a primer on microwave and satellite communications primer on microwave and satellite communications...
TRANSCRIPT

WIRELESS BACKHAULA Primer on Microwave and
Satellite Communications
Dr Rowan Gilmore
CEO, EM Solutions
MILCIS November 2015

TUTORIAL OVERVIEW1. The physical layer – the radio air interface
2. Shannon’s equation
3. The air interface– digitising the analog world using modulation
4. Signals in noise
5. The link budget and its components
6. System imperfections
7. Some example link budgets of commercial radios

1. THE PHYSICAL LAYER
Characterise the channel by its bandwidth B and noise power N added to the received signal power S
Diagram courtesy of Agilent Technologies A/N 1298

2. CHANNEL CAPACITY (WITH AVERAGE POWER CONSTRAINT)
• Shannon’s equation predicts the capacity of a communications channel at zero error rate:
• Capacity = B * log 2
(1 +SNR) where
o C = channel capacity = rate of information transmission in bits per second, at zero error rate
o B = channel’s bandwidth
o SNR assumes additive, white, gaussian noise
• Example
o What is the theoretical maximum transmission capacity down a telephone line (B=3.4kHz) for which SNR = 30dB ?
• In practice, sophisticated error detection and coding are required to approach the theoretical Shannon limit of zero errors.

RECEIVER PERFORMANCEBANDWIDTH AND SNR
• SNR and bandwidth can be traded off
• For two equal capacity channels SNR2
= SNR1
(B1/B2)
• If we increase the channel bandwidth, SNR can be lower for the same information transfer rate
o Example: A signal has SNR of 20dB. How much can the SNR decrease if the bandwidth is doubled?
• A relatively small increase in channel bandwidth buys a large advantage in terms of reduced SNR and minimum transmission power
o In spite of a corresponding increase in the noise floor

3. SIGNAL MODULATION
Amplitude and frequency/phase modulation may be expressed
as polar coordinates (magnitude and phase) of the signal
phasor, relative to a constant carrier
Diagram courtesy of Agilent Technologies A/N 1298

QUADRATURE, BI-PHASE, AND 8-PHASE SHIFT KEYED (PSK) MODULATION
QPSK has four allowed
states corresponding to the four
combinations of a pair of bits. All
possible transitions between the
states are permitted.
• What are the differences
between BPSK and 8PSK?
• What are the advantages of
each?
Typical signal constellations for
different modulation schemes
I
Q
Diagram courtesy of Agilent Technologies A/N 1298

QUADRATURE AMPLITUDE MODULATION (QAM)
m-QAM is spectrally efficient as it achieves a lower baud rate for the same bit
rate. It may require more power to achieve greater differentiation between
adjacent states. 256-QAM uses eight bits per symbol, but the symbols are very
close together so distortion and noise must be minimised to avoid bit errors.
QPSK accepts lower SNR than 256-QAM to achieve the same bit error rate. Diagram courtesy of Agilent Technologies A/N 1298

16-QAM CONSTELLATION AT TRANSMITTER AND RECEIVER
-40 -20 0 20 40
Transmitter Constellation
-40
-20
0
20
40
IQ[TP.3,50,1,0]
-1.5 -0.5 0.5 1.5
Receiver Constellation
-1.5
-0.5
0.5
1.5IQ[TP.2,500,1,0]

4. ES/N0 AND S/N (SNR) RATIOS• Symbol Energy Es (Joules) : the notional average energy in each symbol.
• Average signal power P =S : the average power in dBm or dBW. Power is the symbol energy expended per unit time i.e.
• For a single tone, symbol energy and average power have the following relationships:
- Energy per symbol ES = (Power * Symbol period TS) = S/RS where RS = symbol rate
• Now N0=noise spectral density (dBm/Hz)
so ES /N0= S /RS N0
• But the total noise power is just the power density within the noise (channel) bandwidth B i.e. N = noise spectral density * channel bandwidth = N0*B so N0 = N /B
• Therefore (ES /N0)= (S /N) *B /RS = (S /N) * (1+a) where a is the filter roll-off factor
• S /N and thus ES /N0 are both unit-less (measured in dB).
• ES /N0 is a measure of relative signal strength and its lower bound determines the modulation that can be supported. It does not directly depend on the bandwidth.
• A similar expression exists for bit energy, Eb /N0= S /N * BTb (but then you also need to adjust for coding and/or multiplexing of other users)
ordE
P E P dtdt

SYMBOL ERROR RATE VS SNR
2 4 6 8 10 12 14 16 18 20
Es_N0
SER CURVES
.0001
.001
.01
.1
1
SE
R
Simulation Result
16QAM SER
64QAM SER
256QAM SER
Es/No (dB)

THE NEED FOR GOOD ES/N0• ES = S/RS , proportional to S/B = signal power spectral density (PSD)
• Thus lower carrier power S with lower symbol rate maintains the same ES . Two corollaries:
o More complex modulation in same bandwidth, keeping constant power spectral density maintains Es and thus keeps Es/N0 the same
o More complex modulation with same data rate, requires less BW for the same data rate, thus requires less power to maintain Es and keep Es/N0 the same
• BUT! More bits/symbol requires increasingly higher Es/N0 or SNR for error-free detection of a symbol (see previous slide)
• Coding can be used to improve error correction at the expense of data rateo Code Rate is the ratio of data bits to data + check bits (Rate=k/n) e.g. rate ¾ code has
75% data and 25% check bits in each code block

TRADE-OFF BETWEEN MODULATION DENSITY AND SNRTable 13: ES/No performance at Quasi Error Free PER = 10-7 (AWGN channel)
ModeSpectral efficiency
(bits/symbol)Ideal ES/No (dB) for FECFRAME
length = 64 800
QPSK 1/4 0,490243 -2,35
QPSK 1/2 0,988358 1,00
QPSK 2/3 1,322253 3,10
QPSK 3/4 1,487473 4,03
QPSK 9/10 1,788612 6,42
8PSK 2/3 1,980636 6,62
8PSK 3/4 2,228124 7,91
8PSK 9/10 2,679207 10,98
16APSK 2/3 2,637201 8,97
16APSK 3/4 2,966728 10,21
16APSK 9/10 3,567342 13,13
32APSK 3/4 3,703295 12,73
32APSK 4/5 3,951571 13,64
32APSK 5/6 4,119540 14,28
32APSK 9/10 4,453027 16,05
From DVB-S2 ETSI standard EN 302 307 v1.2.1
Symbol Rate (Rs) 83.3 Msps
Filter rolloff factor (α) 1.2
Bandwidth = (1 + α)Rs 100 MHz
Modulation format QPSK 3/4
Required Es/No 4.03 dB
Required SNR 3.24dB
Es/No=SNR(1+α)
Spectral efficiency 1.487 bits/symbol
Data rate 124 Mbps
Shannon's limit 164 Mbps
Example of QPSK 3/4
OR for same data rate use 16APSK ¾ in a 50MHz bandwidth
Use 16APSK ¾ in a 50MHz bandwidth for same data rate Es/No = 10.21 dB
New Bandwidth 50 MHz
New Required Es/No10.21 dB
(approx 6 dB higher)
New noise floor 3 dB lower
New min signal power Approx 3 dB higher

5. LINK BUDGET CALCULATIONNotes
1. Required SNR (e.g. 9.5 dB) for target BER (1x10-11) and given data rate More powerful digital coding= lower required SNR, but more excess latency
2. Implementation loss (e.g.6 dB)includes estimated losses due to phase noise, clock jitter, imperfect equalization, synchronization inaccuracy, nonlinear effects, multipath delay spread, residual diffraction loss
3. Loss due to water vapor and rain fade : calculations use ITU-R models. If rain fade exceeds allowable maximum, required received SNR is not achieved and hop is unavailable
START: transmitter output power
Effective transmitted power
Tx antenna gain
Rx antenna gain
Dry-air path loss
Effective received signal power
Receiver noise power
Implementation loss (2)Theoretical
dry-air receiver
SNR
Maximum allowable rain fade & water vapor loss (3)
Required received SNR for target BER (1)
Measurement point (Rx threshold)

ELEMENTS IN THE LINK BUDGET• If an isotropic antenna radiates a power PT, the beam power
will spread as a sphere in which the antenna is the center. The power flux at a distance “D” from the transmission point is given by the equation.
Flux = PT/4πD2. . . . . (W/m2)
• As the transmit antenna focuses the energy (i.e. has a gain), within the beamwidth of the antenna the equation changes to:
Flux = GTPT/4πD2. . . . . (W/m2)
where GT is known as the transmit antenna gain and GTPT is the Equivalent Isotropically Radiated Power (EIRP)

ELEMENTS IN THE LINK BUDGET• As a receiver antenna 'collects' the signal, the amount of 'collected' signal will
depend on the receiver antenna size Ae. The received power PR will be:
PR = Flux * Ae = [GTPT/4πD2 ]*Ae
• But:
Ae = effective aperture of the receive antenna
= (λ2/4π)*GR
• λ2/4π is the area of a lossless isotropic antenna (which has unity gain).
(Note GR is therefore inversely proportional to λ2 or 1/f2 for a constant antenna size)
• Substituting,
PR = [GTPT/4πD2 ]* (λ2/4π)*GR or
PR = EIRP * GR * (λ/4πD) 2
• In dB
PR (dBW) = EIRP + GR – Lo ** This is the link equation **
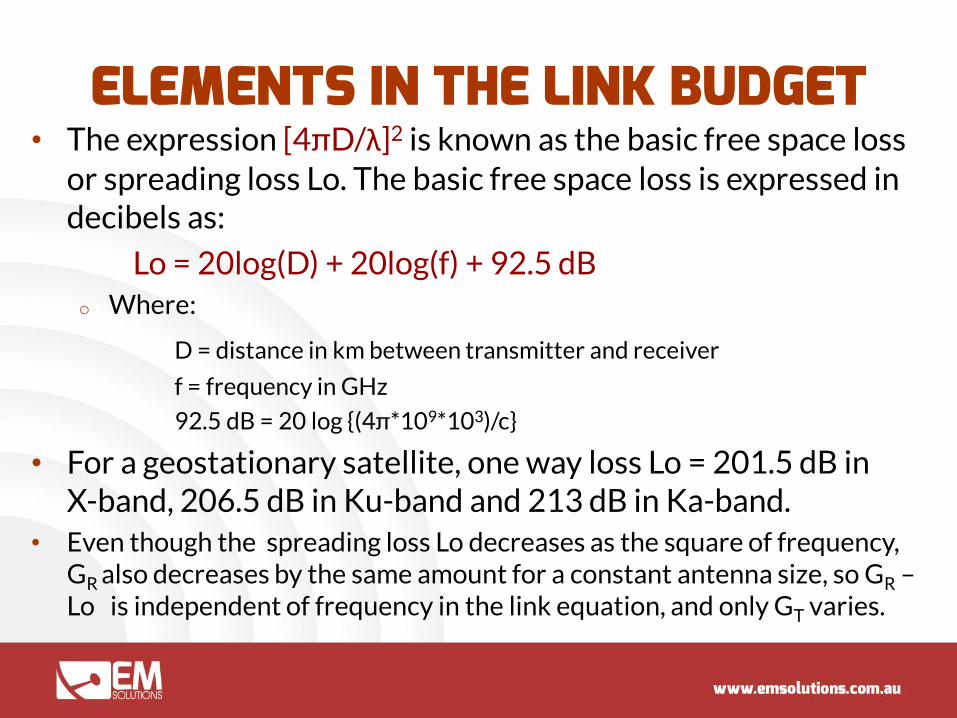
ELEMENTS IN THE LINK BUDGET• The expression [4πD/λ]2 is known as the basic free space loss
or spreading loss Lo. The basic free space loss is expressed in decibels as:
Lo = 20log(D) + 20log(f) + 92.5 dBo Where:
D = distance in km between transmitter and receiver
f = frequency in GHz
92.5 dB = 20 log {(4π*109*103)/c}
• For a geostationary satellite, one way loss Lo = 201.5 dB in X-band, 206.5 dB in Ku-band and 213 dB in Ka-band.
• Even though the spreading loss Lo decreases as the square of frequency, GR also decreases by the same amount for a constant antenna size, so GR –Lo is independent of frequency in the link equation, and only GT varies.

THE CHOICE OF ANTENNA SIZE• Antenna gain and beamwidth are inversely related
o GR is proportional to effective antenna area Ae (in fact, [D/l]2)
o Area illuminated by the transmit antenna is proportional to (r * q) 2
where q = beamwidth and r =radius of the “isotropic sphere”, so the transmit antenna gain is proportional to 4pr2/ (r * q) 2
o So the beamwidth is inversely proportional to sqrt (gain) i.e. diameter
• At E-band (73-86GHz) , a 600mm antenna has about 50dBi gain and 0.5 o beamwidth. A 1200 mm antenna has 56 dBi gain and 0.25 o beamwidth
• At Ka-band (20/30GHz), a 600 mm antenna has 40 dB gain and 1.8o beamwidth on receive, and 42.5dBi gain and 1.2o
beamwidth on transmit.

ANTENNA PATTERNS AND ESD
Shadow boundary

THE SYSTEM NOISE FLOOR• System noise floor at input = FkTB= kTeqB
• PR = {EIRP + GR – Lo} must be sufficiently far above the system noise floor to achieve the desired bit error rate
• So (in dB) SNRmargin = PR - kTeqB
= EIRP + [GR –Teq]- Lo - kB
• Therefore, a receiver can be characterised by its G/T ratio
• For satcoms, use S /No = EIRP + [GR –Teq]- Lo –kwhere k is Boltzmann’s constant (-228.6 dBw/K/Hz) and S/No is in dB-Hz

PATH LOSS AND FADE MARGIN• Rain attenuation varies with path length
and frequency e.g.
o Ka-band 30GHz (uplink) 5.5dB/km in 30mm/hr (“heavy”) rain – BNE, SYD
o E-band attenuation is around 12dB/km
• Availability of a link is a complex function of how often rain and multipath cause the Rx signal to drop below the threshold SNR
o Determined by all the terms in the link budget!

6. SYSTEM IMPERFECTIONS
• The antenna receives all signals but must transmit only the desired signal
• Poor linearity (gain compression) and system noise can degrade the BER performance
o Often requires operating at output power backoff from maximum EIRP to prevent distortion

TRANSMITTER IMPAIRMENTS
-1 -0.5 0 0.5 1
RX Constellation
-1
-0.5
0
0.5
1
IQ[TP.RX Constellation,400,1,0]
64QAM System
• All impairments degrade the bit error rate
Spectral re-growth is caused by third-order (+ higher) intermodulation distortion in the transmitter
Constellation showing transmitter PA compression and thermal noise (L), and phase noise (R). Gain compression causes intermodulation distortion and spectral re-growth.
-1.5 -0.5 0.5 1.5
64QAM Constellation
-1.5
-0.5
0.5
1.5DB(IQ(TP.21,1000,1,0))64QAM

RECEIVER IMPAIRMENTS
Actual Oscillator
f0
Ideal Oscillator
Interferer
SignalInterferer
Downconverted
Interferer
Downconverted
Signal
f
f0
f
Downconverted
Interferer
Downconverted
Signal
Signal
(b)
• Linear impairments include thermal noise and intersymbol-interference• Nonlinear impairments include spurious responses (such as to the image
frequency) and reciprocal mixing
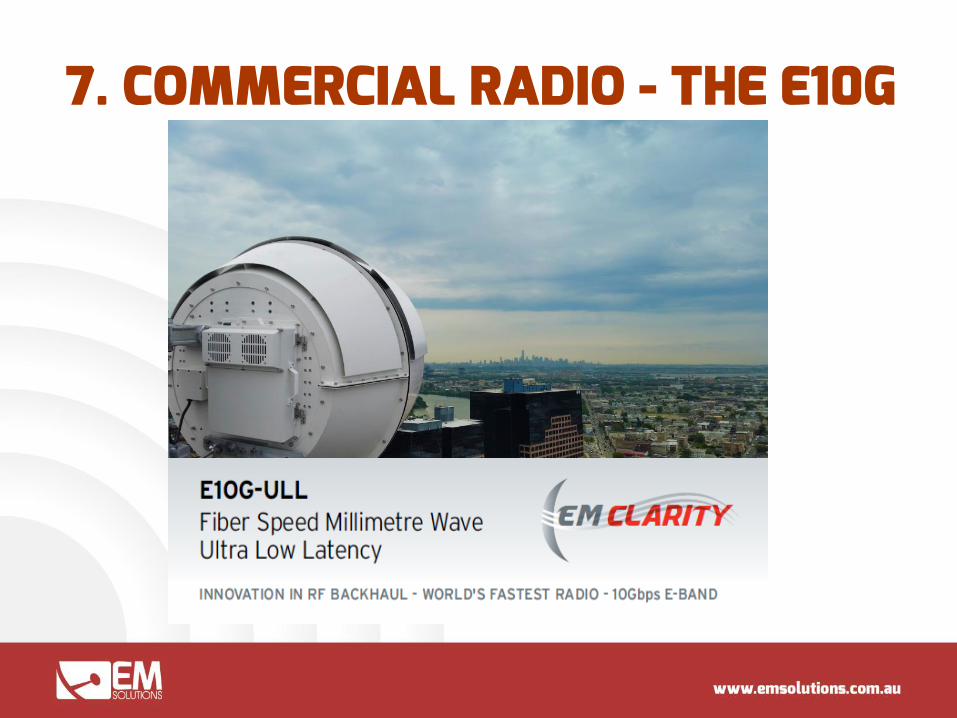
7. COMMERCIAL RADIO - THE E10G


MICROWAVE LINK BUDGET
162.3 dB
55.9 dB
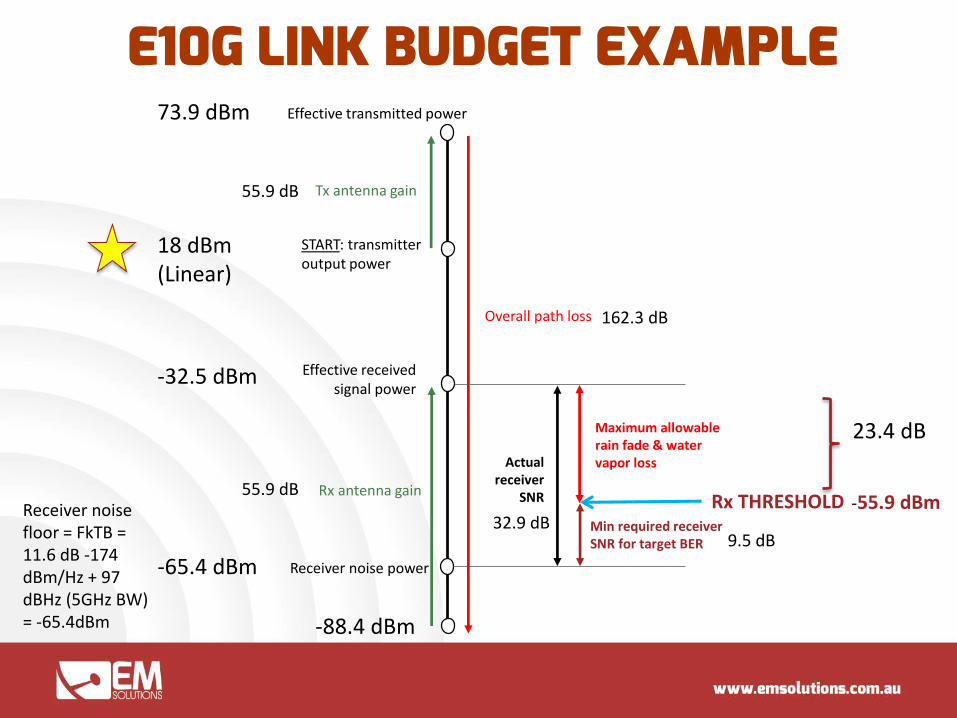
E10G LINK BUDGET EXAMPLE
START: transmitter output power
Effective transmitted power
Tx antenna gain
Rx antenna gain
Overall path loss
Effective received signal power
Receiver noise power
Actual receiver
SNR
Maximum allowable rain fade & water vapor loss
Min required receiver SNR for target BER
Rx THRESHOLD
18 dBm(Linear)
55.9 dB
73.9 dBm
162.3 dB
-65.4 dBm
55.9 dB
-32.5 dBm
9.5 dB
23.4 dB
Receiver noise floor = FkTB = 11.6 dB -174 dBm/Hz + 97 dBHz (5GHz BW) = -65.4dBm -88.4 dBm
32.9 dB-55.9 dBm
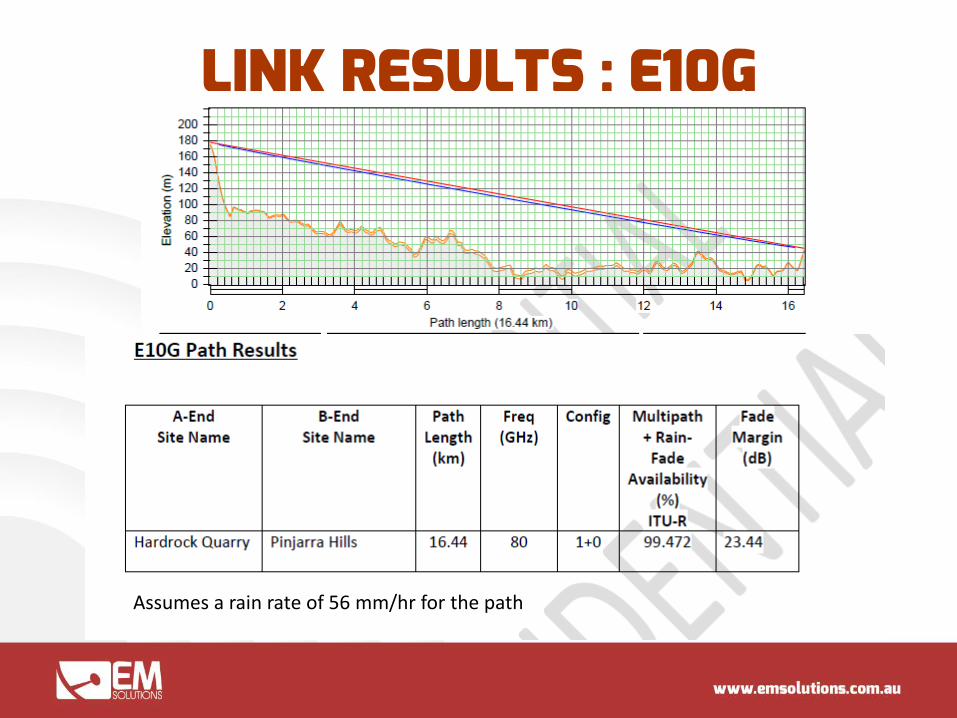
LINK RESULTS : E10G
Assumes a rain rate of 56 mm/hr for the path

COMMERCIAL SATCOM - COTM

SPECIFICATIONKa-Band
Commercial
Ka-Band
Military
Antenna Size 1m
RF Frequency
Rx 19.2 to 20.2 GHz
Tx 29.0 to 30.0 GHz
Rx 20.2 to 21.2GHz
Tx 30.0 to 31.0GHz
Switchable between Commercial and Military operating bands via
Ethernet User Interface
G/T mid band >20dBK
Antenna GainRx 42dB min
Tx 48dB min
EIRP (linear)60dBW (min)
(with EM Solution 01-360A 25W Ka Multiband Diamond Series BUC)
Polarisation Circular
Sidelobes Mil-Std-188-164
Pointing Error <0.2deg
Height (radome) 1500mm
Base Footprint 850mm diameter
Environmental Tested in accordance to MIL-STD-810G CN1 and IEC 60945:2002
Pedestal Type
3 axis
Az 360o continuous
EL -20o to +110o
XEL ±35o
Tracking TypeMonopulse on Ka-band Beacon or
User Defined Carrier
INU & Gyros Embedded
Modem Support (three modem ports
available)
Integrated Inmarsat GX modem or switchable to Customer modem
Compatible with Viasat EBEM MD-1366 modem or equivalent
Satellite Operator Certifications Inmarsat GX (pending Q1 2016) WGS (pending mid 2016)
Regulatory IEC 60945, IEC 60950 , C tick

SATELLITE LINK BUDGETUplink Transponder Budget: NOTE: Version: 1.3
Uplink
Frequency: 30,000.00 MHz
Parameter: Value: Units: Comments:
Ground Station:
User Uplink Transmitter Power Output: 20.0 wattsThis is the power associated with ONE uplinking user station and ONE channel.
In dBW: 13.0 dBW
Transmission Line Losses: -1.5 dB
Connector, Filter or In-Line Switch Losses: -1.0 dB
Antenna Gain: 48.0 dBiC1m antenna
Ground Station EIRP: 58.5 dBWGround Station Effective Isotropic Radiated Power (EIRP) [EIRP=Pt x Ltl x Ga]
Ground Station Antenna Pointing Loss: -0.2 dB
Uplink Path:
Antenna Polarization Losses: -0.75 dB
Path Loss: -213.5 dB
Atmospheric (Gaseous) Losses: -3.1 dBUse Value Appropriate for Elevation Angle Selected in Orbit Performance W/S. See Ippolito.
Ionospheric Losses: -0.2 dB
Rain (Ice Fog) Losses: 0.0 dB
Isotropic Signal Level at the Spacecraft: -159.2 dBW
Spacecraft:
Spacecraft Rcvr Antenna Pointing Loss: -0.4 dB
Spacecraft Rcvr Antenna Gain: 38.3 dBiC
Spacecraft Transmission Line Losses: -2.0 dB
Spacecraft LNA Noise Temperature: 250 K
Spacecraft Sky Temperature: 250 K
Spacecraft Effective Noise Temperature: 520 K
Spacecraft Figure of Merrit (G/T): 8.1 dB/K
S/C Signal-to-Noise Power Density (S/No): 77.1 dBHz Boltzman's Constant: k= -228.6 dBW/K/Hz
Transponder IF Bandwidth: 36000.0 kHz
Transponder Uplink Input Noise Power -125.9 dBWPn = kTB; Additive White Gaussian Noise (AWGN); The satellite receiver's White Noise.
Single User Uplink S/N in Transponder Bandwidth: 1.6 dBThis is the S/N for ONE user seen at the S/C Rcvr IF, measured after the BPF, in the bandwidth determined by that filter.
Single User S(N+I) in Transponder Bandwidth: 1.5 dBThis is the uplink performance measured in the ENTIRE transponder bandwidth (NOTE: This could be a negative number)
Single User Signal Bandwidth: 10000.0 kHz
Single User Uplink S(N+I) in User Terminal Bandwidth: 7.04 dBTHE BOTTOM LINE FOR THE UPLINK (NOTE: This is the average S/(N+I), not the peak value).

SATCOM SYSTEM LINK SUMMARYNOTE:
Developed by: Jan A. King, W3GEY/VK4GEY Version: 1.3
EMS On the Move Terminal 2.70 =Loss(dB) Southern Hemisphere Gateway Station
I/F Filter B.W.= 36.00 MHz
2.0 =Loss(dB) End-to-End Gain = 136.3 dB 1.0 =Loss(dB)
1.5 =Loss (dB)
15.00
15.0 Mbps 1 =Supported Users @ 15.00 Mbps each
4.3 = Each User Eb/No (dB) at Full Supported Data Rate
Spacecraft Current Altitude: 36,000.00 km
Uplink User Slant Range: 37,627.45 km
HPA Sig. Power = 11.57 Watts Downlink User Slant Range: 37,557.85 km
48.0 = Gain (dBi) 38.3 = Gain (dBi) 44.5 =Gain(dBi)
Uplink Frequency: 30,000.00 MHz
HPA Power = 20.0 Watts 520.0 K=System Noise Temp. 46.1 =Gain (dBi) 326.7 K=System Noise Temp. Downlink Frequency: 20,000.00 MHz
58.5 = EIRP (dBW) 8.1 dB/K=G/T 56.4 = Signal EIRP (dBW) 17.8 dB/K=G/T
UPLINK DOWNLINK
S/(No+Io)= 77.0 dB-Hz S/(N+I) = 1.55 dB S/(No+Io)= 86.0 dB-Hz S/(N+I) = 15.98 dB
In Xpdr B.W.= 36.00 MHz In Xpdr B.W.= 10.00 MHz
S/(N+I) = 7.04 dB
In Chan B.W. = 10.00 MHz
20.0 Watts
200.0 Watts
180.0 Watts S/(N+I) = 6.52 dB
0
SYSTEM LINK SUMMARY
Data
Transponder Power Characteristics:
Therm. Dissipation =
=Supported Data Rate (Mbps)
LINK BUDGET
RF Power Output =
UPLINK + DOWNLINKDC Power Input =
UPLINK DOWNLINK
UserXmit
TerminalHPA LNA HPA
TransponderConverters &IF Amplifiers
LNA
UserRcvr
Terminal
User Terminal Spacecraft User Terminal
DIGITAL LINK SUMMARY

GENERAL COMPARISON OF TERRESTRIAL AND SATELLITE COMMUNICATIONS
MICROWAVE SATELLITE
Elevation is horizontal Elevation low up to Vertical
1-50 km per link ~ 36,000 km per link
To/fro frequencies typically close (Up/Down) frequencies typically well separated
Typical band plans (6GHz, 11GHz, 18GHz, 80GHz) 4/6GHz, 7/8GHz, 12/14GHz, 20/30GHz
Low power, path limited High power, power limited
Fade margins 20-50dB Margins (3-5dB typical)
Single hop paths Two hop path
Symmetrical data rates typical Asymmetrical data rates typical
Point to point Point - point or point to multi - point
Fixed terminals Fixed or mobile terminals
Small to medium antennas (0.5 to 2m) Small to very large antennas (0.5 to 20m)
Low noise not critical Low noise is critical
High power not important High power is critical
Short propagation delay (10-200us) Long delay (~250ms round trip)
Regulated bands: low interference Regulated bands: moderate interference
Unregulated bands – possible interference No unregulated bands
Low terminal costs, low to high spectrum costs Medium terminal costs, high spectrum costs
