a process for evaluatmg geographic information systems · a process for evaluatmg geographic...
TRANSCRIPT

A PROCESS FOR EVALUATmG GEOGRAPHIC INFORMATION SYSTEMS
Stephen C. Guptill Editor
Contributing Authors
Daniel Cotter Robert Gibson Richard Listen Henry Tom Timothy Trainor H. Pete VanWyhe
Technology Exchange Working Group-Technical Report 1Federal Interagency Coordinating Committee on Digital Cartography1988
U.S. Geological Survey Open-File Report 88-105

PREFACE
This document has been prepared by members of the Technology Exchange Working Group of the Federal Interagency Coordinating Committee on Digital Cartography. The Working Group actively promotes the exchange of information and ideas on technology and methods for collecting and using digital cartographic data. It also monitors developments in geographic Information systems technology and documents guidance for utilizing that technology.
The members of the Technology Exchange Working Group are listed in Appendix C of the report. Their comments and assistance in preparing this document are gratefully acknowledged. In particular I would like to recognize the contributing authors Dan Cotter, Bob Gibson, Dick Liston, Dave Pendleton, Henry Tom, Tim Trainor, and Pete VanWyhe for their work in putting this report together. I would also like to recognize the work of the Interior Digital Cartography Coordinating Committee, which provided their geographic information systems "Functional Components Document" for our use in the preparation of this report.
Stephen C. GuptillChairman, Technology ExchangeWorking Group, FICCDC

ERRATA
Title Page Add David Pendleton and Elizabeth Porter to list of contributing authors.
p. 3 End of line 11 add Elizabeth Porter, 1988, An overview of the Army CIS program: IGIS Symposium, Arlington, Va., Proceedings [in press].
p. C-l Line 11 add Engineer Topographic Laboratories to Elizabeth Porter's organizational affiliation.

CONTENTS
Preface 11
EXECUTIVE SUMMARY vi
Part I - The Form and Function of a GIS
Chapter 1. OVERVIEW 1
1.1 Purpose 11.2 Background 21.3 General definition and Introduction to GIS 31.3.1 User interface 51.3.2 System/data base management 51.3.3 Data base creation/data entry 51.3.4 Manipulation and analysis of spatial data 61.3.5 Display and product generation 7
Chapter 2. APPLICATIONS 9
2.1 Concepts 92.2 Examples 10
Chapters. USER REQUIREMENTS ANALYSIS (URA) 11
3.1 Overview 113.2 Who should perform the URA? 113.3 Identification of users 123.4 Definition of required products 143.5 Evaluation of work flow 153.6 Data base development 173.7 User applications 183.8 Refinement of GIS product characteristics 183.9 Production rates 193.10 Estimated data volumes 203.11 Cost/benefit analysis 213.12 URA report 22
Chapter 4. APPLICATION ASSESSMENT 23
Chapters. EVALUATION CRITERIA 25
iii

Part II - Topics in the Technical Evaluation of GIS
Chapters. STANDARDS AND GUIDELINES 27
Chapter?. SOFTWARE FUNCTIONS 29
7.1 Overview 297.2 Software functional components checklist 307.2.1 User interfaces 307.2.2 Data base management 317.2.3 Data base creation 327.2.4 Data manipulation and analysis 347.2.5 Data display and product generation 37
Chapters. GIS HARDWARE COMPONENTS 39
8.1 System configuration 398.2 Data capture/input devices 408.3 Processing devices 418.4 Interactive display and editing devices 428.5 External storage devices 428.6 Output devices 43
Chapter 9. BENCHMARKING 45
9.1 General procedures 459.2 Sample GIS benchmark problems 469.2.1 Data entry and data base creation 469.2.1.1 Test (A) Digitizing points and lines 479.2.1.2 Test(B) Edgematching 489.2.1.3 Test(C) Polygonization 499.2.1.4 Test(D) Labelling and/or attributing 499.2.1.5 Test(E) Reformatting of digital data from other systems 499.2.1.6 Test(F) Quick-look plot 509.2.1.7 Test(G) Listing 509.2.1.8 Test(H) Display and edit 509.2.1.9 Test (I) Data base creation and management 509.2.1.10 Test(J) Updating 519.2.1.11 Test(K) Browsing 519.2.2 Data manipulation and analysis 529.2.2.1 Test (A) 529.2.2.2 Test (B) 569.2.2.3 Test (C) 56
IV

APPENDIXES
Appendix A. Geographic information systems related standards,guidelines, and references A-l
Appendix B. Glossary of terms B-l Appendix C. Members of Technology Exchange Working Group C-l
FIGURES
Figure 1. Major components of a geographic information system 3
Figure 2. Concept of separation of categories within a GIS 6

EXECUTIVE SUMMARY'
Today, Federal agencies must quickly respond to complicated problems Involving a wide variety of geographically referenced data sets (such as natural resource, socio- economic, or epidemiologic data). Administrative and regulatory responsibilities as signed to government agencies have placed tremendous pressure on existing informa tion delivery systems. Hie traditional methods of acquiring, storing, and analyzing spa tially referenced data are proving to be too costly and inflexible in meeting these grow ing needs. Computerized geographic information systems (GIS's) are emerging as the spatial data handling tools of choice for solving such complex geographical problems.
A geographic information system is a computer system designed to allow users to col lect, manage, and analyze large volumes of spatially referenced and associated attribute data. Because GIS technology allows analysts to process and interrelate many more kinds of data than were previously feasible, agencies have the potential to greatly im prove traditional missions such as data collection, research, assessment, and informa tion delivery.
Hie purpose of this document is two-fold. First it provides an overview of GIS technol ogy and a general picture of the entire process of evaluating a GIS. This overview is given in Part I of the document and it is written for an audience of both managerial and technical personnel who may not be familiar with GIS technology. Secondly, in Part n, the report provides advice and guidelines to the staff of various agencies who are direct ly involved with the technical issues of implementing or procuring geographic informa tion systems. Part n discusses related standards and guidelines, software functions, hardware components; and benchmarking. An appendix with definitions of terms is also provided. Although this document provides numerous guidelines and examples, it is not intended for use as a specification or procurement document for acquiring a GIS.
VI

PART I » THE FORM AND FUNCTION OF AGIS
Chapter 1. Overview
1.1 PurposeThis document has been prepared to assist Federal managers and technical specialists in evaluating, designing, and procuring geographic information systems (GIS's). Suc cessful CIS implementation and application requires agency personnel to be cognizant of the capabilities and limitations of GIS technology and to carefully evaluate the needs of system users and applications. The variety of possible Federal GIS applications and users make it impractical and inappropriate to provide strict criteria for GIS implemen tation. However, this document provides general guidance for understanding the tech nology in a realistic perspective, evaluating the requirements of possible GIS users and applications, identifying applicable standards for information systems technology, selecting desirable software and hardware characteristics, and conducting benchmark tests to identify optimal hardware and software systems.
As geographic information systems become more widely implemented, their procure ment and operation are being more closely monitored for adherence to agency informa tion resource management guidelines and procedures. Such scrutiny may be a new experience for GIS program managers who may have first acquired their GIS capability as part of a low-visibility research effort. Therefore the reader should be aware that a great deal has been written on information resources management.
For example, the General Accounting Office (GAO) has identified the following five basic objectives for the acquisition and operation of information systems (see GAO, Evaluat ing the Acquisition and Operation of Information Systems, Technical Publication 2, U.S. Government Printing Office, Washington, DC, September 1986, p. 11-15).
Ensure System Effectiveness: System effectiveness is measured by determining whether the system performs the intended functions and whether users get the in formation they need, in the right form, in a timely fashion.
Promote System Economy and Efficiency: An economical and efficient system uses the minimum number of information resources to achieve the output level the system's users require.

Protect Data Integrity: Data integrity requires that systems have adequate controls over how data are entered, communicated, processed, stored, and reported.
Safeguard Information Resources: Information resources, which include hardware, software, data, and people, need to be protected against waste, loss, unauthorized use, and/or fraud.
Comply with Laws and Regulations: Compliance with laws, regulations, policies, and procedures that govern the acquisition, development, operation, and main tenance of information systems must be ensured.
The guidance and recommendations such as those contained within the GAO document should be observed so that GIS requirements documents meet these objectives. This will help to ensure that a given GIS implementation will comply with the various guidelines and procedures should a review or audit occur.
1.2 Background
Federal agencies must acquire, analyze, manage, and disseminate tremendous volumes of spatial and attribute data to accomplish their missions. Spatial data analysis is a multidisciplinary concern. Geographic, medical, sociological, military, and earth science activities, among others, require spatial data analysis. Spatial data sets are fre quently heterogeneous, having data elements such as soils, land use, and population statistics, and are often comprised of data sources with differing scales, coordinate sys tems, accuracies, and areal coverage. The data will originate from source material in multiple formats, such as text, maps, charts, or remotely sensed imagery. In some in stances, agency functions require basic data sets be reduced for incorporation into multidimensional numeric models. The management and analysis of these data in a hardcopy environment to support such modelling and other analytical procedures is often tedious and cumbersome, inhibiting the efficient achievement of agency goals.
Difficulties with managing and analyzing spatial data, such as the transformation of data to common coordinate systems, scale changes, and the development of statistics from overlay procedures, cannot be accomplished through the application of typical data base management systems (DBMS's). DBMS's are normally designed to handle numeric and textual information and are not capable of manipulating spatial data.
Spatial data sets are unique in providing the geographic positions of features, related to known coordinate systems, in specifying attributes of features which may be inde pendent of position, such as color, cost, and size, and in describing the spatial and topologlcal relations among features in the data set. GIS's are specifically designed to manage and analyze spatial data sets having such characteristics.
At present, a number of GIS packages have been developed within the public and private sectors. These packages are both application specific and generic. Develop ment within the GIS field is continuing and more GIS packages can be expected to be come available in the future. Agencies will often be able to apply existing systems directly to their applications, eliminating the need for costly system development work.

This trend Is changing the question of GIS Implementation from one of being able to develop a system to meet agency requirements, to one of selecting the best existing sys tem that meets agency needs.
1.3 General Definition and Introduction to GIS
A geographic information system Is a computer system designed to allow users to col lect, manage, and analyze large volumes of spatially referenced and associated attribute data. GIS's are used for solving complex research, planning, and management problems. The major components of a GIS are: a user interface; system/data base management capabilities; data base creation/ data entry capacity; spatial data manipulation and analysis packages; and display /product generation functions. Figure 1 is a conceptual representation of a GIS system and its major components.
Digital spatial data are vital for a GIS. Spatial data consist of the various features that are defined by their geographic location and descriptive attributes. These features can have point, line, or areal characteristics that are visually discernible, such as wells, roads, or lakes, or Invisible boundaries, such as county lines or school districts. A GIS must be capable of storing and manipulating these types of point, line, and areal data. The association of a given spatial feature with a data type depends on the scale of the map or Image. For example, a river can be shown as an area at large scale but only as a line at a smaller scale..
Two major methods, or data structures, are used to organize spatial data within a com puter for use by a GIS: the raster data structure and the vector data structure. Each of these structures has distinct advantages and disadvantages that affect cost and ef ficiency.
User Interface
System /Data Base Management
Data Base Manipulation and Display andCreation Analysis of Spatial Product GenerationData Entry TA .J Data
Figure l. Major components of a geographic information system.
3

A raster data structure is formed by partitioning the study area into a set of grid cells that are usually square. Each cell is assigned a code describing the feature contained within the cell, as in type of land use, elevation, or county name. The cell size is selected on the basis of the resolution needed; the resolution available, as in the case of remotely sensed data such as Landsat; or the memory capacity of the system.
Explicit x,y coordinates are not given to each cell because the cell location is Implicit in its row and column location in the grid. Separate thematic data sets over the same area, such as land use and counties, can be easily merged (composited) in a computer by combining the attribute codes, cell by cell, of each data set. However, the cell-by-cell nature of the raster structure makes it difficult to retrieve information about specific linear features (for example the length of the shoreline of Great Salt Lake) or to traverse a network of linear features (for example routing a train from Atlanta to Denver).
Vector data structures use a series of x,y coordinates to describe the point, line, and area (or polygon) features. In addition, information about the connections and relation ships among the features portrayed on a map (the topology of the map) is calculated and stored with the coordinates. Thus, system users can derive relationships such as adjacency and connectivity easily. This data structure is computationally more demanding than a raster structure, but Is being used increasingly in GIS's because of the greater information content inherent in the data. The Bureau of the Census Topologically Integrated Geographic Encoding and Referencing (TIGER) files and the U.S. Geological Survey digital line graph (DLG) data are examples of this type of data or ganization.
GIS's typically have been designed to handle either the raster or vector data structure. Image processing systems, specifically those developed to manipulate remotely sensed digital data from satellites (such as Landsat or SPOT), have many of the functions synonymous with a raster based GIS. In referring to GIS's, this report does not draw any distinction between raster or vector based systems. The functions and processes Involved are generic in the sense that the descriptions apply to both raster and vector systems. The more specialized functions of Image processing systems are not within the scope of this report.
The following brief tutorial highlights the functional characteristics of the major GIS components. The treatment is intended to be introductory. An article "Requirements and Principles for the Implementation and Construction of Large-Scale'Geographic In formation Systems" (Smith and others, 1987, International Journal of Geographic Infor mation Systems, vol. 1, no. 1, p. 13-31) provides more detail on this topic. Further details can be obtained from other reference materials and by examination of the software components in Chapter 7.
In lieu of a set of references or selected readings, the reader is referred to an extensive bibliography of works related to digital cartography and GIS entitled "A Final Bibliog raphy for Digital Cartographic Data Standards" compiled by Harold Moellering. This has been published as a microfiche insert to the American Cartographer (vol. 15, no. 1). Additionally, the October 1987 issue of Photogrammetric Engineering and Remote Sens ing (vol. 53, no. 10) was devoted to GIS and contains articles on a variety of technical and applications topics.

1.3.1 User InterfaceThe user Interface Is the method by which the human operator communicates with the various data base and CIS applications modules. It consists of software capabilities that simplify and organize the interaction between the user and the GIS software (for ex ample, menus, help screens, and graphic displays).
1.3.2 System/Data Base ManagementThe GIS data base management component provides the environment within which the GIS functions and the means by which data are controlled. The system management environment Is furnished by the operating system of the host computer. Operating sys tems have generic capabilities to organize, coordinate, facilitate, and execute the com mands of one or many system users in sequence, or in parallel, depending on hardware, software, and demand constraints. Data base management elements of the GIS are executed within the operating system control.
GIS data base management functions parallel those of a nonspatlal DBMS, but with ex tensions beyond the addition, deletion, revision, and Boolean retrieval capabilities of a standard DBMS. The GIS data base management system will have hardware and software facilities for the storage, retrieval, and update of spatial Information. It will in corporate storage structures to minimize data redundancy and to aid spatial searches. In addition, the GIS DBMS (like its nonspatial counterparts) must include features for maintaining data independence, security, and integrity and have the file management capabilities to handle a potentially large archive of data files.
1.3.3 Data Base Creation/Data EntryA GIS data base is normally conceptualized as a series of thematic topics, or categories (sometimes termed "layers'O, of information held within the data base. Figure 2 Is an ex ample of this concept.
Data base creation/data entry refers to the process of bringing data into the electronic environment of the GIS. Data entry Is the process of loading data into a GIS data base. Previously existing data in a computer-compatible format can be loaded directly. A data base may also be created by digitizing, or scanning map information to create a computer-readable data set. This effort Is sometimes referred to as data capture. Data capture is the series of operations required to encode data in a computer-readable form. The two general types of data captured are positional or geographic Information and the accompanying feature attribute data. Positional information is usually digitized from existing graphics, maps, or images. Attributes identify what the features represent in the form of numeric or textual information, such as a feature name or a road class..

Figure 2.-Concept of separation of categories within a GIS.
The costs to capture the data sets to use In a GIS can be expected to far exceed the costs of software and hardware. In creating the data sets for the GIS, data encoding schemes, topological data structuring, attributing of Information, and selection of file structures must all be performed In a manner to support the agency's application. This is a complex and time-consuming task. Failure to capture the correct data, in the cor rect form, with adequate attributes is likely to result In the GIS being unable to support its Intended users.
Emphasis upon the sharing of data between agencies using GIS's is increasing. The maintenance of digital data sets of national extent by agencies such as the Geological Survey and the Bureau of the Census will also Induce progress In the improvement of data translators and the establishment and use of digital data standards. As a result of these activities, the cost of data base creation may gradually cease to be the major cost consideration in GIS implementation. The emphasis will then shift to update and revision of the data to keep it current.
1.3.4 Manipulation and Analysis of Spatial DataIf the preceding functions of spatial information capture and management have been performed properly, the accuracy and the original meaning of the data will have been maintained. The user of a GIS may proceed to what is generally thought of as the primary GIS activity, applying spatial analysis tools to model, make predictions, and reach conclusions about problems of Interest. Such analysis involves combining data from multiple spatial data categories and performing analytical, statistical, measure ment, and other operations upon the GIS data sets to transform the data into informa tion suitable for a given purpose.

Spatial analysis techniques include compositing areas, performing proximity searches, topographic analysis, and clustering and aggregation operations. These operations are ideally performed upon the topological constructs of the data as well as the nonspatial attribute data in an interactive mode. Such operations can range in complexity from simple Boolean queries to reclassifkation and creation of entirely new map displays.
The development and use of a spatial model requires a carefully considered sequence of spatial operations and a keen awareness of the limitations inherent in the characteris tics of the data and categories used. In many instances, one is limited by the encoding and storage characteristics of the data. For example, some mathematical operations can give meaningless or misleading results when applied to ranked or unsealed values, and other operations can only be performed if the data are encoded in raster, and not vector format (and vice versa). Attention must be paid to data quality, including ac curacy and precision, and computationally induced errors due to rounding, interpola tion, and truncation.
Aside from the data manipulation and analysis functions that are integral to a GIS, users will often transfer spatial data from the GIS to external models. The GIS in these instances must have the capability to reformat the data so that it is compatible with the input requirements of the model. The GIS should also be designed to be compatible with the output from such external models. This compatibility will facilitate data base update and the combination of results between various models.
1.3.5 Display and Product Generation
The typical GIS has extensive capabilities for the display of maps, charts, graphs, and tables resulting from use of its analysis and modeling capabilities. A dynamically produced map is a highly effective device and efficient storage mechanism for summariz ing and communicating to the user the results of such analyses. The displays used will range in complexity from tabular reports through simple monochrome plots to publica tion-quality three-dimensional color graphics for a myriad of uses. In some specialized cases, it is not difficult to envision the need for an animated time-sequence of displays, similar in effect to a movie, in order to properly communicate the complex information generated by the GIS.
The displays will take various forms, depending upon the characteristics of the informa tion and the media chosen. These include video screens, line printers, laser printer/plotters, line/ink and jet/electrostatic plotters, color film recorders, photographic media, and microfilm devices.
The design of an effective presentation of the generated information is not an easy problem and is fraught with a host of complicated design and perceptual problems which must be effectively addressed. The objective is to present the information so that it accurately conveys the message to the user without introducing erroneous or mislead ing implications. The effective choice of color, pattern, shading, symbology, text fonts, and placement of text in an uncluttered but accurate way is one of the classical challen ges of cartography.

Chapter 2. Applications
2.1 Concepts
Geographic information systems are versatile, interdisciplinary tools that provide a means for the automated analysis of spatial data. Two typical examples of GIS applica tions are site suitability analyses and the development of textual or statistical data from map-based information.
When a site suitability analysis is performed, the engineer, research specialist, planner, or architect must consider several types of interrelated information. This information will usually consist of data in both textual and graphic formats. The graphic data may cover several map sheets, each at a different scale and having different formats, infor mation contents, and accuracies. In addition, the maps also may be laid out on dif ferent coordinate systems, such as latitude/longitude, State Plane, or Universal Transverse Mercator (UTM).
Factors such as demographics, topography, land use, soil types, geology, land cover, and local zoning typically are analyzed as part of the suitability analysis. All the spatial and textual information must be combined to present a coherent picture, typically in the form of a map. The map may also portray additional information, such as buffer zones, that may be required with the proposed land use.
The creation of these maps by manual means is a time-consuming, tedious process. Hand drafting, photographic processing, and exact scaling and transfer of information between map sources must be preformed. In the GIS environment, these operations can be accomplished automatically. The end product user can also have an oppor tunity to preview products on the display screen of the GIS before a hardcopy map is output.
Providing the base mapping for a site suitability analysis is only one aspect of the GIS' benefits to this process. The base map, which represents a spatial data set, can be manipulated to study options for site development and perform analytical tasks such as area measurement and cut and fill volumes.
Another difficulty in dealing with multiple hardcopy source maps is the development of statistics concerning spatial phenomena. Crop statistics and land use trends are ex amples of statistics that result from the analysis of spatial information. Typically, developing such statistics requires technicians to physically identify and measure fea tures of interest from source maps. GIS software can automatically analyze a spatial data base to compile statistical tables and other textual information.

2.2 Examples
There is an increasing trend on the part of government organizations at all levels to develop GIS's for the management and analysis of spatial data. For example the city of Pittsburgh, Pennsylvania, initiated a $460,000 effort to digitize base map data in 1986. Streets, parcels, building outlines, block boundaries, political units, and topographic contours are being digitized. The resulting digital data set will serve as the basis for im plementing the application of GIS technology to city government.
Although this data set is not yet complete, the city has already gained economic benefits from the effort. A cost savings of $99,000 was realized when the digital files were used to provide planimetric base mapping for the city's water and sewer facilities. Pittsburgh is also developing a computer-aided dispatch system that will be based on digital street mapping (Wells, E.; Solomon, C.P., Creation and Implementation of Com puter Mapping Jor the City of Pittsburgh, Proceedings ASPRS-ACSM, Baltimore, Maryland, March 1987, copies available from the city of Pittsburgh Planning Depart ment).
Another example of successful implementation of a GIS to serve interdisciplinary users is that of the Los Angeles County, California, Department of Public Works (DPW). The DPW serves a population of about seven million in an area of about 4,000 square miles. The DPW must maintain map information concerning bridges, highways, and gas and water lines. The hardcopy map base consists of over 9,000 different paper maps. Changes to the county's infrastructure may necessitate the revision of up to 50 paper maps per year.
The DPW is currently creating digital maps to provide a single, continuous source of base map data for the community. This data base is being applied for numbering street addresses, creating survey or index maps, sewer maintenance, management of street lighting, zoning, and tax purposes.
Benefits from the application of computer mapping technology include a 75-percent to 95-percent reduction in map production time, depending on complexity, compared to the time required to create maps manually. The efficiency of sewer maintenance opera tions has been improved by 20 percent. The total savings have not been quantified by the DPW, but they are reported to be in the "seven digit figures" (Nordisk Kvantif, Report 30, Digital Map Data Bases, Economics and User Experiences in North America, National Board of Survey, Helsinki, Finland, March, 1987).
10
Chapters. User Requirements Analysis (URA)
3.1 Overview
Geographic information systems are successful when they comprehensively and consis tently meet the needs of users. Development of a successful GIS depends on well- defined user requirements. A user requirements analysis (URA) is a detailed study of the needs of potential system users. The URA should result in a clear statement of end- product characteristics, required production rates, estimated data volumes, and cost- benefit rationale.
In performing a URA, much emphasis is necessarily placed on the detailed review of the development and application of map-type products presently being required by users. However, throughout the process, the URA manager should question the need for tradi tional products and note GIS capabilities to meet the same requirements with entirely new products and types of information and services in varied formats. Users of hardcopy products may be limited in their present ability to analyze and apply spatial information by the nature of the media in which they deal. The URA manager may need to advise these users on the possibilities for improving current capabilities of their organizations through GIS application, not merely using the GIS to perform or mimic traditional functions.
3.2 Who Should Perform the URA?
The first problem faced by any organization considering the Implementation of a GIS is to determine who should perform the URA. URA's for successful GIS installations have been performed by in-house staff, contractor staff, or through a combination of both ap proaches. There are many valid reasons for opting for any given approach, however, the desired result is the same, to develop a comprehensive assessment of the analytical capabilities and products required by potential users of the GIS. The requirements of the users can then be matched with system capability to determine optimal configura tions for the organization's GIS procurement.
In-house staff inherently have a greater understanding of the tasks which are to be con sidered for automation through GIS technology. This unique knowledge may justify training staff members in GIS technology and URA techniques so that the URA may be performed in-house. In cases where existing staff members have expertise in GIS's, there may be little reason to consider bringing in outside assistance.
11

When staff time or skills are not available, or when new programs and concepts are being proposed that staff Is not experienced with, outside resources may be required to perform the URA. Assistance may also be available from resources within the parent agency of the organization considering the GIS Implementation. Assistance in develop ing Requests for Proposals (RFP's) for URA services may similarly be available within the agency.
The Important element in determining who should perform the URA Is assuring that the provider of the service has a thorough understanding of both GIS technology and the operations of the organization. When an outside organization Is brought in to per form the URA, it is the responsibility of the government technical representative (GTR) for the URA services procurement to assure that the contractor fully understands the organization's products, services, mission, and needs.
Possible conflicts-of-interest should also be considered before a final determination Is made as to who should perform the URA. Organizations and individuals may, in some Instances, have a vested Interest in certain hardware or software types, and may be In clined, whether Intentionally or unintentionally, to bias results of the URA toward par ticular systems. The objective of the URA Is to identify the needs of an organization and then to select the system that best fills those needs, if such a system exists. All reasonable effort must be made to assure this goal is realized, including assessing pos sible conflicts-of-interests, or biases, on the part of persons or organizations that poten tially could perform the URA.
3.3 Identification of Users
Once resources have been identified for performing the URA, an initial step Is to iden tify the users of the proposed GIS. Depending on the nature of the organization and its products, there may be several types of user groups to consider. A user, in general, can be defined as a person who uses the system for production, or who works with the products developed by the system. In some Instances, a single user will perform both of these functions, such as field crews that both rely on the mapping produced by a sys tem and also use the system to update and revise their spatial data sets to produce new mapping. Another category of user is the potential user, someone who cannot use the present system because of some constraint, but could become a user of the system if it were converted to a GIS.
The system users are those who will actually interface with the hardware and software to create the products of the organization. The function of a GIS for these personnel Is to replace or augment traditional cartographic, geographic, and photogrammetric and related techniques, and to provide for more efficient creation of products analogous to those developed in the hardcopy environment. The system users may even apply the GIS technology for producing hardcopy maps as a final product; the advantages of replicating traditional mapping through the efficiencies of GIS technology being more Important than the development of new, digital products. More often the system users will be applying GIS technology to provide new products and services. Although the system users may only be developing a spatial data set for creating maps, by providing
12

it in a digital form for GIS application, they allow the traditional information to be used in new ways.
The end-product users employ the data created by a system, and the system users, for the needs of their applications, programs, and organizations. These users may be separated from the hardware and software that is used in the GIS environment to create the products. If the end-product users rely on hardcopy data, meeting their needs may only require the continuation of the present hardcopy format data provided by the system. However, If the end-product users desire to interact with the GIS sys tem and use digital data as opposed to hardcopy data, or will want new hardcopy products specialized for specific applications, the GIS system to be implemented must be designed to address these factors.
Factors of concern when end-product users expect to work in the digital environment include hardware, software, data translation, end-product user systems and end- product user applications. If the end-product user desires to interact with specific hardware and software, the URA manager must determine the means for accomplishing this objective. The end-product user may come to the site of the GIS system, may use some type of computer network to tap system capabilities from a remote terminal, or may send electronic flies and programs to the GIS site for execution by the system operators.
The URA manager should determine whether the end-product users have the required training and equipment to perform their desired applications on the GIS system. When such training or equipment is lacking, the end-product users should be so advised and planning ensued with the cooperation of the URA manager to rectify these difficulties, or determine a more realistic approach for access to the system by the end-product users in question.
Whenever end-product users expect to take digital products from the GIS being imple mented and transport this data to their own systems for their applications, the URA manager will need to determine the compatibility of the two systems. The URA manager must answer not only the question of whether digital data can be transported between the two systems, but also if the data can be transported without loss of infor mation. In some cases a software translator will be able to reformat digital data from the implemented GIS to the end-product user system, but a translator to perform the reverse operation may not exist, or may not meet requirements. When end-product users expect to modify data sets and return them for inclusion in the master GIS database, translators that will operate effectively in both directions are needed.
End-product user systems should be reviewed by the URA manager. In addition to is sues related to networking capabilities of computer systems and data translators, there are other conditions that impact the relationship of the implemented GIS with such re lated systems. Does the related system have storage capabilities to manage files from the implemented GIS? Are the input/output capabilities sufficient? Can it perform the analytical tasks required by end user applications?
Ultimately, whether the products from the implemented GIS will serve the needs of the end-product user will depend on the user's application. The URA manager must clearly
13

understand the information and analytical needs of all potential users, and these needs must be translated into GIS capabilities.
The potential users of the system within the immediate organization performing the URA usually can be identified readily by managers within the organization. These may be both system users and end-product users. Organizational plans, distribution lists, service contracts, and similar documentation can serve as a guide for identifying all users of the data produced by the system proposed for conversion to GIS technology.
Identifying possible new users of data produced by the organization will be more com plex. These potential users will be characterized by data needs similar to those of present users. However, the missions of potential users may be entirely different from those of present system users and, therefore, their identities not readily apparent. Some potential users will be organizations or personnel who cannot presently apply products from the existing system because of some constraint, such as map products at inappropriate scales, who could use products that the GIS will be capable of develop ing. Other users may be those who could use the products of the present system, but because of differing organizational missions, their application was not recognized.
Identifying these users will require researching the organization's structure and mis sions for similarities and identifying those that will be served by the proposed system. Interviews with different offices can be used to form preliminary impressions of the potential for new users. Although the identification of potential users is a difficult task, efforts in this direction should not be minimized. A GIS will provide the greatest benefits when utilized by the widest range of users. Coordination of GIS capabilities with possible users prior to implementation will be far cheaper then attempting to retrofit a system once it is in place.
3.4 Definition of Required Products
The purpose of a GIS is to create products of value to users. Before implementing a GIS the products required by users must first be defined. Examples of products re quired can be obtained directly from the present and potential users of the organization's data. These sample data sets should include both products that the users are presently applying and also concepts and designs for desirable products that could be created by a GIS. Through an analysis of these products, the URA manager can form some initial impressions of types of information, and its media, format, and ac curacy, that the GIS will be expected to develop.
These materials should be reviewed with the users to determine what aspects of the in formation content are required for user applications. Many general-purpose maps will contain information that is not needed by some users. For example, the location of power lines on a topographic map may not be important to a hydrologist performing an analysis of a large watershed. Conversely, some information that is not present on the current product may be required by the user and must be created, or added to the exist ing product before the user can perform his application. An example is the hydrologist performing the watershed study who must first annotate the topographic base map of the area to show the watershed boundaries.
14

In addition to the information content of end-products, the URA manager should ap prise himself of user accuracy needs. In assessing accuracy needs a number of sources may be consulted. The user may have published standards for the application of specific types of information for specific purposes. Models may have known accuracy limits that can be considered a upper bound for the accuracy of required Input data sets that might be derived from a GIS. Finally, the present products used in the ap plication can be reviewed to determine, If possible, their accuracy.
The preferred media of the user, scales at which map information will be required, the format, including any color requirements, should all be noted at this stage. The result of this review will be a preliminary identification of the types of information required by users and the assessment of the needed media, accuracy, and format.
Products from a GIS can be broken down Into several types, analogous to the break down of users. Personnel involved In the operation of a GIS may use several products at intermediate stages In the production process. Such products may be quality- control check plots to assess digitizing accuracy and softcopy images to preview products before hardcopy output. The final product normally developed by a GIS is referred to as the end-product, which is applied by the end-product user. Development of end-products is the major function of GIS in a map/spatial information production organization. Such end-products and intermediate-products can initially be defined in the terms described above.
GIS's that are being implemented to support analytical organizations that have no standardized products and that are not concerned with the wide publication and dis tribution of their data and information, pose a more difficult problem in assessing product characteristics. These end-products may be reports, supported by some graphics, that provide textual and tabular results of GIS analyses or they may be more standard hardcopy maps. In some instances the organizations may only be interested in creating digital products. These will require the identification of digital data stand ards and digital data formats. Review of past products and analyses performed by the organization and the mission and goals of the organization will assist the URA manager in understanding the types of products that a GIS must produce to support the or ganization.
3.5 Evaluation of Work Flow
Detailed information on the current system, whether manual or automated, should be gathered by the URA manager. This information should be gathered by interviewing the personnel involved with the existing system, such as the managers, professionals, and technicians. The interviews should be supplemented by observation of their work, noting significant backlogs if any. and the applications of various data sets that are made by the staff. Particular care must be taken to identify the specific types of data used, including the data topology, format, media, representation, and accuracy. At the same time documentation concerning the costs of operating the existing system should be developed. The results of the review of the existing system will form a base line for
15

comparison with any proposed automated system and will serve as the basis for cost/benefit analysis.
Data types can be classed by discipline. Within disciplines data can be further sub classed to provide an adequate description of data types that the proposed GIS must manage and analyze. Each type of data will topologically represent point, line, or area information, or in some instances may be used in different spatial contexts for varying applications. For example, a stream gage record represents point information, a water course represents line information, and a river basin represents areal information. However, in a different application, the user may be creating estimates of hydrologic parameters based on gage records for application to watershed areas. In this instance the hydrologist has applied point information to an area.
The format of each type of data (tables, graphs, maps) should be noted by the URA manager. Users should also be asked if the present format is most functional, or could it be improved by conversion to an alternative representation that might be more ger mane to the organization's applications.
The media in which data are used by an organization's staff to accomplish its missions should be reviewed by the URA manager to assure that a complete picture of the data requirements is gained. As an example, soil maps are often prepared on aerial photographs and the resulting compilation published. The user of the soils map is provided, through the medium of the aerial photograph, with a great deal more informa tion than the areal extent and nature of soil types. Land cover and land use data, as well as planimetric data are contained in the aerial photograph. The URA manager may find that the users of the soil map not only require the thematic soils data, but also rely on the ancillary data presented in the aerial photograph to perform their functions. Identification of these ancillary data for inclusion in the GIS data base should be made at an early stage in the URA to facilitate planning for data base requirements.
Another issue to be considered during the review of data used within the existing sys tem is accuracy. The transfer of these data to an automated environment should not degrade the ability of system users to work with data that meet the accuracy standards required by their mission. User data accuracy requirements may impact GIS data cap ture design, coordinate system and map projection software selection, and data output elements.
Data can be symbolized many ways without changing information content. However, some users may prefer drawings of double-line roads to single-line roads. Symbols for representing point facilities, such as fire stations or hospitals, may have widely recog nized standards that should be adhered to and incorporated within the GIS. The issue of graphic presentation is subjective. The requirements are dictated by the user. The GIS system most likely will allow wide flexibility in the presentation of information on products, and users may be shown examples so that they will become familiar with the GIS potential for developing data presentations that are tailored to their needs.
Often, the staff currently producing a geographic product will not be the source of the information used to develop the product, nor will they be the users of the product. In these cases it will not be enough to simply review the organization's operations. Inter views and observations outside the production organization among the suppliers of
16

data and the product users will be required. Information on data accuracy and the potential for directly acquiring a digital product for loading into the proposed GIS can be ascertained from the data suppliers. Product users can supply information concern ing the adequacy of present products, desires for alternative products, and the mini mum product that must be provided by the proposed GIS.
As this stage the URA manager should have a complete picture of the data inputs, production processes, data outputs, users, and costs of the existing system. This infor mation can be conveniently displayed as flow charts to provide a system model for reference. Within the model information types, directions of flow, production stages, and user interface can be depicted.
3.6 Data Base Development
The data requirements of the users of the existing system will become the data ele ments included within the data base supporting the proposed GIS. Often the greatest cost associated with the development and implementation of a GIS will be the effort to create a digital data base. Justification for applying GIS technology to some application may not be sufficient to support the high cost of collecting the required digital data. The URA manager will normally find that there are needs that GIS technology can readi ly meet, but that these needs can only be met if a complex digital data set is extant.
The review of existing digital data sets for incorporation within the proposed GIS is a first step towards data base development. The cost to create the required data set may be mitigated if the full burden of data capture can be avoided. Contact with such or ganizations as the U.S. Geological Survey's National Cartographic Information Center (that maintains a catalog of digital data bases available from other agencies) and litera ture searches are a means to develop information on available digital spatial data bases.
The ability of existing suppliers of base data to provide their data in digital form should also be investigated. It may be possible to have some forms of data initially collected in a computer-compatible format and avoid later data conversion. Examples are the use of computer-readable forms by field crews and the use of digital remote sensing data for some types of land use/land cover analysis missions.
The final structure of the information, as it will be required by the users, should be as sessed to determine whether it will impact the means by which data are captured. A map may be scanned at a large pixel size and provide adequate data to users if the re quirement is simply to perform grid-cell manipulations with relatively crude grid dimen sions. However, users requiring more precise information may find such a data base unusable. More applications may be found for data sets that are extremely detailed, but the costs of collecting, storing, and manipulating these data must be weighed.
The ability of a GIS to share information with other systems and to receive information from other systems must also be considered. Networked computer systems with dis tributed data bases provide the means for the power of an individual GIS data base to be increased radically. The capability for data sharing depends on the digital format of GIS data base elements. Consideration should be given to the exchangeability of the
17

data format(s) used by the GIS's proposed for the automation effort. The transport of digital data between GIS without significant loss of Information is essential to maximiz ing use of spatial data bases.
3.7 User Applications
The application of data within the GIS by users may require reformatting of data struc tures and topology, interfacing with analytical models, and complex data base manage ment capabilities. Depending on the user needs, data may be handled as raster or vector data. Each data format has advantages and drawbacks. The applicability of a given data format will depend on the needs of the user. The creation of map graphics and the analysis of data from a cartographic perspective often requires vector data. Many environmental models are not capable of managing vector data and operate based on raster data input. The ability of the GIS to manage raster and/or vector data may be required for some user groups.
Models applied to the data base may be incorporated within the GIS or may be outside the specific computing environment of the GIS. In both Instances the ability of data to be loaded Into models In an automated fashion and for the results of modelling to be portrayed by the GIS are important to users.
3.8 Refinement of GIS Product Characteristics
The initial definition of required products and the evaluation of the current system provides a description of products currently being provided to users. However, a thoughtful reassessment of the characteristics of those products should be performed before they are used as the criteria for selecting a GIS. The final product definitions should reflect the flexibility of the GIS technology in generating products, meeting the needs of user groups, and incorporating the Information gleaned during preceding ac tivities.
In many cases products from the existing system have been developed to serve a large number of multidisciplinary users. As such, these products may contain a large amount of information irrelevant to the applications of an individual user. Or, an in dividual user may find a need to reformat, rescale, or extract information from the exist ing product in some manner before these data can be applied to the user's application. In defining GIS products, flexible output from a GIS should be evaluated for providing tailored products specific to user applications.
Issues relating to the formats, media, representations, and accuracy of data required by the user must be carried over into the consideration of GIS end-product characteristics. GIS output capabilities should be designed to provide the product that the users re quire to perform their missions.
In considering these Issues, a differentiation must be made between a GIS that is used to create a hardcopy product (perhaps simply emulating the existing system) and one
18
that Is meant to support analytical studies. When automation of a mass hardcopy production system is considered, the desired CIS output may simply be a close fac simile of the current product. Analytical procedures, even those within a single dis cipline and performed within a single office, may differ drastically In required end-products. Often tabular data are output from CIS-based analysis, while, In other instances high-quality graphics will be required. Frequently a combination of data presentations will be required. The URA manager must be aware of the full range of desired end-product presentations.
Data from GIS may be output to hardcopy or to an electronic media. GIS products may be directly input to models, Incorporated within digital data sets, or stored on computer-compatible media. Users requiring these GIS end-products may have needs for digital data formats and information types. In the design of the GIS the Input for mats and data requirements of user computer models should be reviewed. The objec tive of this effort is to provide an automated link between user analysis of data and the GIS. An example is the modelling of river floods, In which topographic data are used to delineate the extent of flooding. A Digital Elevation Model (DEM) created by a GIS can serve as the base information for this analysis, provided the DEM data can be output from the GIS directly into the river model. Without such a linkage, even though the DEM is an automated product, the user may be forced to restructure and code the topographic data into the flood analysis model manually.
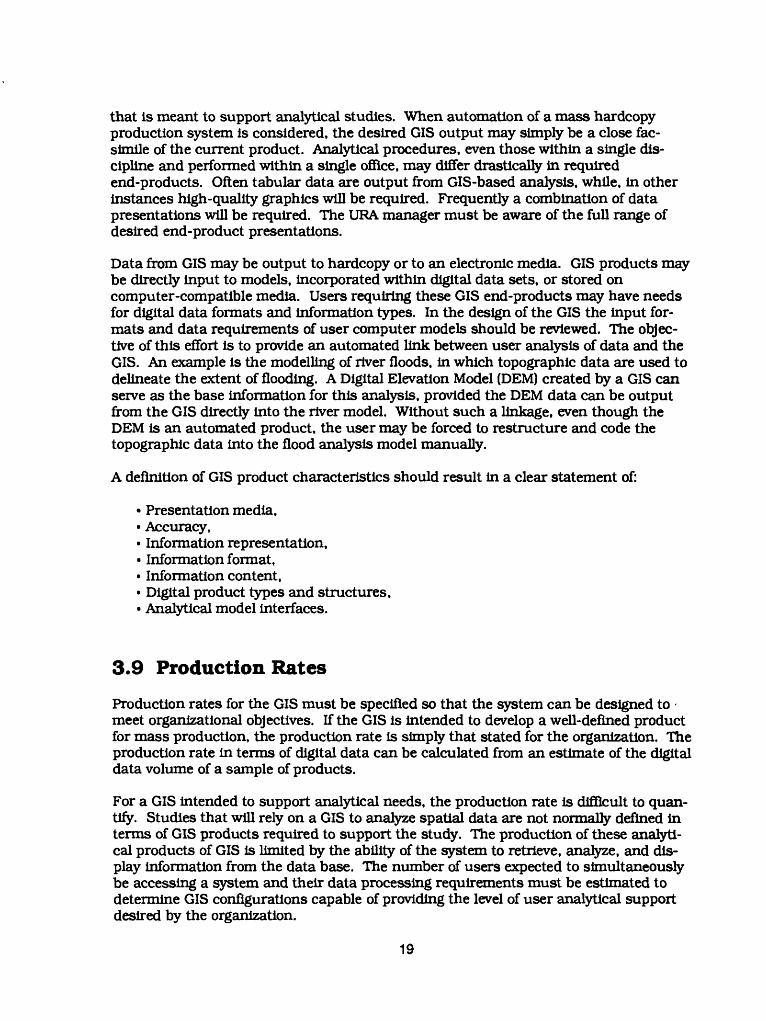
A definition of GIS product characteristics should result In a clear statement of:
Presentation media, Accuracy, Information representation, Information format, Information content, Digital product types and structures, Analytical model interfaces.
3.9 Production Rates
Production rates for the GIS must be specified so that the system can be designed to meet organizational objectives. If the GIS is Intended to develop a well-defined product for mass production, the production rate is simply that stated for the organization. Hie production rate in terms of digital data can be calculated from an estimate of the digital data volume of a sample of products.
For a GIS Intended to support analytical needs, the production rate is difficult to quan tify. Studies that will rely on a GIS to analyze spatial data are not normally defined In terms of GIS products required to support the study. The production of these analyti cal products of GIS is limited by the ability of the system to retrieve, analyze, and dis play information from the data base. The number of users expected to simultaneously be accessing a system and their data processing requirements must be estimated to determine GIS configurations capable of providing the level of user analytical support desired by the organization.
19

Estimates of required analytical products can be made by reviewing past studies by the organization to estimate the number of final and draft map images, graphics, statistical analyses, and other GIS products required. Interviews with staff can identify additional products which might have been produced If GIS capabilities were available. Based on this past experience, the GIS production rates for analytical studies can be extrapolated.
Hardcopy production rates have four primary constraints:
Availability of digital data, Availability of trained personnel, GIS ability to process data, Output device speed.
When considering production rates, the types of products must also be identified. If the product is intended to be a camera-ready image for mass reproduction and distribu tion, high-quality output devices are required. Multicolored and shaded outputs re quire specialized devices. The times to create a hardcopy product from the digital data will vary depending on output device speed. Output devices must be matched to end- product requirements and volumes.
The number, types, and purposes of products required from the GIS must be quantified before actual system configuration. When requirements have been identified they can be compared with system abilities to produce similar products within specified time limits.
3.10 Estimated Data Volumes
The number of data capture, output, and storage devices, as well as the required sizes and speeds of the CPU's should be specified, in part, around the estimated volume of digital data that will be handled by the GIS. Digital data will be input to the system through either some data capture technique, or read directly from an existing file. Aside from the density of graphic information to be digitized, the volume of digital data will also be related to the data structure, format, and level of detail captured. In some instances, particularly when raster data are stored, significant compression of files can be achieved. When vector data are captured, many points that are selected by the digitizer, or that result from a scanning process, can be deleted without impacting the accuracy of the line geometry.
As a first step towards estimating data volumes, the efficiency of a format for storing data relative to user requirements and applications, and the means for compressing these files should be considered. Data base size should be minimized, and data struc tures simplified to the extent possible without creating negative impacts on users.
Data volumes can be estimated by having representative samples of data digitized in the desired format and structure. The sample can be used to estimate the data volume for the entire data base.
20

Data can be classified by their function within the CIS, and data volumes can be es timated for each type of data. Some data sets may not be utilized often and can be stored offline. Similarly decisions can be made as to the storage of data online in mass storage and the priority for retrieval of these data.
In designing the overall CIS system, typical user activity on the system, encompassing data capture, analysis, and output needs, should be estimated. These estimates can be used to assure that the system configuration will support user demands without undue hindrance from system access delays.
3.11 Cost /Benefit Analysis
A cost/benefit analysis attempts to determine the costs of implementing a CIS and to quantify the benefits that CIS Implementation would provide above the present system.
The baseline for comparison is the cost of operating the present system. Organizational budgets and records are the primary source of this Information. Cost factors, such as personnel salaries, hardware, maintenance, overhead, and supplies, should be readily quantifiable.
Intangible benefits from automation, such as improved response time and more flexible output, will require comparison to some baseline. Existing system response time records, products, and user Interviews should be considered in generating the baseline.
The costs associated with the CIS should be calculated for comparison. These costs In clude all purchase and maintenance costs for the system and should Include the economics of the system life cycle. Generally, Information on these costs is easily quan tified, once a system or class of systems has been identified, from educated analysis of vendor-supplied Information.
Other costs that must be considered are the costs for staff training, including lost production while the staff becomes proficient on the new system. A change in staffing also may be required to reflect the operating needs of the new system.
Perhaps the most critical cost element is the creation of the required digital data sets. This cost may range from 10 to 1,000 times the hardware and software costs of the CIS. Hie CIS will not succeed without sufficient digital data. The cost estimate for Im plementation must reflect adequate data capture to support user needs.
Intangible benefits, such as those associated with quicker response time or more product flexibility, are difficult to quantify. Yet, many such benefits are the strongest arguments for having a CIS. In each CIS cost/benefit analysis, the URA manager should attempt to define intangible benefits and associate a monetary value. The total cost/benefit results can be compared directly to the baseline of the current system to view the economic viability of implementing the CIS.
21

3.12 URA Report
The URA manager should prepare a report for the organization management. This report should clearly, and in detail, identify the following:
The operation, users, and data requirements of the existing system, The potential users of a GIS, Products required by users, digital and hardcopy, Data volumes and production rates the GIS will be required to meet, The data base required to support GIS Implementation, A cost/benefit analysis.
The report should provide all the details required to understand the spatial data that users require and the analytical capabilities needed to automate the existing system.
22

Chapter 4. Application Assessment
The URA provides managers with a comprehensive description of the data sets, data base management capabilities, modelling and analytical needs, and product generation requirements for successful GIS implementation. Based on this information the manager must weigh the merits of GIS usage relative to the organization's applications.
The URA cost/benefit analysis is a good indicator of the need for applying GIS technol ogy within the organization. The degree to which intangible benefits have been ade quately measured and quantified must be considered in a subjective manner when the cost/benefit ratio is evaluated. When the cost/benefit ratio is marginal, that is. close to 1.0, further research may be required, particularly into the intangible benefits, before a decision on GIS implementation can be made based on the cost/benefit ratio.
The manager must also consider the appropriateness of applying GIS technology to the organization's applications regardless of the results of the URA. The URA documents how an existing organization functions and supports its users and then quantifies and defines an alternative operation based on GIS technology. The URA does not address is sues that may be related to the organization's objectives, goals, staff capabilities, etc., that are not quantifiable technical issues.
Managers should reflect on the goals and objectives of the organization and determine if a system based on, and products from, GIS technology fulfill both the letter and spirit of the organization's responsibilities. In some organizations the potential loss of the human interaction with either data or users may be an overriding concern. As an ex ample, it may be possible for an organization to create an online system for users to ac quire and analyze data produced by the organization, relieving staff from providing hardcopy documents and advising users on their application. However, in the hardcopy environment, the staff person through frequent, personal contact with the user develops a working knowledge of user needs, concerns, and applications. Ques tions concerning the organization's products and possible errors or problems with these products will often come to light during staff-user interaction. This feedback process leads to improvement of the organization's products and their overall quality.
In the computer environment, users often only work with a segment of a data base, whereas in the hardcopy environment, they nearly always deal with a complete map sheet at some point. The map will normally contain information regarding accuracy and data sources. In the computer environment the user may not have access to infor mation on data sources, accuracy, and even the scale at which the data were originally compiled. Thus, users may lose perspective on fundamental issues, such as accuracy, through the application of GIS technology.
23

When some products and services are moved to an electronic environment, it may not be possible to provide the same degree of responsiveness to users as has been ex perienced under the present system. For unusual or unique problems that cannot be answered or analyzed by the GIS, staff will be required to respond directly to the user. However, staff may find It difficult to address such requests for assistance while they are heavily involved in the operation and management of a GIS.
An increasing concern in the field of information systems, including GIS, are legal is sues. Spatial information placed within a computer can be output to any scale, refor matted, combined with any other data set and used to create new products and services at the users' discretion. During this process the accuracy of data may be mis construed, information misrepresented, and other problems introduced that cause failure of applications based, in part, on misuse of the original data set developed by the organization. The impact of such a failure and the organization's responsibility for foreseeing that such a problem could develop and acting to prevent it, will vary with the application.
Often map documents prepared by a GIS will not be accepted in a court of law. Cur rently land records data are often considered valid in a court of law only if they were prepared through traditional surveying and drafting techniques. Such issues should be addressed by the organization's legal staff as part of the applications assessment.
A move to implement GIS technology will also impact the organization's staff. Without support from the staff, GIS implementation will not succeed. GIS implementation re quires staff retraining for success. If the staff does not support GIS technology, it will be very difficult to create an environment where a transition to a GIS based system is possible. Managers should apprise themselves of the level of effort required by staff to implement the desired system and the staff's attitude towards the change.
24

Chapters. Evaluation Criteria
If upon completing a URA and assessing the appropriateness of CIS applications for the organization's missions, the managers determine that CIS technology should be Incor porated Into the operation, evaluation criteria must be devised to serve as the basis for selecting a GIS. Evaluation criteria should be clearly specified so that both the or ganization and the vendors have a clear understanding of what is requested and what is required. The evaluation criteria should be incorporated into the standards used in conducting benchmark testing (Chapter 9).
Hands-on experience with GIS capabilities will often be of value in developing reasonable evaluation criteria. A useful method to acquire such experience is to per form a small-scale pilot project. The pilot project should be designed to test the ability of GIS systems to meet an organization's operating needs. Pilot tests can be a source of realistic data on production rates, memory and storage requirements, human interface functionality, and user response to GIS products.
All or only portions of the GIS design for the organization may be tested, depending upon the organization's familiarity with GIS systems. It may be desirable to test only the portions of the GIS that are most critical to organizational needs or represent the elements with which the organization is least familiar. Pilot test results can be used to refine evaluation criteria based solely on a URA. Readers may wish to look at an article "Performance Evaluation and Work-Load Estimation for Geographic Information Sys tems" (Goodchlld and Rlzzo, 1987, International Journal of Geographic Information Sys tems, vol. 1, no. 1, p. 67-76) that discusses a software model used to predict system resource utilization.
25
-c 2<?

PART H -- TOPICS IN THE TECHNICAL EVALUATION OF CIS
Chapters. Standards and Guidelines
Standards enable the Integration of geographic information systems. Internally, stand ards enhance the inherent integratlve capabilities within a GIS by coordinating data, software, and hardware to optimize application efficiency, effectiveness, and economy. Externally standards facilitate integration with other GIS's or information systems through compatibility in data administration, data base management, graphics, hardware, and software. Such standardization augments the functionality, flexibility, and productivity of a GIS while extending its availability to a greater audience. Inter face standards enable interconnectivity and communication between information sys tems; they include data interchange, data base conversion, graphics, software, and hardware standards.
Geographic information systems represent a convergence of digital automation and various earth science disciplines. This increasing use of computer software and hardware in spatial applications during the past 2 decades has been maximizing productivity while minimizing costs. Initially, digital automation replaced specific labor intensive or repetitive tasks, resulting in selected points of automation. Once com mitted to digital automation, any inability to integrate these individual implementations to other or new computerized activities through interchanging or interfacing computer data, software, and hardware can seriously offset the overall cost-effectiveness of digital automation.
The initial replacement of manual operations by digital automation has expanded to in clude sophisticated complex and analytical digital spatial applications. Thus interac tively, digital automation influences the development of spatial applications; digital spatial applications become very dependent on digital automation. Collectively, this dual reliance of spatial applications on digital automation extends to a considerable de pendence on integration for maintaining, upgrading, and expanding GIS's.
Accordingly, the success of a GIS is, in large part, contingent upon integration. Integra tion is attainable through prodigious individual effort or by conformance to standards. In general, the former offers only limited short-term solutions; widespread long-term In tegration is dependent upon compatibility defined by standards.
27

Currently, there is considerable interest in and opportunities for GIS. GIS's rapidly gain their expected potential as standards support and sustain their integration. As new digital technology is Implemented and the trend towards total automation of ap plications continues, there must be a concerted effort to integrate and to integrate through the use of standards.
Standards and guidelines for GIS's apply to both general computer systems and specific GIS activities. A set of GIS related standards, guidelines, de facto and developing stand ards, and references is given in Appendix A. Most of the standards listed are Federal In formation Processing Standards (FIPS) which are directly applicable to civilian and military agencies of the Federal government. American National Standards Institute (ANSI), International Organization for Standardization (ISO), and Industry standards are cross-referenced to FTPS standards where appropriate.
In addition, special mention should be made of "The Proposed Standard for Digital Car tographic Data." This proposed standard was published as a special edition of The American Cartographer (vol. 15, no. 1, January 1988). The proposed standard consists of four major components:
Definitions and references, Spatial data transfer, Digital cartographic data quality, Cartographic features.
The standard is an attempt to meet the recognized requirement for easy transfer of spa tial data from one spatial data handling system to another, with both systems possibly residing on computer hardware and operating system software of different makes.
28

Chapter?. Software Functions
7.1 Overview
Defining a set of processing functions to meet specific application needs is an important step in the design or evaluation of a CIS, and is a direct outgrowth of the user require ments analysis phase. Identifying required functions often begins with a detailed list ing of required CIS products and their specifications. Further product analysis subsequently leads to identifying the type of processing functions required to produce each product.
Individual processing functions are often prioritized as either mandatory or desirable capabilities. Mandatory software capabilities, when merged with parameters that quan tify specific application needs such as required response time, accuracy, precision, product generation frequency, and data volumes, lead directly to mandatory hardware capabilities.
Existing GIS's are extremely diverse both in functionality and data base structure. Sys tems use various methods for digitizing, assigning, and storing attribute, coordinate, and topological information. The capability to manipulate, analyze, and display these data varies widely across systems. Capabilities of a given system are often oriented towards providing a specific capability or supporting a specific application area, such as computer aided design (CAD), computer aided mapping (CAM), surveying, natural resource management, terrain analysis, and/or image processing.
As discussed in Chapter 1, functional components for GIS's can be grouped into five broad classes: user interface, data base management, data base creation, data manipulation and analysis, and data display and product generation.
User Interface functions are those methods by which the human operator communi cates with application programs, (for example, menus and help screens).
Data base management functions provide for tracking, retrieval, storage, update, protec tion, and archiving of stored data.
Data base creation functions are those functions required to convert spatial data into a digital form that can be used by a CIS. This Includes digitizing of features found on printed maps or aerial photographs and transformation of existing digital data Into the Internal format of a given GIS. In either case, initial data entry normally requires some form of attribute tagging, topological structuring, and editing. Editing capabilities provide the ability to add, delete, change, and validate either attribute or spatial data.
29

Data manipulation and analysis functions provide the capability to selectively retrieve, transform, restructure, and analyze data.
Retrieval options provide the ability to retrieve either graphic features or feature at tributes in a variety of ways. Transformation includes both coordinate/projection trans formations and coordinate adjustments. Data restructuring includes the ability to convert vector data to raster data (or the inverse), merge data, compress data, reclasslfy or rescale data, and contour, triangulate, or grid random or uniformly spaced Z-value data sets.
Analysis functions differ somewhat depending on whether the internal data structure is raster or vector based. A given CIS may support either or both data structures. Analysis functions provide the capability to create new maps and related descriptive statistics by reclassifying and combining existing data categories in a variety of ways, (for example, graphical overlay (and, or, not) and/or arithmetic (+, -, x, /, etc..)). Analysis functions also support: replacement of cell values with neighboring cell charac teristics (neighborhood analysis); defining distance buffers around points, lines and areas (proximity analysis); optimum path or route selection (network analysis); and generating slope, aspect and profile maps (terrain analysis).
Data display functions provide the ability to generate both two-dimensional or thographic and three-dimensional perspective displays; symbolize point, line and area (polygon) features, and annotate maps for display on a graphics terminal or output to a hardcopy device.
7.2 Software Functional Components Checklist
A detailed checklist of the kinds of processing functions that are often available in each of the five major categories follows in this section.
7.2.1 User Interfaces_ Command driven interface with__ without_ prompt
and answer interface with default answers._ Capability for pull-down or pop-up menus._ Interactive command language interface._ Ability to use command abbreviations (aliases)._ Allow for building of macros, shell scripts, or batch
files to automatically execute complex functions from an aggregate of simpler individual functions.
_ Online help screens to summarize commands available.., and command syntax, function, and limitations for individual commands_ or groups of commands_.
_ Online_ or drafL. users manuaL. and tutorials...
30

__ An undo command to retract previous entry.__ A recall command to restore previous entry.__ User-friendly error messages.__ Soft error recovery.__ Password access protection.
7.2.2 Data Base Management
General
_ Facility for entering data quality information for both spatiaL_ and attribute_ data base, including: lineage_, positional accuracy_, logical consistency^, and completeness^.
__ Facility for tracking data base transactions.__ Support sequential, direct, and keyed access to data files.__ Data dictionary for defining file contents and format.__ Direct access to specific features in addition to sequential
file access._ Allow sorting of tabular or graphic files by attribute or
spatial data field._ Calculate values of new fields using arithmetic expressions
or table look-up in related files.__ Capability to relate data files by shared fields and treat
resultant collection as a unit for all tabular processing functions including data entry and report generation.
_ Capability to set read_, write_, access_ authorities on both spatiaL- and attribute data bases.
_ Provide ability to create, store, retrieve and generate standard reports.
__ Provide the following tabular formatting capabilities: line breaks on specified fields_, page breaks__, calculation of totals_ and subtotals^, specification of page _ and column__ headings, multiple line displays from single records.
Spatial Data Base Components
__ Provision for organizing spatial files by location_,project__, theme_, and map unit__.
_ Provision for multiple access__ to permanent data files,but only authorized user ability to modify data base.
__ Provision for full add, delete, modify of user-created workfiles, by and only by the user.
_ Capability to automatically catalog or index all data inthe data base, including data quality^, location__, anddate last maintained_.
31

_ Generation of status reports on content and condition of thedata base.
_ Capability to add data files without regard to size, orscale.
7.2.3 Data Base Creation
Digitizing
Methods
_ Manually digitized two-dimensional point & line data._ Manually digitized two-dimensional full polygon data._ Manually digitized two-dimensional arc/node polygon data._ Photogrammetrically digitized three-dimensional point, line, and
polygon data._ Manually encoded cellular data. _ Scanned map data. _ Scanned photographic data.
Tagging
_ Assign feature names or codes which may be pointers to feature attributes while digitizing^, or as a separate process_.
Keyboard entry_ Numeric.. Field length_ Menu pad entry_ TexL_ String length_ Cursor pad entry_
_ Facility for setting initial default values and duplicating previous entries.
Assigning Topology
_ Arc pointers to areas Automatic.. Manual_._ Arc pointers to nodes Automatic... Manual_._ Node pointers to arcs Automatic_ Manual_._ Node pointers to areas Automatic^. Manual_._ Area pointers to arcs Automatic.. Manual_._ Area pointers to nodes Automatic... Manual_._ Automatic., manual,_ polygon assembly from arcs._ Automatic., manuaL. identification/linking of complex
polygons (for example, polygons with one or more inner rings). _ Automatic snapping of line end points to nodes while
digitizing^ or in batch_mode.
32

_ Automatic polygon closure._ Automatic polygon centroid calculation^ or manual
digitizing of centroids _.
Attributes
_ Allow for interactive... or batch_ entry of multipleattributes.
_ Allow attributes to be associated with features by featurename_ or by digitized coordinate^, (for example, interiorpolygon coordinate).
_ Allow for automatic__ manuaX_ insertion of calculatedarea__ perimeter__ length_ statistics as attributes.
Error Detection and Editing
Raster or Vector Data
_ Automatic topologic error checking, graphic display of errors, andfacility for interactive correction.
_ Format checking^ range checking_ value checking^, onvector_ coordinate data or raster__ pixel data duringdigitizing., or in batch_ mode.
_ Interactive insertion^ deletion__ changing^. moving_of vector_ features or raster__ pixels by feature_ orgroups__ of features.
_ Automatic checking for overshoots or undershoots at lineintersections during digitizing^ or in batch mode _ andcorrection by redigitizing_ or automatic clipping/joining....
Attributes and Feature Names/Codes
_ Interactive insertion^ deletion__ changing^. moving_of feature names or codes.
_ Checking for feature names or codes that are missing. _ Checking for Illegal names/codes while digitizing^, or in
batch_ mode. __ Entry leveL_ or batch__ checking for Illegal attribute
values or combinations of attribute values. _ Query select function for updating groups of graphic _
feature name _ or attribute _ records.
33

Import/Export
_ Ability to Import the following data-set formats:MOSS_ MAPS_ AMS _ SAGIS_ GRASS_ ODYSSEY__ USGS DLG (Standard)_ USGS DLG (Optional)_ USGS DEM_ USGSDTM__ GIRAS__ SCS GEF_ USCB DIME_ USCB TIGER/LINE_ USCB TIGER/DATA BASE__ STDS_ FEMA/IEMIS DBMS _ DIGITAL IMAGERY _ OTHER __ OTHER _ OTHER __
_ Ability to export the following data-set formats:
MOSS_ MAPS__ AMS _ SAGIS_ GPASS_ ODYSSEY_ USGS DLG (Standard)_ USGS DLG (Optional)_ USGS DEM_ USGSDTM_ GIRAS__ SCS GEF_ USCB DME_ USCB TIGER/LINE_ USCB TIGER/DATA BASE_ STDS_ FEMA/IEMIS DBMS _ DIGITAL IMAGERY _ OTHER _ OTHER __ OTHER___
7.2.4 Data Manipulation and Analysis
Retrieval
_ Selection of a specific data category._ Selection of spatlaL_ or attribute__ data by
rectangular_ circular... or potygonal_ graphic windows. _ Selection of spatiaL_ or attribute_ data by area masks
defined from interactively screen digitized areas_ orredeflned-reclasslfled data categories...
_ Selection of spatiaL_ or attribute_ data by featurename__ or groups of names__.
_ Selection of spatial data by Boolean retrievals onattributes.
_ Selection of spatiaL_ or attribute_ data by graphichooks (for example, digitized point).
_ Browsing either spatial_ or attribute_ data bases.
Restructuring
_ Data conversion from raster to vector_ and vector toraster, with user selectable_ priority for point, linear,or areal features.
_ Interactive_ or automatic_ joining of geometricallyadjacent data resolving gaps/overlaps within default oruser-specified tolerances.
_ Compress_ or decompress _ raster data to run length_
34

or quad tree__ encoded data and reverse_. _ Modify raster cell size through resampling. _ Reduction of unnecessary coordinate detail (weeding) while
retaining corner points, general sinuosity, and shape. _ Smoothing of line data to recover general sinuosity and
shape. _ Generate contours from either random^ or gridded_
(raster) Z-value data points, and conversely generategridded Z-value data points from contour data_.
_ Generate a triangulated irregular network from random_or gridded_ (raster) Z-value data points or from contourdata_.
_ Generate griddecL_ data or contour_ data from atriangulated irregular network.
_ Constrain contour generation by specifying barriers_(for example, fault lines) or constraints_ (for example, ridgeand stream lines).
_ Provision for the following coordinate geometrycapabilities: protraction of parallel lines_ curves_and features_; create equal line_ and arc_ segments;intersect lines_; bisect angles_; locate crosstangent__ and exterior tangent_ lines.
Transformation
_ Mathematical adjustment of vector_ or raster_ data to control points using rotation/translation/scale in X and Y_ (4-parameter), rotation/translation/scale in X or Y_ (6-parameter), local area rubbersheeting_, polynomials..., or some other_ type of least-squares adjustment.
_ Recovery of geographic ground coordinates from digitized photographic data using single-photo resection/intersection techniques together with digital elevation data_ or strips of stereo photographs using analog^ or analytical__ plotters.
_ Transformation of ground survey bearing and distance data to geographic coordinates using least-squares adjustment of traverse data to known ground control.
_ Radiometric calibration of remotely sensed digital image data_ or scanned photographs__.
_ Rescaling of raster data values (for example, contrast stretching)._ Map projection conversions similar to those available in the
USGS/NOAA General Cartographic Transformation Package (GCTP).
_ Albers Conical Equal-Area.__ Azlmuthal Equidistant._ Equidistant Conic._ Equlrectangular._ General Vertical Near-Side Perspective.
35

_ Geographic latitude and longitude._ Gnomonic._ Lambert Azlmuthal Equal-Area._ Lambert Conformal Conic._ Mercator.__ MlUer Cylindrical._ Oblique Mercator (Hotlne)._ Orthographic._ Polar Stereographic._ Polyconic._ Sinusoidal.__ State Plane._ Stereographic._ Transverse Mercator._ Universal Transverse Mercator._ Van Der Grinten I.
Vector or Raster Overlay
_ Boolean AND_, OR^, XOR^, NOT_ overlay operators forvector data: polygon In porygon_, point In porygon__,point In llne_, line In polygon__.
_ Boolean AND_, OR^, XOR^,NOT_ overlay operators forraster cell data: polygon In polygon__, point inpolygon__, point In llne_, line In polygon__.
_ Ability to weight features within a data category_ or datacategories^ during the overlay process.
_ Ability to superimpose one data category on another withreplacement.
_ Ability to automatically^ or manualty_ merge attributeInformation resulting from a graphical compositing process,(for example, Polygon C, a result of A (corn) and B (soil XJ hasconcatenated attribute corn/soilX).
Raster Cell Operations
_ Ability to assign binary (1/0)_, discrete (0-32768)_ or real continuous., data values to cells in a raster data set.
_ Ability to perform the following mathematical operations on two or more raster data categories: add_, subtract^, multipry_, divide_, mlnlmum_, maximum_.
_ Ability to perform the following mathematical operations on a single raster data category: exponentiate^, logarithm..., natural logarithm_, absolute value_, sine_, cosine_, tangent__, arcsine_, arccosine_, arctangent...
36

_ Ability to replace cell values with a new value reflecting some mathematical combination of neighborhood cell values: average_, maxlinum__, mlnlmum_, totaL_, most frequent__, least frequent__, mean deviation^, standard deviation^, other_.
__ Supervised^.., unsupervised__ clustering capability.
General
_ Ability to specify distance buffers from point, line, orpolygon features.
_ Determine alternative and optimum paths through a network. _ Automatically identify drainage networks^., watersheds^.
and viewsheds__._ Perform cut/fiU_ and profile_ analysis on terrain data. _ Generate slope, aspect, and sun intensity data categories. _ Compute azimuth__. bearings_, and geographic point
locations_. _ Define, open and close, and adjust traverses.
Statistics
_ Calculate areas_, perimeters_, lengths_, andvolumes_.
_ Calculate acreage__ and percent of total_ for crosstabulations of mutual occurrences between two data categories.
_ Compute the following descriptive statistics from tabulardata: means_, medians_, quartiles_, percentiles_,range_, mid-range_, standard deviation^..
_ Conduct the following statistical analysis on tabular data:correlation^., regression^, analysis of variance_,factor analysis_, discriminate anatysis_, contingencytables_.
_ Support the following testing: T-test__, chi-square_,Mann-Whitney_, Runs__.
_ Support the following distributions: normal_, Poisson__,binomlal_.
_ Calculation of confidence intervals_ and Wilcoxonintervals__.
7.2.5 Data Display and Product Generation General
_ Generate graphic displays on graphic terminals_, digital plotters_, InkJet printers_, color ribbon printers_, matrix printers^, laser printers_, electrostatic
37

printers.., character printers_, film recorders... _ Display source raster., or vector__ files on either
raster., or vector., display devices. _ Generate maps via copy of the display screen. _ Generate maps that are larger than the physical dimensions
of the output display device, that can then be mosaicked. _ Generate three-dimensional orthographic., and two-point
perspective view plots_ of gridded surfaces., or otherZ-value data categories^.
_ Compose displays interactively., or use default _ mapcomposition layouts.
_ Capability to specify the location^, slze_, scale_,and orientation^, of multiple., viewports on a singledisplay.
_ Ability to display point, line, and polygon data sets. _ Ability to display map neat lines_, grid lines _, tick
marks_ in a latitude/longitude...., state plane_ orUTM^. coordinate reference, with annotation_ at specifiedscale__.
_ Ability to select point symbols_, line types_, area fillpatterns., and character fonts_ from existing tables.
Map and Map Feature Annotation
_ Facility for creating, naming, storing, retrieving and interactively positioning: map titles__, legends.., bar_ or texL. scales, north/south arrows__, single-line or blocked multi-line text strings_.
_ Ability to specify font type_, case_ character size_, color__ and string orientation^, for all text entries.
_ Ability to automatically position^, text entries atprespeclfled point locations (for example, polygon centroids), supplemented with the capability to interactively move_ or rubberbancL. respective entries.
_ Facility for creating, naming, storing and selecting default point symbols_, line types_ and area-fill patterns...
_ Ability to assign point symbol_, line type_, line width_, area-fill pattern_ and color_ to graphic features by specifying a feature name_ or group of names_, feature display color or group of display colors__, attribute or group of attributes_or interactively selecting features with a cursor_.
__ Ability to cross-hatch fill areas by specifying hatch color__, line type__, rotation angle__ and distance interval^..
38

Chapter 8. GIS Hardware Components
The hardware components of a GIS are not unique. Most components are general-pur pose computing devices and associated peripheral equipment. The only functions re quiring somewhat specialized equipment are data capture (digitizing) and data display (graphics output). The list of possible components is divided into six major categories:
System configuration, Data capture/input devices, Processing devices, Interactive display and edit devices, External storage devices, Output devices.
Users must ensure that their hardware configuration is adequate to support their desired software functions (as determined in Chapter 7).
8.1 System Configuration
Note: Consider data and all hardware components (within a single GIS or between GIS's) and evaluate in terms of:
A. Distributive processing environment.1. Personal-computer (PC) or workstation environment.2. Minicomputer environment.3. Mainframe environment.
B. Standalone environment.1. PC environment.2. Mini environment.3. Mainframe environment.
C. Hybrid of options A and B.1. PC environment.2. Mini environment.3. Mainframe environment.
Note: Bach of the above is evaluated for both dumb and intelligent terminals.
39

8.2 Data Capture/Input Devices
Note: If all input data are machine readable, data capture/input hardware is not a required system component.
Devices AvailableA. Manual process.
1. Two-Dimensional data capture, a. Digitizer tables/tablets.
1. Cursors.a. Free cursor, b. Fixed cursor.
2. Three-dimensional data capture (stereocompilation).a. Analytical stereocompiler.
B. Automatic process.1. Two-dimensional data capture,
a. Scanning devices.1. Flatbed.2. Drum.3. CCD Camera.
Evaluation ConsiderationsA. Data capture/input hardware characteristics.
1. Active input area dimensions.2. Accuracy.3. Resolution.
a. Minimum resolution available, b. Variation of resolution possible?
4. Repeatability.5. Color capabilities.
a. Monochromatic or chromatic.b. Number of colors/graytones recognizable.
6. Type of input acceptable.7. Data capture format.
a. Raster, vector, or combination.b. Are conversion capabilities part of the hardware?
8. Ability of absolute data positioning/registration.9. Data collection speed.10. Reliability.11. Maintainability.12. Cost.
Relate the Above Characteristics to and Evaluate in Terms of:B. Source documents to be utilized.
1. Document type, a. Map.
1. Line.
40

2. Area, b. Aerial photographs.
1. Single photo - two dimensional.2. Stereopair - three dimensional,
c. Satellite imagery, d. Miscellaneous.
2. Document form, a. Positive image, b. Negative image.
1. Photographic negatives.2. Microfiche.
3. Do source documents include registered overlays?4. Condition of document.
a. Density of features to be captured, b. Clarity, c. Cleanliness.
5. Maximum document dimensions.6. Monochromatic or chromatic,
a. Amount of colors/graytones.7. Volume of data to be captured.8. Estimated extent of preprocessing required
for successful use with selected device.9. Data capture frequency.
C. Output device evaluation.1. Is the accuracy of the input device compatible with
the accuracy of the selected output device?2. Is the resolution of the input device compatible with
the accuracy of the selected output device? D. Overall system considerations.
1. Compatible with selected system data format?2. Compatible with all other selected system hardware?3. Compatible with selected system software?
8.3 Processing Devices
Evaluation ConsiderationsA. Internal memory available. B. Processing speed.
1. Response time.2. Instruction execution time.
C. Reliability. D. Maintainability. E. Cost.
Relate the Above Characteristics to:F. Overall system considerations.
1. System configurations.2. Software capabilities.
41

8.4 Interactive Display and Editing Devices
Components AvailableA. Graphics terminals.
1. Display technology.a. Vector refresh.b. Storage tube.c. Raster refresh.
B. Alphanumeric keyboards. C. Digitizing tablets/cursors. D. Controllers.
Evaluation ConsiderationsA. Size.
1. Graphics terminal.2. Digitizer table/tablet.
B. Resolution. C. Response time. D. Controller storage capabilities. E. Reliability. F. Maintainability. G. Cost.
8.5 External Storage Devices
Devices AvailableA Disk storage.
1. Fixed.2. Removable.3. Floppy disk.
B. Tape.1. Reel to reel.2. Cartridge.
C. Optical storage.1. CD-ROM.2. Laser disk.
Evaluation ConsiderationsA Storage capacity. B. Access time. C. Transfer rates. D. Reliability. E. Maintainability. F. Cost.
42

8.6 Output Devices
Devices AvailableA. Hardcopy output.
1. Line printer, a. Impact.
1. Print chain.2. Daisy Wheel.3. Dot Matrix,
a. Ink b. Thermal,
b. Non-Impact.1. InkJet.
a. Fire-on-command.b. Free fire or continuous.
2. Xeroxographic.3. Light (Optical).
2. Plotter.a. Type of signal.
1. Analog.2. Incremental,
b. Plotting surface.1. Flatbed.2. Drum(s).
a. Single, b. Multiple.
3. Variation (hybrid), c. Plotting device.
1. Pen (single or multiple). a. Ball point, b. Felt tip/plastic tip. c. Liquid ink.
2. Photohead.a. Fixed aperture (beam), b. Variable aperture (flash), c. Hybrid.
3. Scribing tool, a. Fixed, b. Tangential.
4. Electrostatic.3. Other.
a. Output to tape, b. Output to compact disk.
B. Display output.1. Graphics Terminal.
Evaluation ConsiderationsA. Output hardware characteristics.
1. Active output area dimensions.
43

2. Accuracy.3. Resolution.
a. Minimum resolution available, b. Variation of resolution possible?
4. Color capabilities.a. Monochromatic or chromatic.b. Number of colors/graytones recognizable.
5. Type of output produced.6. Data output format.
a. Raster, vector, or combination.b. Are conversion capabilities part of the hardware?
7. Ability of absolute positioning/registration.8. Data output speed.9. Reliability.10. Maintainability.11. Cost.
Relate the Above Characteristics to and Evaluate in Terms of:B. Documents to be output.
1. Document type, a. Map.
1. Line.2. Area,
b. Graph, c. Report, d. Miscellaneous.
2. Document form, a. Positive Image, b. Negative image.
3. Do output documents Include registered overlays?4. Maximum document dimensions.5. Monochromatic or chromatic,
a. Amount of colors/graytones.6. Volume of data to be output.
C. Input device evaluation.1. Is the accuracy of the output device compatible with
the accuracy of the selected Input device?2. Is the resolution of the output device compatible
with the accuracy of the selected input device? D. Overall system considerations.
1. Compatible with selected system data format?2. Compatible with all other selected system hardware?3. Compatible with selected system software?
44

Chapter 9. Benchmarking
9.1 General Procedures
Benchmarking is a process in which computer systems such as a CIS are tested for functionality and performance. Benchmarking is accepted as part of the acquisition process within both private industry and the Federal Government. The success of benchmarking as an evaluation technique depends upon the extent to which benchmark tests can be constructed that are representative of expected workloads. Ten procedural steps for benchmark construction, as described in the Federal Informa tion Processing Standards Publication 75 "Guidelines on Constructing Benchmarks for ADP System Acquisition," (FIPS-PUB-75, September, 1980), are:
STEP 1. Define benchmarking objectives and complete preliminary activities (such as defining an agency's service, operational, and workload requirements).
STEP 2. Quantify the present workload requirements.
STEP 3. Survey users (to obtain information on present applications and user forecasts of new or changing applications).
STEP 4. Forecast future workload requirements.
STEP 5. Categorize future workloads. Total workload is partitioned into distinct categories.
STEP 6. Determine the Relative Contribution of each category.
STEP 7. Scale Each Category (weight the running times for each category's set of benchmark problems according to its contribution).
STEP 8. Represent workload categories with benchmark problems. Select realor synthetic programs that represent the workload categories identified in STEPS.
STEP 9. Fine tune each benchmark mix on the present system.
STEP 10. Prepare the benchmark package (the documentation of the benchmarkmix and the rules for the live test demonstration) and test the benchmark.
45

Benchmarking should be done following required standards, guidelines, and practices. Much of this information is found in FIPS PUBS (as noted in Chapter 6). In addition to FTPS PUB 75, the reader should refer to FTPS PUB 42-1 "Guidelines for Benchmarking ADP Systems In the Competitive Procurement Environment," (May, 1977) and the General Accounting Office Publication "Evaluating the Acquisition and Operation of In formation Systems," Technical Guideline 2, July, 1986.
A key point is that the benchmarking must be done on products and capabilities Iden tified through a URA and reflect estimated future data volumes. Users must also recog nize that the preparation of a comprehensive benchmark may itself be a major task. The user must weigh factors such as the size of the procurement against the effort re quired to conduct benchmarking to determine the appropriate level of benchmark test- Ing.
The following sections provide some example procedures that may be useful in con structing a GIS benchmark. More specifically they represent a set of example benchmark problems (as described in STEP 8 above) that may be useful in testing various functions that are specific to GIS's. An agency must develop a benchmark that measures the compliance of the system being tested to their specific functional and per formance specifications.
9.2 Sample GIS Benchmark Problems
A URA will have identified output product requirements and their specifications. These products will determine what processing functions are required. The required products and their processing will lead to mandatory and desirable system capabilities and re quirements, as discussed in "Software Functions." Any specific benchmark should be constructed to evaluate all mandatory and desirable system functions.
9.2.1 Data Entry and Data Base CreationThese tests should be done on preselected maps or data sets for which all measure ments are known. The tests should take into consideration the functional components for both hardware and software that your specific analysis indicated were required. For the edgematching test the data should cover the corner of four adjoining areas. The fol lowing tests are generalized to cover generic GIS requirements for data entry and data base creation including:
Digitizing;Edgematching;Polygonization;Labelling;Reformatting of digital data to and from other systems; andData base creation.
46

Under each of these tests there may be requirements (as appropriate) for
Display;Editing - correction of errors;Quick-look plots;Listings; andReport output.
9.2.1.1 Test (A) Digitizing Points and Lines
Digitizing is here regarded as the process of converting point and line data from source documents to a machine-readable format. This may be done manually, by scanning manuscripts, by direct input (keyboard), or with data from outside sources. Editing and reformatting of the data during and after digitizing are considered separately.
In this example manual digitizing functions and procedures will be tested. Digitizing table specifications require a precision of 0.003 inches to 0.005 inches. Tables should be fitted with standard multibutton cross-wire cursors and preferably these should be interchangeable with stylus-type tracing units, to provide higher speed of working where a slightly lower precision can be accepted. These tables should, preferably, be back-illuminated to aid the operator in discrimination of wanted lines on some docu ments. Table size must accommodate the largest documents (36" x 48") exclusive of fixed menu. Moveable menus are acceptable. Menu facilities must be available and setable by user, and will be different for different stations. It must be possible to enter symbolized points (some two-coordinate points), alphanumeric strings (some shaped), point-to-point straight lines and irregular lines, with ease and versatility. Polygons can be recorded in the form of actual boundary data copied from arc data or as a directory to the component arcs. Reference points must be digitized on all sheets. All labels and names entered must be topologically related to point, linear, or polygon features as ap propriate.
Sub-Task 1: Digitize selected linear data, without labels:
1. Streams, rivers, lakes, coastline.
2. Trails, roads.
Report: Total line inches digitized. CPU times. Total line segments. Elapsed time.
Sub-Task 2: Enter geographic names (alphanumeric labels)
1. Road and stream names - give a display reference point and associate topologically with features.
2. Area Names - provide a display reference point or points.
47

Report: Number of names entered.Elapsed and CPU times for each step.
Sub-Task 3: Digitize selected polygons by arcs of subcompartments, making sure several fall on two or more quads.
1. Enter polygon and sub-compartment attributes.
2. Code the boundary segments that make up the subcompartment boundary in such a way that they can be retrieved to make subcompartment boundaries only without interior boundaries (this to prevent sliver problems that may be caused by double digitizing of subcompartment boundaries).
Report: Number of polygon arcs, number of polygons. Elapsed and CPU times for each step.
NOTE: An efficient method to collect the above data is to utilize the arcs created from the previous stream, lake etc., digitization. This minimizes the need for sliver-removal procedures.
Sub-Task 4: Digitize arcs for all polygons on all sheets.
1. Enter a reference number of up to three digits for each polygon and add adisplay reference point for each. These reference numbers must be topologically related to polygons.
Report: Number of points, number of arcs, number of polygons. Elapsed and CPU times for step.
Sub-Task 5: Digitize display reference points for all bridges, road numbers, trail numbers, and enter number labels.
Report: Number of reference points.Elapsed and CPU times for step.
9.2.1.2 Test (B) Edgematching
Edgematchlng is necessary to join lines and polygons across map boundaries. The join should be topological as well as graphic, that is, a polygon so joined should be bounded by a set of line segments with no gaps or overlaps. A single attribute should describe each new data element. The edgematch program should deal with small gaps, slight discrepancies, overshoots, and missed and double lines or report the condition in a manner that facilitates error correction.
Similarly, impossibilities such as single-end lines within a polygon data set (caused by lines missed in digitizing) should be reported.
48

Edgematch each data type for all contiguous sheets provided.
Special notes:
1. Edgematching within each data base area should be straightforward as the graphic source documents should be drawn to match exactly at the edges. Errors will always occur, however, and these should be corrected. For example, it is at least necessary that the edgematch detects hanging line ends, adjacent similar centroid labels, and small unlabelled edge polygons. These should be reported and should be corrected.
2. There may be some minor errors created by manual digitizing. In this case, the edgematching program may be used to smooth Join the lines (variations are probably small).
Report: Elapsed and CPU times and operator utilization time for each data set.
9.2.1.3 Test (C) Polygonization
Polygonizing is the process of connecting together arcs to form polygons. The process should be automatic with simple correction procedures for errors or unprocessed polygons.
Special notes:
The size of areas may be calculated and inserted at this stage.
Report: Elapsed and CPU times and operator utilization time for each data set.
9.2.1.4 Test(D) Labelling and/or Attributing
Labels (with "centroid" points) describing the contents (attributes) of polygons, must be able to be transferred to the digital system. (A label may be a nominal code such as a name or an identification number and/or a small amount of attribute data descriptive of the graphic entity.) Labelling may be done at the most convenient point in the input process for any proposed system, but separate from line digitization for maximum ef ficiency. Labels and attributes must be topologically related to graphic entities.
Report: Elapsed and CPU times and operator utilization time for each data set.
9.2.1.5 Test (B) Reformatting of Digital Data From Other Systems
Data previously digitized will have to be accessed by vendor-supplied interface and/or converted by vendor supplied software to the new system format. The existing data must be able to be fully used in conceit with any data digitized by the new system and in any system function described on the statement of system requirements.
49

For the purposes of the benchmark test, the vendor must convert all provided data al ready In digital form to vendor format or provide software Interface to allow the data to be cross-referenced.
Special note: Raster/Vector ConversionThe system Is required to have the ability to convert data In vector form to data In raster form with grid cell size and orientation selected by the user (for example, to allow map based data to be used In concert with raster data in raster-based systems), and conversely to convert data in raster or grid cell form to a vector format suitable for use in concert with other vector data In a vector-based system. Graphic and topological characteristics of the data must be transformed. This capability may be provided by hardware or software.
Report: For each data set converted to vendor format, provide number of dataelements (attributes, pixels, grid cells) converted, number of data elements in new format, elapsed time, and CPU time.
9.2.1.6 Test(F) Quick-Look Plot
It is necessary to have a quick-look plot or hardcopy facility. These plots should be on paper. Direct Image hardcopy preferred.
9.2.1.7 Test(G) Listing
Listing Is required at frequent intervals during data input for
a. Check on attribute data, b. Reports to operator.
9.2.1.8 Test(H) Display and Edit
Editing of the newly digitized data is required. It should be possible to do this on re quest at any time during or after digitization, and should be easy to use in a normal manner. Editing must apply to points, alphanumerics, point-to-point lines, and Ir regular lines. Junction correction will be invoked frequently.
9.2.1.9 Test (I) Data Base Creation and Management
In most benchmarking cases where multiple sheets are Involved, they are adjacent to one another, covering contiguous areas of land. The data from these sheets must be able to be edgematched into a combined data base to which queries may be addressed. All digitized map sheets for an area must have a consistent data structure that is part of a logical data schema that allows source map sheet boundaries to be ignored during analysis. Any spatial analysis functions must be able to be carried out on part or all of the test area digital file.
50

The organization of the data is most important. Multiple data sets will have to be easily accessed. If this is not optimized, much operator time will be wasted during data analysis and file maintenance. For example, tedious set-up operations on disparate data sets could be a major problem.
Special notes:
1. All graphic/ attribute linkages should now be in place to allow easy utilization.
2. Directories may be created.
Report: Elapsed and CPU times and operator utilization time for each data set. The number of centroids and labels in the data set.
Auxiliary Functions:
For the purpose of the benchmark test, the following auxiliary functions will be exer cised and noted throughout the steps leading to data base creation: color is very desirable; ease and speed of operation will be very important.
9.2.1.10 Test(J) Updating
Updating of the digital data base with new points, lines, and/or polygons and/or new attributes, to add or replace previous entities in the data base is required. The data base must be able to be updated with ease and particular attention will be paid to the efficiency of the update operation. It should be particularly noted that there may be new additions each year and the file system must be essentially "open-ended" and not limited in any way. For the purpose of a benchmark test an attribute data set should be provided at the same time of the benchmark test to update an attribute data set in part of the test data base.
Report: Elapsed and CPU time and operator utilization time for each step. The number and type of update procedures.
9.2.1.11 Test(K) Browsing
Browse is typically used to search and query the data base to produce trial output maps before selecting the desired output map.
It is desirable that the complete data base be accessible to browsing and, following a re quest, to display. No modification to the data base occurs during browse, but the user should be able to select from it an area, scale, and type of data on which the operations of area measurement, generate, reclassify, merge, dissolve, overlay, and distance measure can be performed. The user may wish to use the browse function to define its selection and area of view and then pass the data on to the editing, plotting, or updat ing functions.
51

For the purpose of a benchmark test, browsing is a desirable function and the capability to browse may be demonstrated as follows:
A request will be made at the time of the benchmark test to view a certain data set at a prescribed scale and to carry out certain search operations on that data set.
9.2.2 Data Manipulation and AnalysisThe foregoing procedures of data input and data base creation will result in the data being in digital form. They will be topologically and logically error-free. Necessary linkages between attribute data and graphic entities will have been established in a way that is amenable to subsequent data manipulation, analysis, and product generation.
With the properly selected software components, as described in the "Software Func tional Components Checklist," and GIS generic types of data like:
Vegetation type mapsVegetation attributesWatershed boundariesLakes and streamsStream attribute dataGeographic namesRoads and bridgesDEM and/or DTM (Digital Elevation/Terrain Model)Transportation systemsRecreation siteLand ownershipSoilsPoint location
The following tests are typical for benchmarking GIS manipulation and analysis func tions.
9.2.2.1 Test (A)
Test for the following functions:
Projection changeTopological Overlay-Polygon, line, and raster Generate-Line (straight) Calculate-Slope of area (total case)
--Slope of area (subdivided) Generate-Perspective view Generate Polygon (irregular with islands) Overlay Graphic (three-dimensional case)
52
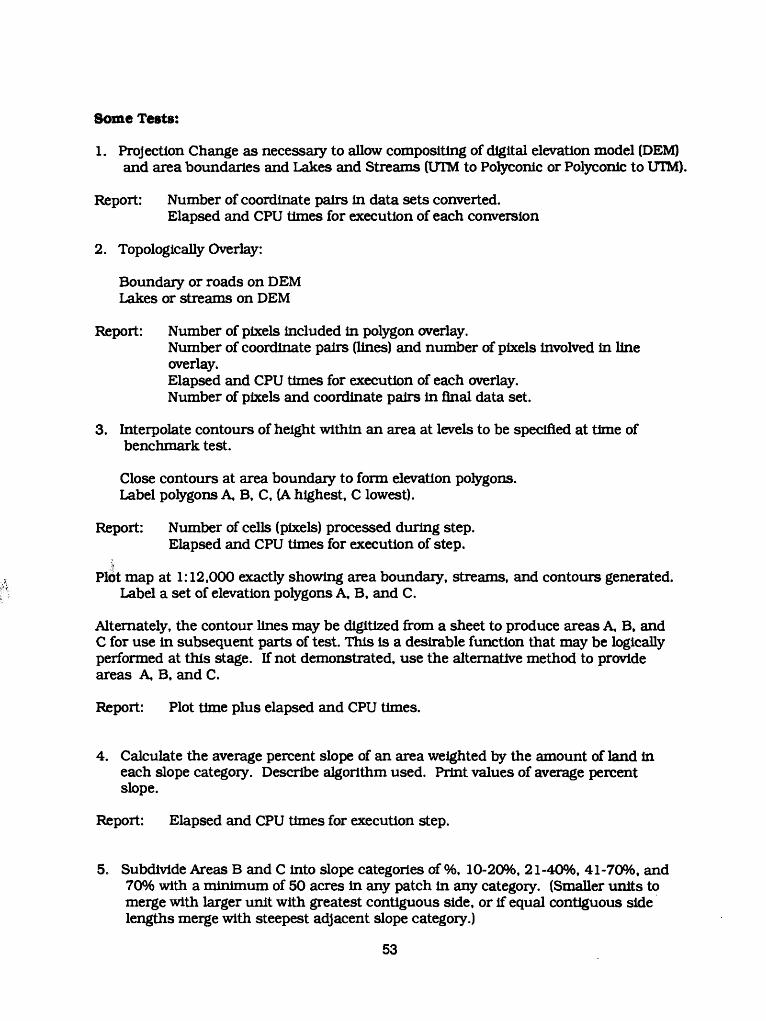
Some Tests:
1. Projection Change as necessary to allow compositing of digital elevation model (DEM) and area boundaries and Lakes and Streams (UIM to Potyconlc or Polyconlc to UTM).
Report: Number of coordinate pairs In data sets converted.Elapsed and CPU times for execution of each conversion
2. Topologically Overlay:
Boundary or roads on DEM Lakes or streams on DEM
Report: Number of pixels Included in polygon overlay.Number of coordinate pairs (lines) and number of pixels Involved In lineoverlay.Elapsed and CPU times for execution of each overlay.Number of pixels and coordinate pairs in final data set.
3. Interpolate contours of height within an area at levels to be specified at time of benchmark test.
Close contours at area boundary to form elevation polygons. Label polygons A, B, C, (A highest, C lowest).
Report: Number of cells (pixels) processed during step. Elapsed and CPU times for execution of step.
i
Plot map at 1:12,000 exactly showing area boundary, streams, and contours generated. Label a set of elevation polygons A, B, and C.
Alternately, the contour lines may be digitized from a sheet to produce areas A, B, and C for use in subsequent parts of test. This is a desirable function that may be logically performed at this stage. If not demonstrated, use the alternative method to provide areas A, B, and C.
Report: Plot time plus elapsed and CPU times.
4. Calculate the average percent slope of an area weighted by the amount of land In each slope category. Describe algorithm used. Print values of average percent slope.
Report: Elapsed and CPU times for execution step.
5. Subdivide Areas B and C into slope categories of %, 10-20%, 21-40%, 41-70%, and 70% with a minimum of 50 acres in any patch in any category. (Smaller units to merge with larger unit with greatest contiguous side, or If equal contiguous side lengths merge with steepest adjacent slope category.)
53
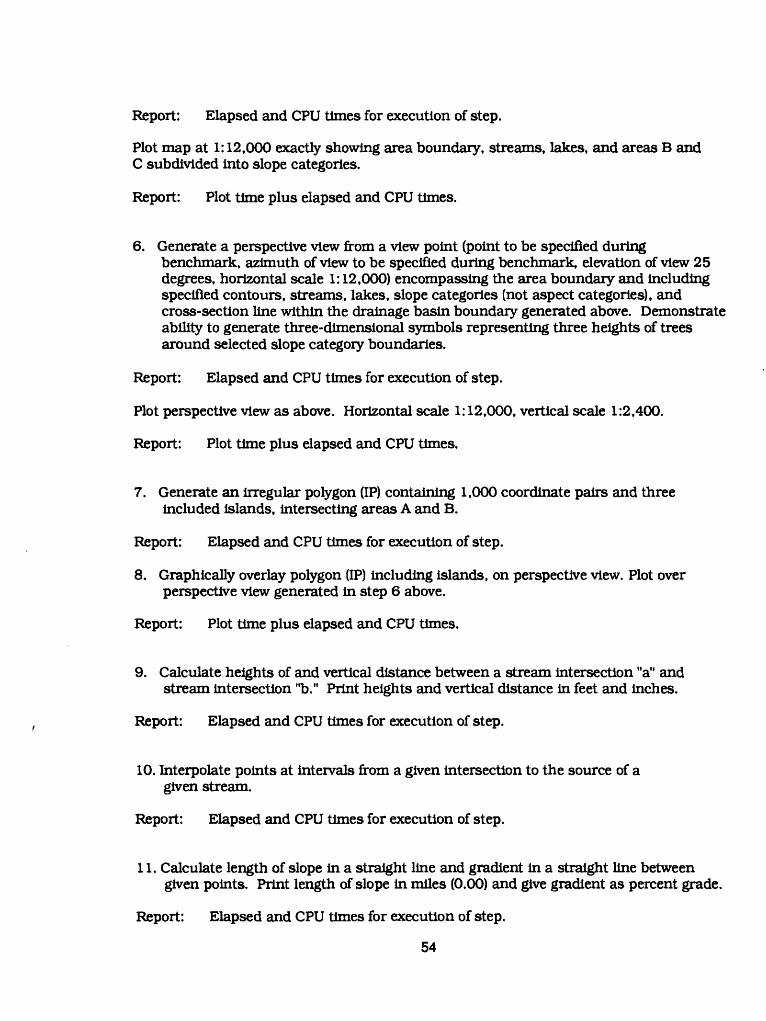
Report: Elapsed and CPU times for execution of step.
Plot map at 1:12,000 exactly showing area boundary, streams, lakes, and areas B and C subdivided into slope categories.
Report: Plot time plus elapsed and CPU times.
6. Generate a perspective view from a view point (point to be specified duringbenchmark, azimuth of view to be specified during benchmark, elevation of view 25 degrees, horizontal scale 1:12,000) encompassing the area boundary and including specified contours, streams, lakes, slope categories (not aspect categories), and cross-section line within the drainage basin boundary generated above. Demonstrate ability to generate three-dimensional symbols representing three heights of trees around selected slope category boundaries.
Report: Elapsed and CPU times for execution of step.
Plot perspective view as above. Horizontal scale 1:12,000, vertical scale 1:2,400.
Report: Plot time plus elapsed and CPU times.
7. Generate an irregular polygon (IP) containing 1,000 coordinate pairs and three included islands, intersecting areas A and B.
Report: Elapsed and CPU times for execution of step.
8. Graphically overlay polygon (IP) including islands, on perspective view. Plot over perspective view generated in step 6 above.
Report: Plot time plus elapsed and CPU times.
9. Calculate heights of and vertical distance between a stream intersection "a" and stream intersection "b." Print heights and vertical distance in feet and inches.
Report: Elapsed and CPU times for execution of step.
10. Interpolate points at intervals from a given intersection to the source of a given stream.
Report: Elapsed and CPU times for execution of step.
11. Calculate length of slope in a straight line and gradient in a straight line between given points. Print length of slope in miles (0.00) and give gradient as percent grade.
Report: Elapsed and CPU times for execution of step.
54
12. Calculate average gradient along a stream (convoluted line) between given points. Print gradient as percent grade.
Report: Elapsed and CPU times for execution of step.
13. Calculate the bearing between stream intersection "a" and stream intersections "b" and "c." Give bearing in degrees True North. Print value for each bearing in degrees True North.
Report: Elapsed and CPU times for execution of step.
14. Generate line between stream intersection "b" and stream intersection "c". Generate cross-section along b-c line. Plot result as a graph with horizontal scale 1:12,000 and vertical scale 1:2,400. Put symbol in cross section where stream crosses section.
Report: Elapsed and CPU times for execution of each step.
15. Subdivide an area into aspect categories: N,NE,E,SE,S,SW,W,NW, Flat (Flat = % slope). Describe algorithm used to identify aspect.
Minimum size in any individual category 50 acres. Smaller units to merge with larger unit with greatest contiguous side. Cornerjoins not considered to be contiguous. If larger units have equal contiguous side length then merge by assuming aspect categories are arranged in a circle. Assign smaller unit to larger unit that occurs as next category clockwise, to next counter-clockwise, to next category clockwise, and so forth,
e.g. South to SW then SE to Wthen E to NW then NE then N
SW to Wthen S to NW then SE to Nthen E toNE
In the case of Flat, assign to South and thereafter as above.
Report: Elapsed and CPU times for execution of step.
Plot 1:12,000 exactly showing an area boundary and an area within divided into aspect categories only. Measure size of each patch in each category and create list in decreas ing order of size by category and sum for total size of each category.
Report: Plot time plus elapsed and CPU times.
55

16. Calculate the average overall aspect of an area weighted by the amount of land in each category NfNE,E,SE,S,SW,W,NW,Flat (Flat = % slope). Describe algorithm used. Print values of average aspect.
Report: Elapsed and CPU times for execution of step.
9.2.2.2 Test(B)
Test for the following functions:
Topological overlay (polygon on polygon and sliver removal).Topological overlay (grid on polygon).Measure area size.Generate circle buffer about a point.Topological overlay (point in polygon).Generate grid cell net.Analyze contiguity.Measure perimeter length.
9.2.2.3 Test(C)
Test for the following functions:
Generate points on lines. Measure distance along lines. Analyze connectivity. Proximity - Shortest route. Calculate - Arithmetic.
1. Generate points on a road network interactively. (Points may be simulated for the benchmark test trial run.) Display labelled points and road network on screen.
Report: Elapsed and CPU times for execution of step.
2. Measure distance along a road between given points. Print result as distance in miles (0.00).
Report: Elapsed and CPU times for execution of step.
3. List all given areas locations connected by road distance of 9 miles or less to each of several points. Produce list of areas for each point.
Report: Elapsed and CPU times for execution of step.
4. Determine the shortest route from given point to each selected area location. Produce list of shortest distances from selected points to each selected area.
56

Report: Elapsed and CPU times for execution of step.
General Consideration
A test should be set up for the system to produce a predetermined product or two. These product generations should test the data manipulating capabilities of the system, and map/graphic production capabilities.
57

APPENDIX A
GEOGRAPHIC INFORMATION SYSTEMS RELATED STANDARDS, GUIDELINES AND REFERENCES
The National Bureau of Standards (NBS) publications identified as FIPS or NBSIR can be ordered from the National Technical Information Service, Springfield, Virginia 22161. Other NBS publications can be obtained from the Superintendent of Docu ments, Government Printing Office, Washington, D.C. 20402. NBS is located In Gaithersburg, Maryland 20899.
** FIPSPUB34
GUIDE FOR THE USE OF INTERNATIONAL SYSTEM OF UNITS (SI) IN FEDERAL IN FORMATION PROCESSING STANDARDS PUBLICATIONS
Establishes requirements for use of International System of Units In all FIPS PUBS. Covers use of dual dimensional notation In measurements, spelling of SI units, symbols for units, and use of separators and decimal points.
** FIPSPUB32-1
CHARACTER SETS FOR OPTICAL CHARACTER RECOGNITION (OCR)
Specifies the shapes and sizes of printed characters to be used In optical character recognition (OCR) systems. The standard Incorporates three character sets designated as OCR-A, OCR-B, and MICR E-13B. The latter character set Is intended for automated recognition by magnetic means but may be read optically. Adopts ANSI X3.2-1970(R1976), ANSI X3.17-1981, and ANSI X3.49-1975(R1982).
A-1

** FIPSPUB33-1
CHARACTER SET FOR HANDPRINTING
Specifies shapes and sizes of handprinted characters to be used in optical character recognition (OCR) systems. Character set remains the same as the previous standard set with the exception of the Yen symbol. This standard applies to Federal ADP sys tems that use handprinted data as input to OCR equipment. Adopts ANSI X3.45-1982.
** FIPSPUB40
GUIDELINE FOR OPTICAL CHARACTER RECOGNITION FORMS
Provides information on the design, preparation, acquisition, and application of OCR forms in data entry systems. Covers the factors affecting forms design, the materials and layout required for forms to be processed in OCR systems, requirements needed to write procurement specifications, and to inspect forms, and the available tools that aid in forms design.
** FIPSPUB85
OPTICAL CHARACTER RECOGNITION (OCR) INKS
Defines the spectral band for read inks and provides spectrophotometric curves for red and blue nonread inks. Applies to inks and preprinted forms that are read by OCR techniques. Adopts ANSI X3.86-1980.
** FIPSPUB89
OPTICAL CHARACTER RECOGNITION (OCR) CHARACTER POSITIONING
Specifies the nominal position with allowable tolerances of OCR characters in relation to their location to other machine-readable characters or sensed marks and to the docu ment edges. Adopts ANSI X3.93M-1981.
A-2

** FIPSPUB90
GUIDELINE FOR OPTICAL CHARACTER RECOGNITION (OCR) PRINT QUALITY, ANSI X3.99-1983
Provides basic information on methods for evaluating the readability of printed charac ters and symbols that are to be optically recognized by electronic means. Adopts ANSI X3.99-1983.
** FEPSPUB107
LOCAL AREA NETWORKS: BASEBAND CARRIER SENSE MULTIPLE ACCESS WITH COLLISION DETECTION ACCESS METHOD AND PHYSICAL LAYER SPECIFICATIONS AND LINK LAYER PROTOCOL
Specifies a network access technique used in office automation applications. Provides the mechanical, electrical, functional and procedural specifications and link protocol re quired to establish physical connections, to transmit bits and to send data link frames between nodes. Adopts IEEE 802.2 Logical Link Control type 1 class 1 service, and all of IEEE 802.3.
** FEPSPUB67
GUIDELINE FOR SELECTION OF DATA ENTRY EQUIPMENT
Provides information about the general characteristics of data entry equipment. Dis cusses the factors to be taken into consideration in the selection of efficient and economical data entry systems.
** FEPSPUB1-2
CODE FOR INFORMATION INTERCHANGE, ITS REPRESENTATIONS, SUBSETS, AND EXTENSIONS, ANSI X3.4-1977, ANSI X3.32-1973, ANSDC3.41-1974
Provides a standard coded character set and a recommended collating sequence, sub sets, extensions, and certain graphic representations for the set, all for use in Federal information processing systems, communications systems, and related equipment. This revised standard withdraws FIPS 7, 15, 35 and 36. Adopts ANSI X3.4-1977, X3.32-1973, andX3.41-1974.
A-3

** FIPSPUB3-1
RECORDED MAGNETIC TAPE FOR INFORMATION INTERCHANGE (800 CPI, NRZI)
Specifies the recorded characteristics of 9-track, one-half-inch-wide magnetic tape and the data format for representing the Standard Code for Information Interchange at the recording density of 800 characters per inch (CPI)-Adopts ANSI X3.22-1973.
** FIPSPUB14-1
HOLLERITH PUNCHED CARD CODE
Specifies the hole patterns to represent the 128 characters of the Standard Code for In formation Interchange In 12-row, 80 column, rectangular hole punched cards. This standard is applicable when subsets of the standard code are used as specified in FIPS 1-2. Adopts ANSI X3.26-1980.
** FIPSPUB25
RECORDED MAGNETIC TAPE FOR INFORMATION INTERCHANGE
Provides specifications for format and recording of the Standard Code for Information Interchange on one-half inch, 9-track magnetic tape. Covers recording method, den sity, allowable skew, signal amplitude, representation of codes on tracks, block, lengths, Inter-record gaps, and check characters. Adopts ANSI X3.39-1973.
** FIPSPUB50
RECORDED MAGNETIC TAPE FOR INFORMATION INTERCHANGE, 6250 CPI (246 CPMM), GROUP CODED RECORDING
Specifies format and recording requirements for representing the Standard Code for In formation Interchange on nine-channel, one-half inch magnetic tape. Tliis standard ap plies to recording and reproducing equipment operating at densities of 6,250 characters per inch. Adopts ANSI X3.54-1976.
A-4

** FIPSPUB51
MAGNETIC TAPE CASSETTES FOR INFORMATION INTERCHANGE (3.810 MM [0.150 IN] TAPE AT 32 BPMM [800 BPIJ, PE)
Specifies the physical, magnetic, and recorded characteristics of a 3.810 mm [0.150 in] magnetic tape cassette at a recording density of 32 bits per millimeter [800 bits per inch] using phase encoding techniques. Adopts ANSI X3.48-1977.
** FIPSPUB52
RECORDED MAGNETIC TAPE CARTRIDGE FOR INFORMATION INTERCHANGE, 4- TRACK, 6.30 MM (1/4 IN), 63 BPMM (1600 BPI), PHASE ENCODED
Specifies format and recording requirements for representing the Code for Information Interchange on 6.30 mm wide magnetic tape cartridges with either one, two, or four spe cial data tracks. This standard applies to recording and reproducing equipment operat ing at densities of 63 bits per millimeter. Adopts ANSI X3.56-1977.
** FIPSPUB54
COMPUTER OUTPUT MICROFORM (COM) FORMATS AND REDUCTION RATIOS, 16 MM AND 105 MM
Specifies the image arrangement, size, and reduction ratios for 16 mm and 105 mm microforms generated by computer output microfilmers. This standard applies to sys tems using business-oriented fonts similar to line-printer output.
** FIPSPUB82
GUIDELINE FOR INSPECTION AND QUALITY CONTROL FOR ALPHANUMERIC COM PUTER-OUTPUT MICROFORMS
Provides basic information on the questions associated with generating microforms by computers and describes test procedures to ensure that the output is of high quality. Specifications are contained in AIIM (NMA) MS 1-1980.
A-5

** FIPSPUB84
MICROFILM READERS
Defines the minimum levels of image quality, illumination, and related characteristics for equipment that displays computer-generated microforms that are made in accord ance with FIPS 54. Also covers maximum safe temperatures and maximum acceptable noise levels. Adopts ANSI/AHM (NMA)/MS20-1979.
** FIPSPUB86
ADDITIONAL CONTROLS FOR USE WITH ASCII
Specifies a set of encoded control functions to facilitate data interchange between data processing equipment, data communication equipment, and ADP terminals of the dis play or printer type, line printers, microfilm printers, typesetting composers, word processors, and related devices. Applies to equipment and services that involve charac ter imaging employing the character set and encoding conversions prescribed by FIPS 1- 2 with primarily character-oriented controls. Adopts ANSI X3.64-1979.
** FIPSPUB91
MAGNETIC TAPE CASSETTES FOR INFORMATION INTERCHANGE, DUAL TRACK COMPLEMENTARY RETURN-TO-BIAS (CRB) FOUR-STATES RECORDING ON 381-MM (O.ISO-IN)TAPE
Specifies the format and recorded characteristics for representing the Code for Informa tion Interchange on 3.81-mm (0.150-in) wide magnetic tape with data recorded on two tracks using complementary recording and a return-to-bias method of encoding. Adopts ANSI X3.59-1981.
** FIPSPUB93
PARALLEL RECORDED MAGNETIC TAPE CARTRIDGE FOR INFORMATION INTER CHANGE, 4-TRACK, 6.30 MM (1/4 IN), 63 BPMM (1600 BPI), PHASE ENCODED
Specifies the format and recorded characteristics for representing the Code for Informa tion Interchange on 6.30 mm (1/4 in) wide magnetic tape cartridge with data recorded across four parallel tracks at a recording density of 63 bits per millimeter (1,600 bits per inch) using phase encoding techniques. Adopts ANSI X3.72-1981.
A-6

** FEPSPUB108
ALPHANUMERIC COMPUTER OUTPUT MICROFORM QUALITY TEST SLIDE
Provides detailed Information for the preparation of a test form slide to ensure the generation of quality microforms by computers. This standard Is a companion to FIPS 82. Adopts AIIM MS28-1983.
** FEPSPUB114
200 MM (8 IN) FLEXIBLE DISK CARTRIDGE TRACK FORMAT USING TWO- FREQUENCY RECORDING AT 6631 BPRAD ON ONE SIDE - 1.9 TPMM (48 TPI) FOR IN FORMATION INTERCHANGE
Prescribes set of physical track format specifications for single-sided, single-density, 200-mm (8-in) flexible disk cartridges which have a data density of 6,631 bprad and 77 tracks at a track density of 1.9 tpmm (48 tpi). Specifications will enable users to inter change information using commercially available disk technology and to purchase off- the-shelf equipment. Adopts ISO 5654/2.
** FEPSPUB115
200 MM (8 IN) FLEXIBLE DISK CARTRIDGE TRACK FORMAT USING MODIFIED FRE QUENCY MODULATION RECORDING AT 13262 BPRAD ON TWO SIDES - 1.9 TPMM (48 TPI) FOR INFORMATION INTERCHANGE
Prescribes a set of physical track format specifications for two-sided, double-density, 200-mm (8-in) flexible disk cartridges which have a data density of 13,262 bprad and 77 tracks at a track density of 1.9 tpmm (48 tpi). Specifications will enable users to in terchange information using commercially available disk technology and to purchase off-the-shelf equipment. Adopts ISO 7065/2.
** FEPSPUB116
130 MM (5.25 IN) FLEXIBLE DISK CARTRIDGE TRACK FORMAT USING TWO- FREQUENCY RECORDING AT 3979 BPRAD ON ONE SIDE - 1.9 TPMM (48 TPI) FOR IN FORMATION INTERCHANGE
Prescribes a set of physical track format specifications for single-sided, single-density, 130-mm (5.25-in) flexible disk cartridges which have a data density of 3,979 bprad and 35 tracks at a track density of 1.9 tpmm (48 tpi). Specifications will enable users to in terchange information using commercially available disk technology and to purchase off-the-shelf equipment. Adopts ISO 6596/2.
A-7

** FIPSPUB117
130 MM (5.25 IN) FLEXIBLE DISK CARTRIDGE TRACK FORMAT USING MODIFIED FREQUENCY MODULATION RECORDING AT 7958 BPRAD ON TWO SIDES - 1.9 TPMM (48 TPI) FOR INFORMATION INTERCHANGE
Prescribes a set of physical track format specifications for two-sided, double-density, 130-mm (5.25-in) flexible disk cartridges which have a data density of 7,958 bprad and 40 tracks at a track density of 1.9 tpmm (48 tpi). Specifications will enable users to in terchange information using commercially available disk technology and to purchase off-the-shelf equipment. Adopts ISO 7487/3.
** FIPSPUB121
VIDEOTEX/TELETEXT PRESENTATION LEVEL PROTOCOL SYNTAX (NORTH AMERICAN PLPS)
Describes the formats, rules, and procedures for encoding of alphanumeric text and pic torial information for videotex! and teletext applications. Adopts joint American Nation al Standard X3.110- 1983/Canadian Standard CSA T500-1983.
** FIPSPUB60-2
I/O CHANNEL INTERFACE
Demies the functional, electrical, and mechanical interface specifications for connecting computer peripheral equipment as part of automatic data processing systems. It is to be used with companion standards (FIPS 61-1, 62, 63-1, and 97) to provide for plug-to- plug interchangeability of peripheral components such as magnetic tape and disk equip ment.
** FIPSPUB61-1
CHANNEL LEVEL POWER CONTROL INTERFACE
Defines the functional, electrical, and mechanical interface specifications for a power control interface for use in connecting computer peripheral equipment as part of automatic data processing systems. This standard is applicable whenever use of FIPS 60-2 is required. Adopts ANSI document X3T9/666, Revision 2/Revised.
A-8

** FIPSPUB62
OPERATIONAL SPECIFICATIONS FOR MAGNETIC TAPE SUBSYSTEMS
Defines the operational specifications for connecting magnetic tape equipment as part of automatic data processing systems. This standard applies to acquisition of magnetic tape equipment whenever use of FTPS PUBS 60-2 and 61-1 are required. Adopts ANSI document X3T9/780, Revision 3.
** FIPSPUB63-1
OPERATIONAL SPECIFICATIONS FOR VARIABLE BLOCK ROTATING MASS STORAGE SUBSYSTEMS
Provides operational specifications for command codes, data formats, sense and status information, etc., for variable block rotating mass storage subsystems which are con nected as part of ADP systems. It Is to be used with FIPS PUB 60-2 and 61-1. Addition al operational specifications of track format and sense information are provided for the most common device types in a separate report entitled Additional Operational Specifications for Variable Block Rotating Mass Storage Devices (A Supplement to FIPS PUB 63-1).
** FIPSPUB97
OPERATIONAL SPECIFICATIONS FOR FIXED BLOCK ROTATING MASS STORAGE SUB SYSTEMS
Defines the peripheral device-dependent operational interface specifications for connect ing fixed block rotating mass storage equipment as a part of automatic data processing (ADP) systems. It Is to be used together with FIPS PUB 60-2 and 61-1. This standard, together with these two referenced standards, provides for full plug-to-plug interchan- geability of fixed block rotating mass storage equipment as a part of ADP systems.
** FIPSPUB111
STORAGE MODULE INTERFACES (with extensions for enhanced storage module inter faces)
Describes the mechanical, electrical and functional requirements for the storage module class of interface between disk drives and their respective control units. An al ternative to FIPS 60-2, I/O Channel Interface, this standard can be used in the acquisi tion of disk drives for medium and large scale computer systems, and for minicomputer systems. Adopts ANSI X3.91M-1982.
A-9

** FIPSPUB94
GUIDELINE ON ELECTRICAL POWER FOR ADP INSTALLATIONS
Provides Information on factors In the electrical environment that affect the operation of ADP systems. Describes the fundamentals of power, grounding, life-safety, static electricity, and lightening protection requirements, and provides a checklist for evaluat ing ADP sites.
** FIPSPUB16-1
BIT SEQUENCING OF THE CODE FOR INFORMATION INTERCHANGE IN SERIAL-BY- BIT DATA TRANSMISSION
Specifies the method for transmitting the Standard Code for Information Interchange in serial-by-bit, serial-by-character data transmission. This standard is the same as Federal Standard 1010. Adopts ANSI X3.15-1976(R1983).
** FIPSPUB17-1
CHARACTER STRUCTURE AND CHARACTER PARITY SENSE FOR SERIAL-BY-BIT DATA COMMUNICATION IN THE CODE FOR INFORMATION INTERCHANGE
Specifies the character structure and sense of character parity for serial-by-bit, serial- by-character data communication for the Standard Code for Information Interchange. This standard is the same as Federal Standard 1011. Adopts ANSI X3.16- 1976(R1983).
** FIPSPUB18-1
CHARACTER STRUCTURE AND CHARACTER PARITY SENSE FOR PARALLEL-BY-BIT DATA COMMUNICATION IN THE CODE FOR INFORMATION INTERCHANGE
Specifies the character structure and character parity sense for transmitting the Stan dard Code for Information Interchange in systems employing parallel-by-bit data trans mission. This standard is the same as Federal Standard 1012. Adopts ANSI X3.25-1976(R1983).
A-10

** FIPSPUB22-1
SYNCHRONOUS SIGNALING RATES BETWEEN DATA TERMINAL AND DATA COM MUNICATION EQUIPMENT
Specifies the rates of transferring binary encoded Information in synchronous serial or parallel form between data processing terminal and data communications equipment that employ voice and band communications facilities. This standard is the same as Federal Standard 1013. Adopts ANSI X3.1-1976.
** FIPSPUB37
SYNCHRONOUS HIGH SPEED DATA SIGNALING RATES BETWEEN DATA TERMINAL EQUIPMENT AND DATA COMMUNICATIONS EQUIPMENT
Specifies the rates for transferring synchronous binary encoded information between data processing terminal and data communication equipment on wide band com munication channels. This standard is the same as Federal Standard 1001 and com plements FIPS 22-1. Adopts ANSI X3.36-1975.
** FIPSPUB71
ADVANCED DATA COMMUNICATION CONTROL PROCEDURES (ADCCP)
Defines the data link control procedures to be used by ADP equipment and services employing bit-oriented synchronous data communication links. The procedures provide for transfer of data across a data link, minimal exposure to errors and to loss or duplication of information control functions relating to beginning, suspending, and ter minating the flow of information across a link and operation on any type of synchronous data transmission facility. Adopts ANSI X3.66-1979.
** FIPSPUB78
GUIDELINE FOR IMPLEMENTING ADVANCED DATA COMMUNICATION CONTROL PROCEDURES (ADCCP)
Provides guidance to the system designer In selecting ADCCP options and other parameters. Recommends certain options so that equipment and services purchased by the Government will be compatible. The use of ADCCP is required under certain conditions specified in FIPS 71.
A-11

** FIPSPUB100
INTERFACE BETWEEN DATA TERMINAL EQUIPMENT (DTE) AND DATA CIRCUIT- TERMINATING EQUIPMENT (DCE) FOR OPERATION WITH PACKET-SWITCHED DATA COMMUNICATIONS NETWORKS
Specifies the means of interfacing ADP equipment and services, as well as telecom munication system terminal equipment, with packet-switched data communication networks. It is based on Recommendation X.25 which was developed and approved by the International Telegraph and Telephone Consultative Committee (CCITT). X.25 con tains a large number of options and implementation alternatives, which if exercised in different ways would impede the interoperability of equipment and services. This Joint standard limits these options and alternatives in order to satisfy the vast majority of Federal user requirements for interconnections with packet-switched data communica tions networks.
** FIPSPUB107
LOCAL AREA NETWORKS: BASEBAND CARRIER SENSE MULTIPLE ACCESS WITH COLLISION DETECTION ACCESS METHOD AND PHYSICAL LAYER SPECIFICATIONS AND LINK LAYER PROTOCOL
Specifies a network access technique used in office automation applications. Provides the mechanical, electrical, functional, and procedural specifications and link protocol required to establish physical connections, to transmit bits and to send data link frames between nodes. Adopts IEEE 802.2 Logical Link Control type 1 class 1 service, and all of IEEE 802.3.
** FIPSPUB76
GUIDELINE FOR PLANNING AND USING A DATA DICTIONARY SYSTEM
Describes the capabilities of a data dictionary system (DDS), discusses selection con siderations, and provides guidance for planning, implementation, and operational use of a DDS.
** FIPSPUB77
GUIDELINE FOR PLANNING AND MANAGEMENT OF DATABASE APPLICATIONS
Summarizes a recommended discipline of application management for database sys tems and provides specific advice on applications planning and management, and on software selection.
A-12

** FIPSPUB88
GUIDELINE ON INTEGRITY ASSURANCE AND CONTROL IN DATABASE ADMINISTRA TION
Provides explicit advice on achieving database Integrity and security control, and docu ments a step-by-step procedure for examining and verifying the accuracy and complete ness of a database.
** FIPSPUB110
GUIDELINE FOR CHOOSING A DATA MANAGEMENT APPROACH
Provides a framework for comparing and selecting alternative data management ap proaches. The emphasis is on pragmatic guidance that captures the principal, relevant decision factors.
** FIPSPUB124
GUIDELINE ON FUNCTIONAL SPECIFICATIONS FOR DATABASE MANAGEMENT SYS TEMS
Provides a framework for gathering and incorporating an appropriate set of data management functions into a request for proposals document. The emphasis is on the logical separation of the database management functional specifications, the relation ship among the logical categories, and the recommended set of sources.
** FIPSPUB11-2
GUIDELINE: AMERICAN NATIONAL DICTIONARY FOR INFORMATION PROCESSING SYSTEMS
Provides a common reference within the Government for terms and definitions used in such information processing activities as the representation, communication, inter pretation, and processing of data by human or automatic means. The Dictionary con sists of a single alphabetic listing of over 4,000 terms and their definitions. Adopts ANSI XS/'m-1-82.
A-13

** FIPSPUB20
GUIDELINES FOR DESCRIBING INFORMATION INTERCHANGE FORMATS
Identifies and defines the physical and logical characteristics of formatted information to Improve data interchange, processing, and use.
** FIPSPUB24
FLOWCHART SYMBOLS AND THEIR USAGE IN INFORMATION PROCESSING
Prescribes and defines flowchart symbols to represent the sequence of operations, the flow of data, and the flow of paperwork on flowcharts for information processing; prescribes presentation techniques for flowchart symbols on flowcharts; prescribes and defines the use of flowchart symbols. Adopts ANSI X3.5-1970.
** FIPSPUB30
SOFTWARE SUMMARY FOR DESCRIBING COMPUTER PROGRAMS AND AUTOMATED DATA SYSTEMS
Establishes a standard form to be used by Federal agencies in documenting summaries or abstracts of programs and automated data systems.
** FIPSPUB38
GUIDELINES FOR DOCUMENTATION OF COMPUTER PROGRAMS AND AUTOMATED DATA SYSTEMS
Provides basic guidance for the preparation of 10 document types that are used in the development of computer software. Can be used as a checklist for the planning and evaluation of software documentation practices.
** FIPSPUB53
TRANSMFITAL FORM FOR DESCRIBING COMPUTER MAGNETIC TAPE FILE PROPER TIES
Provides a standard form for Federal agencies to use in documenting the physical properties and characteristics of a recorded magnetic tape file.
A-14

** FIPSPUB64
GUIDELINES FOR DOCUMENTATION OF COMPUTER PROGRAMS AND AUTOMATED DATA SYSTEMS FOR THE INITIATION PHASE
Provides guidance in determining the content and extent of documentation needed for initiation phase of the software life cycle. Covers preparation of project requests, feasibility studies, and cost/benefit analysis documents.
** FIPSPUB105
GUIDELINE FOR SOFTWARE DOCUMENTATION MANAGEMENT
Provides explicit advice on managing the planning, development, and production of computer software documentation. Includes several checklists, references to relevant standards and guidelines, and a glossary of terms.
** FIPSPUB120
GRAPHICAL KERNEL SYSTEM (GKS)
Specifies a library (or toolbox package) of subroutines for an application programmer to incorporate within a program in order to produce and manipulate two-dimensional pic tures. Promotes portability of graphics application programs between different com puters, and aids programmers in understanding and using graphics methods. Adopts ANSI X3.124-1985. GKS Is also an international standard (ISO 7942).
** FIPSPUB123
SPECIFICATION FOR A DATA DESCRIPTIVE FILE FOR INFORMATION INTERCHANGE (DDF)
Specifies media-independent and system-independent file and record formats for the in terchange of information between computer systems. Provides a mechanism to allow data structures to be easily transported from one computer system to another com puter system, independent of make, with the capability of restructuring the data without loss of content or meaning. Adopts ANSI/ISO 8211 -1985.
A-15

** FIPSPUB121
VIDEOTEX/TELETEXT PRESENTATION LEVEL PROTOCOL SYNTAX (NORTH AMERICAN PLPS)
Describes the formats, rules, and procedures for encoding of alphanumeric text and pic torial information for videotex and teletext applications. Adopts Joint American Nation al Standard X3.110- 1983/Canadian Standard CSA T500-1983.
** FIPSPUB79
MAGNETIC TAPE LABELS AND FILE STRUCTURE FOR INFORMATION INTERCHANGE
Specifies four levels of labeling, label formats, blocking structure, and tape-mark relationships on magnetically recorded tapes used for information interchange. Adopts ANSI X3.27-1978 with qualifications for Federal applicability.
** FIPSPUB118
FLEXIBLE DISK CARTRIDGE LABELLING AND FILE STRUCTURE FOR INFORMATION INTERCHANGE
Prescribes a set of logical track format specifications for flexible disk cartridges described in the following physical track format standards: FIPS 114, 115, 116, and 117. Specifications will enable users to Interchange information using commercially available disk technology and to purchase off-the-shelf equipment. Adopts ISO 7665.
** FIPSPUB21-2
COBOL
Establishes the form for and the Interpretation of programs expressed in FIPS COBOL. Adopts ANSI X3.23-1985.
** FIPSPUB29-1
INTERPRETATION PROCEDURES FOR FEDERAL INFORMATION PROCESSING STAND ARD PROGRAMMING LANGUAGES
Establishes procedures for users and vendors of programming language compilers to follow when requesting Interpretations of the meaning of language specifications of the Federal Information Processing Standard programming languages.
A-16

** FIPSPUB68-1
MINIMAL BASIC
Defines the syntax of the Minimal BASIC programming language and the semantics for its Interpretation. Adopts ANSI X3.60-1978.
** FIPSPUB69-1
FORTRAN
Specifies the form and establishes the Interpretation of programs expressed In the FORTRAN programming language. The standard consists of a full language, FORTRAN, and a subset language, Subset FORTRAN. Adopts ANSI X3.9-1978.
** FIPSPUB109
PASCAL
Specifies the form and establishes the Interpretation of programs expressed In the PAS CAL programming language. Promotes portability of PASCAL programs for use on a variety of data processing systems. Adopts ANSI/IEEE77QX3.97-1983.
** FIPSPUB119
ADA
Specifies the form and establishes the Interpretation of programs expressed in the Ada programming language. Promotes portability of Ada programs for use on a variety of data processing systems. Adopts ANSI/MIL-STD-1815A-1983.
** FIPSPUB99
GUIDELINE: A FRAMEWORK FOR THE EVALUATION AND COMPARISON OF SOFTWARE DEVELOPMENT TOOLS
Presents a framework for the evaluation and comparison of software development tools. The framework Is a hierarchical structure of tool features that provides the level of detail necessary to classify the capabilities of tools. Through a careful analysis of tool features, users can obtain a better understanding of the characteristics of a tool and can compare these characteristics with those of other tools.
A-17

** FIPSPUB106
GUIDELINE ON SOFTWARE MAINTENANCE
Presents Information on techniques, procedures, and methodologies to employ throughout the llfecycle of a software system to Improve the maintainability of that sys tem. Included Is a glossary of technical terms. Appendices provide Information on software maintenance process, how to decide whether or not to continue maintaining a system, and software maintenance tools.
** FIPSPUB101
GUIDELINE FOR LIFECYCLE VALIDATION, VERIFICATION, AND TESTING OF COM PUTER SOFTWARE
Presents an Integrated approach to validation, verification, and testing (W&T) that should be used throughout the software lifecycle. Also Included Is a glossary of techni cal terms and a list of supporting NBS publications. An appendix provides an outline for formulating a W&T plan.
** FIPSPUB4
CALENDAR DATE
Specifies codes to Identify years, months, and dates of the Gregorian calendar.
** FIPSPUB5-1
STATES AND OUTLYING AREAS OF THE UNITED STATES
Provides abbreviations and two-digit numeric codes for States, the District of Columbia, and outlying areas such as Puerto Rico, Virgin Islands, and other U.S. territories.
** FIPSPUB6-3
COUNTIES AND COUNTY EQUIVALENTS OF THE STATES OF THE UNITED STATES AND DISTRICT OF COLUMBIA
Provides names and three-digit numeric codes for counties or county equivalents in the U.S.
A-18

** FIPSPUB8-5
METROPOLITAN STATISTICAL AREAS (MSA's) (Including CMSA's, PMSA's, and NECMA's)
Provides a four-digit numeric code for each Metropolitan Statistical Area In the U.S. and Puerto Rico, Including units called Consolidated Metropolitan Statistical Areas (CMSA's), and Primary Metropolitan Statistical Areas (PMSA's), and related units called New England County Metropolitan Areas (NECMA's).
** FEPSPUB9
CONGRESSIONAL DISTRICTS OF THE UNITED STATES
Specifies the use of two-digit numeric codes to represent the Congressional Districts of each State as identified in the "Congressional Directory."
** FEPSPUB10-3
COUNTRIES, DEPENDENCIES, AREAS OF SPECIAL SOVEREIGNTY, AND THEIR PRIN CIPAL ADMINISTRATIVE DIVISIONS
Provides a list of the basic geopolitical entities in the world, together with the principal administrative divisions that comprise each entity. Each basic geopolitical entity is rep resented by a two-character, alphabetic country code. Each principal administrative division is identified by a four-character code consisting of the two-character country code followed by a two-character administrative division code. These codes are in tended for use in activities associated with the mission of the Department of State and in national defense programs. For country codes adopted by the American National Standards Institute, see FIPS PUB 104-1.
** FDPSPUB19-1
CATALOG OF WIDELY USED CODE SETS
Lists and briefly describes code sets that are in wide use in the U.S. and that might be used in Federal data systems. Assists in the selection of appropriate code sets and in the avoidance of duplicate developments. The common format that is used to describe each listed code set specifies code characteristics, maintenance agency, source docu ment, and other pertinent data.
A-19

** FIPSPUB28
STANDARDIZATION OF DATA ELEMENTS AND REPRESENTATIONS
Defines policies and responsibilities for a government-wide program for the stand ardization of data elements and representations used in Federal automated data sys tems.
** FIPSPUB45
GUIDE FOR THE DEVELOPMENT, IMPLEMENTATION AND MAINTENANCE OF STANDARDS FOR THE REPRESENTATION OF COMPUTER PROCESSED DATA ELE MENTS
Provides basic concepts and terminology of data standardization, describes data charac teristics, basic coding methods, and principles of data code development.
** FIPSPUB55DC
GUIDELINE: CODES FOR NAMED POPULATED PLACES, PRIMARY COUNTY DIVISIONS, AND OTHER LOCATIONAL ENTITIES OF THE UNITED STATES
Provides a two-character State code and five-character numeric place code to uniquely identify each listed entity. An exhaustive list is carried of incorporated places, census designated places, primary county divisions, recognized Indian reservations and Alaska native villages, and counties. For the data files, request the fourth printed version (hard copy/microfiche) or the ninth update tape. Implements ANSI X3.47-1977.
** FIPSPUB55-2
GUIDELINE: CODES FOR NAMED POPULATED PLACES, PRIMARY COUNTY DIVISIONS, AND OTHER LOCATIONAL ENTITIES OF THE UNITED STATES
Documentation for FIPSPUB55DC hardcopy and computer tape.
A-20

** FIPSPUB58
REPRESENTATIONS OF LOCAL TIME OF THE DAY FOR INFORMATION INTERCHANGE
Specifies representations for the local time of the day based on both 12- and 24-hour timekeeping systems. Specifies the time elements and their sequencing, the use of separators between time elements, and the representation of the meridian designator. Adopts ANSI X3.43-1977.
** FIPSPUB59
REPRESENTATIONS OF UNIVERSAL TIME, LOCAL TIME DIFFERENTIALS, AND UNITED STATES TIME ZONE REFERENCES FOR INFORMATION INTERCHANGE
Specifies representations for Universal Time, the Local Time Differential Factors, and Local Time Zones In general use In the U.S. Adopts ANSI X3.51-1975.
** FIPSPUB66
STANDARD INDUSTRIAL CLASSIFICATION (SIC) CODES
Provides classifications, short titles, and codes for representing Industries and groups of establishments with similar economic activities.
** FIPSPUB70-1
REPRESENTATION OF GEOGRAPHIC POINT LOCATIONS FOR INFORMATION INTER CHANGE
Specifies uniform formats for representing geographic point locations that are to be used by Federal agencies In the Interchange of data. The standard Is applicable to the three-point location systems most widely used In the U.S. Adopts ANSI X3.61-1986.
** FIPSPUB92
GUIDELINE FOR STANDARD OCCUPATIONAL CLASSIFICATION (SOC) CODES
Adopts a code set developed by the Office of Management and Budget to identify types of occupational activities. The classification system Includes all occupations In which work is performed for pay or profit.
A-21

** FIPSPUB95
CODES FOR THE IDENTIFICATION OF FEDERAL AND FEDERALLY-ASSISTED OR GANIZATIONS
Specifies a four-character identifier for Federal Government Legislative, Judicial, and Executive Branch agencies, and for Federal-State, interstate, and international or ganizations that receive budgetary support. Also includes government-sponsored enterprises and some Federally aided organizations.
** FBPSPUB103
CODES FOR THE IDENTIFICATION OF HYDROLOGIC UNITS IN THE UNTIED STATES AND THE CARIBBEAN OUTLYING AREAS
Identifies a hydrologic system that divides the United States and Caribbean outlying areas into 21 major regions. Regions are further subdivided into approximately 2,150 units that delineate river basins having drainage areas usually greater than 700 square miles. The codes provide a standardized base for use by water-resources or ganizations. Adopts U.S. Geological Survey Circular 878-A.
** FIPSPUB104-1
ANSI CODES FOR THE REPRESENTATION OF NAMES OF COUNTRIES, DEPEND ENCIES, AND AREAS OF SPECIAL SOVEREIGNTY
Codes are for use by Federal government organizations in reporting contract placement to the General Services Administration's Federal Procurement Data Center, for use in activities concerned with international trade that do not involve Department of State or national defense programs, and for data interchange with international organizations. Another code set, FIPS PUB 10-3, provides country codes for Department of State and defense applications. Implements ANSIZ39.27-1984, which adopts ISO 3166.
** FIPSPUB42-1
GUIDELINES FOR BENCHMARKING ADP SYSTEMS IN THE COMPETTTIVE PROCURE MENT ENVIRONMENT
Recommends good practices for Federal agencies to use in planning, organizing, and conducting benchmark mix demonstrations for competitive computer system procure ments.
A-22

** FIPSPUB75
GUIDELINE ON CONSTRUCTING BENCHMARKS FOR ADP SYSTEM ACQUISITIONS
Describes a practical, step-by-step procedure for constructing benchmarks for use during the competitive acquisition of ADP systems. Ten steps in the benchmark con struction process are identified. Including selection of the benchmark team, workload analysis and forecasting, construction of the benchmark mix, and documentation of the benchmark package.
** FIPSPUB49
GUIDELINE ON COMPUTER PERFORMANCE MANAGEMENT: AN INTRODUCTION
Details the responsibilities of ADP managers in meeting user requirements, managing and planning for ADP resources, communicating with upper management, and com municating with vendors.
** FIPSPUB57
GUIDELINES FOR THE MEASUREMENT OF INTERACTIVE COMPUTER SERVICE RESPONSE TIME AND TURNAROUND TIME
Provides a methodology for measuring interactive computer service response time and turnaround time. Addresses interactive computer utilization characterized by an inter change of input and output between a computer and a person utilizing a keyboard ter minal and describes functional performance measures that can be employed.
** FIPSPUB72
GUIDELINES FOR THE MEASUREMENT OF REMOTE BATCH COMPUTER SERVICE
A basic reference document for use in measuring and evaluating the delivery of network services. This guide identifies availability, reliability, timeliness, and correctness as the attributes to be measured and recommends useful metrics.
A-23

** FIPSPUB96
GUIDELINE FOR DEVELOPING AND IMPLEMENTING A CHARGING SYSTEM FOR DATA PROCESSING SERVICES
Provides a methodology for developing and Implementing a system to distribute the costs of providing data processing services to the users of the services. Identifies the major decisions and practices needed to set the rates for services, to bill for services, and to monitor the system.
** FIPSPUB31
GUIDELINES FOR AUTOMATIC DATA PROCESSING PHYSICAL SECURITY AND RISK MANAGEMENT
Provides guidance to Federal organizations In developing physical security and risk management programs for their ADP facilities. Can be used as a checklist for planning and evaluating security of computer systems.
** FIPSPUB39
GLOSSARY FOR COMPUTER SYSTEMS SECURITY
A reference document containing approximately 170 terms and definitions pertaining to privacy and computer security.
** FIPSPUB41
COMPUTER SECURITY GUIDELINES FOR IMPLEMENTING THE PRIVACY ACT OF 1974
Provides guidance in the selection of technical and related procedural methods for protecting personal data In automated information systems. Discusses categories of risks and the related safeguards for physical security, information management prac tices, and system controls to Improve system security.
A-24

** FIPSPUB46
DATA ENCRYPTION STANDARD, (Reaffirmed until 1987)
Specifies an algorithm to be Implemented in electronic hardware devices and used for the cryptographic protection of computer data. The algorithm uniquely defines the mathematical steps required to transform computer data into a cryptographic cipher and the steps required to transform the cipher back to its original form. This standard has been adopted as a voluntary industry standard, ANSI X3.92-1981.
** FIPSPUB48
GUIDELINES ON EVALUATION OF TECHNIQUES FOR AUTOMATED PERSONAL IDEN TIFICATION
Discusses the performance of personal identification devices, how to evaluate them, and considerations for their use within the context of computer system security.
** FIPSPUB65
GUIDELINE FOR AUTOMATIC DATA PROCESSING RISK ANALYSIS
Presents a technique for conducting a risk analysis of an ADP facility and related as sets. Provides guidance on collecting, quantifying, and analyzing data related to the frequency of occurrence and the damage caused by adverse events.
** FIPSPUB73
GUIDELINES FOR SECURITY OF COMPUTER APPLICATIONS
Describes the different security objectives for a computer application, explains the con trol measures that can be used, and identifies the decisions that should be made at each stage in the life cycle of a sensitive computer application. For use in planning, developing, and operating computer systems that require protection.
** FIPSPUB74
GUIDELINES FOR IMPLEMENTING AND USING THE NBS DATA ENCRYPTION STAND ARD
Provides guidance for the use of cryptographic techniques when such techniques are re quired to protect sensitive or valuable computer data. For use in conjunction with FIPS PUB 46 and FIPS PUB 81.
A-25

** FIPSPUB81
DES MODES OF OPERATION
Demies four modes of operation for the DES which may be used in a wide variety of ap plications. The modes specify how data will be encrypted (cryptographically protected) and decrypted (returned to original form). This standard has been adopted as a volun tary industry standard, ANSI X3.106-1983.
** FIPSPUB83
GUIDELINE ON USER AUTHENTICATION TECHNIQUES FOR COMPUTER NETWORK ACCESS CONTROL
Provides guidance in the selection and implementation of techniques for authenticating the users of remote terminals in order to safeguard against unauthorized access to com puters and computer networks.
** FIPSPUB87
GUIDELINES FOR ADP CONTINGENCY PLANNING
Describes what should be considered when developing a contingency plan for an ADP facility. Provides a suggested structure and format which may be used as a starting point from which to design a plan to fit each specific operation.
** FIPSPUB102
GUIDELINE FOR COMPUTER SECURITY CERTIFICATION AND ACCREDITATION
Describes how to establish and how to carry out a certification and accreditation program for computer security. Certification consists of a technical evaluation of a sensitive system to see how well it meets its security requirements. Accreditation is the official management authorization for the operation of the system and is based on the certification process.
A-26

** FIPSPUB 112
PASSWORD USAGE
Defines ten factors to be considered in the design, implementation and use of access control systems that are based on passwords. It specifies minimum security criteria for such systems and provides guidance for selecting additional security criteria for password systems which must meet higher security requirements.
** FIPSPUB 113
COMPUTER DATA AUTHENTICATION
Specifies a Data Authentication Algorithm (DAA) which, when applied to computer data, automatically and accurately detects unauthorized modifications, both intentional and accidental. Based on FIPS PUB 46, this standard is compatible with requirements adopted by the Department of Treasury and the banking community to protect electronic fund transfer transactions.
** FIPSPUB56
GUIDELINE FOR MANAGING MULTIVENDOR PLUG-COMPATIBLE ADP SYSTEMS
Provides general assistance to Federal ADP managers responsible for the planning, ac quisition, or operation of an ADP system that involves products or services obtained from multiple sources.
** FIPSPUB 122
CONFORMANCE TESTS FOR FIPSPUB 100/FED-STD 1041 VERSION OF CCnT 1980 RECOMMENDATION X.25, INTERFACE BETWEEN DATA TERMINAL EQUIPMENT (DTE) AND DATA CIRCUIT-TERMINATING EQUIPMENT OPERATION WITH PACKET- SWITCHED DATA COMMUNICATIONS NETWORKS
Specifies a standard set of tests to evaluate DTE/DCE conformance to FIPSPUB 100/FED-STD 1041. Aids users in acquiring telecommunications facilities or services based on the CCITr Recommendation X.25.
A-27

** FIPSPUB123
SPECIFICATION FOR A DATA DESCRIPTIVE FILE FOR INFORMATION INTERCHANGE (DDF)
Specifies media-Independent and system-independent file and record formats for the in terchange of information between computer systems. Provides a mechanism to allow data structures to be easily transported from one computer system to another com puter system, independent of make, with the capability of restructuring the data without loss of content or meaning. Adopts ANSI/ISO 8211-1985.
** FIPSPUB124
GUIDELINE ON FUNCTIONAL SPECIFICATIONS FOR DATABASE MANAGEMENT SYS TEMS
This guideline assists the data processing manager in the specification of database management functions. In this guideline is a framework for gathering and incorporat ing an appropriate set of data management functions into a request for proposals docu ment. The emphasis is on the logical separation of the database management functional specifications, the relationship among the logical categories, and the recom mended set of sources.
** FIPSPUB125
MUMPS
This publication announces the adoption of American National Standard for Informa tion Processing Systems Programming Language MUMPS, ANSI/MDC XI1.1-1984, as a Federal Information Processing Standard (FIPS). The American National Standard specifies the form and meaning of program units written in MUMPS. The purpose of the standard is to promote portability of MUMPS programs for use on a variety of data processing systems. The standard is used by implementors as the reference authority in developing language processors; and by other computer professionals who need to know the precise syntactic and semantic rules of the language.
A-28

** FIPSPUB126
DATABASE LANGUAGE NDL
The purpose of this standard is to promote portability of database definitions and database application programs between different Installations. The standard is used by implementors as the reference authority in developing a network model database management system and standard language interfaces to that database management system; and by other computer professionals who need to know the precise syntactic and semantic rules of the standard. Adopts ANSI X3.133-1986.
** FIPSPUB127
DATABASE LANGUAGE SQL
The purpose of this standard is to promote portability of database definitions and database applications programs between different installations. The standard is used by implementors as the reference authority in developing a relational model database management system and standard language Interfaces to that database management system; and by other computer professionals who need to know the precise syntactic and semantic rules of the standard. Adopts ANSI X3.135-1986.
** FIPSPUB128
COMPUTER GRAPHICS METAFILE (CGM)
This is a graphics data interface standard which specifies a file format suitable for the description, storage, and communication of graphical (pictorial) information in a device- independent manner. The purpose of the standard is to facilitate the transfer of graphi cal information between different graphical software systems, different graphical devices, and different computer graphics Installations. Adopts ANSI X3.122-1986.
** NBSIR 86-3386
WORK PRIORITY SCHEME FOR EDP AUDIT AND COMPUTER SECURITY REVIEW By Zella Ruthberg and Bonnie Fisher
This publication describes a methodology for prioritizing the work performed by EDP auditors and computer security reviewers. Developed at an invitational workshop at tended by government and private sector experts, the work plan enables users to evaluate computer systems for both EDP audit and security review functions and to develop a measurement of the risk of the systems. Based on this measure of risk, the auditor can then determine where to spend review time.
A-29

** NBSPUB500-137
SECURITY FOR DIAL-UP LINES By Eugene F. Troy
Ways to protect computers from intruders via dial-up telephone lines are discussed in this guide. Highlighted are hardware devices which can be fitted to computers or used with their dial-up terminals to provide communications protection for nonclasstfled computer systems. Also discussed are techniques that can be added to computer operating systems or incorporated into system management or administrative proce dures.
** NBSPUB500-134
GUIDE ON SELECTING ADP BACKUP PROCESSING ALTERNATIVES By Irene E. Isaac
This report discusses the selection of ADP backup processing support in advance of events that cause the loss of data processing capability with emphasis on management support at all levels of the organization. The alternative processing methods and criteria for selecting the most suitable method are presented, and a checklist for evaluating the suitability of alternatives is provided.
** NBSPUB500-133
TECHNOLOGY ASSESSMENT: METHODS FOR MEASURING THE LEVEL OF COM PUTER SECURITY By William Neugent, John Gilligan, Lance Hofrman, and Zella G. Ruthberg
The document covers the technical tools or processes which can be used to indicate the security adequacy of computer applications, systems, and installations.
** NBSPUB500-121
GUIDANCE ON PLANNING AND IMPLEMENTING COMPUTER SYSTEM RELIABILITY By Lynne S. Rosenthal
This report presents guidance to managers and planners on the basic concepts of com puter system reliability and on the implementation of a management program to im prove system reliability. Topics covered include techniques for quantifying and evaluating data to measure system reliability, designing systems for reliability, and recovery of a computer system after it has failed or produced erroneous output. An ap pendix contains references and a list of selected readings.
A-30

** NBSPUB500-109
OVERVIEW OF COMPUTER SECURITY CERTIFICATION AND ACCREDITATION By Zella Ruthberg and William Neugent
Certification is the technical evaluation of compliance with security requirements, based on security evaluation techniques. Accreditation is official authorization for operation of sensitive computer applications (or in the case of security deficiencies, for security corrections or suspension of certain activities). Managers use these techniques to safeguard their sensitive computer applications from fraud, illegal practices, mission failures, and other disruptions.
** NBSPUB500-85
EXECUTIVE GUIDE TO CONTINGENCY PLANNING By James K. Shaw and Stuart W. Katzke
Written for executives and managers in a brief question and answer format. The guide explains basic terms related to contingency planning, describes what contingency plan ning is and how it fits into an overall computer security program, and includes a bibli ography of related documents.
** NBSPUB500-67
THE SRI HIERARCHICAL DEVELOPMENT METHODOLOGY (HDM) AND ITS APPLICA TION TO THE DEVELOPMENT OF SECURE SOFTWARE By Karl N. Levitt, Peter Neumann, and Lawrence Robinson
Describes the SRI Hierarchical Development Methodology for designing large software systems such as operating systems and data management systems that must meet stringent security requirements.
** NBSPUB500-61
MAINTENANCE TESTING FOR THE DATA ENCRYPTION STANDARD By Jason Gait
Describes four tests that can be used by manufacturers and users to check the opera tion of data encryption devices. These tests are simple, efficient, and independent of the implementation of the Data Encryption Standard (FIPS 46).
A-31

** NBSPUB500-57
AUDIT AND EVALUATION OF COMPUTER SECURITY II: SYSTEM VULNERABILITIES AND CONTROLS Zella Ruthberg, Editor
Proceedings of the second NBS/GAO workshop to develop Improved computer security audit procedures. Contains the findings of three managerial and five technical sessions on computer system vulnerabilities and controls.
** NBSPUB500-54
A KEY NOTARIZATION SYSTEM FOR COMPUTER NETWORKS By Miles E. Smld
Describes a key notarization system that may be used In conjunction with a cryp tographic device to improve data security in computer networks. The proposed system gives users a set of commands for cryptographic key management as well as for data encryption functions.
** NBSPUB500-20
VALIDATING THE CORRECTNESS OF HARDWARE IMPLEMENTATIONS OF THE NBS DATA ENCRYPTION STANDARD By Jason Gait
Describes the design and operation of the NBS testbed that is used for the validation of hardware implementations of the Data Encryption Standard (DES). This report provides the full specification of the DES algorithm, a complete listing of the DES test set, and a detailed description of the interface to the testbed.
** NBSPUB500-139
DATA BASE DIRECTIONS: INFORMATION RESOURCE MANAGEMENT-MAKING IT WORK Elizabeth N. Fong and Alan H. Goldflne, Editors
This report presents the results of a3-day workshop held In Fort Lauderdale, Florida, on October 21-23, 1985, and sponsored by NBS, the Association for Computing Machinery, the IEEE Computer Society, and the Federal Data Management Users Group. TTie workshop evaluated current practices to identify problem areas, reviewed important technologies and tools and when to apply them to information resource management, and explored the motivation and inhibitions to decentralized and dis tributed environments.
A-32

** NBSIR 86-3324
DATA ADMINISTRATION WORKSHOP PROCEEDINGS Frankie E. Spielman, Editor
This report documents the proceedings of a 2-day workshop on data administration, held at NBS on March 27-28, 1985. Sponsored by NBS under the auspices of the Federal Data Management Users' Group, the workshop brought together Federal, State, and local government program managers, information resource managers, data process- Ing managers, and data administrators to discuss and share ideas and experiences.
** NBSPUB500-132
BENCHMARK ANALYSIS OF DATABASE ARCHITECTURE: A CASE STUDY Daniel R Benigni, Editor
This report documents the design and test of a benchmarking methodology to evaluate the performance of database management systems. The methodology was applied to three different database systems representative of current microcomputer, minicom puter, and database machine architectures. The methodology tested was described in NBS Spec. Pub. 500-118, A Guide to Performance Evaluation of Database Systems.
** NBSIR 85-3173
REFERENCE MODEL FOR DBMS STANDARDIZATION By Database Architecture Framework Task Group
This report details a Reference Model for developing standards for database manage ment systems that was developed by the Database Architecture Framework Task Group of the ANSI/X3/SPARC Database Systems Study Group. The Reference Model is a con ceptual framework that divides the standardization work into manageable pieces and shows at a general level how these pieces are related to each other.
** NBSIR 85-3165
USING THE INFORMATION RESOURCE DICTIONARY SYSTEM COMMAND LANGUAGE By Alan Goldflne
Provides an example of using the Information Resource Dictionary System Command Language on a dictionary maintained by the U.S. Air Force to support its Air Staff Codes and Descriptions application.
A-33

** NBSIR 85-3164
A TECHNICAL OVERVIEW OF THE INFORMATION RESOURCE DICTIONARY SYSTEM By Alan Goldflne and Patricia Konig
Provides background information on the development of the draft proposed American National Standard Information Resource Dictionary System and summarizes data ar chitecture, software functions, and processes specified by the standard.
** NBSPUB500-122
GUIDE ON LOGICAL DATABASE DESIGN Elizabeth N. Fong, Margaret W. Hender- son, David K. Jefferson, and Joan M. Sullivan, Editors
Logical database design is a critical process that determines the fundamental data structures supporting an organization's information resources. The way that data are collected, stored, and protected from undesired access is established by the database design process. This report presents a plan of action that enables managers, end users, systems analysts, designers, and applications programmers to cooperatively plan an information system that will serve present and future users' needs.
** NBSPUB500-118
A GUIDE TO PERFORMANCE EVALUATION OF DATABASE SYSTEMS Daniel R Benigni, Editor
This guide provides a generalized methodology for evaluating the performance of a single database system or comparing the performance of several systems. Applicable to most database system designs, the methodology described identifies the criteria to be utilized in the design, execution, and analysis of database system benchmarks.
** NBSPUB500-115
REPORT ON APPROACHES TO DATABASE TRANSLATION By Leonard Gallagher and Sandra Salazar
Describes approaches to database translation, discusses candidate standard inter change forms, and recommends a method for representing the data structures of proposed network and relational data models in a form suitable for database inter change.
A-34

** NBSPUB500-108
GUIDE ON DATA MODELS IN THE SELECTION AND USE OF DATABASE MANAGE MENT SYSTEMS By Leonard J. Gallagher and Jesse M. Draper
Helps users define their requirements for database management systems (DBMS) and select the DBMS that meets their specific needs from the available commercial systems. Two data models used In many DBMS's and other issues affecting the choice of a DBMS are discussed.
** NBSPUB500-92
DATABASE DIRECTIONS: INFORMATION RESOURCE MANAGEMENT - STRATEGIES AND TOOLS Alan H. Goldfine, Editor
Better use of information resource management tools, especially data dictionary sys tems, is the focus of these workshop proceedings. Sponsored lay the NBS and the As sociation for Computing Machinery, the workshop included participants from government, industry, and academic organizations. Their discussions on the uses of in formation resource dictionary systems, information resource management policies and controls, and logical database design are summarized in this report.
** NBSPUB500-86
AN ARCHITECTURE FOR DATABASE MANAGEMENT STANDARDS By Computer Cor poration of America
Presents a framework for future standards, based on features including the identifica tion of database management system functions, the grouping of those functions into components, the support of multiple data model standards, and the specification of both internal and external interfaces.
** NBSIR 82-2619
FUNCTIONAL SPECIFICATIONS FOR A FEDERAL INFORMATION PROCESSING STAND ARD DATA DICTIONARY SYSTEM Patricia A. Konig, Alan Goldfine, and Judith J. New ton, Editors
An interim report specifying software functions to be included in the development of a FIPS Data Dictionary System (DOS).
A-35

** NBSGCR82-419
A FAMILY OF DATA MODEL SPECIFICATIONS FOR DBMS STANDARDS By Frank Manola, Alaln PIrotte, et al. ( Computer Corporation of America
Presents preliminary specifications for three major data models of DBMS's (relational, network, and hierarchical) and identifies a model that Is a subset of operations and data objects common to all three models.
** NBSGCR82-389
SURVEY OF STATE-OF-THE-ART OF LOGICAL DATABASE DESIGN TOOLS By Peter P. Chen, I. Chung, and D. Perry. UCLA
Surveys representative state-of-the-art logical database design tools.
** NBSIR 81-2354
FEDERAL REQUIREMENTS FOR A FEDERAL INFORMATION PROCESSING STAND ARD DATA DICTIONARY SYSTEM By Patricia Konlg and Judith Newton
Reports preliminary conclusions about Federal agency requirements for standard data dictionary system.
** NBSGCR82-375
A DMS COST+BENEFIT DECISION MODEL: ANALYSIS, COMPARISON, AND SELEC TION OF DBMS's By Stanley Y. Su, Don S. Batory, et al.. University of Florida
Presents and gives examples of seven steps to evaluate alternative systems: (1) Select cost and preference (performance) parameters; (2) Formulate elementary criteria; (3) Ag gregate preferences; (4) Issue RFP; (5) Compute global preferences and perform sen sitivity analysis; (6) Compute global costs; (7) Perform cost-preference analysis to rank the systems.
A-36

** NBSGCR82-374
A DMS COST/BENEFIT DECISION MODEL: MATHEMATICAL MODELS FOR DATA MANAGEMENT SYSTEM EVALUATION,/COMPARISON AND SELECTION By Jozo J. Dujmovlc and Richard Elnlcki, University of Florida
Describes the Logical Scoring of Preference (LSP) method by topic: (1) Development of system requirement; (2) Classification and description of elementary criteria; (3) Logic aggregation of preference; (4) Analysis of elementary and compound preference aggrega tion functions; (5) Cost analysis models; and (6) Cost-preference analysis for DBMS comparison and selection.
** NBSGCR82-373
A DMS COST/BENEFIT DECISION MODEL; COST AND PREFERENCE PARAMETERS By Stanley Y. Su, Don S. Batory, et al.. University of Florida
Presents the general cost and preference parameters for the evaluation, comparison, and selection of data management alternatives.
** NBSIR 81-2315
DRAFT SPECIFICATIONS FORA STRUCTURED DATA INTERCHANGE FORM By J. Fry, et al., University of Michigan
Defines the format of a self-describing data interchange file that is media- and machine- independent, and that facilitates the transfer of structured data by a software discipline (such as a DBMS) between dissimilar computing systems and software.
** NBSIR 81-2302
THE POSITIONAL SET PROCESSOR; A TOOL FOR DATA MODELING ByW. Terry Hardgrave, Sandra B. Salazar, and Edwin J. Beller III
Describes the design of a software tool for manipulating mathematical objects such as sets or sequences with the purpose of specifying a DBMS. The positional set processor serves as the basis for a Data Model Processor (DMP), an experimental system for emulating commercial and prototype DBMS's.
A-37

** NBSIR 81-2240
DESIGN OF INFORMATION SYSTEMS USING SCENARIO-DRIVEN TECHNIQUES By Terry Hardgrave, Sandra B. Salazar, and Edwin J. Beller III
Describes a technique for developing Information systems, using a scenario-driven design approach that emphasizes user participation in the design process in order to enhance its usefulness and lower its cost. Information-flow diagrams and database designs are constructed using scenarios, which document the interaction between the computer and the human user.
** NBSPUB500-84
COSTS AND BENEFITS OF DATABASE MANAGEMENT: FEDERAL EXPERIENCE By Jesse M. Draper
A report on the experiences of eight Federal data managers in the use of database management systems. Provides background information on Federal government use of data processing and database management systems.
** NBSPUB500-76
DATABASE ARCHITECTURES - A FEASIBILITY WORKSHOP REPORT John L. Berg, Marc Graham, and Keven Whitnay, Editors
Reports on workshop discussions concerning potential benefits and pitfalls in the ap plication of database technology. Topics covered include data Independence, query lan guages, data dictionaries, and database conversion.
** NBSPUB500-64
DATABASE DIRECTIONS-THE CONVERSION PROBLEM John L. Berg, Editor
Includes reports of a workshop that explored four aspects of database conversion- establishing management objectives, actual conversion experiences, development of standards, and assessing conversion technology.
A-38

** NBSPUB500-59
DATA ABSTRACTION, DATABASES, AND CONCEPTUAL MODELING: AN ANNOTATED BIBLIOGRAPHY By Michael L. Brodle
Presents references to research In data abstraction, databases, and conceptual model- Ing. Contains entries for books, articles, and papers from the areas of programming languages, database management, artificial intelligence, and software engineering.
** NBSPUB500-28
DATABASE ADMINISTRATION: CONCEPTS, TOOLS, EXPERIENCES, AND PROBLEMS By Belkls Leong-Hong and Beatrice Marron
Surveys the experiences and problems of database administrators in organizing, main taining and directing both the automated and nonautomated data resources of an or ganization. Describes software tools for use in database management and data element dictionary systems.
** NBSPUB500-10
A DATABASE MANAGEMENT APPROACH TO PRIVACY ACT COMPLIANCE By Elizabeth Fong
Discusses how database management systems can be used to implement Privacy Act re quirements for the handling of personal information.
** NBSPUB500-2
ACCESSING INDIVIDUAL RECORDS FROM PERSONAL DATA FILES USING NONUNI- QUE IDENTIFIERS By Gwendolyn B. Moore. John L. Kuhns, Jeffery L. Trefizs, and Christina A. Montgomery
Analyzes methodologies for retrieving personal information using nonunique identifiers such as name, address, etc. This study presents statistical methods for Judging the ac curacy and efficiency of various methods.
A-39
** NBSPUB500-111
PROCEEDINGS OF THE NATIONAL BUREAU OF STANDARDS/NATIONAL SECURITY AGENCY WORKSHOP ON STANDARDIZATION ISSUES FOR OPTICAL DIGITAL DATA DISK (OD3) TECHNOLOGY Jean B. Freedman, Editor
Presentations and panel discussions for the NBS/NSA workshop held on June 1-3, 1983 are summarized In this publication. Subjects discussed Included the physical, dimensional, optoelectrical, quality, and data transfer characteristics of OD3 media, current applications, test methods for determining relative media and data life, and the need for standard test and evaluation methods.
** NBSPUB500-107
BIBLIOGRAPHY OF THE LITERATURE ON OPTICAL STORAGE TECHNOLOGY By James R Park
Contains nearly 700 references to literature on optical storage and retrieval of digital computer data. Divided Into two major groups for general literature and patent litera ture, the references are classified Into several broad categories and cross Indexed for the user's convenience.
** NBSPUB500-101
CARE AND HANDLING OF COMPUTER MAGNETIC STORAGE MEDIA By Sidney B. Geller
A reference guide that answers questions about protecting computer tapes and disks. Discusses physical handling of media to avoid damage, contamination, and data loss; control of the environmental factors affecting media; storage and transportation of media; recovery of media and data damaged by extreme temperatures and water; use of Tape Management Systems; scheduled maintenance for active and stored media; long- term archival care and handling of computer tapes.
** NBSIR 82-2588
HYBRID GRIDNET: PACKET AND CIRCUIT SWITCHING IN A SINGLE NETWORK By R T. Moore
GRIDNET is a packet switching network composed of multiple connected dual loops, to provide highly survivable data communications over a large number of sites. This report describes a concept for overlaying such a network with additional channels and switching facilities that may be used to establish point-to-point circuits on a demand basis.
A-40

** NBSIR 81-2298
RESULTS OF FINGERPRINT IMAGE QUALITY EXPERIMENTS ByRT. Moore
Describes a series of experiments matching fingerprints using a variety of card stocks and recording techniques. The best scores were developed from Images placed on very white, slick appearing, calendared card stock with the use of film strips that had been pre-inked and which could be separated to expose an ink film of predetermined thick ness and uniformity.
** NBSPUB500-36
THE LX39 LATENT FINGERPRINT MATCHER By Joseph H. Wegstein and John F. Rafferty
Describes an automated procedure that was developed to determine if a latent scene-of- crime fingerprint matches an inked, rolled, file fingerprint. The procedure involves the use of a semi-automated fingerprint reader to read the minutiae (ridge endings and bifurcations) of the latent print and convert the minutiae to data that can be compared by computer with data representing the file fingerprints.
** NBSIR 86-3385
IMPLEMENTATION AGREEMENTS FOR OPEN SYSTEMS INTERCONNECTION PROTOCOLS Jerry Mulvenna, Editor
This document records current agreements on implementation details of Open Systems Interconnection protocols among the organizations participating in the NBS/OSI Workshop Series for Implementors of OSI Protocols. These decisions are documented to facilitate organizations in their understanding of the status of agreements. This is a standing document that is updated after each workshop (about every 2-1/2 months). A reference list of standards and a list of contributing organizations are included in the Appendix.
** NBSIR 85-3141
COMSAT/NBS EXPERIMENT PLAN FOR TRANSPORT PROTOCOL By Richard Colella, Mamie Wheatley, and Kevin Mills
This report describes an experiment plan for analysis of class 4 transport protocol operating over a satellite link. Alternative protocol mechanisms are proposed for ex pedited data transfer and acknowledgment and retransmission. A simulation model is used to evaluate the effect of the mechanisms and various transport operating parameters on performance.
A-41

** NBSIR 85-3236
AN NBS HOST TO FRONT END PROTOCOL By C. M. Chernlck
This study describes a generic protocol for host to front-end communications proces sors. The protocol was developed to support protocol performance testing and to provide a reliable connection-oriented process-to-process communications path be tween a host computer and a front-end computer.
** NBSPUB500-127
WORKSHOP ON ANALYTIC AND SIMULATION MODELING OF IEEE 802.4 TOKEN BUS LOCAL AREA NETWORKS Robert Rosenthal, Editor
This report includes presented papers and summarizes the deliberations of a workshop held at the NBS in April 1985. The focus was the performance and characteristics of token bus networks. The 39 participants from industry, academia, and the Federal government exchanged information on current research efforts and identified future re search areas needed to advance understanding of the technology and its use in process control, laboratory, and factory automation applications.
** NBSIR 85-3104
PERFORMANCE MEASUREMENT OF OSI CLASS 4 TRANSPORT IMPLEMENTATIONS By Kevin L. Mills, Jeff W. Gura, and C. Michael Chemick
Describes measurement system to evaluate the performance of open system intercon nection (OSI). Several metrics are discussed to establish a quantitative characterization of layered protocol performance. Metrics specific to the OSI transport protocol are also discussed. The measurement system was used to develop a demonstration of different manufacturers' systems communicating through a network.
** NBSIR 84-2966
AN NBS HOST TO FRONT END PROTOCOL By Jean-Luc Archambault
This study describes a discrete event simulation of token bus networks that was used to analyze the performance of networks that conform with the IEEE 804.2 specifica tions. The model measures the utilization of the network, the rotation time, the waiting time of the data packets, and the queue lengths in the Medium Access Control sublayer.
A-42

** NBSPUB500-96
SELECTION OF LOCAL AREA COMPUTER NETWORKS By Robert Rosenthal, Editor
Describes steps that computer users can follow In selecting a local area computer net work. This guide Includes advice on features of different networks, how to identify the needs of an installation, and then determine which network will support those needs. Steps are detailed for preparing a solicitation document, and for evaluating and select ing from the proposals received.
** NBSPUB500-44
A METHODOLOGY FOR THE SELECTION OF INTERACTIVE COMPUTER SERVICES By Sandra A. Mamrak and Paul D. Amer
Presents a methodology for comparing and selecting remote access interactive computer services through statistical analysis of measurement data collected about the services. The methodology incorporates confidence statements about the probability of having made a correct selection.
** NBSPUB500-81
SURVEY OF STANDARDIZATION EFFORTS OF CODED CHARACTER SETS FOR TEXT PROCESSING By Joan E. Knoerdel
Presents information on the status of various standards for coded character sets and on the organizations that develop these standards.
** NBSPUB500-72
GUIDANCE ON REQUIREMENTS ANALYSIS FOR OFFICE AUTOMATION SYSTEMS
Presents a methodology for studying the feasibility and practicality of implementing of fice automation systems. Covers how to determine baseline office productivity, design the office automation system, develop functional specifications, assess the cost Justifica tions, and conduct posttmplementation audits of the office automation system.
A-43

** NBSPUB500-143
GUIDE TO THE SELECTION AND USE OF FOURTH GENERATION LANGUAGES By Martha M. Gray
This report helps managers select fourth-generation languages (4GL) based on the fea tures, functions, and capabilities of these languages. Subjects covered include a recom mended selection process; the hardware, software, organizational, and user environments that affect the selection and use of fourth-generation languages; and the operating, user interface, language, security, report writing, data management, graphics, and implementation features of 4GL's. Recommendations on 4GL use are provided.
** NBSPUB500-138
A FUNCTIONAL MODEL FOR FOURTH GENERATION LANGUAGES By Gary Fisher
Defines fourth-generation languages (4GL) in terms of the functions performed and ser vices provided. Some commonly provided functions and services are: user functions such as query language, screen formatter, report formatter, and procedural language components; data management functions such as data dictionary and database management system components; and system functions such as file handling, job con trol, and communications.
** NBSPUB500-117
SELECTION AND USE OF GENERAL-PURPOSE PROGRAMMING LANGUAGES By JohnV. Cugini
Volume 1 explains the features of seven popular programming languages Ada, BASIC, C, COBOL, FORTRAN, Pascal, and PL/1 - and discusses the criteria that ADP managers and users can apply to select the right language for their special require ments. The criteria are based on the logical capabilities of the language and its Im plementation; the application to be programmed; and the user's computing environment including existing facilities and software. Volume 2 contains program ex amples to illustrate the features and style of the seven languages.
A-44

** NBSIR 83-2639
COST-BENEFIT IMPACT STUDY ON THE ADOPTION OF THE DRAFT PROPOSED REVISED X3.23 AMERICAN NATIONAL STANDARD PROGRAMMING LANGUAGE COBOL By Marco Fiorello and John Cuginl
Assesses the costs and benefits for the Federal government resulting from a proposed revision of the COBOL programming language standard. Based on analysis of Federal COBOL programs and interviews with COBOL users, this study concludes that the government will net an estimated $72 million in benefits with the adoption of the revision.
** NBSPUB500-77
SPECIFICATIONS AND TEST METHODS FOR NUMERIC ACCURACY IN PROGRAM MING LANGUAGE STANDARDS By John V. Cugini
This publication formulates language-independent and machine-independent criteria for assessing the quality of floating-point arithmetic operations and functions. Model al gorithms for testing are included.
** NBSPUB500-70+1
NBS MINIMAL BASIC TEST PROGRAMS - VERSION 2, USER MANUAL By John V. Cugini, Joan S. Bowden, and Mark W. Skall
Describes the set of programs developed by NBS to test conformance of implementa tions of BASIC to the Federal and American National Standards.
** NBSPUB500-70+2
NBS MINIMAL BASIC TEST PROGRAMS - VERSION 2, USER MANUAL (Volume 2. Source Listings and Sample Output) By John V. Cugini, Joan S. Bowden and Mark W. Skall
Provides the source code for programs developed by NBS to test conformance of im plementations of BASIC to the Federal and American National Standards.
A-45

** NBSHBK131
USING ANS FORTRAN Gordon E. Lyon, Editor
Presents a set of reference charts for ANS FORTRAN 66 syntax; observations on using standard language features; Instructions on circumventing and extending FORTRAN 66 with the least harm; an appraisal of FORTRAN 77 in terms of FORTRAN 66 constructs.
** NBSPUB500-26
COBOL INSTRUMENTATION AND DEBUGGING: A CASE STUDY By Gordon Lyon
Describes methods for improving programmer productivity in writing and checking COBOL programs. Techniques Involving interactive rather than batch programming are illustrated In a test case.
** NBSPUB500-140
PERSONAL COMPUTER NETWORKS By John Barkley
Surveys the technology of personal computer networks from the point of view of the user. It describes the technology and services provided by networks designed for per sonal computers and those networks, such as those based on a telephone system, that can connect personal computers but were designed for a different purpose.
** NBSIR 86-3356
ELECTRONIC BULLETIN BOARDS By Ted Landberg
This report aids computer users Interested in establishing electronic bulletin board sys tems. Hardware, software, and communications requirements are discussed. Bulletin boards are computer services that enable callers with microcomputers or terminals with communications capabilities to post and read messages, and to transfer files to and from the service.
A-46

** NBSPUB500-135
INTEGRATED SOFTWARE FOR MICROCOMPUTER SYSTEMS ByLynneS. Rosenthal
This publication explains five different ways to integrated software: the multifunction application package; a program suite that works together; a software integrator; an operating system that controls and coordinates applications programs; and a back ground utility program. The advantages and disadvantages of each approach to integra tion, and the key issues to be considered in selecting integrated software, are discussed.
** NBSPUB500-131
GUIDE FOR SELECTING MICROCOMPUTER DATA MANAGEMENT SOFTWARE By Charles L. Sheppard
This guide provides information to assist data processing managers in the selection process for microcomputer data management software. General information is provided on the different categories into which microcomputer data management software can be grouped. The features that distinguish the software packages along this spectrum are discussed and illustrated.
** NBSPUB500-128
STARTING AND OPERATING A MICROCOMPUTER SUPPORT CENTER By Ted Landberg and Stanley Winkler
This report identifies and discusses the management issues and resources associated with.establishing a microcomputer support center. For managers contemplating the es tablishment of such a center, this report provides information on requirements for staff ing, space, equipment, software, and operating policies.
** NBSPUB500-125
ISSUES IN THE MANAGEMENT OF MICROCOMPUTER SYSTEMS By John Barkley and Lynne S. Rosenthal
Identifies issues related to the management of microcomputer systems and analyzes some of the options available for the effective integration of small systems into an organization's overall ADP usage. Included in the discussion are overall organizational characteristics, information issues, user issues, and technology issues.
A-47

** NBSPUB500-120
SECURITY OF PERSONAL COMPUTER SYSTEMS: A MANAGEMENT GUIDE By Dennis D. Stelnauer
This publication provides practical advice on the following issues: physical and environ mental protection; system and data access control: integrity of software and data; back up and contingency planning; auditability; communications protection. References to additional information, a self-audit checklist, and a guide to security products for per sonal computers are included in the appendices.
** NBSPUB500-112
SELECTION OF MICROCOMPUTER SYSTEMS By John Barkley. Dennis Gilbert, and Al Hankinson
Provides practical advice on selecting a microcomputer system and answers questions about technical issues. These include: when to use a microcomputer system and when to use central ADP facilities; how to maximize data and resource sharing; how to reduce software development and maintenance costs; and how to avoid hardware and software obsolescence. An appendix explains the features and capabilities of microcomputer sys tems emphasizing office applications and communications.
** NBSPUB500-110
MICROCOMPUTERS: INTRODUCTION TO FEATURES AND USES By Myron Hecht, Herbert Hecht, and Laurence Press
Helps organizations plan for and manage the introduction of microcomputers by ex plaining the basic features of hardware, software, and applications and discussing key points for managers and users. A reference list, glossary, and annotated bibliography are included.
** NBSPUB500-102
MICROCOMPUTERS: A REVIEW OF FEDERAL AGENCY EXPERIENCES By Dennis Gilbert, Elizabeth Parker, and Lynne Rosenthal
Presents the results of a 6-month study of the management and technical issues as sociated with the use of microcomputers. This study is based on interviews with Federal users during the period of August 1982 to January 1983, as well as informa tion gathered from reports, periodicals, information services, and other sources.
A-48

** NBSIR 82-2573
AN ANNOTATED BIBLIOGRAPHY OF INTRODUCTORY ARTICLES TO AID IN THE SELECTION OF SMALL COMPUTER SYSTEMS By Lynne Rosenthal and John Barkley
Presents references In popular magazines and journals to Introductory material for those Involved In the selection and evaluation of small computing systems.
** NBSPUB500-144
GUIDANCE ON SOFTWARE PACKAGE SELECTION Edited by Sheila Frankel
This report describes a systematic procedure for identifying and evaluating off-the-shelf software packages, and for incorporating the selected package into the organizational environment. Each phase of the software package selection and implementation process is discussed.
** NBSPUB500-142
A MANAGEMENT OVERVIEW OF SOFTWARE REUSE By William Wong
This report provides general guidance on the problems and benefits of software reuse. Software reuse can substantially reduce software costs and risks, while improving software quality and productivity. Subjects covered in this study include both the tech nical issues and the nontechnical issues, such as lack of standards, resistance to change, data and proprietary rights, and project management problems, that need to be addressed to make software reuse cost-effective.
** NBSPUB500-141
ANNOTATED BIBLIOGRAPHY ON SOFTWARE MAINTENANCE ByWilmaM. Osborne and Ron Raigrodskl
Contains summaries of 285 articles and papers from computer science journals, books proceedings, periodicals, and other publications. Covering a 15-year period from 1972 to 1986, the bibliography overviews both the management and technical issues of software maintenance, and identifies the techniques, procedures, methodologies, and tools that have been effectively employed to improve the quality of software systems.
A-49

** NBSER 86-3407
AN EXPERIMENT IN SOFTWARE ACCEPTANCE TESTING By Dolores R. Wallace
Software acceptance testing was performed on a prototype software engineering environ ment as part of the program to provide Information to Federal agencies for Improving quality and productivity in software development and maintenance. The purpose of software acceptance testing is to demonstrate to its purchasers that the software satis fies its requirements. This report describes the method and standards applied In software acceptance testing, discusses the difficulties encountered during the study, and proposes research directions for software acceptance testing.
** NBSPUB500-136
AN OVERVIEW OF COMPUTER SOFTWARE ACCEPTANCE TESTING By Dolores Wallace
This publication helps organizations plan for and manage the process of acceptance testing to determine whether a software system satisfies organizational requirements for the system. The development of the test plan, acceptance criteria, and test cases and procedures are discussed. A checklist of activities for planning and managing the acceptance testing process Is Included.
** NBSPUB500-130
EXECUTIVE GUIDE TO SOFTWARE MAINTENANCE ByWilmaM. Osborne
This pocket-size guide answers sixty-four key questions about software maintenance for executives and managers who are responsible for software projects. The guide covers software tools, software reuse, Improvement of programmer and software produc tivity, and steps that can be taken to reduce software maintenance costs.
** NBSPUB500-129
SOFTWARE MAINTENANCE MANAGEMENT By James A. McCall, MaryD. Herndon, andWilmaM. Osborne
Recommended procedures for managing software maintenance projects to cut costs and improve software quality are detailed In this report. It overviews software main tenance problems and describes techniques, practices, tools, and procedures that can help reduce those problems and contribute to the development of quality software. An integrated approach to software maintenance is described with suggestions for improv ing the maintenance process.
A-50

** NBSPUB500-114
INTRODUCTION TO SOFTWARE PACKAGES Sheila Frankel, Editor
Encourages the use of software packages as an alternative to in-house development and helps users find the right software for their applications. Application areas that are currently supported by software packages and the benefits and limitations of software packages are discussed. This document includes annotated list of publica tions.
** NBSIR 85-3113
ANNOTATED BIBLIOGRAPHY OF RECENT PAPERS ON SOFTWARE ENGINEERING EN VIRONMENTS By Raymond C. Houghton, Edited by Dolores R. Wallace
Reports on the contents of 55 papers on software engineering environments.
** NBSPUB500-116
TOWARD AN IMPROVED FIPS COST-BENEFIT METHODOLOGY, PHASE II: DESCRIP TIVE MODELS - GENERAL PURPOSE APPLICATION SOFTWARE DEVELOPMENT AND MAINTENANCE By Mary Lou Chipman, Marco Fiorello, Peg Kay, and Patricia Powell
Presents a functional-flow descriptive model that can be used to categorize the applica tion software (ASOF) development and maintenance activities. ASOF-related activities may be conceptually represented in descriptive model form by combining one or more of the basic model tasks for use in identifying the impact of standards and guidelines and in preparing cost-benefit analyses.
** NBSPUB500-106
GUIDANCE ON SOFTWARE MAINTENANCE By Roger J. Martin and Wilma M. Osborne
Discusses practical ways to improve the quality and effectiveness of software main tenance. This report emphasizes that software maintenance should be performed in a structured, controlled way over the entire life cycle of the application system and that managers should institute controls over the software process, the application system, and any changes that are made.
A-51

** NBSPUB500-105
GUIDE TO SOFTWARE CONVERSION MANAGEMENT Mark Skall, Editor
Describes explicit steps for carrying out software conversion projects. Developed to help managers avoid the common problems associated with software conversion, this guide includes an extensive reference list, case studies, and a glossary of terms.
** NBSPUB500-99
STRUCTURED TESTING: A SOFTWARE TESTING METHODOLOGY USING THE CYCLOMATIC COMPLEXITY METRIC By Thomas J. McCabe (McCabe and Associates, Inc.)
Describes a testing methodology that limits computer program complexity so that in dividual modules within the program can be tested. This report details how to measure program complexity and how to carry out the structured testing process.
** NBSPUB500-98
PLANNING FOR SOFTWARE VALIDATION, VERIFICATION. AND TESTING Patricia B. Powell, Editor
A guide for managers, programmers, and analysts to aid in developing plans for software validation, verification, and testing and in selecting appropriate practices, tech niques, and tools. In explaining the fundamental concepts, this report provides infor mation to help in establishing organizational policies for V.V&T.
** NBSPUB500-94
PROCEEDINGS OF THE NBS FIPS SOFTWARE DOCUMENTATION WORKSHOP A, J. Neumann, Editor
Proceedings of a workshop held March 3, 1982 at NBS. Includes papers and sum maries of discussions of various aspects of software documentation including use of ex isting standards, and applications of documentation to enhance software sharing, improve human interfaces, and improve software quality.
A-52

** NBSPUB500-90
GUIDE TO CONTRACTING FOR SOFTWARE CONVERSION SERVICES By Mark Skall
Provides practical advice on how to describe, specify, accept, and evaluate contractor services and includes check lists and worksheets to assist in the conduct of software conversion studies.
** NBSPUB500-87
MANAGEMENT GUIDE FOR SOFTWARE DOCUMENTATION ByAlbrechtJ. Neumann
Discusses software documentation problems and outlines policies, procedures, and ap plicable standards that can be used to improve documentation planning, implementa tion, and maintenance. Appendices include checklists for documentation policies and procedures, references to available literature, and a glossary of terms.
** NBSPUB500-78
NBS PROGRAMMING ENVIRONMENT WORKSHOP REPORT Martha A. Branstad and W. Richards Adrion, Editors
A report on technology and future research needs in the use of automated techniques for software development. Programming environments are various approaches to automating software development, such as the use of an integrated software tools sys tem and the use of tool features embedded in a high-level language.
** NBSPUB500-75
VALIDATION, VERIFICATION, AND TESTING OF COMPUTER SOFTWARE By W. Richards Adrion, Martha A. Branstad, and John C. Chemiavsky
Discusses testing and analysis techniques that are needed throughout the software development process to improve the quality of software. A useful guide to programmers and software managers in developing better software products.
A-53

** NBSPUB500-73
COMPUTER MODEL DOCUMENTATION GUIDE By the Federal Computer Performance Evaluation and Simulation Center
Provides guidance to model developers in communicating the details of model design and operation. Details the contents of documentation manuals that are needed by managers, users, programmers, and analysts.
** NBSPUB500-62
CONVERSION OF FEDERAL ADP SYSTEMS: A TUTORIAL By Joseph Collica, Mark Skall, and Gloria Bolotsky
Discusses the major problems encountered in converting computer software from use on one system to use on another system. The experiences of four Federal agencies in carrying out large-scale conversion projects and the views of four companies specializ ing in different aspects of conversion are highlighted.
** NBSPUB500-56
VALIDATION, VERIFICATION, AND TESTING FOR THE INDIVIDUAL PROGRAMMER By Martha A. Branstad, John C. Cherniavsky, and W. Richards Adrion
A guide to software testing and verification by programmers who do not have access to sophisticated development tools or extensive resources. Includes guidance to develop ing and planning tests and other verification techniques throughout the software lifecycle.
** NBSPUB500-39
COMPUTER MODEL DOCUMENTATION: A REVIEW AND AN APPROACH
Reviews the documentation procedures contained in studies and reports on software and model documentation. This study proposes procedures to improve the usefulness of computer models by establishing documentation requirements throughout the life cycle of a model.
A-54

** NBSPUB500-15
DOCUMENTATION OF COMPUTER PROGRAMS AND AUTOMATED DATA SYSTEMS MitchellA. Krasney, Editor
Proceedings of a symposium held at NBS in October 1976 to assist Federal agency staffs in applying guidelines for documenting computer programs. Contains papers and summaries of discussions focusing on Federal agency experiences with documenta tion standards.
** NBSIR 86-3408
STUDY OF A PROTOTYPE SOFTWARE ENGINEERING ENVIRONMENT By Dolores Wallace and D. Richard Kuhn
This study of prototype software engineering environment provides information to Federal agencies on software tools for Improving quality and productivity in software development and maintenance. The report discusses features of software engineering environments and presents several factors to consider when evaluating a software en gineering environment.
** NBSER 85-3250
CHARACTERISTICS AND FUNCTIONS OF SOFTWARE ENGINEERING ENVIRONMENTS By Raymond C. Houghton, Jr. and Dolores R Wallace
Software engineering environments surround their users with software tools necessary for systematic development and maintenance of software. This report characterizes software engineering environments by type, by their relationship to the software life cycle, and by their capabilities, limitations, primary users, and levels of support. Ex amples of existing software engineering environments that are available commercially or in research laboratories are discussed.
** NBSPUB500-93
SOFTWARE VALIDATION, VERIFICATION, AND TESTING TECHNIQUE AND TOOL REFERENCE GUIDE Patricia B. Powell, Editor
Describes basic features of validation, verification, and testing (V.V&T) techniques and tools. Information provided includes input, output, an example of the technique or tool, an assessment of its effectiveness and usability, applicability, an estimate of learn ing time and training, an estimate of needed resources, and references.
A-55

** NBSPUB500-91
THE INTRODUCTION OF SOFTWARE TOOLS By Herbert Hecht
Helps computer users plan for and manage the use of software tools. This report details the organizational and other factors that might retard the use of software tools and offers step-by-step procedures for overcoming the obstacles to tool use.
** NBSIR 81-2423
COMPILER-BASED PROGRAMMING SUPPORT CAPABILITIES By Intennetrics, Inc.
A study to determine a set of features offered by program analysis and testing tools that could be implemented in a compiler.
** NBSGCR81-357
FORTRAN 77 ANALYZER SYSTEM/SUBSYSTEM SPECIFICATION By TRW Defense and Space Systems Group
Reports completed for ICST by TRW Defense and Space Systems Group.
** NBSGCR81-358
FORTRAN 77 ANALYZER FUNCTIONAL REQUIREMENTS DOCUMENT By TRW Defense and Space Systems Group
Reports completed for ICST by TRW Defense and Space Systems Group.
** NBSGCR81-359
FORTRAN 77 ANALYZER USER MANUAL By TRW Defense and Space Systems Group
Reports completed for ICST by TRW Defense and Space Systems Group.
A-56

** NBSGCR81-360
FORTRAN 77 ANALYZER TEST PLAN By TRW Defense and Space Systems Group
Reports completed for ICST by TRW Defense and Space Systems Group.
** NBSGCR 81-361
FORTRAN 77 ANALYZER MAINTENANCE MANUAL By TRW Defense and Space Sys tems Group
Reports completed for ICST by TRW Defense and Space Systems Group.
** NBSIR 81-2388
SYNOPSIS OF INTERVIEWS FROM A SURVEY OF SOFTWARE TOOLS USAGE By Herbert Hecht
A survey to Investigate how different programming environments affect the use of and direct the development of software tools.
** NBSPUB500-82
FINAL REPORT: A SURVEY OF SOFTWARE TOOLS USAGE By Herbert Hecht
Analyzes software tools usage at 23 different sites, including private sector, government- support, and government organizations. Topics covered Include factors affecting tools use, user experiences, and tool acquisition and development policies.
** NBSPUB500-80
PROCEEDINGS OF THE NBS/IEEE+ACM SOFTWARE TOOL FAIR Raymond C. Houghton, Jr., Editor
A compilation of information to aid users In the selection of software tools. Includes descriptions and background data about software tools that were demonstrated at the March 1981 San Diego Tool Fair held In conjunction with the Fifth International Con ference on Software Engineering.
A-57

** NBSPUB500-74
FEATURES OF SOFTWARE DEVELOPMENT TOOLS By Raymond C. Houghton.Jr.
Presents a classification scheme to aid users in selecting software tools according to the features that they provide. The classification scheme categorizes available tools, stand ardizes the terminology associated with tools, and eases the task of comparing and evaluating tools.
** NBSPUB500-14
SOFTWARE TOOLS: A BUILDING BLOCK By I. Trotter Hardy, Belkis Leong-Hong, and Dennis W. Fife
Surveys techniques for producing computer programs through the joining of existing programs or blocks of computer code. Describes the application of this approach to the construction of a text editor and syntax analyzer, includes an annotated bibliography about software tools.
** NBSPUB500-126
A TOPOLOGICAL APPROACH TO THE MATCHING OF SINGLE FINGERPRINTS: DEVELOPMENT OF ALGORITHMS FOR USE ON LATENT FINGERMARKS By Malcolm K. Sparrow and Penelope J. Sparrow
This report describes a method of coding fingerprint patterns by a variety of topological coordinate schemes, with fingerprints comparison being performed on the basis of local ized topological information which Is extracted from the recorded coordinate sets. Such comparison is shown to offer a substantial improvement In performance over existing (special) techniques.
** NBSPUB500-124
A TOPOLOGICAL APPROACH TO THE MATCHING OF SINGLE FINGERPRINTS: DEVELOPMENT OF ALGORITHMS FOR USE ON ROLLED IMPRESSIONS By Malcolm K. Sparrow and Penelope J. Sparrow
This report describes research to evaluate topology-based coding of fingerprints and matching algorithms for comparing single fingerprints. The topological approach (in a way that omits reference to distances and directions of ridges and bifurcations) makes it possible to avoid the detrimental effects of plastic distortion of prints caused by the elasticity of the human skin.
A-58

NBSPUB500-119
FUTURE INFORMATION TECHNOLOGY - 1984: TELECOMMUNICATIONS Peg Kay and Patricia Powell, Editors
Contains sections discussing the network architecture, underlying telecommunications' technologies, and input/output associated with telecommunications through 1999; three perspectives on the divestiture of AT&T; security in a distributed environment; and the management implications of the trends in Information technology. Companion to Spec Pub 500-103, Future Information Processing Technology, 1983.
NBSPUB500-103
FUTURE INFORMATION PROCESSING TECHNOLOGY - 1983 Peg Kay and Patricia Powell, Editors
Includes forecasts of computer hardware and software products through 1997, an over view of the U.S. information Industry and its expected future structure and a discus sion of implications for the user. Also included are sections dealing with estimates of future system costs, the impact of law and regulation on Federal ADP, and managing end user computing.
NBSPUB500-100
TOWARD AN IMPROVED FIPS COST-BENEFIT METHODOLOGY, PHASE IrDESCRIP- TIVE MODELS - DATA PROCESSING OPERATIONS By Marco Fiorello and Peter L. Elrich (Fiorello, Shaw and Associates) and Peg Kay
Presents a set of functional-flow models that can be used to categorize the operational activities of Federal data processing users.
NBSGCR 83-444
PROCEEDINGS-WORKSHOP ON STANDARDIZATION FOR SPEECH I/O TECHNOL OGY David S. Pallett, Editor
Includes papers and summaries of discussions of a workshop cosponsored by NBS and the Naval Air Development Center in March 1982. Assessment and measurement of the performance of speech I/O technology were the focus of discussions.
A-59

** NBSPUB500-89
AN AUTOMATED FINGERPRINT IDENTIFICATION SYSTEM By Joseph H. Wegsteln
Describes an automated process developed for the Federal Bureau of Investigation to compare data from fingerprints and to determine whether two fingerprints Impressions were made by the same finger.
** NBSIR 75-687
EFFECTIVE USE OF COMPUTING TECHNOLOGY IN VOTE TALLYING By Roy G. Saltman
Describes hardware, software, and administrative problems encountered in conducting computerized elections. Recommends techniques for audits, physical controls over bal lots and computer records, management of computer programs, facilities, and teleprocessing to improve accuracy and security of the vote tallying processes.
** NBSPUB500-17
COPYRIGHT IN COMPUTER-READABLE WORKS: POLICY IMPACTS OF TECHNOLOGI CAL CHANGE By Roy G. Saltman
A reference document on copyright issues. Contains the findings, recommendations, and conclusions of a policy-oriented, multidisciplinary study conducted in 1974-76.
** NBSIR 86-3416
SIMPLE MULTIPROCESSOR PERFORMANCE MEASUREMENT TECHNIQUES AND EX AMPLES OF THEIR USE By Alan Mink, John W. Roberts, Jesse M. Draper, and Robert J. Carpenter
This report describes simple hardware techniques for the measurement of the perfor mance of multiprocessor computers. A number of examples of data obtained using these techniques are reported, as well as a discussion of the timing accuracy obtainable with this approach.
A-60

** NBSIR 86-3395
NATIONAL BUREAU OF STANDARDS WORKSHOP ON PERFORMANCE EVALUATION OF PARALLEL COMPUTERS By Sandra B. Salazar and Carl H. Smith
Report of a workshop held on June 5 and 6, 1985 to discuss techniques for the measurement and evaluation of parallel computers. Experts from industry, govern ment, and academia presented position papers and reported on experiences with paral lel computers.
** NBSIR 85-3296
PERFORMANCE MEASUREMENT TECHNIQUES FOR MULTIPROCESSOR COM PUTERS By John W. Roberts
Various methods for measuring the performance of multiprocessor computers are dis cussed in this publication. The various aspects of a system that can be measured in clude processor, memory caches and local memory, switching networks buses, queues, processes, variables, instructions, and other conditions. Measurements can be used to evaluate overall performance, improve performance, and improve future designs of mul tiprocessor systems.
** NBSPUB500-123
GUIDE ON WORKLOAD FORECASTING By Helen Letmanyi
Forecasting is an essential planning tool that enables managers to predict future ADP workloads and computing resource requirements. This guide presents information about quantitative techniques that can be used for forecasting workload requirements. Criteria for selecting a particular technique are discussed. Then a step-by-step ap proach is presented to enable managers to use forecasting techniques effectively in plan ning for future computing requirements.
** NBSPUB500-113
ASSESSMENT OF TECHNIQUES FOR EVALUATING COMPUTER SYSTEMS FOR FEDERAL AGENCY PROCUREMENTS By Helen Letmanyi
This reports helps users identify and assess techniques to evaluate computer systems. Subjects discussed include the criteria by which alternative evaluation techniques may be compared and selected. The concepts presented are applicable to all sizes of general- purpose computers, from microcomputers to mainframes.
A-61

** NBSPUB500-60
SIZING DISTRIBUTED SYSTEMS: OVERVIEW AND RECOMMENDATIONS By Sandra A. Mamrak
Discusses tools and techniques for configuring computer hardware and software com ponents of distributed systems to meet functional and capacity demands of a given workload.
** NBSPUB500-53
TECHNOLOGY ASSESSMENT: ADP INSTALLATION PERFORMANCE MEASUREMENT AND REPORTING By Carol B. Wilson
Evaluates the Federal government's computer performance management practices. Recommends the development of standard performance measures, a government-wide data base of normative performance values, and statistical computer performance evaluation techniques.
** NBSPUB500-43
A GUIDE TO MAJOR JOB ACCOUNTING SYSTEMS: THE LOGGER SYSTEM OF THE UNIVAC 1100 SERIES OPERATING SYSTEM ByJ. M. Mohr.A. K. Agrawala and J. F. Flannagan
Describes the use of Logger, the job accounting system supplied by UNIVAC for its 1100 Series Operating System. Level 32, for collecting information about the performance characteristics of the system. The structure of the accounting log system and the infor mation contained in the log tapes are analyzed.
** NBSPUB500-40
GUIDELINE ON MAJOR JOB ACCOUNTING SYSTEMS: THE SYSTEM MANAGEMENT FACILITIES (SMF) FOR IBM SYSTEMS UNDER OS/MVT
Analyzes the workings of the IBM job accounting system, its capabilities and limitations in collecting performance data, how to install and operate it, and how to interpret the flies and records it collects. An aid to evaluating and improving the performance of IBM 360/370 systems through the use of job accounting system data.
A-62

** NBSPUB500-38
FINDINGS OF THE STANDARD BENCHMARK LIBRARY STUDY GROUP By Dennis M. Conti
Findings of a government-Industry study group investigating the feasibility of standard benchmark programs for testing computer systems in competitive procurement actions. Discusses phases of the benchmark process such as workload definition and benchmark construction, and suggests areas for future investigations.
A-63

APPENDIX B
GLOSSARY OF TERMS
Terms are defined here only as used In this document. This glossary is Intended to serve the reader who may be unfamiliar with some of the terminology associated with geographic information systems. Rapid advances In computer technology make it vir tually Impossible to provide concise, yet widely recognized definitions for the wide range of applications and operations being conducted with geographic information systems today. Users of this document should keep this In mind when using this glossary.
accuracy - degree of conformity with a standard, or the degree of correctness attained In a measurement. Accuracy relates to the quality of a result, and is distinguished from precision which relates to the quality of the operation by which the result is ob tained.
accuracy requirement - statement of how accurate the desired results must be to sup port a particular application.
accuracy standards - specifications that set up standards to which the finished product must adhere.
aggregation operations - process of bringing together many distinct parts or categories of data Into one grouping, usually as a composite display.
algorithm - statement of the steps to be followed in the solution of a problem.
alphanumeric string - string of information consisting of both letters and numbers, and possibly Including other symbols such as punctuation marks and mathematical sym bols.
American National Standards Institute (ANSI) - organizes committees of computer users, manufacturers, etc., to develop and publish Industry standards. ANSI standards are used by U.S. firms as guidelines, although they may be modified.
analysis - methodological Investigation of a problem by a consistent procedure, and its separation into related units for further detailed study.
analytical products - products made with the use of analytic techniques.
ancillary data - auxiliary or supplementary data.
B-1

arc data - data representing the location of linear features or the borders of polygon fea tures.
area - a level of spatial measurement referring to a two-dimensional defined space. A polygon on the earth as projected onto a horizontal plane Is an example of an area.
aspect - horizontal direction In which a slope faces, commonly expressed as the direc tion clockwise from north.
aspect categories - classification of an aspect Into a grouping based on cardinal com pass direction or a range of degrees.
attribute - descriptive characteristic or quality of a feature. An attribute value Is a measurement assigned to an attribute for a feature instance.
attribute tagging - process of assigning an attribute to a particular feature.
automatic clipping/joining - system capability for copying small portions of a data base for movement and placement elsewhere in the data base without operator intervention.
automatic polygon centroid calculation - system capability for determining the center of a polygon area without operator intervention. Usually associated with automatic label placement.
automatic snapping - system capability for completing a line segment whose end ap proaches a predefined threshold of closeness to an intersection or node, without any operator intervention.
azimuth - horizontal direction of a line measured clockwise from a reference plane, usually the meridian.
base line - a starting point from which future Improvements will be compared.
base data - basic level of map data on which other information is placed for purposes of comparison or geographical correlation.
bearing - horizontal angle at a given point measured clockwise from a specific reference datum to a second point.
benchmark - a series of tests for ensuring that hardware and/or software meets user needs.
Boolean retrievals - search strategy for information retrieval based on the use of the logi cal operators AND, OR, and NOT to represent symbolic relationships.
browsing - system capability to find an undefined feature or set of features in a database.
centroid - a point interior to a polygon whose coordinates are the averages of the cor responding coordinates for all points included in the given area.
B-2

chromatic - of or relating to color or color phenomena; multicolored.
clustering operations - operations allowing one to agglomerate (cluster) individual items or features into groups.
compression - a series of techniques used for the reduction of space, bandwidth, cost, transmission, generating time, and the storage of data. These techniques are designed for the elimination of repetition, removal of irrelevancies, and the employment of special coding techniques, such as run-length encoding.
computer aided design fCADl - software with the capability of assisting the operator to perform standard engineering and architecture design functions.
computer aided mapping fCAMl - software with the capability of assisting the operator to perform standard mapping functions.
computer-compatible format - data in a format which can be readily input into a com puter.
confidence Interval - statement of accuracy based on a statistic whose distribution func tion is known; for example, the normal distribution function or bivariate normal dis tribution function. Errors are stated as some percentage of the total probability of 100 percent, for example, a 90 percent assurance level.
connectivity analysis - analytical technique to determine whether a set of points (nodes) or lines are connected to each other.
contiguity analysis - analytical technique to determine whether a set of areas (polygons) are situated next to each other. Sometimes referred to as adjacency analysis.
contour - an imaginary line on the ground, all points of which are at the same elevation above or below a specified datum surface, usually mean sea level.
control point - any station in a horizontal or vertical control network that is identified in a data set or photograph and used for correlating the data shown in that data set or photograph.
coordinate pair - set of cartesian coordinates describing the two-dimensional location of a point, line, or area (polygon) feature in relation to the common coordinate system of the data base.
coordinate systems - a particular kind of reference frame or system, such as plane rec tangular coordinates or spherical coordinates, that use linear or angular quantities to designate the position of points within that particular reference frame or system.
corner joins - the location where three or more contiguous map sheets come together.
cost/benefit ratio - ratio obtained from the detailed evaluation of the costs and benefits arising from some investment or operation.
B-3

CPU time - actual computational time necessary to process a set of instructions In the arithmetic and logic units of the computer.
cross-section - a section taken normal to the direction of a proposed centerline which can be used to determine new contour or altered contour plots or volumes from cross sections taken at regular intervals or break points.
currency - an assessment of whether the information portrayed actually reflects the cur rent situation.
data base - a collection of information related by a common fact or purpose.
data base creation - process of bringing data into the electronic environment of a data base for later use.
data base development - process of determining what elements will be included in a data base and their internal relationships.
data base management system - software designed to access and structure a data base.
data capture - series of operations required to encode data in a computer-readable digi tal form (digitizing).
data dictionary - repository of information about the definition, structure, and usage of data. It does not contain the actual data.
data display - visible representation of data on a console screen in the form of a report, graph, or drawing.
data element - a specific item of information appearing in a set of data.
data encoding - to apply a code, frequently one consisting of binary numbers, to repre sent individual or groups of data. Sometimes used as data capture.
data entry - process of loading data in a computer-compatible format directly into a data base.
data category flayer) - refers to data having similar characteristics being contained in the same data set (for example, roads, rivers). Usually information contained in one data category is related and is designed to be used with other categories.
data manipulation - the performance of those data processing chores common to most users, such as sorting, input/output operations, and report generations.
data quality - refers to the degree of excellence exhibited by the data in relation to its portrayal of the actual phenomena.
data reduction - process of transforming masses of raw data into useful, ordered, or simplified intelligence.
B-4

data set - collection of similar and related data records that are recorded for use by a computer.
data structure - organization of data, particularly the reference linkages among data ele ments.
data topology - refers to the order or relationship of specific items of data to other items of data.
decompress - process by which compressed data is expanded to its former file size.
digital data - of or relating to data in the form of digits; data displayed, recorded, or stored In binary notation.
digital data set - collection of similar and related data records that are recorded for use by a computer.
digital elevation model fDEMl - a file with terrain elevations recorded at the intersec tions of a fine grid and organized by quadrangle to be the digital equivalent of the eleva tion data on a topographic base map.
digital terrain model fDTM) - a land surface represented In digital form by an elevation grid or lists of three-dimensional coordinates.
digitizing - process of converting an analog Image or map into a digital format usable by a computer.
display - graphic presentation of the output data of any device or system.
dissolve - refers to the process of removing shared common attributes by eliminating the shared boundaries when merging two or more polygons.
distance measure - ability to measure the distance between selected locations or points. May include perimeter, path length, distance to nearest neighbor, or search distances.
distributed data base - data base with unique components in geographically dispersed locations linked through a telecommunications network.
edge matching - the comparison and graphic adjustment of features to obtain agree ment along the edges of adjoining map sheets.
editing - inserting, deleting, and changing attribute and geometric elements to correct and/or update model or data base.
elapsed time - actual clock time taken to complete a command or operation, as opposed to CPU time.
encoding - process of converting data (text or spatial) to a form that is usable by a com puter program.
B-5
encoding scheme - system used to make the data usable by a particular computer program.
entities - items about which Information is stored. May be tangible or intangible. Are further defined by attributes.
error analysis - analytical technique to determine the amount of deviation from a stand ard or specification.
export - process of transferring data or software from one system to another system.
extract information - to copy from a set of items all those items which meet a specified criterion.
feature - a set of phenomena with common attributes and relationships. The concept of feature encompasses both entity and object.
feature attribute - also called a feature object. An element used to represent the non- positional aspects of an entity.
feature positional information - refers to information representing the location of an en tity or object within a specified reference system.
Federal Information Processing Standards fFIPS) - official source within the Federal Government for Information processing standards. Developed by the Institute for Com puter Sciences and Technology at the National Bureau of Standards.
fidelity - degree with which the system accurately reproduces the data Input into it.
file structuring - logical form of a file that results from applying a particular file or ganization and layout to a group of records.
format - predetermined arrangement of characters, fields, lines, punctuation, page num bers, etc.
format checking - process of examining the format of the data input into the data base to ensure it is in a format usable by the system.
format conversions - converting data in one format Into a format usable by another sys tem.
generalize - reduce detail in the model, that is, resampling to larger spacing or reduc tion of points in a line.
generate - derive a desired outcome by the application of one or more operations to the original model.
B-6

geographic information system - system of computer hardware, software, and proce dures designed to support the capture, management, manipulation, analysis, modeling, and display of spatially referenced data for solving complex planning and management problems.
geometric correction - transforming data to ground or image space in a known coor dinate system.
government technical representative fGTRl - provides technical instruction and over sight under designated contracts. Also referred to as the Contracting Officer's Techni cal Representative (COTE?) within some agencies.
gradient - rate of rise or fall of a quantity against horizontal distance expressed as a ratio, decimal, fraction, percentage, or the tangent of the angle of inclination.
graphic entities - entities which are graphically portrayed as geometric shapes or sym bols on the source document.
grid - a network of uniformly spaced horizontal and perpendicular lines which enclose an area (a cell) with an associated value assigned.
hard copy - printed paper or film copy of machine output in a visually readable form such as printed reports, listings, graphs, drawings, maps, or summaries.
horizontal control - network of stations of known geographic or grid positions referred to a common horizontal datum, which control the horizontal positions of mapped fea tures with respect to parallels and meridians, or northing and easting grid lines shown on the map.
image processing - encompasses all the various operations that can be applied to image format data. These include, but are not limited to, image compression, image restora tion, image enhancement, image rectification, preprocessing, quantization, spatial filter ing, and other image pattern recognition techniques.
Import - process of bringing data or software from another system into a system.
interactive - refers to a system allowing two-way electronic communication between the user and the computer.
internal data structure - organization within the system of data and particularly, the reference linkages among data elements.
International Organisation for Standardization (ISQ1 - international body which promotes standardization through agreements with national standardization authorities.
intersection - the coexistence of end points at a specific geographic location; the set of all objects common to two or more intersecting sets.
B-7

irregular line - a complex line which cannot be easily described by a mathematical poly nomial.
islands - refers to polygons completely enclosed within another polygon.
Join - area where two or more adjacent maps or Images are brought together to form a continuous model.
junction - refers to the point (node) where two or more line segments join together.
labelling - process of assigning attributes to polygons.
layers - refers to the various "overlays" of data, each of which normally deals with one thematic topic. These overlays are registered to each other by the common coordinate system of the data base.
least-squares adjustment - method of adjusting observations in which the sum of the squares of all the deviations or residuals derived in fitting the observations to a mathe matical model is minimized. Such an adjustment is based on the assumption that blunders and systematic errors have been removed from the data, and that only ran dom errors remain.
line - a level of spatial measurement referring to a one-dimensional defined object having a length, direction, and connecting at least two points. Examples are roads, rail roads, telecommunication lines, streams, etc.
lineage - information about the data source, particularly the original scale, and ac curacy.
local area rubbersheeting - topological process of stretching or shrinking a subarea or portion of a map or image to fit in registration with selected control points.
logical consistency - refers to the topologic structure of the data within a data base and its ability to relate spatial elements to each other without contradictions.
maintainability - capacity for making updates in an efficient and cost-effective manner to a data base or software.
manually digitized - refers to the process of converting an analog map or other graphic overlay into numeric format with the use of a digitizing table/tablet and manually trac ing the input data with a cursor.
manually encoded - refers to the process of data input, including tabular and attribute information, into a computer-compatible format through the use of direct operator inter action with collection and/or storage system peripherals.
map boundaries - lines that bound the body of a map, usually parallels and meridians. Also referred to as neatlines or sheet lines.
B-8

map projection - systematic drawing of lines of a plane surface to represent the paral lels of latitude and the meridians of longitude of the Earth.
mathematical adjustment - mathematical procedures for the application of corrections to observations, for the purpose of reducing errors or removing internal inconsistencies in derived results.
merge - to take two or more maps or data sets and combine them together into a single, coherent map or data base without redundant information.
model - representation of reality in a numeric format capable of being displayed and manipulated.
monochromatic - only in one color on a contrasting background.
multidimensional numeric models - representation of reality in a numeric format show ing two or more dimensions which are capable of being displayed and manipulated.
neighborhood analysis - analytical techniques used to determine relationships between a point location and its n-th order neighbors.
network analysis - analytical techniques concerned with the relationships between loca tions on a network, such as the calculation of optimal routes through road networks, capacities of network systems, or best location for facilities along networks.
off-line - transmission of information between a computer and a peripheral unit before or after, but not during, processing, in contrast to on-line processing.
on-line - transmission of information between a computer and a terminal or display device while processing is occurring, in contrast to off-line processing.
orthographic - refers to the representation of related views of an object as if they were all geometrically projected upon a plane with a point of projection at infinity.
output - anything that comes out of a computer to any other device.
overlay - data layer, usually dealing with only one aspect of related information, which is used to supplement the data base. Overlays are registered to the base data by a com mon coordinate system.
- small area of information spliced into a data base in order to update, complete, or densify the data content.
perspective view - three-dimensional representation generated with reference to a specific viewer location on or above the surface portrayed.
photogrammetrirally digitized - digitized from aerial photographs and geodetic control data by means of photogrammetric instruments, providing three-dimensional coor dinates.
B-9

pixel - short for "picture element." The smallest discrete element which makes up an image.
planimetric base mapping - map prepared from aerial photographs by photogrammetric methods, as a guide or base for contouring.
planimetric data - spatial data that do not take topographic relief information into ac count for establishing position.
point - a level of spatial definition referring to an object that has no dimension. Map ex amples include wells, weather stations, and navigational lights.
polygonlzation - process of connecting together linear feature information into polygons.
positional accuracy - term used in evaluating the overall reliability of the positions of cartographic features relative to their true position, or to an established standard.
preprocessing - preliminary transformation of raw data required to facilitate further car tographic processing.
product generation - refers to producing a desired product through the application of one or more operations; usually a hardcopy product.
projection change - procedure to transfer features from one projection surface to the corresponding position on another projection surface by graphical or analytical methods.
proximity - measure of closeness to a specified point as defined by a user.
proximity analysis - analytical technique used to determine the relationship between a selected point and its neighbors.
proximity search - analytical procedure to identify occurrences of predefined data ele ments in the neighborhood of a selected point.
quad corner areas - user-defined measure relating to the portion of a quadrangle map ping sheet where it joins two or more other sheets.
quality control - process of taking steps to ensure the quality of data or operations is in keeping with standards set for the system.
quick-look plot - a "draft" plot done very fast, which may not adhere to the positional ac curacy or symbolization of the final plot.
radiometrlc calibration - refers to the procedure in image processing of determining the quantitative relation of how a multispectral image appeared from the sensor system with the input values it was intended to measure.
raster - pattern of horizontal, parallel scan lines comprising the image on a cathode ray tube screen, on which each scan line consists of segments varying in intensity.
B-10

raster refresh display - cathode ray tube on which the image is displayed in raster for mat and which must be refreshed by a new pass of the electron beam about 30 times a second.
recall - procedure which restores previous entry.
reclasslfy - procedure to change the classification of existing data.
rectification - process of projecting a tilted or oblique image onto a reference plane.
reference point - initialization of the frame of reference.
reformat - procedure to change the data format to one usable by the system.
repeatability - ability to consistently obtain the same results when conducting the same operation.
replace - procedure to replace all existing occurrences of a specified data element with a new data element.
Request for Proposals fRFPl - Government contracting document which specifies the re quirements of a procurement that contractors use to submit proposed solutions and cost information. Government bases contract award on the contractor response to the RFP.
rescale - adjustment of values or parameters representing magnitudes or intensity so that the data reflects an aspect more suited to the user.
resolution - measure of the ability of a display system to distinguish detail under cer tain specific conditions. The measure of this ability is normally expressed In lines per millimeter, meters per pixel, dots per inch, etc.
rubberband - ability to fix the ends of a line, or selected points along a line, in a static position and then "stretch" the line between the fixed points to establish new geometric shapes.
- ratio or fraction between the distance on a map, chart, or photograph and the corresponding distance on the surface of the Earth.
scanning - process of using an electronic input device to convert analog information from such as maps, photographs, or overlays, into a digital format usable by a com puter.
sequential - refers to data files in a serial order, that is, one file after another, usually stored on magnetic tape.
single photo resection /Intersection - procedure for determining position and orientation of the camera (resection) or ground location (intersection) photogrammetrically using a single photo and known control points.
B-11

site suitability analyses - analytical techniques used to present a coherent picture of how well a particular location is suited for a specific purpose. Generally involves analysis of a multitude of various types of interrelated information.
slivers - refers to polygons formed when two adjacent polygons do not abut along a single common line and leave a small space between the larger two.
slope - rate of rise or fall of a quantity against horizontal distance expressed as a ratio, decimal, fraction, percentage, or the tangent of the angle of inclination. Also called gradient.
source material - data of any type required for the production of mapping, charting, and geodesy products including, but not limited to, ground-control aerial and ter restrial photographs, sketches, maps, and charts; topographic, hydrographic, hyp- sographic, magnetic, geodetic, oceanographic, and meteorological information; intelligence documents; and written reports pertaining to natural and manmade fea tures of the area to be mapped or charted.
spatial analysis - analytical techniques associated with the study of the location of geographical entities together with their spatial dimensions. Also referred to as quan titative analysis.
spatial data - data pertaining to the location of geographical entities together with their spatial dimensions. Spatial data are classified as point, line, area, or surface.
spatial data bases - collections of spatial information related by a common fact or theme.
spatial data sets - collection of similar and related spatial data records that are recorded for use by a computer.
standards - an exact value, a physical entity, or an abstract concept, established and defined by authority, custom, or common consent to serve as a reference, model, or rule in measuring quantities or qualities, establishing practices or procedures, or evaluating results. A fixed quantity or quality.
stereo pair - two photographs having sufficient perspective overlap of detail to make pos sible stereoscopic examination of an object or an area common to both.
storage tube display - a CRT display on which an image can be stored on the screen for several minutes or longer with a single pass of the electron beam.
surface - a level of spatial measurement referring to a three-dimensional defined space. Examples include contours, isolines, bathymetry, etc.
surveying - process of data collection by observation and measurement.
symbolized points - points that are represented by an assigned symbol.
B-12
system model - representation of the Information types, directions of flow, production stages, and user Interfaces for a system.
tabular data - data In a row and column format.
terrain analysis - analytical techniques to determine the effect of terrain on a particular operation. Usually involves slope, soil types, and vegetation.
thematic topics - mapping categories consisting of a single type of data which are In tended to be used with base data.
thinning - process whereby a linear feature is generalized through the use of a series of rules that reduces the number of data points while maintaining the basic shape of the feature.
three-dimensional (3-D) data - volumetric data representing measurements in three dimensions, as angular or linear measures such as phi-lambda-kappa or latitude- longitude-elevation.
topographic analysis - analysis of the configuration of a surface, Including its relief and the position of streams, roads, cities, etc. Usually subdivided Into hypsography (the relief features), hydrography (the water and drainage features), culture (manmade fea tures), and vegetation.
topologic error checking - process of ensuring that the logical consistency of the data is intact, that is, all polygons are closed, all arcs are connected to nodes, etc.
topological - refers to such properties of geometric figures as adjacency that are not al tered by distortion as long as the surface is not torn.
topological relationships - refers to how data elements relate to each other within the data base. In particular, how a change to one element affects other elements.
topological structuring - process of organizing data topologically so that the relation ships and reference linkages are specified.
topological verification - process of verifying the topological relationship between data elements.
topology - a branch of geometrical mathematics which is concerned with order, con tiguity, and relative position, rather than actual linear dimensions.
transformation - conversion of coordinates between alternative referencing systems.
traverse data - data relating to a survey made using a method whereby lengths and directions of lines between points on the Earth are obtained by or from field measure ments, and used In determining position of the points.
B-13

triangulated irregular network - a data structure which describes a three-dimensional surface as a series of irregularly shaped triangles. Usually used in connection with ter rain modeling.
two-dimensional f2-D) data - areal data in two dimensions, such as northing-easting or latitude-longitude.
undo - refers to the ability to retract previous entry.
updating - refers to the capability to make changes or add new information to existing data.
user interface - method by which the human operator communicates with the various data base and applications modules.
user requirement analysis (URA) - study of the needs of potential system users.
vector - directed line segment, with magnitude commonly represented by the coor dinates for the pair of end points. Vector data refers to data in the form of an array with one dimension.
vector refresh display - cathode ray tube on which the image is displayed as a vector and which must be refreshed by a new pass of the electron beam about 30 times a second.
weight features - process of systematically increasing the value of a particular data ele ment or elements so as to give that element more significance in the analysis or calcula tions.
window - rectangular frame with a specified size and location on the screen of an inter active graphics system, and within which a rectangular portion, or window, of the map is displayed.
z-value data points - data points providing a value perpendicular or normal to a specified surface (elevation).
B-14

APPENDIX C
TECHNOLOGY EXCHANGE WORKING GROUP MEMBERSHIP
Stephen C. Guptill (Chairman)
Dan Cotter
Edwin I. DeLong Jr.
Martin Fish
Robert Gibson
Gorden E. Howard
Richard Liston
Charles K. Paul
Dave Pendleton
Elizabeth Porter
Earl Prechtel
Henry Tom
Timothy Trainor
U.S. Geological Survey Department of Interior
Federal Emergency Management Agency
Urban Mass Transportation Adm. Department of Transportation
U.S. Coast Guard Department of Transportation
Defense Mapping Agency Department of Defense
Environmental Protection Agency
Soil Conservation Service Department of Agriculture
U.S. Agency for International Development
National Ocean Service Department of Commerce
U.S. Army Department of Defense
Defense Mapping Agency Department of Defense
National Bureau of Standards Department of Commerce
Bureau of the Census Department of Commerce
C-1

Edward Partington Environmental Protection Agency
Pete VanWyhe Forest ServiceDepartment of Agriculture
John C. Stewart US Nuclear Regulatory Commission
William Liles Central Intelligence Agency
C-2 oU.S. G.P.O. 1988-201-933:80017