a profile and training needs ssessment of ... profile and training needs assessment of...
TRANSCRIPT

A PROFILE AND TRAINING NEEDS ASSESSMENTOF COMMUNITY/PUBLIC HEALTH PROFESSIONALS
IN WASHINGTON STATE
Northwest Center for Public Health Practiceand
Center for Health Education and Research
School of Public Health and Community MedicineUniversity of Washington
Funded by theHealth Resources Services Administration (HRSA)
January 1998

2
Principal Investigator: James Gale, MD
Project Director: Sheri Reder, MSPH, PhD
Project Coordinator: Laurie Conratt, MBA
Acknowledgments
Thanks to Janice Taylor, Training Manager, Washington State Department of Health(DOH), for collaborating on the development of the questionnaire and for managingcoordination with DOH.
Thanks to Vicki Kirkpatrick and Kay Koontz, of the Washington State Association ofLocal Public Health Officials (WSALPHO), for encouraging participation of the localhealth departments in this research.
Thanks to Mimi Fields, MD, Deputy Secretary, DOH, for providing ongoing support forthe training needs assessment and the development of innovative training programs forcommunity/public health professionals.
Thanks to Shawna Wakefield for her many hours of careful data entry.
Thanks to Virginia Kennedy, Center for Health Policy Studies, School of Public Health,The University of Texas Houston Health Science Center for sharing their questionnaireand the findings of their study, the Professional Public Health Workforce in Texas.
Thanks to the many managers and administrators within the Department of Health, localhealth departments, and community, migrant and Indian clinics who supported thisresearch by encouraging professional staff to respond to the questionnaire.
Thanks to the 1316 individuals who returned completed questionnaires.

3
Executive Summary
This report presents the findings of the first phase of a survey profiling community/publichealth professionals in Washington state and delineating their training needs. Thesefindings indicate that although the distribution of community/public health professionalsvaries among organizational settings, the training needs within these organizations andamong professional groups are similar.
For the purposes of this research, public health is defined as a broad array of organizedactivities directed at preventing illness, injury and disability, and promoting physical andmental health. Community/public health professionals include all those individuals whoprovide these services on a population level, or who provide health promotion and diseaseprevention services to individuals.
This research was conducted between April and November 1997. The survey sampleincluded all professional employees of the Washington State Department of Health(DOH), thirty-one (31) of the thirty-three (33) local health departments (LHDs) inWashington state, and approximately half the community, migrant and Indian clinics in theState. A mail questionnaire was sent to 2349 professional employees, 1316 surveys werecompleted and returned, for an overall response rate of fifty-six (56) percent.
The profile that emerges of these community/public health professionals is:• They are predominately White (85%) and college educated (89%).• About a quarter speak a language in addition to English (including almost half
of clinic employees).• They have worked in community/public health for an average of 8.8 years with
almost a third having worked in this field for over ten years.• There is great variation in the distribution of occupations among the three
organizational settings. For example DOH has only about nine (9) percentclinicians, LHDs forty-three (43) percent and clinics have about eighty (80)percent clinicians.
• Over twice as many respondents have managerial/supervisory responsibilities(49%), as those who categorize themselves as managers/administrators (22%).
• Almost three-quarters of respondents engage in two or more occupationalactivities, and about half engage in three or more activities (e.g., evaluation andresearch).
Communication skills are the most highly rated training needs. The top four trainingneeds identified, across organizations and occupations, are:
• interpersonal communication,• cross-cultural and cross-age communication,• electronic communication, and• participatory teaching/training skills.

4
Other training topics that are rated highly include: group facilitation, health promotion,quality improvement and assurance, written communication, community/programplanning, and community involvement/mobilization. In addition, data analysis andutilization and written communication are highly rated by health professionals other thanclinicians.
The first choice method of receiving training is on-site with an instructor, with regionaltraining with an instructor second, and mediated training methods only selected by a smallnumber of respondents.
Although the survey findings identify categories of training needs and preferred modes oftraining delivery, a more in-depth examination of training topics is needed prior to thedesign and implementation of training programs. Focus groups, with community/publichealth professionals, could be used to delineate the specific content of highly rated trainingtopics (e.g., interpersonal communication). Likewise these groups could be used toexplore circumstances in which professionals, who prefer in-person training, wouldpositively view mediated training (e.g., computer-based training).
Finally, this survey needs to be implemented among all organizations that providecommunity/public health services in Washington state. Although DOH, LHDs and clinicsare central components of the community/public health system, many other organizationsare also part of that system (e.g., hospitals, other State agencies such as the Department ofSocial and Health Services, and non-profit organizations). The information provided by atruly comprehensive profile and training needs assessment could be used to increase theefficiency and effectiveness of community/public health professionals by identifyingcommon areas where training is needed, and supporting training coordination andcollaboration among organizations and professional groups.

5
Table of ContentsPages
Executive Summary 3-4Background and Methods 6-8Profile Findings 10-21Training Needs Findings 22-25Discussion/Conclusions 26-27
TablesTable I: Questionnaire Response Rate 9Table II: Demographic Characteristics 11Table III: Community/Public Health Experience 12Table IV: Distribution of Occupational Categories 13Table V: Distribution of Grouped Occupational Categories 15Table VI: Highest Educational Level Attained by 17
Grouped Occupational CategoryTable VII: Occupational Activities Performed 21Table VIII: Mean Ratings of Training Topics 24Table IX: Mean Ratings of Training Topics by 25
Grouped Occupational Categories
ChartsChart I: Comparison of Managerial/Supervisory Responsibility 18
with Administrator/Manager Occupational StatusChart II: Percent of Respondents with Managerial/Supervisory 19
Responsibility by Grouped Occupational CategoryChart III: Number of Occupational Activities Performed 20Chart IV: First Choice Method of Receiving Training 23
AppendixAppendix A: Mean Rating of Training Areas by Grouped Occupational 28
Category for DOHAppendix B: Mean Rating of Training Areas by Grouped Occupational 29
Category for LHDsAppendix C: Mean Rating of Training Areas by Grouped Occupational 30
Category for clinics

6
Background and Methods
This report presents the findings of the first phase of a survey profiling community/publichealth professionals in Washington State and delineating their training needs. For thepurposes of this research, public health is defined as a broad array of organized activitiesdirected at preventing illness, injury and disability, and promoting physical and mentalhealth. Community/public health professionals include all those individuals who providethese services on a population level, or who provide health promotion and diseaseprevention services to individuals.
This is a time of change in the health care system. The traditional roles of the public healthprofessions are changing as direct patient care is de-emphasized and assessment andquality assurance roles are highlighted. This shift in roles is broadening the spectrum oforganizations which provide community/public health services so that many private andnon-profit providers, such as health maintenance organizations and managed care plans,are assuming responsibilities that were once entirely within the domain of governmentalpublic health agencies. This research contributes to an understanding of who is currentlyproviding community/public health in this State, and how those individuals perceive theirtraining needs. The findings of this survey are also a first step in exploring new models forproviding effective training including training across organizations and professionalcategories.
This research was conducted between April and November 1997. It is based on a similarsurvey conducted by the Center for Health Policy Studies, School of Public Health, TheUniversity of Texas Houston Health Science Center, 1996. The Texas work drew on theAmerican Public Health Association’s (APHA) effort to construct a comprehensive datasystem for monitoring public health personnel in the United States. Although both theTexas and Washington studies focus on public health, the primary purpose of the Texasstudy is to identify Workforce shortage areas while the central focus of the Washingtonstudy is to identify training needs. Still, there remains enough similarities in the two studiesthat meaningful comparisons could be made.
Survey SampleThe findings in this report include a profile and training needs assessment of professionals,in Washington State, who are employed by:
• Washington State Department of Health (DOH),• local health departments (LHDs), and• community, migrant and Indian clinics.

7
DOH, LHDs and clinics are included in the first round of this survey because professionalemployees in these organizations have been traditionally defined as the core providers ofpublic health services.
Other organizations that employ a significant number of community/public healthprofessionals, and should be included in next implementation of this survey, include:
• State agencies such as the Department of Social and Health Services and theDepartment of Ecology,
• hospitals, health maintenance organizations and health plans (e.g., managedcare),
• private, nonprofit or voluntary agencies (e.g., American Cancer Society).
Since a comprehensive list of private non-profit and voluntary health organizations inWashington state does not currently exist, the first phase of this project included startingto compile such as list. The county-specific list, to date, was distributed to identifiedorganizations. The next phase of this effort should include continued follow-up to developa comprehensive list of such organizations in this State.
There are two additional groups that should be re-evaluated for inclusion in the next roundof the survey - employee health organizations and school health services. Employee healthservices were not initially included because the services they offer are not population-based. However, large organizations (e.g., Boeing) provide considerable health services tonumerous employees, including wellness and prevention services which are conventionallywithin the domain of public health. It, therefore, may be appropriate to include theseorganizations in this research.
Public educational institutions are not included in this research because the training needsof professionals in educational settings is different from the needs of those in othercommunity/public health settings. However public schools provide a great deal ofwellness and prevention services to children and adolescents. A greater understanding ofhow their training needs mesh with those of other community/public health professionalscould be very beneficial. At a minimum, opportunities to compare existing data should beexplored and perhaps a training needs assessment, adapted for public school settings,could be developed.
Questionnaire DevelopmentThe basic instrument design is based on the questionnaire developed by the Center forHealth Policy Studies, School of Public Health, the University of Texas Houston HealthScience Center. However, many revisions to the questionnaire were made toaccommodate Washington’s emphasis on the identification of training needs. TheWashington questionnaire represents a collaborative effort of the Northwest Center forPublic Health Practice and the Washington State Department of Health (DOH), along withfeedback from representatives of local health departments and community clinics. In

8
addition, the questionnaire reflects the Public Health Improvement Plan (PHIP) and recentefforts of the Education and Training Activities Committee (ETAC). Before administeringthe questionnaire, it was also pretested with members of the target population and revisedaccording to their recommendations. (A copy of the questionnaire can be obtained fromthe Northwest Center for Public Health Practice, University of Washington.)
MethodsOverall, the survey response rate is fifty-six (56) percent. The survey was conducted as amail questionnaire to professional employees of the State Department of Health (DOH),local health departments (LHDs) and community, migrant and American Indian clinics.Upon request, each participating organization provided a list of their professionalemployees. Professional employees were identified by the employing organization asanyone in a position which requires at least a four year college degree.
The sample is stratified among the three major groups: DOH, LHDs and clinics. Inaddition, the sample among local health departments is further stratified by the number ofemployees in the health department and its location in either Eastern or WesternWashington. Professional employees in each organization are sampled using either arandom selection model or a one-hundred percent sample, depending on the size of theorganization. Every effort was made to ensure that the number of respondents for eachsubgroup would be large enough to conduct meaningful sub-analyses.
The questionnaire was mailed directly to each selected professional employee and areminder postcard was mailed about ten days after the questionnaire. In some cases, agiven organization or subgroup of organizations had a particularly low response rate andso the questionnaire was mailed a second time. Overall, the survey response rate is fifty-six (56) percent. Table I provides the number of employees who received questionnairesand their response rates by type of organization.

Table I Questionnaire Response Rate
Number of ProfessionalEmployees
Number ofQuestionnaires Sent
Number of CompletedQuestionnaires
Response Rate
WA State Dept. of Health 697 393 264 67%
Local Health Departments* 1843 1150 661 57%
Sea King 729 298 151 51%
Large Western WA 512 250 149 60%
Small Western WA 173 173 97 56%
Large Eastern WA 220 220 137 62%
Small Eastern WA 209 209 127 61%
Clinics** 806 806 391 49%
Total 3346 2349 1316 56%
*Of the 33 local health departments, all participated except for two small health departments. SeaKing is the only large local health department. Medium local health departments have more than 50 and less than 150 professional employees. Small local health departments have up to 50 professional employees.**Approximately 50% of the clinics in Washington State participated in this survey including the largest clinics such as SeaMar, Yakima Valley Farmworkers clinics and Puget Sound Neighborhood clinics. Many clinics that did not participate were very small (less than five professional employees).

10
Profile Findings
The demographic characteristics of community/public health professionals responding tothis survey are summarized in Table II. Of note:
• About eighty-nine (89) percent of respondents have at least a bachelors degreeincluding about a quarter with a master’s degree and over ten percent with a doctorateor medical degree.
• Almost three-quarters of respondents reported that they were licensed, certified orregistered in a health-related specialty. This is a high level of certification, particularlysince some of respondents are in fields (e.g., health planning) that do not havelicensure or certification.
• Over forty percent of DOH respondents are males, while only about a quarter of therespondents from LHDs and clinics are males.
• Over eighty-five (85) percent of respondents identify themselves as “White”. This isfairly consistent among DOH, LHD and clinic professional employees.
• Over a quarter of respondents speak a language other than English. Among clinicrespondents, almost half speak a second language.

Table IIDemographic Characteristics
(Respondents)
CharacteristicAll
Respondents DOH Local Health Departments Clinics
Highest Level Less Than High School 0.1% 0.0% 0.0% 0.3%
of Education High School of Equivalent 2.7% 6.7% 1.9% 1.6%
Completed Associate, 2-year Degree 8.0% 5.9% 6.7% 11.5%Bachelor's Degree 50.7% 43.3% 62.2% 36.9%Master's Degree 25.8% 37.0% 23.9% 20.9%Doctorate* 11.5% 6.7% 3.6% 28.0%Other 1.2% 0.4% 1.7% 0.8%
Licensed, Certified, Yes 72.8% 35.6% 77.7% 89.8%
or Registered in a No 27.2% 64.4% 22.3% 10.2%
Health-Related Specialty
Gender Male 28.4% 40.8% 24.1% 27.4%Female 71.6% 59.2% 75.9% 72.6%
Age Mean Age 43 45 44 41Under Age 35 19.3% 16.0% 15.6% 28.1%Ages 35-44 33.8% 29.2% 34.9% 35.3%Ages 45-54 36.4% 40.9% 39.7% 27.5%Ages 55-64 9.8% 13.6% 9.0% 8.3%Over Age 64 0.7% 0.4% 0.8% 0.8%
Race/Ethnicity American Indian or Alaskan Native 1.0% 0.8% 0.3% 2.3%Asian American or Pacific Islander 5.0% 3.5% 4.5% 6.8%Black/African American 1.9% 2.8% 2.0% 1.0%Hispanic/Latino(a) 3.4% 3.1% 1.2% 7.3%White 86.7% 87.0% 90.0% 80.7%Other 2.0% 2.8% 1.9% 1.8%
Speak Any Language Yes 28.6% 19.9% 21.6% 45.7%
Besides English? No 71.4% 80.1% 78.4% 54.3%
N=1326 n=264 n=661 n=391
*The doctorate category includes some individuals with professional doctorates (e.g., MDs), as well as those whose degrees are in academic fields (PhDs).

12
The mean length of time that respondents have worked as community/public healthprofessionals is 8.8 years. As illustrated in Table III, over a third of all respondents, ineach organizational setting, have been employed as community/public health professionalsfor five years or less, while almost another third are “long-term” community/public healthprofessionals having worked in the field for over ten years. DOH has the highestpercentage of “long-term” professionals, while the clinics have the highest percentage ofprofessionals with short tenure in community/public health.
Table III
Community/Public Health Experience
Years in Public/ All Department Local Health
Community Health Respondents of Health Departments Clinics
1-5 years 38.0% 32.6% 32.4% 51.9%
6-10 years 30.4% 28.6% 32.0% 29.0%
11-15 years 12.1% 9.4% 15.0% 8.6%
16-20 years 10.5% 12.5% 11.5% 6.6%
21+ years 9.0% 16.9% 9.1% 3.9%
Total N=1242 n=224 n=646 n=362
Mean Years 8.8 9.7 9.7 6.6
Table IV describes survey respondents by occupational categories. In order to clarify thedifferences among occupational categories they have been condensed into eight groups.Table V shows the distribution of survey respondents in these eight grouped occupationalcategories.
Overall the largest group of respondents, almost thirty (30) percent, identify themselves asmedical clinicians (e.g., MDs and RNs); however DOH has only five percent, LHDstwenty-eight (28) percent and clinics forty-five (45) percent. The trend is the same fornon-medical clinicians (e.g., psychologists and social workers) - the lowest percentage inDOH and the highest percentage in the clinics. However, the trend is reversed for healthplanners/communications specialists, managers/administrators and quantitativeresearchers. In these occupational categories DOH has a much higher percentage ofprofessionals than either the LHDs or the clinics. It is also noteworthy, but not surprising,that the largest percentage of environmental health professionals reside in the LHDs.

Table IVDistribution of Occupational Categories
(Respondents)
All Department Local Health
Respondents of Health Departments ClinicsOccupational Category* (%) (f) (%) (f) (%) (f) (%) (f)
Administrator 6.2% (80) 8.4% (21) 5.2% (34) 6.2% (24)
Manager 15.9% (207) 30.7% (77) 14.6% (95) 8.8% (34)
Auditor, Inspector, or Surveyor 1.7% (22) 7.6% (19) 0.5% (3) 0.0% -
Behavioral Researcher 0.5% (6) 0.8% (2) 0.3% (2) 0.5% (2)
Biostatistician, Epidemiologist 1.6% (21) 4.0% (10) 1.5% (10) 0.3% (1)
Community Organizer/Involvement Specialist 2.2% (28) 0.0% - 3.7% (24) 0.8% (3)
Disease Investigator 0.8% (10) 0.4% (1) 1.4% (9) 0.0% -
Environmental Health Specialist 12.2% (159) 8.4% (21) 20.0% (136) 0.0% -
Health Care Consultant 3.5% (45) 10.4% (26) 2.6% (17) 0.5% (2)
Health Communications Specialist 2.1% (27) 2.8% (7) 2.9% (19) 0.3% (1)
Health Planner/Policy Analyst 1.7% (22) 6.4% (16) 0.9% (6) 0.0% -
Information/Computer Management** 0.5% (6) 1.6% (4) 0.9% (2) 0.0% -
Laboratory Scientist 3.5% (46) 9.6% (24) 2.0% (13) 2.3% (9)
Medical Clinicians 29.0% (377) 5.2% (13) 28.4% (185) 45.4% (176)
Non-Medical Clinicians 18.0% (237) 3.6% (9) 14.1% (92) 34.8% (135)
Occupational Health Specialist 0.3% (4) 0.0% - 0.5% (3) 0.3% (1)
Other 0.2% (4) 0.4% (1) 0.3% (2) 0.0% -
N=1300 n=251 n=652 n=388
*See definitions on page 14.**Information/Computer Management was the only write-in category that received more than one response.
14
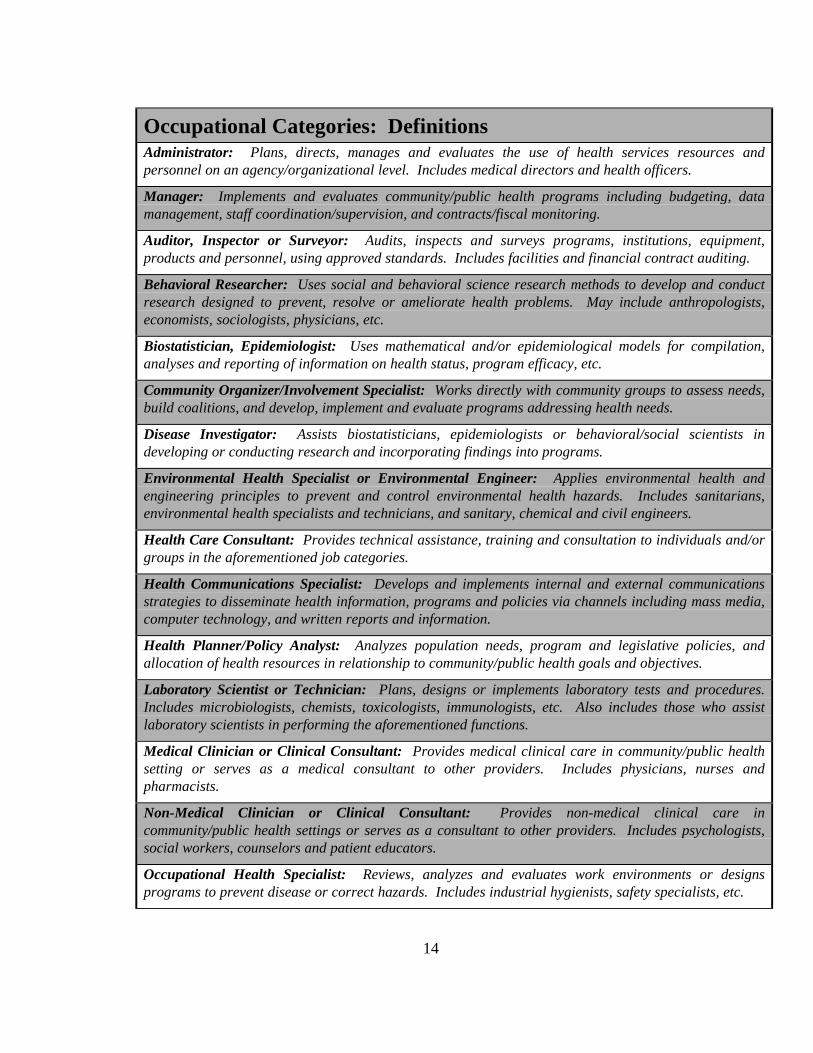
Occupational Categories: DefinitionsAdministrator: Plans, directs, manages and evaluates the use of health services resources andpersonnel on an agency/organizational level. Includes medical directors and health officers.
Manager: Implements and evaluates community/public health programs including budgeting, datamanagement, staff coordination/supervision, and contracts/fiscal monitoring.
Auditor, Inspector or Surveyor: Audits, inspects and surveys programs, institutions, equipment,products and personnel, using approved standards. Includes facilities and financial contract auditing.
Behavioral Researcher: Uses social and behavioral science research methods to develop and conductresearch designed to prevent, resolve or ameliorate health problems. May include anthropologists,economists, sociologists, physicians, etc.
Biostatistician, Epidemiologist: Uses mathematical and/or epidemiological models for compilation,analyses and reporting of information on health status, program efficacy, etc.
Community Organizer/Involvement Specialist: Works directly with community groups to assess needs,build coalitions, and develop, implement and evaluate programs addressing health needs.
Disease Investigator: Assists biostatisticians, epidemiologists or behavioral/social scientists indeveloping or conducting research and incorporating findings into programs.
Environmental Health Specialist or Environmental Engineer: Applies environmental health andengineering principles to prevent and control environmental health hazards. Includes sanitarians,environmental health specialists and technicians, and sanitary, chemical and civil engineers.
Health Care Consultant: Provides technical assistance, training and consultation to individuals and/orgroups in the aforementioned job categories.
Health Communications Specialist: Develops and implements internal and external communicationsstrategies to disseminate health information, programs and policies via channels including mass media,computer technology, and written reports and information.
Health Planner/Policy Analyst: Analyzes population needs, program and legislative policies, andallocation of health resources in relationship to community/public health goals and objectives.
Laboratory Scientist or Technician: Plans, designs or implements laboratory tests and procedures.Includes microbiologists, chemists, toxicologists, immunologists, etc. Also includes those who assistlaboratory scientists in performing the aforementioned functions.
Medical Clinician or Clinical Consultant: Provides medical clinical care in community/public healthsetting or serves as a medical consultant to other providers. Includes physicians, nurses andpharmacists.
Non-Medical Clinician or Clinical Consultant: Provides non-medical clinical care incommunity/public health settings or serves as a consultant to other providers. Includes psychologists,social workers, counselors and patient educators.
Occupational Health Specialist: Reviews, analyzes and evaluates work environments or designsprograms to prevent disease or correct hazards. Includes industrial hygienists, safety specialists, etc.

Table VDistribution of Grouped Occupational Categories
(Respondents)
Grouped All Department Local HealthOccupational Respondents of Health Departments ClinicsCategory* (%) (f) (%) (f) (%) (f) (%) (f)
Auditor/Inspector/Surveyor 1.7% (22) 7.6% (19) 0.5% (3) 0.0% -
Environmental/Occupational Health 12.5% (163) 8.4% (21) 21.3% (139) 0.3% (1)
Health Planners/Communication Specialist 9.4% (122) 19.5% (49) 10.1% (66) 1.5% (6)
Lab Scientist 3.5% (46) 9.6% (24) 2.0% (13) 2.3% (9)
Manager/Administrator 22.1% (287) 39.0% (98) 19.8% (129) 14.9% (58)
Medical Clinicians 29.0% (377) 5.2% (13) 28.4% (185) 45.4% (176)
Non-Medical Clinicians 18.2% (237) 3.6% (9) 14.1% (92) 34.8% (135)
Quantitative Researcher 3.3% (43) 6.8% (17) 3.5% (23) 0.8% (3)
Other 0.2% (3) 0.4% (1) 0.3% (2) 0.0% - N=1300 n=251 n=652 n=388
*Grouped occupational categories definitions: Auditor/Inspector/Surveyor = unchanged Environmental/Occupational Health + occupational health specialist + environmental engineer Health Planner/Communication Specialist = health communication + community organizer/involvement specialist + health care consultant + health planner/policy analyst Lab Scientist = unchanged Manager/Administrator = manager + administrator Medical Clinicians = clinicians with medically-related degrees (e.g., MDs and RNs) Non-Medical Clinicians = clinicians with professional degrees (e.g., psychologists and social workers) Quantitative Researcher = biostatistician/epidemiologist + disease investigator + behavioral researcher + information/computer manager

16
As illustrated in Table VI, in all professional groups at least two-thirds of respondentshave at least a bachelors degree. Four occupational categories had at least fifteen (15)percent of respondents with less than a bachelors degree: information/computermanagement, non-medical clinicians, health care consultants and managers. The highesteducational level is attained by four occupational categories in which at least one quarterof respondents had a PhD or MD: administrators, behavioral researchers,biostatisticians/epidemiologists, and medical clinicians. (See Table VI.)
The mean number of years of managerial/supervisory responsibility among respondents isseven years. Although only twenty-two (22) percent of survey respondents categorizethemselves as administrators or managers, almost half of respondents report that they havesome supervisory responsibility. Chart I illustrates that for each employer type thepercentage of professionals who have managerial/supervisory responsibility is muchgreater than the percentage of those who identify themselves as managers oradministrators. (See Chart I.) Chart II illustrates the varying extent ofmanagerial/supervisory responsibility among professionals in each occupational category.

Table VIHighest Education Level Attained by Occupational Category
(All Respondents)
Occupational Category High School Associate Bachelor Master Doctorate Other n =
Administrator 1.3% 7.6% 29.1% 36.7% 24.1% 1.3% 79
Manager 7.1% 8.1% 46.2% 34.0% 3.6% 1.0% 197
Auditor, Inspector, or Surveyor 0.0% 0.0% 45.5% 45.5% 9.1% 0.0% 22
Behavioral Researcher 0.0% 0.0% 0.0% 50.0% 50.0% 0.0% 6
Biostatistician, Epidemiologist 0.0% 0.0% 38.1% 28.6% 28.6% 4.8% 21
Community Organizer/Involvement Specialist 0.0% 0.0% 44.4% 48.1% 0.0% 7.4% 27
Disease Investigator 0.0% 0.0% 66.7% 33.3% 0.0% 0.0% 9
Environmental Health Specialist 1.9% 1.3% 74.4% 21.8% 0.6% 0.0% 156
Health Care Consultant 2.3% 20.9% 46.5% 27.9% 2.3% 0.0% 43
Health Communications Specialist 0.0% 0.0% 73.1% 26.9% 0.0% 0.0% 26
Health Planner/Policy Analyst 4.5% 4.5% 18.2% 63.6% 9.1% 0.0% 22
Information/Computer Management 0.0% 16.7% 83.3% 0.0% 0.0% 0.0% 6
Laboratory Scientist 4.5% 6.8% 68.2% 15.9% 2.3% 2.3% 44
Medical Clinicians 0.0% 0.5% 54.6% 17.1% 25.5% 2.2% 368
Non-Medical Clinicians 4.0% 27.0% 39.8% 24.8% 4.0% 0.4% 226
Occupational Health Specialist 0.0% 0.0% 50.0% 50.0% 0.0% 0.0% 4
Occupations with more than 25% of respondents attaining a PhD or MD
Occupations with at least 15% of respondents only attaining a high school or associate degree

Chart IComparison of Managerial/Supervisory Responsibility with
Administrator/Manager Occupational Status
49.2%
53.6%
43.8%
55.6%
22.1%
39.0%
19.8%
14.9%
0.0%
10.0%
20.0%
30.0%
40.0%
50.0%
60.0%
All Respondents Department of HealthRespondents
Local Health DepartmentRespondents
Clinic Respondents
Employer
Val
id %
% with management/supervisory responsibility % who described self as manger/administrator

Chart IIPercent of Respondents with Managerial/Supervisory Responsibility by
Grouped Occupational Category
91.9%
41.4%37.0%
33.3% 35.5%32.0%
47.8%
27.3%
0.0%
10.0%
20.0%
30.0%
40.0%
50.0%
60.0%
70.0%
80.0%
90.0%
100.0%
Man
ager
/Adm
inis
trat
or
(n =
285
)
Non
-Med
ical
Clin
icia
ns (
n =
232
)
Med
ical
Clin
icia
ns
(n =
373
)
Qua
ntita
tive
Res
earc
her
(n =
42)
Hea
lth P
lann
er/
Com
mun
icat
ion
Spe
cial
ist (
n =
121
)
E
nviro
nmen
tal/
O
ccup
atio
nal H
ealth
(n =
162
)
Lab
Sci
entis
t (n
= 4
6)
Aud
itor/
Insp
ecto
r/S
urve
yor
(n =
22)
Grouped Occupational Category
Val
id %
20
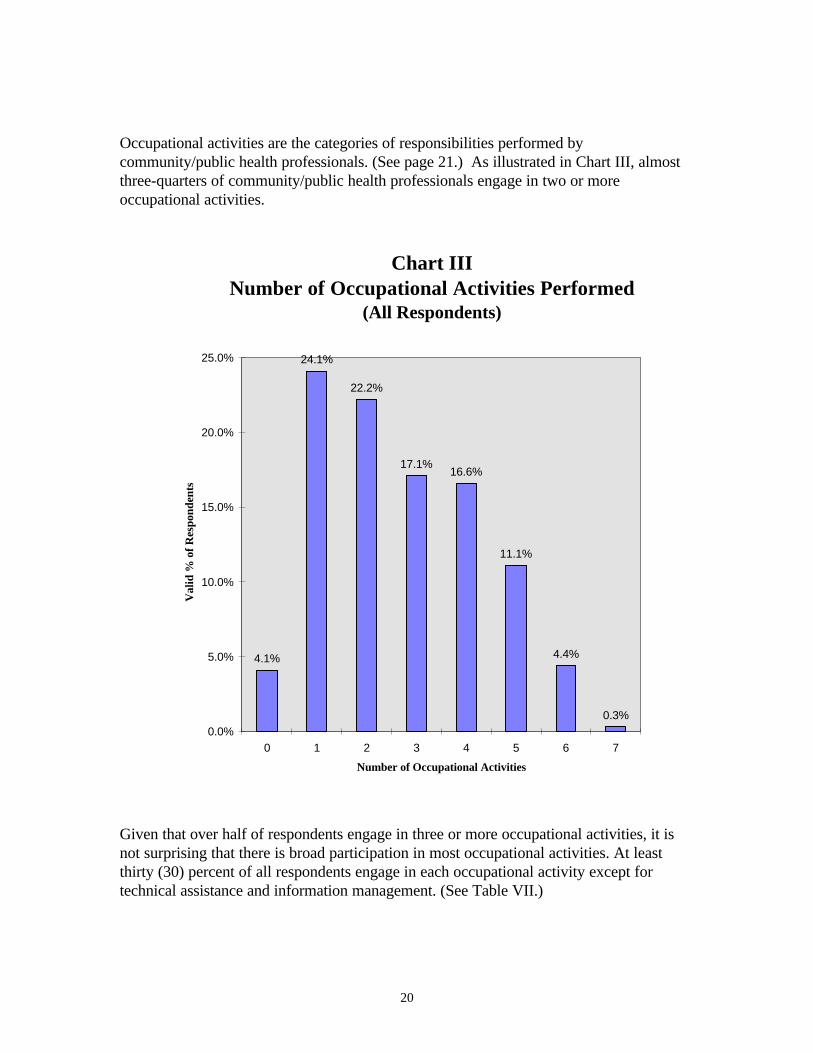
Occupational activities are the categories of responsibilities performed bycommunity/public health professionals. (See page 21.) As illustrated in Chart III, almostthree-quarters of community/public health professionals engage in two or moreoccupational activities.
Chart IIINumber of Occupational Activities Performed
(All Respondents)
4.1%
24.1%
22.2%
17.1%16.6%
11.1%
4.4%
0.3%0.0%
5.0%
10.0%
15.0%
20.0%
25.0%
0 1 2 3 4 5 6 7
Number of Occupational Activities
Val
id %
of
Res
pond
ents
Given that over half of respondents engage in three or more occupational activities, it isnot surprising that there is broad participation in most occupational activities. At leastthirty (30) percent of all respondents engage in each occupational activity except fortechnical assistance and information management. (See Table VII.)

Table VIIOccupational Activities Performed
Any Time on Activity
All Local Health
Occupational Activity Respondents DOH Department Clinics
Clinical Care, Patient Education and Consultation 62.3% 21.7% 58.8% 92.8%
Monitoring, Investigation and Surveillance 41.7% 54.9% 52.7% 15.2%
Administration and Management 56.0% 72.6% 51.0% 54.5%
Community Involvement and Planning 43.5% 42.2% 54.5% 25.7%
Communication, Public Education and Information 51.5% 61.8% 60.8% 29.6%
Evaluation and Research 30.1% 47.6% 34.8% 11.2%
*Technical Assistance and Information Management 1.5% 3.7% 1.4% 0.5%
N = 1300 n = 251 n = 652 n = 388
Occupational Activities: DefinitionsClinical Care, Patient Education and Consultation: Provides, coordinates or consults regarding patient clinical care including education, counseling, nutrition and socialwork.
Monitoring, Investigation and Surveillance: Assesses health and disease indicators for individuals and populations, or environmental quality (e.g., air and water quality,food, sanitation).
Administration and Management: Develops policy and regulations, staff coaching/supervision, team building, strategic plan development, financial planning and managingresources, etc.
Community Involvement and Planning: Works with communities to conduct needs assessments, develop plans, build coalitions and involve all populations including hard-to-reach groups.
Communication, Public Education and Information: Develops and implements internal (organizational) and external (community) information dissemination strategiesincluding mass media, information technology and interpersonal communication.
Evaluation and Research: Develops and conducts evaluation of existing community or environmental health programs or policies, or develops and conducts formativeresearch for development of new health programs and policies.
*Technical Assistance and Information Management: This category was not on the questionnaire. It was created because of frequent write-ins by respondents. Had this category been on the questionnaire, the percentage of people reporting involvement in this activity would certainly have been greater.

22
Training Needs Findings
As illustrated by Table VIII, communication skills are the most highly rated areas oftraining needs. The five training topics* that are the most highly rated by respondentsacross occupations and organizational settings are:
1. interpersonal communication,2. cross-cultural and cross-age communication,3. electronic communication,4. participatory teaching/training skills, and5. group facilitation.
Other training areas that are rated fairly highly include: health promotion, qualityimprovement and assurance, written communication, community/program planning, andcommunity involvement/mobilization.
An examination of training needs across occupational categories (See Table IX) supportsplacing top priority for training on:
- interpersonal communication,- cross-cultural and cross-age communication,- electronic communication, and- participatory teaching/training skills.
Each of the five largest occupational categories: (medical clinicians,managers/administrators, non-medical clinicians, environmental/occupational healthspecialists, and health planners/communication specialists) highly rated these trainingneeds. Group facilitation received less consistent ratings among these occupationalcategories and is rated lower by respondents from the smaller occupational categories (labscientist, quantitative researcher and auditor/inspector/surveyor).
It is also worth noting that two additional training topics, data analysis and utilization andwritten communication, are highly rated by health professionals other than medical andnon-medical clinicians.
__________________________* The questionnaire did not define the areas of training except noting that interpersonalcommunication includes mentoring and coaching, electronic communication includesInternet and INPHO, and group facilitation includes team building and leading meetings.

23
Finally, in an examination of preferred modes of receiving training, over half of surveyrespondents selected on-site training as their first choice. (See Chart IV) Regionaltraining is also preferred by almost forty (40) percent of respondents, while mediatedtraining, provided by an instructor, including computer-based training, two-wayaudio/video conferencing and satellite downlink conferencing were selected by only asmall number of respondents.
Chart IVFirst Choice of Receiving Training
(All Respondents)
56.3%
38.5%
7.4%
1.8% 2.5%
0.0%
10.0%
20.0%
30.0%
40.0%
50.0%
60.0%
On-SiteTraining
RegionalTraining
Computer-Based
Training
Two-WayAudio/VideoConference
SatelliteDownlink
Conference
Modes of Training
Val
id %

Table VIII Mean Ratings of Training Topics
All Local HealthTraining Topic Respondents DOH Departments Clinics
Clinical Skills 3.7 2.1 3.4 5.3
Environmental Health Skills 3.3 2.6 3.4 3.6
Laboratory Skills 2.6 2.2 2.5 3.2
Health Promotion/Disease Prevention 4.4 3.5 4.6 4.7
Overview Community/Public Health System 3.8 3.6 3.9 3.8
Finance and Personnel Management/Budgeting 3.4 3.7 3.4 3.2
*Group Facilitation 4.4 4.5 4.5 4.3
*Cross-Cultural and Cross-Age Communication 4.6 4.0 4.6 5.0
*Interpersonal Communication 4.7 4.6 4.7 4.7
Health and Risk Communication Strategies 3.9 3.8 4.2 3.5
Mediation and Negotiation 3.9 4.3 3.9 3.6
*Participatory Teaching/Training Skills 4.5 4.2 4.7 4.5
Community/Program Planning 4.2 3.7 4.4 4.0
Community/Involvement/Mobilization 4.2 3.5 4.5 4.1
Legislative/Policy Advocacy 3.7 3.8 3.8 3.3
Provision of Technical Assistance 3.7 4.0 3.8 3.2
*Electronic Communication 4.5 4.6 4.6 4.2
Data Analysis and Utilization 4.0 4.3 4.2 3.4
Survey Design and Implementation 3.6 3.7 3.9 3.0
Quality Improvement and Assurance 4.3 4.7 4.4 4.1
Disease Outbreak Investigation 3.2 2.5 3.7 2.9
Written Communication 4.2 4.3 4.5 3.5
Rated on a scale of 1-7, with 1 = no benefit, 4 = some benefit, and 7 = great benefit: mean >= 4.5; 4.0 <= mean <= 4.5
*highest priority topics

Table IXMean Rating of Each Training Topic by Grouped Occupational Category
(All Respondents)
Occupational Category
Environmental/ Health Planner/ Auditor/Medical Non-Medical Manager/ Occupational Communication Lab Quantitative Inspector/
Training Topics Clinicians Clinicians Administrator Health Specialist Scientist Researcher Surveyor
Clinical Skills 5.5 5.4 2.4 1.5 2.3 3.1 2.0 2.4
Environmental Health Skills 3.5 3.3 2.3 5.8 2.1 4.0 2.1 3.3
Laboratory Skills 3.1 3.0 1.7 3.0 1.4 5.9 1.8 2.3
Health Promotion/Disease Prevention 5.1 4.9 3.7 4.0 4.3 3.6 4.1 3.0
Overview Community/Public Health System 3.9 3.8 4.1 3.2 4.3 3.1 3.6 3.2
Finance and Personnel Management/Budgeting 2.9 2.8 5.0 3.1 3.4 3.2 2.8 3.2
Group Facilitation 4.3 4.5 4.9 3.9 5.2 3.6 3.6 3.7
*Cross-Cultural and Cross-Age Communication 5.0 5.1 4.4 4.0 5.0 3.4 3.5 3.5
*Interpersonal Communication 4.6 4.9 4.9 4.2 4.9 4.3 3.9 4.5
Health and Risk Communication Strategies 3.7 3.7 4.0 4.2 4.6 3.2 3.9 4.4
Mediation and Negotiation 3.3 3.8 4.7 4.0 4.3 3.1 3.0 4.2
*Participatory Teaching/Training Skills 4.6 4.9 4.2 4.4 5.2 4.2 4.2 3.8
Community/Program Planning 4.1 4.2 4.5 3.7 5.0 3.0 4.0 2.8
Community/Involvement/Mobilization 4.4 4.4 4.4 3.5 4.9 2.9 4.0 2.3
Legislative/Policy Advocacy 3.6 3.4 4.3 3.1 4.2 2.9 3.1 3.8
Provision of Technical Assistance 3.3 3.4 4.1 3.9 4.1 3.8 4.1 4.0
*Electronic Communication 4.2 4.3 4.8 4.6 4.6 4.6 4.4 4.1
Data Analysis and Utilization 3.5 3.3 4.7 4.2 4.4 4.7 5.6 3.9
Survey Design and Implementation 3.2 3.0 4.0 3.8 4.6 3.4 4.9 3.3
Quality Improvement and Assurance 4.0 4.1 5.1 3.9 4.6 4.9 4.2 4.8
Disease Outbreak Investigation 3.4 3.2 2.7 4.5 2.2 3.5 4.3 1.7
Written Communication 3.7 3.9 4.3 4.7 4.9 4.3 4.6 4.7
n = 377 n = 237 n = 287 n = 163 n = 122 n = 46 n = 43 n = 22
Rated on a scale of 1-7, with 1 = no benefit, 4 = some benefit, and 7 = great benefit: mean >= 5.0; 4.5 <= mean <= 5.0*highest priority topics

26
Discussion/Conclusions
The profile indicates that Washington state has a high percentage of well-educated,certified/licensed community/public health professionals. Many of these professionals havelong-term tenure in community/public health - almost a third of them have been involvedin this field for over ten years. As expected, the distribution of professional occupationsvaries by organizational setting. For example, the highest percentage of those providingclinical care are employed by clinics, whereas DOH employs the highest percentage ofthose providing health planning and communication services, and performing research andmanagement functions. The distribution of occupations in the local health departmentsfalls between that of DOH and the clinics.
The major training needs that emerge are communication skills in the form of interpersonalcommunication, cross-cultural and cross-age communication, electronic communication,and participatory teaching and training skills. All of these topics were highly rated byprofessionals in each organizational setting (DOH, LHDs and clinics) and across thelargest professional groups (medical clinicians, managers/administrators, non-medicalclinicians, environmental/occupational health specialists, and health planners andcommunication specialists).
A reason that these training needs were rated highly among so many professional groupsmay be the broad professional responsibilities among these groups. The profile indicatesthat almost three-quarters of community/public health professionals engage in two or moreoccupational activities, and half of professionals engage in three or more activities. Thismeans that most professionals are engaging in a number of tasks beyond the bounds oftheir central professional responsibility. This is illustrated by the finding that although onlytwenty-two (22) percent of survey respondents categorize themselves as administrators ormanagers, almost half of respondents report that they have some supervisory/managerialresponsibility. Certainly supervisory/managerial tasks require communication skills.
Although survey findings do an excellent job of identifying categories of training needsand preferred modes of training delivery, a more in-depth examination of these topics isneeded prior to the design and implementation of training programs. Survey resultsprovide information about preferred categories of training needs, but do not explore whatprofessionals mean by each of those categories. For example, what exactly doprofessionals mean when they request additional training in electronic communication? Dothey want to learn how to send attachments on e-mail, and/or do they want to learn howto use the Internet for research? Focus groups, with community/public healthprofessionals, could be used to answer these questions.

27
Likewise, the findings of this survey indicate that training delivered by an instructor/traineris virtually always preferred to mediated training via a computer, audio/video conferenceor satellite downlink site. The reasons for this preference, however, need to be examined.Perhaps professionals prefer in-person training because of its familiarity, or their lack ofcomfort with technology (e.g., computers), or because they are more frequently providedwith paid time-off for scheduled in-person training. Since some types of training may bemost effectively provided in a mediated format (e.g., data analysis), it is important tounderstand the reasons for professionals’ training preferences so that barriers to mediatedtraining can be addressed.
This survey represents the self-identified training needs of community/public healthprofessionals. This means that training needs are most likely based on current professionalresponsibilities. Given changes within the community/public health system, it would alsobe helpful to know what legislators, politicians, public policy analysts andcommunity/public health administrators perceive as the areas in which increasedproficiency among the community/public health professionals would be beneficial.Incorporation of their perspectives should be included in training plans.
Finally, this survey needs to be implemented among the other organizations that providecommunity/public health services in Washington. Although DOH, LHDs and clinics arethe conventional providers of community/public health services, many other governmentaland private organizations also provide these services. For example, the next surveyimplementation should include other State agencies such as the Department of Social andHealth Services and the Department of Ecology; hospitals, health maintenanceorganizations and health plans; and private non-profit and voluntary agencies such as theAmerican Cancer Society. In addition, it would be useful to survey health professionals inlarge for profit organizations, such as Boeing, that provide considerable preventive healthservices to employees and their families. It would also be beneficial to work with the K-12educational system to coordinate efforts to profile and identify training needs among themany classroom teachers, program specialists and school nurses who provide wellness andprevention services to Washington state’s children.
The information, provided by a truly comprehensive profile and training needs assessment,could be used to increase the efficiency and effectiveness of community/public healthprofessionals by identifying areas where training is needed, and supporting trainingcoordination and collaboration among organizations and professional groups.

APPENDIX AMean Rating of Each Training Topic by Grouped Occupational Category
(Department of Health)
Occupational Category
Environmental/ Health Planner/ Auditor/Medical Non-Medical Manager/ Occupational Communication Lab Quantitative Inspector/
Training Topics Clinicians Clinicians Administrator Health Specialist Scientist Researcher Surveyor
Clinical Skills 5.2 4.2 1.7 1.7 1.8 2.8 1.4 2.4
Environmental Health Skills 3.7 2.6 2.1 5.3 1.9 4.2 1.6 3.3
Laboratory Skills 2.8 1.8 1.5 3.3 1.6 6.2 1.3 2.5
Health Promotion/Disease Prevention 5.2 5.4 3.0 4.0 3.7 3.9 3.5 2.7
Overview Community/Public Health System 4.7 2.2 3.8 3.0 4.2 3.4 3.4 3.0
Finance and Personnel Management/Budgeting 2.8 1.6 4.9 2.6 3.6 3.3 2.7 3.3
*Group Facilitation 4.7 4.0 4.9 4.1 4.8 4.0 3.5 3.8
*Cross-Cultural and Cross-Age Communication 5.0 4.3 4.4 4.1 4.0 3.4 3.4 3.3
*Interpersonal Communication 4.3 5.6 4.9 4.3 4.3 4.5 4.1 4.7
Health and Risk Communication Strategies 3.5 3.4 3.9 4.3 3.7 3.2 3.6 4.5
Mediation and Negotiation 3.5 4.1 4.9 3.7 4.4 3.6 3.1 4.2
*Participatory Teaching/Training Skills 4.9 4.6 4.0 4.4 4.6 4.7 3.8 3.8
Community/Program Planning 4.3 3.7 4.0 3.6 4.1 3.4 3.5 2.7
Community/Involvement/Mobilization 4.7 3.6 3.8 3.0 3.7 3.0 3.1 2.3
Legislative/Policy Advocacy 3.7 3.8 4.3 2.8 4.1 3.0 3.2 3.9
Provision of Technical Assistance 3.6 3.1 4.3 3.4 4.2 4.0 4.1 3.9
*Electronic Communication 4.2 5.0 4.7 4.9 4.5 5.1 4.1 4.1
Data Analysis and Utilization 3.5 3.2 4.4 4.1 4.4 5.1 5.5 3.9
Survey Design and Implementation 3.3 2.8 3.6 3.8 4.3 3.6 4.9 3.3
*Quality Improvement and Assurance 4.5 3.2 5.2 4.0 4.7 5.1 3.5 4.9
Disease Outbreak Investigation 3.2 2.0 2.2 3.6 2.0 3.8 4.7 1.4
Written Communication 4.1 3.7 4.0 4.5 4.5 5.1 4.8 4.8
n = 13 n = 9 n = 98 n = 21 n = 49 n = 24 n = 17 n = 19
Rated on a scale of 1-7, with 1 = no benefit, 4 = some benefit, and 7 = great benefit: mean >= 5.0; 4.5 <= mean <= 5.0*highest priority topics

APPENDIX BMean Rating of Each Training Topic by Grouped Occupational Category
(Local Health Departments)
Occupational Category
Environmental/ Health Planner/ Auditor/Medical Non-Medical Manager/ Occupational Communication Lab Quantitative Inspector/
Training Topics Clinicians Clinicians Administrator Health Specialist Scientist Researcher Surveyor
Clinical Skills 5.1 5.1 2.4 1.5 2.6 3.6 2.1 2.3
Environmental Health Skills 3.0 3.0 2.4 6.0 2.2 4.7 2.2 3.3
Laboratory Skills 2.6 2.8 1.8 3.0 1.3 5.8 1.9 1.3
Health Promotion/Disease Prevention 5.3 5.0 4.1 4.0 4.8 3.4 4.3 4.3
Overview Community/Public Health System 4.1 3.8 4.3 3.3 4.4 2.5 3.6 4.3
Finance and Personnel Management/Budgeting 2.8 2.9 5.1 3.1 3.3 2.8 2.6 2.7
Group Facilitation 4.6 4.5 4.8 3.8 5.5 2.7 3.6 3.5
*Cross-Cultural and Cross-Age Communication 5.0 4.9 4.3 4.0 5.7 3.0 3.4 4.7
*Interpersonal Communication 4.9 4.8 4.9 4.2 5.3 4.1 3.7 3.3
Health and Risk Communication Strategies 4.0 3.7 4.5 4.2 5.2 2.9 3.8 3.5
Mediation and Negotiation 3.5 3.8 4.7 4.0 4.3 2.3 2.8 4.3
*Participatory Teaching/Training Skills 4.9 5.0 4.2 4.3 5.6 3.5 4.3 3.3
Community/Program Planning 4.5 4.4 4.8 3.7 5.6 2.6 4.2 3.0
Community/Involvement/Mobilization 4.7 4.8 4.7 3.7 5.6 2.2 4.4 2.3
Legislative/Policy Advocacy 3.9 3.6 4.7 3.1 4.4 2.3 3.0 3.0
Provision of Technical Assistance 3.4 3.5 4.3 4.0 4.1 3.4 4.1 4.3
*Electronic Communication 4.5 4.5 4.9 4.5 4.7 3.9 4.5 4.0
Data Analysis and Utilization 3.8 3.4 4.9 4.2 4.5 3.9 5.8 3.7
Survey Design and Implementation 3.6 3.4 4.3 3.8 4.8 3.1 5.1 3.3
Quality Improvement and Assurance 4.1 4.2 5.1 3.9 4.6 4.5 4.7 4.0
Disease Outbreak Investigation 3.8 3.6 3.2 4.6 2.4 3.3 4.1 3.0
Written Communication 4.2 4.2 4.7 4.7 5.3 3.3 4.6 3.7
n= 185 n = 92 n = 129 n = 139 n = 66 n = 13 n = 23 n = 3
Rated on a scale of 1-7, with 1 = no benefit, 4 = some benefit, and 7 = great benefit: mean >= 5.0; 4.5 <= mean <= 5.0*highest priority topics

APPENDIX CMean Rating of Each Training Topic by Grouped Occupational Category
(Clinics)
Occupational Category
Environmental/ Health Planner/ Auditor/Medical Non-Medical Manager/ Occupational Communication Lab Quantitative Inspector/
Training Topics Clinicians Clinicians Administrator Health Specialist Scientist Researcher Surveyor
*Clinical Skills 5.8 5.6 3.6 1.0 3.2 3.0 6.0 ---
Environmental Health Skills 3.9 3.6 2.5 1.0 3.5 2.1 4.5 ---
Laboratory Skills 3.6 3.2 2.0 1.0 1.7 5.3 4.0 ---
*Health Promotion/Disease Prevention 5.0 4.8 3.8 4.0 4.0 3.2 6.0 ---
Overview Community/Public Health System 3.7 3.9 4.2 1.0 4.7 3.2 4.7 ---
Finance and Personnel Management/Budgeting 3.0 2.9 4.7 7.0 3.0 3.7 6.0 ---
Group Facilitation 4.0 4.4 5.0 7.0 5.2 4.0 4.7 ---
*Cross-Cultural and Cross-Age Communication 5.0 5.3 4.6 5.0 5.7 4.1 5.5 ---
*Interpersonal Communication 4.4 5.0 4.8 5.0 5.0 4.0 4.3 ---
Health and Risk Communication Strategies 3.4 3.6 3.4 1.0 4.3 3.7 6.0 ---
Mediation and Negotiation 3.2 3.8 4.4 7.0 2.7 2.9 4.5 ---
Participatory Teaching/Training Skills 4.2 4.8 4.4 7.0 4.8 3.9 5.5 ---
Community/Program Planning 3.8 4.0 4.5 1.0 5.2 2.6 5.5 ---
Community/Involvement/Mobilization 4.0 4.3 4.4 1.0 5.5 3.6 5.5 ---
Legislative/Policy Advocacy 3.3 3.3 3.6 4.0 3.2 3.3 3.5 ---
Provision of Technical Assistance 3.1 3.4 3.3 1.0 2.5 4.0 4.0 ---
Electronic Communication 3.9 4.2 4.6 7.0 4.7 4.4 5.0 ---
Data Analysis and Utilization 3.1 3.2 4.5 4.0 3.8 4.6 4.7 ---
Survey Design and Implementation 2.7 2.8 3.9 4.0 4.2 3.2 4.3 ---
Quality Improvement and Assurance 3.9 4.0 4.9 4.0 4.7 4.8 4.5 ---
Disease Outbreak Investigation 3.1 3.0 2.4 1.0 2.0 2.9 4.0 ---
Written Communication 3.2 3.6 3.8 7.0 4.8 3.6 3.5 ---
n = 176 n = 135 n = 58 n = 1 n = 6 n = 9 n = 3 n = 0
Rated on a scale of 1-7, with 1 = no benefit, 4 = some benefit, and 7 = great benefit: mean >= 5.0; 4.5 <= mean <= 5.0*highest priority topics