a profile of the south african dairy …nda.agric.za/docs/amcp/dairmvcp11.pdf · the export of milk...
TRANSCRIPT

1
A PROFILE OF THE SOUTH AFRICAN DAIRY MARKET VALUE CHAIN
2011
Directorate Marketing Private Bag X 15
Arcadia 0007
Tel: 012 319 8455/6 Fax: 012 319 8131
Email: [email protected] www.daff.gov.za

TABLE OF CONTENTS
1. DESCRIPTION OF THE INDUSTRY 4
4
5
6
6
8
8
912
1717
21
24
25
25
25
26
27
27
32
38
38384450566268
74
1.1. Milk production areas
1.2. Production trends
1.3. Employment
2. MARKET STRUCTURE
2.1. DOMESTIC MARKET AND PRICES
2.2. EXPORT AND IMPORT OF DAIRY PRODUCTS
2.2. EXPORTS 2.2.1. Export values of milk and dairy products
2.3. SHARE ANALYSIS 2.3.1. Share analysis of milk and dairy products exports
2.4. IMPORTS
2.5. MARKETING CHANNELS IN THE DAIRY INDUSTRY
3. EMPOWERMENT PLANS BY THE INDUSTRY
4. BARRIERS TO THE LEVEL OF PARTICIPATION BY
THE EMERGING SECTOR
5. OPPORTUNITIES AND WEAKNESSES
6. MARKET INTELLIGENCE
6.1. Export Tariffs
6.2. Import tariffs
7. COMPETITIVENESS OF THE DAIRY INDUSTRY
7.1. Exports 7.1.1. Milk and cream (neither concentrated nor sweetened) 7.1.2. Milk and cream, concentrated or sweetened 7.1.3. Buttermilk and yoghurt 7.1.4. Whey and other natural milk products 7.1.5. Butter and other fats and oils derived from milk 7.1.6. Cheese and Curd
2
7.2. Imports

7.2.1. Milk and cream (neither concentrated nor sweetened) 7480869298
104
109
7.2.2. Milk and cream, concentrated or sweetened 7.2.3. Buttermilk and yoghurt 7.2.4. Whey and other natural milk products 7.2.5. Butter and other fats and oils derived from milk 14.2.6. Cheese and Curd
8. ACKNOWLEDGEMENTS
3
1. DESCRIPTION OF THE INDUSTRY
The contribution of milk production in South Africa makes approximately 0.5% to the world milk production. There are four major dairy breeds in South Africa namely, Holstein, Jersey, Guernsey and Ayrshire. The industry comprises of number of different economic activities and significant differences exist between farming methods and processing of dairy products. These activities involve the production and marketing of raw milk, pasteurized milk and cream, fermented milk, long-life milk and cream, yoghurt, cheese and its by-product whey, milk powder, sweetened and unsweetened concentrated milk, butter and butter oil (ghee).
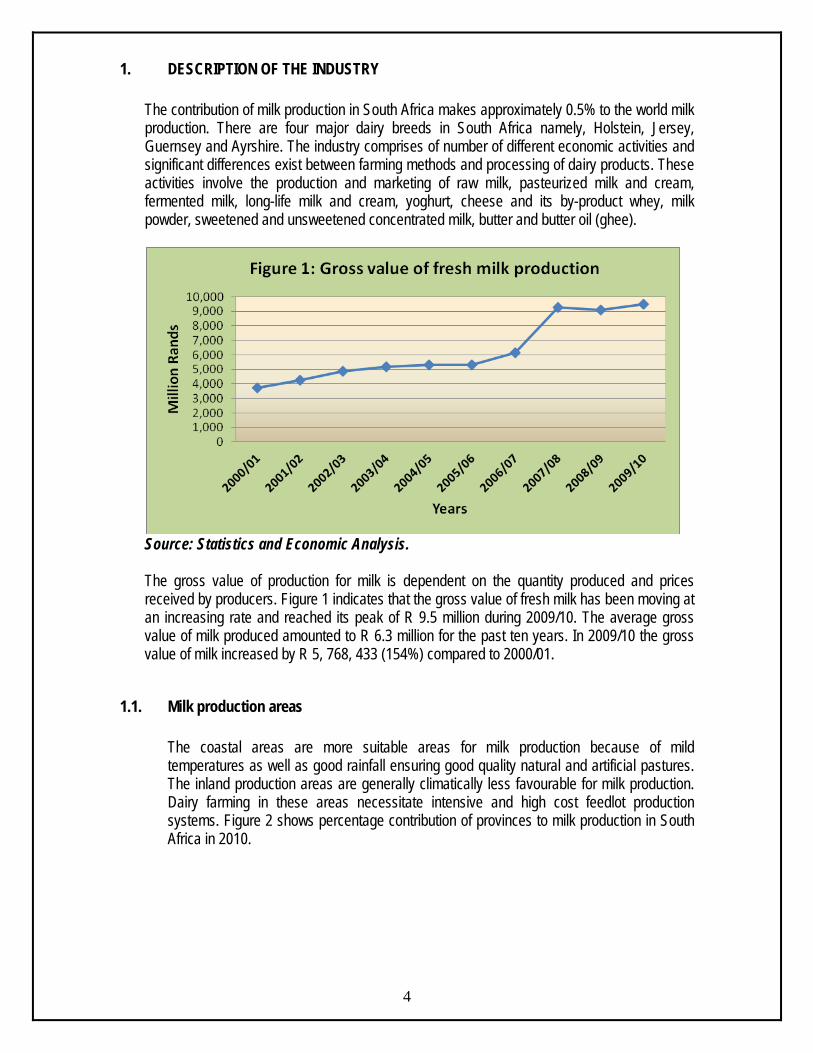
Source: Statistics and Economic Analysis. The gross value of production for milk is dependent on the quantity produced and prices received by producers. Figure 1 indicates that the gross value of fresh milk has been moving at an increasing rate and reached its peak of R 9.5 million during 2009/10. The average gross value of milk produced amounted to R 6.3 million for the past ten years. In 2009/10 the gross value of milk increased by R 5, 768, 433 (154%) compared to 2000/01.
1.1. Milk production areas
The coastal areas are more suitable areas for milk production because of mild temperatures as well as good rainfall ensuring good quality natural and artificial pastures. The inland production areas are generally climatically less favourable for milk production. Dairy farming in these areas necessitate intensive and high cost feedlot production systems. Figure 2 shows percentage contribution of provinces to milk production in South Africa in 2010.
4

Source: MPO.
Western Cape contributed 27% of the total milk produced in South Africa followed by Eastern Cape and KwaZulu–Natal which took up 24% each; Free State contributed 13%; North–West 5%; Mpumalanga 4%, Gauteng 3%, Northern Cape and Limpopo contributed less than a percent.
1.2. Production trends
Over the past ten years the number of milk production and dairy cows has been fluctuating but there is a slight increase of 6% and 1% respectively. This may be due to the uncertainty of the milk industry.
5

Source: Statistics and Economic Analysis.
1.3. Employment
The South African dairy industry is important to the job market with over 4 000 milk producers employing 60 000 farm workers and providing 40 000 people with indirect jobs within the value chain like milk processing and milling industry.
2. MARKET STRUCTURE
The South African dairy market is divided into 60% liquid and 40% concentrated products. Pasteurized liquid milk and UHT milk are the major liquid products, while hard and semi cheese is the major concentrated product. Different types in each category are shown in Figure 4 and 5.
6

Source: MPO.
Figure 4 shows that pasteurized milk has the highest percentages of 52 followed by UHT (long life) by 28; yoghurt by 13; mass & buttermilk by 5 percent. Flavoured milk commanded the lowest market share of liquid milk with 2% share.
Source: MPO.
7

Condensed milk products consist of 38% of hard and semi cheese followed by milk powder with a percentage share of 19, then other cheese by 16%. Condensed milk and buttermilk powder commanded the lowest shares of condensed milk products with the shares of 7% and 1% respectively.
2.1. DOMESTIC MARKET AND PRICES
Local milk consumption and prices is illustrated in Figure 6.
Source: Statistics and Economic Analysis.
Figure 6 indicates that milk price increased from 2000/01 to 2003/04 and declined from 2004/05 to 2006/07 before a sharp increase from 2007/8 to 2009/10. The period 2004/05 – 2005/06 experienced the decline in prices as processors were positioning themselves for an expected increase in production but this led to a no growth in production that force processors to review their pricing. Consumption of milk started at a low rate from 1999/00 continuing at an increasing rate to 2002/03 to 2007/08 and thereafter experienced a slight decrease from 2008/09 to 2009/10. This was mainly due to under performance of the industry as farmers were withdrawing from the industry which was stricken by economic crisis.
2.2. EXPORT AND IMPORT OF DAIRY PRODUCTS
8
Internationally the main milk producing regions are as follows: European Union 31%, New Zealand 30%, Australia 12%, USA 5% and the balance 22% are the cumulative total of the other regions in the world. Milk production in South Africa makes a very small contribution to

the world production but in terms of the values of agricultural production in South Africa, it is the fifth largest agricultural industry in the country.
Milk is produced much more cheaply in New Zealand and certain parts of the world than in South Africa. Imported milk from the EU and US is cheaper than in South Africa because of subsidies in these countries. Dairy companies in those countries are paid a guaranteed floor price for designated quantities of dairy products. Dairy companies in both countries are given a subsidy to bridge the gap between the supported domestic price and world market price. In the EU dairy farmers are paid subsidies for the use of certain inputs. The annual imports and exports of dairy products (in litres) from 2001 to 2010 are shown in Figure 8.
Source: Quantec EasyData.
Figure 8 showed that South Africa became a net exporter of milk and dairy products during 2001, 2002, 2004 and 2008 to 2010 and became a net importer during 2003 and 2005 to 2007. The increase in exports in 2008 to 2010 was due to the attractive international price of milk.
2.2. EXPORTS
The dairy industry is also an important earner of foreign exchange. In 2010, exports of dairy products amounted to 288 million kilograms valued at over R 3 billion. There was an increase of 57% of milk and dairy products exported to the world and a drastic increase of 109% in 2010 compared to 2001. Figure 9 below shows the exports of dairy products from 2001 to 2010.
9

Source: Quantec EasyData. From Figure 9, exports of milk and dairy products experienced the lowest exports in 2001 and 2003 to 2007 before increasing substantially in 2008. The decrease experienced in 2010 was due to the low production in the local market. Both quantity and value followed the same trend throughout the period under analysis.
10

Source: Quantec EasyData. Figure 10 shows that during 2010 New Zealand hold a bigger market share of South African milk and dairy products exports accounting for 21% followed by France and Australia with 20% and 12% respectively. The smallest shares were commanded by Italy and Morocco with a 2% market share each.
Source: Quantec EasyData.
11

Figure 11 shows that in export quantities, milk and cream (neither concentrated nor sweetened) dominated exports of milk and dairy products from 2003 to 2010, and milk and cream (concentrated or sweetened) became dominant in 2001 to 2002 and thereafter became the second highest from 2003 to 2005 and again during 2007 to 2010. Buttermilk took the second highest level during 2005 only.
2.2.1. Export values of milk and dairy products Figure 12 – 20 shows the export of milk and dairy products from provinces and district municipalities.
Source: Quantec EasyDdata.
Figure 13 illustrates that Gauteng province played a major role in the exports of milk and dairy products from 2001 to 2010 with a peak value of R 342 million in 2009. This may be due to the fact that Gauteng is the main exit point to the SADC region as most of these exports were destined to SADC region. Western Cape Province commanded the second level of milk and dairy products exports followed by KwaZulu–Natal and Eastern Cape provinces while irregular exports were recorded in Mpumalanga, North West, Free State and Limpopo provinces.
12

Source: Quantec EasyData.
In Western Cape Province, City of Cape Town metropolitan municipality played an important role in the export of milk and dairy products throughout the period under analysis with the highest export value of R 132 million recorded in 2002. Exports of milk and dairy products were also recorded in Cape Winelands district municipality from 2003 to 2010 and irregular export values in Eden, Overberg and West Coast district municipalities were recorded.
Source: Quantec EasyData.
13
In Eastern Cape Province, high milk and dairy products exports values have been recorded from Cacadu district municipality which commanded the highest values except in 2008 followed by Nelson Mandela metropolitan municipality which reached its peak of R 9 million in 2008. Irregular exports of milk and dairy products were recorded in the Amatole district municipality.

Source: Quantec EasyData. Intermittent values were recorded from Free State Province from four district municipalities (Motheo, Lejweleputswa, Thabo Mofutsanyane and Northern Free State). Motheo district municipality recorded a high value of R 1.7 million in 2009 and Motheo recorded the highest in 2010 of R 1.3 million.
Source: Quantec Easy data.
14
In KwaZulu–Natal Province, high milk and dairy products export values have been recorded at eThekwini district municipality throughout the period under analysis. It reached its peak of R 14
million during 2008. Irregular exports of milk and dairy products were recorded at Uthukulu, iLembe, Amajuba, Uthukela, Umgungundlovu and Ugu district municipalities.
Source: Quantec EasyData.
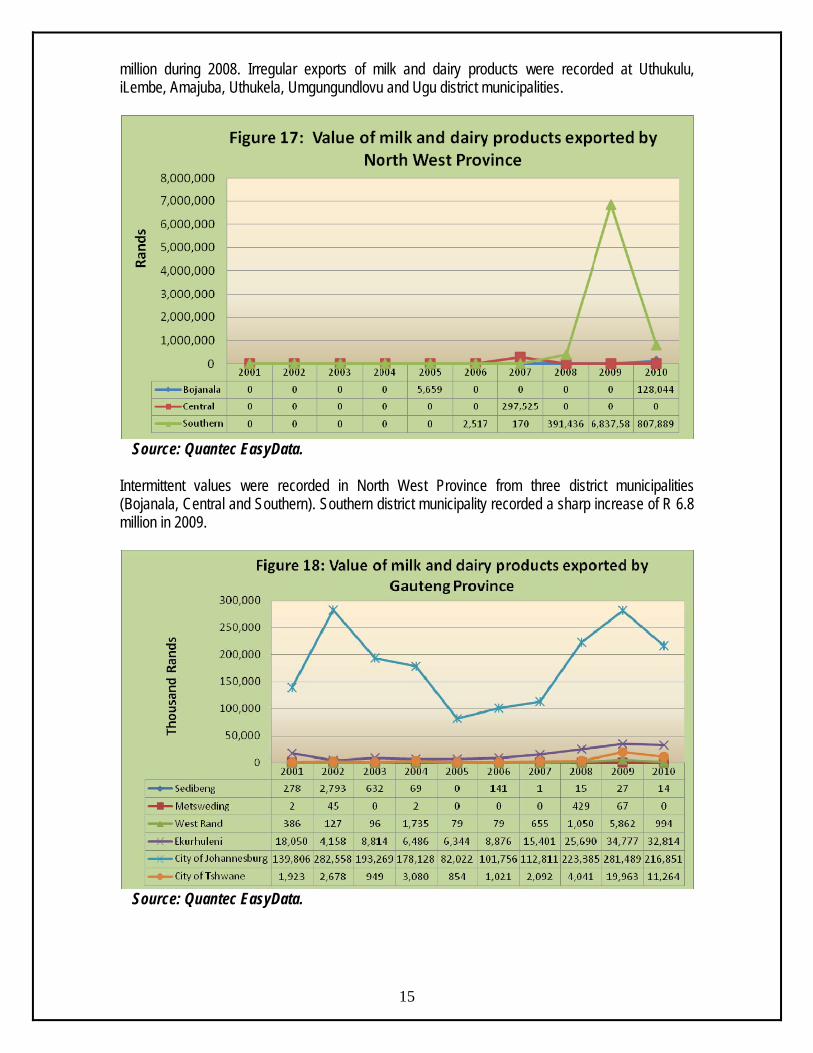
Intermittent values were recorded in North West Province from three district municipalities (Bojanala, Central and Southern). Southern district municipality recorded a sharp increase of R 6.8 million in 2009.
Source: Quantec EasyData.
15

In Gauteng province, high milk and dairy products export values have been recorded for the past ten years at the City of Johannesburg metropolitan municipality with the highest values R 283 million in 2002 and R 281 million during 2009. West Rand district, Ekurhuleni district and City of Tshwane metropolitan municipalities also recorded milk and dairy products exports on a regular basis. Irregular exports of milk and dairy products were recorded in Sedibeng and Metsweding district municipalities.
Source: Quantec EasyData.
In Mpumalanga Province, Ehlanzeni played a major role in the export of milk and dairy products from 2001 to 2010 and reached its peak of R 25 million in 2006. Irregular exports of milk and dairy products were recorded from Gert Sibande and Nkangala district municipalities.
16
Source: Quantec EasyData.

Limpopo Province recorded irregular exports of milk and dairy products during 2002 to 2010 from Vhembe, Mopani, Waterberg and Capricorn district municipalities. Vhembe district municipality recorded the highest exports value of R 4.5 million in 2008. There was a huge improvement of milk and dairy products exports from Limpopo during 2010 with Waterberg district municipality being the highest by R 17million followed by Vhembe district municipality by R 8 million then R 3 million from Capricorn district.
2.3. SHARE ANALYSIS
2.3.1. Share analysis of milk and dairy products exports Table 1: Share of provincial milk and dairy products to the total RSA milk and dairy products exports (%). Years Provinces
2001 2002 2003 2004 2005 2006 2007 2008 2009 2010
Western Cape 17.23 30.23 23.07 16.38 25.38 26.69 29.64 28.00 25.75 21.53 Eastern Cape 0.65 0.47 0.88 0.67 2.48 1.85 3.60 3.92 3.77 2.52 Free State 0.00 0.00 0.00 0.00 0.00 0.00 0.00 0.00 0.32 0.39 KwaZulu-Natal 1.87 2.21 2.46 2.65 8.37 3.92 3.27 3.47 2.33 2.06 North West 0.00 0.00 0.00 0.00 0.00 0.00 0.13 0.09 1.31 0.22 Gauteng 80.01 66.88 73.03 79.28 59.54 55.00 56.50 60.78 65.67 62.21 Mpumalanga 0.24 0.20 0.54 0.48 4.13 12.36 6.06 2.65 0.63 4.46 Limpopo 0.00 0.01 0.01 0.53 0.11 0.18 0.81 1.08 0.23 6.60 Total 100 100 100 100 100 100 100 100 100 100 Source: Quantec EasyData. Table 1 show that Gauteng province commands the greatest share of South African milk and dairy products’ exports. This is in spite of the fact that Western Cape and Eastern Cape provinces are the major milk producing provinces. This may be due to the fact that Gauteng is the exit point for milk and dairy products to the SADC regions. Western Cape, Eastern Cape, KwaZulu–Natal and Mpumalanga Provinces reported regular exports of milk and dairy products. Limpopo, North West and Free State Provinces recorded intermittent export shares of milk and dairy products while there were no milk and dairy exports from Northern Cape Province. Table 2: Share of district milk and dairy products to the total Western Cape provincial milk and dairy products exports (%). Years Districts
2001 2002 2003 2004 2005 2006 2007 2008 2009 2010
City of Cape Town 100.00 100.00 69.60 87.31 94.22 91.31 90.79 88.11 92.45 96.52 West Coast 0.00 0.00 0.00 0.00 0.30 1.14 0.85 0.52 1.08 0.00 Cape Winelands 0.00 0.00 30.36 12.68 5.47 6.63 8.36 11.22 5.94 0.94 Overberg 0.00 0.00 0.00 0.00 0.01 0.00 0.00 0.00 0.00 0.00 Eden 0.00 0.00 0.03 0.01 0.00 0.92 0.00 0.15 0.54 2.53 Total 100 100 100 100 100 100 100 100 100 100
17
Source: Quantec EasyData.

The City of Cape Town metropolitan municipality has commanded the greatest share of milk and dairy products’ exports in the Western Cape Province from 2001 to 2010. Fractional exports of milk and dairy products occurred in the Cape Winelands, West Coast, Overberg and Eden district municipalities. Table 3: Share of district milk and dairy products to the total Eastern Cape provincial milk and dairy products exports (%). Years Districts
2001 2002 2003 2004 2005 2006 2007 2008 2009 2010
Cacadu 73.85 99.93 99.70 52.75 99.27 99.81 67.78 45.45 76.38 90.02 Amatole 26.15 0.07 0.00 13.63 0.41 0.03 3.99 0.00 0.00 0.04 Nelson Mandela 0.00 0.00 0.30 33.61 0.32 0.16 28.22 54.55 23.62 9.94 Total 100 100 100 100 100 100 100 100 100 100 Source: Quantec EasyData. Cacadu district municipality has commanded the greatest share of milk and dairy products exports in the Eastern Cape Province. Fractional exports of milk and dairy products occurred in Amatole district and Nelson Mandela metropolitan municipalities. Table 4: Share of district milk and dairy products to the total Free State provincial milk and dairy products exports (%). Years Districts
2001 2002 2003 2004 2005 2006 2007 2008 2009 2010
Motheo 0.00 0.00 0.00 0.00 0.00 0.00 0.00 0.00 0.00 77.40 Lejweleputswa 0.00 99.82 0.00 0.00 0.00 0.00 0.00 0.00 0.00 0.00 Thabo Mofutsanyane 0.00 0.18 0.00 0.00 0.00 0.00 100.00 0.00 0.00 0.01 Northern Free State 0.00 0.00 0.00 0.00 0.00 0.00 0.00 0.00 100.00 22.59 Total 100 100 100 0 0 0 0 100 100 100 Source: Quantec EasyData. Free State Province experienced fractional exports of milk and dairy products from Motheo, Lejweleputswa, Thabo Mofutsanyane, Northern Free State district municipalities. Motheo district municipality commanded the highest share of milk and dairy products during 2010, Lejweleputswa district municipality was the greatest during 2002, Thabo Mofutsanyane district municipality in 2007 and Northern Free State in 2009.
18

Table 5: Share of district milk and dairy products to the total KwaZulu–Natal provincial milk and dairy products exports (%). Years Districts
2001 2002 2003 2004 2005 2006 2007 2008 2009 2010
Ugu 0.00 0.00 0.00 0.03 0.00 0.17 0.00 0.00 0.52 0.00 Umgungu ndlovu 0.00 0.30 0.00 11.81 9.55 0.19 0.06 0.00 0.08 0.01 Uthukela 0.00 0.00 0.30 0.00 0.00 0.00 0.00 0.00 0.06 0.22 Amajuba 0.00 0.00 0.38 0.00 0.00 0.00 0.00 0.00 0.00 0.00 Uthungulu 0.28 0.01 0.00 0.00 0.01 0.57 0.00 0.00 0.00 0.08 iLembe 2.87 0.00 0.21 0.00 0.00 0.00 0.00 6.85 6.48 12.84 eThekwini 96.85 99.70 99.10 88.16 90.45 99.07 99.94 93.15 92.85 86.86 Total 100 100 100 100 100 100 100 100 100 100 Source: Quantec EasyData. eThekwini district municipality has commanded the greatest shares of milk and dairy products exports in the KwaZulu–Natal Province from 2001 to 2010. Fractional exports of milk and dairy products occurred in Uthukulu, iLembe, Amajuba, Uthukela, Umgungundlovu and Ugu district municipalities. Table 6: Share of district milk and dairy products to the total North West provincial milk and dairy products exports (%). Years Districts
2001 2002 2003 2004 2005 2006 2007 2008 2009 2010
Bojanala 0.00 0.00 0.00 0.00 100.00 0.00 0.00 0.00 0.00 13.68 Central 0.00 0.00 0.00 0.00 0.00 0.00 99.94 0.00 0.00 0.00 Southern 0.00 0.00 0.00 0.00 0.00 100.00 0.06 100.00 100.00 86.32 Total 0 0 0 0 0 100 100 100 100 100 Source: Quantec EasyData. Intermittent milk and dairy exports in North West Province were recorded from Bojanala, Central and Southern district Municipalities from 2005 to 2009. Bojanala district municipality commanded 100% shares during 2005 and Southern district municipality has commanded 100% shares of milk and dairy products exports from 2008 to 2009.
19

Table 7: Share of district milk and dairy products to the total Gauteng provincial milk and dairy products exports (%). Years Districts
2001 2002 2003 2004 2005 2006 2007 2008 2009 2010
Sedibeng 0.17 0.96 0.31 0.04 0.00 0.13 0.00 0.01 0.01 0.01 Metsweding 0.00 0.02 0.00 0.00 0.00 0.00 0.00 0.17 0.02 0.00 West Rand 0.24 0.04 0.05 0.92 0.09 0.07 0.50 0.41 1.71 0.38 Ekurhuleni 11.25 1.42 4.33 3.42 7.10 7.93 11.76 10.09 10.16 12.53 City of Johannesburg 87.14 96.65 94.85 94.00 91.85 90.96 86.14 87.74 82.26 82.79 City of Tshwane 1.20 0.92 0.47 1.63 0.96 0.91 1.60 1.59 5.83 4.30 Total 100 100 100 100 100 100 100 100 100 100 Source: Quantec EasyData. The City of Johannesburg municipality has commanded the greatest share of milk and dairy products exports in Gauteng province from 2001 to 2010 followed at a distant by Ekurhuleni district municipality. City of Tshwane metropolitan and West Rand district municipalities reported regular exports throughout the period under analysis. Fractional exports of milk and dairy products occurred in the Sedibeng and Metsweding district municipalities. Table 8: dairy products (neither concentrated nor sweetened) to the total Mpumalanga provincial milk and dairy products exports (%). Years Districts
2001 2002 2003 2004 2005 2006 2007 2008 2009 2010
Gert Sibande 0.00 11.56 0.00 26.59 8.63 0.00 0.85 0.00 16.24 0.00 Nkangala 0.00 0.00 0.49 0.00 0.00 0.00 0.00 0.00 0.04 0.45
Ehlanzeni 100.0
0 88.44 99.51 73.41 91.37 100.00 99.15 100.00 83.72 99.55 Total 100 100 100 100 100 100 100 100 100 100 Source: Quantec EasyData. Ehlanzeni district municipality has commanded the greatest shares of milk and dairy products’ exports in Mpumalanga Province from 2001 to 2010. Irregular exports of milk and dairy products occurred in the Gert Sibande district and Nkangala district from 2002 to 2010. Table 9: Share of district milk and dairy products to the total Limpopo provincial milk and dairy products exports (%). Years Districts
2001 2002 2003 2004 2005 2006 2007 2008 2009 2010
Mopani 0.00 0.00 0.00 0.75 0.00 0.00 0.01 0.07 0.00 0.00 Vhembe 0.00 100.00 24.96 84.74 0.00 90.65 94.18 99.93 95.31 28.48 Capricorn 0.00 0.00 75.04 14.52 100.00 9.35 5.80 0.00 4.69 11.78 Waterberg 0.00 0.00 0.00 0.00 0.00 0.00 0.00 0.00 0.00 59.74 Total 0 0 100 100 100 100 100 100 100 100 Source: Quantec EasyData.
20
Intermittent exports of milk and dairy products were recorded in Limpopo Province. Vhembe district municipality commanded the greatest shares of milk and dairy products exports during 2002, 2004 and 2006 to 2009.Intermittent exports of milk and dairy products were experienced from Mopani, Capricorn and Waterberg district municipalities.
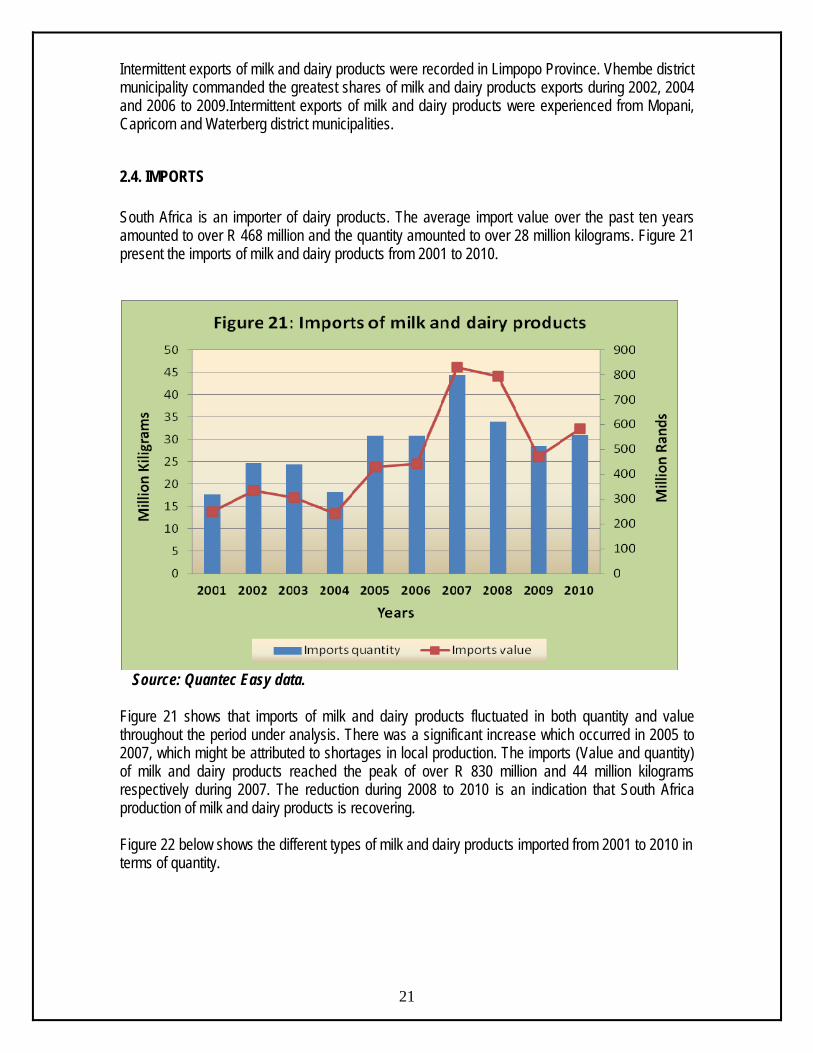
2.4. IMPORTS South Africa is an importer of dairy products. The average import value over the past ten years amounted to over R 468 million and the quantity amounted to over 28 million kilograms. Figure 21 present the imports of milk and dairy products from 2001 to 2010.
Source: Quantec Easy data.
Figure 21 shows that imports of milk and dairy products fluctuated in both quantity and value throughout the period under analysis. There was a significant increase which occurred in 2005 to 2007, which might be attributed to shortages in local production. The imports (Value and quantity) of milk and dairy products reached the peak of over R 830 million and 44 million kilograms respectively during 2007. The reduction during 2008 to 2010 is an indication that South Africa production of milk and dairy products is recovering. Figure 22 below shows the different types of milk and dairy products imported from 2001 to 2010 in terms of quantity.
21

Source: Quantec EasyData.
Figure 22 shows that milk and cream (concentrated or sweetened), whey and milk & cream (not concentrated nor sweetened) were among the most imported quantities of milk and dairy products in South Africa during the period under analysis. Milk and cream (concentrated or sweetened) commanded the greatest quantities of the imports market in 2002 to 2003 and 2005 to 2007. Milk & Cream (not concentrated nor sweetened) dominated the imports market from 2008 to 2010. Figure 23 below shows the different types of milk and dairy products imported from 2001 to 2010 in terms of value.
22
Source: Quantec Easy data.

Figure 23 above indicate that milk and cream (concentrated and sweetened) commanded the greatest share of imports followed by cheese & curd and whey was on the third level of milk and dairy values imported by South Africa. On average Milk and Cream (concentrated and sweetened) commanded a share of R 149 million followed by Cheese and Curd by R 120 million then Whey by R 99 million during the period under review. Figure 24 shows the origin of milk and dairy products imported to South Africa in 2010.
Source: Quantec Easy Data.
Figure 24 above shows that the main supplier of milk and dairy products to South Africa in 2010 was Argentina which had an import market share of 30% followed by France which exported 18% of milk and dairy products to South Africa. Australia and New Zealand had an equal share of 14% of milk and dairy products exported to South Africa.
23

2.5. MARKETING CHANNELS IN THE DAIRY INDUSTRY
Figure 25: Marketing Channels.
Processors buys milk from farmers and import milk concentrates and produces dairy products for primary distribution to retailers, exports and for further processing.
Milk production in South Africa is mainly by two sectors; Commercial Producers, and Small and Medium size Producers. Commercial Producers sell milk to Dairy Processors. Small and medium size producers sell most of their milk directly to consumers and some to processors. Dairy
24
Commercial Dairy farms
Bulk collection
Dairy Processors
Dairy Products (Cheese, Butter, etc)
Secondary dairy products
Primary Distribution
Retailers Small and informal trade Institutions
Imports
Small and Medium Dairy Farms
Exports
Consumers

25
3. EMPOWERMENT PLANS BY THE INDUSTRY The following is a list of ventures/projects/programmes. Media releases were arranged for the dairy industry. The MPO, in conjunction with the provincial departments and municipalities and other relevant stakeholders were responsible for these empowerment plans. 3.1. Successful ventures: Commercially viable. Grasslands Trust. Wittekleibosch Trust
Fort Hare Dairy Trust outside Alice in Eastern Cape started in 2004 and the first cow was milked in October 2007. The trust started between a partnership between 70 white farmers from the Tsitsikamma and the Underberg area – through their company Amandlelo Agri and University of Fort Hare. The University donated land and the cost of the project was R 22 million (R 2 million donated by University, R 5 million by Amandlelo and 15 million by Land Bank of which 7.5 million is loan). The farmers signed on an empowerment company Vuwa Investments which was given 35% stake in the company. The farmers kept 49 % and the rest was shared among 600 workers from the 70 dairy farms. Today Fort Hare Dairy Trust is a state-of-the-art commercial dairy farm. It has 800 cow rotary parlor that produces approximately 10 000 litres of milk a day much of which is supplied to Clover milk company. The farm that requires 600 tons of maize is sourced from farmers in the Alice area. Every year Amandlelo takes between 10 and 15 black interns. Some of them are sent to Fort Hare Dairy Trust. Farmers are rewarded with cattle as they pass through different stages. This will enable them to start their own full time dairy farming (Pretoria News, 17 June 2009).
3.2. Training Programmes:
Agri SETA accredited farm worker training. Agri SETA accredited emerging farmer training. Workers training funded by MILK SA. Training of Extension officers of Department of Agriculture in North West Province
and Free State. 3.3. Magazines: Ubisi Mail and Dairy Mail are distributed free of charge to emerging farmers.
4. BARRIERS TO THE LEVEL OF PARTICIPATION BY
THE EMERGING SECTOR
The low profitability of milk production is the major barrier to entry for the emerging farmers. Access to credit facilities and financial package specially structured to their needs also plays
a role. The volatility of the market and the effect of imports in depressing producer prices make it
difficult for the emerging farmers to enter the industry. The dynamics of pricing in the dairy industry as well as the shelf life of the products is such
that the farmers are squeezed to accept whatever price that the producers/processors offer them to dispose of their products.

26
The market is dominated by 4 major processors in the milk industry making it extremely
difficult for the emerging farmers to make inroads in the dairy processing industry.
They lack the necessary capital to invest in dairy equipment. The volume of milk produced may not be sufficient to invest in capital equipment. To form a cooperative would assist in increasing the volume through the collection of milk from several small farms. However the infrastructure and the underdeveloped roads and the great distances between farms could be inhibiting factors to go this route.
Smaller processors tend to pay higher raw milk prices than the larger processors during
periods of seasonal milk shortages because they lack the bargaining power that the larger processors have. During periods of surpluses the large producers dump their products in the retail sector at very low prices making it difficult for the small processors to compete.
The big players in the market have facilities to convert raw milk into milk powder, butter,
cheese or long-life milk which can be stored for longer periods of time. This facility is capital intensive and for the volumes of raw milk produced by the emerging farmers it is not really worth it in the long term.
The farmers/producers lack the expertise, equipment to pasteurize milk. Transport and the
quantity are major deterrents for small farmers to get their products to the big processors. The big processors/buyers find it not worth the effort to access these farmers due to the road infrastructure and small inconsistent and small volumes of milk produced.
5. OPPORTUNITIES AND WEAKNESSES
Success in the dairy market depends on two factors namely: quality products and the support of processors. Successful advertising, exports and the development of new products are also important.
Some consumers like to buy fresh milk direct from producers because the origin of the milk is known. A strong relationship can be built between producer/s and consumers.
Producers can sell direct to small cafes and street vendors shortening the value chain cutting out some transaction costs resulting in an increase in profits. This channel will require higher capital and involves more risks. A sound relationship needs to be in place between the sellers and the buyers.
Since deregulation the number of smaller milk producers has increased dramatically and processors are willing to receive milk from the smaller producers. However this supply channel will require a high level control measures on hygiene and the producer has to comply with the required standards.
High demand of value added products such as sour milk, yoghurt and cheese can be a market to be explored. However to go this route would require high investment, market knowledge and the necessary training.

27
Packaging to promote brand identification can open an opportunity but this would require market research and knowledge, training and investment.
6. MARKET INTELLIGENCE
6.1. Export Tariffs Tariffs that different importing countries applied to milk and dairy products originating from South Africa in 2009 and 2010 are shown in table 10 to 15. Table 10: Milk and cream (neither concentrated nor sweetened) Country 2009 2010
Product Code Trade Regime Description
Applied Tariffs
Total Ad valorem Equivalent Tariff (estimated)
Applied Tariffs
Total Ad valorem Equivalent Tariff (estimated)
Comoros 040111000; 04012000 & 04013000
MFN duties 0.00% 0.00% 0.00% 0.00%
Mauritius 040111000; 04012000 & 04013000
MFN duties 0.00% 0.00% 0.00% 0.00%
Mozambique
04011000 04012010 & 04013000
Preferential tariff for SA
15.00%
15.00% 15.00% 0.00%
15.00% 0.00%
United Republic of Tanzania
040111000; 04012000 & 04013000
MFN duties 60.00% 60.00% 60.00% 60.00%
Zimbabwe 040111000; 04012000 & 04013000
MFN duties 40.00% 40.00% 40.00% 40.00%
Source: Market Access Map. Comoros and Mauritius allow the importation of milk and cream (not concentrated or sweetened) from South Africa duty free. The most protected market exists in United Republic of Tanzania which applied the MFN duties of 60% in 2009 and 2010 followed by Zimbabwe by 40% MFN duties applied. Mozambique continued with preferential tariff of 15%.

28
Table 11: Milk and cream (concentrated or sweetened) 2009 2010 Country Product code Trade
Regime Description
Applied Tariffs
Total Ad valorem Equivalent Tariff (estimated)
Applied Tariffs
Total Ad valorem Equivalent Tariff (estimated)
Angola 04021000; 04022100; 04029100& 04029900
MFN duties 2.00% 2.00% 2.00% 2.00%
Malawi 04021000; 04022100 & 04022900 04029900
MFN Duties Preferential tariff for SA
10.00%
10.00% 10.00% 10.00%
10.00% 10.00%
Mozambique 0402101004021090 04022110 04022120 04029990
MFN Duties Preferential tariff for SA MFN Duties Preferential tariff for SA Preferential tariff for SA
10.00%
10.00%
10.00% 10.00% 0.00% 0.00% 15.00%
10.00% 10.00% 0.00% 0.00% 15.00%
Zambia 04021010; 04021090; 04022120; 04022130; 04022190; 040222920 & 04022990
Preferential tariff for South Africa
2.8% 2.8% 0.00% 0.00%
Zimbabwe 04021010; 04021090; 04029110 & 04029190 04021090; 04022190; 04022990; 04029190 & 04029990
MFN duties MFN duties
20.00% 20.00% 20.00% 40.00%
20.00% 40.00%

29
2009 2010 04022910
MFN duties
25.00%
25.00%
Source: Market Access Map. Malawi, Mozambique and Zambia has a preferential tariff for exports of milk and cream (concentrated or sweetened) during 2009 and 2010 varying from 0% to 10%. Zambia lifted its preferential tariff from 0.8% in 2009 to 0% in 2010. Zimbabwe’s market of Milk and Cream (Concentrated & sweetened) is the highest protected market with the MFN duties ranging from 20% to 40% during 2010. Table 12: Buttermilk, cream, yoghurt, etc
2009 2010 Country Product Code
Trade Regime Description
Applied Tariffs
Total Ad valorem Equivalent Tariff (estimated)
Applied Tariffs
Total Ad valorem Equivalent Tariff (estimated)
Angola 04031000 & 04039000
MFN duties 10.00% 10.00% 10.00% 10.00%
Malawi 04031000 & 04039000
MFN duties 10.00% 10.00% 10.00% 10.00%
Mozambique
04031000 04039000
Preferential tariff for South Africa
15.00%
15.00% 15.00% 0.00%
15.00% 0.00%
Zambia 04031000 & 04039000
Preferential tariff for South Africa
0.00% 0.00% 0.00% 0.00%
Zimbabwe 04031000; 04039000; 04039010 & 04039090
MFN duties 40.00% 40.00% 40.00% 40.00%
Source: Market Access Map. Mozambique and Zambia has a preferential tariff for exports of buttermilk, curdled milk, cream and yoghurt of 15% and 0% (free) respectively in 2010Angola and Malawi continued applying MFN duties of 10% to buttermilk, curdled milk, cream and yoghurt originating from South Africa from 2009 to 2010. Zimbabwe applies MFN duties of 40% respectively to buttermilk, curdled milk, cream and yoghurt originating from South Africa in 2009 and 2010. Table 13: Whey and natural milk products

30
2009 2010 Country Product code Trade Regime Description
Applied Tariffs
Total Ad valorem Equivalent Tariff (estimated)
Applied Tariffs
Total Ad valorem Equivalent Tariff (estimated)
China 04041000 & 04049000
MFN duties 2.00% 2.00% 2.00% 2.00%
Japan 040410111; 040410151 040410119 040410129; 040410129; 040410139 & 040410149
MFN duties 29.80% + 9732.78 $/Ton
322.40% 29.80% + 4043.43 $/Ton
35.00% 25.00% 489.82%
Republic of Korea
0404102110; 0404102120; 0404102130; 0404102190 & 0404102900 0404900000
MFN duties 49.50% 49.50% 49.50% 36.00%
49.50% 36.00%
Viet Nam
040410110000; 040410190000; 040410910000; 040410990000; 040490000000
General tariff
00% 0.00%
Zambia 04041000 & 04049000
Preferential tariff for SA
0.00% 0.00%
Source: Market Access Map. Mozambique allowed importation of whey from South Africa at a preferential rate of 0% in 2010 and Viet Nam applied a general tariff of 0%. . China applied the same general tariff of 2% during 2009 and 2010 while Republic of Korea applied 49.50%. Japan was the most protected market of whey origination from South Africa with applied MFN tariff ranging from 25% to 489.82% during 2010. Table 14: Butter and other fats and oils derived from milk
2009 2010 Country Product code Trade Regime Description
Applied Tariffs
Total Ad valorem Equivalent Tariff (estimated)
Applied Tariffs
Total Ad valorem Equivalent Tariff (estimated)
Malawi 04051000; 04052000; 04059000
MFN duties 25.00% 25.00% 25.00% 25.00%
Mauritius 04051000; 04052000; 0459010 &
MFN duties 0.00% 0.00% 0.00% 0.00%
31
04059090
Zambia 04051000; 04052000; 04059010 & 04059090
Preferential tariff for SA
0.00% 0.00% 0.00% 0.00%
Zimbabwe 04051000; 04052000 & 04059000
MFN duties 40.00% 40.00% 40.00% 40.00%
Source: Market Access Map. Mauritius and Zambia allow importation of whey from South Africa duty free. Malawi and Zimbabwe apply MFN duties of 25% and 40% to butter and other fats and oils derived from milk originating from South Africa during 2009 and 2010. Table 15: Cheese and curd
2009 2010 Country Product code
Trade Regime Description
Applied Tariffs
Total Ad valorem Equivalent Tariff (estimated)
Applied Tariffs
Total Ad valorem Equivalent Tariff (estimated)
Angola
04061000; 04062000; 04063000; 04064000 & 04069000
MFN duties 10.00% 10.00% 10.00% 10.00%
Malawi
04061000; 04062000; 04063000; 04064000 & 04069000
MFN duties 25.00% 25.00% 25.00% 25.00%
Mozambique
04061000; 04062000; 04063000; 04064000 & 04069000
Preferential tariff for SA
15.00% 15.00%
Zambia
04061000; 04062000; 04063000; 04064000 & 04069000
Preferential tariff for SA
0.00% 0.00% 0.00% 0.00%
Zimbabwe
04061000; 04062000; 04063000; 04064000 & 04069000
MFN duties 40.00% 40.00% 40.00% 40.00%
Source: Market Access Map.

32
Angola, Malawi and Zimbabwe applied the MFN duties of 10%, 25% and 40% respectively to cheese and curd originating from South Africa during 2009 and 2010. Mozambique and Zambia has a preferential tariff for exports of cheese and curd of 0% in 2010
6.2. Import tariffs Tariffs that South Africa applied to imports of milk and dairy products originating from all possible countries in 2009 and 2010 are shown in table 16 to 21. Table 16: Milk and cream, neither concentrated nor sweetened
2009 2010 Country Product code
Trade Regime Description
Applied Tariffs
Total Ad valorem Equivalent Tariff (estimated)
Applied Tariffs
Total Ad valorem Equivalent Tariff (estimated)
Argentina
0401 (Milk and Cream not concentrated nor sweetened)
MFN duties 0.00% 0.00% 0.00% 0.00%
Austria
0401 (Milk and Cream not concentrated nor sweetened)
MFN duties 0.00% 0.00% 0.00% 0.00%
Brazil
0401 (Milk and Cream not concentrated nor sweetened)
MFN duties 0.00% 0.00% 0.00% 0.00%
United Kingdom
0401 (Milk and Cream not concentrated nor sweetened)
MFN duties 0.00% 0.00% 0.00% 0.00%
Uruguay
0401 (Milk and Cream not concentrated nor sweetened)
MFN duties 0.00% 0.00% 0.00% 0.00%
Source: Market Access Map.

33
South Africa applies no tariff on all the imports of milk and cream (neither concentrated nor sweetened). Table 17: Milk and cream, concentrated or sweetened
2009 2010 Country Product code
Trade Regime Description
Applied Tariffs
Total Ad valorem Equivalent Tariff (estimated)
Applied Tariffs
Total Ad valorem Equivalent Tariff (estimated)
Belgium; United States of America & Uruguay
04021010 & 04021090 04022110 & 04022190 04022900 04029100 04029900
MFN duties 96.00% or 661.73 $/Ton whichever is the lower 96.00% or 661.73$/Ton whichever is the lower 96.00% or 661.73$/Ton whichever is the lower 96.00% or 661.73$/Ton whichever is the lower 96.00% or 661.73$/Ton whichever is the lower
24.98% 26.47% 27.47% 40.32% 13.50%
France & New Zealand
04021010 & 04021090 04022110 & 04022190 04022900
MFN duties 96.00% or 589.54 $/Ton whichever is the lower
24.47% 96.00% or 661.73 $/Ton whichever is the lower 96.00% or 661.73$/Ton whichever is the lower 96.00% or 661.73$/Ton whichever is
24.98% 26.47% 27.47%

34
2009 2010 Country Product code
Trade Regime Description
Applied Tariffs
Total Ad valorem Equivalent Tariff (estimated)
Applied Tariffs
Total Ad valorem Equivalent Tariff (estimated)
04029100 04029900
the lower 96.00% or 661.73$/Ton whichever is the lower 96.00% or 661.73$/Ton whichever is the lower
40.32% 13.50%
Source: Market Access Map. Table 17 indicates that South Africa applied a total ad valorem equivalent tariff for milk and cream (concentrated or sweetened) of 24.98%, 26.47% 27.47% 40.32% and 13.50% depending on the product code to Belgium, USA, Uruguay, France and New Zealand in 2010. Table 18: Buttermilk, cream, yoghurt, etc
2009 2010 Country Product code
Trade Regime Description
Applied Tariffs
Total Ad valorem Equivalent Tariff (estimated)
Applied Tariffs
Total Ad valorem Equivalent Tariff (estimated)
Belgium; France; Netherlands; New Zealand & United Kingdom
04031000 04039010; 04039020& 04039090
MFN duties
0.00%
0.00%
0.00% 96.00% or 661.73 $/Ton whichever is the lower 96.00% or 661.73 $/Ton whichever is the lower
0.00% 31.21%
Source: Market Access Map.

35
Table 18 indicates that South Africa decreased its applied the total ad valorem equivalent tariff of 0% and 31.24% depending on the product code to Belgium, France, Netherlands, New Zealand and UK during 2010. Table 19: Whey and other natural milk products
2009 2010 Country Product code
Trade Regime Description
Applied Tariffs
Total Ad valorem Equivalent Tariff (estimated)
Applied Tariffs
Total Ad valorem Equivalent Tariff (estimated)
Australia; Ireland ; New Zealand & United States of America
04041000 04049010 & 04049090
MFN duties 96.00% or 589.54 $/Ton whichever is the lower
30.83% 96.00% or 661.73 $/Ton whichever is the lower 96.00% or 661.73 $/Ton whichever is the lower
34.61% 22.82%
France
04041000 04049010 & 04049090
MFN duties 96.00% or 661.73 $/Ton whichever is the lower 96.00% or 661.73 $/Ton whichever is the lower
34.61% 22.82%
Source: Market Access Map. Table 19 indicates that South Africa increased its applied and ad valorem equivalent tariff to Australia, Ireland, New Zealand, USA and France for whey from 96.00% or $ 589.54/ton, whichever is lower and 30.83% respectively in 2009 to 96% or $ 661.73/ton, whichever is lower and 34.61% respectively in 2010.

36
Table 20: Butter and other fats and oils derived from milk
2009 2010 Country Product code
Trade Regime Description
Applied Tariffs
Total Ad valorem Equivalent Tariff (estimated)
Applied Tariffs
Total Ad valorem Equivalent Tariff (estimated)
Australia; Belgium; Denmark Ireland & New Zealand
04051000 04052000 04059000
MFN duties 79.00% or 655.04 $/Ton whichever is the lower
31.78%
79.00% or 735.26 &/Ton whichever is lower
35.67% 19.78% 27.48%
Source: Market Access Map. Table 20 indicates that South Africa increased its applied and ad valorem tariff for butter and other fats and oils derived from milk from 79% or $ 655.04/ton, whichever is lower and 31.78% respectively during 2009 to 79% or 735.26% $/Ton whichever is the lower or 35.67% in 2010. Table 21: Cheese and curd
2009 2010 Country Product code
Trade Regime Description
Applied Tariffs
Total Ad valorem Equivalent Tariff (estimated)
Applied Tariffs
Total Ad valorem Equivalent Tariff (estimated)
France; Ireland; Italy; New Zealand &United States of America
04061000 04062000 04063000 04064000 04069011; 04069012; 04069021; 04069022;
MFN duties 95.00% or 655.04 $/Ton whichever is the lower
13.13%
95.00% or 735.26 $/Ton whichever is the lower
14.74% 10.96% 14.24% 12.23% 16.13%

37
2009 2010 Country Product code
Trade Regime Description
Applied Tariffs
Total Ad valorem Equivalent Tariff (estimated)
Applied Tariffs
Total Ad valorem Equivalent Tariff (estimated)
04069091 & 04069099
Source: Market Access Map. Table 21 indicates that South Africa applied different tariffs depending on different product codes for cheese and curd from France, Ireland, New Zealand, Italy and USA. The total ad valorem equivalent tariff of 14.74%, 10.96%, 14.24%, 12.23% and 16.13% and the applied tariff was at 95% or 735.26 $ /Ton or whichever is the lower during 2010.

7. COMPETITIVENESS OF THE DAIRY INDUSTRY
7.1. Exports
7.1.1. Milk and cream (neither concentrated nor sweetened) Table 22: List of importing markets for the product exported by South Africa in 2010 South Africa’s exports represent 0.25% of world exports for Milk and cream, (not concentrated or sweetened), its ranking in world’s exports is 41.
Trade Indicators
Importers
Exported
value 2010 (USD thousand)
Trade balance 2010 (USD
thousand)
Share in
South Africa
's exports (%)
Exported
quantity 2010
Quantity unit
Unit value
(USD/unit)
Exported
growth in
value between 2006-
2010 (%,
p.a.)
Exported
growth in
quantity
between 2006-
2010 (%,
p.a.)
Exported
growth in
value between 2009-
2010 (%,
p.a.)
Ranking of
partner countries in world import
s
Share of
partner countries in world imports (%)
Total import growth
in value
of partner countri
es between 2006-
2010 (%, p.a.)
Tariff (estimat
ed) faced by
South Africa
(%)
World 17657 10024 100 17465 Tons 1011 46 19 -8 100 7 Zimbabwe 8609 8609 48.8 8476 Tons 1016 373 379 10 58 0.1 536 40 Mozambique 4981 4981 28.2 5494 Tons 907 23 -1 60 89 0 11 8.5 United Republic of Tanzania 1449 1449 8.2 1586 Tons 914 26 13 -2 73 0.1 41 60
38
Source: ITC calculations based on COMTRADE statistics.

Table 22 shows that during 2010, South Africa exported a total of 17 657 tons of milk and cream (not concentrated or sweetened) at an average value of US$ 1 011/unit. South Africa exported greater quantities of milk and cream (not concentrated or sweetened) to Zimbabwe, Mozambique and United Republic of Tanzania. The greatest share of South African milk and cream (not concentrated or sweetened) exports were destined to Zimbabwe which commanded 48.8% share during the year 2010 followed by Mozambique (28.2 %) then United Republic of Tanzania by 8.2%. South Africa’s milk and cream (not concentrated or sweetened) exports increased by 49% in value and 19% in quantity between the periods 2006 and 2010. During the same period, exports of milk and cream (not concentrated or sweetened) to Zimbabwe increased by 373% in value while quantity increased by 379%; and Mozambique increased by 23% in value and decreased by 1% in quantity. Between the periods 2009 and 2010, South Africa’s exports of milk and cream (not concentrated or sweetened) decreased by 8% in value. During the same period, Zimbabwe and Mozambique increased by 10% and 60% respectively in value.
39

40

The chart illustrates that South Africa’s exports of milk and cream (not concentrated or sweetened) represent 0.25% of world exports. Between 2006 and 2010 South Africa’s milk and cream, not concentrated or sweetened Uganda, Comoros and Zimbabwe were growing at a rate that is less than their import growth from the world. This means that South Africa is losing the market in the mentioned countries. Nigeria represents loses in the declining market (i.e its annual growth is less that the world’s average growth) while other mentioned countries represent gains in the dynamic market (i.e its annual growth is more that the world’s average growth). During the same period, South Africa’s milk and cream (not concentrated or sweetened) exports to Mauritius, Zamia, United Arab Emirates, Seychelles, Mozambique, Malawi, Democratic Republic of Congo and Saint Helena were growing at a rate that is greater than their imports from the rest of the world. Therefore South Africa is gaining the market share in those countries. Zambia represent loses in the declining market while Malawi represent gains in the declining market and other countries represent gains the dynamic market. The markets which have the highest growth in demand for South African Milk and Cream (not concentrated nor sweetened) exist in Zimbabwe, United Arab Emirates, Seychelles and Zambia. The annual growth of South African’s exports to these countries is at 373%, 87%, 71% and 62% respectively.
41

42

South Africa is currently exporting large quantities of milk and cream, not concentrated nor sweetened to Zimbabwe, and it has a market share on 48.76% of South Africa’s exports. Zimbabwe’s imports from the world is greater than its imports from South Africa, therefore South Africa can still penetrate Zimbabwe’s import market because its annual growth is attractive (536%). If South Africa wishes to diversify its exports of milk and cream (not concentrated or sweetened), Pakistan and Uganda are the smallest markets but attractive for market development because their annual imports growth are growing at a rate of 178% and 86% respectively.
43

7.1.2. Milk and cream, concentrated or sweetened Table 23: List of importing markets for the product exported by South Africa in 2010 South Africa's exports represent 0.12% of world exports for milk and cream (concentrated or sweetened), its ranking in world exports is 48.
Trade Indicators
Importers
Exported value 2010 (USD
thousand)
Trade balance
2010 (USD
thousand)
Share in
South Africa'
s exports (%)
Exported
quantity 2010
Quantity unit
Unit value
(USD/unit)
Exported
growth in
value between 2006-
2010 (%,
p.a.)
Exported
growth in
quantity
between 2006-
2010 (%,
p.a.)
Exported
growth in
value between 2009-
2010 (%,
p.a.)
Ranking of
partner countries in world import
s
Share of
partner countries in world imports (%)
Total import growth
in value
of partner countri
es between 2006-
2010 (%, p.a.)
Tariff (estimated) faced by South Africa (%)
World 19206 -3716 100 5706 Tons 3366 17 9 -17 100 4 Mozambique 6776 6767 35.3 1936 Tons 3500 8 0 31 112 0.1 -23 7.3 Zambia 5332 5332 27.8 807 Tons 6607 14 -5 1 104 0.1 25 0 Zimbabwe 4682 4682 24.4 1248 Tons 3752 71 70 -43 95 0.1 76 30.1 Malawi 415 415 2.2 101 Tons 4109 -4 -22 -81 117 0.1 7 10 Angola 385 385 2 518 Tons 743 -1 13 -1 42 0.5 1 2 DRC 378 378 2 182 Tons 2077 -20 -18 -25 61 0.3 4 5
44
Source: ITC calculations based on COMTRADE statistics.
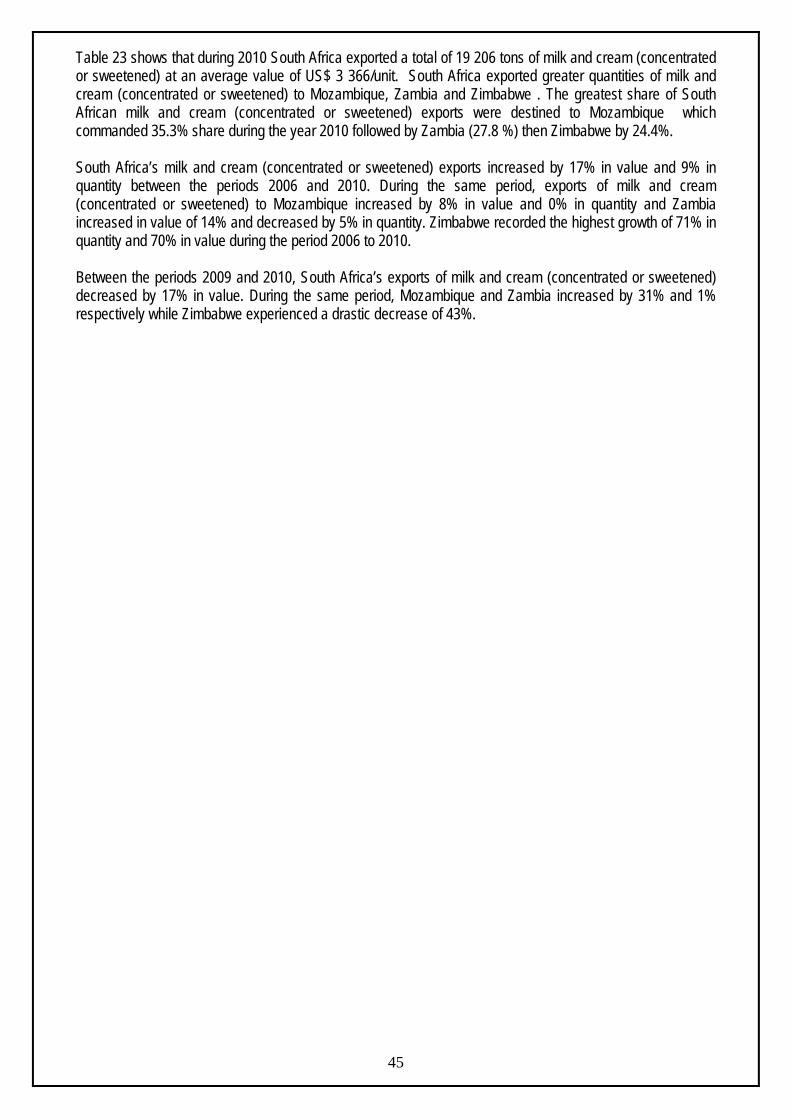
Table 23 shows that during 2010 South Africa exported a total of 19 206 tons of milk and cream (concentrated or sweetened) at an average value of US$ 3 366/unit. South Africa exported greater quantities of milk and cream (concentrated or sweetened) to Mozambique, Zambia and Zimbabwe . The greatest share of South African milk and cream (concentrated or sweetened) exports were destined to Mozambique which commanded 35.3% share during the year 2010 followed by Zambia (27.8 %) then Zimbabwe by 24.4%. South Africa’s milk and cream (concentrated or sweetened) exports increased by 17% in value and 9% in quantity between the periods 2006 and 2010. During the same period, exports of milk and cream (concentrated or sweetened) to Mozambique increased by 8% in value and 0% in quantity and Zambia increased in value of 14% and decreased by 5% in quantity. Zimbabwe recorded the highest growth of 71% in quantity and 70% in value during the period 2006 to 2010. Between the periods 2009 and 2010, South Africa’s exports of milk and cream (concentrated or sweetened) decreased by 17% in value. During the same period, Mozambique and Zambia increased by 31% and 1% respectively while Zimbabwe experienced a drastic decrease of 43%.
45
46

The chart illustrates that South Africa’s exports of milk and cream (concentrated or sweetened) represent 0.12% of world exports. Between 2006 and 2010 South Africa’s milk and cream (concentrated or sweetened) was losing the market share in Zimbabwe, Zambia, Kenya, Malawi, Angola, Democratic Republic of Congo and Mauritius because imports from South African were growing at a rate that is less than their imports growth from the world. During the same period, South Africa was gaining the market shares of milk and cream (concentrated or sweetened) exports to Mozambique, Uganda, Saint Helena, Seychelles, United Republic of Tanzania, Congo and Ghana because imports from South African were growing at a rate that is greater than their imports from the rest of the world. Ghana is the only country representing gains in the declining market while other countries represent loses in the declining market.
47

48

If South Africa wishes to diversify its export of milk and cream (concentrated and sweetened), Kenya will be attractive for market development because although it is a small market (0.1% world share) its annual growth is 31%. South Africa can still penetrate the import market of Zimbabwe and Zambia even though they have a market share of 24.38% and 27.76% respectively of South African’s exports. This is due to the fact the their imports growth from the world are still greater than South African’s export growth to Zimbabwe and Zambia and their annual import growths are the highest at a rate of 76% and 25%.
49
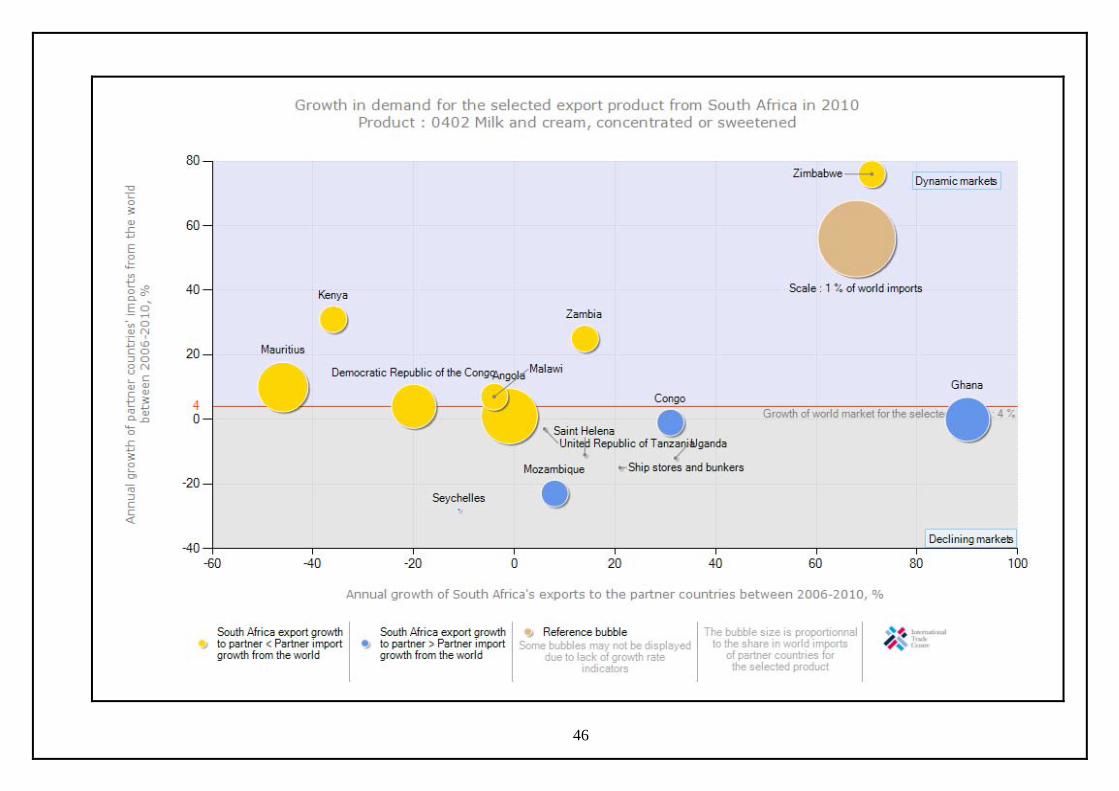
7.1.3. Buttermilk and yoghurt Table 24: List of importing markets for Buttermilk and yoghurt exported by South Africa in 2010 South Africa’s exports represent 0.26% of world exports for Buttermilk and yoghurt, its ranking in world exports is 36.
Trade Indicators
Importers
Exported value
2010 (USD
thousand)
Trade balance
2010 (USD
thousand)
Share in
South Africa'
s exports (%)
Exported
quantity 2010
Quantity unit
Unit value
(USD/unit)
Exported
growth in
value between 2006-
2010 (%,
p.a.)
Exported
growth in
quantity
between 2006-
2010 (%,
p.a.)
Exported
growth in
value between 2009-
2010 (%,
p.a.)
Ranking of
partner countries in world
imports
Share of
partner countries in world
imports (%)
Total import growth in value
of partner countri
es between 2006-
2010 (%, p.a.)
Tariff (estimated) faced by South
Africa (%)
World 9933 6040 100 4510 Tons 2202 14 2 -8 100 3 Mozambique 4614 4614 46.5 1805 Tons 2556 18 -9 88 115 0 12 10.2 Angola 2280 2280 23 1127 Tons 2023 4 4 -56 31 0.6 21 10 Zimbabwe 1033 1033 10.4 615 Tons 1680 134 162 -28 119 0 264 40 Malawi 516 516 5.2 233 Tons 2215 35 37 8 135 0 40 10 Zambia 429 429 4.3 181 Tons 2370 41 22 118 139 0 28 0
50
Source: ITC calculations based on COMTRADE statistics.

Table 24 shows that during 2010 South Africa exported a total of 9 933 tons of buttermilk and yoghurt at an average value of US$ 2 202/unit. South Africa exported greater quantities of buttermilk and yoghurt to Mozambique, Angola and Zimbabwe. The greatest share of South African buttermilk and yoghurt exports were destined to Mozambique which commanded 46.5% share during the year 2010 followed by Angola with 23% then Mozambique (10.%). South Africa’s buttermilk and yoghurt exports have increased by 14% in value and 2% in quantity between the periods 2006 and 2010. During the same period, exports of buttermilk and yoghurt to Mozambique increased by 18% in value and 9% in quantity; and Angola increased by 4% each in value and quantity. Zimbabwe experience extreme increases of 134% in value and 162% in quantity. Between the periods 2009 and 2010, South Africa’s exports of buttermilk and yoghurt decreased by 8% in value. During the same period, Mozambique increased by 88% and Angola decreased by 56% in value.
51

52

The chart illustrates that South Africa’s exports of buttermilk and yoghurt represent 0.26% of the world exports. Between 2006 and 2010 South Africa’ was losing the market share of buttermilk and yoghurt in Malawi, Angola, Chad, Seychelles, Cameroon, Zimbabwe and Mauritius because its exports were growing at a rate that is less than their import growth from the rest of the world. Among the mentioned countries Zimbabwe’s demand growth for South African buttermilk and yoghurt is the highest (134%). During the same period, South Africa’s buttermilk and yoghurt exports to Nigeria, Uganda, Democratic Republic of Congo, Ghana, Greece, Mozambique, Saint Helena, Zambia and United Republic of Tanzania were growing at a rate that is greater than their imports from the rest of the world. Therefore South Africa is gaining the market share in these countries.
53

54

South Africa’s exports of buttermilk and yoghurt are dominant in Mozambique but if South Africa wishes to diversify its exports the most attractive market will be Zimbabwe. Even though its world market share is at 0%, their annual growth which is 264% is very attractive. Greece looks to be the biggest markets of world’s buttermilk and yoghurt but its annual growth of 6% and has a share of 0.11% of South African buttermilk and yoghurt. Therefore it might be difficult for South Africa to penetrate its market.
55

7.1.4. Whey and other natural milk products Table 25: List of importing markets for whey and natural milk exported by South Africa in 2010 South Africa's exports represent 0.09% of world exports for whey and natural milk, its ranking in world exports is 42.
Trade Indicators
Importers
Exported
value 2010 (USD thousand)
Trade balance
2010 (USD
thousand)
Share in
South Africa
's exports (%)
Exported
quantity 2010
Quantity unit
Unit value
(USD/unit)
Exported
growth in
value between 2006-
2010 (%,
p.a.)
Exported
growth in
quantity
between 2006-
2010 (%,
p.a.)
Exported
growth in
value between 2009-
2010 (%,
p.a.)
Ranking of
partner countries in world import
s
Share of
partner countries in world imports (%)
Total import
growth in value of partner
countries between
2006-2010 (%, p.a.)
Tariff (estimated)
faced by South Africa
(%)
World 3211 -19525 100 3805 Tons 844 13 22 64 100 0 Japan 1575 1575 49.1 1968 Tons 800 48 64 106 8 3.4 2 322.4 Republic of Korea 532 532 16.6 725 Tons 734 1 13 -24 9 3.4 -2 42.8 China 242 242 7.5 304 Tons 796 135 57 65 2 9.9 11 6.4 Zambia 180 180 5.6 172 Tons 1047 39 31 800 121 0 56 0 Viet Nam 168 168 5.2 226 Tons 743 1100 22 1.2 10 0 Kenya 125 125 3.9 36 Tons 3472 79 145 136 0 20 25
56
Source: ITC calculations based on COMTRADE statistics.

Table 25 shows that during 2010 South Africa exported a total of 3 211 tons of whey and natural milk products at an average value of US$ 844/unit. South Africa exported greater quantities of whey and natural milk products to Japan, Republic of Korea and China. The greatest share of South African whey and natural milk products exports were destined to Japan which commanded 49.1% share during the year 2010 followed by Republic of Korea taking 16.6% and China by 7.5%. South Africa’s whey and natural milk products exports increased by 1322% in value and 22% in quantity between the periods 2006 and 2010. During the same period, exports of whey and natural milk products to Japan increased by 48% in value and 64% in quantity and Republic of Korea increased by 1% in quantity and 3% in value; while China increased by 135% in value and 57% in quantity. Between the periods 2009 and 2010, South Africa’s exports of whey and natural milk products increased by 64% in value. During the same period, Japan increased by 106%; Republic of Korea decreased by 24% and China increased by 64% respectively in value.
57
58

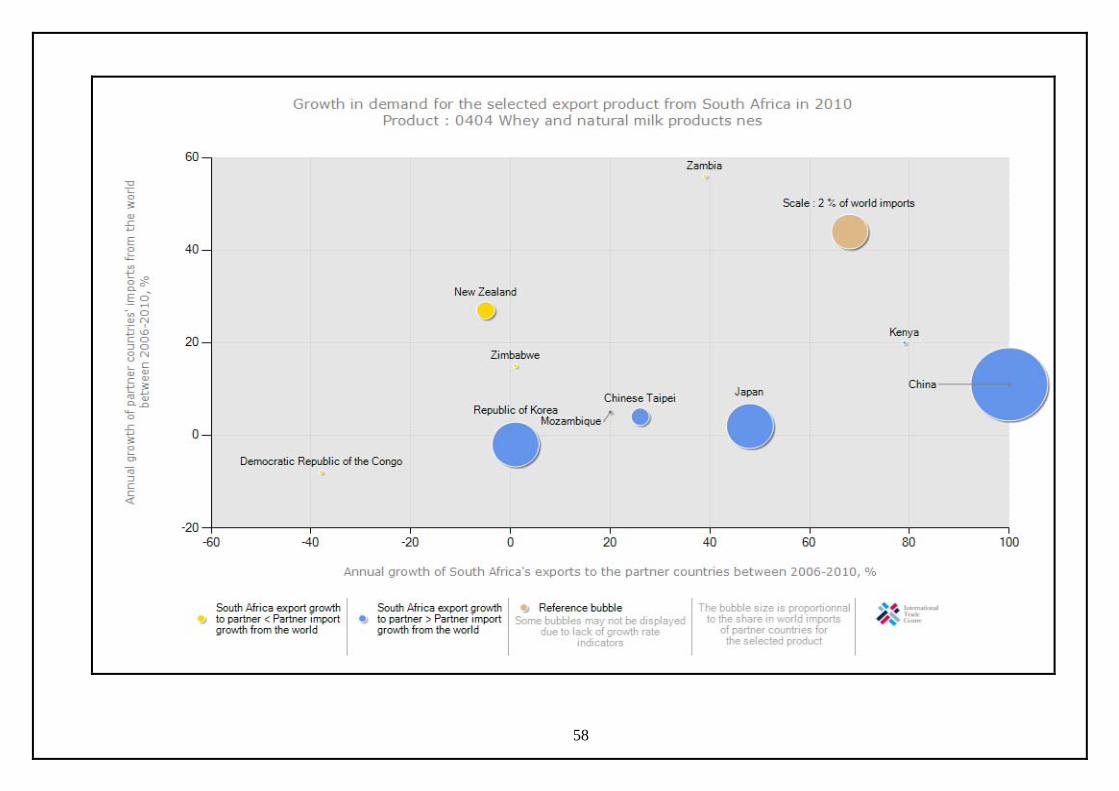
The chart illustrates that that South Africa’s exports of whey and natural milk products represent 0.09% of the world exports. Between 2006 and 2010 South Africa’s whey and natural milk products exported to New Zealand, Democratic Republic of Congo, Zambia and Zimbabwe were growing at a rate that is less than their import growth from the rest of the world. Therefore, South Africa is losing the market share in the mentioned countries. During the same period, South Africa is gaining the market shares of whey and natural milk products exports in China, Kenya, Japan, Chinese Taipei, Mozambique and Republic of Korea because its exports were growing at a rate that is greater than their imports from the rest of the world. China’s demand growth of South African whey and natural milk products is the highest at 135% rate.
59

60

The chart illustrates that China is the biggest importer of whey and natural milk products with a world market share of 9.9% but it is not the main importer of South Africa’s whey and natural milk products. It has a market share of 7.54% in South Africa’s exports and its import annual growth is 11%. It is therefore the second biggest prospective market for South Africa’s whey and natural milk products. South Africa can diversify its market to Zambia, although its world import share is 0%, its annual growth is at 56% which is the highest.
61

7.1.5. Butter and other fats and oils derived from milk Table 26: List of importing markets for butter and other fats and oils derived from milk exported by South Africa in 2010 South Africa’s export represent 0.07% of world export for butter and other fats and oils derived from milk, its ranking in world exports is 47.
Trade Indicators
Importers
Exported value
2010 (USD
thousand)
Trade balance
2010 (USD
thousand)
Share in
South Africa'
s exports (%)
Exported
quantity 2010
Quantity unit
Unit value
(USD/unit)
Exported
growth in value between 2006-
2010 (%, p.a.)
Exported
growth in
quantity
between 2006-
2010 (%, p.a.)
Exported
growth in value between 2009-
2010 (%, p.a.)
Ranking of
partner countries in world
imports
Share of
partner countries in world
imports (%)
Total import growth in value
of partner countri
es between 2006-
2010 (%, p.a.)
Tariff (estimated) faced by South
Africa (%)
World 4817 -4711 100 1469 Tons 3279 24 18 19 100 4 Zimbabwe 1329 1329 27.6 608 Tons 2186 72 63 37 139 0 64 40 Mozambique 1251 1251 26 273 Tons 4582 10 -4 63 149 0 -3 0 Mauritius 866 866 18 193 Tons 4487 28 12 -7 73 0.1 12 0 Zambia 536 536 11.1 125 Tons 4288 30 21 54 144 0 23 0 Malawi 239 239 5 54 Tons 4426 6 -10 7 163 0 15 25
62
Sources: ITC calculations based on COMTRADE statistics.

Table 26 shows that during 2010 South Africa exported a total of 3 279 tons of butter and other fats derived from milk at an average value of US$ 3 279/unit. South Africa exported greater quantities of butter and other fats derived from milk to Zimbabwe, Mozambique, Mauritius and Zambia. The greatest share of South African butter and other fats derived from milk exports were destined to Zimbabwe which commanded 27.6% share during the year 2010 followed by Mozambique (26%). Mauritius received a share of 18% and Zambia 11.1% South Africa’s butter and other fats derived from milk exports increased by 24% in value and 18% in quantity between the periods 2006 and 2010. During the same period, exports of butter and other fats derived from milk to Zimbabwe increased by 72% in value and 63% in quantity; and Mozambique increased by 10% in value and decreased by 4% quantity. Between the periods 2009 and 2010, South Africa’s exports of butter and other fats derived from milk increased by 19% in value. During the same period, Zimbabwe and Mozambique increased by 37% and 63% respectively in value. Zambia decreased by 8% in value during the periods 2009 and 2010.
63

64

The chart illustrates that that South Africa’s exports of butter and other fats and oils represent 0.07% of the world exports. Between 2006 and 2010 South Africa’s butter and other fats exported to United Republic of Tanzania, Saint Helena, Zimbabwe, Seychelles, Nigeria, Australia, Uganda, Malawi and Angola were growing at a rate that is less than their export growth to the rest of the world. During the same period, South Africa’s butter and other fats exports to Ghana, Greece, Zambia, United Arab Emirates, Democratic Republic of Congo Mauritius and Mozambique were growing at a rate that is greater than their exports to the rest of the world. Therefore South Africa is gaining the market shares in both dynamic market (Ghana, Zimbabwe, Zambia, Democratic Republic of Congo, Mauritius, and Greece) and declining market (Mozambique).
65

66

The chart illustrates that Iran dominated the import market of butter and other fats derived from milk, but is not importing of South African‘s butter and other fats. Iran’s annual import growth is 44% and its world share is 3.5%. This put South Africa at a better chance to develop a new market with Iran. South Africa can also expand its export market to Zimbabwe because its annual import growth is still the highest (64%).
67

7.1.6. Cheese and Curd Table 27: List of importing markets for the product exported by South Africa in 2010 South Africa’s exports represent 0.04% of world exports of cheese and curd, its ranking in world exports is 55.
Trade Indicators
Importers
Exported value
2010 (USD
thousand)
Trade balance
2010 (USD
thousand)
Share in
South Africa'
s exports (%)
Exported
quantity 2010
Quantity unit
Unit value
(USD/unit)
Exported
growth in value between 2006-
2010 (%, p.a.)
Exported
growth in
quantity
between 2006-
2010 (%, p.a.)
Exported
growth in value between 2009-
2010 (%, p.a.)
Ranking of
partner countries in world
imports
Share of
partner countries in world
imports (%)
Total import growth in value
of partner countri
es between 2006-
2010 (%, p.a.)
Tariff (estimated) faced by South
Africa (%)
World 10491 -22985 100 2082 Tons 5039 28 13 41 100 7 Mozambique 4049 4049 38.6 809 Tons 5005 22 -3 61 151 0 22 12.2 Zimbabwe 1837 1837 17.5 335 Tons 5484 158 133 36 145 0 151 40 Zambia 1668 1668 15.9 362 Tons 4608 41 30 45 147 0 35 0 Angola 595 595 5.7 120 Tons 4958 11 15 63 77 0.1 16 10 Malawi 591 591 5.6 134 Tons 4410 21 27 6 171 0 19 25
68
Sources: ITC calculations based on COMTRADE statistics.

Table 27 shows that during 2010 South Africa exported a total of 10 491 tons of cheese and curd at an average value of US$ 5 039/unit. South Africa exported greater quantities of cheese and curd to Mozambique, Zimbabwe and Zambia. The greatest share of South African cheese and curd exports were destined to Mozambique which commanded 38.6% share during the year 2010 followed by Zimbabwe with 17.5% then Zambia by 15.9%. South Africa’s cheese and curd exports increased by 28% in value and 13% in quantity between the periods 2006 and 2010. During the same period, exports of cheese and curd to Mozambique increased by 22% in value and declined by 3% in quantity; and Zimbabwe increased in value and quantity by 158% and 133% respectively. Between the periods 2009 and 2010, South Africa’s exports of cheese and curd increased by 41% in value. During the same period, Mozambique and Zimbabwe increased by 61% and 36% respectively in value.
69

70

The chart illustrates that that South Africa’s exports of cheese and curd represent 0.04% of the world exports. Between 2006 and 2010 South Africa is losing the market share of cheese and curd exports to Mozambique, Angola, Congo, Mauritius, Nigeria, Uganda and Kenya because its exports were growing at a rate that is less than their import growth from the rest of the world. During the same period, South Africa is gaining the market share of cheese and curd exports to Ghana, Zambia, Democratic Republic of Congo (DRC), Malawi, Greece, United Arab Emirates, Zimbabwe, Seychelles, Saint Helena, Ethiopia and United Republic of Tanzania were growing at a rate that is greater than their imports from the rest of the world. This means South Africa is gaining the market shares in both dynamic market (Ghana, Greece, Zimbabwe, Saint Helena, Ethiopia, Zambia and Malawi) and declining market (United Arab Emirates, Seychelles and United Republic of Tanzania).
71

72

The chart shows that Greece is the world’s greatest importer of cheese and curd, but is not the main importer of South African cheese and curd. Its share in South African market is 0.07% and its annual growth is 5%. This makes it impossible for South Africa to develop a market in Greece. Zimbabwe is the most attractive market for South Africa due to its annual growth of 151%.
73
7.2. Imports
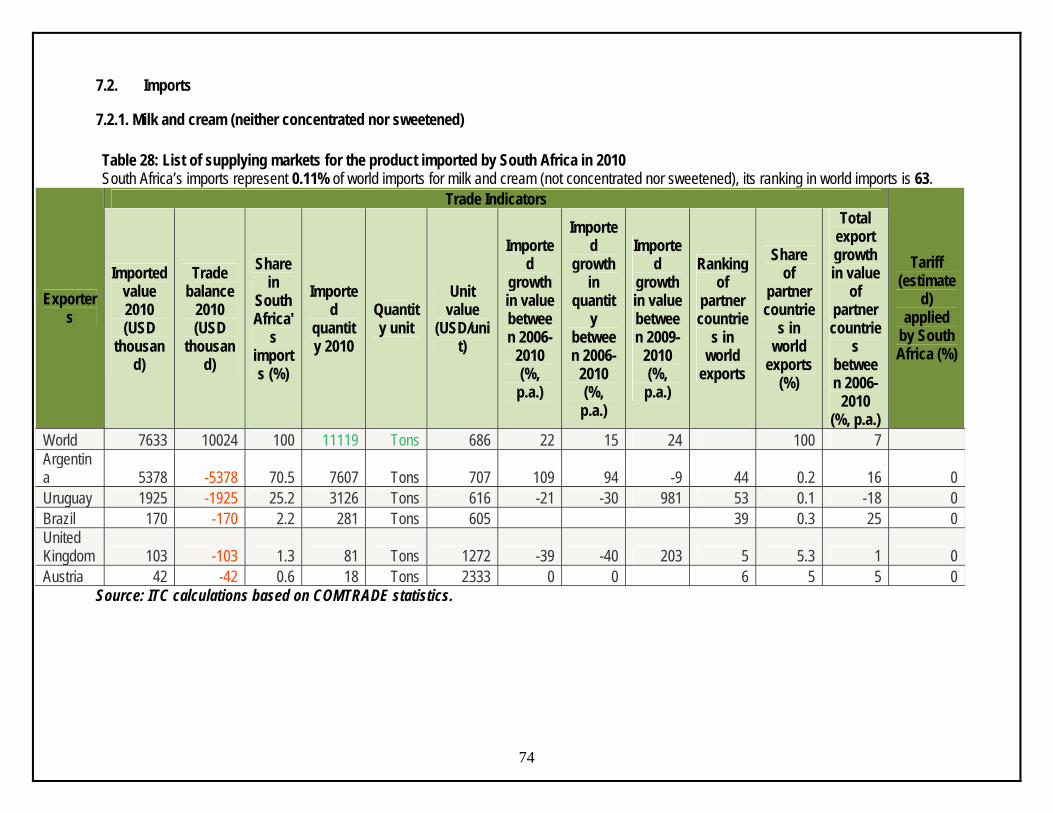
7.2.1. Milk and cream (neither concentrated nor sweetened) Table 28: List of supplying markets for the product imported by South Africa in 2010 South Africa’s imports represent 0.11% of world imports for milk and cream (not concentrated nor sweetened), its ranking in world imports is 63.
Trade Indicators
Exporters
Imported value 2010 (USD
thousand)
Trade balance
2010 (USD
thousand)
Share in
South Africa'
s imports (%)
Imported
quantity 2010
Quantity unit
Unit value
(USD/unit)
Imported
growth in value between 2006-
2010 (%, p.a.)
Imported
growth in
quantity
between 2006-
2010 (%, p.a.)
Imported
growth in value between 2009-
2010 (%, p.a.)
Ranking of
partner countrie
s in world
exports
Share of
partner countrie
s in world
exports (%)
Total export growth in value
of partner countrie
s between 2006-
2010 (%, p.a.)
Tariff (estimate
d) applied
by South Africa (%)
World 7633 10024 100 11119 Tons 686 22 15 24 100 7 Argentina 5378 -5378 70.5 7607 Tons 707 109 94 -9 44 0.2 16 0 Uruguay 1925 -1925 25.2 3126 Tons 616 -21 -30 981 53 0.1 -18 0 Brazil 170 -170 2.2 281 Tons 605 39 0.3 25 0 United Kingdom 103 -103 1.3 81 Tons 1272 -39 -40 203 5 5.3 1 0 Austria 42 -42 0.6 18 Tons 2333 0 0 6 5 5 0
74
Source: ITC calculations based on COMTRADE statistics.

Table 28 shows that during 2010 South Africa imported a total of 7 633 tons of milk and cream (not concentrated nor sweetened), at an average value of US$ 686/unit. South Africa imported greater quantities of milk and cream, (not concentrated or sweetened) from Argentina, Uruguay and Brazil. The greatest share of South African milk and cream (not concentrated or sweetened) imports originated from Argentina which commanded 70.5% share during the year 2010 followed by Uruguay with 25.2% then follow Brazil by 2.2%. South Africa’s milk and cream (not concentrated or sweetened) imports increased by 22% in value and 15% in quantity between the periods 2006 and 2010. During the same period, imports of milk and cream (not concentrated or sweetened) from Argentina increased by 109% in value and 94% in quantity; and Uruguay decreased in value and quantity by 21% and 30% respectively. Between the periods 2009 and 2010, South Africa’s imports of milk and cream (not concentrated or sweetened) increased by 24% in value. During the same period imports of milk and cream from Argentina of milk and cream (not concentrated or sweetened) exports to South Africa decreased by 9% and Uruguay’ s imports increased by 981% respectively in value.
75

76

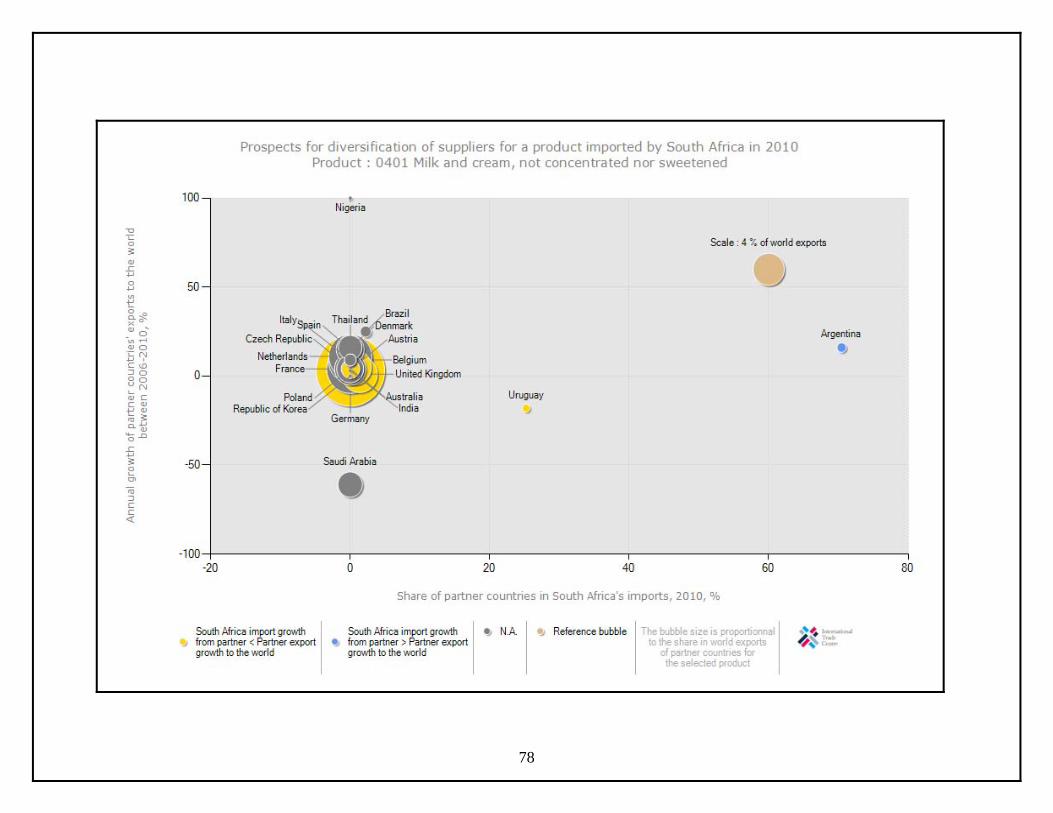
The chart illustrates that South Africa’s imports between 2006 and 2010 represent 0.11% of the world’s imports of milk and cream, not concentrated or sweetened. Imports from Germany, Australia, Austria, Uruguay and United Kingdom were growing at a rate that is less than their export growth to the rest of the world. This means that South Africa is losing the market share in the mentioned countries. During the same period, South Africa is gaining the market share of milk and cream, not concentrated or sweetened imports from Argentina because South Africa’s import growth were growing at a rate that is greater than Argentina’s exports to the rest of the world. The most competitive market is Germany with the world market share of 21.8% followed at a distance by United Kingdom with a world market share of 5.3%.
77
78
The chart illustrates that Germany is not a big supplier of South Africa’s market for milk and cream (not concentrated or sweetened) but it is the world’s greatest exporter of milk and cream (not concentrated or sweetened) over the period 2006 to 2010. Even though Germany is the main supplier (21.8% share of world’s exports), its annual growth of 3% shows that it not easy for South Africa to penetrate its market. South Africa can diversify to Nigeria which has the lowest world’s exports share of 0% but its annual growth is at 207%.
79

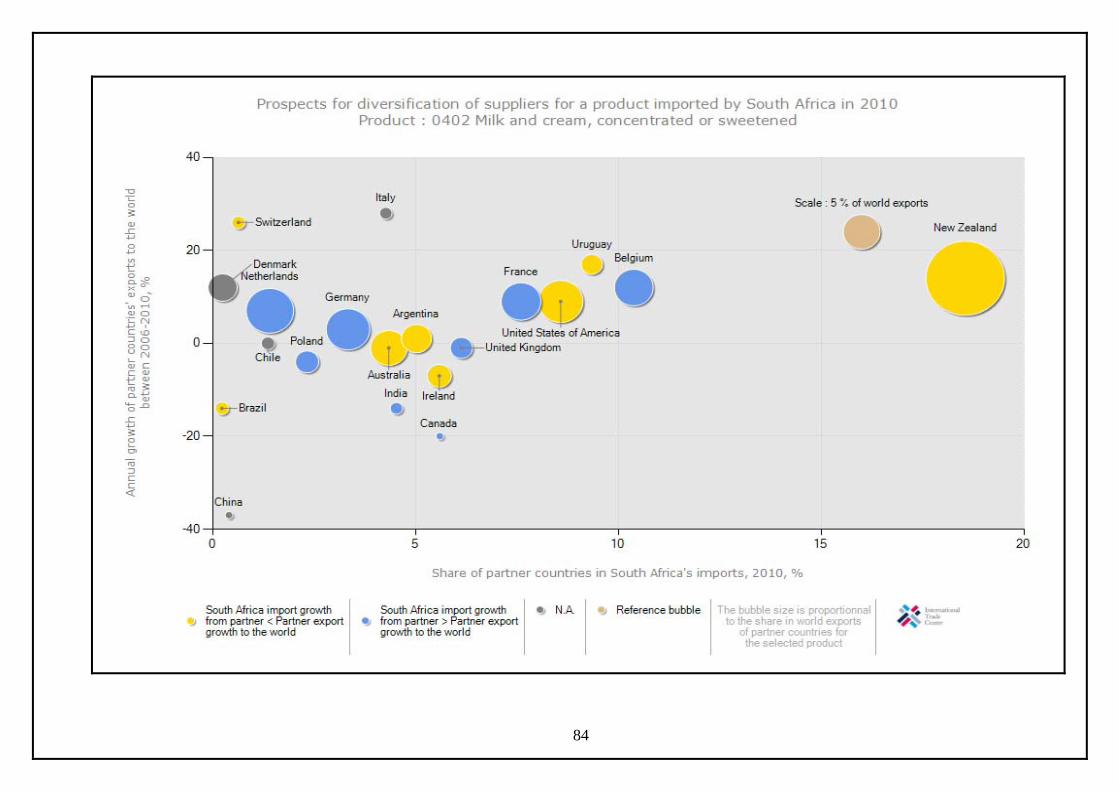
7.2.2. Milk and cream, concentrated or sweetened Table 29: List of supplying markets for the product imported by South Africa in 2010 South Africa’s imports represent 0.15% of world imports for milk and cream (concentrated or sweetened), its ranking in world imports is 86.
Trade Indicators
Exporters
Imported value 2010 (USD
thousand)
Trade balance
2010 (USD
thousand)
Share in
South Africa'
s imports (%)
Imported
quantity 2010
Quantity unit
Unit value
(USD/unit)
Imported
growth in value between 2006-
2010 (%,
p.a.)
Imported
growth in
quantity
between 2006-
2010 (%,
p.a.)
Imported
growth in value between 2009-
2010 (%,
p.a.)
Ranking of
partner countrie
s in world
exports
Share of
partner countrie
s in world
exports (%)
Total export growth in value
of partner countrie
s between 2006-
2010 (%, p.a.)
Tariff (estimated) applied by South Africa (%)
World 22922 -3716 100 6922 Tons 3311 -10 -14 75 100 6 New Zealand 4253 -4248 18.6 1253 Tons 3394 -17 -21 133 1 25.2 14 22.3 Belgium 2380 -2380 10.4 670 Tons 3552 30 41 260 6 5.8 12 22.3 Uruguay 2143 -2143 9.3 650 Tons 3297 15 8 99 14 1.5 17 22.3 United States of America 1967 -1955 8.6 611 Tons 3219 -8 -13 1211 3 7.6 9 22.3 France 1743 -1743 7.6 559 Tons 3118 214 220 -15 5 6 9 22.3
80
Source: ITC calculations based on COMTRADE statistics.

Table 29 shows that during 2010 South Africa imported a total of 22 922 tons of milk and cream (concentrated or sweetened), at an average value of US$ 3 311/unit. South Africa imported greater quantities of milk and cream, (concentrated or sweetened) from New Zealand, Belgium and Uruguay. The greatest share of South African milk and cream (concentrated or sweetened) imports originated from New Zealand which commanded 18.6% share during the year 2010 followed by Belgium (10.4%) and Uruguay (9.3%). South Africa’s milk and cream (not concentrated or sweetened) imports decreased by 10% in value and 14% in quantity between the periods 2006 and 2010. During the same period, imports of milk and cream (concentrated or sweetened) from New Zealand also decreased by 17% in value and 21% in quantity; and Belgium increased in value and quantity by 30% and 41% respectively. Between the periods 2009 and 2010, South Africa’s imports of milk and cream (concentrated or sweetened) increased by 75% in value. During the same period, New Zealand and Belgium’s milk and cream (concentrated or sweetened) exports to South Africa also increased by 133% and 260% in value. United Kingdom commanded 6.1% of South Africa’s milk and cream (concentrated or sweetened) import market in 2010 and its exports were growing by 286% in quantity during the period 2006 and 2010. It represents a potential supplier for South Africa’s milk and cream (concentrated or sweetened).
81

82

The chart illustrates that between 2006 and 2010 South Africa’s milk and cream (concentrated or sweetened) imported from New Zealand, Argentina, Australia, United States of America, Uruguay, Switzerland, Ireland and Brazil were growing at a rate that is less than their export growth to the rest of the world. New Zealand is the most competitive market because its world share is 25.2% and its annual growth is 14%. During the same period, South Africa’s milk and cream, concentrated or sweetened imports from Germany, Belgium, Netherlands, Poland, France, India, Canada and United Kingdom were growing at a rate that is greater than their exports to the rest of the world. Netherlands is the second competitive market with a world market share of 8.9% and an annual growth of 7%.
83
84

The chart illustrates that New Zealand is not a big supplier of South Africa’s market for milk and cream (concentrated or sweetened) but it is the main world exporter and its market was growing (14%) over the period 2006to 2010. New Zealand is therefore the biggest prospective supplier for South Africa’s milk and cream (concentrated or sweetened). The chart also shows that Italy has experienced highest annual growth rate of 28% during 2006 to 2010. It represents a small possible supplier for South Africa’s milk and cream (concentrated or sweetened). Belgium is the biggest supplier of South African’s Milk and Cream, Concentrate or sweetened. The share of Belgium in South African imports is 10.28% followed by France with 9%.
85

7.2.3. Buttermilk and yoghurt Table 30: List of supplying markets for the product imported by South Africa in 2010 South Africa’s imports represent 0.11% of world imports for Buttermilk and yoghurt, its ranking in world’s imports is 70.
Trade Indicators
Exporters
Imported value
2010 (USD
thousand)
Trade balance
2010 (USD
thousand)
Share in
South Africa'
s imports (%)
Imported
quantity 2010
Quantity unit
Unit value
(USD/unit)
Imported
growth in value between 2006-
2010 (%,
p.a.)
Imported
growth in
quantity
between 2006-
2010 (%,
p.a.)
Imported
growth in value between 2009-
2010 (%,
p.a.)
Ranking of
partner countrie
s in world
exports
Share of
partner countrie
s in world
exports (%)
Total export growth in value
of partner countrie
s between 2006-
2010 (%, p.a.)
Tariff (estimate
d) applied
by South Africa (%)
World 3893 6040 100 1379 Tons 2823 -5 -4 61 100 5 New Zealand 1080 -1078 27.7 333 Tons 3243 -8 -11 61 8 3 2 3.3 France 842 -842 21.6 328 Tons 2567 27 2 18.1 8 0.4 Belgium 559 -559 14.4 197 Tons 2838 -46 -44 1896 3 8.7 0 0.4 Netherlands 446 -446 11.5 168 Tons 2655 14 15 -12 10 2.6 12 0.4 United Kingdom 353 -353 9.1 111 Tons 3180 82 93 64 12 2 5 0.4 Ireland 249 -249 6.4 82 Tons 3037 -42 -15 16 1.3 0 0.4 Germany 136 -136 3.5 54 Tons 2519 2 30 -50 1 20.5 1 0.4
86
Source: ITC calculations based on COMTRADE statistics.

Table 30 shows that during 2010 South Africa imported a total of 3 893 tons of buttermilk and yoghurt, at an average value of US$ 2 823/unit. South Africa imported greater quantities of milk and cream, (concentrated or sweetened) from New Zealand, France, Belgium and Netherlands. The greatest share of South African buttermilk and yoghurt imports originated from New Zealand which commanded 27.7% share during the year 2010 followed by France (21.6%), Belgium (14.4%) and Netherlands (11.5%). South Africa’s buttermilk and yoghurt imports decreased by 5% in value and declined by 4% in quantity between the periods 2006 and 2010. During the same period, imports of buttermilk and yoghurt from New Zealand also decreased by 8% in value and 11% in quantity; and imports from Netherlands decreased by 45% in value and 44% in quantity. Between the periods 2009 and 2010, South Africa’s imports of buttermilk and yoghurt increased by 61% in value. During the same period, New Zealand, Belgium and Netherlands’ buttermilk and yoghurt exports to South Africa increased by 61%, 17 and 1896% respectively.
87

88
The chart illustrates that between 2006 and 2010 South Africa’s buttermilk and yoghurt imported from New Zealand, Belgium, Ireland, United States of America and Italy were growing at a rate that is less than their export growth to the world. During the same period, South Africa’s buttermilk and yoghurt imports from Netherlands, Germany and United Kingdom were growing at a rate that is greater than their exports to the rest of the world. Germany is the most competitive market during the periods 2006 and 2010 due to its world share market of 20.5% followed at a distance by Belgium with the world market share of 8.7%.
89

90

Germany is the biggest supplier of for buttermilk and yoghurt and has a share of 3.49% of South African’s imports. South Africa can either penetrate the Germany’s market or diversify to the fastest growing markets of buttermilk and yoghurt which are Bahrain and Islamic Republic of Iran. Germany has an annual export growth of 1% which is a limiting factor for South Africa to penetrate the market. Bahrain experienced an annual export growth of 112% and Islamic Republic of Iran grew by 76% during the periods 2006 to 2010. Although they have a world export share of 0% and 2.7% respectively they are the smallest prospective suppliers for South Africa due to their growth rates.
91

7.2.4. Whey and other natural milk products Table 31: List of supplying markets for the product imported by South Africa in 2010 South Africa’s imports represent 0.65% of world’s imports for whey and natural milk products; its ranking in world imports is 27.
Trade Indicators
Exporters
Imported
value 2010 (USD thousand)
Trade balance
2010 (USD
thousand)
Share in
South Africa
's imports (%)
Imported
quantity 2010
Quantity unit
Unit value
(USD/unit)
Imported
growth in
value between 2006-
2010 (%, p.a.)
Imported
growth in
quantity
between 2006-
2010 (%, p.a.)
Imported
growth in
value between 2009-
2010 (%, p.a.)
Ranking of
partner countries in world
exports
Share of
partner countries in world
exports (%)
Total export growth in value of partner
countries between
2006-2010 (%, p.a.)
Tariff (estimated) applied by
South Africa (%)
World 22736 -19525 100 7250 Tons 3136 13 0 42 100 0 France 8620 -8620 37.9 3570 Tons 2415 -1 -7 -2 3 13 -3 6.7 Australia 4304 -4304 18.9 1134 Tons 3795 11 173 12 1.9 -9 6.7 New Zealand 3672 -3666 16.2 720 Tons 5100 131 127 54 4 11.4 3 6.7 United States of America 2898 -2898 12.7 628 Tons 4615 151 97 122 1 16.9 7 6.7 Ireland 1513 -1513 6.7 683 Tons 2215 0 -8 160 7 2.9 -2 6.7 Germany 938 -938 4.1 221 Tons 4244 41 21 85 2 15.8 -3 6.7
92
Source: ITC calculations based on COMTRADE statistics.

Table 31 shows that during 2010 South Africa imported a total of 22 736 tons of whey and natural milk products, at an average value of US$ 3 136/unit. South Africa imported greater quantities of whey and natural milk products from France, Australia, New Zealand and United States of America (USA). The greatest share of South African whey and natural milk products’ imports originated from France which commanded 37.9% share during the year 2010 followed by Australia, New Zealand and USA with 18.9%, 16.2, and 12.7% respectively. South Africa’s whey and natural milk products imports increased by 13% in value and declined to 0% in quantity between the periods 2006 and 2010. During the same period, imports of whey and natural milk products from France decreased by 1% in value and 7% in quantity; and imports from Australia increased by 11% in quantity. New Zealand experienced drastic increases of 131% in value and 127% in quantity during 2006 to 2010. Between the periods 2009 and 2010, South Africa’s imports of whey and natural milk products experienced an increase of 42% in value. During the same period, France’ whey and natural milk products exports to South Africa decreased by 2% in value while imports from Australia and New Zealand increased by 173% and 54% respectively in value. United State of America (USA) represents a possible supplier to South Africa of whey and natural milk products because its import growth increased by 151% in value and 97% in quantity during 2006 to 2010.
93

94

The chart illustrates that between 2006 and 2010 South Africa’s whey and natural milk products imported from Netherlands and Denmark were growing at a rate that is less than their export growth to the rest of the world. During the same period, South Africa’s whey and natural milk products imported from United States of America (USA), New Zealand, Germany, Argentina, France and Ireland were growing at a rate that is greater than their exports to the rest of the world. The most competitive supplier of whey and natural milk products is USA which has a world‘s exports share of 16.9% followed by Germany by 15.8% and New Zealand by 11.4%. South Africa’s import growth from these countries is more that their export growth to the world.
95
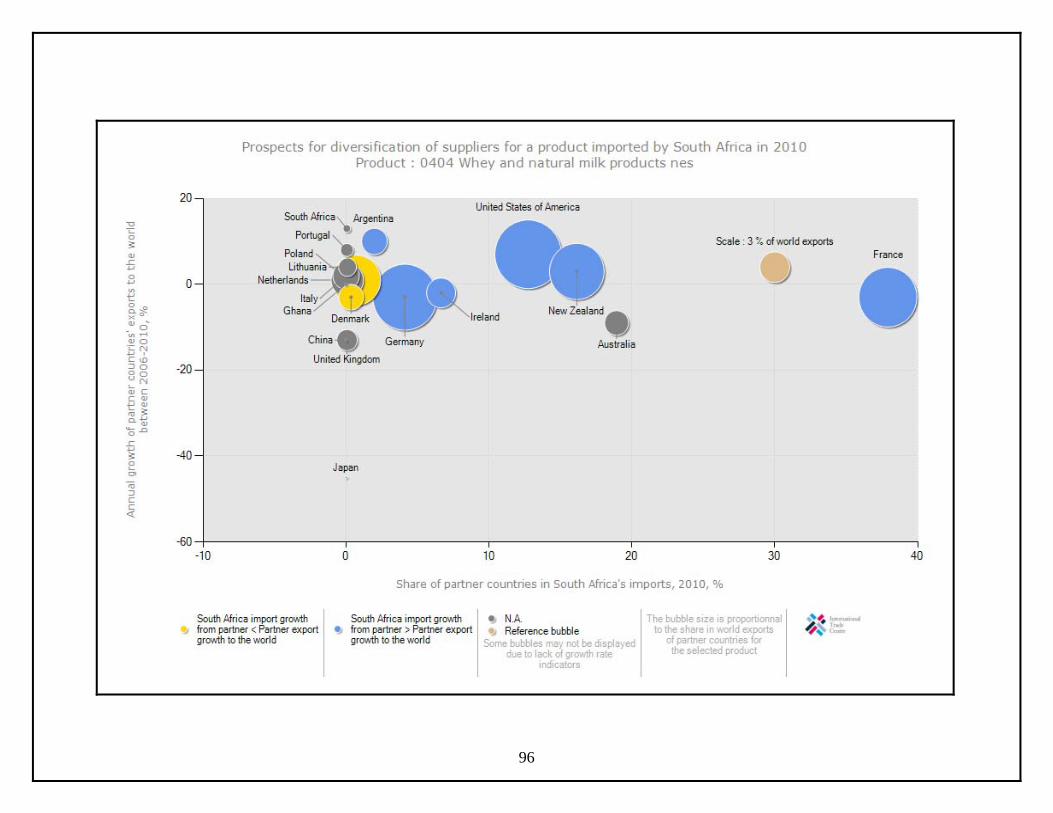
96

South Africa is already importing the biggest exporters of whey and natural milk products which are USA and Germany. USA has a world market share of 16.9% while Germany has a world market share of 15.8% during 2010. They have a share of South Africa’s imports of 12.75% and 4.13% respectively. South Africa can look on penetrating the market of these biggest markets or diversify to Portugal which has a growth rate of 7%. Portugal’s growth rate is 1% higher than USA, Therefore it might not be necessary for South Africa to diversify because it is already importing from the most attractive markets.
97
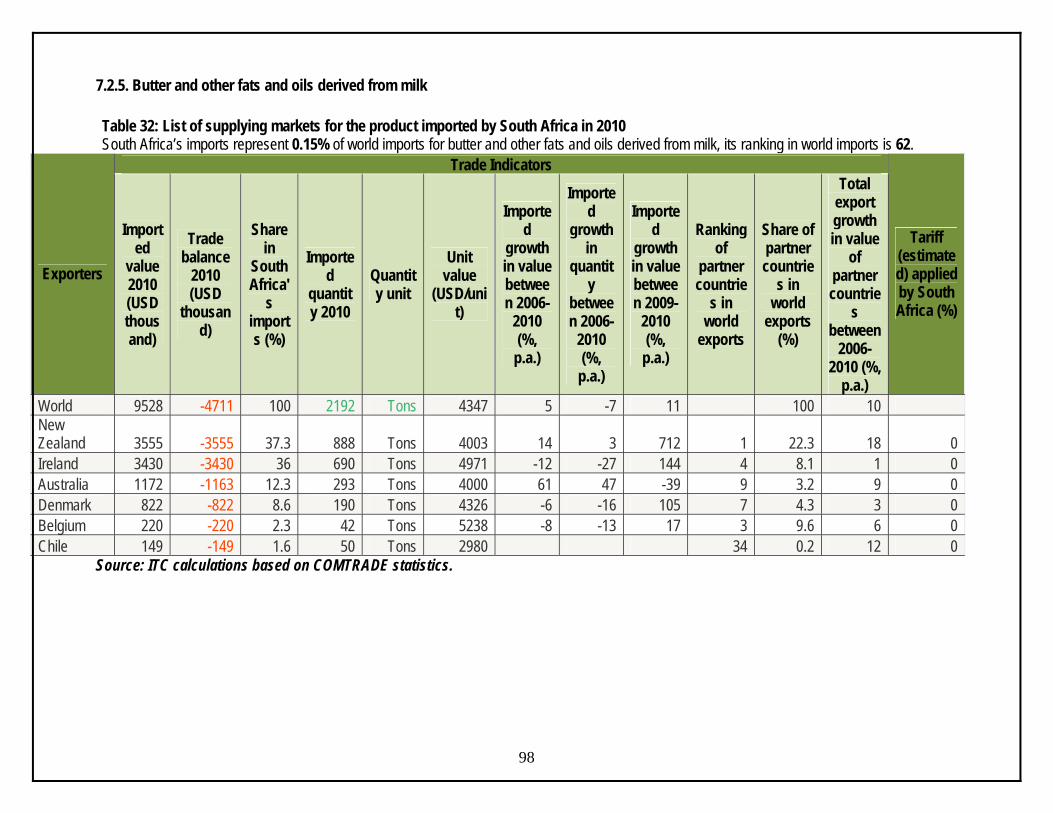
7.2.5. Butter and other fats and oils derived from milk Table 32: List of supplying markets for the product imported by South Africa in 2010 South Africa’s imports represent 0.15% of world imports for butter and other fats and oils derived from milk, its ranking in world imports is 62.
Trade Indicators
Exporters
Imported
value 2010 (USD thousand)
Trade balance
2010 (USD
thousand)
Share in
South Africa'
s imports (%)
Imported
quantity 2010
Quantity unit
Unit value
(USD/unit)
Imported
growth in value between 2006-
2010 (%,
p.a.)
Imported
growth in
quantity
between 2006-
2010 (%,
p.a.)
Imported
growth in value between 2009-
2010 (%,
p.a.)
Ranking of
partner countrie
s in world
exports
Share of partner countrie
s in world
exports (%)
Total export growth in value
of partner countrie
s between
2006-2010 (%,
p.a.)
Tariff (estimated) applied by South Africa (%)
World 9528 -4711 100 2192 Tons 4347 5 -7 11 100 10 New Zealand 3555 -3555 37.3 888 Tons 4003 14 3 712 1 22.3 18 0 Ireland 3430 -3430 36 690 Tons 4971 -12 -27 144 4 8.1 1 0 Australia 1172 -1163 12.3 293 Tons 4000 61 47 -39 9 3.2 9 0 Denmark 822 -822 8.6 190 Tons 4326 -6 -16 105 7 4.3 3 0 Belgium 220 -220 2.3 42 Tons 5238 -8 -13 17 3 9.6 6 0 Chile 149 -149 1.6 50 Tons 2980 34 0.2 12 0
98
Source: ITC calculations based on COMTRADE statistics.

Table 32 shows that during 2010 South Africa imported a total of 9 528 tons of butter and other fats, at an average value of US$ 4 347/unit. South Africa imported greater quantities of butter and other fats from New Zealand, Ireland and Australia. The greatest share of South African butter and other fats imports originated from New Zealand which commanded 37.3% share during the year 2010 followed by Ireland by 36% then Australia (12.3. South Africa’s butter and other fats imports increased by 5% in value and declined by 7% in quantity between the periods 2006 and 2010. During the same period, imports of butter and other fats from New Zealand increased by 14% in Value and 3% in quantity while Ireland decreased in value and quantity by 12% and 27% respectively. Australia experienced high increases of 61% in value and 47% in quantity. Between the periods 2009 and 2010, South Africa’s imports of butter and other fats increased by 11% in value. During the same period, New Zealand’s butter and other fats exports to South Africa increased by 712% in value while imports from Ireland increased by 144% and Australia decreased by 39% in value.
99

100

The chart illustrates that between 2006 and 2010 South Africa’s butter and other fats imported from New Zealand, Belgium, United Kingdom, Denmark and Ireland were growing at a rate that is less than their export growth to the rest of the world. During the same period, South Africa’s butter and other fats imports from France, Germany and Australia were growing at a rate that is greater than their exports to the rest of the world. New Zealand is the most competitive supplier of butter and other fats because its world market share is 22.3% followed by Belgium with 9.6% and Ireland with 8.1%.
101

102

The chart illustrates that New Zealand is the main supplier of world’s butter and other fats. If South Africa wishes to diversify from Germany, France and Australia New Zealand will be the prospective supplier due to its world export share of 22.3%. USA is the most attractive market because of its highest annual export growth of 52%. USA will be the small (3% world exports share) prospective market for South Africa.
103
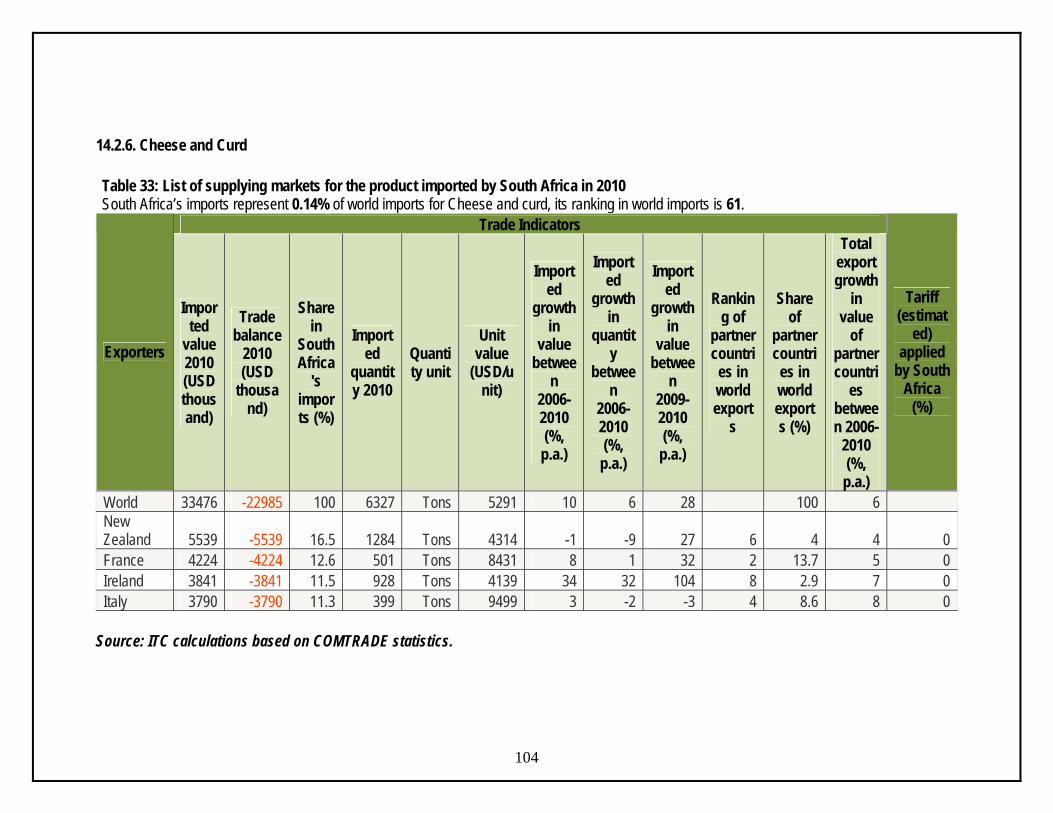
14.2.6. Cheese and Curd Table 33: List of supplying markets for the product imported by South Africa in 2010 South Africa’s imports represent 0.14% of world imports for Cheese and curd, its ranking in world imports is 61.
Trade Indicators
Exporters
Imported
value 2010 (USD thousand)
Trade balance
2010 (USD
thousand)
Share in
South Africa
's imports (%)
Imported
quantity 2010
Quantity unit
Unit value
(USD/unit)
Imported
growth in
value betwee
n 2006-2010 (%,
p.a.)
Imported
growth in
quantity
between
2006-2010 (%,
p.a.)
Imported
growth in
value betwee
n 2009-2010 (%,
p.a.)
Ranking of
partner countries in world export
s
Share of
partner countries in world exports (%)
Total export growth
in value
of partner countri
es between 2006-
2010 (%, p.a.)
Tariff (estimat
ed) applied
by South Africa
(%)
World 33476 -22985 100 6327 Tons 5291 10 6 28 100 6 New Zealand 5539 -5539 16.5 1284 Tons 4314 -1 -9 27 6 4 4 0 France 4224 -4224 12.6 501 Tons 8431 8 1 32 2 13.7 5 0 Ireland 3841 -3841 11.5 928 Tons 4139 34 32 104 8 2.9 7 0 Italy 3790 -3790 11.3 399 Tons 9499 3 -2 -3 4 8.6 8 0
104
Source: ITC calculations based on COMTRADE statistics.

Table 33 shows that during 2010, South Africa imported a total of 33 476 tons of cheese and curd, at an average value of US$ 5 291/unit. South Africa imported greater quantities of cheese and curd from New Zealand, France, Ireland and Italy. The greatest share of South African cheese and curd imports originated from New Zealand which commanded 16.5% share during the year 2010 followed by France (12.6%), Italy (11.5) and Ireland (11.3%). South Africa’s cheese and curd imports increased by 10% in value and 6% in quantity between the periods 2006 and 2010. During the same period, imports of cheese and curd from New Zealand decreased by 1% in value and 9% in quantity; imports from France increased by 8% in value and 1% in quantity; and imports from Italy increased by 34% in value and by 32% in quantity. Between the periods 2009 and 2010, South Africa’s imports of cheese and curd decreased by 28% in value. During the same period, New Zealand’s cheese and curd exports to South Africa increased by 27% in value and imports from France increased by 32% in value while those from Italy also increased by 104%.
105

106
The chart illustrates that between 2006 and 2010 South Africa’s cheese and curd imported from Switzerland, Italy, New Zealand and Belgium were growing at a rate that is less than their export growth to the rest of the world. During the same period, South Africa’s cheese and curd imports from Australia, Austria, United States of America, Morocco, Netherlands, Germany, Argentina, Spain, Denmark, France, Greece, Lithuania Ireland and United Kingdom were growing at a rate that is greater than their exports to the rest of the world. The most competitive suppliers of cheese and curd are Germany, France and Netherlands with the world export market share of 15.6%, 13.7% and 12.6% respectively during the period 2006 to 2010.
107

108

South Africa’s imports of Cheese and Curd are from the biggest and fastest growing markets in the world. Therefore there is no need for South Africa to diversify its import market except to penetrate more on the current suppliers especially USA because it is the fastest growing market (24%) and has a small share of South Africa’s import market of 8.25%.
8. ACKNOWLEDGEMENTS 1. Statistics and Economic Analysis.
www.daff.gov.za. 2. Clover
Roodepoort South Africa 1715 Tel: +27 (11) 471 1400 Fax: +27 (11) 471 1504 www.clover.co.za
3. Competition Commission Tel: 012 394 3300 Fax: 012 394 0169 www.comptrib.co.za.
4. Dairy Belle (PTY) LTD Private Bag 208 Bryanston 2021 Tel: 011 840 4000 Fax: 011 514 0084 www.dairybelle.co.za
5. International Trade Center www.trademap.org
6. LactoData
www.dairyconnect.co.za.
7. MacMap www.macmap.org
8. Milk Producers Organization (MPO). Dr Koos Coetzee 012-8435600 www.mpo.co.za
9. National Agricultural Marketing Council (NAMC). Tel: (012) 3411115 Fax: (012) 3411911 www.namc.co.za
10. Nestle
P O Box 50661, Randburg, 2125 Fax: (011) 889 6559 086 009 6116 (General) 086 009 6789 (Nutrition) 0800 001 691 (Pet Care) www.nestle.co.za
11. Parmalat SA(PTY)LTD
Stellenbosch 7600 Tel: +27 21 809 1400 Fax: +27 21 809 1518 www.parmalat.co.za
12. Quantec.
www.Quantec.co.za.
13. Trade & Industrial Policy Strategies (TIPS)
www.tips.org.za.
109

Disclaimer:
110
This document and its contents have been compiled by the Department of Agriculture, Forestry and Fisheries for the purpose of detailing the dairy industry. The views expressed in this document are those of the Department of Agriculture, forestry and fisheries with regard to agricultural industry, unless otherwise stated and, therefore the Department of Agriculture, forestry and fisheries does not accept responsibility for any errors in such information and anyone acting on such information does so entirely at his or her own risk.