a profile of women working in ontario’s music industry · a profile of women working in ......
TRANSCRIPT

A Profile of Women Working in Ontario’s Music Industry Final Report
May 26, 2015
Presented to:
Presented by:

Profile of Women Working in the Ontario Music Industry – Final Report 2 of 32
Table of Contents
Executive Summary 5
1. Introduction 10
1.1 Objectives for this report 10
1.2 Approach and methodology 10
1.3 Ontario’s music industry 12
1.4 About Women in Music Canada 13
2. Women Working in Ontario’s Music Industry 14
2.1 Demographic snapshot 14
2.2 Work activity and role 17
2.3 Compensation 21
3. Challenges and Opportunities 25
3.1 Job satisfaction 25
3.2 Career impacts and factors of influence 26
4. Conclusion 30
Appendix: Survey Approach and Methodology 31
Industry Role Taxonomy 31
Calculation of Average Earnings by Industry Role 31
Table of Figures
Figure 1 Age distribution of women working in Ontario’s music industry (n=455) ............................................ 14 Figure 2 Ethnicity of women working in Ontario’s music industry (n=452) ....................................................... 15 Figure 3 Work location for women in Ontario’s music industry (n=446) ........................................................... 15 Figure 4 Highest education level completed by women in the Ontario music industry (n=454)......................... 16 Figure 5 Portion of women in the Ontario music industry with children under the age of 18 (n=455) ................ 16 Figure 6 Type of worker, women in the music industry in Ontario (n=455) ...................................................... 17 Figure 7 Music industry roles in which women worked (n=395) ...................................................................... 18 Figure 8 Years of experience for women working in the Ontario music industry (n=455) .................................. 18 Figure 9 Distribution of women by level of seniority (n=270) .......................................................................... 19 Figure 10 Average hours worked per year (n=416) ......................................................................................... 20 Figure 11 Average hours worked by women per week, by industry (n=416) .................................................... 21 Figure 12 Average annual music industry salaries in Ontario, compared to best available data ......................... 22
Profile of Women Working in the Ontario Music Industry – Final Report 3 of 32
Figure 13 Average total annual earnings for women by industry role (n=395).................................................. 23 Figure 14 Average total annual earnings for women by level of seniority (n=395) ............................................ 24 Figure 15 Average annual earnings for women by worker type (n=395) .......................................................... 24 Figure 16 Portion of women whose education is related to their current employment (n=455) ........................ 25 Figure 17 Women’s average primary job satisfaction by worker type (n=282) .................................................. 26 Figure 18 Average impact of various factors on women’s career progression, across all worker types (n=455) ... 27

Profile of Women Working in the Ontario Music Industry – Final Report 4 of 32
Generously Supported by:
Disclaimer: Funding for this study was provided by the Ontario Media Development Corporation. Any opinions, findings, conclusions or recommendations expressed in this material are those of the author and do not necessarily reflect the views of the Ontario Media Development Corporation or the Government of Ontario. The Government of Ontario and its agencies are in no way bound by the recommendations contained in this document.
We acknowledge the financial support of FACTOR, the Government of Canada through the Department of Canadian Heritage (Canada Music Fund) and of Canada’s Private Radio Broadcasters.
Profile of Women Working in the Ontario Music Industry – Final Report 5 of 32
Executive Summary The Ontario music industry is an award-winning, internationally-recognized sector which produces top artists, songwriters, innovations and collaborations. Ontario is home to Canada’s largest music industry and yet there is little available data on the employment of women and the challenges they face navigating through their careers.
Established in 2012, Women in Music Canada (WIM-C) is a federally registered non-profit organization dedicated to fostering equality in the music industry through the support and advancement of women. WIM-C engaged Nordicity in order to conduct the research and analysis to develop a baseline of credible data about women in the music industry in Ontario on which to be able to measure progress.
Approach & Methodology
Nordicity developed and deployed an online survey to gather the key profile information about women working in the music industry in Ontario. The survey was targeted at individuals working in the music industry in Ontario and received 455 usable responses. The survey was publicly available and spread through a wide variety of music industry websites, social media, newsletters and mailing lists by independent PR firm, rock-it promotions. On the basis of the large sample size and lack of obvious selection bias, the survey sample can reasonably be considered a randomized sample of the women working in the music industry.
Demographic Profile
According to the survey responses, women working in the Ontario music industry tended to be:
Somewhat younger than women in Ontario’s population as a whole - 41% of women working in the music industry were under the age of 30 vs. 20% of the population in Ontario as a whole (based on Statistics Canada Labour Force Survey data from 2014).
Relatively homogeneous – 89% of survey respondents described themselves as white as compared to 63% of women across Ontario who identify as Caucasian, according to 2011 (i.e. the most recent) data from the National Household Survey (NHS) catalogue number 99-010-X2011028).
Clustered in the Greater Toronto Area (86%), which follows the major location of music industry activity in the province. There were also clusters of women in music working in Southwestern Ontario and Ottawa and surrounding region.
Well-educated – 41% had completed an undergraduate degree and an additional 13% had completed both undergraduate and graduate studies.
Industry Profile
The survey found that the majority of women working in the music industry (60%) do so as employees of music industry companies. The remaining 40% were entrepreneurial, working as company owners (21%) or primarily as freelancers and short-term contract employees (19%). Some 27% of women working in the music industry reported having worked more than one job in 2014. On

Profile of Women Working in the Ontario Music Industry – Final Report 6 of 32
average, women who identified as freelancers worked an average of 15 freelance/contract jobs per year.
Based on our survey results, one can observe that women in Ontario’s music industry are working in the following industry roles:
Women are working, for the most part in “Promotion and Marketing” roles (20%), in “Event Production” (17%) and as “Artists Managers and Agents” (16%).
A full 15% of women in the industry are working in admin and/or professional services roles such as HR, legal, accounting and other administrative roles.
They are least likely to work in “Music Production” (6%) roles and in Sales and Business Development (7%).
The majority of women who responded to the survey were at intermediate stages in their careers (39%). A relatively smaller share were entry-level workers (9%) or held executive positions (10%). When asked, 57% of women who responded to the survey indicated that they thought they were “Where they should be” at this stage in their careers. A secondary scan of employment of a range of music companies operating in Ontario (n=30), including among the survey responses, found that:
Of 104 named executive positions, just 24 or 23% were held by women;
48% of companies surveyed had no women represented in their executive tier.
A crucial measure of women’s work in the music industry is their level of compensation as compared to the average music industry worker. That is to say, the results below do not compare women’s earnings with their male counterparts, instead, they compare women’s earnings with the best available data for average salaries in the Ontario and/or Canadian music industry. The various bars in the chart below represent:
1) Average salary of women in the music industry who responded to the survey ($47,185);
2) Average salary of women in the music industry who responded to the survey and identified themselves as music industry company employees (i.e., as opposed freelancers and/or company owners) ($50,537);
3) Average salaries of women in the music industry who responded to the survey and indicated “major label” or “major music publisher” as primary company roles ($53,857);
4) Average sound recording industry1 salary in Canada reported by PwC in 2010 ($60,100);
5) Average music industry salaries based on companies who responded to our survey (n.b., sample represents approximately 100 full time workers) ($56,000);
6) Average salary for employees of independent music companies in Canada in 2011 ($22,250).
1 Defined as those companies involved in developing, publishing, manufacturing, distributing, marketing and promoting musical recordings and artists and performers.

Profile of Women Working in the Ontario Music Industry – Final Report 7 of 32
Exhibit 1 - Average annual music industry salaries in Ontario, compared to best available data2
Source: Employment in Ontario’s Music Industry Survey, 2014-15 (Nordicity), PwC/Music Canada Economic Impact of the Sound Recording Industry in Canada (2012), Nordicity/CIMA Sound Analysis: An examination of the Canadian Independent Music Industry (2013).
The chart above illustrates that:
At $50,537, women employees of music companies earned (in 2014) about 10% less than the average music company employee. According to Nordicity’s company-level survey, in 2014, the average earnings for a music company employee were $56,000 – slightly lower than reported in the 2010 Music Canada study.
Women employees of music companies earned approximately 7% more than the average women working in the music industry that is to say $50,537 as compared to $47,185 (for example as freelancers and or business owners) in 2014.
Women working at “Major Labels/Publishers” reported higher earnings than the average survey respondent, according to the survey, and
The annual salaries of women in the music industry in 2014 were 27% lower on average than the most recently available average annual salary for the sound recording segment in Canada.
2 n=286 for all women, n=214 for women music company employees, n=35 for women in major labels/publishers
$47,185$50,537
$53,857$60,100
$56,000
$22,250
$0
$10,000
$20,000
$30,000
$40,000
$50,000
$60,000
$70,000
All women (2014) Women musiccompany
employees(2014)
Women in MajorLabels/Publishers
(2014)
Sound recordingindustry (2010)
Music companyemployees
(2014)
Independentmusic company
employees(2011)

Profile of Women Working in the Ontario Music Industry – Final Report 8 of 32
When survey results related to compensation were examined by role3, we found that:
The greatest salaries in 2014 were earned by Administrative/Professional Services roles ($46,610) which include Legal, IT, Accounting and HR, followed by Artist Managers and Agents ($46,385).
The lowest salaries were reported by Artists with an average salary of $24,134.
The figure below presents the average annual earnings for women by the level of seniority they have achieved in the industry. Respondents were able self-select the appropriate label which described their level of seniority.
Exhibit 2 Average total annual earnings for women by level of seniority (n=395)
Source: Employment in Ontario’s Music Industry Survey, 2014-15 (Nordicity)
There is a fairly broad range from entry-level to Executive as one might expect and the greatest increases are experienced in the jump from intermediate roles to senior-level roles and from senior-level roles to Executive.
Challenges, Opportunities and Conclusions
According to the survey and industry consultations, women in the music industry in Ontario continue to face numerous challenges. From lower pay across the board and low exposure to boardrooms/executive levels to a lack of workforce diversity and systemic gender discrimination, there is much work to be done and progress to be made.
3 To compute these figures, Nordicity first estimated how much of each survey respondent’s total income was attributable to work in each of the core music industry roles outlined in the survey. By-role average earnings were then adjusted according to the total share of survey respondents working in each role. Role taxonomy was based on Nordicity’s previous research in the Ontario music industry. For more information on how average incomes were estimated for industry role, please see the Appendix to this report.
$87,273
$65,574
$44,227$32,500 $28,333
$0
$20,000
$40,000
$60,000
$80,000
$100,000
Executive Senior Intermediate Junior Entry-level
Profile of Women Working in the Ontario Music Industry – Final Report 9 of 32
Women who responded to the survey indicated that:
1) Access to networking opportunities;
2) Overall workplace culture, and;
3) Access to mentors
…had had the most positive impacts on their career progression. Conversely:
1) Compensation practices
2) Gender balance in senior management and;
3) Overall gender balance in the workplace
…were rated the most negative factors with regard to career progression.
Although the results showed that “overall workplace culture” had the potential to have a positive impact on career progression, the open-ended survey responses raised some troubling concerns, which expose the experiences of some women working in the music industry. While the comments were not time bound, that is to say, not necessarily related to “recent” events (i.e., respondents could be describing experiences from earlier in their careers) they are nonetheless distressing. For example, gender-based discrimination and inappropriate workplace behavior, from bullying to sexual harassment was described by some survey respondents. When the workplace culture includes gender discrimination, the effects go beyond career advancement and affect other aspects of life. Many comments on challenges to career progression in the music industry also focused on increasing competition for music industry work in a tough economic climate.
There are numerous ways in which WIM-C can play a role in the future of the music industry, starting in Ontario. At an industry event related to this research, attendees voted on what interventions would be the most useful and impactful to their careers and career progression. Access to mentors and mentorship opportunities and access to training and professional development were seen as the most beneficial and/or highest priority actions to support women in their music careers. In this respect, not only is WIM-C positioned to help support women in the industry, the women themselves are highly engaged and committed to strengthening their careers and their networks. As a first step, this report provides a foundation or baseline for future analysis and tracking progress.

Profile of Women Working in the Ontario Music Industry – Final Report 10 of 32
1. Introduction In this section, Nordicity presents the objectives for this report - A Profile of Women Working in the Music Industry in Ontario - as well as the approach and steps taken to achieve these objectives.
1.1 Objectives for this report
The Ontario music industry is an award-winning, internationally-recognized sector which produces top artists, songwriters, innovations and collaborations. Ontario is home to Canada’s largest music industry and yet there is little available data on the employment of women and the challenges they face navigating through their careers.
Women in Music Canada (WIM-C) recognized that in order to better support and advocate for its members’ needs, it would require current and credible information about the profile of women working in the Ontario music industry. From industry segment and earnings to demographics, through this engagement, WIM-C also sought to shed more light on the challenges and opportunities facing women in the music industry in Ontario.4 This report is intended to provide a foundation for future research and analysis and a baseline of credible data on which to be able to measure progress.
This study is restricted to the Province of Ontario, although WIM-C is a national organization. Therefore, a final objective is to set a base for expanding this Ontario-based profile into a Canada-wide industry profile.
1.2 Approach and methodology
Nordicity developed a phased research approach in consultation with WIM-C in order to deliver the above-stated objectives.
Primary Data Gathering
There were three main sources of primary data for this study:
Individual Survey: Nordicity developed and deployed an online survey to gather the profile information identified in the data planning phase. The survey was targeted at individuals working in the music industry in Ontario. This survey was refined and tested by industry members and advisors during an in-depth consultation session hosted by WIM-C. The survey was promoted heavily for eight weeks and with the support of the PR agency rock-it-promotions. While the individual survey was open to men and women, the overwhelming
4 Note that the scope included those women working for both Canadian and foreign-controlled entities, freelancers, company owners and so on.

Profile of Women Working in the Ontario Music Industry – Final Report 11 of 32
majority of responses were from women and so the results are best utilized when filtered for women respondents.
Open-ended responses: Survey respondents were given the opportunity to provide additional thoughts in the survey, and these are presented throughout this report.
Company-Level Survey: A company-level survey was deployed to approximately 50 companies in operation in Ontario but gained fewer responses. The full sample represented just 100 full time workers in the music industry in Ontario. As such, these results are only reported when they can also be validated by other publicly-available sources. As a result, additional research was conducted looking at all publicly-available data from Statistics Canada, Industry Canada, Human Resources Skills Development Canada, the music industry database “Poll Star” (pollstar.com) and recently published reports from Music Canada, Canadian Independent Music Association and the OMDC’s Music Industry Profile.
Data Analysis and Reporting:
Representative Sample: With 455 individual level responses, the survey sample was deemed robust and varied enough in order to extrapolate results as representative of the industry.
Validation Exercise: Nordicity conducted its preliminary analysis and presented select survey findings a WIM-C industry event in March 2015. Over 100 women in the music industry were in attendance and had a chance to comment on findings and participate in a prioritization exercise in terms of key issues facing the industry.
Reporting: The results of the survey, secondary research and the validation exercise are included in this report. WIM-C intends to present findings during the 2015 North by Northeast (NXNE) Festival in Toronto.
A Note on Survey Representativeness
The survey sample was deemed to be representative of women working in the music industry in Ontario because a) it generated a robust response base and b) it was distributed extensively.
In all, the survey resulted in some 455 responses. The exact number of women working in the music industry in Ontario is unknown, but a simple statistical inference calculation tells us that a sample of this size could be used to extrapolate to a group of over 1 million within the 95% confidence interval (i.e. to a margin of error less than 5%). Moreover, there was no reason to believe that any significant selection biases existed with respect to the survey (i.e. no one group is more or less likely to have filled it out). The survey was publicly available and spread through a wide variety of music industry websites, social media, newsletters and mailing lists by independent PR firm, rock-it promotions.
On the basis of the large sample size and lack of obvious selection bias, the survey sample can reasonably be considered a randomized sample of the women working in the music industry.
Profile of Women Working in the Ontario Music Industry – Final Report 12 of 32
1.3 Ontario’s music industry
Ontario’s music industry is the largest in Canada and accounts for 82% of music industry revenues in Canada. Estimates suggest that 78% of national recording industry jobs are based in Ontario.5 Music industry companies in Canada are often considered and counted according to whether they belong to the “majors” – that is to say the Canadian-based branches of “foreign-owned” entities, or whether they are “independent” that is to say, “Canadian-owned.” In terms of the independent, Canadian-owned music industry, the Canadian Independent Music Association (CIMA) reports that:
Over 13,400 people are employed by the independent music industry in Canada or 4,300 people when one excludes artists.
A 2012 report from Music Canada which looked at the economic impact of the whole (i.e., not solely Canadian-owned) sector, reported that there were:
1,809 FTEs in the sound recording industry in 2010 (~81% of Canadian sound recording industry employment)
$108.8M in wages and salaries (~84% of Canadian total)
For the purposes of this report, and in consultation with WIM-C’s advisory committee, Nordicity separated the Ontario music industry into seven core industry roles:
Artists;
Artist managers/agents;
Promotion and marketing;
Sales and business development;
Administration and professional services;
Music production (and related activities);
Event promotion, and;
“Other.”
The roles above were undertaken across a number of different music industry segments. For instance, within music creation, broadcasting, music labels, music publishing and professional organizations (e.g. FACTOR, SOCAN). Each of these music industry segments utilize various combinations of these roles. The results presented in this report are not heavily-weighted towards a particular music industry segment (e.g. the survey sample of administration and professional services workers is not heavily broadcaster-based). Rather, the values (e.g. average salaries) calculated for each role could more accurately be described as averages across all music segments. More information about the activities associated with each of these roles is provided in Appendix A, including how Nordicity accounted for women working in hybrid roles/across multiple industry activities.
5 Music Canada/PwC, 2012

Profile of Women Working in the Ontario Music Industry – Final Report 13 of 32
1.4 About Women in Music Canada
Established in 2012, Women in Music Canada is a federally registered non-profit organization dedicated to fostering equality in the music industry through the support and advancement of women. Providing knowledge, strategy & solutions to its members and the greater community is its driving purpose.

Profile of Women Working in the Ontario Music Industry – Final Report 14 of 32
2. Women Working in Ontario’s Music Industry The results presented in this section of the report are based largely on the survey to individuals working in the music industry in Ontario. The total number of responses from women – approximately 455 - suggests that we can extrapolate these results as representative of women in the music industry in Ontario as a whole. All of the following charts contain an “n=” value, which indicates the number of usable survey responses received for the question related to each chart. Results from the Nordicity company-level survey have only been reported when they were also validated by independent sources and other secondary research.
2.1 Demographic snapshot
In order to profile women working in the music industry in Ontario, a starting point for consideration is their demographic composition. The figure below presents the distribution by age of women working in the music industry.
Figure 1 Age distribution of women working in Ontario’s music industry (n=455)
Source: Employment in Ontario’s Music Industry Survey, 2014-15 (Nordicity); Statistics Canada Labour Force Survey CANSIM Table 051-0001 (2014)
As we can see in the figure above, according to the survey responses, women working in the Ontario music industry skews somewhat younger than women in Ontario’s population as a whole (based on Statistics Canada Labour Force Survey data from 2014). According to the survey:
41% of women working in the music industry were under the age of 30.
Nearly 75% of women working in the music industry in 2014 were under the age of 40.
The figure below presents the ethnicity of women working in the Ontario music industry, according to the survey responses.
20%
16%
18%
20%
26%
41%
31%
18%
8%
2%
0% 5% 10% 15% 20% 25% 30% 35% 40% 45%
18 to 29 years old
30 to 39 years old
40 to 49 years old
50 to 59 years old
More than 60 years old
Women in music industry Women in overall Ontario population
Profile of Women Working in the Ontario Music Industry – Final Report 15 of 32
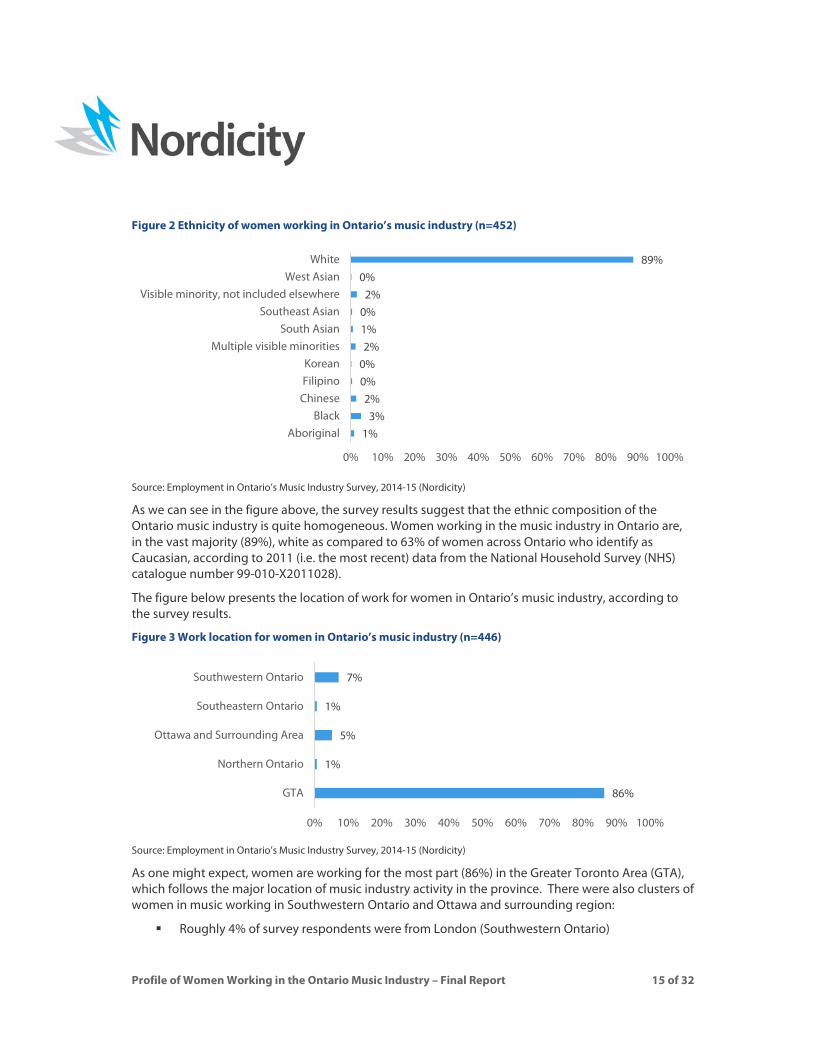
Figure 2 Ethnicity of women working in Ontario’s music industry (n=452)
Source: Employment in Ontario’s Music Industry Survey, 2014-15 (Nordicity)
As we can see in the figure above, the survey results suggest that the ethnic composition of the Ontario music industry is quite homogeneous. Women working in the music industry in Ontario are, in the vast majority (89%), white as compared to 63% of women across Ontario who identify as Caucasian, according to 2011 (i.e. the most recent) data from the National Household Survey (NHS) catalogue number 99-010-X2011028).
The figure below presents the location of work for women in Ontario’s music industry, according to the survey results.
Figure 3 Work location for women in Ontario’s music industry (n=446)
Source: Employment in Ontario’s Music Industry Survey, 2014-15 (Nordicity)
As one might expect, women are working for the most part (86%) in the Greater Toronto Area (GTA), which follows the major location of music industry activity in the province. There were also clusters of women in music working in Southwestern Ontario and Ottawa and surrounding region:
Roughly 4% of survey respondents were from London (Southwestern Ontario)
1%3%
2%0%0%2%
1%0%2%
0%89%
0% 10% 20% 30% 40% 50% 60% 70% 80% 90% 100%
AboriginalBlack
ChineseFilipinoKorean
Multiple visible minoritiesSouth Asian
Southeast AsianVisible minority, not included elsewhere
West AsianWhite
86%
1%
5%
1%
7%
0% 10% 20% 30% 40% 50% 60% 70% 80% 90% 100%
GTA
Northern Ontario
Ottawa and Surrounding Area
Southeastern Ontario
Southwestern Ontario

Profile of Women Working in the Ontario Music Industry – Final Report 16 of 32
Approximately 2% were from Hamilton (GTA)
The figure below presents the highest level of education completed by women working in the Ontario music industry, according to the survey and compares it to women in the overall population in Ontario (according to data from Statistics Canada’s 2014 Labour Force Survey CANSIM Table 282-0004).
Figure 4 Highest education level completed by women in the Ontario music industry (n=454)
Source: Employment in Ontario’s Music Industry Survey, 2014-15 (Nordicity)
The survey results indicate that women in the Ontario music industry are more educated than the general population. This result points to the importance of higher education (i.e. an undergraduate or graduate university degree) in obtaining work in Ontario’s highly-competitive music industry.
The figure below presents the share of women working in the music industry who, according to survey results, had a child under the age of 18 in 2014/2015.
Figure 5 Portion of women in the Ontario music industry with children under the age of 18 (n=455)
Source: Employment in Ontario’s Music Industry Survey, 2014-15 (Nordicity)
8%
25%
30%
7%
21%
13%
41%
24%
17%
5%
0% 10% 20% 30% 40% 50%
Completed Graduate School
Completed Undergraduate Degree
Completed College
Some College or University
Completed High School
Women in music industry Women in overall Ontario population
I have children under 18 years
of age17%
I do not have children under 18 years of age
83%

Profile of Women Working in the Ontario Music Industry – Final Report 17 of 32
2.2 Work activity and role
This section looks at the nature of the work undertaken by women in Ontario’s music industry, according to the survey results. The figure below shows how women working in the music industry identified the type of worker they are, primarily-speaking.
Figure 6 Type of worker, women in the music industry in Ontario (n=455)
Source: Employment in Ontario’s Music Industry Survey, 2014-15 (Nordicity)
In the figure above we see that:
The majority of women working in the music industry (60%) do so as employees of music industry companies.
Approximately one-fifth (21%) of women working in the industry are themselves company owners, while the remaining fifth (19%) are working primarily as freelancers and short-term contract employees.
The survey results also showed that:
Some 27% of women working in the music industry reported having worked more than one job in 2014.
On average, women who identified as freelancers worked an average of 15 freelance/contract jobs per year.
The figure below presents the share of women who responded to our survey by the music industry role in which they worked:
Freelancer/short-term contract
employee19%
Employee of a company
60%
Owner of a company21%

Profile of Women Working in the Ontario Music Industry – Final Report 18 of 32
Figure 7 Music industry roles in which women worked (n=395)
Source: Employment in Ontario’s Music Industry Survey, 2014-15 (Nordicity)
Based on our survey results, one can observe that women in Ontario’s music industry are working in the following industry roles:
Women are working, for the most part in “Promotion and Marketing” roles (20%), in “Event Production” (17%) and as “Artists Managers and Agents” (16%).
A full 15% of women in the industry are working in admin and/or professional services roles such as HR, legal, accounting and other administrative roles.
They are least likely to work in “Music Production” (6%) roles and in Sales and Business Development (7%).
The figure below presents the years of music industry work experience for women working in the Ontario music industry in 2014-15.
Figure 8 Years of experience for women working in the Ontario music industry (n=455)
Source: Employment in Ontario’s Music Industry Survey, 2014-15 (Nordicity)
In the figure above we can observe that women working in the music industry represent a broad range of experience levels:
The highest share were those with up to five years of experience – 43% of the total industry.
8%
15%
7%
20%
6%
17%
16%
10%
0% 5% 10% 15% 20% 25%
Other
Admin/Professional Services
Sales and BD
Promotion and Marketing
Music Production, etc.
Event Production
Artist Management/ Agent
Artist
8%
10%
25%
22%
21%
14%
0% 5% 10% 15% 20% 25% 30%
Startup Phase (less than one year)
1 - 2 years
3 - 5 years
6 - 10 years
11 - 20 years
More than 20 years
Profile of Women Working in the Ontario Music Industry – Final Report 19 of 32
A third of the industry reported having more than ten years of industry experience.
When tallied, the women surveyed represent approximately 3,668 combined years of music industry experience.
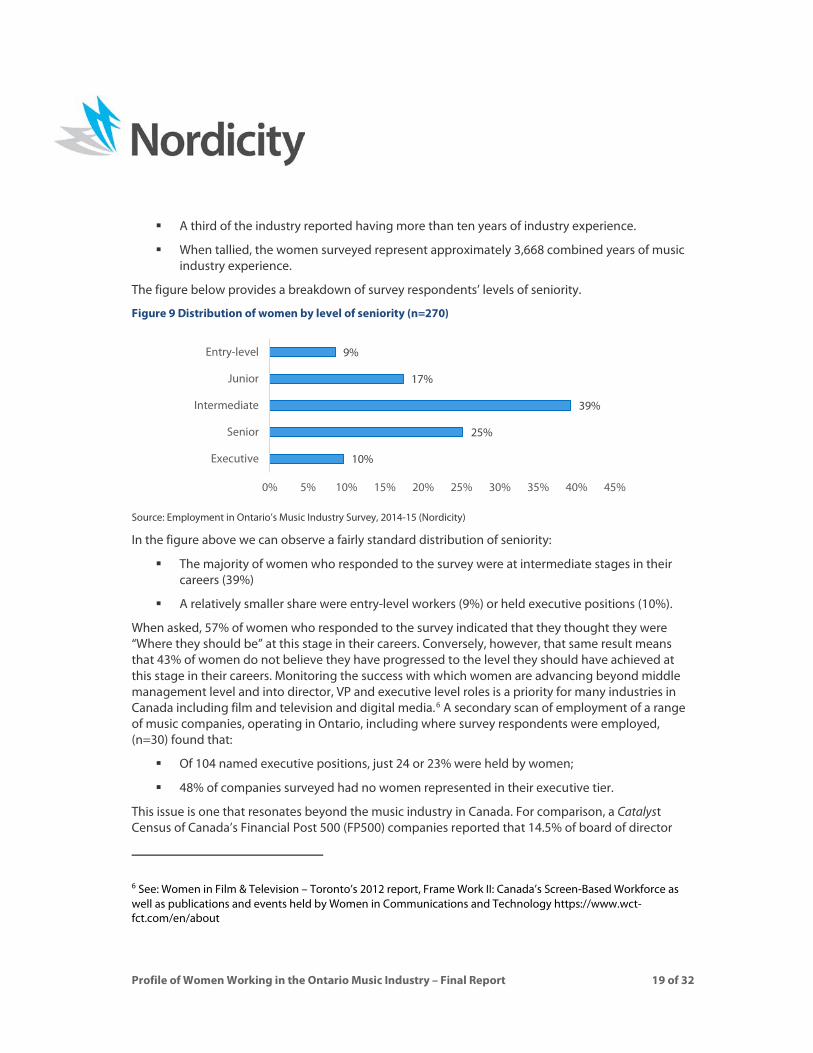
The figure below provides a breakdown of survey respondents’ levels of seniority.
Figure 9 Distribution of women by level of seniority (n=270)
Source: Employment in Ontario’s Music Industry Survey, 2014-15 (Nordicity)
In the figure above we can observe a fairly standard distribution of seniority:
The majority of women who responded to the survey were at intermediate stages in their careers (39%)
A relatively smaller share were entry-level workers (9%) or held executive positions (10%).
When asked, 57% of women who responded to the survey indicated that they thought they were “Where they should be” at this stage in their careers. Conversely, however, that same result means that 43% of women do not believe they have progressed to the level they should have achieved at this stage in their careers. Monitoring the success with which women are advancing beyond middle management level and into director, VP and executive level roles is a priority for many industries in Canada including film and television and digital media.6 A secondary scan of employment of a range of music companies, operating in Ontario, including where survey respondents were employed, (n=30) found that:
Of 104 named executive positions, just 24 or 23% were held by women;
48% of companies surveyed had no women represented in their executive tier.
This issue is one that resonates beyond the music industry in Canada. For comparison, a Catalyst Census of Canada’s Financial Post 500 (FP500) companies reported that 14.5% of board of director
6 See: Women in Film & Television – Toronto’s 2012 report, Frame Work II: Canada’s Screen-Based Workforce as well as publications and events held by Women in Communications and Technology https://www.wct-fct.com/en/about
10%
25%
39%
17%
9%
0% 5% 10% 15% 20% 25% 30% 35% 40% 45%
Executive
Senior
Intermediate
Junior
Entry-level
Profile of Women Working in the Ontario Music Industry – Final Report 20 of 32
positions were held by women in 2012. The same study indicated that 40% of FP500 companies had no women directors in 2013.7 The 2011 HRSDC Employment Equity Report indicates that women occupy 28.1% of senior management positions in Ontario and 27.6% in Canada (in all industries). All told, there is still a great deal of progress to be made at the top echelons of the music business.8 Career progression challenges are explored in more detail in Section 3.2.
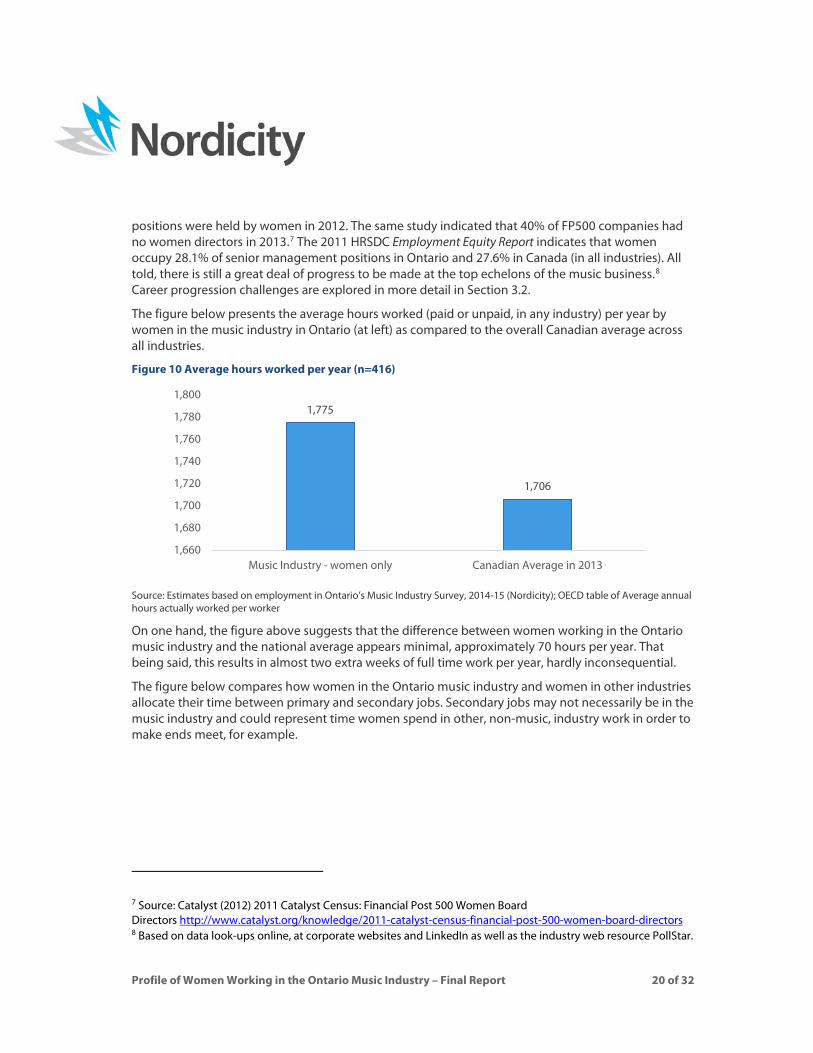
The figure below presents the average hours worked (paid or unpaid, in any industry) per year by women in the music industry in Ontario (at left) as compared to the overall Canadian average across all industries.
Figure 10 Average hours worked per year (n=416)
Source: Estimates based on employment in Ontario’s Music Industry Survey, 2014-15 (Nordicity); OECD table of Average annual hours actually worked per worker
On one hand, the figure above suggests that the difference between women working in the Ontario music industry and the national average appears minimal, approximately 70 hours per year. That being said, this results in almost two extra weeks of full time work per year, hardly inconsequential.
The figure below compares how women in the Ontario music industry and women in other industries allocate their time between primary and secondary jobs. Secondary jobs may not necessarily be in the music industry and could represent time women spend in other, non-music, industry work in order to make ends meet, for example.
7 Source: Catalyst (2012) 2011 Catalyst Census: Financial Post 500 Women Board Directors http://www.catalyst.org/knowledge/2011-catalyst-census-financial-post-500-women-board-directors 8 Based on data look-ups online, at corporate websites and LinkedIn as well as the industry web resource PollStar.
1,775
1,706
1,660
1,680
1,700
1,720
1,740
1,760
1,780
1,800
Music Industry - women only Canadian Average in 2013

Profile of Women Working in the Ontario Music Industry – Final Report 21 of 32
Figure 11 Average hours worked by women per week, by industry (n=416)
Source: Employment in Ontario’s Music Industry Survey, 2014-15 (Nordicity); Statistics Canada Labour Force Survey table 282-0028 (2014)
In the figure above, we can observe that:
Women in the Ontario music industry work about five hours more per week in total than the average for women in other industries, both in Ontario and across Canada;
In spite of this, the average woman in the Ontario music industry devote less time to music-related work than their counterparts in other industries spend on their primary job, suggesting the need to take secondary work in addition to music industry work;
Women in the Ontario music industry spend approximately one quarter of their total working time in jobs outside of the music industry, while women in other industries spend about 2% of their time on jobs outside of their primary line of work.
One survey respondent described “inconsistent funding” as a major challenge to career progression, explaining that “more time spent working outside of music and less creating and less opportunities to perform” was standing in the way of achieving career goals. Others explained the need for two jobs, “As a part-time music consultant, many of my clients cannot afford to pay me market rates for my services. I supplement my income with a full time job” and “High cost of living in Toronto makes a second job unrelated to music a necessity.”
2.3 Compensation
A crucial measure of women’s work in the music industry is their level of compensation as compared to the average music industry worker. That is to say, the results below do not compare women’s earnings with their male counterparts, instead, they compare women’s earnings with the best available data for average salaries in the Ontario and/or Canadian music industry. The various bars in the chart below represent:
1) Average salary of women in the music industry who responded to the survey ($47,185);
31.8
32.1
28.5
0.8
0.7
8.7
32.6
32.8
37.2
0 10 20 30 40
All industries - Canada
All industries - Ontario
Music Industry (survey respondents)
Primary job (i.e. Music industry jobs for survey respondents) Other jobs

Profile of Women Working in the Ontario Music Industry – Final Report 22 of 32
2) Average salary of women in the music industry who responded to the survey and identified themselves as music industry company employees (i.e., as opposed freelancers and/or company owners) ($50,537);
3) Average salaries of women in the music industry who responded to the survey and indicated “major label” or “major music publisher” as primary company roles ($53,857);
4) Average sound recording industry9 salary in Canada reported by PwC in 2010 ($60,100);
5) Average music industry salaries based on companies who responded to our survey (n.b., sample represents approximately 100 full time workers) ($56,000);
6) Average salary for employees of independent music companies in Canada in 2011 ($22,250).
Figure 12 Average annual music industry salaries in Ontario, compared to best available data10
Source: Employment in Ontario’s Music Industry Survey, 2014-15 (Nordicity), PwC/Music Canada Economic Impact of the Sound Recording Industry in Canada (2012), Nordicity/CIMA Sound Analysis: An examination of the Canadian Independent Music Industry (2013).
The chart above illustrates that:
At $50,537, women employees of music companies earned (in 2014) about 10% less than the average music company employee. According to Nordicity’s company-level survey, in 2014, the average earnings for a music company employee was $56,000 – slightly lower than reported in the 2010 Music Canada study.
9 Defined as those companies involved in developing, publishing, manufacturing, distributing, marketing and promoting musical recordings and artists and performers. 10 n=286 for all women, n=214 for women music company employees, n=35 for women in major labels/publishers
$47,185$50,537
$53,857$60,100
$56,000
$22,250
$0
$10,000
$20,000
$30,000
$40,000
$50,000
$60,000
$70,000
All women (2014) Women musiccompany
employees(2014)
Women in MajorLabels/Publishers
(2014)
Sound recordingindustry (2010)
Music companyemployees
(2014)
Independentmusic company
employees(2011)

Profile of Women Working in the Ontario Music Industry – Final Report 23 of 32
Women employees of music companies earned approximately 7% more than the average women working in the music industry that is to say $50,537 as compared to $47,185 (for example as freelancers and or business owners) in 2014.
Women working at “Major Labels/Publishers” reported higher earnings than the average survey respondent, according to the survey, and
The annual salaries of women in the music industry in 2014 were 27% lower on average than the most recently available average annual salary for the sound recording segment in Canada.
The figure below presents estimates of the average annual earnings for women by the role of the music industry in which they work. To compute these figures, Nordicity first estimated how much of each survey respondent’s total income was attributable to work in each of the core music industry roles below. By-role average earnings were then adjusted according to the total share of survey respondents working in each role. Role taxonomy was based on Nordicity’s previous research in the Ontario music industry. For more information on how average incomes were estimated for industry role, please see the Appendix to this report.
Average music industry earnings are not available at this level of granularity (i.e., by role). As such, the overall average we would compare the results below to would be the $60,100 average sound recording industry salary (2010 PwC report) or the $50,537 from the Nordicity survey which represents the average salary of women in the music industry who responded to the survey and identified themselves as music industry company employees.
Figure 13 Average total annual earnings for women by industry role (n=395)
Source: Employment in Ontario’s Music Industry Survey, 2014-15 (Nordicity)
In the chart above we can see that:
The greatest salaries in 2014 were earned by Administrative/Professional Services roles ($46,610) which include Legal, IT, Accounting and HR, followed by Artist Managers and Agents ($46,385).
The lowest salaries were reported by Artists with an average salary of $24,134.
$46,610 $46,385$42,220 $41,692 $40,036 $37,650
$24,134
$0
$10,000
$20,000
$30,000
$40,000
$50,000
Admin/ProfessionalServices
ArtistManagement/
Agent
Music Production,etc.
Sales and BD Event Production Promotion andMarketing
Artist

Profile of Women Working in the Ontario Music Industry – Final Report 24 of 32
The figure below presents the average annual earnings for women by the level of seniority they have achieved in the industry. Respondents were able self-select the appropriate label which described their level of seniority.
Figure 14 Average total annual earnings for women by level of seniority (n=395)
Source: Employment in Ontario’s Music Industry Survey, 2014-15 (Nordicity)
There is a fairly broad range from entry-level to Executive as one might expect and the greatest increases are experienced in the jump from intermediate roles to senior-level roles and from senior-level roles to Executive.
The figure below presents average annual earnings for women by type of worker.
Figure 15 Average annual earnings for women by worker type (n=395)
Source: Employment in Ontario’s Music Industry Survey, 2014-15 (Nordicity)
As one might expect, freelancers and short-terms contract employees earn far less than their counterparts with more steady incomes. That being said, what is perhaps most surprising is that women working as music company owners reported earning less than their counterparts in the music industry. This may reflect the possibility that companies were in the start-up phase, for example.
$87,273
$65,574
$44,227$32,500 $28,333
$0
$20,000
$40,000
$60,000
$80,000
$100,000
Executive Senior Intermediate Junior Entry-level
$19,928
$50,397
$33,966$41,456
$0
$10,000
$20,000
$30,000
$40,000
$50,000
$60,000
Freelancer/short-termcontract employee
Employee of a musicindustry company
Owner of a musiccompany
All types
Profile of Women Working in the Ontario Music Industry – Final Report 25 of 32
3. Challenges and Opportunities In addition to the profile information presented in this report, it was important to explore more broadly the challenges and opportunities women in the music industry in Ontario are facing. While it is beyond the scope of this report to make recommendations, WIM-C will use the results related to job satisfaction, career impacts and positive and negative career factors, in order to develop and refine its programming and activities.
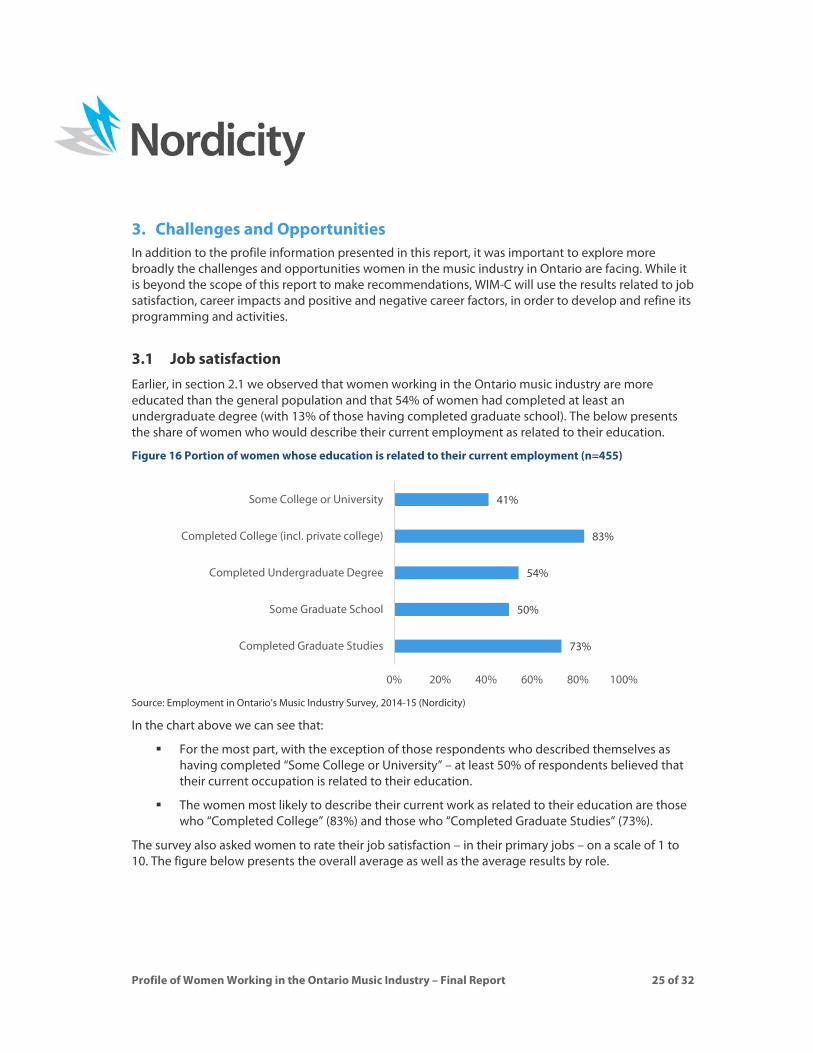
3.1 Job satisfaction Earlier, in section 2.1 we observed that women working in the Ontario music industry are more educated than the general population and that 54% of women had completed at least an undergraduate degree (with 13% of those having completed graduate school). The below presents the share of women who would describe their current employment as related to their education.
Figure 16 Portion of women whose education is related to their current employment (n=455)
Source: Employment in Ontario’s Music Industry Survey, 2014-15 (Nordicity)
In the chart above we can see that:
For the most part, with the exception of those respondents who described themselves as having completed “Some College or University” – at least 50% of respondents believed that their current occupation is related to their education.
The women most likely to describe their current work as related to their education are those who “Completed College” (83%) and those who “Completed Graduate Studies” (73%).
The survey also asked women to rate their job satisfaction – in their primary jobs – on a scale of 1 to 10. The figure below presents the overall average as well as the average results by role.
73%
50%
54%
83%
41%
0% 20% 40% 60% 80% 100%
Completed Graduate Studies
Some Graduate School
Completed Undergraduate Degree
Completed College (incl. private college)
Some College or University

Profile of Women Working in the Ontario Music Industry – Final Report 26 of 32
Figure 17 Women’s average primary job satisfaction by worker type (n=282)
Source: Employment in Ontario’s Music Industry Survey, 2014-15 (Nordicity)
The overall average for job satisfaction was 7.3 as represented by the dotted line. Above average job satisfaction was reported in just two role categories, “Other” and “Artists.” All other job satisfaction ratings, while still strong, fell below the overall average of 7.3.
3.2 Career impacts and factors of influence
Previously, we saw that 43% of women working in the Ontario music industry would not describe themselves as “where they should be” at this stage in their careers. The survey asked respondents to rate a range of factors in terms of how they have had an impact on their careers on a scale from “Very negative” to “Very positive.” The figure below presents the overall average rating for each career impact factor.
7.3
8.2
7.2
6.9
7.0
7.9
7.0
6.7
6.3
0.0 1.0 2.0 3.0 4.0 5.0 6.0 7.0 8.0 9.0
All segments
Other
Artist Management/ Agent
Event Production
Music Production, etc.
Artist
Promotion and Marketing
Admin/Professional Services
Sales and BD

Profile of Women Working in the Ontario Music Industry – Final Report 27 of 32
Figure 18 Average impact of various factors on women’s career progression, across all worker types (n=455)
Source: Employment in Ontario’s Music Industry Survey, 2014-15 (Nordicity)
Women who responded to the survey indicated that:
1) Access to networking opportunities;
2) Overall workplace culture, and;
3) Access to mentors
…had had the most positive impacts on their career progression. Conversely:
1) Compensation practices
2) Gender balance in senior management and;
3) Overall gender balance in the workplace
…were rated the most negative factors with regard to career progression. When one considers that, according to the Nordicity survey results, women in the industry are paid less than the average music industry earner, it is not surprising that compensation practices have had the most negative impact on career progression.
-0.43
-0.23
-0.12
-0.07
-0.05
0.10
0.14
0.42
0.43
0.58
0.71
-2.0 -1.5 -1.0 -0.5 0.0 0.5 1.0 1.5 2.0
Compensation practices
Gender balance in senior management
Overall gender balance in the workplace
Work/life balance
Opportunities for advancement
Overall cultural diversity in the workplace
Access to appropriate professional development
The management style of my direct boss
Access to mentors
Overall workplace culture
Access to networking opportunities
Impact: Very Negative None Very Positive

Profile of Women Working in the Ontario Music Industry – Final Report 28 of 32
Although the results above show that “overall workplace culture” is reported to have a positive impact on career progression, the open-ended survey responses raised some troubling concerns, which expose the experiences of some women working in the music industry. While the comments below are not time bound, that is to say, not necessarily related to “recent” events (i.e., respondents could be describing experiences from earlier in their careers) they are nonetheless distressing. When the workplace culture includes gender discrimination, the effects go beyond career advancement and affect other aspects of life:
An entrepreneur run industry so there is a lack of good staff management at most companies.
Male-dominated in upper management creating a "boys club" type of environment.
Often I get stuck with tasks that are traditionally performed by women (Cleaning the office, Administration/Organization). These tasks often take time away from my advancement as an audio engineer.
Gender-based discrimination and inappropriate workplace behavior, from bullying to sexual harassment was also described by some survey respondents.
Dealing with huge egos and unrealistic demands on my time. Having to keep quiet about questionable practices and ethics and being subject to verbal abuse from immediate supervisor with no human resource structure in place to seek advice or action. Constantly having to "coddle" over inflated egos and often being subject to "secretarial" type demands despite an executive level position. Being poorly compensated for the responsibility and demands of the position. Witnessing and being subject to inappropriate sexual innuendo and lack of sympathy for being put in that position. Being forced to take meetings and ridiculed for expressing discomfort at having to meet with certain individuals of questionable character and on a few occasions, being ridiculed for asking for security measures to be put in place when I felt that my own safety and that of my staff was compromised.
I find a lot of the time, being a self-sufficient female musician and producer has a negative impact on the men that I work with. There is a major tendency to assume that being a woman means that the men can simply hide important information (such as engineering methods used on songs, or networking opportunities) because they believe you are incapable although you have the evidence to show that you have adequate knowledge.
In the figure above, we see that “Work/life balance” received a negative score based on the survey results. In addition, anecdotally, at industry events and in the open-ended survey responses women in the industry described having children and/or taking maternity leave as having a negative impact on their careers.
“Having a child, set me back for many years. My former employer tried illegally to change my returning position to one of lower rank and compensation. We settled out of court which left me unemployed mid-career during the recession.”
Beyond motherhood, survey respondents described “family issues”, “family deaths”, “personal issues” and “family commitments” as having had a negative impact on their career, showcasing the often unforgiving and/or inflexible nature of a career in the music industry.

Profile of Women Working in the Ontario Music Industry – Final Report 29 of 32
Many comments on challenges to career progression in the music industry focused on increasing competition for music industry work in a tough economic climate:
All of the above covers the influences on my career, but also important to add that there aren't too many indie labels or management companies around so competition is hard for getting a new job. Also, other labels and management companies are hesitant to 'steal' an employee from somewhere else as they don’t want to hire someone that may put them in the bad books with the initial company which could affect opportunities in the future.
The recession last decade had an adverse impact in that it took a long time to transition from contracts into permanent work.
Downsizing of major labels, newspapers, radio and the CBC have caused senior employees to be let go and those people are applying (and getting) the entry level positions.
These results were validated at the WIM-C industry event in March 2015.

Profile of Women Working in the Ontario Music Industry – Final Report 30 of 32
4. Conclusion As this profile has demonstrated, women in the music industry in Ontario, home to Canada’s largest music industry, face numerous challenges. From lower pay across the board and low exposure to boardrooms/executive levels to a lack of workforce diversity and systemic gender discrimination, there is much work to be done and progress to be made.
There are numerous ways in which WIM-C can play a role in the future of the music industry, starting in Ontario. At an industry event related to this research, attendees voted on what interventions would be the most useful and impactful to their careers and career progression. The results were as follows:
“Which of the following actions for WIM-C to take would be the most beneficial and/or the highest priority for you in your
career?”
Ranked No. 1
1. Access to mentors and mentorship opportunities 43%
2. Access to training and professional development 40%
3. Increasing networking opportunities 30%
4. Better access to industry information and resources 16%
In this regard survey respondents explained their views about the potential impact of mentors and access to mentorship opportunities:
I find there's a distinct lack of mentors (and especially female mentors) for my role/career. My career would have benefited from having any sort of mentor ten years ahead of me in their career.
I have a very supportive VP and president who have both guided me through the ranks.
I have been very lucky to have strong mentors and support within my organization and the industry. More opportunities for networking, professional development and mentoring would enable further progress and facilitate a stronger community and increased opportunity.
Not only is WIM-C positioned to help support women in the industry, the women themselves are highly engaged and committed to strengthening their careers and their networks. As a first step, this report provides a foundation or baseline for future analysis and tracking progress.
Profile of Women Working in the Ontario Music Industry – Final Report 31 of 32
Appendix: Survey Approach and Methodology Industry Role Taxonomy
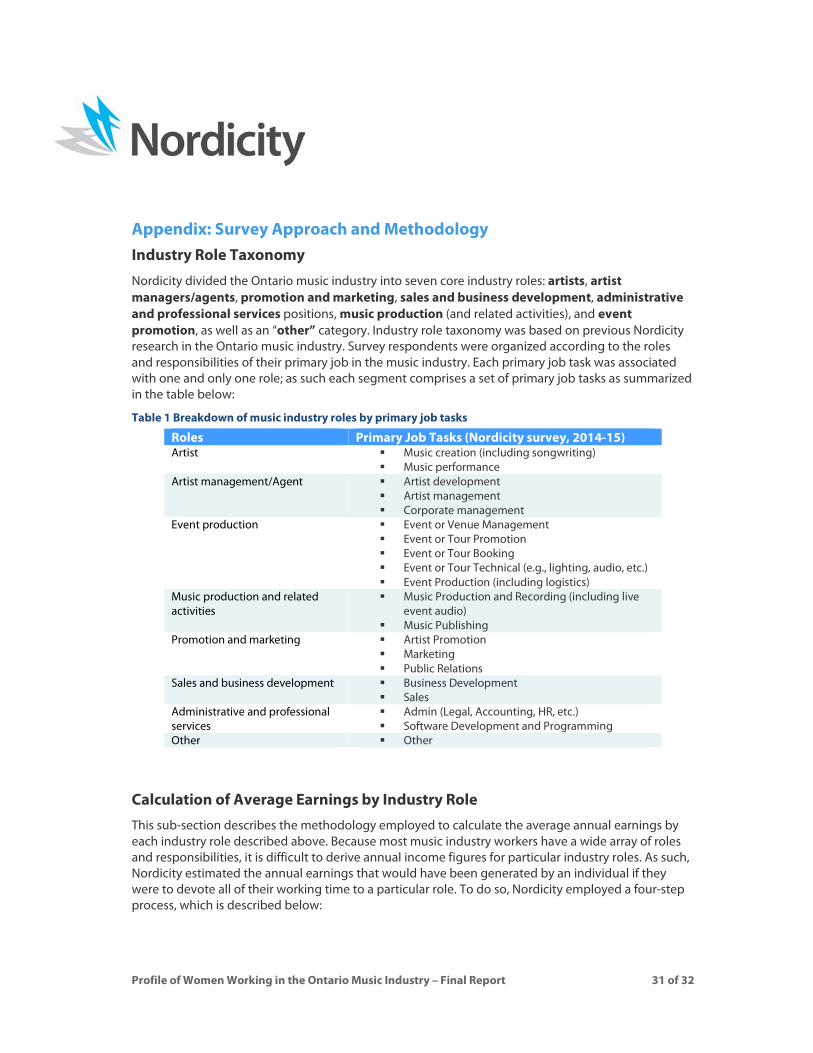
Nordicity divided the Ontario music industry into seven core industry roles: artists, artist managers/agents, promotion and marketing, sales and business development, administrative and professional services positions, music production (and related activities), and event promotion, as well as an “other” category. Industry role taxonomy was based on previous Nordicity research in the Ontario music industry. Survey respondents were organized according to the roles and responsibilities of their primary job in the music industry. Each primary job task was associated with one and only one role; as such each segment comprises a set of primary job tasks as summarized in the table below:
Table 1 Breakdown of music industry roles by primary job tasks
Roles Primary Job Tasks (Nordicity survey, 2014-15) Artist Music creation (including songwriting)
Music performance Artist management/Agent Artist development
Artist management Corporate management
Event production Event or Venue Management Event or Tour Promotion Event or Tour Booking Event or Tour Technical (e.g., lighting, audio, etc.) Event Production (including logistics)
Music production and related activities
Music Production and Recording (including live event audio)
Music Publishing Promotion and marketing Artist Promotion
Marketing Public Relations
Sales and business development Business Development Sales
Administrative and professional services
Admin (Legal, Accounting, HR, etc.) Software Development and Programming
Other Other
Calculation of Average Earnings by Industry Role
This sub-section describes the methodology employed to calculate the average annual earnings by each industry role described above. Because most music industry workers have a wide array of roles and responsibilities, it is difficult to derive annual income figures for particular industry roles. As such, Nordicity estimated the annual earnings that would have been generated by an individual if they were to devote all of their working time to a particular role. To do so, Nordicity employed a four-step process, which is described below:

Profile of Women Working in the Ontario Music Industry – Final Report 32 of 32
1. Each survey respondent was assigned a share for each music industry role according to the tasks they undertook as part of their primary job. For instance,
a) An individual who undertook five tasks, of which two were related to artist management/agent-related work and three were in sales and/or business development, was considered to have spent 40% (2/5) of their total working time in artist management/agency and 60% (3/5) of their time in sales and business development.
b) A survey respondent who completed only tasks in promotion and marketing would be considered to have spent 100% of their total time in promotion and marketing.
2. The income earned from work in each role was calculated for each survey respondent, by applying the share time they worked in each role as part of their primary music industry employment to the total income they earned in all roles. If the person in example a) above, for instance, earned $50,000 per annum in total, $20,000 (i.e. $50,000×40%) would be attributable to their work in artist management/agency, and $30,000 (i.e. $50,000×60%) would be from sales and business development work.
3. The average income generated in each industry role was then calculated.
4. The average income values were divided by the share of total survey respondents in each role, in order to estimate the average income that would be earned by survey respondents if they devoted all of their time to work in that role. For instance:
a. The average annual income earned by survey respondents in Artist Management/Agency was $7,513 (working part-time in this role) and the share of all survey respondents’ time devoted to Artist Management/Agency was 16%. As such, the average annual salary that would have been earned by survey respondents if they devoted all of their working time to this kind of work was $46,385 (i.e. $7,513÷16%).
b. The average annual income earned by survey respondents in Promotion and Marketing work was $7,701 (working part-time in this role) and the share of all survey respondents’ time devoted to Promotion and Marketing was 20%. As such, the average annual salary that would have been earned by survey respondents if they devoted all of their working time to this kind of work was $37,650 (i.e. $7,701÷20%).