a proof of concept study of respiratory physiology in
TRANSCRIPT

A Proof of Concept Study of Respiratory Physiology in Preterm Neonates
during High Flow Nasal Cannula Therapy
Dr. Saikiran Gopalakaje
MBBS (India), MD (India), MRCPCH (UK)
Doctor of Medicine
Institute of Cellular Medicine
March 2019


i
Abstract
Introduction and rationale: High flow nasal cannula therapy is being increasingly used as a
form of respiratory support across the world. Its adoption and popularity have been rapid but
little is known regarding its key mechanism of action even after more than a decade of its use.
I conducted a proof of concept study of respiratory physiology during high flow therapy in
preterm neonates.
Methods: The study protocol involved measurement of nasopharyngeal airway pressures and
gas concentrations as well as measurement of tidal breathing indices. A detailed descriptive
review of clinical efficacy of high flow nasal cannula in preterm infants was performed. In
order to identify the optimum measuring techniques, in this proof of concept study, three
types of pressure measuring techniques, a gas analyser device and a non-invasive tidal
breathing indices device were studied and the results are presented in this thesis. In addition, a
detailed protocol for a larger randomised crossover study of respiratory physiology during
continuous positive airway pressure of 6 cm H2O and high flow nasal cannula therapy ranging
from 2-8 litres per minute flow was designed..
Results: In this thesis, the results of a proof of concept physiological study have been
presented. The results of the measurements performed in six babies of varying gestational age
(less than 37 weeks of gestation) and birth weight are presented. Valid tidal volumes were
measured in all babies, nasopharyngeal gas concentrations and pressure measurements in five
and two babies respectively. There were no adverse events.
Conclusions: It is feasible to measure nasopharyngeal air way pressures and gas
concentrations as well as non-invasive tidal breathing indices in babies on high flow nasal
cannula therapy safely. This study was successfully followed up by a larger randomised cross
over study involving 45 infants with the same protocol.

ii
Dedication
For Madhura, Sameeksha and Samarth.

iii
Acknowledgements
First and foremost, I am extremely grateful to my primary supervisor, Dr Chris O’Brien, who
provided me the window of a great opportunity to learn research and guided me during this
work. I had many long hours of physiology teaching from him, which was invaluable in my
understanding of some of the difficult concepts involved in this study. He has not only taught
me his knowledge and expertise but also supported and encouraged me to take decisions
which helped me progress in my career. I will always remember that I owe it to him in
becoming a Respiratory Paediatrician.
I am also extremely grateful to Dr Malcolm Brodlie, my academic supervisor for being there
when it mattered and providing solutions to difficult situations drawing from his vast
experience in research. His support and guidance during the writing phase was invaluable.
This thesis would not have materialised without his support and guidance.
I am indebted to Dr Alan Fenton and Dr Sundeep Harigopal for their whole-hearted support
and encouragement throughout the study period. I was adequately supervised on site by them
for all situations that I came across during the conduct of the study. They provided significant
amount of their time in developing the protocol, providing input from their experience and
knowledge as senior neonatologists.
I would also like to thank all the hard working and dedicated medical and nursing staff on the
neonatal unit at the Royal Victoria Infirmary who supported me like their own family
member. I offer my sincere gratitude to all the infants and their parents on the Neonatal
intensive care unit at the Royal Victoria Infirmary, Newcastle upon Tyne, UK for their
participation in this study.
I was able to undertake research and complete writing mainly because of the constant
encouragement and unconditional support from my wife, Madhura. I thank my children,
Sameeksha and Samarth for their love and affection. I thank my parents for providing me the
education and upbringing to reach this level of achievement.
I would like to thank Special Trustees at Newcastle Hospitals for providing me with the
financial support to undertake this research.

iv

v
Table of Contents
Abstract……………………………………………………………………………….. i
Dedication……………………………………………………………………………... ii
Acknowledgements………………………………………………………………........ iii
Table of contents…………………………………………………………………........ v
List of tables…………………………………………………………………………... xii
List of figures…………………………………………………………………………. xiv
List of abbreviations used in this thesis……………………………………………... xvii
Publications arising from this thesis………………………………………………… xx
Chapter 1. Introduction…………………………………………………………........ 1
1.1 Prevalence of HFNC use……………………………………………………… 2
1.1.1 Definition…………………………………………………………….. 2
1.1.2 History of HFNC usage ……………………………………….......... 2
1.1.3 Use of HFNC in neonatal units……………………………………... 4
1.2 High Flow Nasal Cannula Device Set Up……………………………............. 7
1.3 Mechanisms of Action………………………………………………………... 9
1.3.1 Heating and humidification of gas…………………………………. 9
1.3.2 Airway distending pressure………………………………………… 10
1.3.3 Airway dead space wash out………………………………………... 11
1.3.4 Effect on work of breathing………………………………………… 11
1.3.5 Reducing metabolic demand………………………………………... 13
1.4 Effects of HFNC on Airway Distending Pressures…………………............. 13
1.4.1 Airway pressure - Principle factors………………………………... 13
1.4.2 Pressure in the Device Circuit……………………………………… 14
1.4.3 Anatomy of upper airway…………………………………………... 15
1.4.4 Effects of mouth position on nasopharyngeal pressure…………... 20
1.4.5 Effects of flow rate on nasopharyngeal pressure………………….. 22
1.4.6 Effects of nasal cannula size on nasopharyngeal pressure……….. 24
1.4.7 Summary of effects of HFNC on airway pressures……………….. 26
1.5 Measuring Airway Pressure…………………………………………………. 29

vi
1.5.1 Types of pressure measuring technology…………………………... 29
1.5.2 Technical requirements for airway pressure sensors……………... 32
1.5.3 Other factors affecting sensor performance………………………. 33
1.5.4 Principles of Pressure Sensors……………………………………… 34
1.5.5 Types of airway pressure measurements…………………………... 37
1.5.6 Practical challenges in pressure measurement in neonates………. 37
1.6 Effects of HFNC on Washout of Airway Dead Space………………………. 38
1.6.1 Airway dead space wash out effect and CO2 removal…………….. 38
1.6.2 Airway dead space wash out effect and its impact on oxygenation 40
1.6.3 Methods of measuring airway gas concentrations………………… 41
1.7 Effects of HFNC on Tidal Volume…………………………………………... 44
1.7.1 Tidal volume and minute volume importance for ventilation……. 44
1.7.2 Tidal volume measurement studies during HFNC………………... 44
1.7.3 Methods of measuring tidal volume………………………………... 46
1.8 HFNC Summary of literature review ………………………………............. 49
1.8.1 Summary of physiology studies…………………………………….. 49
1.9 Concerns with HFNC Therapy………………………………………............. 58
1.9.1 Delivery of airway pressure – unmonitored and unpredictable….. 58
1.9.2 Microbial colonisation of delivery systems………………………… 58
1.9.3 Effects on lung volumes……………………………………………... 58
1.9.4 Effects of noise………………………………………………………. 59
1.9.5 Possibilities of air leak syndromes…………………………………. 60
1.9.6 Monitoring while on HFNC………………………………………… 60
1.10 HFNC - Gaps in knowledge………………………………………………….. 60
1.10.1 Airway pressure measurement during HFNC therapy …………... 61
1.10.2 Nasopharyngeal gas concentrations during HFNC therapy ……... 61
1.10.3 Tidal volume changes during HFNC therapy …………………….. 61
1.10.4 Gaps in knowledge regarding HFNC clinical application………... 61
Chapter 2. Aims……………………………………………………………………… 62

vii
Chapter 3. Descriptive Review of Key Outcomes with High Flow Nasal Cannula
Therapy in Preterm Infants …………………………………………....
64
3.1 Introduction…………………………………………………………………… 65
3.2 Background…………………………………………………………………… 66
3.2.1 Definitions……………………………………………………………. 66
3.2.2 Rationale……………………………………………………………... 68
3.3 Aims and Outcomes…………………………………………………………... 69
3.3.1 Aims………………………………………………………………….. 69
3.3.2 Outcomes…………………………………………………………….. 69
3.4 Methods………………………………………………………………………... 69
3.4.1 Search strategy………………………………………………………. 69
3.4.2 Selection of studies…………………………………………………... 70
3.4.3 Statistical analysis………………………………………………….... 71
3.5 Primary Respiratory Support for RDS in Neonates – HFNC versus CPAP 73
3.5.1 Descriptive review of studies evaluating HFNC for primary
respiratory support compared to CPAP…………………………...
73
3.5.2 Results and discussion………………………………………………. 82
3.6 Primary Respiratory Support for RDS – HFNC versus NIPPV…………... 85
3.6.1 Descriptive review of studies evaluating HFNC for primary
respiratory support compared to NIPPV…………………………..
85
3.6.2 Results and discussion………………………………………………. 86
3.7 Post Extubation Respiratory Support – HFNC versus CPAP……………... 89
3.7.1 Descriptive review of studies evaluating HFNC for post
extubation respiratory support compared to CPAP………………
89
3.7.2 Results and discussion………………………………………………. 96
3.8 HFNC for Weaning from CPAP/NIV……………………………… 102
3.8.1 Descriptive review of studies evaluating HFNC as a weaning
mode…………………………………………………………………..
102
3.8.2 Results and discussion………………………………………………. 104
3.9 Other Clinical Outcomes with HFNC……………………………………….. 106
3.9.1 Bronchopulmonary Dysplasia (BPD)………………………………. 106
3.9.2 Mortality……………………………………………………………... 109
3.9.3 Air leak complications………………………………………………. 111
3.9.4 Patient comfort……………………………………………………… 113

viii
3.9.5 Nasal trauma………………………………………………………… 113
3.10 Discussion……………………………………………………………………... 116
3.10.1 Efficacy of HFNC……………………………………………………. 116
3.10.2 HFNC- Other clinical outcomes……………………………………. 118
3.10.3 HFNC- Safety and comfort…………………………………………. 120
3.11 Summary of descriptive review of studies evaluating clinical efficacy of
HFNC…………………………………………………………………………..
120
Chapter 4. Materials and Methods………………………………………………….. 121
4.1 Study Design Development…………………………………………………... 122
4.1.1 Study protocol……………………………………………………….. 122
4.2 Ethics Approval………………………………………………………………. 122
4.3 Informed Consent…………………………………………………………….. 123
4.4 Selection and Withdrawal of Study Participants…………………………… 123
4.4.1 Inclusion criteria…………………………………………………….. 123
4.4.2 Exclusion criteria……………………………………………………. 124
4.4.3 Withdrawal of participants…………………………………………. 124
4.5 Baseline Assessments…………………………………………………………. 124
4.6 Details of Study Design and Procedures…………………………………….. 125
4.7 Description of Study Interventions………………………………………….. 127
4.8 Airway pressure– Gaeltec Catheter Tip Pressure Transducer……………... 127
4.8.1 Gaeltec Catheter Tip Pressure Transducer ………………………. 129
4.8.2 Dimensions…………………………………………………………... 131
4.8.3 Storage, safety and standards certification………………………... 131
4.8.4 Catheter assembly…………………………........................................ 131
4.8.5 Amplification………………………………………………………… 133
4.8.6 Calibration…………………………………………………………... 133
4.8.7 Linearity……………………………………………………………... 135
4.8.8 Frequency response…………………………………………………. 139
4.8.9 Stability………………………………………………………………. 140
4.8.10 Factors influencing catheter performance………………………… 140

ix
4.8.11 Description of airway pressure measurement with Gaeltec
Catheter………………………………………………………………
140
4.8.12 Results of Gaeltec catheter pressure measurement……………….. 141
4.8.13 Summary of catheter mounted pressure transducer……………… 141
4.9 Airway Pressure Measurement - Thermal Sensor Pressure Transducer…. 142
4.9.1 Introduction…………………………………………………………. 142
4.9.2 Measuring principle of a thermal flow sensor ……………………. 144
4.9.3 Equipment details …………………………………………………... 144
4.9.4 Sensor assembly……………………………………………………... 144
4.9.5 Calibration…………………………………………………………... 144
4.9.6 Linearity……………………………………………………………... 146
4.9.7 Frequency response…………………………………………………. 146
4.9.8 Factors influencing sensor performance…………………………... 146
4.9.9 Description of thermal sensor pressure measurement……………... 148
4.9.10 Results of thermal sensor pressure measurement………………… 148
4.9.11 Summary of thermal sensor pressure transducer……………….... 148
4.10 Airway Pressure Measurement - Differential Pressure Transducer……… 150
4.10.1 Principle of differential pressure transducer……………………… 150
4.10.2 Description of B&D differential transducer structure……………. 150
4.10.3 Transducer assembly………………………………………………... 150
4.10.4 Calibration…………………………………………………………... 152
4.10.5 Linearity……………………………………………………………... 152
4.10.6 Frequency response…………………………………………………. 154
4.10.7 Factors influencing differential transducer performance………... 154
4.10.8 Description of Differential pressure transducer measurement…... 154
4.10.9 Summary of differential pressure transducer……………………... 154
4.11 Gas Analysers for Respiratory Gases……………………………………….. 155
4.11.1 Principle……………………………………………………………… 155
4.11.2 Materials and device assembly……………………………………... 157
4.11.3 Calibration…………………………………………………………... 160
4.11.4 Obtaining measurements…………………………………………… 160

x
4.11.5 Factors influencing gas analyser performance……………………. 160
4.11.6 Summary of gas analyser for air way gas concentrations………... 160
4.12 Tidal volume measurement - Volusense Technology……………………….. 161
4.12.1 Principle……………………………………………………………… 161
4.12.2 Materials and device assembly……………………………………... 164
4.12.3 Factors influencing Volusense performance………………………. 164
4.12.4 Measurement of tidal volumes……………………………………… 164
4.13 Transcutaneous CO2 measurement…………………………………………. 165
4.14 Transcutaneous O2 saturation measurement………………………………. 165
4.15 Data recording………………………………………………………………… 165
4.16 Study Treatment……………………………………………………………… 169
4.16.1 Adjustment of FiO2…………………………………………………. 169
4.16.2 Study Duration……………………………………………………… 169
4.16.3 Minimisation of Bias………………………………………………… 169
4.16.4 Discontinuation Criteria……………………………………………. 169
4.16.5 Concomitant Treatments…………………………………………… 170
4.17 Research Governance………………………………………………………… 170
4.18 Source data…………………………………………………………………… 171
4.19 Assessment of efficacy………………………………………………………... 171
4.20 Assessment of safety…………………………………………………………... 171
4.21 Discussion and summary……………………………………………………... 172
Chapter 5. Results…………………………………………………………………….. 173
5.1 Introduction…………………………………………………………………… 174
5.2 Baseline characteristics of study population………………………………... 174
5.3 Airway Pressure Recordings…………………………………………………. 177
5.4 Gas concentration measurement…………………………………………….. 180
5.4.1 In-vivo measurement of airway O2 and CO2 concentrations…….. 180
5.4.2 Gas concentration measurements in this proof of concept study… 182
5.4.3 Relationship of administered O2 to recorded O2 concentration in
nasopharyngeal airway……………………………………………...
184

xi
5.5 Tidal breathing indices measurements by Volusense method……………... 186
5.5.1 Tidal volumes in HFNC…………………………………………….. 186
5.5.2 Tidal breathing indices including flow derivatives from
Volusense……………………………………………………………..
188
5.6 Gas exchange profile of patients during the study………………………….. 190
5.6.1 Heart rate, respiratory rate, transcutaneous O2 and CO2 levels…. 190
5.6.2 Physiology parameters during respiratory support cross- over
(CPAP to HFNC and vice versa)……………………………………
195
5.7 Safety and adverse events…………………………………………………….. 197
5.8 Conclusions……………………………………………………………………. 197
Chapter 6. General Discussion………………………………………………………. 198
6.1 Thesis Results and Current Literature……………………………………… 199
6.1.1 Retrospective audit of HFNC use in a tertiary neonatal unit…….. 199
6.1.2 Evidence for efficacy and safety of HFNC in preterm neonates…. 200
6.1.3 Airway pressure measurement methods…………………………... 201
6.1.4 Airway gas concentration measurement methods during HFNC... 202
6.1.5 Tidal breathing indices using Volusense in preterm neonates…… 205
6.2 Safety Aspects of a Respiratory Physiology Study in Preterm Neonates…. 207
6.3 Strengths and Limitations of the Study……………………………………... 207
6.4 Future Research………………………………………………………………. 209
6.5 My reflections about this work………………………………………………. 210
Chapter 7. References………………………………………………………………... 211
Chapter 8. Appendices……………………………………………………………….. 227

xii
List of Tables
Table Title
Page
Number
1 Nasal cavity dimensions at nasal valve region (ABW)
18
2 Summary of studies examining airway pressures during HFNC
27
3 Solid-state pressure sensor transducer compared to traditional fluid-
filled catheter pressure measurements
31
4 Pressure ranges normally encountered during pulmonary function tests
in infants and young children
33
5 The tidal volumes during CPAP and HFNC (Saslow et al)
45
6 The tidal volumes in mL at equal distending pressures (Lavizzari et al)
46
7 List of physiology studies evaluating respiratory parameters and HFNC
mechanisms
50
8 Bronchopulmonary Dysplasia Definition
67
9 List of studies included in HFNC clinical efficacy review
72
10 Summary of clinical studies comparing HFNC versus CPAP as primary
respiratory support
79
11 Summary of clinical studies comparing HFNC versus NIPPV as primary
respiratory support for RDS in preterm neonates
87
12 Summary of clinical studies comparing HFNC versus CPAP as post
extubation respiratory support for RDS in preterm neonates
97
13 Summary of clinical studies comparing HFNC versus CPAP alone as
weaning from CPAP in preterm neonates
105
14 Features of gas analyser components
159
15 Equipment used in the study
168
16 Timeline of various physiology studies in the proof of concept study
170
17 Participant Summary
175
18 Baseline characteristics of infants in the two groups
176

xiii
Table
(cont) Title
Page
Number
19 Airway pressure profile recorded with B&D differential transducer with
HFNC varying flow rates (Study ID 06)
179
20 Maximum, mean, minimum CO2 and O2 concentrations in
nasopharyngeal airway at various HFNC flow rates
183
21 Relationship of administered O2 to recorded O2 concentration in
nasopharyngeal airway during HFNC
185
22 Tidal volumes in ml/kg determined by Volusense method at CPAP 6 cm
H2O and varying HFNC flow rates
187
23 Tidal breathing indices with tidal flow derivatives
189
24 Heart Rate (mean) during the study
191
25 Respiratory rate (mean) during the study
192
26 Transcutaneous O2 saturation levels (mean %) during the study
193
27 Transcutaneous CO2 (mean) levels during the study
194

xiv
List of Figures
Figure
Title
Page
Number
1 Five-year trend in NIV use
6
2 Schematic diagram of a HFNC device
8
3 Schematic representation of HFNC
14
4 Effect of pressure limiting valve in HFNC device
15
5 Coronal cross sections of nasal cavity with respective locations
illustrated on the sagittal view
17
6 CT scan image of nasal cavity in a 4-month-old normal child
19
7 Sensor attached to the side of a catheter (Gaeltec) at its distal end
30
8 Schematic representation of a piezo resistive sensor
35
9 Schematic representation of a diaphragm displacement sensor
36
10 Forest plot of comparison: HFNC versus CPAP soon after birth for
primary respiratory support in RDS, Outcome: Treatment failure as
defined by the studies
83
11 Forest plot of comparison: HFNC versus NIPPV for primary
respiratory support in RDS, Outcome: Treatment failure as defined by
the studies
88
12 Forest plot of comparison: HFNC versus CPAP for post extubation
respiratory support in RDS, Outcome: Treatment failure as defined by
the studies
100
13 Pooled estimate of BPD risk in preterm infants on HFNC compared
with other modes of NIV as primary respiratory support
107
14 Pooled estimate of BPD risk in preterm infants supported post
extubation on HFNC compared with other modes of NIV
107
15 Pooled estimate of risks of death in preterm infants on HFNC
compared with other modes of NIV as primary respiratory support
110
16 Pooled estimate of risks of death in preterm infants supported post
extubation on HFNC compared with other modes of NIV
110

xv
Figure
(cont)
Title
Page
Number
17 Risk of air leak complications in preterm infants on HFNC compared
with other modes of NIV as primary respiratory support
112
18 Risk of air leak complications in preterm infants supported post
extubation on HFNC compared with other modes of NIV
112
19 Pooled estimate of risk of nasal trauma in preterm infants on HFNC
compared with other modes of NIV as primary respiratory support
115
20 Pooled estimate of risk of nasal trauma in preterm infants supported
post extubation on HFNC compared with other modes of NIV
115
21 HFNC Study Flow Chart
126
22 Gaeltec catheter tip pressure transducer
128
23 Catheter tip pressure transducer with strain gauge sensor at the tip
130
24 Catheter tip pressure transducer assembly with amplifier in series
132
25 Schematic diagram & catheter mounted pressure transducer calibration
134
26 Linearity of the CPAP pressure checked with water manometer
136
27 Linearity of the Gaeltec Catheter Tip Pressure transducer – CTO- L1
against the control (Bland Altman plot)
137
28 Linearity of the Gaeltec Catheter Tip Pressure transducer – CTO- L2
against the control (Bland Altman plot)
138
29 Example of a Thermal micro sensor pressure transducer
143
30 Principle of thermal sensor
145
31 Linearity of the thermal pressure transducer against the control
(Bland Altman plot)
147
32 Airway pressure recording with thermal sensor – HFNC 5LPM –
Dampening signal with movements
149
33 Differential pressure transducer and its assembly with nasopharyngeal
catheter in series
151
34 Linearity of the B&D Differential Pressure Transducer against the
control (Trend line with Error Bars-Standard Error)
153

xvi
Figure
(cont)
Title
Page
Number
35 Schematic diagram of Gas Analyser
156
36 Gas analyser, Nafion connecting tube and In-line filter
158
37 Schematic representation of Volusense Electromagnetic Inductance
Plethysmography
162
38 Volusense machine and measurement display on the machine screen
163
39 Example of simultaneous recording of physiology parameters in Lab
Chart recorder –Study ID – 06
166
40 Study trolley
167
41 Valid Pressure tracing with respiratory waveform for at least 10 breaths
177
42 Mean Airway pressure profile recorded with B&D differential
transducer with HFNC varying flow rates (Study ID 04 and 06)
179
43 Recording of nasopharyngeal airway O2 and CO2 concentrations during
CPAP with FiO2 34%
181
44 Heart Rate (mean) during the study
191
45 Respiratory rate (mean) during the study
192
46 Transcutaneous O2 saturation levels (mean %) during the study
193
47 Transcutaneous CO2 (mean) levels during the study
194
48 The physiology parameters trend with change in respiratory support
mode (CPAP to HFNC and HFNC to CPAP)
196
49 CO2 trace during high flow, during mechanical ventilation preterm
neonate and facemask ventilation via pneumotachograph
204

xvii
Abbreviations used in this thesis
Abbreviation
Expansion
81mKr Krypton
ABG Arterial Blood Gas
ABW Anterior Bony Window
AOP Apnoea of Prematurity
BCAW Bony Choanal Aperture Width
BCPAP Bubble Continuous Positive Airway Pressure
BiPAP Bilevel Positive Airway Pressure
BNC connector Bayonet Neill–Concelman connector
BPD Bronchopulmonary dysplasia
BW Birth Weight
CI Confidence Interval
CINAHL Cumulative Index to Nursing and Allied Health Literature
CLD Chronic Lung Disease
CNLD Chronic Neonatal Lung Disease
CO2 Carbon dioxide
COPD Chronic Pulmonary Obstructive Disease
COSHH Control of Substance Hazardous to Health
CPAP Continuous Positive Airway Pressure
CTO Catheter Tip Transducer
dB Decibels
DC Direct Current
dP/dt Change in pressure over time
EAM External Auditory Meatus
EELV End Expiratory Lung Volume
EIP Electromagnetic Inductance Plethysmography
ELBW Extremely Low Birth Weight
EMBASE Excerpta Medica dataBASE
FiO2 Fraction of inspired Oxygen
Fr French (refers to size)
FRC Functional Residual Capacity
FVg Expiratory Flow Volume loop centre of gravity
GA Gestational Age
GF Gauge Factor
h Thoracic motion
H2O Water
HFNP High Flow Nasal Prong
HFO High Flow Oxygen
HFTTO High Flow Trans Tracheal Oxygenation
Hg Mercury
HiP-HiV High Pressure High Volume

xviii
Abbreviation
(cont)
Expansion
HiP-LoV High Pressure Low Volume
HR Heart Rate
I2 Inaccuracy2
ICU Intensive Care Unit
INSURE Intubation, Surfactant administration, Extubation
IPP Intra Pharyngeal Pressure
IPPV Invasive Positive Pressure Ventilation
IRAS Integrated Research Application System
IVH Intra Ventricular Haemorrhage
kPa KiloPascals 81mKr Krypton
LABW Left Anterior Bony Width
LFNC Low Flow Nasal Cannula
LFNP Low Flow Nasal Prong
LFO Low Flow Oxygen
LFTTO Low Flow Trans Tracheal Oxygenation
LOA Limit of Agreement
LoP-HiV Low Pressure High Volume
LPBW Left Posterior Bony Width
LPM Litres Per Minute
MEMS Micro Electro Mechanical Systems
MV Minute Volume
N2 Nitrogen
NC Nasal Cannula
NCPAP Nasal Continuous Positive Airway Pressure
NEC Necrotising Enterocolitis
NICU Neonatal Intensive Care Unit
NIH National Institute of Health
NIMV Nasal Intermittent Mandatory Ventilation
NIPPV Non Invasive Positive Pressure Ventilation
NIV Non Invasive Ventilation
NP Nasopharyngeal Pressure
NVD Nasopharyngeal Vertical Distance
O2 Oxygen
OD Outer Diameter
PaCO2 Arterial Carbon dioxide content
PaO2 Arterial Oxygen content
PCA Post Conceptional Age
PCO2 Partial pressure of Carbon dioxide
PDA Patent Ductus Arteriosus
PEEP Positive End Expiratory Pressure
Pes Oesophageal Pressure
PETCO2 Carbon dioxide with Pneumotach

xix
Abbreviation
(cont)
Expansion
Pgas Gastric Pressure
PICU Paediatric Intensive Care Unit
PIPP Premature Infant Pain Profile
PLV Pressure Limiting Valve
PMA Post Menstrual Age
Poes Oesophageal Pressure
PP Pharyngeal Pressure
PPV Positive Pressure Ventilation
PRP Pressure Rate Product
Prp Retro Pharyngeal Pressure
PSU Power Source Unit
PTEF Peak Tidal Expiratory Flow
Ptp Trans pulmonary pressure
PTPdi Pressure Time Product of diaphragm
RABW Right Anterior Bony Width
%RC Rib cage contribution
RCT Randomised Control Trial
RD Risk Difference
RDS Respiratory Distress Syndrome
Rev Man Review Manager
RIP Respiratory Inductance Plethysmography
ROP Retinopathy of Prematurity
RPBW Right Posterior Bony Width
RR Risk Ratio
RSV Respiratory Syncytial Virus
SIPPV Synchronised Intermittent Positive Pressure Ventilation
SpO2 Oxygen saturation
TAA Thoraco Abdominal Asynchrony
TAM Thoracic Abdominal Motion
TcPCO2 Transcutaneous Partial Pressure of Carbon dioxide
te Expiratory time
TEF Total Expiratory Flow
TGI Tracheal Gas Insufflation
Ti Inspiratory times
TOSCA Transcutaneous Oxygen and Carbon dioxide measurement
tPTEF Time to Peak Tidal Expiratory Flow
TTC Trans Tracheal Catheter
TV Tidal Volume
VA Alveolar Ventilation
VD Dead space Ventilation
VLBW Very Low Birth Weight
VT Tidal Volume
WOB Work of Breathing

xx
Publication and Presentations
1. Saikiran Gopalakaje, Sundeep Harigopal, Chris O’Brien, Malcolm Brodlie, Alan Fenton. 5-
Year Trends in Neonatal Respiratory Support: Influence of High Flow Nasal Cannula
(HFNC) Oxygen Therapy on Incidence of Severe BPD. Presentation at Pediatric Academic
Society Meeting, 2014.
2. Saikiran Gopalakaje. High Flow Nasal Cannula Physiology update –Presentation at North
East Respiratory Meeting, August 2014, Great North Children’s Hospital, Newcastle-upon-
Tyne, UK.
3. Haq I, Gopalakaje S, Fenton AC, McKean MC, J. O’Brien C, Brodlie M. The evidence for
high flow nasal cannula devices in infants. Paediatric Respiratory Reviews. 2014;15(2):124-
34.

1
Chapter 1. Introduction

2
1.1 Prevalence of HFNC use
1.1.1 Definition
In the Cochrane review of HFNC in neonates the following definition was used to identify
relevant studies – ‘High flow nasal cannulae (HFNC) are small, thin, tapered binasal tubes
that deliver oxygen or blended oxygen/air at gas flows of more than 1 L/min’(1).
The flow rate is considered high flow when it is above that used in conventional low flow
system. In LFNC system, the oxygen is not humidified or heated and is delivered by standard
nasal cannulae (1-3).
However, defining HFNC in absolute numbers without taking into account patient population
that it is being used on is likely to be inaccurate. For example, a flow of 1-2 litres per minute
in an older child or an adult may not be high flow. The flow has to be well above the
inspiratory flow demands of a patient when in respiratory distress. The inspiratory flow
demands rise significantly at times of respiratory distress.
In the context of this study, as this study is in neonates, a definition of more than 1 litre per
minute flow is used.
1.1.2 History of HFNC usage
The current modern high flow nasal cannula therapy systems have evolved over time. This
was possible due to inventions that led to the development of apparatus adapted to heat and
humidify air and to deliver heated and humidified air to the respiratory tract of a human
patient. The integration of blenders that deliver varying concentrations of oxygen to the
patient has also been crucial. There were a series of inventions in the 1970s that led to
humidification of gases and in 1980s heating and humidification technologies were further
improved (4).
The delivery of oxygen and oxygen enriched air to the respiratory tract of a patient can cause
discomfort. If this gas mixture also has low humidity it increases the respiratory irritation. The

3
respiratory irritation is worse when the oxygen and air mixture is administered over a long
period of time (4).
Some of the early examples of inventions that tried to overcome this problem include a device
developed by Richard H Blackmer in 1981 that allowed oxygen enriching apparatus to
increase or regulate the humidity of the air. The air supplied to the patient may be heated by
circulation of warm air over delivery tubing, use of electric resistance heaters or circulating
warm liquid co-linearly with the delivery tubing (4, 5). Similarly Fisher and Paykel Ltd
developed a heating and humidification device in 1985. In their design, the humidifier has the
ability to create a vapour pressure sufficient to cause water vapour and deliver at a desired
temperature (6).
Throughout the 1980s and 1990s, various companies and individual scientists developed
heating and humidification devices for delivery of blended air/oxygen mixture to patients (4).
Vapotherm produced the first Food and Drug Administration (FDA) approved device for
delivering humidified high flow therapy in neonates in 2004. This device was called
Vapotherm 2000i. This approval was for intended use to add moisture and to warm breathing
gases for administration to patients, including neonates/infants and paediatric or adult patients
(7).
These Vapotherm units were withdrawn from the market in January 2006 following concerns
due to Ralstonia infection in some US neonatal units. This was followed by a period of
individual units putting together their own systems for delivery of heated, humidified gas
using basic components of a humidifier, respiratory circuit, adapter and nasal cannula (7).
This was followed by device produced by Fisher and Paykel Healthcare (Auckland, New
Zealand). This device called RT329 Infant Oxygen Delivery System was able to deliver
heated (37C) and humidified (44 mg/L) gas via nasal cannula at flow rates of up to 8 L/min
(7).
Depending upon the manufacturer the methods of heating and humidification of gases in
various high flow devices vary. For example, heating method in Vapotherm is by having a
tube structure where warm water compartment encircles the respiratory gas delivery tube
whereas in Fisher and Paykel system a heated wire coil is used which extends to the end of

4
the circuit (7). Currently there are many commercial systems available manufactured by
different companies such as Vapotherm, Fisher and Paykel, ResMed. The relative merits of
these devices need investigating.
1.1.3 Use of HFNC in neonatal units
The use of HFNC in neonatal units has been on the rise. The common reasons cited for the
use of HFNC over CPAP has been increased patient comfort, easier to apply and reduction in
nasal trauma and to provide positive airway pressure support. The increase in use predated
completion of large clinical trials.
In an online survey of 157 neonatologists in Australia and New Zealand in the year 2012, 27
neonatal units were contacted (8). The response rate was 71% with 67% returning complete
response to the questionnaire (8). 63% of the neonatal units at that time were using HFNC (8).
57% of the neonatologists replied that there was no published data on safety and clinical
usefulness of HFNC in neonates, however 15 of the 27 neonatal units covered in this survey
had some local policy in place for using HFNC (8). Rain out of the circuit with fluid
instillation into the upper airway was the most common problem reported(8). Most reported
(86%) that it was easier to apply and 84% reported HFNC was better tolerated by the
babies(8) than CPAP. Only 21% of the units used HFNC as primary support for RDS whereas
62% were using as post extubation respiratory support (8). HFNC was used as a primary
treatment for apnoea of prematurity in 58% of the units (8). Side effects including
pneumothorax, hyperinflated lung fields, pulmonary haemorrhage, or feeding intolerance
were not documented with HFNC use (8).
In the USA, Hochwald and Osiovich performed a questionnaire survey of 97 academic
neonatal units, 69% of the responders were using HFNC (9).
In 2009, a telephone survey of senior nurses working in 214 UK neonatal units found 55% of
the units using HFNC (10). The definition of HFNC was flow rate more than 1 litre per
minute (10). However only 77% of these units were humidifying the gases before delivery as
high flow (10). This reflects the evolution of high flow nasal cannula technology that earlier
high flow gases were delivered without appropriate humidification or heating to appropriate
temperature.

5
A telephone survey of 203 UK neonatal units was done in 2012 with 100% response rate (11):
113 (56%) of the neonatal units use some form of HFNC (11), 42% of the units used either
HFNC initially or CPAP followed by HFNC following extubation (11). HFNC was used only
as a step down from CPAP in 58% of the units (11). Flow rate at commencement varied
between with 60% of the units starting at HFNC at 8 litres per minute and 30% of the units at
5-6 litres per minute (11). Most units weaned off the HFNC once the flow rate was 2-3 litres
per minute (11).
A web based survey of 57 Level 2 and 3 neonatal units was done from November 2011 to
May 2012 in the UK with 77% response rate (12). Among the responders 77% of the units
used HFNC (12), 50% of the units did not have any guideline for use of HFNC (12).
Vapotherm was the most commonly used device with 47% of the units using it whereas
Fisher and Paykel bRT329 was used in 38% units (12). Indications included as an alternative
to CPAP in 77%, for weaning CPAP in 71%, and for post extubation support in 53% (12).
Gradual reduction in flow rate was the most common method of weaning where as one unit
weaned by reducing the time spent on HFNC (12).
It is evident from the series of surveys that the prevalence of use of HFNC is increasing in
neonatal units. This increase in use is not based on irrefutable evidence of its safety and
efficacy. The ease of administration and no reports of significant serious short term adverse
events might have allowed its acceptance.
Recent studies on HFNC use in neonates have not reported increased incidence of BPD but
information about 'Severe BPD' is lacking. We examined the incidence of 'Severe BPD' by
performing a retrospective audit of neonatal unit data from Royal Victoria Infirmary,
Newcastle upon Tyne looking at the population of preterm babies less than 32 weeks’
gestation that required oxygen beyond the first 28 days of life (13). The aims of the audit were
to examine trends in use of non-invasive respiratory support and respiratory outcomes in
neonates <32 weeks’ gestation receiving non-invasive ventilation (NIV) and to identify
association between type of non-invasive respiratory support and severe BPD.
A total of 776 babies with <32 weeks’ gestation were admitted during the five-year period
between January 2008 and December 2012 (13). Among these, 282 preterm babies required
oxygen >28days of life (13). Out of these, 128 babies received CPAP ± BiPAP alone and 154

6
received HFNC ± CPAP.(13) The use of HFNC increased during this five-year period and
that of CPAP as the sole non-invasive respiratory support decreased as illustrated in the
Figure 1.
Figure 1. Five-year trend in NIV use
Figure 1 shows the increase in use of HFNC during the 5-year period associated with decline
in use of CPAP alone as non-invasive therapy.

7
1.2 High Flow Nasal Cannula Device Set Up
HFNC system is composed of humidification unit and flow driver and different types of
heating system to deliver warmed, humidified blended air/oxygen mixture at variable flow
rate and adjustable FiO2. These gases are heated to temperature close to 37˚C, humidified to
100% relative humidity and delivered to the patient via nasal cannulae.
Several manufacturers currently produce different HFNC circuits and devices, which vary in
heating and humidification methods.
The HFNC devices currently available in the market differ in their technology in different
aspects of HFNC system but underlying principle is to administer the heated, humidified
blended gas mixture at desired flow rate and FiO2. A schematic diagram of a HFNC device is
shown in figure 2.

8
Figure 2. Schematic diagram of a HFNC device(2)
Figure 2 shows components of a typical HFNC device.

9
1.3 Mechanisms of Action
The following mechanisms of action of the heated, humidified high flow nasal cannula system
have been suggested. It is important to note that the relative contribution of these mechanisms
is not yet clearly elucidated. The possible role of these mechanisms has been either directly
studied (14) or been extrapolated from similar studies done in animals and in vitro systems
(14).
1. Heating and humidification of gas
2. Airway distending pressure
3. Airway dead space wash out
4. Effect on work of breathing
5. Reducing metabolic demand
1.3.1 Heating and humidification of gas
It is a function of the upper airway particularly the nasal space to warm and humidify the
inspired gas before delivery to lower airways. However, the inspiratory gas flows delivered by
high flow systems are far higher than the inspiratory flows normally taking place in an infant
with tidal breathing or even during respiratory distress. The anatomical capacity of the natural
humidification and heating system thus is limited to meet the humidification requirements for
higher inspiratory flows. Consequently, the unhumidified and unheated gas flows can dry up
the mucosa and result in mucosal injury and infection Kopelman (15).
The clinical effectiveness of systems with heated and humidification gas delivery is also
likely to be better compared to unheated and unhumidified system. In a crossover study of 30
preterm infants, post extubation support with heated and humidified device (Vapotherm) fared
better with no extubation failure compared to those receiving unheated and unhumidified high
flow (16).
The possible reason for this improved clinical effectiveness with heated humidified high flow
system is likely because of its effects on pulmonary compliance and conductance. Saslow and
colleagues compared 6 cm of H2O of conventional CPAP using standard humidification
system with a high flow system delivering 5 L/min of heated humidified gas to infants. The
10
respiratory compliance profile was 1.03 ± 0.47 for HFNC whereas only 0.83 ± 0.49 ml/cm
H2O / kg for CPAP (17).
This improved respiratory compliance seen with HFNC system when compared to CPAP was
seen despite CPAP achieving better oesophageal pressure (a surrogate for airway end
expiratory pressure) profile (1.76± 1.46 vs 1.32 ± 0.77 cm H2O)(14, 17). Thus HFNC system
achieved better respiratory compliance despite achieving less distending pressure possibly due
to better conditioning of delivered gas (14). This effect on compliance was observed in an
earlier study in ventilated infants that even five minutes of ventilation with unheated and
unhumidified gas resulted in significant reduction in pulmonary compliance and conductance
(18).
1.3.2 Airway distending pressure
It is well established that the airway distending pressure is one of the main mechanisms of
action of CPAP devices. That CPAP is effective in treating respiratory distress in infants was
shown way back in 1971 (19). HFNC also delivers a certain amount of distending pressure to
the airways as shown in several studies including in vitro studies (20-23) as well as a number
of small clinical and interventional studies in humans (3, 17, 24-31).
The distending pressure increases the Functional Residual Capacity (FRC). FRC is the
volume of gas remaining in the lungs at the end of a normal expiration. At this lung volume
the outward recoil of the chest wall and inward lung recoil are equal. FRC is reduced when
the lungs are stiff and chest wall has low elasticity such as seen with preterm infants. Thus
reduction in FRC means the baby is breathing from a lung volume which is closer to the
closing volume. Since CPAP increases transpulmonary pressure there is increase in lung
volume at the end of a normal respiration i.e., FRC. The increase in FRC in turn results in
improved ventilation (32).
The quantity of airway distending pressure achieved during HFNC is variable and
unpredictable. This depends upon the quantity of leak at the nasal cannula –nares interface
and at the mouth level. The flow rates used and size of the baby also influence the airway
pressures measured during HFNC therapy.

11
1.3.3 Airway dead space wash out
The Carbon dioxide (CO2) removal is enhanced by enhancing the alveolar ventilation. The
alveolar ventilation is determined by the minute volume which is calculated from the
equation,
Respiratory Minute Volume (MV) in litres (L) = Tidal Volume (TV) in litres X Respiratory
Rate (f)
Alveolar Minute Ventilation = (Tidal Volume – Dead space) X Respiratory Rate (f)
Therefore, it is apparent that by reducing the dead space component, the alveolar ventilation
can be improved.
Since HFNC delivers gas flow in excess of inspiratory gas flow demands there is wash out of
exhaled CO2 and enrichment of delivered O2 concentration in the upper airways and possibly
further along the conducting airways. This effectively reduces dead space volume as there is
clearance of CO2 from conducting airways allowing the alveolar ventilation with new gas
mixture achieved by HFNC. Therefore, the efficiency of gas exchange improves. This results
in lesser need for the infant to increase MV by increasing the respiratory rate. Clinically this
has been observed by reduction in respiratory rate in several retrospective (33, 34) and
prospective studies (31, 35).
There is speculation that this improvement in ventilation is due to dead space wash out effect
mainly and not due to distending pressure alone (22). In an animal study involving piglets
with induced acute lung injury, HFNC administered within a range of 2-8 L/min, achieved
improved ventilation and oxygenation. This effect was proportional to the flow levels used
irrespective of pressures generated and higher leak resulted in better oxygenation (22).
1.3.4 Effect on work of breathing
Thoraco-abdominal asynchrony, Tidal volumes, pleural pressures (indirectly inferred by
oesophageal pressures) measurements have been done to study the effects of HFNC and
CPAP on respiratory mechanics and work of breathing (17, 30, 31, 36, 37).
Locke et al demonstrated that as the flow rate increases there is a reduction in thoraco-
abdominal asynchrony (30). Since thoraco-abdominal asynchrony gives an estimate of work
of breathing, increasing the HFNC flow rate resulted in reduction in work of breathing (38).

12
Boumecid demonstrated in 19 preterm infants that the thoraco-abdominal asynchrony seen in
HFNC was comparable to that seen in constant-flow CPAP whereas variable – flow CPAP
was better in improving thoraco-abdominal asynchrony (37).
The tidal volume measured by respiratory inductance plethysmography during HFNC when
compared to CPAP was similar as found by two different investigators (17, 37). Similarly a
respiratory mechanics study by Lavizzari involved 20 preterm infants who required non-
invasive respiratory support within 96 hours after birth (36). They studied tidal volumes
measured by respiratory inductance plethysmography, pleural pressures estimated from
oesophageal pressures and also gas exchange during administration of a randomised sequence
of CPAP at 2,4 and 6 cm H2O and HFNC at 2, 4 and 6 Litres per minute (36). Their study did
not show any significant differences in breathing pattern, gas exchange or total work of
breathing between HFNC and CPAP(36). Comparison of CPAP fixed at 6 cm of H2O was
done with variable amounts of HFNC between 1-6 litres per minute flow rate was done by
Lampland et al (31). They measured heart rate, respiratory rate, inspired oxygen
concentration, and arterial oxygen saturation (31). They noticed increased oxygen
requirements, increase in respiratory rate and also some apnoea events when HFNC flow rates
were 1-2 litres per minute (31).
In a randomised crossover study in infants with evolving or established BPD, Shetty et al
studied effects of HFNC and CPAP on work of breathing, thoracoabdominal asynchrony and
oxygenation (39). They studied 20 infants (median gestational age of 27.6 weeks (range 24.6-
31.9 weeks) at a median postnatal age of 30.9 weeks (range 28.1-39.1 weeks) (39). Infants
were studied on 2 consecutive days (39). On the first study day, they were randomised to
either CPAP or HHFNC each for 2 h, the order being reversed on the second day (39). The
pressure time product of the diaphragm (PTPdi) was used to infer the work of breathing (39).
There were no significant differences in the work of breathing on CPAP versus HFNC as the
mean PTPdi 226 (range 126-294) was similar to HFNC mean PTPdi 224 cm H2O/s/min
(95% CI for difference: -27 to 22; p=0.85) (range 170-318) (p=0.82) (39).
In a single centre, prospective study involving children less than 3 years of age, relationship
between HFNC and effort of breathing was studied. The effort of breathing was estimated by
measuring percent change in pressure rate product (PRP) (40). They used different levels of
flow rates at 0.5, 1.0, 1.5, and 2.0 L/kg/minute based on body weight (40). In 21 patients with

13
49 episodes they reported that increasing flow rates resulted in a significant difference in the
percent change in PRP from baseline (of 0.5 L/kg/minute). The highest change was seen at
flow rate of 2.0 L/kg/min (-21%) (40). Further, this effect was particularly significant in
children less than 8 kg in weight.
1.3.5 Reducing metabolic demand
The inspired air is warmed to 37˚C and humidified to 100% relative humidity by the nasal
passages (14). There is energy cost to this process of conditioning the gas before delivery to
lower airways (14). The nasal passages do capture moisture and heat from expired gas for
recycling with subsequent inspirations (14). However as this is not 100% efficient system,
there is metabolic energy expenditure by nasal mucosa to warm and humidify the inspired gas
to ideal conditions (14). In an adult breathing at 12 breaths per minute with 500ml tidal
volume in an environment of 21˚C temperature and 50% relative humidity will spend an
additional 156 calories per minute to warm and humidify the inspired air to ideal condition
(14). HFNC by delivering gases warmed to 37˚C and humidified to 100% relative humidity
reduce the metabolic cost to the baby (14).
1.4 Effects of HFNC on Airway Distending Pressures
1.4.1 Airway pressure - Principle factors
Airway pressure due to HFNC is determined by three principle factors (41):
Flow
Anatomical dimensions
The leak –Around nasal prongs & mouth
A schematic representation of the resistors in series and pressure compartments that can be
identified is shown in figure 3.

14
Figure 3. Schematic representation of HFNC(41)
Figure 3 illustrates the two resistors and two pressure compartments in the circuit - patient
HFNC system applied to patient. Resistor (R1) is the nasal cannula and therefore pressure
compartment (P1) is the patient circuit(41). Resistor (R2) represents the components resistive
to gas release from the patient’s nose (around the cannula) and mouth and therefore pressure
compartment (P2) is the pressure in the nasopharynx (41).
Unlike CPAP, High flow nasal cannula is an open system. Gas flow delivered to a patient via
nasal cannula and the cannula prongs should not occlude the nares and where the patient’s
mouth should not be actively closed (41). The reason for this is explained by the
understanding of resistance locations and pressure segments in the whole HFNC and patient
airway continuum. The pressure in each compartment is a function of the resistor(s) that lie in
series downstream from that compartment (41). Therefore, circuit pressures will always be
substantially greater than pressure in the nasopharynx (41).
1.4.2 Pressure in the Device Circuit
Nasal cannula outer diameter is very small in the range of 2-3.7 mm (2). Therefore, this offers
very high resistance to airflow. Therefore to achieve high flows into the patients airway the
circuit pressure needs to achieve high levels up to 3 to 4 PSI range (41). It has been shown
that limiting the pressure by pressure limiting valve (PLV) limits the ability to deliver higher
flows (31). It is not possible to transfer the same amount of high pressure into the patient’s
airway because of the nasal cannula resistor which is upstream to airway. The key findings of
role of pressure limiting valve in HFNC device is shown in figure 4.
Airway Tubing & Flow driver

15
Figure 4. Effect of pressure limiting valve in HFNC device (31)
Figure 4 shows the data from Lampland et al(31) using a Fisher and Paykel HFNC system
with and without a pressure limiting valve (PLV) set to 45 cmH2O noted that with the
pressure limiting valve in place, the system does not permit more than 2 L/min to pass
through the cannula regardless of the flow entering the humidifier(31, 41).
1.4.3 Anatomy of upper airway
The nostrils and nasal cavities are the first anatomical points through which HFNC is
delivered. It is therefore important to study the distribution and velocity of the airflow in the
nasal cavity. In order to understand this phenomenon, knowledge of nasal anatomy and its
geometrical influence has to be understood.
The nasal cavity has tortuous passages that form a large surface area and are lined with
mucosa (42). The nasal cavity extends from nasal vestibule till the beginning of nasopharynx.
This is actually two separate airways partitioned by the nasal septum within the nasal cavity
(42). The nasal vestibule is the area enclosed by the external cartilages of the nose and is lined
with small, filtering hairs (42). The turbinates (or concha) are long, narrow and curled bone
shelves that protrude into the nasal cavity, creating a large surface area and forming the
inferior, middle and superior airways and meatus passageways (42). The nasal valve occurs
just posterior of the nasal vestibule and is the region of smallest cross-sectional area (See
figure number 5) (42).

16
These cross-sectional areas at the nasal valve has been found to be 0.54–1.21 cm2 measured
by Ozcan Cakmak et al (43). They determined this from their study on 25 healthy adults using
CT scan data. However the nasal valve size is not constant but constantly changing with the
nasal cycle with changes in the surrounding erectile tissues (44). The nasal valve leads into
the nasal cavity expanding both in height and in cross sectional area. The relative anatomy of
both half of nasal cavity is similar although they are not symmetric in dimensions (42). The
right side tends to be larger in cross sectional area (42). The cross sectional area of the right
nasal cavity 7.2 cm posterior of the external naris is 30% larger than on the left (42).
In a study examining the dimensions of human nasal cavity using CT scan data of 30 healthy
adults reported that the internal volume of middle region of the left and right nasal cavities
vary by up to 65% (45). The cross-sectional area narrows down to 1.1 cm2 in the oropharynx.
The oropharynx size depends upon the position of soft palate (42).
Since the nasal passages have complex geometry and inaccessible passageways, it is difficult
to study flow pattern within nasal cavities. However the flow patterns can be studied using in
vitro artificial nasal models (42). Using computational models, Wolf et al (46) found that on
inspiration, maximum velocities of 6–18 ms-1 were measured at the nasal valve, 2 ms-1 in the
main passage and 3 ms-1 in the nasopharynx (46). Largest flow was through the middle
airway. During expiration, maximum velocities of 3–6 ms-1 were measured in the nasal valve
and velocity of 1–2 ms-1 throughout the nasal cavity (46).

17
Figure 5. Coronal cross sections of nasal cavity with respective locations illustrated on
the sagittal view(42)
Figure 5 shows a series of anatomical areas of the nose starting from nares anteriorly and
proceeding posteriorly. The corresponding anatomical areas are depicted in sagittal view.

18
In infants and children nasal cavity measurements have been made using CT scan. Likus et al
examined the CT scans of 180 Polish Caucasian children (83 girls and 97 boys) with age
range of birth to 3 years, with normal development and with no evidence of craniofacial
abnormalities in the age range of birth to 3 years (47). The children were divided into
following groups
A: 0–3 months (23 children: 13 females and 10 males)
B: 4–6 months (35 children: 20 females and 15 males)
C: 7–12 months (53 children: 27 females and 26 males)
D: under 2 years of age (13–24 months) (42 children: 14 females and 28 males)
E: under 3 years of age (25–36 months) (27 children: 9 females and 18 males).
They measured several nasal dimensions, of particular importance to this study were, firstly,
anterior bony width between the two maxillary ridge called as piriform aperture (ABW) and
this refers to site of nasal valve, secondly, nasopharynx vertical distance between posterior
vomer and cranial base (NVD) which relates to nasopharyngeal size and finally, bony choanal
aperture width between both pterygoid processes in posterior nasal cavity called choanal
aperture (BCAW) which relates to any possibility of resistance in series further down in the
nasal cavity. These nasal dimensions are illustrated in figure 6.
The results for above three parameters are shown in table 1 (47),
Table 1. Nasal cavity dimensions at nasal valve region (ABW)(47)
Group ABW
[mm]
BCAW
[mm]
Nasopharynx
NVD [mm]
A 14.87 ± 1.62 16.86 ± 2.16 21.06 ± 3.48
B 15.60 ± 1.15 16.70 ± 1.26 24.86 ± 2.66
C 17.11 ± 1.27 17.77 ± 1.45 25.60 ± 2.67
D 18.46 ± 1.35 19.26 ± 1.47 25.62 ± 2.40
E 18.87 ± 1.28 20.65 ±1.53 26.18 ± 3.27
Table number 1 shows the typical nasal cavity dimensions seen in various age groups of
children from 0-36 months of age.

19
Figure 6. CT scan image of nasal cavity in a 4 month old normal child(47)
Figure number 6 shows CT scan image of a 4-month-old child with identification of the
important structures in nasal anatomy.
There is progressive growth in the nasal cavity dimensions with age but it is not uniform or
linear (47). In a study on 39 infants, using continuous wide-band noise acoustic rhinometry,
using a specific probe optimized for infants examined at infancy and 1 year of age, the nasal
dimensional growth and maturation was reported by Djupesland et al (48). During the first
year of life, the acoustically determined dimensions of the nasal airways increased
significantly (48). The total minimal cross-sectional area increased by 67% (0.21 cm2-->0.35
cm2)(48), the volume of the anterior 4 cm of the nasal airway by 36% (1.80 cm3-->2.44 cm3)
and the distance to the minimum cross-sectional area by 19% (0.78 cm-->0.93 cm) (48).
During inspiration, the air flow velocity is higher initially and its path of flow is mainly
through the lower half of the nasal cavity. Therefore, the olfactory grove which is located in
ABW – Anterior bony
width
BCAW – Bony choanal
aperture width
NVD – Nasopharynx
Vertical Distance
RABW – Right
anterior bony width
LABW – Left anterior
bony width
RPBW – Right
posterior bony width
LPBW – Left posterior
bony width

20
the upper portion of the nasal cavity receives air flows with lower velocity (49). The sniffing
manoeuvre alters this flow and directs increased air flow towards the upper portion of the
nasal cavity.
The narrowest part of the nasal passage relevant to air flow resistance is at the functional
nasal valve in the anterior nasal cavity and therefore it is a major determinant of flow (49).
The posterior cavity, however is wider and circular. The expiratory flow in the nasal cavity is
along the turbinates (49).
The relationship of nasal air flow is linear to the nasal cavity volume and area (49). The nasal
tissues, however, cause dynamic changes to the nasal resistance which affects flow. This is
due to a number of factors including collapse of soft tissues and downstream resistance of the
lower airways (49).
The neonates are obligate nasal breathers supplemented by oral breathing during sleep (49).
Primary oronasal breathing occurs normally with crying and returns to uninterrupted nasal or
some combination of oronasal (49).
A premature infant’s skin is especially susceptible to injury from nasal interface devices (49).
Researchers have used to different scoring systems based on site of nasal trauma. The damage
may occur at any of these sites including the nares, intranasal septum, the septum’s anterior
tip (columella), or philtrum (49).
In summary, the nasal and nasopharyngeal airway anatomy of preterm, infants and adults
poses a physiologically complex pattern of airway resistance.
1.4.3 Effects of mouth position on nasopharyngeal pressure
When the HFNC circuit is connected to the patient with the nasal interface there are mainly 2
sites which allow leak. First is at the nasal cannula and nare interface and second is at the
mouth. It has been shown in studies on CPAP that pharyngeal pressures drop when the mouth
is open (50).

21
Kubicka et al studied delivered oral cavity pressures during HFNC flow rate range of 1-5
litres per minute in 27 infants (3). Small (outer diameter: 0.2 cm) cannulae were used for all
infants and prescribed flow rate was opportunistically studied with no changes made for the
study (3). In their study infants (postmenstrual age: 29.1–44.7 weeks; weight: 835–3735 g;
flow rate: 1–5 L/minute), no pressure was generated with the mouth open at any flow rate (3).
With the mouth closed, the oral cavity pressure was related to both flow rate and weight. For
infants of <1500 g, there was a linear relationship between flow rate and oral cavity pressure
(3). They concluded that firstly, their technique of measuring oral cavity pressure can estimate
the level of continuous positive airway pressure and secondly, continuous positive airway
pressure generated with heated, humidified, high-flow nasal cannula treatment depends on the
flow rate and weight(3). According to their data, the more smaller infants when their mouths
were closed had clinically significant and unpredictable levels of continuous positive airway
pressure during high flow therapy (3).
In the study by Arora et al involving 25 (mean 78.1 [SD 30.9] days; weight 5.3 [SD 1.1] kg)
patients with bronchiolitis, nasopharyngeal pressures were measured at varying flow rates of
HFNC(28). They found that nasopharyngeal pressures increased linearly with flow rates up to
6 L/min (28). Nasopharyngeal pressure increased by 0.45 cm H2O for each 1 L/min increase
in flow rate (28). There were significant differences between pressures in open and closed
mouth states for flow rates up to 6 L/min (28). At 6 L/min, the pressure in open mouth state
was 2.47 cm H2O and that in closed mouth state was 2.74 cm H2O (P<0.001)(28).
In a lung model study, two HFNC devices Vapotherm 2000i and Fisher-Paykel were studied
to understand the relationship between the device, intraprong, and proximal airway pressures
and the flow values. Fisher-Paykel system had a pressure release valve (23).
A paediatric size cannula of 2-mm inner diameter was used in a lung model and the device,
intraprong, and proximal airway pressures at random flow values between 0 L/min and 12
L/min with an FIO2 of 0.21 were measured under simulated minimal and moderate nares-
prong leak as well as varying mouth leak (23).
Irrespective of leak, all the three pressures increased with increasing flows with both devices
(23). Under conditions of minimal leak and flow rates <8 L/min, the Fisher-Paykel device
generated larger pressures than the Vapotherm device although this was not seen at higher
flows because of pressure release valve (23). The intra prong pressures were about 1/5th to

22
1/3rd (between 22% and 27% and 20% and 32% ) of the corresponding device pressure value
for Fisher-Paykel and Vapotherm (23). There was further reduction in proximal airway
pressure downstream by about 20% to 30% relative to the intraprong pressure values with the
two devices (23). Interestingly, the device pressure was not affected by nares-prong leaks or
mouth leak (23). However, the increase in leak at nares or mouth caused reduction in
intraprong and proximal airway pressures (23). The authors concluded that HFNC may
deliver uncontrolled continuous positive airway pressure to infants (23).
However, the results of some studies evaluating mouth position and effects on airway
pressure are in conflict with the results of above studies. Wilkinson et al. studied pharyngeal
pressure in 18 preterm neonates (median gestational age 34 weeks, weight 1.619 kg) during
high flow therapy (27). A catheter-tip pressure transducer was introduced into the
nasopharynx (27). Flow was sequentially increased to a maximum of 8 litres per minute and
decreased to a minimum of 2 litres per minute (27). There was a strong association between
pharyngeal pressure and both flow rate and infant weight (P<0.001, r20.61), but not mouth
closure (27). They concluded that high flow nasal cannulae at flow rates of 2 to 8 litres per
minute can lead to clinically significant elevations in pharyngeal pressure in preterm infants
(27). Flow rate and weight but not mouth closure are important determinants of the pressure
transmitted (27). They felt that the amount of nasal gas leakage with HFNC was more
important than the degree of mouth leak, particularly in comparison to the tightly fitting nasal
prongs used with CPAP, which allow very little gas to escape from the nostrils (2, 27).
1.4.4 Effects of flow rate on nasopharyngeal pressure
CPAP machines are capable of varying the flow delivered to achieve set amount of pressure
when the circuit has varying amounts of leak. Generally, the flow to the magnitude of around
8 litres per minute is used to achieve a CPAP of about 5-6 cm H2O. Thus, this implies that
varying amounts of flow can have varying amount of pressure generation downstream in the
airways. This aspect has been looked in more detail with respect to HFNC by various
investigators.
In an animal study, Frizzola et al studied effects of flow rate on the tracheal pressures (22).
Neonatal piglets (n=13; 2-6kg) were injured with IV oleic acid and supported with HFNC at 2
-8 L/minute (22). Tracheal pressures were recorded by transmural catheters (22). Oxygenation

23
and tracheal pressures increased in a flow dependent manner and at 8L/minute, tracheal
pressures did not exceed 6±1 cmH2O (22).
Kubicka et al studied oral cavity pressures during HFNC flow rate range of 1-5 litres per
minute in 27 infants (3). Small (outer diameter: 0.2 cm) cannulae were used for all infants and
prescribed flow rate was opportunistically studied with no changes made for the study (3). In
their study infants (postmenstrual age: 29.1–44.7 weeks; weight: 835–3735 g; flow rate: 1–5
L/minute), under the conditions of mouth open no pressure was generated irrespective of the
flow rate (3). The oral cavity pressure was related to flow rate and weight of the infant when
the mouth was closed. The relationship was linear between flow rate and oral cavity pressures
for infants <1500 grams (3).
Lampland et al conducted both in vitro and in vivo study of effects of HFNC flow rate on the
airway pressures (31). In the in vitro part, the HFNC pressure and flow was measured with
varying degrees of leak and with and without the use of a pressure-limiting valve (31). In the
in vivo part, they measured end expiratory oesophageal pressures in 15 newborns on NCPAP
6 cm H2O and then on HFNC at 6 L/minute, with flow decreased by 1 L/minute every 30
minutes (31). In the in vitro study, in the absence of leaks, the pressures were limited by the
pressure-limiting valve only at flows > 2 L/minute (31). With leaks of 30% and 50%,
delivered pressures were always < 3 cmH2O(31). They found wide variation in intrapatient
and interpatient results (31). The end expiratory oesophageal pressures were similar with
CPAP and HFNC (31).
Spence et al studied intra pharyngeal pressures (IPP) in 14 infants in an observational study
on a sample of stable term and preterm infants who were being treated either with NCPAP or
with HFNC (26) with 6 babies were studied on both (26). Two infants only had IPP measured
on CPAP, and six infants had IPP measured on HFNC (26). IPPs were recorded for 2 to 3 min
or until airway pressure and infant were stabilized at each level NCPAP of 2, 4 and 6 cm H2O
and HFNC of 1, 2, 3, 4 and 5 l/min average pressures were documented over the 2 to 3 min
observation period at each NCPAP and HFNC level and a single value was recorded (26).
Infants’ mouths were kept closed by gentle chin support and/or pacifier placement (26).
A Viasys 5 French Tracheal Catheter (PN 10635, Viasys Healthcare, Yorba Linda, CA, USA)
was introduced to the posterior pharynx through the infant’s nares or mouth for measuring
pressure (26). Depth of insertion was estimated by measuring the distance between the corner
of the nare and the ear lobe (26). The catheter was connected to a pressure-measuring device

24
(Viasys avea ventilator) and IPP was recorded continuously (26). The Viasys Infant Flow
CPAP System was the primary device used for this study (26). HFNC was delivered via
Fischer & Paykel (Fisher & Paykel Healthcare Inc. Irvine, CA, USA) humidification system
and Salter brand infant nasal cannula (26). All the infants had the ‘infant size’ prongs from
Salter (26). Except for one patient, HFNC consistently generated a significant amount of
CPAP: the average IPP (cm of H2O) for flow rates of 1, 2, 3, 4 and 5 litres per minute was
1.7±0.3, 1.7±0.2, 2.6±0.3, 3.8±0.4 and 4.8±0.5 respectively (26). In one patient, flows at 1to5
LPM generated an IPP of <2cmH2O (26). This study did not find a correlation between the
size of the baby and the IPP generated at each flow rate, as it was not powered to detect this
correlation if any (P = 0.707) (26).
In another study involving 16 VLBW infants over 3 days of age, range of airway pressures
with Optiflow HFNC device was studied (51). Both pharyngeal and oesophageal pressures
were measured using a 6Fr solid state manometric catheter (Unisensor, NH) with dummy in
and out for mouth leak evaluation (51). The infants characteristics at study entry were age of
mean (SD)) 36(22) days, gestationa age 27(2) wks, Birth weight 850 (220) g and FiO2
26(6)% (51). At the 7L/min flow rate, the end inspiratroy and end expiratory pressures (cm
H2O) for pharyngeal and oesophageal measurment were 5.5 (4.6, 6.7), 6.5 (5.4, 7.6), 2.2 (1.0,
3.3) and 13.3 (10.6, 14.2) respectively (51). There was a significant relation
between flow and pharyngeal pressure although flow rates greater than 4 L/min had little
additional effect on pharyngeal pressure (51). Their conclusion was that alteration of flow has
a significant effect on pharyngeal but not oesophageal pressure (51). This is difficult to
explain apart from any possibility of methodology of pressure measurement being the cause
of their finding.
1.4.5 Effects of nasal cannula size on nasopharyngeal pressure
The nasal cannula and nares interface is a site for leak in the HFNC circuit when applied to
the patient. Therefore, relative size of nasal cannula to the nare diameter is of practical
relevance. Some of the earliest studies of oesophageal pressures during high flow therapy
have shown that larger nasal cannula tends to produce higher pressures (2, 30).
Nasal cannula outer diameter (OD) is specified by manufactures(2). In general, the OD is
around 2.4 mm in premature and new born neonates, and 2.4 to 3.7 mm in infant and
paediatric patients (2, 49). Locke et al. measured oesophageal pressure produced with varying

25
OD of nasal cannulae (2, 30). The 3 mm OD nasal cannula delivered higher pressures with a
mean of 9.8 cm H20 at a flow of 2L/min in infants who were 30 weeks’ gestation at 28 days
of age(2, 30). In contrast, the 2 mm OD cannula, did not deliver any pressure (30). One
possible explanation for this is there may be increase in leakage of flow around the smaller
cannulae (2). It is important to note that this study dates back to 1993 and the high flow
device was not a standardised equipment capable of heating and humidifying to optimum
conditions (30).
The ratio of nasal cannula to the nasal opening is more important than the absolute size of the
cannula (30). The entire nasal passage is important in the development of positive end-
distending pressure (30). Both anatomic and physiologic factors can affect the nasal gas flow
pattern and turbulence will cause resistance to gas flow similar to a mechanical occlusion of
the nasal passage (30).
Since size of nares is proportional to the size of the baby, baby’s weight influences the likely
pressures delivered to the airways (2).
Volsko et al in an in vitro study described the relationship between the pressure generated at
the airway opening and flow through a nasal cannula using a simulated infant model (21). A
range of nare sizes including small, medium and large were drilled into a plastic fixture (21).
A lung simulator was used to simulate spontaneous breathing (21). A range of tidal volumes
from 3 mL to 12 mL were delivered by adjusting the amplitude in a simulated respiratory
wave form (21). The simulated lung model had a lung compliance and resistance set at 0.5
mL/cm H2O and 125 cm H2O/L/s, respectively (21). They optimally sized cannulae for
premature, infant and paediatric nares to ensure that they were not occluded (2, 21). The
prong occlusion of the nares did not exceed 50% (21). A flow rate range of 2– 6 L/min in 1-
L/min increments was used (21). They recorded Mean airway pressure and percent change in
tidal volume (VT) (21). The greatest effect on tidal volume was seen with the premature
cannula (21). The least effect on pressure and VT change occurred with the infant cannula
(21). The differences in spontaneous tidal volume across all flows were negligible (21). The
maximum pressure generated was 2 cm H2O, which was not clinically significant (2, 21).
These findings were similar to Locke’s study on infants using 2 mm OD nasal cannula (2, 30).

26
Using a simulated in vitro system Sivieri et al. measured proximal airway pressures delivered
by a HFNC system while varying flow and ratio of cannula to nares size. Airway pressure
increased progressively with increased flow and with nasal prong to nares ratio (20). They
concluded that safe and effective use of HFNC requires careful selection of appropriate nasal
prongs for the individual infant even with an integrated pressure limiting valve (20).
1.4.6 Summary of effects of HFNC on airway pressures
The physiology studies looking at airway pressures have been summarised in the table
number 2. The relationship of airway pressures to other parameters can be summarised as
follows,
1. When compared to CPAP the airway pressures (oesophageal, nasopharyngeal, oral)
are similar to, or less than, those usually set with CPAP (3, 21, 26, 27, 38). However
the pressures measured with older HFNC devices recorded higher airway pressures
beyond the pressures usually used in CPAP therapy (30).
2. The flow rate positively correlates with pressure; airway pressures increasing with
increasing flow (3, 22, 26, 31, 38, 52).
3. The airway pressures increase with decreasing infant weight (3, 27, 38).
4. There is significant inter-patient variability in airway pressures mainly due to varying
leak at the mouth and nose (3, 20, 23, 31, 38).

27
Table 2. Summary of studies examining airway pressures during HFNC
Study n Weight
(grams)
Flow
(L/min)
Conclusions of Airway
Pressure
Relevant
Circumstances
Locke(30)
Pediatrics
1993
13 Mean
1,377
0.5-2 No pressure generation with
smaller prongs at any flow
rate
Larger prongs deliver
increasing pressure with
increasing flow
Unheated and
unhumidified
Mean
oesophageal
pressure of
9.8 cm H2O at 2
L/minute
Sreenan(24)
Pediatrics
2001
40 1,260 1–2.5 Flow rate required to
generate similar oesophageal
pressure as generated by
NCPAP of 6 cm H2O
increases with increasing
infant weight
Unheated,
humidified
Oesophageal
pressure
Volsko(21)
Respir Care
2011
Lung
model
1000
>2 Highest &lowest airway
pressure
Mean airway pressure
Positive
expiratory
pressure with all
cannula sizes
Saslow(17)
J Perinatol
2006
18 580 –
1990
3 - 5 Not more than CPAP of 6 cm
H2O
Oesophageal
pressure
Pyon(53)
PAS (abstract)
2008
8 < 2000 6 - 8 Not more than CPAP of 6 cm
H2O
Oesophageal
pressure
Lampland
J(31)
Pediatr
2009
15 1324 ±
424
1 - 6 Similar to CPAP of 6 cm H2O Oesophageal
pressure
Spence(26)
J Perinatol
2007
14 1589+/-
170
Up to 5 Intrapharyngeal pressure 4.8±
0.5 cm H2O at 5 LPM
Mouth closed
800 g (high pressures)
2100g (low pressures)
Study weight
1589±170

28
Study
(cont)
n Weight
(grams)
Flow
(L/min)
Conclusions of Airway
Pressure
Relevant
Circumstances
Wilkinson(27)
J Perinatol
2008
18 534 -
1868
2 - 8 Mean pharyngeal pressure of
5.3 cm H2O at 5 L/m
No effect of
mouth position
on pressures.
Study weight
1.619 kg (0.816
to 4.400).
Kubicka(3)
Pediatrics
2008
27 835 –
3735
1 - 5 Highest oral cavity pressure
recorded was 4.8 cm H2O
Mouth closed
Snug nasal
prongs
2 babies <1000 g;
(900g & 835g)
Collins(29)
Journal of
Paediatrics
and Child
Health
2013
9 - 2-8 Nasopharyngeal pressures
measured
Comparison of 2 HFNC
systems
2-6 l/min – no difference
7 l/min - VAPO-
4.7 (2.2)
F&P - 4.23 (2.2)
8 l/min - VAPO -
4.9 (2.2)
F&P- 4.1 (2.3)
Arora et
al(28)
2012
25
weight,
5300
[SD
1100]
Up to
6L/kg/min
Acute bronchiolitis -
Prospective, observational
study Heated humidified
HFNC system.
Linear increase in NP
pressures with flow rates up
to 6 L/minute but with
significant differences
between pressures in open
and closed mouth states.
Bronchiolitis severity scores
improved significantly
Nasopharyngeal
(NP) pressures
Vital signs
Bronchiolitis
severity scores
Oxygen
saturation
Mile´si et
al(54).
2013
21 - 1, 4, 6 and
7L/kg/min
Pharyngeal pressure (PP) and
oesophageal pressure (Pes)
measured simultaneously.
Flow >2 L/kg/minute
generated a mean PP >4 cm
H2O.
Significant reduction in
respiratory rate noted with
increase in flow from
baseline to maximal flow
rate.
Prospective
observational
study Heated and
humidified
HFNC (RT329
system with
MR850
humidifier,
Fisher and
Paykell)

29
1.5 Measuring Airway Pressure
The most popular devices currently used for medical pressure measurement are based on
catheters and guidewires (55).
1.5.1 Types of pressure measuring technology
Air filled balloons
Fluid (Saline/Water) filled Catheter
Air charged catheter
Solid state Catheter with inbuilt transducer
Optical fibre pressure sensor
The air-filled balloon pressure sensor is less expensive compared to other sensors (56).
However, they do not last long and performance may alter with repeated use and cleaning
(56). The performance is also affected by the dimensions of the balloon which determines the
efficiency with which pressure signal is transmitted to the external pressure transducer (56).
The balloon volume needs to be monitored to maintain optimum performance (56). Since the
transducer is externally located it is difficult to use this device for ambulatory pressure
monitoring (56)
Although air-charged catheters are less expensive, fluid-filled catheters have relatively more
stable response (55). Cooper et al compared the efficiency in pressure transduction of air
charged and water filled catheters for urodynamic pressure measurement (57). The catheters
were exposed to sudden change in pressure. During this time, they assessed frequency
response of the two systems. In addition, they also measured the response of the catheters to
movement artefacts and different gravity effects by changing the height of the catheter tips to
different levels (57).
Water-filled catheters do not attenuate the pressure signal as much as the air-charged catheters
because water is not compressible (57). However, the column of water in the tube can vibrate
and cause peak pressure amplification (57). Since air is compressible, it results in attenuation
of the pressure signals (57). Thus while the water filled catheter may affect mainly higher
frequencies, the air-charged systems attenuate lower frequencies as well (57). Unlike the

30
water filled catheters, air-charged catheters are less affected by movement and gravity effects
(57).
The length of the water filled catheter is inversely related to frequency response of the whole
system. The wider the diameter, more will be the attenuation of the natural frequency of the
water column itself (55).
Solid state catheter with inbuilt transducer at the tip is next in the development of the pressure
transducers. A schematic diagram is shown in the figure 7. Although these pressure
guidewires are a further improvement and alternative to catheters they are more expensive
(55). Guidewires and catheter pressure transducers are known as electro-mechanical pressure
transducers (55). The pressure-sensing device can be a part of a catheter containing multiple
channels to perform other functions (55).
Figure 7. Sensor attached to the side of a catheter (from Gaeltec Ltd) at its distal end
Figure 7 showing the side wall mounted pressure transducers at the distal end of the catheter.
An example of solid state guide wire with pressure sensors was used by Pavel Mazmanyan et
al whilst measuring airway pressures during HFNC and CPAP in infants (58). This Mikro-
Cath pressure catheter is said to deliver accurate data for analysis of airway pressures. The
advantage is these provide continuous, real-time data. The catheter is used for monitoring
pressures as a minimally invasive device but it can be used only for less than 24 hours with
body contact.

31
These catheters have several advantages. Pressure is measured at the site of interest, can be
measured in ambulatory patient, it is not influenced by gravity and the movement of the
subject does not give rise to significant motion artefacts unlike a fluid filled catheter.
The main disadvantages are that they need re-calibration, are fragile and expensive. The
salient features of the measurements from the solid-state catheters and fluid filled catheters
are shown in table 3.
Table 3. Solid-state pressure sensor compared to traditional Fluid-filled pressure
measurements (55)
Solid state guide wire technology Fluid filled catheter
Accurate dP/dt Unreliable dP/dt
True pressure signal Pressure signal needs augmentation-
overshoot and resonance possibilities
No time delay in signal conduction Time taken for signal transmission
Not affected by movements Motion artefacts are frequent
True pressure readings in any height in fluid
No effect of gravity before or after
calibration
Gravitational effects can cause change in
baseline with change in height of catheter
after calibration
Table 3 shows the differences between solid-state and fluid-filled pressure measurements
Optical fibre sensors are more recent improvement over catheter based sensors. Since they are
very small they are useful for medical applications. The optical fibres made up of silica glass
have about 125-micron diameter. Optical fibres of even 80 microns diameter are now
available (55).
They can be used even when tight bending is needed. The bend – insensitive fibres are
capable of transmitting signals through tight bends. A single catheter can hold multiple
numbers of optical fibre pressure sensors enabling multiple type of applications or
measurements (55).

32
Another distinct advantage is that optical fibre sensors can be built in a way that they are able
to detect different signal types such as strain or pressure, temperature at multiple points along
the length of the optical fibre. These multiple points can detect either single type or different
types of physical parameters (55)
Finally, these fibres are extremely stable over long periods of recording. The sensor
prototypes are quoted as having a stability of 1 mm Hg/hour and the commercially available
sensors come with a stability of 3 mmHg/28 days (55).
1.5.2 Technical requirements for airway pressure sensors
Range of a pressure sensor can be defined as the difference between the maximum and
minimum value that can be measured by that sensor in the site of interest (55).
Since the pressure range is different in different body systems the appropriate site-specific
pressure sensor with the capability to measure pressure should be used. For example, the left
ventricular pressure range is 0 -150 mm Hg (0 - 203.9 cm H2O) whilst that in intra cranial site
is only 0 -7.5 mm Hg (0 – 10.1cm H2O) (55).
Similarly, the pressure range varies at different sites in the respiratory system. The intra
alveolar and intra tracheal pressures change dynamically as well and can reach to levels of –
75 mmHg (101.9 cm H2O) (55). Pressure ranges vary based on the application needs and
condition of the infant’s breathing, for example, in a spontaneously breathing infant to that in
a ventilated infant (59). A European Task Force set up to provide guidance on standards for
Infant Lung Function Testing recommended following pressure ranges shown in table
4 (59).
Accuracy of the sensor requirements depends on the area of interest to be measured. The
clinical relevance of magnitude of changes in pressure readings on organ function or disease
state assessment (55). For example, a small pressure error in reported pressures in left
ventricular pressure may not affect clinical judgement whereas similar range of error in
intracranial pressure would affect clinical decision making.

33
The sampling rate is defined as the number of measurements obtained per second. The
sampling rate of a pressure signal is determined its waveform and periodicity (55). A system
should be able to record at least double the highest frequency present in the signal so that all
the data in the signal can be reproduced accurately (55). In the case of the medical sensors, the
general recommendation is that they should acquire 5–10-times more samples than the highest
frequency of the pressure wave that is being measured (55).
The linearity of a pressure sensor should be within 1% of the reading or 1.01 cm H2O
whichever is greater (59). It is important to note that the linearity is a different concept from
accuracy. A pressure sensor can have acceptable linearity being consistently inaccurate. It is
possible to apply correction if there is linearity.
Table 4. Pressure ranges normally encountered during pulmonary function tests in
infants and young children (59)
Pressure Transducer Pressure range kPa
Oesophageal pressure -5 to 5
Airway opening pressure -10 to 10
Plethysmographic box pressure (100 L) -0.1 to 0.1
Jacket Pressure (forced flows) 0 to 15
The Table 4 shows pressure range in various pulmonary function tests in infants and young
children
1.5.3 Other factors affecting sensor performance
The physical characters of the catheter that cause damping effect on the pressure signal
include its own elasticity, mass and friction. The catheter has a natural frequency that will
affect the sensor performance in the sensors located within the catheters (55). The main effect
will be on the frequency response of the sensor equipment (55).
The sampling site should not be affected by eddies or current effects. These currents will
particularly affect the lateral pressure measurements (59). Another significant factor is the

34
Bernoulli effect which is greater when the diameter of the tube is small such as seen in infants
(59).
The common reasons for baseline instability of the equipment include drift of transducers
(intrinsic property of the material of the transducer) and sensitivity to temperature, position
(gravity, e.g. water filled catheter systems) and other changes in environmental conditions
(59). Baseline instability is crucial for calibration and measurement procedures (e.g. when
using catheter tip transducers for oesophageal manometry) and must be specified by the
manufacturer (59).
1.5.4 Principles of Pressure Sensors
There are two main types of pressure measurement sensors namely strain gauge transducer
and diaphragm displacement sensors.
The strain gauge transducers change their output in response to the strain (pressure changes)
(55). Their working principle is governed by the following relation between sensitivity
(Gauge factor GF) and relative change in resistance (∆R/R) and relative change in length
(∆L/L), also called as strain ε (55). A schematic representation of this principle is shown in
the figure number 8.
GF = ∆R/R / ∆L/L= ∆R/R / ε (55)
The technology in diaphragm displacement sensors is known as micro electro mechanical
systems (MEMS) technology (55). These sensors have a very thin structure which deforms
and has a flat surface called as diaphragm. The diaphragm is located in a sealed cavity (55).
The diaphragm deforms when the pressure impacting on its surface changes. The principle
mechanism of this type of diaphragm sensors can be capacitance based or based on a
piezoelectric transducer (55). At baseline, the cavity has an initial volume (V0) and pressure
(P0). Then a change in pressure (∆P) causes the medium inside the cavity to compress or
expand (∆V) depending on the direction of pressure change. This is possible because medium
is enclosed in the cavity (55). A schematic representation of this principle is shown in the
figure number 9.

35
Figure 8. Schematic representation of a piezo resistive sensor (55)
Figure 8 shows a schematic diagram of a piezo resistive type of sensor with change in
dimension under the influence of a strain (or pressure)
L refers to the length of the
sensor element
∆L refers to the change in length
of the sensor element on
application of strain (or pressure)

36
Figure 9. Schematic representation of a diaphragm displacement sensor (55)
Figure 9 shows a schematic diagram of a diaphragm displacement sensor depicting the
volume change in sensor cavity when diaphragm is displaced due to the pressure differential
applied on its surface.
V0 - Initial volume of the
sensor cavity
P0 - Initial pressure in the
sensor cavity
∆P - Change in pressure on
the diaphragm of the sensor
∆V – Change in the volume
of the cavity
D- Diaphragm of the sensor
∆P
D

37
1.5.5 Types of airway pressure measurements
The airway pressures can be reported at different points in the waveform. Some authors have
reported the end expiratory pressure whereas some other studies have reported mean airway
pressures.
1.5.6 Practical challenges in pressure measurement in neonates
1. Size of nasopharyngeal airway smaller and therefore need smaller calibre diagnostic
instruments.
2. The neonates typically have less reserve in terms of maintaining adequate gas exchange and
decompensate quickly, therefore interventional studies are riskier and difficult to perform.
3. Since neonates feed relatively frequently time window for performing measurements is
small and for the same reason prolonged airway pressure measurement is difficult.
4. The fidelity of data acquired and that used for reporting needs to be defined strictly with
clear criteria.
5. The motion artefacts are a significant practical problem due to neonates crying, moving and
secretions if any.
6. Calibration requirements: Any interruptions in measurements due to neonate requiring care,
desaturations would mean that recalibration of the measuring equipment may be required.

38
1.6 Effects of HFNC on Washout of Airway Dead Space
1.6.1 Airway dead space wash out effect and its impact on CO2 removal
The minute ventilation consists of alveolar ventilation and dead space ventilation. By flushing
the dead space/ expired CO2 off and enriching it with set FiO2 the dead space can be reduced
and alveolar ventilation can form a greater proportion of the minute ventilation. This results in
improved efficiency of respiratory efforts to achieve adequate gas exchange.
Tracheal gas insufflation (TGI) method can be used to promote CO2 elimination (60-64). In
experimental animal models TGI reduces dead space and promotes pulmonary gas exchange
and reduces ventilator pressure and volume requirements (65, 66). Studies evaluating acute
lung injury using modified endotracheal tubes designed to reduce physiological dead space
during mechanical ventilation in animal models, noted that compared to conventional
mechanical ventilation the requirement for pressure and volume were less with reduction in
dead space strategy (67, 68). The markers of lung and systemic inflammation were also
reduced.
Nakos et al studied effects of TGI in spontaneously breathing patients with COPD (69). These
patients had been weaned from mechanical ventilation (69). The study had two groups, one
with oral tracheal tube and a second with tracheostomy (69). They found that the tidal volume
(VT), minute volume (MV), PaCO2, and dead space volume VD/VT were dependent on the
flow rates used via oral-tracheal tube (69). The distal catheter position was better in terms of
efficacy than the proximal position. The TGI gas delivery through tracheostomy tube was less
effective compared to oral tracheal tube (69). They concluded that reduction in CO2 levels
reduced the VT needed and this in turn reduced the work of breathing required to achieve the
VT and MV (69). .
The physiologic effects of TGI was further studied by Miller et al in an acute lung injury
model involving neonatal piglets. The piglets (n=19, Weight 2.4±0.4 kg) were spontaneously
breathing and were supported with CPAP of 5 cm H2O. The aim of the study was to
understand TGI effects on gas exchange and pulmonary mechanics (70). The acute lung
injury was induced by intravenous oleic acid administration. They were given either CPAP
and TGI (n=9) or CPAP alone (n=10) (70). The target SaO2 of >93% was maintained by
39
increments in FiO2 by 0.05 every 15 min during the study. Apart from vital signs, they
recorded the following parameters namely, arterial blood gases, pulmonary mechanics, and
Thoraco abdominal motion (TAM) (70). The group receiving TGI achieved better
oxygenation and CO2 removal compared to the control (70). Consequently, the pH was also
higher and closer to the baseline value in TGI group. The oxygen requirement noted by the
FiO2 titration data showed that TGI group required lesser oxygen supplementation by 4 hours
into the study. They also required lower minute ventilation (MV) and showed greater
compliance compared to the control group (70). The resistance and TAM were similar
between the two groups (70). They concluded that the use of TGI with CPAP in the treatment
of acute lung injury results in better gas exchange and improved pulmonary mechanics (70).
In this study, the piglets were intubated and therefore application of TGI was done through
endotracheal tube. Therefore if one were to achieve TGI by some other means than by
endotracheal intubation then that would result in improved ventilation and CO2 clearance and
reduced need for mechanical ventilation (14).
Dewan and Bell studied the effects of airway dead space wash out in 10 patients of COPD on
respiratory support with trans tracheal catheters (TTC) by administering low flow and high
flow oxygen and assessing effects on dyspnoea and exercise tolerance (71). The study
protocol involved four sessions of modified progressive treadmill tests on two separate days
(71). Two tests were performed when the patients receiving Low Flow Trans Tracheal
Oxygen (LFTTO) and High Flow Trans Tracheal Oxygen (HFTTO) and other two tests were
done when the patients were receiving low flow nasal prong (LFNP) and high flow nasal
prong (HFNP) oxygen (71). Equivalent oxygen saturation was achieved by adjusting the flow
rate (71). The exercise distance with HFTTO was 2.5 times greater than with LFTTO and
HFNP was 2.38 times greater than with LFNP (p<0.005) (71). Interestingly, there was no
significant difference in exercise distance and dyspnoea scores with HFTTO as compared
with HFNP and LFTTO compared with LFNP (71). They concluded that the exercise
tolerance was greater with the use of high flow oxygen irrespective of the route when
compared to low flow oxygen (71). The maximum exercise tolerance was not improved by
Trans Tracheal oxygen as compared to nasal prong oxygen when the oxygen saturations were
maintained similar (71).
Holleman-Duray et al showed in their neonatal study which incorporated an early extubation
protocol that infants extubated to high flow therapy from a significantly greater ventilator rate

40
compared to other non-invasive support modes (33± 8 vs 28 ±8 breaths per minute; p<0.05)
(72). This indicates that the babies requiring higher respiratory rate to achieve adequate MV
for satisfactory gas exchange were able achieve satisfactory ventilation by increasing alveolar
ventilation fraction with high flow therapy because of airway dead space wash out effect (72).
1.6.2 Airway dead space wash out effect and its impact on oxygenation
Chatila et al conducted a prospective but non randomised and non-blinded study in 10 patients
with COPD and compared the effects of high flows of humidified oxygen (HFO) to
conventional low flow oxygen (LFO) delivery at rest and during exercise (73). All the patients
had advanced airflow obstruction but were clinically stable with no evidence of exacerbation
(73). Baseline recording was done on rest and then patients exercised on a cycle ergometer for
up to 12 min starting on LFO first (73). They had a period of rest followed by exercise when
using the high-flow oxygen (HFO) system. The HFO was delivering 20 L/min and was
adjusted to deliver similar FiO2 as that of LFO system (73). They measured the work of
breathing, tidal volume, respiratory rate, inspiratory time fraction, rapid shallow breathing
index and pressure-time product from a pulmonary mechanics monitor (73). The patients
whilst receiving HFO exercised longer and reported less dyspnoea with better breathing
pattern compared to when on LFO (73). Although the FiO2 was maintained equivalent when
on HFO and LFO, the exercise period with HFO achieved higher oxygenation (73).
They concluded that high flows of humidified oxygen by enhancing oxygenation improved
exercise performance in patients with COPD and severe oxygen dependency (73).
In studies with in vitro models, airway oxygen fractions were higher with the HFNC versus
non-rebreathing masks (14, 74). This is likely due to the effect of a high flow on the upper air
way dead space, with the high flow of oxygen 'washes out' the end-expiratory gas containing
reduced O2 and higher CO2 content(54). In the next breath, the lower airways receive gas with
higher oxygen concentration because of this washout effect (54).

41
1.6.3 Methods of measuring airway gas concentrations
Airway gas concentration can be measured by sampling the air by a catheter and analysing it
with a gas analyser. The sampling can be continuous or intermittent. Commercial gas
analysers with high degree of accuracy are available. These are generally electronic analysers
that can perform rapid and continuous gas analysis.
Broadly gas analysers can be classified into O2 analysers, CO2 analysers and multiple gas
analysers. These devices can be incorporated in a single unit which can be used for gas
analysis in clinical and research setting.
Oxygen analyser types include those using paramagnetic technique, galvanic technique and
polarographic technique.
Paramagnetic technique is based on the principle that oxygen has a free electron which makes
it to be attracted towards a magnetic field (75). These analysers are made up of two
compartments, one for sampling and other acts a reference compartment (75). They are
separated by a pressure transducer (75). When the expired gas is channelled through the
sampling compartment it is subjected to an electromagnetic field which agitates the oxygen
molecules (75). At the same time the reference compartment receives room air with 21%
oxygen (75). Thus a differing concentration of oxygen creates a differing partial pressure and
this is picked up by the pressure transducer and is converted to a DC voltage (75). This is
proportional to the concentration of oxygen (75).
Galvanic technique is based on chemical properties of the oxygen molecules. Oxygen is made
to diffuse across the membrane and an electrolyte solution (Potassium hydroxide) to a cathode
made up of gold or silver and the anode is usually lead (75, 76). Depending on the partial
pressure of oxygen an electrical current is generated which gives quantitative estimation of
oxygen concentration (75). They have a response time of approximately 20 seconds with an
accuracy of 3% (75). These devices do not need water vapour trap as they are not affected by
water vapour. However, the limitation is limited life of electrolyte solution which is affected
by the oxygen over time.

42
In the polarographic technique current flows between a silver cathode and a platinum anode
(75). The oxygen molecules move across a Teflon membrane (75). An external current is
required to drive the cathode reaction, hence the name polarographic (76).
CO2 analyser types include Infrared absorption spectroscopy, refractometry, piezoelectric
absorption, Raman scattering and mass spectrometry.
Infrared absorption spectroscopy is based on the principle that molecules having dissimilar
atoms absorb infrared radiation in a unique way specific to that molecule (75). In doing so,
energy is generated which causes molecular vibration (75). This vibration has a specific
frequency which is dependent upon the molecular mass and atomic bonding of the molecule
of the gas (75). Thus the absorption of infrared by a specific molecule occurs at a specific
wavelength and this obeys ‘Beer-Lambert law’ (75). According to Beer-Lambert law there is
a logarithmic dependence between the transmission of light through a substance and the
concentration of that substance (75). The infrared absorbance peaks for carbon dioxide with
this technique is located at the 4-5 μm range (75). The device has a set of narrow band filters
set in chopper wheel assembly through which infrared radiation is focussed (75). The specific
infrared rays filtered are captured or detected by photocells or thermopiles, amplified and
signal is processed giving quantitative output of the levels of gas being analysed (75).
The device can be set as a mainstream or as side stream to the ventilation channel (75). The
mainstream attachment does not require gas sampling but the side stream requires gas
sampling (75). Water trap is required in both set up as water vapour affects analysis (75). The
sampling rate in side stream set up should be at around 50-250 ml/min (75).
Refractometry technique is based on the physical principle of refraction of a monochromatic
light through the gas medium being analysed (75). There are calibrated refractometers
(example, Rayleigh) which have a series of prisms which split the light source through
sampling and control tubes (75). Different gases produce specific pattern of refraction and
from this their type and concentration can be determined (75). This type of device is typically
used for anaesthetic gases such as halothane but can be used for other gases including CO2
(75). However, these do not give breath to breath analysis (75).
Piezoelectric absorption analysers are based on the resonance property of a piezoelectric
compound such as quartz (75). Two quartz crystals (one coated with silicone based oil and

43
other remains uncoated) are mounted between electrodes (75). The oil-coated quartz crystal
absorbs the gas being analysed and changes the resonant frequency in proportion to the
concentration of gas present (75). Although these devices have a fast response time they are
limited by inability to differentiate individual gases (75).
Raman scattering phenomenon is used in another type of CO2 analysers. The scattering of
light on contact with object is been theorised by two principles, first is called Rayleigh
scattering and the second called Raman Scattering. This technique uses Raman scattering
principle where an intense, coherent and monochromatic light interacts with the gas molecule
being analysed, gets scattered (75). During this process, some of the light's energy is either
absorbed or release of the energy as a photon with a different wavelength (75). This leads to
change in the wavelength due to transformational shift in the gas molecule (75). The scattered
light is passed through a series of narrowband filters onto a photo-detector followed by signal
processing unit (75). Since the filters are specific for the gas to be analysed, the concentration
of gas can be determined (75). This technique is fast and can analyse multiple gases with good
accuracy (75).
Mass spectrometry is mainly a research tool but it is highly accurate. In this technique, a
sample of the gas to be analysed is drawn into a low pressure chamber which is connected to
another chamber subjected to vacuum pressure (75). The gas molecules get ionised due to this
exposure to pressure change and they are accelerated by a cathode plate (75). These ionised
molecules have different mass and charge based on the type of gas (75). They are separated
by exposure to electromagnets or fixed magnets (75). They are filtered by narrow band filters
and trapped by photovoltaic receptors, the electrical signal is amplified and processed into a
quantitative estimate of the gas being analysed (75). The response time is long so it is not
suitable for continuous inline monitoring but they are very accurate (75).

44
1.7 Effects of HFNC on Tidal Volume
1.7.1 Tidal volume and minute volume importance for ventilation
Minute volume is the amount of gas inhaled or exhaled from a person's lungs in one minute.
If both tidal volume (VT) and respiratory rate (ƒ or RR) are known, minute volume can be
calculated by multiplying the two values.
MV = TV X f
Blood carbon dioxide (PaCO2) levels vary inversely with minute volume. Minute volume
generally decreases when at rest, and increases with exercise. Minute volume comprises the
sum of alveolar ventilation and dead space ventilation,
V= VA + VD
Where VA is alveolar ventilation and VD represents dead space ventilation.
Tidal ventilation parameters have been used to assess the impact of HFNC on work of
breathing (10). Non-invasive methods of lung function assessment in preterm and term infants
can be done by tidal breathing measurements. This can help in management of respiratory
support.
1.7.2 Tidal volume measurement studies during HFNC
Saslow et al studied eighteen preterm neonates <2.0 kg on HFNC and NCPAP support in a
random order(17). A ventilator was used to deliver 6 cm H2O of NCPAP with nasal
prongs(17). High-flow nasal cannula therapy was delivered with Vapotherm (VAPO) at 3, 4
and 5 l/min (17). Tidal ventilation was measured using respiratory inductance
plethysmography which was calibrated with face-mask pneumotachography (17). The
oesophageal pressure was measured to generate estimation of transpulmonary pressure (Ptp).
The sampling frequency of data was at 100 Hz. The outcomes measured included tidal
volume (ml/kg), respiratory rate, lung compliance, phase angle and end distending
pressure(17). The tidal volume range they noted with high flow therapy (VAPOTHERM) and
CPAP are shown in table 5 (17).

45
Table 5. The tidal volumes during CPAP and HFNC in the study by Saslow et al(17)
Respiratory support levels Tidal volumes (mean±s.d.) n=18
NCPAP 6 3.53±1.92
VAPOTHERM 3 3.15±1.36
VAPOTHERM 4 3.08±1.35
VAPOTHERM 5 3.21±1.31
Table 5 shows the mean tidal volumes observed during HFNC and CPAP in 18 preterm
neonates.
Boumecid et al studied thirteen infants (GA=29 ±1 Weeks; BW=1350±350 g) at a post-natal
age of 3±1 days on three respiratory support devices each for 30 minutes in random order
(37). The respiratory support modes were variable flow NCPAP generator (Infant-Flow, EME
Tricomed, UK) at a pressure of 5 cm H2O, a conventional constant-flow NCPAP (Baby-
Flow, Draeger, Germany) at a pressure of 5 cm H2O with gas flow rate 10 l/min and nasal
cannulae (length=1 cm, internal diameter=1.5 mm; Kendal, Germany) connected to an air-O2
blender-flow meter (Sechrist, France) with flow rate of 2 l/min (37). They used respiratory
inductive plethysmography (Respitrace Plus, Sensor Medics, USA) and obtained Tidal
volume (VT), rib cage contribution to the VT (%RC), phase angle between abdominal and
thoracic motions (h), respiratory rate (RR), and inspiratory times (Ti) (37). Mean tidal
volume, VT, measured from the flow- volume loops was higher during variable-flow than
during either constant-Flow NCPAP or during nasal cannulae (p<0.05) (37).
Lavizzari et al conducted a randomised crossover trial in 20 preterm infants (gestational age:
31±1 weeks) with mild-moderate RDS requiring non-invasive respiratory support within 96 h
after birth (36). Infants were exposed to a randomised sequence of CPAP and HFNC at
different settings (2, 4 and 6 cmH2O for NCPAP and 2, 4, 6 L/min for HFNC) to enable
comparison at the same level of retropharyngeal pressure (Prp) (36). A 6 Fr feeding catheter
with four side holes at the distal extremity was inserted in the pharynx and connected to a
pressure transducer to measure retropharyngeal pressure (Prp) (36). To avoid occlusions of

46
the catheter by secretions, a 40 mL/h airflow produced by a micro infuser was applied at the
inlet of the catheter (36).
Tidal volume was measured from respiratory inductance plethysmography and they found that
the VT was similar in the two modalities as shown in table 6 (36).
Table 6. The tidal volumes in mL at equal distending pressures - Lavizzari et al(36)
Respiratory support Prp=2 cm H2O Prp=4cm H2O
CPAP 5.77 (4.76; 6.75) 6.89 (4.33; 8.41)
HFNC 5.29 (3.46; 7.95) 7.54 (3.97; 10.17)
Table 6 shows the tidal volumes at equal distending pressures during HFNC and CPAP in 20
preterm infants.
1.7.3 Methods of measuring tidal volume
The pneumotachometer is currently the most accepted device to measure tidal breathing (77).
However, this requires application of a face mask over the face which has been shown to alter
the respiratory parameters. In a physiology study on 10 normal, sleeping term infants aged 1-4
days, investigators studied the effects of application of pneumotachograph in addition to full
face mask compared to facemask rim alone on the tidal volume and respiratory rate. The tidal
volume and respiratory rate were determined by a transthoracic impedance pneumograph
(78). There was a significant reduction in respiratory rate both in quiet sleep (12%) and during
rapid eye movement sleep (17%) with face mask rim alone. When the complete face mask
plus pneumotachograph was applied, the respiratory rate reductions were 10% in quiet sleep
and 14% in rapid eye movement sleep (78). Tidal volumes on the other hand showed increase
in both types of instrumentation and quantitatively the increase in tidal volumes were of
similar magnitude to respiratory rate reduction (78). They concluded that the change in
respiratory pattern was due to trigeminal stimulation from the face mask used (78).
Respiratory inductance plethysmography (RIP) provides a non-invasive measurement of lung
volume using recording bands around the thorax and abdomen. In its simplest form it involves
inductance coils placed around the child’s chest and abdomen and changes in the impedance

47
of the coils are proportional to changes in the volume of the chest and abdomen and the sum
of the two impedances is proportional to lung volume (79).
RIP is based upon the two-compartment model of thoraco abdominal movement during
respiration (80). The valid measurements are obtained when initial calibration is done
accurately, the body movements are stable and changes in respiratory movements are
recorded accurately (80). Measurement errors occur when there is displacement of transducer
bands and when body position changes (80). RIP detects changes in the volume of the chest
and abdomen during inspiration and expiration, which can be used to measure tidal volume
(80).
Saslow et al used RIP in 18 preterm neonates <2.0 kg, when they studied in a random order
on HFNC or CPAP support (17). CPAP at 6 cm H2O with nasal prongs was delivered by a
ventilator while HFNC was by Vapotherm (VAPO) at 3, 4 and 5 l/min flow rates (17). Tidal
ventilation was obtained using respiratory inductance plethysmography by recording chest
wall and abdominal movements (17). They used respiratory inductance plethysmography
(RIP) bands (Respibands Plus, Sensormedics Corp., Yorba Linda, CA) placed around the
infant’s rib cage and abdomen(17). Calibration was done by direct comparison of volume
changes measured by face-mask pneumotachography (Hans Rudolph Inc., Kansas City, MO)
(17). No differences were found in the work of breathing for all settings (17).
In study of 13 premature infants (GA=29 ±1) weeks; BW=1350±350 g) at a post-natal age of
3±1 days Boumecid et al used Respiratory Inductance Plethysmography (RIP) when they
compared variable flow CPAP to constant flow CPAP and nasal cannula (at a flow rate of 2
l/min) (37). They used Respitrace Plus for RIP and calibrated it using face mask
pneumotachography (37). The RIP was useful in obtaining the respiratory parameters and
allowed the authors to make comparison between variable flow CPAP and constant flow
CPAP as well as nasal cannula therapy (37). They found that mean tidal volume was higher
during variable-flow compared to other modes in their study (37).
Lavizzari et al studied 20 preterm infants between 28+0 and 32+6 weeks gestational age (GA)
and postnatal age <96 h receiving either NCPAP or HFNC for mild to moderate RDS(36).
They used RIP to calculate tidal volumes (36). Tidal changes were computed from the
abdominal (AB) and thoracic (RC) displacements measured by respiratory inductance
plethysmography (RIP) (36). The calibration was done comparing with a face-mask

48
pneumotachography over several spontaneous breaths (36). Using this RIP method, they did
not find any statistically significant differences in breathing pattern, gas exchange, lung
mechanics and total WOB in either mode of respiratory support (36).
Volusense is a recently developed system using electromagnetic inductive plethysmography
technique for evaluating tidal breathing indices in infants. Respiratory measurements are
derived from changes in electromagnetic inductance in a wrap-around vest worn by the baby.
The vest is disposable and used for one patient only to avoid cross-infection. The vest is made
from soft elastic. The vests contain thin conductive coils that are isolated. Thorax and
abdominal volumes and volume changes are measured and stored digitally. This allows
measurement of tidal volume, respiratory rate and tidal flow volume loops non-invasively and
without application of masks or instrumentation of the infant’s airway. The calibration is done
with a pretested and validated cylinder provided with the device (24-26). This has been
recently validated as reliable as pneumotachography and safe in babies of gestation 28 weeks
and above (24, 26). The technique is therefore ideal for measuring the effects of HFNC and
CPAP on tidal breathing indices non-invasively and may improve our understanding of its
mechanism of action. It may also allow us to detect the effects of varying pressure on
Functional Residual Capacity (FRC) baseline and improve understanding of the role of
pressure on recruitment of lung volume.
Using a device employing this new technique of electromagnetic inductance plethysmography
(EIP), Pickerd et al measured tidal breathing in 49 healthy spontaneously breathing infants
between 32 and 42 weeks postconceptional age (PCA) (81). They noted that the tidal
volume/kg and minute volume decreased with advancing PCA (81). In another study using
similar electromagnetic inductive plethysmography technique, tidal ventilation and breathing
pattern were measured and compared simultaneously with pneumotachography in 43 infants
either receiving no respiratory support or continuous positive airway pressure (CPAP)
(82).Twenty-three infants were receiving CPAP (gestational age 28 ± 2 weeks, mean ± SD)
and 20 were breathing spontaneously (gestational age 34 ± 4 weeks)(82). The two methods
were in reasonable agreement, with VT (r2 = 0.69) ranging from 5 to 23 ml (4–11 ml kg−1)
with a mean difference of 0.4 ml and limit of agreement of −4.7 to + 5.5 ml (82).

49
1.8 HFNC – Summary of Literature Review
1.8.1 Summary of physiology studies
In summary, the use of HFNC is an increasing trend across the world. The device set up has
basic components of humidification, air and oxygen blender and a flow driver delivering
conditioned gases via nasal cannulae. There are some evidences in support of various
proposed mechanisms of action in the form of in vitro and in vivo physiology studies in
animals and humans. The measurement techniques differ greatly in their working mechanism,
accuracy and applicability to the intended study question. Various investigators have
conducted focussed research on respiratory physiology parameters. The conditions of study,
equipment used and methods employed differ and making inference is difficult. The
physiology studies are listed in table 7.

50
Table 7. List of physiology studies evaluating respiratory parameters and HFNC
mechanisms
Study
Year
Number
Setting Type
of subjects
Age/gestatio
nal age (GA)
and weight
Study type
and design
Respiratory
support
devices used
Outcomes
measured
Findings Additional
informatio
n
Locke et
al(30)
1993
n = 13
NICU
Preterm
infants Mean
GA 30 weeks,
mean birth
weight 1,377
g
Observational
study
Unheated and
unhumidified
HFNC (Salter
Labs)
Oesophageal
pressure
Ventilatory
patterns with
respiratory
inductance
plethysmograph
y
No pressure
generation
with smaller
prongs at any
flow rate
Larger
prongs
deliver
increasing
pressure with
increasing
flow
Mean
pressure of
9.8 cm H2O
at 2
L/minute
Flow rates
0.5–2 L/
Minute 0.2
and 0.3 cm
prongs
Sreenan
et al(24)
2001
n = 40
NICU
Preterm
infants Mean
GA 28.7
weeks, mean
study weight
1,260 g
Observational
study
Unheated,
humidified
HFNC (Salter
Labs) vs.
NCPAP
(Infant Star)
Treatment of
Apnoea of
Prematurity
(AOP)
Oesophageal
pressure
No
difference in
efficacy of
treatment for
AOP
Salter Labs
‘infant’ size
prongs used
Low flow
rates used
at 1–2.5 L/
minute
Saslow et
al(17)
2006
n = 18
NICU
Preterm
infants Mean
GA 28.2
weeks, mean
study weight
1,542 g
Observational
crossover
study Heated
and
humidified
HFNC
(Vapotherm
2000i) vs.
NCPAP
(Infant Bird
Ventilator)
Work of
breathing
Respiratory
inductance
plethysmograph
y Respiratory
rate
Oesophageal
pressure
No
difference
noted
between two
modalities.
Oesophageal
pressure was
significant
only at 5
L/minute of
HFNC
Used flow
rates
ranging
from 3–5
L/minute
Spence et
al(26)
2007
n = 14
NICU
Preterm
infants
Median study
GA 30 weeks,
median study
weight 1,589
g
Observational
study Heated
and
humidified
HFNC
(Fisher and
Paykell) and
NCPAP
(Infant Flow)
Pharyngeal
pressure
Pharyngeal
pressure
increases
with
increasing
flow
‘Infant’ size
Salter
prongs were
used

51
Study
Year
number
(cont)
Setting Type
of subjects
Age/gestatio
nal age (GA)
and weight
Study type
and design
Respiratory
support
devices used
Outcomes
measured
Findings Additional
informatio
n
Kubicka
et al(3)
2008
n = 27
NICU
Preterm
infants GA
range 25–40
weeks, birth
weight 605–
3,657 g
Observational
study Heated
and
humidified
HFNC
(Vapotherm
2000i or
Fisher and
Paykell
RT329)
Oral pressure No pressure
generated
with mouth
open
When mouth
in closed
position
pressure
increases
with flow in
infants <
1,500 g
Flow rates
1–5
L/minute,
0.2 cm
prongs
More
mature and
larger
infants
included in
study
Wilkinso
n et
al(27)
2008
n = 18
NICU
Preterm
infants
Median GA
27.1 weeks,
median birth
weight 944 g
Observational
study Heated
and
humidified
HFNC
(Fisher and
Paykell
RT329)
Pharyngeal
pressure
Pharyngeal
pressure
increases
with
increasing
flow but
decreases
with
increasing
weight
Included
extremely
premature
infants
Higher
flows up to
8 L/minute
Mouth
position is
irrelevant
Lamplan
d et
al(31)
2009
n = 15
NICU
Preterm
infants Mean
GA 29.5
weeks, mean
birth weight
1,324 g
Observational
study Heated
and
humidified
HFNC
(Fisher and
Paykell
RT329) vs.
NCPAP
(Draeger
Babylog
8000)
Physiological
parameters
including heart
rate, respiratory
rate, FiO2,
PaO2 RDS
scoring system
Oesophageal
pressure
As flow rate
decreases
respiratory
rate increases
As flow rate
increases
oesophageal
pressure
increases
Fisher and
Paykell
neonatal
size prongs
of 0.24 cm
used
Slightly
higher flow
rates
studied 1–6
L/minute
Corley et
al(35)
2011
n = 20
ICU Mean
age 65.3
years, weight
93.3 kg
Post cardiac
surgery adult
patients
Prospective
interventional
study LFNC
vs. HFNC
Electrical
impedance
tomography
Respiratory rate
Borg scores
Significant
correlation
between
airway
pressures and
end
expiratory
lung
impedance
A trend
towards
HFNC
improving
subjective
dyspnoea
scoring

52
Study
Year
number
(cont)
Setting Type
of subjects
Age/gestatio
nal age (GA)
and weight
Study type
and design
Respiratory
support
devices used
Outcomes
measured
Findings Additional
informatio
n
Volsko et
al(21)
2011
Simulatio
n model
Laboratory
based study
Active
simulator
lung model
Observational
study Lung
model
simulated a
sick neonate
of
approximatel
y 1 kg with
lung
compliance
0.5 mL/cm
H2O and
resistance
125 cm
2O/L/s
Highest and
lowest airway
pressure
Mean airway
pressure
VT drop
Flows of >2
L/minute
generated
positive
expiratory
pressure with
all cannula
sizes
Cannulae
used were
(Comfort
Flow
models)
Premature
Infant
Infant
Arora et
al(28)
2012
n = 25
PICU Mean
age 78.1 [SD
30.9] days;
weight, 5.3
[SD 1.1] kg
Acute
bronchiolitis
Prospective,
observational
study Heated
humidified
HFNC
system
Nasopharyngeal
(NP) pressures
Vital Signs
Bronchiolitis
severity scores
Oxygen
saturation
Linear
increase in
NP pressures
with flow
rates up to 6
L/minute but
with
significant
differences
between
pressures in
open and
closed mouth
states
Bronchiolitis
severity
scores
improved
significantly
No effect of
gender or
weight
noted on
generated
pressure
Mile´si et
al(54)
2013
n = 21
PICU
Infants < 6
months old
Acute RSV
bronchiolitis
Prospective
observational
study Heated
and
humidified
HFNC
RT329
system
Fisher and
Paykell
Pharyngeal
pressure (PP)
and
oesophageal
pressure (Pes)
measured
simultaneously
Flow >2
L/kg/minute
generated a
mean PP >4
cm H2O
Significant
reduction in
respiratory
rate noted
with increase
in flow
Measured at
flows of 1,
4, 6 and 7
L/minute

53
Study
Year
number
(cont)
Setting Type
of subjects
Age/gestatio
nal age (GA)
and weight
Study type
and design
Respiratory
support
devices used
Outcomes
measured
Findings Additional
informatio
n
Sivieri et
al(20)
2013
Simulatio
n model
Laboratory
based study
Observational
study
HFNC
(Fisher &
Paykel
system with
integrated
pressure
relief valve)
In vitro
evaluation of
effect of
nasal prong-
to-nares ratio
and mouth
leak on
airway
pressures
generated by
HFNC device
Cannula and
airway
pressures
Cannula and
mouth leak
flows
For all ratios
mouth open
6 L/minute
flow
pressures
were < 1.7
cm H2O
Ratios <0.9
mouth closed
airway
pressure was
<10 cm H2O
Ratios >0.9
50% mouth
leak airway
pressure rises
to 18 cm
H2O at 2
L/minute
flow
24 cm H2O
at 6 L/
minute flow
(pressure
relief valve
limited)
Neonatal
and infant
sized nasal
prongs (3.0
and 3.7 mm
outer
diameter)
Seven sizes
of
simulated
nares
(range: 3-7
mm internal
diameter)
Nasal
prong-to-
nares ratio
range (0.43
to 1.06)
Collins et
al(29)
2013
n=9
NICU
mean
gestational
age at birth
of 27.4
completed
weeks (SD
1.5) and
birthweight
1139 g (SD
253).
Observational
study
HFNC
Devices
Fisher &
Paykel
Vapotherm
Pharyngeal
pressure
measurements
recorded with
both HFNC
devices at flow
rates of 2–8
L/min.
There was no
difference in
pharyngeal
pressures
recorded
between
devices at
flow rates of
2–6 L/min;
measured
pressure was
linearly
associated
with flow
(R2 = 0.9).
The
pressure
limiter
valve of the
Fisher &
Paykel
device
attenuated
the
pharyngeal
pressures at
flows of 7
and 8
L/min.

54
Study
Year
number
(cont)
Setting Type
of subjects
Age/gestatio
nal age (GA)
and weight
Study type
and design
Respiratory
support
devices used
Outcomes
measured
Findings Additional
informatio
n
Parke et
al(83)
2013
n=15
Adults
Age 59.5
±10.6 years
Weight 85.1
±17 kg
Cardiac post-
operative
patients
RT033/ 034
Optiflow
nasal
cannula,
MR880
heated
humidifier,
and RT241
heated
delivery tube,
Fisher &
Paykel
The pressure
transducer -
Nasopharyng
eal catheter
connected to
a differential
transducer
Nasopharyngeal
pressure
measurements
at gas flows of
30, 40, and 50
L/min
mean ± SD
nasopharyng
eal airway
pressures
were 1.5 ±
0.6, 2.2 ±
0.8, and 3.1
± 1.2 at 30,
40, and 50
L/min
The
expiratory
pressure
during
HFNC was
higher than
the mean
pressure
previously
reported for
nasal high
flow.
Shetty et
al(39)
2016
n=20
Median
gestational
age of 27.6
weeks (range
24.6–31.9
weeks))
Studied at a
median
postnatal age
of 30.9 weeks
(range 28.1–
39.1 weeks).
Randomised
crossover
trial
HFNC -
Fisher and
Paykel using
optiflow
neonatal and
infant nasal
prongs
WOB assessed
by measuring
the pressure
time product of
the diaphragm
(PTPdi).
Thoracoabdomi
nal asynchrony
(TAA)
SaO2
no
significant
differences
in the results
on CPAP
versus
HHFNC
mean PTPdi
mean TAA
mean SaO2
Oesophagea
l (Poes) and
gastric
(Pgas)
pressures
were
measured
using a dual
pressure
transducer
tipped
catheter
(Gaeltec).
Frizzola
et al
2012
Animal
Study
n=13
Neonatal
piglets (n=13;
2-6kg) were
injured with
IV oleic acid
and supported
with HFNC at
2 through 8
L/min.
Treatment
order
randomised
Vapotherm
2000i
CPAP
VIP Bird
infant
ventilator
Tracheal
pressures
Respiratory
parameters –
respiratory rate
and relative
tidal volume
CO2 levels
PaO2 levels
were measured
CO2 trended
downward in
a flow
dependent
manner
independent
of leak.
Double
prong (low
leak) had
greater
impact on O2
At 8L/min,
tracheal
pressures
did not
exceed 6±1
cm H2O.
Single
prong(high
leak)
greater CO2
removal
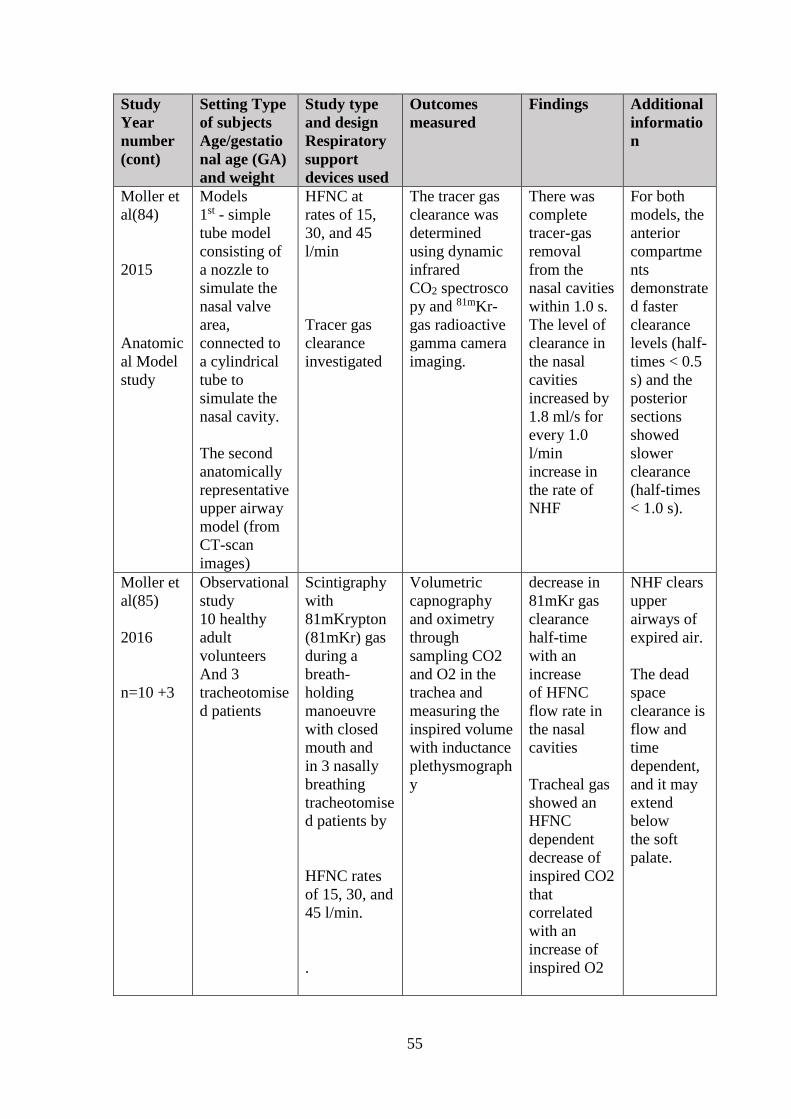
55
Study
Year
number
(cont)
Setting Type
of subjects
Age/gestatio
nal age (GA)
and weight
Study type
and design
Respiratory
support
devices used
Outcomes
measured
Findings Additional
informatio
n
Moller et
al(84)
2015
Anatomic
al Model
study
Models
1st - simple
tube model
consisting of
a nozzle to
simulate the
nasal valve
area,
connected to
a cylindrical
tube to
simulate the
nasal cavity.
The second
anatomically
representative
upper airway
model (from
CT-scan
images)
HFNC at
rates of 15,
30, and 45
l/min
Tracer gas
clearance
investigated
The tracer gas
clearance was
determined
using dynamic
infrared
CO2 spectrosco
py and 81mKr-
gas radioactive
gamma camera
imaging.
There was
complete
tracer-gas
removal
from the
nasal cavities
within 1.0 s.
The level of
clearance in
the nasal
cavities
increased by
1.8 ml/s for
every 1.0
l/min
increase in
the rate of
NHF
For both
models, the
anterior
compartme
nts
demonstrate
d faster
clearance
levels (half-
times < 0.5
s) and the
posterior
sections
showed
slower
clearance
(half-times
< 1.0 s).
Moller et
al(85)
2016
n=10 +3
Observational
study
10 healthy
adult
volunteers
And 3
tracheotomise
d patients
Scintigraphy
with
81mKrypton
(81mKr) gas
during a
breath-
holding
manoeuvre
with closed
mouth and
in 3 nasally
breathing
tracheotomise
d patients by
HFNC rates
of 15, 30, and
45 l/min.
.
Volumetric
capnography
and oximetry
through
sampling CO2
and O2 in the
trachea and
measuring the
inspired volume
with inductance
plethysmograph
y
decrease in
81mKr gas
clearance
half-time
with an
increase
of HFNC
flow rate in
the nasal
cavities
Tracheal gas
showed an
HFNC
dependent
decrease of
inspired CO2
that
correlated
with an
increase of
inspired O2
NHF clears
upper
airways of
expired air.
The dead
space
clearance is
flow and
time
dependent,
and it may
extend
below
the soft
palate.

56
Study
Year
number
(cont)
Setting Type
of subjects
Age/gestatio
nal age (GA)
and weight
Study type
and design
Respiratory
support
devices used
Outcomes
measured
Findings Additional
informatio
n
Miller et
al(70)
2004
Animal
Study
n=19
Spontaneousl
y breathing
neonatal pigs
(2.4_0.4 kg)
Induced lung
injury
Randomised
controlled
randomized
to receive
CPAP with
TGI (TGI;
n=9) or
CPAP alone
(control;
n=10)
arterial blood
gases,
pulmonary
mechanics, and
thoracoabdomin
al
motion (TAM)
were evaluated
30 min after
injury and at 1-
hr intervals for
4 hr
TGI group
PaCO2 was
lower
while the
oxygenation
indices were
greater
pH was
greater
ventilation
was
accomplishe
d with a
lower minute
ventilation
(MV)
Examined
role of TGI
(wash out
effect)
HFNC was
not studied
Resistance
and TAM
were
similar
between
groups.
Chang et
al(52)
2011
In-Vitro
study
To study the
effect of flow
on
temperature,
humidity,
device
pressure, and
resistance
Nasal cannula
(NC),
continuous
positive
airway
pressure
(CPAP), and
high-flow
nasal cannula
(HFNC)
Flow ranges
(0-3 L/min
and 0-8
L/min)
Effect of flow
on temperature,
in humidity,
pressure and
resistance
For all
devices at 0-
3 L/min,
there was a
difference
(p<0.01) in
temperature,
humidity
pressure and
resistance as
a function of
flow.
For HFNC
and CPAP at
0-8 L/min,
there was a
difference
(p<0.01) in
temperature,
in humidity,
pressure and
resistance as
a function of
flow.
Gas
delivered
by HFNC
was more
humid than
NC and
CPAP.
Higher
pressure
and
resistance
was
delivered
by the
HFNC
system

57
Study
Year
number
(cont)
Setting Type
of subjects
Age/gestatio
nal age (GA)
and weight
Study type
and design
Respiratory
support
devices used
Outcomes
measured
Findings Additional
informatio
n
Sivieri et
al(86)
2017
In-Vitro
study
Premature
infant lung
model
Piston
cylinder lung
simulator,
having a
fixed volume
of 30 ml and
a 4.8 ml dead
space,
simulated
spontaneous
breathing
(6.5 ml tidal
volume, Rate
50/min, Ti
0.5 sec)
Fisher &
Paykel
cannulas (2.8
and 3.2mm
O.D.)
Infant-Flow
NCPAP
cannulas (3.4
and 4.1mm
O.D.
Simulated
airways with
either 3.5 or
4.5mm I.D.
nares.
The lung was
primed with 5%
CO2.
Washout times
were
determined at
HFNC settings
of 3, 4, 5, 6, and
8 L/min and
NCPAP at 3, 4,
5, 6, and 8 cm
H2O with
simulated open
and closed
mouth
conditions and
full and half
inserted HFNC
prongs
Overall
combined
mean
washout
times for
NCPAP with
mouth closed
were
significantly
longer than
HFNC over
all five
pressure and
flow device
settings.
CO2 washout
times
decreased as
flow or
pressure
device
settings were
increased.
Simulated
mouth
opening
was a 5mm
I.D. side tap
below the
nasal
interface.
There were
negligible
differences
in washout
times
between
NCPAP and
HFNC with
mouth
open.

58
1.9 Concerns with HFNC Therapy
1.9.1 Delivery of airway pressure – unmonitored and unpredictable
Some of the earlier studies on high flow therapy documented delivery of inadvertently high
mean airway pressures when nasal cannula diameter 0.3 cm was used in neonates (30).
Studies of airway pressures since have not consistently identified dangerously high pressures
(3, 17, 27, 31). However there is wide variation in the techniques and protocol used to
measure pressures (2).
1.9.2 Microbial colonisation of delivery systems
In 2005 there were reports of Ralstonia species infection in the neonatal units using
Vapotherm 2000i (87, 88). This was noted to be due to the humidification system used in the
HFNC units. Since then strict infection prevention measures such as disposal of humidifier
fluid routinely and standardised cleaning of equipment has made these systems safer.
However, as HFNC circuit contains moist, humidified system, continued vigilance and strict
adherence to cleaning must be followed to avoid infections.
Shoemaker et al noted increased gram-negative infections in their observational study (89).
1.9.3 Effects on lung volumes
Long term effects of inadequate lung expansion or over distension due to effects on end
expiratory lung volume (EELV) –does it increase incidence of CNLD? Inadequate end
expiratory pressure may lead to reduction in end expiratory lung volume or Functional
Residual Capacity. This can lead to atelectasis and can give rise to atelectotrauma. It is
possible that in the presence of atelectasis lung units that are still recruited may in advertently
receive a greater proportion of tidal volume and become over distended.
On the contrary, over distension can lead to volutrauma. Dreyfuss et al studied this
phenomenon of volutrauma in rats with or without strapped chests (90). This allowed limiting
the thoracoabdominal movements (90). They compared the consequences of normal tidal
volume ventilation in mechanically ventilated rats at a high airway pressure (HiP-LoV) with
those of high tidal volume ventilation at a high (HiP-HiV) or low (LoP-HiV) airway pressure

59
(90). An application of PEEP (10 cm H2O) and its effects on both oedema and lung
ultrastructure was also studied (90). In rats with low tidal volumes (VT) there was no cases of
pulmonary oedema, even when high airway pressures were used (90). The lungs from the rats
submitted to high volume ventilation had significant permeability type pulmonary oedema
(90). This oedema was more pronounced in LoP-HiV rats and it was markedly reduced by
application of PEEP (90).
Both these phenomena are harmful to developing lung tissue. It is not known; however exact
dose-response value for these adverse effects to occur during HFNC. Whether transient
elevations or drop in airway pressures have any clinic-pathological effects is unknown.
1.9.4 Effects of noise
The noise levels produced vary with the type of machine used. It also depends upon the flow
driver and the way the system is built. It also depends upon the flow rate used during therapy.
Roberts CT et al performed a study in 21 infants to determine whether HFNC (n=21) was
noisier than bubble CPAP n=13) (BCPAP) for preterm infants (91). They measured noise
levels within the external auditory meatus (EAM) with a microphone probe tube connected to
a calibrated digital dosimeter (91).. HFNC flow rate range was 2–5 L/min, and BCPAP
pressures were 5–7 cm of water using 6–10 L/min of gas flow (91). There was no evidence of
a difference in average noise levels measured at the EAM for HFNC compared to
BCPAP(91). HFNC was quieter than BCPAP only at low frequency (500 Hz), mean (95% CI)
3.0 (0.3 to 5.7) dBA (91). Noise increased with increasing BCPAP gas flow (p=0.007), but
not with increasing set pressure (91). There was a trend to noise increasing with increasing
HFNC gas flows (91). They concluded that HFNC are not noisier than BCPAP for preterm
infants at the gas flow range that they studied.
An In-Vitro study was done to record the noise levels produced by Fisher & Paykel NHF™
and Vapotherm Precision Flow®) and one CPAP device (Dräger Babylog® 8000 plus in the
oral cavity of newborn manikin model in an incubator in a quiet environment (92). HFNC
flows of 4-8 l/min and CPAP pressures of 4-8 cm H2O with CPAP flow at 8 l/min was used
(92). Vapotherm HFNC generated the highest noise levels, measuring 81.2-91.4 dB(A) with
increasing flow (92). Fisher & Paykel HFNC noise levels were between 78.8 and 81.2 dB(A)

60
(92). The CPAP device generated the lowest noise levels between 73.9 and 77.4 dB(A)(92).
Thus in this study both HFNC devices generated higher noise levels than the CPAP device
(92).
1.9.5 Possibilities of air leak syndromes
A case series with HFNC including one involving pneumocephalus, pneumo orbitis and scalp
emphysema raised concerns with air leak syndromes (93). Since there have been few more
case reports of air leak (94, 95). However, this has not been supported by further larger
clinical trials involving HFNC (96-98).
1.9.6 Monitoring while on HFNC
Delayed recognition of a deteriorating patient with progressive respiratory failure may occur
due to the ability of the HFNC system to give up to 100% oxygen without necessarily
improving ventilation and CO2 removal. However, not much has been published in neonatal
or paediatric literature regarding the likely short term adverse events due to HFNC apart from
few case reports. This may be because there is no clear evidence as to how to wean, escalate
or stop high flow therapy (99). A Cochrane systematic review in 2015 failed to identify any
relevant studies evaluating discontinuation of HFNC in preterm infants (99). Therefore, any
adverse event may not be appreciated as due to the way HFNC as administered or prescribed
to the neonate. In the adult ICU however, there have been some observational and
retrospective data regarding possible delays in intubation due to reliance on HFNC
contributing to mortality (100, 101).
1.10 HFNC - Gaps in knowledge
Although various mechanisms of action for HFNC in neonates have been proposed the
relative contributions of these mechanisms is not well understood. In addition there are a
number of factors influencing the measurements of physiology parameters depending on the
technique used making comparisons and inferences of earlier studies particularly difficult.

61
1.10.1 Airway pressure measurement during HFNC therapy
The magnitude of pressure generated in the airway varies depending upon the site of
measurement, measurement technique used and the fidelity of the data acquired and used to
report the pressures. Thus clinicians and researchers are still not clear as to the pressure
effects of HFNC on the airway. Therefore it is important to identify appropriate and fit for
purpose techniques and record accurate pressure measurements in the airway.
1.10.2 Nasopharyngeal gas concentrations during HFNC therapy
Dead space wash out effects of HFNC in human patients has not been unequivocally
answered. The proposed evidences have largely been drawn from tracheal insufflation studies
and animal models. Thus recording airway gas concentrations at various stages of respiratory
cycle gives clarity regarding any role for dead space wash out mechanism for HFNC.
1.10.3 Tidal volume changes during HFNC therapy
The tidal volume measurement is challenging as application of pneumotach devices on the
face to capture tidal breathing results in alternation in respiratory rate and depth. Thus non-
invasive techniques are needed which can continuously measure changes in tidal volumes
with changes in HFNC therapy. However, measuring techniques involving conventional
plethysmography equipment are cumbersome. Therefore a simple, minimally invasive device
is needed. Although it has been shown that following initiation of HFNC there is
improvement in respiratory rate and heart rate parameters in children with respiratory distress
it is not clear whether this effect is due to effects on the tidal volumes.
1.10.4 Gaps in knowledge regarding HFNC clinical application
There is currently no consensus and evidence basis for the treatment initiation parameters
such as HFNC flow levels and whether to wean oxygen or flow as well as the rate of weaning
to be employed. The influence of different pathologies and population for which it is being
used also needs to be studied.

62
Chapter 2. Aims

63
The work presented in this thesis was a proof of concept study for a larger randomised
crossover study to investigate respiratory physiology during high flow nasal cannula therapy
in preterm neonates.
In order to evaluate the respiratory physiology, various parameters had to be measured. This
included nasopharyngeal pressures, nasopharyngeal space oxygen and carbon dioxide
concentration, tidal volumes and measures of gas exchange such as transcutaneous carbon
dioxide levels and transcutaneous oxygen saturation. I investigated the feasibility and
accuracy of methods to measure these parameters in preterm neonates during high flow
therapy. In parallel I designed and developed the protocol for the randomised crossover study
and successfully applied for ethical approval.
Therefore, the specific aims of my project were to,
1. Perform a descriptive review of available evidence for clinical efficacy and safety of high
flow nasal cannula therapy in preterm neonates
2. Assess the range, accuracy and feasibility of three different types of nasopharyngeal
airway pressure measuring techniques in preterm neonates during high flow therapy
3. Assess the feasibility and accuracy of airway gas concentration assessment in preterm
neonates during high flow therapy
4. Assess the feasibility and accuracy of measuring tidal volumes in preterm neonates during
high flow therapy using Volusense equipment

64
Chapter 3. Descriptive Review of Key Outcomes with High Flow Nasal
Cannula Therapy in Preterm Infants

65
3.1 Introduction
In preterm infants, Respiratory Distress Syndrome (RDS) is an important clinical entity
requiring intensive care support. The disease has a wide spectrum in severity and therefore
different levels of respiratory support may be required. It is important to identify optimum
respiratory support which is safe in the short term as well as long term and efficacious in
terms of clinical outcomes. This is particularly important at present because it is evident from
surveys that a significant number of neonatal units and clinicians have reported existence of
equipoise when deciding between CPAP and HFNC.
HFNC was initially used as a post extubation respiratory support or while weaning from
CPAP. However, as experience with its use increased with time, neonatal units started using it
as primary respiratory support following birth or when RDS set in. This clinical application
was not preceded by well conducted clinical trials. Since the first paper on its use as primary
respiratory support was presented by Nair et al in an academic meeting in 2005 there have
been several studies examining the clinical efficacy and safety of HFNC in neonatal
population.
In this chapter, a descriptive review of these studies followed by a table listing the key
features of each study is presented. A discussion on the current evidence for and against its
use as respiratory support in various clinical situations has been presented.

66
3.2 Background
3.2.1 Definitions
In this review following definitions were used,
Preterm infants – Infants born at gestation less than 37 weeks completed.
HFNC therapy – Treatment with heated, humidified air/oxygen mixture with flow rates more
than 1 litre per minute.
CPAP therapy – Treatment with a device delivering air/oxygen mixture via a nasal interface
which maintains a continuous positive airway pressure.
BPD – NIH definition – Infants requiring oxygen at 28 days of life and further classified
according to gestation at birth and oxygen/positive pressure requirement as shown in table 8.

67
Table 8. Bronchopulmonary Dysplasia Definition(102)
Gestational
Age <32 wk ≥32 wk
Time point of
assessment
36 wk PMA or discharge to home,
whichever comes first
>28 d but <56 d postnatal age or
discharge to home, whichever comes
first
Treatment with oxygen > 21% for at least 28 d plus
Mild BPD Breathing room air at 36 wk PMA or
discharge, whichever comes first
Breathing room air by 56 d postnatal
age or discharge, whichever comes first
Moderate BPD
Need * for <30% oxygen at 36 wk
PMA or discharge, whichever comes
first
Need * for <30% oxygen at 56 d
postnatal age or discharge, whichever
comes first
Severe BPD
Need * for ≥30% oxygen and/or
positive pressure, (PPV or NCPAP) at
36 wk PMA or discharge, whichever
comes first
Need * for ≥30% oxygen and/or
positive pressure (PPV or NCPAP) at 56
d postnatal age or discharge, whichever
comes first
Table 8 shows the current consensus definition of BPD(102)

68
3.2.2 Rationale
This review is relevant because of the widespread use of HFNC despite it being just over a
decade old therapy. This has the implications for lung health of the individual patient as well
as implications for health care burden for family and health care providers because of unclear
risks for efficacy in the short term and bronchopulmonary dysplasia in the long term. This is
particularly relevant for extremely low birth weight infants.
Pathophysiology in BPD can be considered in three areas as lung parenchymal disease,
pulmonary vascular disease and airways disease.
In BPD, pulmonary gas exchange is abnormal due to changes in lung parenchyma. The
changes include alveolar simplification and abnormal development of the pulmonary vascular
bed (103). The lung parenchyma shows different areas of hyperinflation, atelectasis and
fibrosis. This results in increased dead space, abnormal lung resistance and compliance in a
patchy distribution, V/Q mismatch and intrapulmonary shunting (104-106). The differences in
pulmonary resistance and compliance in different lung units results in differences in
ventilation causing ventilation inhomogeneity.
The main features of pulmonary vascular abnormality seen in BPD are poor growth of
pulmonary vascular bed and inflammation due to endothelial cell dysfunction (103).
This results in poor gas exchange. Pulmonary hypertension develops over time when this
process is severe (103).
Increased airway obstruction is seen in BPD due to airway remodelling, decreased airway and
alveolar growth, and mechanical ventilation associated complications such as tracheomalacia,
bronchomalacia, and stenosis of glottis, sub glottis and trachea. Airway obstruction leads to
air trapping (107). Pulmonary mechanics are also altered because of reduction in the lung
parenchymal elastic framework. This results in reduced airway support and allows airway
closure and collapse of alveoli. These changes result in overall reduced lung compliance and
reactance whilst increasing pulmonary resistance (108, 109).

69
3.3 Aims and Outcomes
3.3.1 Aims
The aim of this review is to present an up to date evidence regarding the efficacy and safety of
HFNC as respiratory support for preterm infants (<37 weeks’ gestational age at birth), when
compared with other modes of non-invasive respiratory support.
3.3.2 Outcomes
Main outcomes of interest are treatment failure as defined by study criteria (failure of
extubation), mortality, nasal trauma, BPD, air leak syndromes, length of respiratory support,
duration of oxygen therapy and duration of hospitalisation.
3.4 Methods
3.4.1 Search strategy
I searched the following electronic databases Ovid Medline, EMBASE, HMIC and CINAHL
as well as The Cochrane Library. In addition, the references from the extracted articles were
cross checked for further articles. All languages were included during the search for articles.
The study types searched included Cochrane Reviews, Systematic Reviews, Meta-Analyses,
Controlled Clinical Trials, and Randomized Controlled Trials. The key words used in earlier
Cochrane Review and another earlier meta-analysis done by Kotecha et al were used for the
search and are listed below (1, 110).
Key words used as in the study by Kotecha et al - Non-invasive ventilation, CPAP,
continuous positive airway pressure, nasal cannula, nasal prong, oxygen inhalation therapy,
high-flow, high-flow therapy, Infant, Low Birth Wt., Infant, Extremely Low Birth Wt., Infant,
Premature, Premature Birth, Fetal Growth Retardation, Birth Wt., Low Birth Wt., IUGR,
Randomized Controlled Trials, Random Allocation, Double-blind Method, Single Blind
Method, clinical trial, controlled clinical trial, multicentre study (110).
Key words used as in the Cochrane review- infant or newborn or neonate or neonatal or
premature or very low birth weight or low birth weight or VLBW or LBW (1).

70
In this review, I included prospective, randomized controlled trials involving preterm infants
born at <37 weeks’ gestational age. Studies involving both term and preterm babies were
included but only preterm data was taken into consideration. Trials were included if
participating infants received non-invasive respiratory support, and randomly assigned to
HFNC or any other form of non-invasive respiratory support as primary respiratory support
after birth, after extubation from mechanical ventilation or while weaning from non-invasive
respiratory support.
3.4.2 Selection of studies
A total of 35 studies published as full text articles (24, 29, 91, 96-98, 111-139) and 2 studies
as abstracts (140, 141) were extracted from the literature search. Among these, five articles
were used for qualitative analysis only such as for review of other clinical outcomes (118,
133, 137-139). A total of 20 studies published as full-text articles (96-98, 113, 114, 116-118,
122-132, 134) and 2 studies published as abstracts (140, 141) with treatment failure data were
included in the final review. Of the studies published as abstracts, one study evaluated HFNC
as primary support but was terminated early and the data was extracted from previous reviews
(1, 110, 140, 142) and in another study only abstract data was used to review HFNC as
weaning mode (141). Both these abstracts were included because data needed for the review
question was available.
All included studies compared HFNC with CPAP, except 2 studies of which one compared
HFNC with Nasal Intermittent Positive Pressure Ventilation (NIPPV) (126) and Nasal
Intermittent Mandatory Ventilation (NIMV) in the other (123). All the studies involved
preterm infants who were <37 weeks’ gestation except in 2 studies which included both term
and preterm infants but stratified data of only preterm babies were included in the analysis
(97, 111).
One study compared HFNC with CPAP both as a primary mode of respiratory support and as
post extubation respiratory support and stratified data for primary outcomes were available for
both uses and therefore this study was included review questions (97). Thus, 6 studies were
included for examining HFNC as primary respiratory support (97, 122, 127, 130, 131, 140)
and 11 studies were included for examining HFNC as post extubation respiratory support (96-

71
98, 111, 112, 116, 117, 124, 125, 128, 132). Google Translate was used for an automated
translation from Chinese to English (Google Inc, Mountain View, CA). Characteristics and
clinical details of all the included studies are presented in table 9.
3.4.3 Statistical analysis
Although this was a descriptive review, I calculated risk ratio for various outcomes using the
data from included studies. I used Review Manager (RevMan) version 5.3 (The Nordic
Cochrane Centre, The Cochrane Collaboration, 2014, Copenhagen, Denmark) for statistical
analysis. The data was extracted for each intervention group and Risk Ratios (RR) was
calculated, along with 95% confidence intervals (CIs). Significance was set at P<0.05.

72
Table 9. List of studies included in HFNC clinical efficacy review
Study name Study
Type
Study population
n
Comparison Outcomes
Yoder
2013
RCT Primary n=141
Post extubation
n= 291
HFNC vs
CPAP
Treatment failure
Subgroup -Primary support
Extubation failure
Subgroup – Post extubation
Nair
2005
RCT n=67 HFNC vs
CPAP
Treatment failure requiring intubation
Iranpour
2011
RCT n=70 HFNC vs
CPAP
Treatment failure requiring intubation
Lavizzari
2016
RCT n=316 HFNC vs
CPAP
Treatment failure requiring intubation
Shin
2017
RCT n=87 HFNC vs
CPAP
Treatment failure requiring intubation
Roberts
2016
RCT n=564 HFNC vs
CPAP
Treatment failure requiring intubation
Kugelman
2011
RCT n=76 HFNC vs
NIPPV
Treatment failure requiring intubation
Iranpour
2016
RCT n=60 HFNC vs
NIMV
Total respiratory support
Respiratory support after 1st day
Collins
2013
RCT n=132 HFNC vs
CPAP
Extubation failure in the first 7 days after
extubation
Manley
2013
RCT n=303 HFNC vs
CPAP
Treatment failure within 7 days of
randomisation
Liu
2014
RCT n=255 HFNC vs
CPAP
Extubation failure in the first 7 days after
study entry
Mostafa-
Gharehbaghi
2014
RCT n=85 HFNC vs
CPAP
Re-intubation within 3 days of study
entry
Chen
2015
RCT n=66 HFNC vs
CPAP
Extubation failure within 7 days
Chen
2016
RCT n=129 HFNC vs
CPAP
Extubation failure within 7 days
Kang
2016
RCT n=161 HFNC vs
CPAP
Treatment failure within 7 d after
extubation
Kadivar
2016
RCT n=54 HFNC vs
CPAP
Remaining extubated for at least 3 days
after INSURE method.
Soonsawad
2017
RCT n=49 HFNC vs
CPAP
Extubation failure within 3 days after
endotracheal tube removal
Elkhwad
2017
RCT n=60 HFNC vs
CPAP
Failure of extubation within 5 days of
initial extubation
Abdel Hady
2011
RCT n=60 HFNC vs no
HFNC
Duration of oxygen
Requirement
Badiee
2015
RCT n=88 HFNC vs
CPAP only
Duration of oxygen
Requirement
Soonsawad
2016
RCT n=101 HFNC vs
CPAP only
Time, it took to wean off the use of the
CPAP or HFNC devices
Bao
2017
RCT n=82 HFNC vs
LFNC
Rate of one time successful weaning of
CPAP
TOTAL 3297
Table 9 shows the list of studies included in this review and key characteristics.

73
3.5 Primary respiratory support for RDS - HFNC versus CPAP
3.5.1 Descriptive review of studies evaluating HFNC for primary respiratory support
compared to CPAP
I identified 6 RCTs addressing this question in this review. 3 studies were small trials and 3
studies had large number of infants. Overall 1245 babies have been studied. A brief
description of these studies is followed by a meta-analysis of the primary outcome of
treatment failure. The treatment failures in the studies were defined by need for intubation and
mechanical ventilation.
A study by Yoder et al consisted of essentially two subgroups- one subgroup where HFNC
was used as primary support for respiratory distress and compared with CPAP, and other
subgroup where HFNC was used as post extubation support and compared with CPAP in its
efficacy against treatment failure (97). Over all 432 term and preterm infants of more than 28
weeks' GA who were planned to receive non-invasive respiratory support either as primary
support after birth or as post extubation support were enrolled onto the study (97). Among the
study patients, 351 infants were preterm and rest were term babies (97). The primary support
subgroup had 125 preterm infants and post-extubation subgroup had 226 preterm babies(97).
The respiratory support provided by HFNC was in the range of 3 to 5 L/min or nasal CPAP
was 5 to 6 cmH2O and this was administered after randomisation (97). The primary outcome
was defined as the need for intubation based on pre-determined criteria, within 72 hours of
commencing the treatment allotted by randomisation with either HFNC or CPAP (97).
There was no significant difference in the primary outcome between CPAP and HFNC. More
infants in the HFNC group crossed over to the alternative treatment after 72 hours. Any type
of positive pressure requirement was shorter for CPAP group as compared to HFNC group
but there was no difference in time to wean to room air or BPD rate.
They concluded that in infants >28 weeks’ gestational age, HFNC appears to have similar
clinical efficacy and safety to CPAP as a mode of non-invasive respiratory support.
The study had prespecified criteria for intubation and used random number generation and
opaque sealed envelopes for randomisation but the study was non-blinded. The risks for bias
include, non-blinded study, selective reporting of outcomes, and loss of power when making
subgroup analysis of preterm babies from the whole study group which had both term and
preterm babies.

74
Nair et al conducted a single-centre study looking at HFNC efficacy as a primary support for
respiratory distress in preterm infants (140). They enrolled 67 preterm infants of mean (range)
32 (27-34) weeks gestational age and mean birth weight of 1700 grams with respiratory
distress in the first six hours after birth (140). They were randomised to HFNC (mean flow
rate was 5 to 6 L/min) or CPAP (pressures of 5 to 6 cmH2O) (140). The primary outcome was
pre-determined with set criteria and was met if the infant required intubation due to
respiratory failure (140). They found that 4/33 (12.1%) in HFNC group and 4/34 (11.7%) in
NCPAP group ended up with treatment failure as per their pre-determined criteria in the trial
(p= 0.96).
This was one of the first studies which looked at HFNC as primary support for RDS in
neonates. The study was well structured with pre specified criteria (140). In addition unlike
some other studies during the same time, the Vapotherm units used in the study were modern
and delivered both heated as well as humidified gas (140). However, the study had to be
stopped early due to reports of infection with Ralstonia species in other neonatal units using
Vapotherm device for delivery of HFNC (1). The study was unpublished but was presented in
Paediatric Academic Society meeting (1, 140). The recruited infant numbers did not reach the
power to discriminate superiority of HFNC over CPAP (1). The study did not examine the
extremely premature babies or VLBW babies (140).
The risks of bias include non-blinded study, the Vapotherm device was provided by the
company.
In a single centre study by Iranpour et al conducted in a University Hospital in Iran, 70
preterm infants of 30 to 35 weeks' gestation were enrolled at 24 hours of age. The inclusion
criteria was presence of ongoing features of respiratory distress and oxygen requirement
(122). Infants were then randomised to either HFNC (gas flow 1 to 4 L/min) or to continuing
nasal CPAP (6 cmH2O)(122). In this study they also used INSURE (Intubation, Surfactant
administration, Extubation) technique if the infants met prespecified criteria and this was done
either before or after randomisation as per infants clinical requirement (122).
They found that there was no difference in failure of treatment. In addition, there were no
differences in death, duration of hospitalization, duration of improvement of respiratory
distress, chronic lung disease (CLD) and pneumothorax. There was less nasal trauma in

75
HFNC group (P<0.0001). They concluded that HFNC was as effective as CPAP in the
management of RDS in premature neonates more than 30 gestational weeks.
This study was a prospective randomised trial with clear segregation of two treatment arms
and included complications data such as nasal trauma and air leak episodes. The
randomisation process was unclear and criteria for treatment failure/intubation was not stated.
This was a non-blinded study. The HFNC flow rates were much lower than conventionally
used at present. Despite this, the HFNC arm did not show poorer primary outcome compared
to CPAP. The use of INSURE treatment might have altered the course of RDS and might
have changed the respiratory support requirement significantly. In addition, the pre-treatment
of 24 hours duration with nasal CPAP might influence the subsequent lung compliance due to
CPAP effects on end expiratory lung volume.
The risks of bias in this study includes unclear randomisation process where information
about sequence generation being not available. This results in selection bias. The criteria for
treatment failure or re intubation was not specified resulting in performance bias.
Ciuffini et al in 2013 at halfway stage and Lavizzari et al on completion in 2016 published
their single centre study of 316 preterm infants, mean (range) gestational age of 33 (29-36)
weeks and mean birth weight of 1900 grams with mild to moderate respiratory distress after
birth (119). Infants were randomised to receive HFNC (flow rates of 4 to 6 L/min) or nasal
CPAP (pressures of 4 to 6 cmH2O). The primary outcome was the need for intubation within
72 hours of life, based on a prespecified criteria (119). At halfway stage of the recruitment,
they found that 11/85 (12.9%) in HFNC group and 5/92 (5.43%) in NCPAP group ended up
with intubation within 72 hours of enrolment into the trial (p= 0.11) (119).
The study used block randomisation method with sealed envelopes. They had pre-specified
criteria for intubation. The study included infants who had INSURE technique who may have
a different course of RDS compared to other infants without surfactant. The study was
published prior to completion full trial of planned study population of 316 infants and this
was a non-blinded study.
The completed trial was then published by the same group Lavizzari et al in 2016 as a
randomized, clinical, non-inferiority trial (127). The treatment arms were HFNC on one arm
and CPAP/biphasic positive airway pressure (BiPAP)in the other am (127). The primary
outcome was treatment failure within 72 hours, defined by the need for mechanical ventilation

76
127). The non-inferiority margin was set at 10% (127). The study was done between 2012
and 2014 (127).
Their study objective was to determine whether HFNC provides respiratory support as a
primary approach with efficacy levels of being non-inferior to nasal continuous positive
airway pressure (CPAP) or bi-level CPAP (BiPAP) in preterm neonates (127).
The inclusion criteria were preterm in the gestational age 29+0 to 36 +6 presenting with mild
to moderate RDS requiring non-invasive respiratory support(127). Pre specified criteria for
starting non-invasive respiratory support were in place in the protocol (127). The study arms
were HFNC at flow rates of 4 to 6 L/min or CPAP/BiPAP at pressures of 4 to 6 cm H2O
(127).
They recruited a total of 316 infants with 158 in the HFNC group (mean [SD] GA, 33.1 [1.9]
weeks; 52.5% female) and 158 in the CPAP/BiPAP group (mean [SD] GA, 33.0 [2.1] weeks;
47.5% female) (127). The primary outcome failure of treatment was seen in 17 out of 158
infants in HFNC group (10.8%) and 15 out of 158 infants in CPAP/BiPAP group (9.5%). The
95% CI of risk difference was −6.0% to 8.6%; P = .71 (127). In this study, the use of HFNC
was noninferior to CPAP with regard to the primary outcome because the upper 95%
confidence limit (8.6%) was below the non-inferiority margin of 10%, and the lower 95%
confidence limit (−6.0%) was below 0% (127). The result was similar when applying a per-
protocol analysis (127).
Since their findings were in agreement within the limits of non-inferiority margins set
initially, they concluded that HFNC showed efficacy and safety similar to those of
CPAP/BiPAP when applied as a primary respiratory support to mild to moderate RDS in
preterm infants older than 28 weeks’ gestational age (127).
This study achieved total study numbers as per their sample estimates and used pre-specified
and standardised criteria for study entry. The non-inferiority margin of 10 percentage points
allows reasonable degree of certainty to claim non-inferiority of one treatment compared to
the other.
This study also used INSURE (intubation, surfactant treatment, and extubation) treatment and
this did not amount to treatment failure. Moreover, the surfactant administration was

77
common, occurring in >40% of infants in both treatment groups. They did not report the age
at randomisation and the respiratory support data before entry to the study was not explicitly
stated. The risks of bias in this study include non-blinded study affecting performance bias.
Shin et al conducted a randomised controlled trial involving 87 preterm infants with
gestational age range of 30 - 35 weeks with respiratory distress within 24 hours after birth
(131). The primary outcome was defined as the need for intubation or mechanical ventilation
due to treatment failure (131). The treatment failure included any of the following: respiratory
acidosis at maximum setting of the allocated device [flow 7 L/min or PEEP 7 cmH2O]),
degree of hypoxia (defined by FiO2>0.4 to maintain SpO2 88 to 94%) or frequency and
severity of apnoea (>2–3 episodes of apnoea/hour requiring repeated stimulation or bag-and-
mask ventilation) despite optimising therapy delivery either during HFNC or during CPAP
(131). The primary outcome events in HFNC was 16 out of 42 neonates and in CPAP was 9
out of 43 neonates reached treatment failure criteria (Risk difference 17.17 [−1.90–36.23]; P =
0.099) (131). The most frequent reason for treatment failure was hypoxia (p=0.020) seen
predominantly in HFNC group (131). The authors concluded that their study did not support
the noninferiority of HFNC compared to CPAP as an initial management of respiratory
distress in premature infants at between 30 and 35 weeks gestational age (131).
The randomization was performed by using computer-generated random-number followed by
sequentially numbered sealed opaque envelopes. Babies who received intubation and
surfactant were excluded and criteria for treatment failure was explicitly stated.
This was a non- blinded study with small study numbers, therefore it is possible that it did not
have the power to identify effectiveness between two modalities of respiratory support.
Roberts et al conducted a multicentre, randomized, noninferiority trial, where 564 preterm
infants (gestational age, ≥28+0 weeks) with early respiratory distress were studied with one
arm being nasal high-flow therapy and the other arm being nasal CPAP (130). The primary
outcome was treatment failure within 72 hours after study entry (130). In this non inferiority
trial the margin was 10 percentage points and it was determined by the absolute difference in
the risk of the primary outcome (130). CPAP rescue provided to HFNC arm in case of failure
and if CPAP also failed, they were mechanically ventilated (130).

78
Treatment failure was observed in 71 of 278 infants (25.5%) in the HFNC group and in 38 of
286 infants (13.3%) in the control group (risk difference, 12.3 percentage points; 95%
confidence interval [CI], 5.8 to 18.7; P<0.001) (130). The rate of intubation within 72 hours
and rate of adverse events was similar between two groups (130). Since the treatment failure
rate was 25.5% in HFNC group they concluded that when used as primary support for preterm
infants with respiratory distress, HFNC results in higher treatment failure compared to CPAP
(130).
This study also did not adopt INSURE treatment and the randomisation process was robust.
Trial recruitment was stopped early after review by safety monitoring committee. In order to
achieve 90% power, the study needed 750 infants to identify non-inferiority of HFNC over
CPAP. The risks of bias are non-blinded study, allowed CPAP cross over from HFNC and
therefore could have affected secondary outcomes.
These 6 studies have been summarised in table 10.

79
Table 10. Summary of clinical studies comparing HFNC versus CPAP as primary
respiratory support
Author,
date,
Country
Publication
journal
Study
population
Type of
study
Primary
outcome
Results
Events/Tota
l
Additional
information
Yoder et
al(97)
2013
USA
Pediatrics
141 neonates
in primary
support arm
– 28–42/40
gestational
weeks,
birth weight
≥1000 g
125 babies
were preterm
Multi-centre
RCT
Unblinded
Extubation
failure any
time after
initiation of
study
support
HFNC –
6/58
CPAP-
9/67
Pre-
intervention
respiratory
support also
included
neonates who
were initially
on non-
invasive
support
Pre-extubation
caffeine use
was not
standardised
Nair et
al(140)
2005
USA
PAS
meeting
unpublished
67 preterm
infants
27 to 34
weeks'
gestational
age (GA)
mean GA of
32 weeks and
birth weight
of 1700
grams
Single centre
RCT
Unblinded
HFNC:
Vapotherm
5 to 6 L/min
CPAP:
bubble
CPAP,
Hudson
prongs, 5 to 6
cmH2O
Respiratory
failure
requiring
intubation,
based on
prespecifie
d criteria
(pH ≤ 7.25
and
PaCO2 ≥ 60
mmHg , or
FiO2 >
0.70, or
severe or
frequent
apnoea)
HFNC 4/33
CPAP 4/34
Vapotherm
units were
recalled
following
reports of
Ralstonia
infection –
therefore
study ended
prior to full
recruitment
Randomisatio
n was
standardised
with Sealed
envelopes and
Stratified into
27 to 30
weeks' and 31
to 34 weeks'
gestation.
Permuted
block
randomisation

80
Author,
date,
Country
Publication
journal
(Cont)
Study
population
Type of
study
Primary
outcome
Results
Events/Tota
l
Additional
information
Iranpour et
al(122)
2011
Iran
Archives of
Disease in
Childhood.
70 preterm
infants
30–35 weeks
gestation
RCT
Group1
(CPAP)
received
NCPAP from
birth and
Group 2
(HFNC)
received
CPAP for the
first 24 hours
after birth,
then standard
HFNC
Rates of
treatment
failure (and
need for
intubation)
within
seven days
of trial
entry
HFNC 0/35
CPAP 0/35
Lavizzari et
al(127)
2016
Italy
JAMA
Pediatrics
316 infants
with 158 in
the HFNC
group (mean
[SD] GA,
33.1 [1.9]
weeks;
and 158 in
the
CPAP/BiPA
P group
(mean [SD]
GA, 33.0
[2.1] weeks;
randomized
clinical non-
inferiority
trial
The babies
were
randomised
to either
HFNC at 4 to
6 L/min or
CPAP/BiPA
P at 4 to 6
cm H2O
Treatment
failure
within 72 h,
defined as
the need for
mechanical
ventilation
HFNC
17/158
CPAP
15/158
In the CPAP
group, infants
were shifted to
BiPAP in the
case of more
than 4
episodes
of apnoea per
hour or more
than 2
episodes per
hour requiring
positive
pressure
ventilation or
if deemed by
clinicians
because of
increased
work of
breathing.

81
Author,
date,
Country
Publication
journal
(Cont)
Study
population
Type of
study
Primary
outcome
Results
Events/Tota
l
Additional
information
Shin et
al(131)
2017
South Korea
J Korean
Med Sci
87 preterm
infants
30 weeks and
less than 35
weeks of ges-
tational age
Single centre
RCT
HFNC
Flow of 5
L/min
initially and
adjusted
between 3–7
L/min
CPAP-
PEEP of 5
cmH2O
initially and
adjusted be-
tween 4–7
cmH2O
Pre-
specified
treatment
failure
criteria
HFNC
16/42
CPAP
9/43
HFNC
Optiflow
System
Fisher &
Paykel
Optiflow
CPAP
Infant Flow
CPAP system
or Millennium
ventilator
Short binasal
prongs with
different sizes
according to
weight
Roberts et
al(130)
2016
Internationa
l trial
The New
England
Journal of
Medicine
564 infants
included in
the analysis
HFNC 278
CPAP 286
RCT
HFNC
Optiflow
Junior
Fisher and
Paykel or
Precision
Flow
Vapotherm
device.
Initial gas
flow of 6 to 8
LPM
CPAP
ventilator, an
underwater
“bubble”
system, or a
variable-flow
device.
Pre-
specified
treatment
failure
criteria
HFNC
71/278
CPAP
38/286
HFNC
The size of the
nasal cannulae
was
determined
according to
the
manufacturers
instructions
CPAP
short binasal
prongs
or a nasal
mask

82
3.5.2 Results and discussion:
I performed a meta-analysis of the primary outcomes of all the available studies to date up to
January 2018. This is summarised in a Forest plot in figure 10.
When the later studies are taken into account, the updated pooled analysis shows that CPAP is
better than HFNC in primary respiratory support in terms of the primary outcome of treatment
failure (defined by individual studies at different timescales). This is consistent with the meta-
analysis presented by Roberts et al excluding the relatively smaller Shin et al study (131,
142).

83
Figure 10. Forest plot of comparison: HFNC versus CPAP soon after birth for primary
respiratory support in RDS, Outcome: Treatment failure as defined by the studies.
Figure 10 shows risk ratio with 95% confidence intervals in brackets when comparing HFNC
versus CPAP as the primary respiratory support mode for RDS in preterm neonates.

84
When HFNC was compared with CPAP as a primary respiratory support mode in preterm
neonatal respiratory distress there was increased risk of treatment failure as shown in the
Forest plot figure 10 with RR 1.57 95% CI (1.20, 2.05)].
The studies by Yoder et al (97), Nair et al (140), Iranpour et al (122) and initial publication of
the part of the study by Lavizzari group (119) were systematically reviewed and meta-
analyses was published by different investigators in 2015 (110) and 2016 (1). They found no
differences in treatment failure, intubation, or other clinical outcomes. Subsequently there
have been further larger studies published by Lavizzari et al (127), Shin et al (131) and
Roberts et al (130). These later studies are larger, more rigorous in terms of statement of
criteria for treatment interventions and were pre-registered as clinical trials reducing the
reporting bias.
The Cochrane review in 2016 presented their meta-analysis from studies up to 2016 (1). They
found a cumulative risk ratio of 1.30 (0.73, 2.34) based on 439 patients from 3 trials with 211
patients in HFNC arm and 228 patients in CPAP arm (1). They concluded that for preterm
infants needing primary respiratory support after birth, there were no differences in the rates
of primary or secondary outcomes between HFNC and CPAP (1).

85
3.6 Primary Respiratory Support for RDS in Neonates – HFNC versus NIPPV
HFNC has been compared with bi-level type of pressure support devices. There have been 2
RCTs comparing HFNC to other bi-level type of non-invasive respiratory support as primary
respiratory support after birth in preterm infants.
3.6.1 Descriptive review of studies evaluating HFNC for primary respiratory support
compared to NIPPV
In this single-centre, prospective, randomized, controlled, pilot study, Kugelman studied 76
preterm infants (gestational age <35 weeks, weight >1000 g) with RDS comparing HFNC
with NIPPV for primary respiratory support after birth (126). Infants were treated with either
HFNC (starting gas flow 1 L/min, increased up to 5 L/min as required) or synchronised
NIPPV (positive inflation pressure 14 to 22 cmH2O, positive end-expiratory pressure 6
cmH2O, rate 12 to 30 inflations per minute) (126). The primary outcome was the proportion
of infants who failed non-invasive respiratory support and needed endotracheal intubation or
were switched to another form of non-invasive respiratory support (126).
A total of 76 infants participated in the trial (38 in each treatment group) (126). The type of
respiratory support mode was associated with duration of the non-invasive support. The BPD
rates were similar between the two groups (126). Nasal trauma was not recorded and air leak
was reported in 2 patients receiving HFNC (126). The study did not include ELBW babies.
The risks of bias include being a non-blinded study the equipment was supplied by
Vapotherm company. The randomisation sequence generation method was not described.
The study by Iranpour et al compared Nasal Intermittent Mandatory Ventilation (NIMV) to
HFNC in preterm infants with RDS after the first 24 hours of life (123). Those requiring
NIMV respiratory support more than one day and showed the signs of respiratory distress
were randomized into two groups of NIMV and HFNC (123). There were 30 infants in each
group (123). All patients with RDS were treated with NIMV for the first day (123). They
evaluated the rates of chronic lung disease, mechanical ventilation, failure to treatment, the
time to establish full enteral feeding and the mortality rate (123). No incidence of treatment
failure, chronic lung disease, mechanical ventilation or endotracheal intubation was observed
in either group (123). Nasal mucosal damage was mainly seen in NIMV group (123). In view
of the favourable complications profile, they concluded that HFNC was more tolerable than

86
NIMV in the treatment of RDS in premature neonates ≥30 weeks when initiated after the first
24 hours of life (123).
The study employed simple randomisation to allocate the study groups. The administration of
surfactant with INSURE method might affect the results although there was no statistical
significant difference in its use between the two groups. The minimum respiratory flow rate of
oxygen was 2 L/min and the optimum was calculated based on the patient’s weight [0.68W
(kg) + 0.92] formula from Sreenan et al study (24). The NIMV device characteristics were not
specified.
3.6.2 Results and discussion
The above two studies have been summarised in table 11. The primary outcome and events
per study arm has been extracted from the studies. I performed a risk ratio analysis using the
data from above two studies shown in figure 11.
When HFNC was compared with NIPPV as a primary respiratory support mode, there was no
significant increased risk of treatment failure, RR 0.85 95% CI (0.44, 1.65).
Cochrane review took into account data from one study and reported that there was no
difference between HFNC and NIPPV in rates of treatment failure, death or CLD (1, 126).
Also, from the same study it was noted that infants randomised to HFNC spent a longer
period of time receiving non-invasive respiratory support (median 4 days vs median 2 days, P
< 0.01) (1, 126).
Since then there has been one more study from 2016 which did not find any further
differentiating data with regards to primary outcome of treatment failure as defined by the
study (123).
Since there were no events relating to death, CLD or treatment failure in either arm of
treatment in the study by Iranpour et al, there was no difference between HFNC and NIPPV in
rates of treatment failure, death or CLD.

87
Table 11. Summary of clinical studies comparing HFNC versus NIPPV as primary
respiratory support for RDS in preterm neonates
Author,
date,
Country
Publication
journal
Study
population
Type of
study
Level of
evidence
Equipment
Primary
outcome
Results
Events/Total
Additional
information
Kugelman et
al(126)
2015
Israel
Pediatric
Pulmonology
76 neonates
Gestational
age <35
weeks,
mean 33
weeks and
weight
>1000 g,
mean 1800
grams)
Single-
centre RCT
Unblinded
Vapotherm
device,
Precision
Flow or
2000i
NIPPV
SLE 2000
or 5000
Treatment
failure defined
by requiring
mechanical
ventilation
HFNC 11/38
NIPPV
13/38
HFNC
Vapotherm
nasal
prongs
NIPPV
nasal
prongs
Iranpour et
al(123)
2016
Iran
British
Journal of
Medicine &
Medical
Research
60 infants
Gestational
age of 30
to 35
weeks
(mean 31.8
in NIMV
and 31.83
weeks in
HFNC)
HFNC-
RT329
(Fisher and
Paykel
Healthcare,
Salter Lab,
Arvin,
California).
The
external
diameter of
the nasal
cannula
was 2 mm.
NICU
duration
Post-NICU
hospitalisation
period
Age when
oral feeding
began
Age when full
oral feeding
established
HFNC
0/30
NIMV
0/29
Treatment
failure
criteria not
specified
Sreenan et
al study
used to
calculate
HFNC
flow rates
NIMV –
Device not
specified
Table 11 is a summary of two studies comparing HFNC versus NIPPV as a primary
respiratory support mode for treatment of RDS in preterm infants.

88
Figure 11. Forest plot of comparison: HFNC versus NIPPV for primary respiratory
support in RDS, Outcome: Treatment failure as defined by the studies.
Figure 11 shows risk ratio with 95% confidence intervals in brackets when comparing HFNC
versus NIPPV as the primary respiratory support mode for RDS in preterm neonates.

89
3.7 Post Extubation Respiratory Support – HFNC versus CPAP
There are now more than 1000 preterm babies who have been studied regarding the efficacy
of HFNC over CPAP in providing adequate post extubation respiratory support.
A detailed description of each study and a table summarising key features has been presented.
I performed meta-analysis of key outcomes and discuss the findings in relation to existing
knowledge from previous systematic reviews.
3.7.1 Descriptive review of studies evaluating HFNC for post extubation respiratory support
compared to CPAP
In a prospective, single-centre study involving 132 very preterm infants below 32 weeks’
gestation at birth Collins et al evaluated clinical efficacy of HFNC as post extubation
respiratory support (96). The mean gestational age was 28 weeks and birth weight was 1100
grams (96). The study groups were HFNC (Vapotherm 8 L/min) as treatment arm and nasal
CPAP (Hudson Respiratory Care, 8 cmH2O) as control arm as per randomisation (96). They
used nasal cannula with 1.5 mm outer diameter for HFNC and bi-nasal prongs with outer
diameter of 3.7-4.6 for nasal CPAP. The primary outcome was extubation failure in the first
seven days after extubation (96). Their pre-defined extubation failure criteria included
episodes of apnoea occurring at a frequency of >6 episodes in 6 hours or severe enough to
require intermittent positive pressure ventilation, acidosis (pH <7.25 and PCO2 >66 mmHg)
and sustained increase in FiO2 of >15% from extubation (96). The study population included
132 infants with 67 in HFNC arm and 65 in CPAP arm. The primary outcome rate was similar
in both groups (96). The study conclusion was that the extubation failure rates are similar
between HFNC and CPAP therapy at 7 days in premature infants (96).
The study had several strengths with adequate randomisation process and clearly defined
failure criteria. However, the study was non-blinded and extremely premature and extremely
low birth weight babies were not included. The risks of bias in this study includes being an
unregistered trial there may have been selective reporting.
Manley et al conducted a multi-centre, non-inferiority study of 303 preterm infants (< 32
weeks’ gestation at birth) and studied efficacy of HFNC versus CPAP post extubation in
providing respiratory support (98). The mean gestational age was 27 weeks and mean birth

90
weight was 1000 grams (98). Infants were randomised to receive either HFNC (5 to 6 L/min)
or CPAP (7 cmH2O) after extubation (98). The primary outcome was treatment failure within
seven days of randomisation, based on prespecified criteria (98). Infants who failed HFNC
were treated with CPAP (98).
HFNC was noninferior to CPAP in terms of primary outcome (risk difference 8.4 percentage
points; 95% confidence interval [CI] -1.9, 18.7 (98). There were no significant differences
between HFNC and CPAP groups for treatment failure reasons although 48% of HFNC
failure infants were rescued with CPAP without reintubation (98). There was no significant
difference between the HFNC and CPAP groups for reintubation within 7 days of extubation
(risk difference -7.4 percentage points; 95% CI -16.6, 1.8; p=0.12) (98). The nasal trauma rate
was significantly less with HFNC (98). The study concluded that the efficacy and safety of
respiratory support with HFNC and CPAP are similar in very preterm infants following
extubation (98).
This was a multi-centre trial with large numbers and therefore with adequate power to address
their primary outcome measure. A pragmatic, real life approach to study protocol with HFNC
failure babies being able to be offered period of CPAP was incorporated. However, the non-
inferiority margin was generous. Stricter interpretation i.e., 10% rather than 20% percentage
points for non-inferiority would have shown that HFNC was not non-inferior to CPAP as a
post extubation respiratory support strategy. The risks of bias in this study include non-
blinded study, selective reporting as not all the outcomes listed have been reported.
Yoder et al conducted a multicentre study where HFNC was compared with CPAP as a
respiratory support for neonatal respiratory distress. A subgroup analysis of babies in whom
HFNC was used as primary support for respiratory distress and compared with CPAP was
done (97). Over all 432 term and preterm infants of more than 28 weeks' GA who were
planned to receive non-invasive respiratory support either as primary support after birth or
post-extubation were enrolled onto the study (97). Of these, 351 infants were preterm and rest
were term babies (97). The primary support subgroup had 125 preterm infants and post-
extubation subgroup had 226 preterm babies (97). The respiratory support provided by
HFNC was in the range of 3 to 5 L/min and nasal CPAP was 5 to 6 cmH2O and this was

91
administered after randomisation (97). The primary outcome was defined as the need for
intubation within 72 hours of randomisation (97).
There was no significant difference in the primary outcome between CPAP and HFNC in the
subgroup analysis (97). More infants in the HFNC group crossed over to the alternative
treatment after 72 hours (97). They concluded that in infants >28 weeks’ gestational age,
HFNC appears to have similar clinical efficacy and safety to CPAP as a mode of non-invasive
respiratory support (97).
The study protocol had prespecified criteria for intubation and they used random number
generation with opaque sealed envelopes for randomisation and like other studies included
this review, it was non-blinded. The risks of bias include selective reporting and non-blinded
study.
In a prospective, multi-centre randomised control study, conducted in China, 255 infants (< 7
days old) were studied (111). In this study 150 were preterm and the mean gestational age was
35.5 weeks and mean birth weight was 2,472 ± 788 grams (111). A total of 128 infants were
in the HFNC group, and 127 infants were in the CPAP group (111). Post extubation
respiratory support was allotted following randomisation to either HFNC or CPAP (111).
BPD or death in hospital, extubation failure defined by requiring reintubation within 7 day of
study entry were the primary outcomes (111). During the first 72 hours of the study, cross-
over was not allowed between the two groups (111).
The difference in the extubation failure for HFNC (12/128, 9.4%) versus nasal CPAP (12/127,
9.4%) (P > 0.05), or in mortality for HFNC (12/128, 9.4%) versus nasal CPAP (15/127,
11.8%) (P > 0.05) were not statistically significant (111). They concluded that among infants
in the first week of postnatal age, HFNC appears to have efficacy and safety similar to those
of CPAP group when used as post extubation respiratory support (111).
Although this was a multicentre, prospective randomised controlled study, it included diverse
mixture of infants where pathology is widely different ranging from RDS to meconium
aspiration syndrome. Subgroup data was not given in detail to understand the distribution of
outcome data among more vulnerable group i.e., preterm infants. The risks of bias include

92
non-blinded study, trial was not registered raising the possibility of reporting bias and also the
random sequence generation method was not explicitly stated.
Mostafa-Gharehbaghi et al conducted a single-centre randomised controlled study with 123
preterm infants where 85 neonates who met inclusion criteria were enrolled (128). The mean
gestational age was 32.15 ± 1.59 weeks and the birth weight was 1895 ± 438 grams (128). All
the babies were given CPAP as well as surfactant with INSURE technique (128). After
extubation they were then randomised to either HFNC (flow rate of 6 L/min) or nasal CPAP
(pressures of 5 to 6 cmH2O) (128). The primary outcome was re-intubation according to
prespecified criteria within three days of study entry (128).
The primary outcome was noted in 8 patients (18.6%) in CPAP group and 5 (11.9%) in
HFNC group (128). HFNC device manufacturer was not mentioned in the article and the
CPAP device was Bubble CPAP System Fisher and Paykel Health Care, Inc (128). Their
conclusion was that HFNC was as effective as nasal CPAP for respiratory support in preterm
infants after INSURE treatment (128).
This was a randomised controlled study with prespecified criteria for primary outcome. Since
Vapotherm was not accessible in Iran, the country in which this study was done, they used bi-
nasal prongs for HFNC. However, it is not mentioned in the study whether they used a local
custom-made assembly of heated humidified device or any other pre-tested commercial
device. The risks of bias in this study includes non-blinded study and unclear methodology
regarding primary outcome. The intubation criteria not specified.
In a randomised, controlled study in preterm infants aged 26 to 31(+6 days) weeks with
respiratory distress syndrome after extubation Kang et al studied 161 infants (125). The
HFNC (n=79) was compared with CPAP (n=82) (125). They also made subgroup analysis of
babies according to the gestational age (125). HFNC device was Fisher & Paykel Healthcare
and CPAP device was Infant Flow, VIASYS Healthcare (125). The treatment failure rate,
reintubation rate within 7 days after extubation, incidence of complications, and mortality
during hospitalization were the outcomes studied (125). The treatment failure rate and
reintubation rate showed no significant differences between the HFNC and CPAP groups
(125). They concluded that in preterm infants aged 29-31(+6) weeks, HFNC has a similar

93
efficacy as CPAP after extubation, while in those aged less than 29 weeks, HFNC should be
used with caution (125).
The main strength of this study is that it also included preterm infants of under 29 weeks’
gestation. However, the study was inadequately powered to provide definitive conclusion
about the role of HFNC in comparison to CPAP control therapy. The risks of bias in this
study includes non-blinded study.
Kadivar et al in their randomised, controlled study compared the effect of HFNC with nasal
CPAP in post-extubation of 54 preterm infants with RDS. They used INSURE method for all
babies in their study (124). The primary outcome was remaining extubated for at least 3 days
after INSURE method (124). The patient was reintubated if there was hypercapnia
(pCO2≥60) with pH<7.25 and/or paO2<50 with FiO2>0.6(124). HFNC device used was
Fisher & Paykel, Healthcare, Auckland, New Zealand and the CPAP device used was
Dragger, Lubeck, Germany (124). Nasal prong details were not mentioned.
The rate of reintubation was higher in the HFNC compared with the nasal CPAP group (124).
The rate of either IVH or ROP, duration of oxygen requirement and hospitalization were not
statistically different (124). There were no cases of BPD or mortality seen (124).
Although the authors concluded that that preterm infants with RDS could be managed post-
extubation after INSURE method with either CPAP or HFNC, their primary outcome showed
that the rate of reintubation was higher in the HFNC group (124). The study was randomised,
controlled study with prespecified failure criteria in the protocol however, the flow rates used
were below the conventional flow rates used in preterm infants.
Soonsawad et al conducted a randomised, controlled, single centre study involving 49 preterm
infants with gestational age <32 week or birth weight of <1500 g post extubation onto HFNC
(n=24) or CPAP (n=25) (132). A block-of-four randomization stratified by gestational age
(<28 week, 28 to 30 week and >30 week) and implemented with concealed, opaque envelopes
with the computer generated sequence numbers (132). The primary outcome was extubation
failure within 72 h after endotracheal tube removal (132). HFNC set up included binasal
cannula (BC2425 model, Fisher and Paykel Healthcare, Auckland, New Zealand), 2.4 mm in
outer diameter, occupying approximately half of the nares diameter. Fisher and Paykel

94
Healthcare humidifier was used (132). The CPAP support was by variable flow CPAP
generator (Fabian, Acutronic, Hirzel, Switzerland) via nasal mask (132).
There was no difference in the primary outcome between the two groups with 8 infants in
HFNC vs. 6 in CPAP group (p = 0.47) (132). However, 6 infants (75%) in HFNC and 4
infants (66%) in CPAP group who met failed extubation criteria were rescued by bi-level
CPAP (132). Therefore, the reintubation rate was similar [2 infants (8.3%) in HFNC vs. 2
infants (8%) in CPAP group] (132). Study concluded that the extubation failure rate was not
statistically different between infants who were on HFNC or CPAP support (132).
The strength of the study includes adequate randomisation process although the overall
numbers were small to make definitive conclusions about efficacy.
Elkhwad et al conducted a single centre randomised controlled trial in Iran (112). The study
included 60 preterm infants between 24 and 28 weeks’ gestation (mean 26.7 weeks) with
respiratory distress syndrome (112). The mean birth weight was similar in two groups (112).
They were randomized to either HFNC or CPAP (112). The primary outcome was failure of
extubation defined by the need for re-intubation and mechanical ventilation within 5 days of
initial extubation (112). HFNC machine used was Tri-Anim Vapotherm the Precision Flow
and CPAP machine was Fisher and Paykel Healthcare, Bubble CPAP System (112). No
information about nasal prongs used was given.
Preterm infants who remained intubated for more than 24 hours were excluded from the study
(112). They analysed 53 infants’ data with 24 in HFNC arm and 29 in CPAP arm (112). Their
results showed that 17.2% of neonates placed on HFNC failed extubation and required re-
intubation within 5 days of initial extubation compared with 20.8% of neonates placed on
CPAP (p value 1.000) (112). Similarly mean duration of respiratory support using HFNC was
37.45 days compared to 40.04 days using CPAP (p value 0.66) and duration of oxygen
requirement for infants placed on HFNC was 49.41 days compared to 43.75 days for infants
placed on NCPAP (p value 0.58) (112). The study concluded that HFNC use was comparable
to the use of CPAP in the immediate post-extubation period for preterm infants between 24
and 28 weeks gestations with Respiratory Distress Syndrome and does not increase risk for
co-morbid conditions (112).

95
This study included extremely preterm babies and study groups were randomised before
allotment. However, there was no information about nasal prongs used and whether this
allowed adequate leak at nasal interface. This is an important data as the study included
babies with mean birth weight of under 1000 grams. The risks of bias include non-blinded
study and unclear risk in terms of reporting bias.
Chen et al evaluated 66 VLBW babies of less than 37 weeks gestational age in a single centre
randomised controlled study to compare the clinical efficacy of HFNC versus nasal CPAP in
treatment of respiratory distress syndrome. Babies received surfactant and conventional
treatment initially after birth. The primary outcome was rate of re-intubation within 7 days of
extubation was significantly lower in HFNC group. In addition, HFNC babies had
significantly shorter oxygen exposure time and invasive ventilation time, and suffered lower
incidences of nasal injury, air leak, and abdominal distention, as compared with the CPAP
group. They recommended HFNC as the first choice of non-invasive ventilation in the
treatment of RDS in VLBW infants.
The article was in Chinese and Google Translate was used to understand the methods and
results. The randomisation method was not clear.
Chen et al conducted the only study which studied exclusively ELBW babies. In this single
centre randomised, controlled study 129 ELBW infants born <34 weeks of gestation were
allocated to HFNC or CPAP group. The primary outcome included the incidence of
extubation failure, nasal injury, air leak, abdominal distension and bronchopulmonary
dysplasia. The extubation failure rate was lower in HFNC group (25.8%) compared to the
nasal CPAP group (47.6%) which was statistically significant. The BPD rates similar in two
groups. They concluded that HFNC was an effective and safe method for prevention of
extubation failure in ELBW infants.
The article was in Chinese and Google Translate was used to understand the methods and
results. The randomisation method was not clear.

96
3.7.2 Results and discussion
A summary of the studies evaluating HFNC compared to CPAP as post extubation respiratory
support is shown in table 12.
I generated a pooled meta-analysis from the studies available up to date and compared with
Cochrane review (1) from 2016 and another review published in 2017 (142). This is shown in
figure 12.

97
Table 12. Summary of clinical studies comparing HFNC versus CPAP as post
extubation respiratory support for RDS in preterm neonates
Author,
date,
Country
Publication
journal
Study
population
Type of
study
Equipment
Primary
outcome Results
Additional
information
Yoder et
al(97)
2013
USA
Pediatrics
291
ventilated
neonates
28–42/40
gestational
weeks
Multi-centre
RCT
Nonblinded
Extubation
failure any
time after
initiation of
study support
There were no
predefined
extubation
criteria
HFNC
11/107
CPAP
9/119
Pre-intervention
respiratory
support also
included
neonates who
were initially on
non-invasive
support
Pre-extubation
caffeine use was
not standardised
Collins et
al(96)
2013
Australia
The Journal
of Pediatrics
132 very
preterm
infants (<
32 weeks
Mean
gestational
age & birth
weight
were
28weeks &
1100 grams
Single centre
RCT
nonblinded
HFNC
Vapotherm
CPAP
Hudson
Respiratory
Care
Extubation
failure in the
first seven
days after
extubation
Apnoea
>6 in 6 hours
or an episode
requiring
IPPV
HFNC
15/67
CPAP
22/65
Extubation
failure
Apnoea
Acidosis
pH <7.25 &
PCO2>66mmHg
Sustained
increase in FiO2
of >15% from
extubation
Manley et
al(98)
2013
Australia
NEJM
303
preterm
infants
<32 weeks
Multi centre
RCT
nonblinded
HFNC
Optiflow
CPAP
mechanical
ventilator or
an
underwater
“bubble”
system
Treatment
failure within
seven days of
randomisation,
based on
prespecified
criteria
HFNC
52/152
CPAP
39/151
HFNC- binasal
infant cannulae
Fisher & Paykel
Healthcare
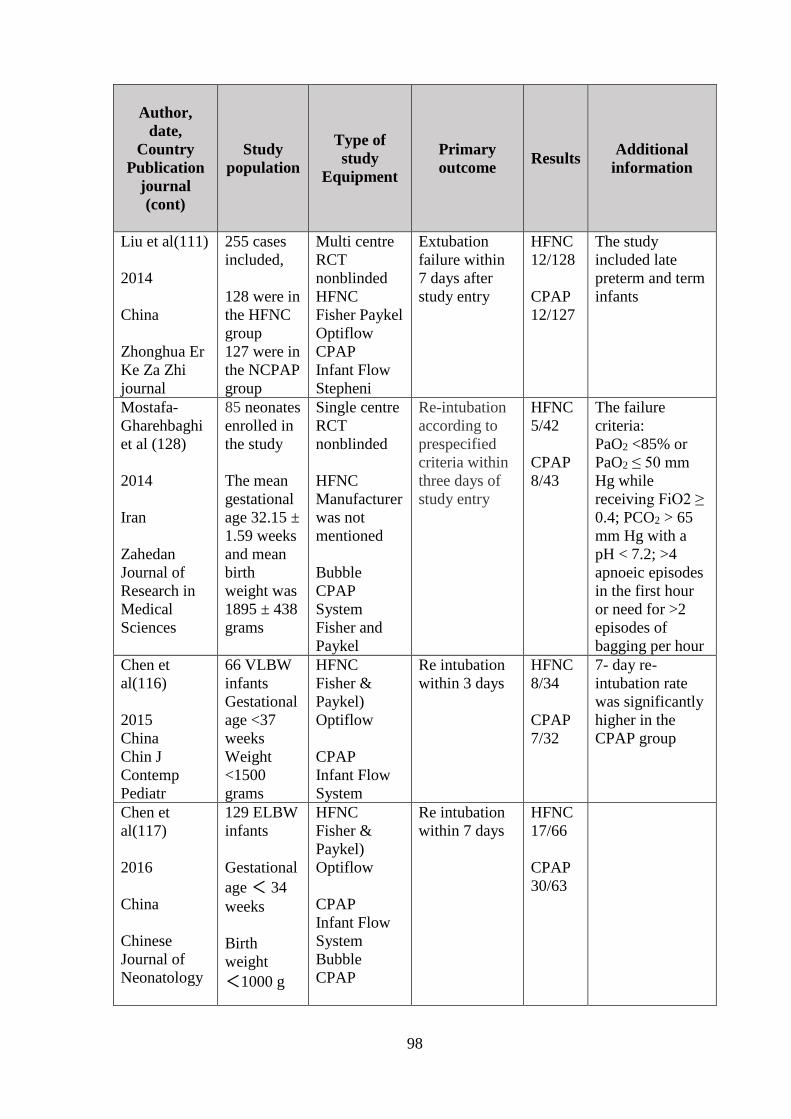
98
Author,
date,
Country
Publication
journal
(cont)
Study
population
Type of
study
Equipment
Primary
outcome Results
Additional
information
Liu et al(111)
2014
China
Zhonghua Er
Ke Za Zhi
journal
255 cases
included,
128 were in
the HFNC
group
127 were in
the NCPAP
group
Multi centre
RCT
nonblinded
HFNC
Fisher Paykel
Optiflow
CPAP
Infant Flow
Stepheni
Extubation
failure within
7 days after
study entry
HFNC
12/128
CPAP
12/127
The study
included late
preterm and term
infants
Mostafa-
Gharehbaghi
et al (128)
2014
Iran
Zahedan
Journal of
Research in
Medical
Sciences
85 neonates
enrolled in
the study
The mean
gestational
age 32.15 ±
1.59 weeks
and mean
birth
weight was
1895 ± 438
grams
Single centre
RCT
nonblinded
HFNC
Manufacturer
was not
mentioned
Bubble
CPAP
System
Fisher and
Paykel
Re-intubation
according to
prespecified
criteria within
three days of
study entry
HFNC
5/42
CPAP
8/43
The failure
criteria:
PaO2 <85% or
PaO2 ≤ 50 mm
Hg while
receiving FiO2 ≥
0.4; PCO2 > 65
mm Hg with a
pH < 7.2; >4
apnoeic episodes
in the first hour
or need for >2
episodes of
bagging per hour
Chen et
al(116)
2015
China
Chin J
Contemp
Pediatr
66 VLBW
infants
Gestational
age <37
weeks
Weight
<1500
grams
HFNC
Fisher &
Paykel)
Optiflow
CPAP
Infant Flow
System
Re intubation
within 3 days
HFNC
8/34
CPAP
7/32
7- day re-
intubation rate
was significantly
higher in the
CPAP group
Chen et
al(117)
2016
China
Chinese
Journal of
Neonatology
129 ELBW
infants
Gestational
age < 34
weeks
Birth
weight
<1000 g
HFNC
Fisher &
Paykel)
Optiflow
CPAP
Infant Flow
System
Bubble
CPAP
Re intubation
within 7 days
HFNC
17/66
CPAP
30/63

99
Author,
date,
Country
Publication
journal
(cont)
Study
population
Type of
study
Equipment
Primary
outcome Results
Additional
information
Kang WQ
(125)
2016
China
Chinese
journal of
contemporary
pediatrics
161
preterm
infants
HFNC
(n=79)
CPAP
(n=82).
Single centre
RCT
nonblinded
HFNC-
Fisher &
Paykel
CPAP -
Infant Flow
Treatment
failure within
7 days after
extubation.
HFNC
29/79
CPAP
19/82
The failure rate
(45%) in preterm
infants treated
with 26-
28 +6 weeks was
higher than that
in controls (21%)
(χ 2 = 4.70, P =
0.03)
Kadivar(124)
2016
Iran
Iranian
Journal of
Medical
Sciences
54 preterm
infants
27 in each
group
HFNC and
CPAP
Single centre
RCT
nonblinded
Remaining
extubated for
at least 3 days
after INSURE
method.
HFNC
14/27
CPAP
4/27
Nasal prong
details were not
mentioned.
HFNC - Fisher &
Paykel
CPAP - Dragger,
Germany
Soonsawad et
al(132)
2017
Indian
Journal of
Pediatrics
Thailand
49 infants
enrolled
24 in the
HFNC
25 in the
CPAP
group
Single centre
RCT
nonblinded
Extubation
failure within
72 h after
endotracheal
tube removal
HFNC
8/24
CPAP
6/25
Binasal cannula
(BC2425 model,
Fisher and
Paykel), 2.4 mm
in outer diameter
HFNC - Fisher
and Paykel
CPAP - Fabian,
Acutronic
Elkhwad et
al(112)
2017
Qatar
Neonat
Pediatr Med
60 preterm
infants
enrolled
(54
analysed)
(mean 26.7
weeks)
Single centre
RCT
nonblinded
Failure of
extubation
(need for re-
intubation)
within 5 days
of initial
extubation
HFNC
5/29
CPAP
5/24
The mean birth
weight
CPAP - 995.33
(SD 201.66)
HFNC- 994.54
(SD 202.82)
Table 12 shows a summary of 11 studies comparing HFNC versus CPAP as a post extubation
respiratory support mode in preterm infants.

100
Figure 12. Forest plot of comparison: HFNC versus CPAP for post extubation
respiratory support in RDS, Outcome: Treatment failure as defined by the studies.
Figure 12 shows a Forest Plot analysis of risk ratio when comparing HFNC versus CPAP as a
post extubation respiratory support mode.

101
HFNC resulted in a RR (95% CI) of 1.09 (0.90, 1.31) for treatment failure. This is similar to
Cochrane review where treatment failure with HFNC as defined by the studies was similar to
CPAP (1).
A Cochrane review performed meta-analysis of the studies available until 2016 (1). However
since then there have been number of RCT adding to the total number of babies where HFNC
as post extubation respiratory support was studied (142). However the previous drawbacks of
the studies remain that studies are varied in methodology, performed in different clinical
settings, different levels of flow have been utilized (126). For example, Yoder et al used
initial flows based on infants’ weight (3 L/min for 1,000–1,999 g, increased by a maximum of
3 L/min) whereas Collins et al used an initial flow of 8 L/min and Manley et al used an initial
flow of 5–6 L/min (126).
The Cochrane Review authors noted that RCTs thus far have included relatively few
extremely preterm infants (<28 weeks’ GA) (1). However in infants >28 weeks’ gestation
they found that HFNC resulted in a RR (95% CI) of 0.80 (0.44, 1.44) for treatment failure,
and 0.51 (0.27, 0.97) for intubation in comparison to CPAP (1). Therefore the review
concluded that post-extubation HFNC may be an appropriate therapy in this group of infants
with rescue CPAP being available (1).
The studies by Soonsawad et al (132) and Kang et al (125) reached similar conclusions as
Cochrane review. Study by Kadivar et al found a higher rate of intubation in HFNC infants
(124).

102
3.8 HFNC for Weaning from CPAP/NIV
3.8.1 Descriptive review of studies evaluating HFNC as a weaning mode
Abdel Hady et al conducted a randomised, controlled, single-centre study involving 60
preterm infants of gestational age 28 weeks and above (mean gestational age of 31 weeks and
mean birth weight of 1600 grams) (113). The infants were eligible when they were stable on
low levels of non-invasive respiratory support (CPAP 5 cmH2O and supplemental oxygen ≤
30%) (113). The two arms of the study were HFNC of 2 LPM and remaining on CPAP until
they came off supplemental oxygen (113). The primary outcome in this study was the
duration of supplemental oxygen and respiratory support (113).
The two groups had 30 infants each and were similar in study entry characteristics (113). The
CPAP group had fewer days on oxygen [median (interquartile range): 5 (1–8) vs 14 (7.5–
19.25) days, pb0.001] and shorter duration of respiratory support [10.5 (4–21) vs 18 (11.5–29)
days, p=0.03] (113). There were no differences between groups regarding success of weaning
from nasal CPAP (113). The study concluded that weaning preterm infants from nasal CPAP
to HFNC will cause increase in exposure to oxygen and longer duration of respiratory support
(113).
Badiee et al also conducted a single centre randomised controlled study involving 88 preterm
infants of gestational age 28 to 36 weeks (mean gestational age at birth of 31 weeks) who
were stable on CPAP 5cmH2O and less than 30% supplemental oxygen (114). They were
randomised to HFNC (2 L/min) or to remain on CPAP (114). The primary outcome in this
study was the duration of supplemental oxygen (114).
The mean duration of oxygen therapy (20.6 ± 16.8 h vs. 49.6 ± 25.3 h, P < 0.001) and mean
length of hospital stay (11.3 ± 7.8 days vs. 14.8 ± 8.6 days, P = 0.04) was significantly lower
in HFNC group compared to non‑HFNC group (114). However, the successful weaning rate
was similar between two groups (114). The study concluded that by using HFNC as step
down from CPAP, the duration of oxygen therapy and length of hospitalization in preterm
infants can be reduced (114).

103
Soonsawad et al conducted a single centre, randomised, controlled study involving 101
preterm infants with a gestational age of <32 weeks who met the predefined criteria of
stability for weaning off CPAP. The study groups included one group weaning by using
HFNC and the other group weaning directly from CPAP (141). The stable infants were
defined by those requiring CPAP pressures of ≤6 cm H2O and a FiO2 of ≤0.3 for at least 24
h (141). The rate of weaning in HFNC was 1 litre/min every 24 h to 2-3 litters/min depending
on body weight where <1000 grams babies 2 litres per minute and >1000 grams 3 litres per
minute and in the CPAP group rate of weaning was by reducing pressure by 1 cm H2O every
24 h until stable on CPAP 4 cm H2O (141). The HFNC or CPAP was weaned off after this
stage was reached. The primary outcome was the time it took to wean off either CPAP or
HFNC.
There were 51 infants in the HFNC and 50 infants in the CPAP group (141). There was no
difference in time to successfully wean between the 2 groups (141). Infants in the HFNC
group had significantly less nasal trauma (20% vs. 42%; p = 0.01) (141). The study concluded
that the time to wean off CPAP using HFNC was not different from when weaning directly
from CPAP (141).
Baozhi et al conducted a single centre randomised controlled study involving 82 preterm
infants of gestational age ≤34wk and birth weight ≤2000g who were ready to wean CPAP
(129). One group was HFNC and the control group received nasal cannula oxygen therapy
(129). Primary outcomes were rate of one-time successful weaning CPAP, duration of
respiratory support, weight gain rate, incidence of BPD and retinopathy of prematurity(ROP),
nosocomial infection rate and air leak after weaning CPAP (129).
They reported that one-time successful weaning CPAP and oxygen duration and respiratory
support duration were lower and weight gain rate was higher (P<0.05) in HFNC group (129).
Their conclusion was compared to nasal cannula oxygen therapy HFNC achieves higher rate
of one-time successful weaning from CPAP (129).

104
3.8.2 Results and discussion
A summary of the studies evaluating efficacy of HFNC as a weaning mode is presented in
table 13.
The earlier study by Abdel Hady used very low flow rates and unsurprisingly found babies
weaned by HFNC did worse than those by CPAP. However surprisingly subsequent study in
2015 by Badiee found favourable results for weaning by HFNC despite using similar flow
rate. The mean duration of oxygen therapy in CPAP group in the Badiee study was about 2
days compared to 5 days in the Abdel Hady study. This difference could partially be due to
shorter maintenance on CPAP after initial stabilization in the Badiee study (6 h instead of 24
h). The reduction in HFNC flow rate was faster in Badiee study (0.5 L/min every hour as
compared to 0.5L/min every 6h by Abdel Hady.
Finally, in 2016, Soonsawad study showed no difference when HFNC was used as a step
down from CPAP as opposed to weaning directly from CPAP.
Therefore, at present there is no evidence to suggest that HFNC helps in improving outcomes
when used as a weaning method from respiratory support.

105
Table 13. Summary of clinical studies comparing HFNC versus CPAP alone as weaning
from CPAP in preterm neonates
Author,
date,
Country
Study
population
Type of
study
Primary
outcome
Results Additional
information
Abdel Hady
et al(113)
2011
Egypt
60 preterm
infants
Gestational
age >28 wk
(mean 31),
mean birth
weight1600
grams
Randomized
Open label
Controlled
trial
Duration of
oxygen
requirement
Non HFNC
group had fewer
days on oxygen
and shorter
duration of
respiratory
support
HFNC flow
rate was 2
L/min with
FIO2 = 0.30
Badiee et
al(114)
2015
Iran
88 preterm
infants of
gestational
age 28 to
36 weeks
(mean 31
weeks)
Randomized
controlled
trial
The main
outcome
was the
duration of
oxygen
requirement
The duration of
oxygen therapy
and length of
hospitalization in
preterm infants
can be reduced
with weaning by
HFNC
HFNC –44
babies
CPAP – 44
babies
Soonsawad
(141)
2016
Thailand
101preterm
infants
with a
gestational
age of <32
weeks
Randomized
controlled
trial
Time taken
to wean off
the use of
the CPAP
or HFNC
devices
Time to wean off
CPAP using
HFNC was not
different from
when weaning
directly from
CPAP
Infants in the
HFNC group
had less nasal
trauma
HFNC – 51
CPAP - 50
Baozhi
(129)
2017
China
82 preterm
infants of
gestational
age ≤34wk
and birth
weight
≤2000g
Randomized
controlled
trial
Rate of
one-time
successful
weaning
CPAP
One-time
successful
weaning CPAP
was higher
O2 duration,
respiratory
support duration
was lower
Weight gain rate
was higher
(P<0.05) in
HFNC
Table 13 is a summary of clinical studies comparing HFNC versus CPAP alone as weaning
from CPAP in preterm neonates.

106
3.9 Other Clinical Outcomes with HFNC
3.9.1 Bronchopulmonary Dysplasia (BPD)
I performed a pooled analysis of the BPD data from the review of studies undertaken on two
specific indications of HFNC. The BPD rates with risk ratio when HFNC was compared to
CPAP as primary respiratory support for preterm neonate respiratory distress and a Forest
Plot analysis is shown in figure 13.
The BPD rates with risk ratio when HFNC was compared to CPAP as post extubation
respiratory support for preterm neonate respiratory distress and a Forest Plot analysis is
shown in figure 14.

107
Figure 13. Pooled estimate of BPD risk in preterm infants on HFNC compared with
other modes of NIV as primary respiratory support
Figure 13 is Forest plot analysis of BPD risk in preterm infants on HFNC compared with
other modes of NIV for primary respiratory support.
Figure 14. Pooled estimate of BPD risk in preterm infants supported post extubation on
HFNC compared with other modes of NIV
Figure 14 is a Forest plot analysis of BPD risk when HFNC is compared with other modes of
NIV in preterm infants for post extubation respiratory support.

108
When I performed a meta-analysis for the outcome BPD, comparing HFNC with CPAP, the
risk ratio was suggestive of no increased risk either when HFNC was used as primary
respiratory support [RR 1.17 95% CI (0.72, 1.90)] or as post extubation respiratory support
[RR 0.88 95% CI (0.74, 1.05)].
The Cochrane Review reported a no increased risk when compared to CPAP in the clinical
outcome of BPD (RD 0.96, 95% CI 0.78 to 1.18) from analysis of 893 infants pooled from
post-extubation studies (1).
Taha and his group conducted a retrospective data analysis from the Neonatal Database for a
5-year period from January 2008. The inclusion criteria were that babies weighing ≤ 1000 g at
birth, and having received HFNC or CPAP therapy (133). Their main objective was the rate of
incidence of bronchopulmonary dysplasia (BPD) or death in extremely low birth weight
infants who received HFNC versus CPAP (133).
In their study, 2487 infants were included with 941 in CPAP group, 333 in HFNC group, and
1546 in HFNC ± CPAP group (133). The BPD rate or mortality rate was significantly higher
in the HFNC group (56.8%) compared with the CPAP group (50.4%, P < .05) (133). This was
also seen in group receiving HFNC ± CPAP group compared with the CPAP group (133).
Hoffman et al conducted a retrospective chart review with the objective to evaluate the effect
of introducing HFNC on length of respiratory support and stay (139). They included 163
patients in 24–32 weeks’ gestation requiring mid-level support (HFNC/nasal CPAP) 1year
before and after HFNC implementation (139). Pre-HFNC group had eighty infants and the
post-HFNC group had 83 infants (139). There was a trend towards higher BPD rates in post
HFNC group whilst the rates of retinopathy of prematurity was significantly higher (139). The
post-HFNC subjects had longer duration of non-invasive respiratory support (139). They
concluded that HFNC introduction was significantly associated with a longer duration of non-
invasive respiratory support in addition to being associated with increased retinopathy of
prematurity rates (139).
There are methodological weaknesses in these studies. They have differing demographics in
infants treated with HFNC, inconsistencies in the definition of BPD, and changes in practice
during the study period and selection bias associated with any retrospective study (142).

109
Therefore, it is not possible to make firm conclusions regarding association or causation of
HFNC therapy and BPD.
3.9.2 Mortality
In this review, the mortality outcome showed no significant increased risk when HFNC was
compared to CPAP. This was seen when HFNC was used as post extubation respiratory
support [RR 0.62 95% CI (0.28, 1.39)] as well as when used as a primary respiratory support
[RR 0.61 95% CI 0.08, 4.57)]. (See Figures 15 and 16)
There was no statistically significant difference in the rate of deaths in the group of preterm
infants randomly assigned to receive HFNC compared with other NIV in an earlier systematic
review involving 922 infants (OR: 0.48 [0.18 to 1.24]) (110)

110
Figure 15. Pooled estimate of risk of death in preterm infants on HFNC compared with
other modes of NIV as primary respiratory support
Figure 15 shows Forest plot analysis of risk of death in preterm infants on HFNC compared
with other modes of NIV as primary respiratory support.
Figure 16. Pooled estimate of risks of death in preterm infants supported post
extubation on HFNC compared with other modes of NIV
Figure 16 shows Forest plot analysis of mortality risk with HFNC versus other NIV modes for
post extubation respiratory support in preterm infants
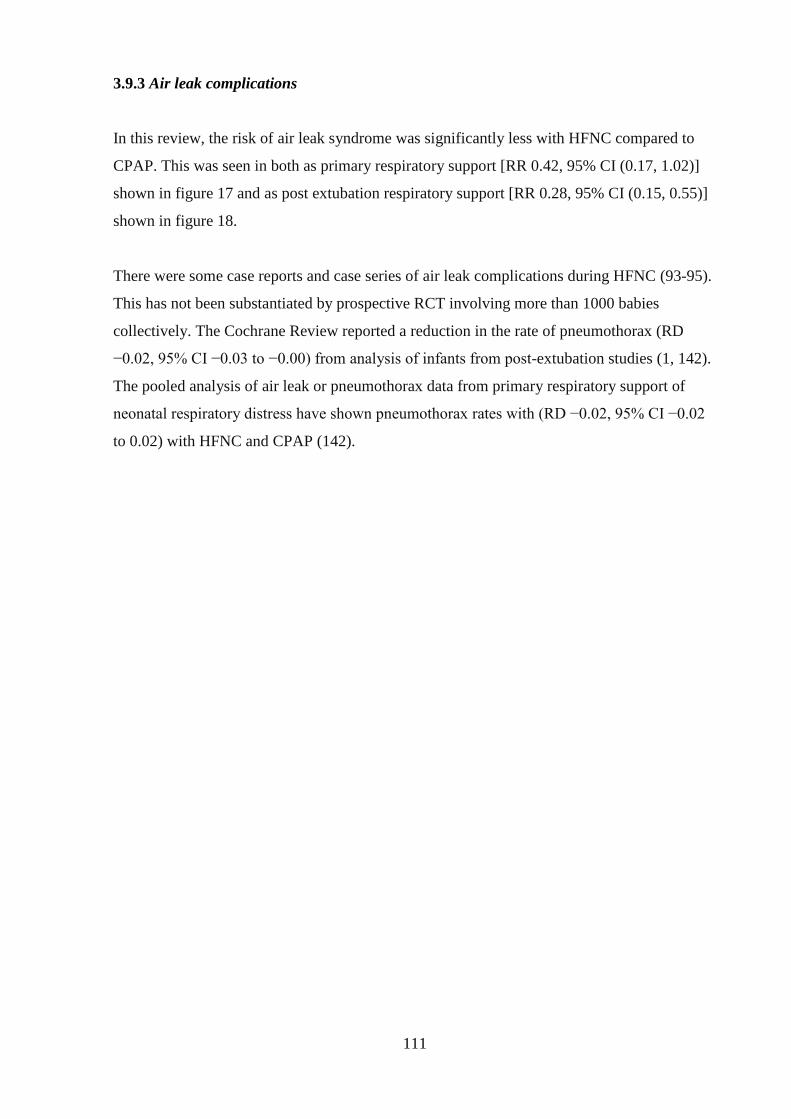
111
3.9.3 Air leak complications
In this review, the risk of air leak syndrome was significantly less with HFNC compared to
CPAP. This was seen in both as primary respiratory support [RR 0.42, 95% CI (0.17, 1.02)]
shown in figure 17 and as post extubation respiratory support [RR 0.28, 95% CI (0.15, 0.55)]
shown in figure 18.
There were some case reports and case series of air leak complications during HFNC (93-95).
This has not been substantiated by prospective RCT involving more than 1000 babies
collectively. The Cochrane Review reported a reduction in the rate of pneumothorax (RD
−0.02, 95% CI −0.03 to −0.00) from analysis of infants from post-extubation studies (1, 142).
The pooled analysis of air leak or pneumothorax data from primary respiratory support of
neonatal respiratory distress have shown pneumothorax rates with (RD −0.02, 95% CI −0.02
to 0.02) with HFNC and CPAP (142).

112
Figure 17. Pooled estimate of risk of air leak complications in preterm infants on HFNC
compared with other modes of NIV as primary respiratory support
Figure 17 shows estimate of risk of air leak complications in preterm infants on HFNC
compared with other modes of NIV as primary respiratory support.
Figure 18. Pooled estimate of risk of air leak complications in preterm infants supported
post extubation on HFNC compared with other modes of NIV
Figure 18 shows risk of air leak complications in preterm infants supported post extubation on
HFNC compared with other modes of NIV.

113
3.9.4 Patient Comfort
In a randomised, crossover comparison of 24 h of treatment with CPAP or HFNC, followed
by 24 h of the alternative therapy in infants with mild respiratory illness, patient comfort was
the primary outcome. The study concluded that the parents preferred HFNC, but there were
no significant differences in a patient comfort score (137).
Preterm infants are thought to be more comfortable on HFNC compared with CPAP by
neonatal nurses (91).
In an observational cross-sectional study, 60 preterm infants, received CPAP (n=37) and
HFNC (n=23)(138). Pain response was assessed using Premature Infant Pain Profile (PIPP),
duration of first cry and salivary-cortisol concentrations (138). They reported PIPP scores
were significantly higher in the CPAP compared with HFNC group and no infants in HFNC
group had severe pain defined by PPP score >12 and salivary cortisol levels were higher in
CPAP group (138). A lower incidence of cry was observed for infants in the HFNC group
compared with the CPAP group (138). In addition, the respiratory rate was significantly lower
with HFNC (138).
3.9.5 Nasal trauma
The risk of nasal trauma was significantly less when HFNC was compared with CPAP either
as primary respiratory support [RR 0.50 95% CI (0.34, 0.72)] as shown in figure 19 or as post
extubation respiratory support [RR 0.50 95% CI (0.40, 0.61)] as shown in figure 20.
This is consistent with other reviews performed with earlier studies up to and including from
2016 (1, 110). Nasal trauma was less common in HFNC group infants than infants treated
with control (CPAP, SIPPV) means of respiratory support in majority of the studies including
Nair (140), Iranpour (122), Collins (96), Manley (98), Yoder (97) and Mostafa-Gharehbaghi
(128) and Soonsawad (132) but no difference was seen in two studies Liu (111) and
Kugelman (126).
An earlier meta-analysis of HFNC versus CPAP to prevent extubation failure with secondary
outcome as nasal trauma showed a RR 0.64 (95% CI of 0.51-0.79) (1).

114
Collins et al devised a nasal trauma score in a randomised controlled study comparing infants
extubated to either HFNC or nasal CPAP (118). These infants were preterm <32 weeks’
gestation (118). The HFNC device used was Vapotherm and infants receiving this therapy
used Sticky Whiskers type of nasal dressing and infants receiving nasal CPAP used either
Sticky Whiskers or Cannualaide type of nasal dressings (118). The nasal trauma score
consisted of six sites looking for erythema, bleeding or ulceration and were recorded three
times daily during the first 7 days post extubation (118). The sum of these 21 scores was
compared between the two groups. The scores in HFNC group (2.8 with SD 5.7) was much
less compared to CPAP (11.7 with SD 10.4) group (118). They concluded that HFNC causes
less nasal trauma compared to CPAP in the first 7 days post-extubation (118).

115
Figure 19. Pooled estimate of risk of nasal trauma in preterm infants on HFNC
compared with other modes of NIV as primary respiratory support
Figure 19 shows risk of nasal trauma in preterm infants on HFNC compared with other modes
of NIV as primary respiratory support.
Figure 20. Pooled estimate of risk of nasal trauma in preterm infants supported post
extubation on HFNC compared with other modes of NIV
Figure 20 shows estimate of risk of nasal trauma in preterm infants supported post extubation
on HFNC compared with other modes of NIV.

116
3.10 Discussion
3.10.1 Efficacy of HFNC
In their review on HFNC, Kotecha et al equated the efficacy of HFNC to failure of therapy as
defined by the authors (110). They conducted their analysis with focus on HFNC as a primary
mode of respiratory support as well as a post extubation respiratory support.
They included four studies involving 321 preterm infants (97, 143-145) comparing HFNC
with other NIV as a primary mode of respiratory support. The OR for failure of therapy was
1.02 (95% CI: 0.55 to 1.88). Since Kugelman et al study compared HFNC with NIPPV,
excluding this yielded OR of 1.12 (0.51 to 2.50) (110).
In this review, I included a large multicentre RCT (130) and a smaller study (131) published
later thereby increasing the number of preterm babies in the analysis. A total of 1227 preterm
babies distributed evenly in two arms of HFNC and CPAP were analysed.
When HFNC was compared with CPAP as a primary respiratory support mode in preterm
neonatal respiratory distress there was increased risk of treatment failure as shown in the
Forest plot figure 10 with RR 1.57 95% CI (1.20, 2.05)].
When larger number of babies including the later studies are included, the balance shifts
towards CPAP favouring CPAP as a mode of respiratory support shows lesser risks of failure
of therapy. This is consistent with the meta-analysis presented by Roberts et al excluding the
relatively smaller Shin et al study (131, 142).
Thus for practical application, primary mode of respiratory support in RDS the findings of
Kotecha et al study is being challenged by the higher risks of failure found in this review
(110).
Similar to Kotecha et al study, the Cochrane review in 2016 presented their meta-analysis
from studies up to 2016 (1, 110). They found a cumulative risk ratio of 1.30 (0.73, 2.34)
based on 439 patients from 3 trials with 211 patients in HFNC arm and 228 patients in CPAP
arm (1). They concluded that for preterm infants needing primary respiratory support after
birth, there were no differences in the rates of primary or secondary outcomes between HFNC
and CPAP (1).

117
The Cochrane review (1) had only half the numbers of Lavizzari et al (127) study published
by Ciuffini et al prematurely whereas Kotecha et al (110) does not have the numbers from the
later Shin et al (131) and Roberts et al (130) studies. These later studies are larger, more
rigorous in terms of statement of criteria for treatment interventions and were pre-registered
as clinical trials reducing the reporting bias.
In this review, when HFNC was compared with NIPPV as a primary respiratory support
mode, there was no significant increased risk of treatment failure, RR 0.85 95% CI (0.44,
1.65).
Cochrane review took into account data from one study and reported that there was no
difference between HFNC and NIPPV in rates of treatment failure, death or CLD (1, 126).
Also, from the same study it was noted that infants randomised to HFNC spent a longer
period of time receiving non-invasive respiratory support (median 4 days vs median 2 days, P
< 0.01) (1, 126).
Since then there has been one more study from 2016 which did not find any further
differentiating data with regards to primary outcome of treatment failure as defined by the
study (123).
There was no separate analysis of HFNC versus NIPPV as a primary mode of support in
Kotecha et al paper (110). However they did include Kugelman et al study (143) for pooled
analysis of estimation of odds of failure of therapy as a primary mode of respiratory support.
As a post extubation respiratory support mode HFNC when compared to CPAP in a total of
661 babies in three studies (96, 97, 146), Kotecha et al (110) found odds of failure of
treatment of 1.09 (0.58 to 2.02). This means HFNC and CPAP showed no difference in risk of
failure. In this review, a total of eleven studies containing 1513 babies showed that HFNC
resulted in a RR (95% CI) of 1.09 (0.90, 1.31) for treatment failure when compared to CPAP
when used as a post extubation respiratory support mode. This is similar to Cochrane review
where treatment failure with HFNC as defined by the studies was similar to CPAP (1).

118
The earlier studies included in Kotecha et al review are varied in methodology, performed in
different clinical settings and different levels of flow have been utilized (110, 126). For
example, Yoder et al (97) used initial flows based on infants’ weight (3 L/min for 1,000–
1,999 g, increased by a maximum of 3 L/min) whereas Collins et al (96) used an initial flow
of 8 L/min and Manley et al (146) used an initial flow of 5–6 L/min (126). These
methodological inconsistencies continue in the later studies included in this review as well.
Unlike the studies included in Kotecha et al review, a study by Kadivar et al, included in this
review found a higher rate of intubation in HFNC infants (110, 124).
The Cochrane Review authors noted that RCTs thus far have included relatively few
extremely preterm infants (<28 weeks’ GA) (1). This finding is echoed in the paper by
Kotecha et al as well and they concluded that no recommendations can be made in extremely
premature babies as there have been no significant studies including these babies (110).
However in infants >28 weeks’ gestation they found that HFNC resulted in a RR (95% CI) of
0.80 (0.44, 1.44) for treatment failure, and 0.51 (0.27, 0.97) for intubation in comparison to
CPAP (1). Therefore the review concluded that post-extubation HFNC may be an appropriate
therapy in this group of infants with rescue CPAP being available (1).
In this review three studies arrive at different conclusions in terms of efficacy of HFNC as a
weaning mode. The Abdel Hady study (147) found babies weaned by HFNC did worse than
those weaned by CPAP whereas study by Badiee et al (148) found the opposite. More
recently study by Soonsawad et al study (141) showed no difference when HFNC was used as
a step down from CPAP as opposed to weaning directly from CPAP. The Kotecha et al paper
did not analyse this aspect of HFNC use (110).
Therefore, at present there is no evidence to suggest that HFNC helps in improving outcomes
when used as a weaning method from respiratory support.
3.10.2 Other clinical outcomes
In this review looking at the BPD outcome, comparing HFNC with CPAP, the risk ratio was
suggestive of no increased risk either when HFNC was used as primary respiratory support
[RR 1.17 95% CI (0.72, 1.90)] or as post extubation respiratory support [RR 0.88 95% CI
(0.74, 1.05)].

119
Kotecha et al review had a total of 932 infants in the studies having data on BPD outcome
with OR of 0.93 (CI 0.67 to 1.28) showing they were comparable in two groups (110).
The Cochrane Review reported a no increased risk when compared to CPAP in the clinical
outcome of BPD (RD 0.96, 95% CI 0.78 to 1.18) from analysis of 893 infants pooled from
post-extubation studies (1).
In this review, the mortality outcome showed no significant increased risk when HFNC was
compared to CPAP. This was seen when HFNC was used as post extubation respiratory
support [RR 0.62 95% CI (0.28, 1.39)] as well as when used as a primary respiratory support
[RR 0.61 95% CI 0.08, 4.57)].
Similarly, there was no statistically significant difference in the rate of deaths in the group of
preterm infants randomly assigned to receive HFNC compared with other NIV in an earlier
systematic review by Kotecha et al involving 922 infants (OR: 0.48 [0.18 to 1.24]) (110)
In this review, the risk of air leak syndrome was significantly less with HFNC compared to
CPAP. This was seen in both as primary respiratory support [RR 0.42, 95% CI (0.17, 1.02)]
and as post extubation respiratory support [RR 0.28, 95% CI (0.15, 0.55)].
Similarly, Kotecha et al (110) reported no increased odds of air leak with HFNC in their
pooled data with total of 992 infants with OR of 0.72 (CI 0.28 to 1.83).
There were some case reports and case series of air leak complications during HFNC (93-95).
This has not been substantiated by prospective RCT involving more than 1000 babies
collectively. The Cochrane Review reported a reduction in the rate of pneumothorax (RD
−0.02, 95% CI −0.03 to −0.00) from analysis of infants from post-extubation studies (1, 142).
The pooled analysis of air leak or pneumothorax data from primary respiratory support of
neonatal respiratory distress have shown pneumothorax rates with (RD −0.02, 95% CI −0.02
to 0.02) with HFNC and CPAP (142).

120
3.10.3 Safety and comfort
The patient comfort scores have been reported variably in different studies (149, 150).
However preterm infants are thought to be more comfortable on HFNC compared with CPAP
by neonatal nurses (91) and parents (149).
The risk of nasal trauma was significantly less when HFNC was compared with CPAP either
as primary respiratory support [RR 0.50 95% CI (0.34, 0.72)] or as post extubation respiratory
support [RR 0.50 95% CI (0.40, 0.61)].
This is consistent with other reviews performed with earlier studies by Kotecha et al and
Cochrane review (1, 110). Collins et al devised a nasal trauma score in a randomised
controlled study comparing infants extubated to either HFNC or nasal CPAP (118). They
concluded that HFNC causes less nasal trauma compared to CPAP in the first 7 days post-
extubation (118).
3.11 Summary of descriptive review of studies evaluating clinical efficacy of HFNC
HFNC therapy results in less risk of nasal trauma and air leak complications irrespective of
whether it is used as primary support or as post extubation support. However, when it is used
as primary respiratory support in preterm babies with RDS, more babies will end up meeting
failure criteria and need intubation or other forms of escalation of respiratory support
compared to CPAP. The same outcome is equivocal when two small studies are reviewed
together comparing HFNC with NIPPV. There is no difference between HFNC and CPAP
when used as post extubation support and in BPD and mortality outcomes. There are
equivocal results from the three studies that examined whether HFNC improves outcomes if
used as a weaning mode instead of weaning on CPAP.

121
Chapter 4. Materials and Methods

122
4.1 Study Design Development
The study design was developed after undertaking a review of high flow therapy in infants(2)
and conducting a retrospective neonatal data base study of use of HFNC in local neonatal unit
(153).
The study protocol was internally peer reviewed followed by an external peer review process.
My research team held consultations with neonatal nurses, parents and neonatal medical staff.
The ideas and current knowledge about safe margins of therapy and applicability of study
pathway in the protocol was discussed in formal meetings within the neonatal unit.
4.1.1 Study protocol
I developed the full study protocol for a comprehensive evaluation of respiratory physiology
during high flow therapy. A copy of the full study protocol is in Appendix number 1.
The study had two phases- initial proof of concept phase to identify reliable, feasible, safe and
repeatable methods of measuring various respiratory parameters. The second phase involves
larger number of babies. The study was registered in Clinical Trials Registry, Number:
NCT02200900.
4.2 Ethics Approval
I submitted a detailed ethics application through the IRAS platform for submission of clinical
trials in United Kingdom. The IRAS application document is attached in Appendix number 2.
I presented the study to ethics committee along with the study Chief Investigator. I prepared
the answers for the queries posed by all members of the Ethics committee including medical,
research and lay representatives.
I made the required changes to the protocol and resubmitted to Ethics committee and received
the approval with approval number14/NE/0093. A copy of the ethics approval is attached in
appendix number 3.

123
4.3 Informed Consent
I obtained informed written consent from parents after giving them a full verbal and written
explanation of the study. In addition, the attending clinical team was also available to meet
with the parents during the intervention period to ensure that they understood the study
procedures and continue to consent to participate in the study.
Some preliminary written and verbal information was, whenever possible, offered to the
parents when the baby was likely to be eligible. Additional information was also given once
the baby was stable on non-invasive respiratory support.
A copy of the Participant Information Sheet has been presented in appendix number 4.
Further information about the study continued to be given to parents as and when they
requested it after the baby was enrolled into the study. They were also offered an early
appointment with the senior clinician responsible for the baby’s care so they could discuss
participation in greater detail. It was made clear to the parents that they remained free to
withdraw their baby from the study at any time but if they did withdraw their baby, we would
ask them for consent to analyse the data that has been already collected.
Information about the study was continued to be offered to parents after their baby left the
neonatal unit.
4.4 Selection and Withdrawal of Study Participants
In this proof of concept study, 6 infants were recruited and underwent measurements for the
study. In the next stage, approximately 45 babies would be recruited for the study.
4.4.1 Inclusion criteria
Infants were eligible if:
1. They were less than 37 weeks’ gestation at birth
2. Were on non-invasive respiratory support and
3. The parent(s) were given written informed consent to their baby’s participation

124
4.4.2 Exclusion criteria
1. Infants who were clinically unstable and unsuitable for non-invasive respiratory support as
judged by attending neonatology consultant clinician.
The infant must be clinically stable for preceding 12 hours on non-invasive respiratory
support. Indications of clinical stability were,
Stable FiO2 requirement in the previous 12 hours – The FiO2 has not increased more
than 0.2 from baseline
Tolerating feeds
Stable observations including heart rate (100-180 per minute), respiratory rate (30-60
per minute), temperature (36.5- 37.5oC)
No signs of infection – evidence of blood culture positive infection and or treatment
for active infection
2. Participation in a concurrent study that prohibits inclusion in other trials
3. Known major upper airway, lower respiratory tract, cardiac or gastrointestinal tract
anomaly
4. Co-existing complications such as pneumothorax.
4.4.3 Withdrawal of participants
Babies could be withdrawn for any of the reasons detailed in the discontinuation criteria. The
reason for withdrawal was recorded on the data collection form.
4.5 Baseline Assessments
For eligible babies, clinical details were collected at study entry. This included details to
confirm eligibility including gestational age, type of respiratory support, and clinical stability
over the previous 12 hours and confirmation of a signed parental consent form. (See
Appendix 5 for a copy of consent form)

125
4.6 Details of Study Design and Procedures
This was a randomised, crossover study. I performed the proof of concept phase with the
following study design. A larger study followed the same protocol and methods after
completion of first phase. The study procedures are summarised in figure number 21 and
described in more detail in subsequent sections.

126
Figure 21. HFNC Study Flow Chart
Randomisation
Group 1
Group 2
Babies less than 37 weeks gestation
Exclusion criteria:
1. Clinically unstable for
NIV support
2. A concurrent study that
prohibits participation.
3. Current complications
like pneumothorax.
4. Known major upper
airway, lower respiratory
tract, gastrointestinal tract
or cardiac anomalies.
RECRUIT-
MENT
STAGE
Inclusion criteria:
1. NIV support - on CPAP or HFNC
2. Age >5 days
Measurements
Nasopharyngeal pressures
O2 & CO2 concentrations
TOSCA CO2 reading
Tidal breathing indices
Exit criteria
Inadequate ventilation -
(pH <7.20 and pCO2 >10
kPa)
Inadequate oxygenation –
(FiO2 >0.6 and/or increase
in FiO2 of 0.2 from
baseline to maintain SpO2
>91%)
Recurrent unprovoked
apnoea requiring
intervention (not self-
resolving) or one major
apnoea requiring mask
ventilation
CPAP 6cm H2O
HFNC 8 LPM
HFNC 7 LPM
HFNC 6 LPM
HFNC 5 LPM
HFNC 4 LPM
HFNC 3 LPM
HFNC 2 LPM
HFNC 8 LPM
HFNC 7 LPM
HFNC 6 LPM
HFNC 5 LPM
HFNC 4 LPM
HFNC 3 LPM
HFNC 2 LPM
CPAP 6cm
H2O
Back on original support
CPAP or HFNC
MEASURE-MENT
STAGE
RANDOM-
ISATION
STAGE
0-30
30-40
40-50
50-60
60-70
70-80
80-90
90-120
Time
Minutes
0-30
30-60
60-70
70-80
80-90
90-100
100-110
110-120
Time
Minutes

127
4.7 Description of Study Interventions
Non-invasive respiratory support was given to preterm babies where clinically indicated by
the clinical team. The device used were the standard devices used in participating neonatal
unit (Fabian therapy, ACUTRONIC Medical Systems AG). The baby was given non-invasive
respiratory support either by HFNC or CPAP as deemed appropriate by the attending
clinician. The standard neonatal policy (See Appendix 6) in maintaining baby’s oxygen
saturations and clinical stability were followed.
The interventions were studied for total of about two hours as described below. After this
time, the baby was returned to the non-invasive support that was originally administered by
the clinical team.
The internal nare diameter was measured with a tape measure. The nasal cannula outer
diameter was obtained from product information on the cover provided by the manufacturer.
The ratio of nasal cannula to nare diameter was documented.
4.8 Airway pressure measurement – Gaeltec Catheter Tip Pressure Transducer
There are different types of catheter tip pressure transducers used in the medical field.
Gaeltec, Brown Medical Systems and Millar Instruments are some of the leading
manufacturers I tested a Gaeltec catheter (Gaeltec, Dunvegan, UK) with transducer mounted
at the tip to assess whether it was suitable for measurement of airway pressures. The Gaeltec
Catheter tested by us is shown in figure 22.

128
Figure 22. Gaeltec catheter tip pressure transducer
The Figure 22 shows the image of the Gaeltec catheter with catheter tip mounted transducer,
catheter with cm markings and a connector assembly containing one tube with Luer lock end
for gas analysis and the other containing electrical connection components to connect to the
amplifier.
A – Electrical connection
assembly
B – Pressure transducer
C – Gas sampling channel
D – cm markings

129
4.8.1 Gaeltec catheter tip pressure transducer
The Gaeltec catheter measures pressure at the site of catheter placement where the sensor is
located at the distal tip of the catheter. The sensor is mounted on the side wall at the distal tip
of the catheter.
The Gaeltec catheters have the following parts -
Sensor assembly
Connector assembly
Silicone catheter with customised markings as needed
Customised additional channel if needed – As I needed an additional channel for
sampling nasopharyngeal air the company manufactured a custom made catheter with
a small channel with additional port with leur lock connection at the other end.
The sensor was a resistive strain gauge type (55). This element was mounted in a catheter wall
close to the tip as shown in figure 23.
The sensor has a metal diaphragm which is very thin and works as a resistive strain gauge
membrane and is housed in the catheter in a unique arrangement. There is an atmospheric
reference pressure channel that connects the back of the sensing area to the ambient air
pressure via a hole in the connector. Therefore, all measurements are differential with respect
to ambient air.
Apart from the sensor assembly, the catheter has a connector component. This has passive
components to complete a full Wheatstone bridge circuit. This also has temperature
compensation and a bridge balance network. Together, this connector assembly can be
connected to most strain gauge amplifier systems. I used the Gaeltec S7d 4 channel amplifier.
It is important that these amplifiers provide electrical isolation. The amplifier must be patient
isolated. These pressure sensors require an excitation voltage of 1V or less DC or 5V r.m.s or
less AC to avoid electrical damage when in use.

130
Figure 23. Catheter tip pressure transducer with strain gauge sensor at the tip
The Figure 23 shows the sensor assembly (marked with arrow A) of the Gaeltec catheter. The
sensor assembly as a silicon layered strain gauge component (marked with arrow C) an
opening for the gas channel (marked with arrow B). The cm marking is shown with arrow D
with first marking 3 cm from the tip of the catheter.
A – Pressure transducer
sensor assembly
B – Gas sampling channel
opening
C –Strain gauge
component
D – cm markings

131
4.8.2 Dimensions
The Gaeltec catheter CTO-L1 and CTO-L2 are general purpose catheters. The total length of
the catheter was 76 cm measuring from the tip to the connecter assembly shoulder. The
transducer assembly was located at the sidewall close to the tip of the catheter. There were
markings at 1cm intervals from the tip of the catheter for measuring length of insertion.
I used the endoscope cleaning suite at the hospital for sterilisation of the catheter following
use. The catheter is designed for multiple use and it was clearly critical to avoid any risk of
cross infection. I extrapolated the cleaning process for bronchoscopes and liaised with the
endoscopy cleaning service to set up a protocol to ensure there was no risk of cross infection.
The catheter connector assembly part was protected by sealing with a silicone rubber cap
provided by the company. This was done to prevent liquid from entering the small
atmospheric reference pressure hole in the centre of the pins on the plug of the connector
assembly. If liquid enters this channel then sensor may be permanently damaged and also will
not be able to function as a differential transducer in relation to atmospheric pressure.
4.8.3 Storage, safety and standards certification
The catheter was stored in a plastic, crush proof transducer box and sent to cleaning and
sterilisation in a transparent, plastic box labelled with date and time. The catheter like most
medical equipment was subjected to The Health and Safety at Work Act (1974) and the
Control of Substances Hazardous to Health (COSHH) regulations (1988). This means that
equipment needs to be sterilised after use and used as per instructions for the safety of
personnel handling it and patients in whom it is being used. CE 0120 EC Certificate was in
place with full quality assurance system, Certificate GB 12/86323 and Gaeltec devices limited
was assessed and certified as meeting the requirements of Directive 93/42/EEC on Medical
Devices for medical pressure transducers.
4.8.4 Catheter assembly
This type of catheter needs an amplifier to process the transducer signals into readable
analogue form as seen in figure 24.

132
Figure 24. Catheter tip pressure transducer assembly with amplifier in series
Figure 24 shows the amplifier (marked with arrow A) connected to the Gaeltec catheter. The
sensor assembly (marked with arrow C) is located at the tip of the catheter and its signals are
transferred as analogue output via the connector assembly (marked with arrow B)
A – Amplifier
B – Connector assembly
C – Sensor assembly

133
4.8.5 Amplification
I used the Gaeltec S7d a general-purpose amplifier for interfacing Gaeltec Pressure
Transducers to the AD instruments chart recorder (analogue device) for recording the pressure
data.
This was a 4-channel device powered by a low voltage mains adaptor and it has a single
output port for connection to the host device and a single input port for pressure transducer
connection and also has a LCDE display for use during setup and configuration. It has
electrical isolation with protection up to 5000 volts between the pressure transducer connected
to a patient and the host analogue device. It was cleaned by alcohol wipes after each study. It
was stored in normal environmental temperature, range between 5˚C and 30˚C.
4.8.6 Calibration
The transducer sensor is placed inside a calibration chamber provided by Gaeltec as shown in
figure 25. This has a sealing compressible grommet that forms an airtight seal around the
catheter.
The calibration involves 2 stages,
First, the Gaeltec S7d amplifier is calibrated followed by connecting to the host analogue
device (Power lab, AD instruments, Oxford, UK) and calibrating to the likely range of
pressures to be measured.
The following steps are followed for the Gaeltec S7d amplifier calibration, Firstly, the
transducer is connected to amplifier and the transducer sensor was placed and sealed inside
the calibration chamber and then the calibration chamber was connected to the manometer
and left open to atmosphere. Then the host analogue device was connected to the amplifier
(S7d). Finally, mains connection was done via adaptor. The second step was to switch the
amplifier (S7d) on followed by zeroing all the inputs followed by zeroing the selected channel
input. The last step was amplifier calibration to the desired range of pressures. I used 2-point
calibration to calibrate to ‘0’ and ‘20’ cm H2O pressures.

134
Figure 25. Schematic diagram and catheter mounted pressure transducer calibration
Figure 25 shows the schematic diagram of catheter mounted pressure transducer calibration.

135
4.8.7 Linearity
The linearity refers to the straightness of the output signal at various equally spaced pressure
points applied in an increasing direction.
According to the manufacturers, Gaeltec catheters should have linearity when used within the
pressure ranges of 0- 300 mm Hg. The reported linearity and hysteresis error is ±1% FS BSL
(Full Scale or Full Span stands for the difference between the lowest and highest measured
point and BSL stands for Best Straight Line, a virtual line derived from a set of non-linear
points).
I tested the linearity for the air-way pressure range that is likely to be seen in preterm infants
against a known source of pressure delivered by a CPAP machine (B&D Electro medical,
Stratford-upon-Avon, UK) as control. The CPAP machine pressures were cross checked
against a water manometer to confirm accuracy and linearity. The trend was linear and CPAP
and water manometer recorded pressures were the same. This is shown in figure 26.
. Then I tested the linearity of the two Gaeltec catheters by comparing them with CPAP
delivered pressures. Both catheters had pressure measurements difference of up to 1.3 cm H20
pressure in either direction compared to the control. This is shown in the figures 27 and 28.
The difference between two measures (Gaeltec catheter versus the control) on Y axis was
plotted against the mean of the two measures.

136
Figure 26. Linearity of the CPAP pressure checked with water manometer
Figure 26 shows linearity and accuracy of CPAP machine when a series of pressures were
plotted against the water manometer.

137
Figure 27. Linearity of the Gaeltec Catheter Tip Pressure transducer – CTO- L1 against
the control (Bland Altman plot)
Figure 27 shows the difference between the two pressures on Y axis plotted against the mean
of the two measures along the X axis with Gaeltec catheter CTO-L1.
-15
-10
-5
0
5
10
15
Dif
fere
nce
bet
wee
n t
he
two m
easu
res
cm
H2O
Mean of the two measures cm H2O
Gaeltec-1
Lower LOA
Upper LOA
Bias

138
Figure 28. Linearity of the Gaeltec Catheter Tip Pressure transducer – CTO- L2 against
the control (Bland Altman plot)
Figure 28 shows the difference between the two pressures on Y axis plotted against the mean
of the two measures along the X axis with Gaeltec catheter CTO-L2.
-15
-10
-5
0
5
10
15
Dif
fere
nce
bet
wee
n t
he
two m
easu
res
cm H
2O
Mean of the two measures cm H2O
Gaeltec -2
Bias
Lower LOA
Upper LOA

139
4.8.8 Frequency response
The manufactures report excellent frequency response since the sensor and catheter assembly
is small in size. The frequency response of the pressure measurement instruments may
degrade when additional equipment or catheters are connected in series. I tested the frequency
response for the measuring unit with nasopharyngeal catheter attached to the amplifier.
The frequency range of airway pressure wave signal is influenced by the breathing frequency.
Small mammals or preterm neonates, when in respiratory distress can have respiratory rate in
the range of 60-120 breaths per minute. This gives a frequency range of 1-2 Hz (Frequency in
Hz = number of cycles/60 seconds). In order for the measurement systems to have adequate
frequency response, they should be able to measure up to four times the normal frequency of
the study population. For example, in neonates with frequency of 1-2 Hertz, the measurement
systems should have a frequency characteristic of at least 4-8 Hertz.
Frequency response of the pressure measuring systems was tested by ‘pop test’. In this test an
inflated balloon is fitted over the pressure sensor and then burst, producing a sudden drop in
input signals to the system(154). The time taken 10 to 90% of pressure change was noted
from the laptop reading the electronic chart recorder data. Fourier transformation equation
(fbw = (1/3Tr where Tr is in milliseconds) was used to calculate the frequency response of the
system being checked, where fbw is the frequency response and Tr is the time taken for the
pressure change from 10 to 90% of the final resting pressure.
The response to an instantaneous change in pressure was recorded on a laptop computer using
electronic chart recorder software (Power lab 16/35, AD instruments, Oxford, UK).
The frequency response for airway pressure measurement included the airway pressure
transducer, the connecting tubing (in case of B&D differential transducer and Thermal sensor
transducer) and the amplifier (in case of Gaeltec catheter tip pressure transducer).
The frequency response of the Gaeltec catheter tip pressure transducer (CTO-L1) and the
amplifier was measured with the above technique and showed a 10-90% response time of 75
milliseconds giving frequency response of 4.4 Hertz. A second catheter set was also tested
(CTO-L2) which had response time of 63 milliseconds which equates to frequency response
of 5.2 Hertz.

140
This was less than that reported by manufacturers as well as in other studies that used similar
catheter systems (39, 155).
4.8.9 Stability
According to manufacturers, the Zero drift factor is typically less than 1mmHg over 24 hours.
This amounts to about 1.35 cm H2O pressure. This can be considered as a significant pressure
difference particularly in a very small premature baby. I performed stability of pressure
readings over a period of time with 2 sets of Gaeltec catheters. The catheter tip with
transducer was kept in the Gaeltec calibration tube. After calibration of the pressure
transducer, different pressures were delivered to the calibration tube from the CPAP machine
(B&D Electro medical, Stratford-upon-Avon, UK). The resulting analogue output from the
transducer was recorded continuously on an electronic chart recorder (Power lab, AD
instruments, Oxford, UK). The drift from baseline was noted over a period of 2 hours. The
stability was ±1.3 cm H2O off baseline at lower pressures (3-6 cm H2O) and about ±0.3 cm
off baseline at 20 cm H2O pressures.
4.8.10 Factors influencing catheter performance
According to manufacturers the catheter has a life of at least 10 years. However, this is
affected by the care taken during its use. The catheter tip transducer system is affected by
extreme pressures, thermal stress and if any liquid enters the channel communication between
atmosphere and sensor chamber.
4.8.11 Description of airway pressure measurement with Gaeltec Catheter
A catheter (Gaeltec Devices Ltd, Dunvegan, UK) with pressure transducer and port for gas
sampling at the tip was placed at the nasopharynx or oropharynx by using standard
measurement for placing nasopharyngeal airways(27, 29). Distance between nare of the nose
to tragus of ear was measured with a measuring tape. The nasopharyngeal catheter was
introduced to about 1 cm less than this measurement to ensure adequate placement in
nasopharynx and to avoid gagging or undue stimulation of cough reflex (27, 29). This was
connected to an O2 and CO2 analyser (AD instruments Gas analyser) and electrically isolated
excitation amplifier to measure pressure. Where possible this was timed to coincide with

141
routine replacement of the feeding tube which was facilitated at the conclusion of the
study. The pressure recording was done when mouth was passive and also with mouth closed
gently with a finger pressing on the chin.
4.8.12 Results of Gaeltec catheter pressure measurement
Nasopharyngeal pressure measurement was tried in two babies (Study ID 01 and 02) with
Gaeltec catheter tip transducer. No accurate, acceptable airway pressure profile was obtained
in both these measurements.
The catheter however allowed sampling for airway gas concentration measurement.
4.8.13 Summary of catheter mounted pressure transducer
The catheter tip pressure transducer is an attractive option to measure airway pressures and
has been cited as practical in a number of published series. The manufacturer also felt it was
suitable for use in infants and that it would be capable of measuring pressures typical for a
child on respiratory support. The ability to measure pressure at the desired location in the
airway without being affected by gravity and also any movement of the patient is attractive.
However, the device is manufactured for a wide range of pressure measurement and its
applicability to measure a small range of pressure at the lower end of its range is suspect. The
stability of the measurements is another factor which needs to be more stable. Despite
previous published work my investigations have shown this technology lacks the necessary
accuracy and stability for use in small infants. Results from previous published series using
this technique need to be interpreted with caution.

142
4.9 Airway Pressure Measurement - Thermal Sensor Pressure Transducer
4.9.1 Introduction
Thermal sensor pressure transducers work on a different principle to differential pressure
sensors and find application in medical, automobile and other precision industries. They are
small in size and have signal-conditioning circuit on a single microchip. There are different
manufacturers (examples: Sensirion AG, Switzerland and First Sensor AG, Berlin, Germany).
There are a range of products and a transducer suitable for the pressure range likely to be seen
in this study is shown in figure 29. This device comes with a sensor component which is
combined with the analogue and digital signal processing circuit on a small silicon chip.

143
Figure 29. Example of a Thermal micro sensor pressure transducer
Figure 29 shows the thermal micro sensor pressure transducer and its constituent parts. The
micro sensor is housed in a case (marked with arrow B) and is powered by an AC adopter
(marked with arrow D). The gas flow ports Hi and Lo are indicated (arrow marked C) and the
output is via BNC connector (marked with arrow A)

144
4.9.2 Measuring principle of a thermal flow sensor
The microchip has a heating element. This releases heat into the medium through which the
gas flows. Two temperature sensors are placed on either side of heating element. When the
gas flows across the sensors it detects a difference in temperature with high sensitivity. This
change in temperature is read as pre-calibrated flow signal by the micro sensor chip. This is
shown in figure 30. Since all the elements of this system are assembled on a single silicon
chip the analogue sensor signals are amplified and processed without interference.
4.9.3 Equipment details
The thermal sensor is a small compact unit measuring 2cmX2cm in size. It has high and low
flow ports and an analogue output cable with BNC connectors for connection to the electronic
chart recorder.
The sensor assembly was packaged in a heat resistant plastic container by the biomedical
engineering department at our institute. This enabled cleaning with surface active cleaning
agents used in the neonatal unit for equipment cleaning. The device was cleared for electrical
safety as per the standards for medical equipment.
4.9.4 Sensor assembly
The nasopharyngeal catheter is connected to the ‘high’ flow port of the sensor assembly and
the ‘low’ flow assembly is open to the atmosphere. The output from the sensor assembly is
connected to the electronic chart recorder (Power lab, AD instruments, Oxford, UK) via BNC
connector.
4.9.5 Calibration
I calibrated the transducer with a 2-point calibration against known pressure source delivered
by a calibrated CPAP device. The calibration points were recorded by the electronic chart
recorder (Power lab, AD instruments, Oxford, UK) and the calibrated voltage values were
entered in the chart recorder to generate the pressure values.

145
Figure 30. Principle of thermal sensor (Obtained from Sensirion AG)
The Figure 30 shows micro sensor chip with a heating element in the centre and two
temperature sensors on either side allowing the gas to flow in a straight channel

146
4.9.6 Linearity
The linearity of the pressure transducer was checked against a known source of pressure. The
control was various levels of CPAP pressures delivered by a calibrated CPAP machine (B&D
Electro medical, Stratford-upon-Avon, UK).
In the linearity testing the pressure signals correlated well with control pressure as seen by the
Bland Altman plot in the figure number 31 with pressures range from 3 cm H2O to 20 cm
H2O closely following the bias line.
4.9.7 Frequency response
The frequency response of the thermal sensor type of transducer was tested with the ‘pop’ test
method(154). This test was done when the transducer was connected in series with the
nasopharyngeal catheter (Argyle Gentle Flow Suction Catheter, Size 8FR, Covidien Ltd,
Ireland) used to measure pressure in the nasopharyngeal airway. The response time was 33
milliseconds giving a frequency response of 9.9 Hertz.
4.9.8 Factors influencing sensor performance
The thermal sensor requires an uninterrupted flow of gas down the nasopharyngeal catheter
enabling temperature changes at the sensor. Therefore, it is different from differential pressure
transducer. The main limitation in using this in very small preterm babies is that flow can
easily be interrupted by secretions and may not be uniform. There is no effect of gravity
unlike the water filled catheter systems. However, the effect of local changes in temperature
may be substantial as in-vitro calibration may not be applicable to in-vivo use.

147
Figure 31. Linearity of the thermal sensor pressure transducer against the control
(Bland Altman plot)
Figure 31 shows the two measures with thermal transducer and control along Y axis plotted
against the mean of the two measures along the X axis showing good linearity.
-15
-10
-5
0
5
10
15
Dif
fere
nce
bet
wee
n t
he
two m
easu
res
cm
H2O
Mean of the two measures cm H2O
Thermal Sensor-
Linearity
Lower LOA
Upper LOA
Bias

148
4.9.9 Description of thermal sensor pressure measurement
A catheter (Suction catheter size Fr 8) was placed at the nasopharynx or oropharynx by using
standard measurement for placing nasopharyngeal airways (27, 29). Distance between nare of
the nose to tragus of ear was measured with a measuring tape. The nasopharyngeal catheter
was introduced to about 1 cm less than this measurement to ensure adequate placement in
nasopharynx and to avoid gagging or undue stimulation of cough reflex (27, 29). This was
connected to the ‘high’ flow port of the sensor assembly and the ‘low’ flow assembly is open
to the atmosphere. The output from the sensor assembly is connected to the electronic chart
recorder (Power lab, AD instruments, Oxford, UK) via BNC connector.
Where possible this was timed to coincide with routine replacement of the feeding tube which
was facilitated at the conclusion of the study. The pressure recording was done when mouth
was passive and also with mouth closed gently with a finger pressing on the chin.
4.9.10 Results of thermal sensor pressure measurement
Nasopharyngeal pressure measurement was tried in two babies (Study ID 03 and 05) with
thermal sensor transducer. No accurate, acceptable airway pressure profile was obtained in
both these measurements. A pressure profile obtained with this method is shown in figure
number 32.
4.9.11 Summary of thermal sensor pressure transducer
The thermal sensor is technically sound with good frequency response, linearity and response
times. However, in the case of preterm neonates it was difficult to receive consistent, valid
pressure signals because of the presence of secretions blocking the catheter and interrupting
free flow of gas.

149
Figure 32. Airway pressure recording with thermal sensor – HFNC 5LPM – Dampening
signal with movements
Figure 32 shows the pressure data obtained with thermal sensor transducer with varying
amplitude and irregularity.

150
4.10 Airway Pressure Measurement - Differential Pressure Transducer
Differential pressure transducers are widely used in industries, gas and engineering equipment
and in medical equipment. They can be used to either measure pressure or flow by
differentiating the pressure signal
4.10.1 Principle of differential pressure transducer
The differential pressure transducers convert change in pressure into an electrical signal. This
is achieved by the sensor contained in these transducers. The sensor can be of different types.
In the B&D differential transducer that I used, the sensor is made up of a diaphragm with
strain gauges attached. The strain gauges deform on application of a pressure difference and
these are transmitted as electrical signals by the Wheatstone bridge transmitting system
attached to the diaphragm. This deformation is proportional to the pressure changes. In B&D
differential transducer, one of the pressures is always atmospheric pressure as one surface of
the diaphragm is subjected to the atmospheric pressure.
4.10.2 Description of B&D differential transducer structure
The differential transducer sensor has a diaphragm type of sensor as its core element. The
other essential part is the transmitting unit which conveys the electrical signal generated due
to pressure changes as an analogue signal to the recording equipment. The transducer was
cleaned after each use as per existing neonatal unit policy of cleaning medical equipment.
The product had electrical safety and standards certification for use as medical equipment.
The B&D differential transducer used in this study is shown in figure 33.
4.10.3 Transducer assembly
The transducer is connected to the nasopharyngeal catheter (Argyle Gentle Flow Suction
Catheter, Size 8FR, Covidien Ltd, Ireland) through a leur lock connector. The nasopharyngeal
catheter was kept patent with a constant flow of air through a syringe pump containing 50 ml
syringe flushing air at a constant rate of at 20ml/hr. The output signal was recorded in
electronic chart recorder (Power lab 16/35, AD instruments, Oxford, UK) via BNC
connectors.

151
Figure 33. Differential pressure transducer and its assembly with nasopharyngeal
catheter in series
Figure 33 shows the B&D differential transducer (arrow marked A) connected to the
nasopharyngeal catheter (arrow marked D) through its port (arrow marked C). The output
from B&D is shown digitally in this transducer but also collected as analogue output (arrow
marked B).
A –Differential
transducer
B – Analogue output
C – Catheter connection
port
D – The nasopharyngeal
catheter connected to the
transducer

152
4.10.4 Calibration
I calibrated the B&D transducer before each use with a known pressure source from a CPAP
machine (B&D Electromedicals, Stratford-upon-Avon, UK). A 2-point calibration was done
and voltages in the electronic chart recorders were appropriately adjusted.
4.10.5 Linearity
The linearity check gave satisfactory readings over the range 3-20 cm H2O when compared
with control pressures delivered by calibrated CPAP device as illustrated in figure 34.
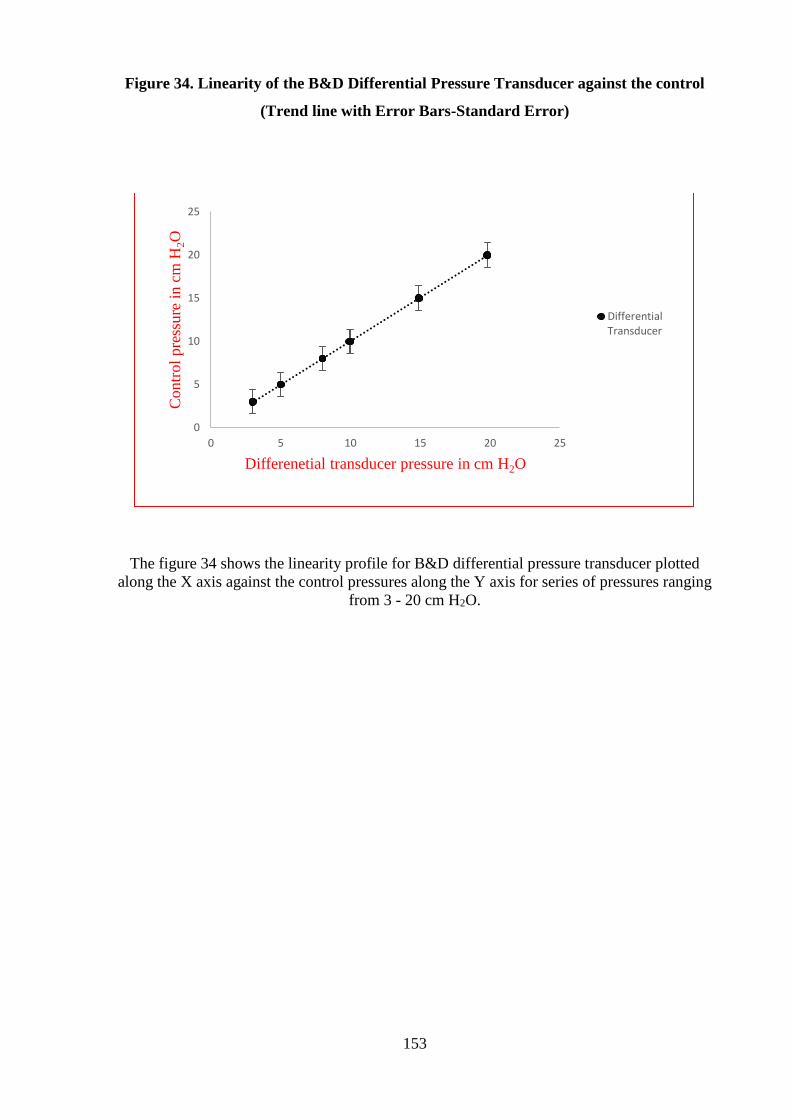
153
Figure 34. Linearity of the B&D Differential Pressure Transducer against the control
(Trend line with Error Bars-Standard Error)
The figure 34 shows the linearity profile for B&D differential pressure transducer plotted
along the X axis against the control pressures along the Y axis for series of pressures ranging
from 3 - 20 cm H2O.
0
5
10
15
20
25
0 5 10 15 20 25
Contr
ol
pre
ssure
in c
m H
2O
Differenetial transducer pressure in cm H2O
DifferentialTransducer

154
4.10.6 Frequency response
The frequency response of B&D differential transducer was tested when connected in series
with nasopharyngeal catheter (Argyle Gentle Flow Suction Catheter, Size 8FR, Covidien Ltd,
Ireland) by the ‘pop’ test method(154). The response time was 20 milliseconds giving a
frequency response of 16.2 Hertz.
4.10.7 Factors influencing differential transducer performance
The differential transducer works on the physical principle of deformation of strain gauge
elements in its sensor. Therefore, it can be influenced by the ambient temperature. The
accurate pressure measurement is dependent on a patent catheter leading up to the site of
interest but not necessarily an active flow.
4.10.8 Description of Differential pressure transducer measurement
Differential transducer method (B&D Electromedical, Stratford-upon-Avon, UK): A suction
catheter was placed at the nasopharynx or oropharynx by using standard measurement for
placing nasopharyngeal airways. Distance between nare of the nose to tragus of ear was
measured with a measuring tape(26). The nasopharyngeal catheter was introduced to about 1
cm less than this measurement to ensure adequate placement in nasopharynx and to avoid
gagging or undue stimulation of cough reflex(26). This was connected to O2 and CO2 analyser
and differential pressure transducer via a 3-way connection. The gas analysis sampling was
done intermittently at flow rate changes as per the study pathway.
4.10.9 Summary of differential pressure transducer
The B&D differential transducer had very good accuracy, linearity and frequency response. It
was also practicable to use in a small preterm baby due to the practical challenges of
unpredictable flow into the measuring catheter. The results and discussion of airway pressure
measurements done with this method are discussed in the results chapter –Chapter 5.

155
4.11 Gas Analysers for Respiratory Gases
There are different types of gas analysers available which are used predominantly in
anaesthetic practice, intensive care and also by sports physiologists. I used a commercially
available gas analyser (AD instruments, Oxford, UK), which provides analogue output for O2
and CO2 concentration from the gas sample being analysed.
4.11.1 Principle
The AD instruments gas analyser is an electronic gas analyser with transducers for infrared
carbon dioxide and visible spectrum oxygen detection. A schematic diagram illustrating the
gas analyser components is shown in figure 35.

156
Figure 35. Schematic Diagram of Gas Analyser (From AD instruments, Oxford, UK)
Figure 35 shows a schematic diagram of a gas analyser with its constituent parts.

157
4.11.2 Materials and device assembly
The AD instruments gas analyser has a gas analyser unit, connecting tube called Nafion and
output cable with BNC connectors for connection to electronic chart recorder. These are
shown in figure 36.
Nafion is a copolymer of tetrafluoroethylene (Teflon) and perfluoro-3, 6-dioxa-4-methyl-7-
octene-sulfonic acid i.e.a combination of Teflon with sulfonic acid group side chains
interspersed in it. These side chains have a very high affinity to water, absorbing 13 molecules
of water for every sulfonic acid group in the polymer and therefore Nafion tube absorbs 22%
by weight of water. Unlike micro-porous membrane permeation, which transfers water
through a relatively slow diffusion process, Nafion removes water by absorption. This
absorption occurs as a first order kinetic reaction, so equilibrium is reached very quickly.
Because this is a specific reaction with water, gases being dried or processed are not affected.
The Nafion tube is 30 cm in length and 0.13 mm in diameter. The material allows water
vapour to pass through its walls so that the water vapour content of the gas sample inside the
tube equilibrates with that of the room air. This happens very quickly within milliseconds.
The In-line Filter connects directly to the sampling port of the Gas Analyser to protect the
transducers from moisture and damaging particulates. This has 0.45µm pore-size hydrophobic
membrane and a disc size of 17mm.
The gas analyser (AD instruments, Oxford, UK) has an infrared carbon dioxide sensor and
optical oxygen detector. The analyser samples expired gas from a mixing chamber with a
damped, micro-vacuum sampling pump. A flow control knob on the front of the unit provides
sampling rates of 35 to 200 ml/min. The maximum flow values may vary for different sizes
and lengths of tubing. The gas analyser has the following operating requirements- power
supply of 85–250 VAC 50/60 Hz, temperature range should be 5–35 °C and humidity
between 0–90% (non-condensing). The salient features are shown in table 14.

158
Figure 36. Gas analyser, Nafion connecting tube and In-line filter
Figure 36 shows a gas analyser with its different functionalities labelled, a nafion connecting
tube and a bacterial filter.
Flow control Gas sample inlet
port
Power Pump switch indicator
Nafion tube In-line filter

159
Table 14. Features of gas analyser (obtained from AD instruments, Oxford, UK)
Features CO2 analyser
O2 analyser
Type of analyser Infrared, optical Visible spectrum (760 nm)
absorption
Range 0–10% CO2 5–100% O2
Output Linear, 0–1 V (0–10% CO2) Linear, 0.05–1 V (5–100% O2)
Resolution 0.1% CO2 0.01% O2
Linearity ±0.1% CO2 ±0.2% O2
Drift 0.1% CO2 over 8 hours 0.1% O2 over 2 hours
Response time (10–90%) 90–130 ms @ 200–50 ml/min
- transducer alone; 440 ms @
200 ml/min sample flow with
Nafion tubing and
hydrophobic filter connected
to sample inlet port
Transducer 130–300 ms
between 200–50 ml/min
Table 14 shows performance features of gas analyser components.
The CO2 transducer works on the principle of infrared absorptiometry. It is a Servomex model
1507 infrared transducer. It is calibrated so that output voltages in the range 0–1 V are
proportional to CO2 concentrations in the range 0–10%.
The O2 transducer works on the principle of optical absorptiometry. It is an Oxigraf X2004
sensor which uses absorption spectroscopy in the visible spectrum (760 nm). The incoming
gas sample is exposed to narrow-band light produced by a laser diode. The light is thermally
tuned to a particular emission-line in the oxygen spectrum. A detector on the opposite side of
the chamber detects changes or attenuation in the light intensity at the wavelength of the gas
sample being studied. As the concentration of oxygen in the chamber increases, more energy
is absorbed by the oxygen molecules in the gas and less light is received by the detector.
The exterior of the gas analyser was cleaned as per neonatal unit policy for medical
equipment. The device had all the electrical and safety standards certificates for use as a
medical device.

160
4.11.3 Calibration
The instrument was warmed up for at least 15 minutes prior to every test to minimize any
possible electrical drift. Calibration of the O2 and CO2 analysers was performed immediately
prior to every test using two-point calibration with two known gas mixtures.
Oxygen analyser was calibrated with first calibration point being room air and the second was
12.5% O2 cylinder with CO2 7.5% and balance N2 gas mixture. For CO2, first calibration point
was room air (0.004) and the second was 7.5% CO2 from gas mixture cylinder (BOC Health
care, UK).
4.11.4 Obtaining measurements
The machine was switched on for 15 minutes and then calibrated as per the protocol.
Then the pump speed was set at 200ml/min. A nafion tube was connected to the gas inlet port.
The nafion tube ensures optimising the water vapour content of the gas sample to the room air
level. A bacterial filter was juxtaposed between nafion tube and patient catheter to prevent
cross infection or contamination of the machine. The machine makes continuous
measurements of the O2 and CO2 levels of the sampled gas sample which is recorded as an
analogue signal on electronic chart recorder (Power lab, AD instruments, Oxford, UK)
4.11.5 Factors influencing gas analyser performance
The measured gases should be free of excessive water vapour. In addition, inadequate
warming time might affect the results due to alteration in the electronic signals produced by
the O2 and CO2 transducers.
4.11.6 Summary of gas analyser for air way gas concentrations
The features of the AD instruments gas analyser including the response time, range of
measurement capability and ability to record continuous gas concentration in an analogue
output were suitable for the purposes of this study.

161
4.12 Tidal volume measurement - Volusense Technology
4.12.1 Principle
Volusense uses electromagnetic inductive plethysmography technique for evaluating tidal
breathing indices in infants (81, 156). A vest with conductive coils is wrapped around the
baby’s chest and abdomen. The resultant change in magnetic field generated by the coils due
to movements of the chest and abdomen is picked up by an antenna placed at a height over the
baby. This allows measurement of tidal volume, respiratory rate and by differentiating volume
signals over time tidal flow indices can be measured. A schematic diagram of Volusense
principle is shown in figure 38.
The measurements are depicted continuously in the Volusense screen as flow volume signals.
The measurement quality can be visually checked by the shape of the waves as shown in
figure 39.
Thoraco abdominal asynchrony can be calculated from the Electromagnetic Inductance
Plethysmography done via the Volusense software. The chest wall and abdominal movement
signals have specific wave characteristics. The phase angle provides a quantitative estimation
of Thoraco-abdominal asynchrony. In addition, the shape of the flow volume loop can give
clues about airway obstruction to flow.
Volusense machine has been validated for tidal breathing indices measurement in both term
and preterm infants in the earlier studies (157, 158).

162
Figure 37. Schematic representation of Volusense Electromagnetic Inductance
Plethysmography (157)
Figure 37 shows a schematic representation of Volusense machine. The key components are
labelled (157).

163
Figure 38. Volusense machine and measurement display on the machine screen
Figure 38 shows the Volusense machine with its main components labelled.
Tidal breathing display
Antenna
Volusense machine with display screen

164
4.12.2 Materials and device assembly
The Volusense machine comes with a standalone unit consisting of a base unit with device
computer for onscreen instructions and conducting the calibration and test. The device
extends onto an antenna. The device also comes with a calibration unit consisting of a
metallic cylinder with known volume against which the calibration has to be performed in the
area of interest. This test site specific calibration is crucial as the magnetic fields in an area
that might interfere is specific to that area.
The vest containing conductive coils comes in 5 different sizes. These are colour coded and
are ranging from vests suitable for a less than 1000 grams baby to a larger infant. Accurate
size selection is done after measuring the distance between the armpit to hip in the baby and
comparing it with the colour coded scale and colour coded vests provided by the company.
4.12.3 Factors influencing Volusense performance
The presence of a strong magnetic field or instruments that might generate electromagnetic
field are likely to interfere with measurements. The baby needs to be quiet and not moving
vigorously as movements will lead to artefacts. The size of the vest should be appropriate for
the baby’s size as too loose or too tight vests will not accurately measure the actual tidal
breathing indices. The calibration has to be done according to the guidelines and height of
antenna needs to be as per guidance.
4.12.4 Measurement of tidal volumes
The Volusense vest was placed over the infant’s torso. Respiratory measurements are derived
from changes in electromagnetic inductance in this wrap-around vest worn by the baby. The
vest is disposable and used for one patient only to avoid cross-infection. Thorax and
abdominal volumes and volume changes are measured and stored digitally by the Volusense
device shown in figure 38. The device was used to record tidal volume, tidal flow volume
loop, respiratory rate and to calculate tidal breathing indices. The device has the ability to
export analogue signals of tidal volume and flow for simultaneous recording in the
multichannel recorder for synchronous recording.

165
4.13 Transcutaneous CO2 measurement
Transcutaneous (Radiometer UK Limited, Crawley, UK) sensor was applied to the baby’s
skin to measure carbon dioxide (CO2) levels.
4.14 Transcutaneous O2 saturation measurement
Transcutaneous oxygen saturation percentage was measured by placing pulse oximetry probe
on foot and connecting it to Masimo SET Pulse Oximetry machine (Masimo Europe Limited,
Basingstoke, UK).
4.15 Data recording
All the above measurements were connected to a multi-channel recorder (Power lab chart
recorder, AD Instruments, Oxford, UK) that allowed synchronised recording and graphical
presentation of all the above parameters. These are saved as files allowing future
analysis. The following measurements were attempted at a sampling frequency of 100Hz.
Transcutaneous oxygen saturations.
Transcutaneous CO2 levels.
Nasopharyngeal pressures.
Concentration of CO2 and O2 in nasopharyngeal space during inspiration and
expiration.
Tidal volume, flow, respiratory rate and FRC baseline.
Clinical observations were done as per unit policy (Appendix Number 6).
A screenshot of simultaneous multichannel recording of respiratory physiology parameters is
shown in the figure 39. The different channels are colour coded to identify different inputs
from measuring equipment.

166
Figure 39. Example of simultaneous recording of physiology parameters in Lab Chart
recorder –Study ID – 06
Figure 39 is a screenshot from the simultaneous multichannel recording of the all the
physiological parameters measured in this study. The individual parameters are represented in
colour coded waveforms and the analogue measurements are displayed onscreen as well.
A study trolley was assembled containing the following devices as shown in figure 40 and a
list of equipment used in the study is given in Table Number 15.
O2
CO2
TV
TcPCO2
Pressure
HR
SPO2

167
Figure 40. Study Trolley
Figure 40 shows the study trolley assembly with its components.
Study laptop
B&D differential
transducer
AD instruments chart
recorder
TOSCA Radiometer
Gas analyser
Pulse oximeter
Storage areas

168
Table 15. Equipment used in the study
Equipment
Manufacturer
Standards
Features
The HFNC and
CPAP devices
Fabian therapy:
ACUTRONIC
Medical
Systems AG
CE 0124. Fabian Therapy
is an Equipment Class IIb
ventilator per European
directive.
It can provide both
CPAP and HFNC
therapy
Pressure monitoring
and gas sampling
Gaeltec catheter
tip pressure
transducer:
Gaeltec Devices
Ltd
CE 0120
EC Certificate full quality
assurance system:
Certificate GB 12/86323,
Directive 93/42/EEC on
Medical Devices for
medical pressure
transducers.
Single equipment
with incorporated
pressure transducer
and a channel for
aspirating gas
sample for analysis
Pressure monitoring Differential
pressure
transducer
B&D
Electromedical
Ltd
CE 0120
Electrical safety
certificate
Compact device
easily portable for
bedside
measurements
Gas analyser AD instruments,
Oxford, UK
CE 0120
Electrical safety
certificate
Needs calibration
against known gas
concentration before
use
Tidal breathing
indices
Volusense
Pediatrics,
Bergen, Norway
Class II A according to
MDD.
Electrical Classification:
Class I, type B according
to IEC 60601-1
Safety standards: EN/IEC
60601-1: 2005 and
EN/IEC 60601-1-6
Bulky instrument,
it’s a standalone
device with its own
software input from
device laptop.
However, data can
be exported in
analogue form to
multichannel chart
recorder
Transcutaneous
carbon dioxide
monitoring.
Radiometer UK
Limited,
Crawley, UK
CE 0123
Instrument Class 1, type
BF, defibrillator proof,
fulfils the requirements of
MDD 93/42
Compact device,
amenable for
bedside
measurement
Transcutaneous O2
saturation
monitoring
Masimo Europe
Limited,
Basingstoke,
UK
CE 0120
Electrical Safety
certificates
Compact device for
continuous
measurements

169
4.16 Study Treatment
4.16.1 Adjustment of FiO2
FiO2 was continued at the same level as pre-study entry level. Any desaturations outside the
standard target range (91-95%) were dealt with as per standard neonatal practice (FiO2
increased or decreased by 5% aliquots). A sustained increase (more than 15 minutes) in FiO2
by 0.2 above baseline or FiO2 > 0.6 was used as the cut-off to restore the infant to previous
flow rate with no further reduction in flow. The study was continued but these infants were
studied over a reduced range of flow rates.
4.16.2 Study Duration
Total study duration was around 120 minutes. I was directly observing the baby throughout
the study.
4.16.3 Minimisation of Bias
The recordings were done simultaneously on an electronic chart recorder with no possibility
of observer bias. The stability of pressure traces was based on the presence of a clean artefact
free respiratory waveforms after recording. Only those segments with no noise and artefact
were analysed and all artefact free data in its entirety was exported for analysis to avoid
observer bias.
4.16.4 Discontinuation Criteria
The attending clinician had the powers to withdraw the baby at any time in the interests of the
baby’s health and well-being. Babies would have been discontinued from study if (any of):
Inadequate ventilation - pH <7.20 and pCO2 >10 kPa,
Inadequate oxygenation - FiO2 >0.6 and/or increase in FiO2 of 0.2 from baseline to
maintain SpO2 >91% (28),
Recurrent unprovoked minor apnoea requiring intervention (not self-resolving; >2 per
hour during study) or one major apnoea requiring positive pressure ventilation (28).

170
4.16.5 Concomitant Treatments
Throughout the study, the babies continued to receive prescribed concomitant treatments
deemed necessary to provide adequate supportive care.
4.17 Research Governance
Babies recruited to the HFNC Study spent about two hours participating in the study. I
monitored the babies closely throughout the study. In addition, babies continued to have
routine neonatal observations as per the neonatal unit policy by the clinical team. There was
no transfer of babies between neonatal units during this study as it was a short study of two
hours duration. Timeline of proof of concept project development is given below in Table
number 16.
Table 16. Timeline of various physiology studies in the proof of concept study
Respiratory physiology study development
Timeline
HFNC Review of evidence
July 2013-September2013
Protocol development
October 2013-January2014
Study Trolley assembly
July 2014
Gas analyser calibration set up
August 2014
Pressure monitoring calibration set up
August 2014
Volusense equipment training
December 2014
Airway pressure monitoring– Gaeltec catheter
February 2015
Airway pressure monitoring with thermal sensor
February 2015
Airway pressure monitoring with differential transducer
March 2015
Airway gas concentration
February-March 2015
Tidal breathing indices- Volusense
February –March 2015

171
4.18 Source data
Source data was obtained from:
• Hospital records for the baby’s clinical condition before study.
• Data downloaded from the electronic multi-channel recorder (Power lab, AD
Instruments, Oxford, UK).
4.19 Assessment of efficacy
The primary outcome measures were recorded during the study on electronic chart recorder.
The mechanism for recording any significant respiratory deterioration resulting in exit criteria
being met was analysed on a case by case basis by the study team and the data monitoring
committee. Each baby was monitored as per the current neonatal unit standards (Appendix 6).
4.20 Assessment of safety
Safety was assessed continuously during each baby’s study in the neonatal unit. Standard
system was in place to address any adverse event.

172
4.21 Discussion and summary
I undertook investigation of the techniques available to measure respiratory physiology in
preterm infants accurately, safely and also wanted to demonstrate that it was feasible in
preterm infants.
Out of the three pressure measuring systems, though they all had specific advantages, the
stability of the Gaeltec pressure catheter mounted pressure transducer was not optimal over a
two-hour period at the pressure range we expected to see in preterm infants. I decided to test
the quality of pressure tracings with these methods before choosing the most appropriate
technique for larger randomised crossover study.
The gas analyser selection for measuring airway gas concentration was based on the features
described namely response rate, accuracy and feasibility for ease of use at bed side in a
neonatal unit.
I explored the features of a novel tidal volume measuring device called Volusense. This
electromagnetic inductance plethysmographic device has been tested in neonates including
preterm neonates but never during HFNC therapy situation (81, 160). The technical aspects of
the machine when I examined in depth seemed to be suitable for the purposes of this study
i.e., measuring tidal volumes continuously whilst measuring other physiological parameters in
babies who were receiving varying flow rates of HFNC.
These devices in addition to the already standardised transcutaneous CO2 and oximetry
devices in use made up the core elements of the equipment used in this study.

173
Chapter 5. Results

174
5.1 Introduction
The body of literature on HFNC therapy in various clinical conditions is growing. Its use in
the neonatal population has been increasing and it has been the subject of several studies as
discussed in my literature review (96, 98, 130).
However, the key mechanism of action of HFNC is yet to be elucidated. Out of the several
mechanisms of action proposed the predominant feature is not known (14). Without this
knowledge, it is difficult and empirical to make guidelines and treatment protocols for its
initiation, maintenance weaning and stopping the therapy (99).
In order to understand the role of airway distending pressure, dead space wash out effect and
influence on tidal volume and hence minute ventilation, we planned a comprehensive
physiological study. I undertook the initial study evaluating the equipment to be used in this
study as above. I chose and built the cart that all the equipment was mounted on and wired all
items up to the chart recorder. I established a protocol whereby the equipment could be
calibrated then wheeled to the patient’s bedside in order to start the investigation.
I also performed proof of concept studies to assess feasibility and safety before undertaking a
larger study involving a larger number of babies. A detailed study protocol (See Appendix
Number 1) as described earlier was developed followed by approvals from North East Ethics
Committee-2(See Appendix Number 3), Special Trustees at Newcastle Hospitals for funding
(See Appendix Number 7) and finally Newcastle Hospitals NHS foundation Trust research
governance for site specific research (See Appendix Number 8).
5.2 Baseline characteristics of study population
The median (IQR) gestational age at birth was 27 (25.71-29.28) weeks and the median (IQR)
birth weight was 872.5 (705-1160) grams. The gender distribution was equal (3 male, 3
female). 5 babies were >1500 grams in weight at the time of the study. There was one baby
<1000 grams in weight at the time of the study. The median (IQR) age at the time of study
was 34.78 (32.86-36.14) weeks and the median (IQR) study weight was 1785 (1580-1980)
grams. The participant summary and study entry characteristics are summarised in tables 17
and 18.

175
Table 17. Participant Summary
Recruitment Number of babies
Respiratory support
starting mode
Consented
9
Studies undertaken
6
1 CPAP
5 HFNC
Reasons for exclusion
2 babies came off high
flow therapy soon after
consent before study could
commence.
1 baby - Volusense only
started – Baby active and
unsettled- data not
obtained consistently.
Table 17 shows a summary of the participants in this pilot study.

176
Table 18. Description of baseline characteristics at study entry
Participants Gender
Gestational
Age
in weeks
Age at the time
of study
in weeks
Birth Weight
grams
Weight at the
time of study
in grams
1 F 27+6 36+1 675 1980
2 F 29+2 34+4 1160 1700
3 M 26+1
28
905
975
4 F 24+6 35 705 1870
5 M 25+5 37+1 840 2280
6 M 31+3 32+6 1400 1580
Median 27
34.78 872.5 1785
IQR range (25.71-29.28) (32.86-36.14) (705-1160) (1580-1980)
Table 18 shows the baseline characteristics of the study population.

177
5.3 Airway Pressure Recordings
Two babies had a range of pressure measurement across different HFNC flows with the B&D
differential transducer.
A pressure recording was taken as valid and real if it showed the typical wave pattern and
without interference and was of uniform amplitude across several respiratory cycles. In this
study, at least 10 breaths were needed to accept measurements from that epoch. Various
pressure data were collected and the segment represented by each pressure parameter is
shown in a valid pressure signal in figure 41.
Figure 41. Valid Pressure tracing with respiratory waveform for at least 10 breaths
Figure 41 shows a valid pressure waveform that would be accepted for analysis.
1:18:18 1:18:19 1:18:20 1:18:21 1:18:22 1:18:23 1:18:24 1:18:25 1:18:26 1:18:27 1:18:28 1:18:29 1:18:30 1:18:31
4
5
6
7
8
9
Pre
ssu
re (
cm
H2
O)

178
The range of pressures seen during HFNC in a preterm neonate is shown in table 19 and
figure 42. In this example, maximum pressure in air ways was seen during HFNC of 8 LPM.
In the HFNC flow range of 2-8 LPM, there was a flow dependent increase in mean air way
pressures and maximum airway pressures.

179
Table 19. Airway pressure profile recorded with B&D differential transducer with
HFNC varying flow rates (Study ID 04 and 06)
Respiratory
Support
Pressure
Minimum
cm H2O
Pressure
Mean
cm H2O
Pressure
Maximum
cm H2O
Study ID 04 06 04 06 04 06
CPAP 6cm H2O 1.69 3.56 4.01 5.59 5.81 7.34
HFNC 8 LPM 2.39 5.62 4.15 7.14 4.83 8.01
HFNC 7 LPM 0.34 4.31 3.27 5.74 6.4 6.77
HFNC 6 LPM 0.09 3.36 3.51 5.18 6.7 6.30
HFNC 5 LPM 0.00 0.80 2.19 3.48 4.94 5.18
HFNC 4 LPM 0.07 0.97 0.7 2.63 1.1 4.92
HFNC 3 LPM 0.42 0.22 0.98 2.64 1.44 4.21
HFNC 2LPM 0.20 0.52 1.44 1.60 2.21 3.39
Table 19 shows the complete range of various pressure parameters across all HFNC flow
ranges and CPAP control mode.
Figure 42. Mean Airway pressure profile recorded with B&D differential transducer
with HFNC varying flow rates (Study ID 04 and 06)
Figure 42 is a scatter plot of the mean airway pressures across HFNC flow ranges and CPAP.
0
2
4
6
8
0 1 2 3 4 5 6 7 8 9
Mea
n P
ress
ure
in c
m H
2O
1= CPAP 6 cm H2O Pressure2-8 = HFNC Flow Rate in L/min
Airway Pressures -B&D Differential Transducer
Study ID 04 Study ID 06

180
5.4 Gas concentration measurement
5.4.1 In-vivo measurement of airway O2 and CO2 concentrations
The O2 and CO2 concentration in nasopharyngeal gas sample was sampled intermittently
during each flow rate from 2-8 LPM and during CPAP of 6 cm H2O pressures. The FiO2
being administered was noted down at the same time. The transcutaneous CO2 was
continuously recorded throughout the study.
In the figure number 43, a snapshot of gas concentration analysis of nasopharyngeal space is
illustrated with blue wave form from CO2 transducer and red wave form from O2 transducer
of the gas analyser. The points in CO2 curves which stands for End Inspiratory and End
Expiratory CO2 levels are indicated by black arrows.

181
Figure 43. Recording of nasopharyngeal airway O2 and CO2 concentrations during
CPAP with FiO2 34%
Figure 43 shows the recording of O2 and CO2 (marked with arrows) in nasopharynx during
HFNC therapy.
Administered FiO2 34%
Recorded O2 concentration 27.5%
Recorded CO2 concentrations
End inspiratory
End expiratory
Airway O2
Airway CO2
Tidal volume

182
5.4.2 Gas concentration measurements in this proof of concept study
Valid gas concentration measurement was available from Study ID 2, 3, 4 and 6 for different
flow rates. The range of values seen is shown in table 20.

183
Table 20. Maximum, mean, minimum CO2 and O2 concentrations in nasopharyngeal
airway at various HFNC flow rates
Study
ID
Mode
O2
Average
Minimum
%
O2
Average
Maximum
%
O2
Mean
%
CO2
Average
Minimum
%
CO2
Average
Maximum
%
CO2
Mean
%
2 CPAP 6 25.7 28.4 27.0 0.42 2.38 1.31
3 CPAP 6 33.2 36.0 34.5 1.90 4.40 3.05
4 HFNC 8 18.6 21.8 20.3 0.28 3.12 1.50
6 HFNC 8 16.8 20.8 19.4 0.33 4.05 1.50
3 HFNC 7 33.3 36.4 34.8 1.01 3.64 2.22
6 HFNC 7 17.2 20.7 19.0 0.25 3.11 1.49
3 HFNC 6 31.0 35.1 32.7 0.81 3.46 1.46
4 HFNC 6 21.0 26.0 23.2 1.18 3.80 2.52
4 HFNC 4 20.0 23.1 21.5 0.79 3.12 1.95
6 HFNC 4 17.1 20.9 19.7 0.06 3.85 1.10
3 HFNC 3 32.3 36.8 34.4 0.98 4.35 2.51
6 HFNC 3 15.8 20.8 19.0 0.22 4.91 1.64
3 HFNC 2 34.6 37.5 35.8 1.36 3.52 2.53
4 HFNC 2 22.3 25.0 23.6 0.44 2.68 1.48
6 HFNC 2 15.9 20.7 18.5 0.46 5.38 2.54
HFNC
2-4 LPM
versus
6-8 LPM
P = 0.54
P value calculated using the t-test (Difference -0.183; Standard error 0.294; 95% CI-
0.8289 to 0.4636; t-statistic -0.622; DF 11; Significance level P = 0.5466)
Table 20 shows maximum, mean, minimum CO2 and O2 concentrations in nasopharyngeal
airway at various HFNC flow rates. There was no difference between CO2 levels between
HFNC flow rates of 6-8 LPM compared to 2-4 LPM (P = 0.55 95% 95% CI -0.83 to 0.46; t-
statistic).

184
5.4.3 Relationship of administered O2 to recorded O2 concentration in nasopharyngeal
airway
The administered FiO2 by HFNC was slightly higher than the measured O2 levels in the
nasopharyngeal gas sample. Thus, the HFNC prescribed oxygen concentration is likely to
deliver a slightly lesser FiO2 concentration to the upper airways. The mean nasopharyngeal O2
levels at different HFNC flow rates and CPAP 6 cm H2O respiratory support, recorded from
nasopharyngeal gas samples is shown in table 21.
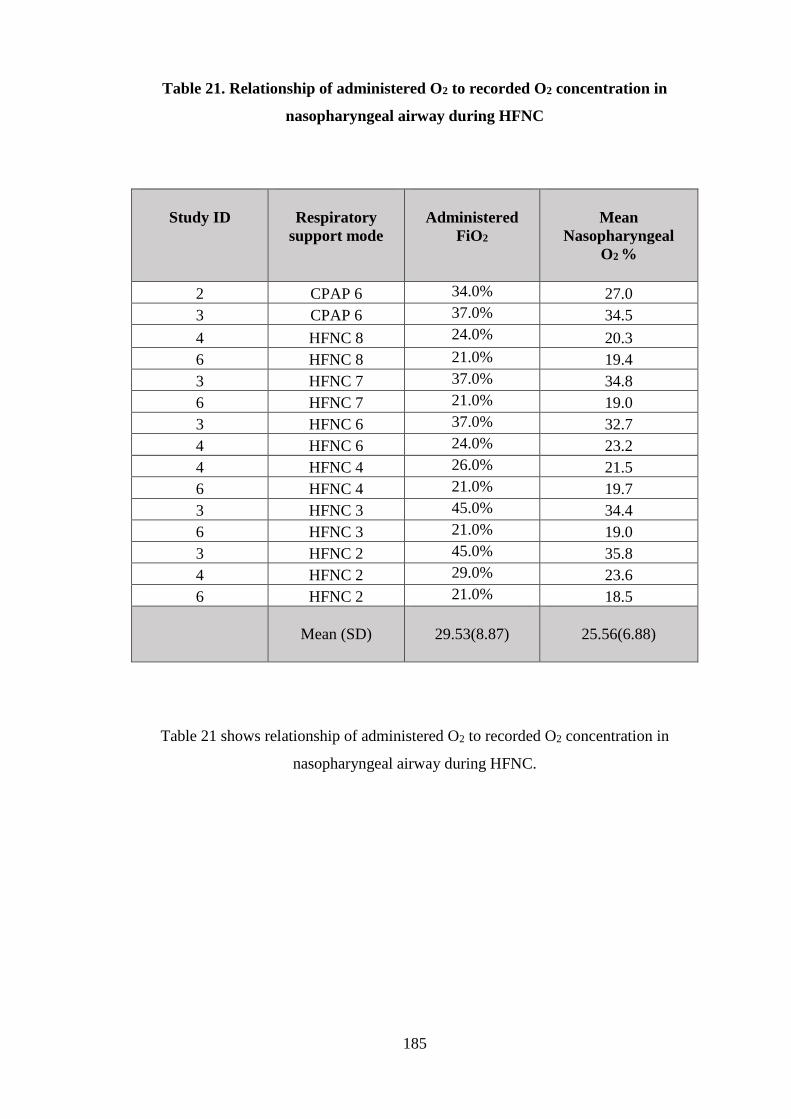
185
Table 21. Relationship of administered O2 to recorded O2 concentration in
nasopharyngeal airway during HFNC
Study ID
Respiratory
support mode
Administered
FiO2
Mean
Nasopharyngeal
O2 %
2 CPAP 6 34.0% 27.0
3 CPAP 6 37.0% 34.5
4 HFNC 8 24.0% 20.3
6 HFNC 8 21.0% 19.4
3 HFNC 7 37.0% 34.8
6 HFNC 7 21.0% 19.0
3 HFNC 6 37.0% 32.7
4 HFNC 6 24.0% 23.2
4 HFNC 4 26.0% 21.5
6 HFNC 4 21.0% 19.7
3 HFNC 3 45.0% 34.4
6 HFNC 3 21.0% 19.0
3 HFNC 2 45.0% 35.8
4 HFNC 2 29.0% 23.6
6 HFNC 2 21.0% 18.5
Mean (SD)
29.53(8.87)
25.56(6.88)
Table 21 shows relationship of administered O2 to recorded O2 concentration in
nasopharyngeal airway during HFNC.

186
5.5 Tidal breathing indices measurements by Volusense method
Tidal breathing indices were measured as per the study protocol during CPAP of 6 cm H2O
and HFNC flow rate from 2-8 LPM. These were measured in all the 6 babies in the study.
5.5.1 Tidal volumes in HFNC
The mean tidal volumes at each flow rate was within the range of 3.1-3.9 ml/kg. However, the
relationship of tidal volume and flow rate was not linear. There was no significant difference
between the tidal volume seen at CPAP of 6 cm H2O and each of the flow rates 2-8 LPM. The
mean tidal volume in ml/kg is shown in table 22.

187
Table 22. Tidal volumes in ml/kg determined by Volusense method at CPAP 6 cm H2O
and varying HFNC flow rates
Study
ID
CPAP
6 cm
H2O
HFNC
8 LPM
HFNC
7 LPM
HFNC
6 LPM
HFNC
5 LPM
HFNC
4 LPM
HFNC
3 LPM
HFNC
2 LPM
01 2.49 NA NA 2.36 2.35 2.33 2.77 3.5
02 4.54 4.12 4.41 3.45 3.76 4.11 3.1 5.17
03 7.62 3.77 3.10 3.75 4.24 3.17 4.63 6.19
04 1.77 2.38 2.07 2.08 1.72 2.05 2.02 1.60
05 2.10 1.76 1.87 1.83 1.65 1.82 1.20 1.11
06 3.76 3.44 4.63 5.17 4.63 5.62 5.34 5.82
MEAN 3.71 3.10 3.22 3.11 3.06 3.18 3.18
3.90
STD
DEV 2.18 0.99 1.28 1.26 1.31 1.45 1.56
2.17
Table 22 shows Tidal volumes in ml/kg determined by Volusense method at CPAP 6 cm H2O
and varying HFNC flow rates.
188
5.5.2 Tidal breathing indices including flow derivatives from Volusense
The Volusense generated flow volume loops from the chest and abdominal wall movements.
The various flow values are derived by differentiating the volume curves. This is shown in
table 24. There were no statistically significant differences in either tidal volumes or flow
indices derived from the flow volume loops when HFNC of 8 LPM was compared with CPAP
of 6 cm of H2O.
The mean peak tidal expiratory flow (PTEF) in mL/s during HFNC 8 LPM and CPAP 6 cm
H2O was similar with no statistically significant difference (p=0.9150). Similarly, time to
peak tidal expiratory flow as a ratio of total expiratory time, referred as Tptef/Te, was also
similar (p=0.8111) between the two respiratory support modalities of HFNC 8 LPM and
CPAP 6 cm H2O.
The phase angle obtained from the difference in thoracic and abdominal wall movements was
similar (p= 0.7962) indicating effect of HFNC and CPAP on thoracoabdominal asynchrony
was the same in this instance.
The expiratory flow volume loop centre of gravity, referred as FVg, was also similar (p=
0.3706) in the two modalities of respiratory support.

189
Table 23. Tidal breathing indices with tidal flow derivatives
Indices HFNC 8 LPM
(n=5)
CPAP 6cm H2O
(n=5)
Weight at study in
grams
Mean (range)
1737 (975-2280) 1737 (975-2280)
Vt (ml)/kg
Mean(SD)
2.82
(1.51)
3.14
(2.62)
RR(/min)
Mean(SD)
62.69
(21.45)
57.93
(18.90)
V'E(mL)/kg
Mean(SD)
184.84
(127.53)
193.01
(207.80)
PTEF (mL/s)
Mean(SD)
14.69
(2.94)
14.33
(6.69)
Tptef/Te (%)
Mean(SD)
62.61
(16.00)
65.11
(16.00)
Te/Ti 203.20
(122.18)
188.62
(41.91)
Phase angle (Degree)
mean (SD)
101.08
(62.46)
90.3
(65.19)
FVg (dimensionless)
Mean (SD)
0.48
(0.07)
0.45
(0.01)
Table 23 shows tidal flow indices derived from the Volusense flow volume loops.
Vt (mL)/kg - Tidal volume per kilogram body weight
RR - Respiratory rate
V’E (mL)/kg - minute ventilation
PTEF - Peak tidal expiratory flow
Tptef/Te - Time to peak tidal expiratory flow as a ratio of total expiratory time
FVg - Expiratory flow volume loop centre of gravity (dimensionless)

190
5.6 Gas exchange profile of patients during the study
5.6.1 Heart rate, respiratory rate, transcutaneous O2 and CO2 levels
All the babies had continuous heart rate, respiratory rate, transcutaneous O2 concentration and
transcutaneous CO2 levels measured as shown in Table 24, Table 25, Table 26 and Table 27
and figure 44, figure 45, figure 46, figure 47 respectively. The mean values of these basic
respiratory parameters were recorded throughout the study across all HFNC flow ranges.
The mean heart rate and mean respiratory rates were stable across the flow ranges of HFNC
as well as CPAP of 6 cm H2O during the study period.
The oxygen saturation profile was stable within the limits agreed in the protocol (FiO2 not
exceeding more than 0.2 from baseline) throughout the study and 3 babies needed increase in
FiO2 in 5% aliquots.
The transcutaneous CO2 mean values were within the acceptable range during the entire study
period in all the babies. This shows that there were no transient elevations of TcPCO2 levels
during the various HFNC flow levels during the study period.

191
Table 24. Heart Rate (mean) during the study
Study
ID
CPAP
6 cm
H2O
HFNC
8 LPM
HFNC
7 LPM
HFNC
6 LPM
HFNC
5 LPM
HFNC
4 LPM
HFNC
3 LPM
HFNC
2 LPM
Total
study
Mean
HR
1 154 142 148 146 151 144 155
2 154 160 157 151 153 147 157 161 160
3 174 177 161 164 161 162 163 166 169
4 160 175 162 165 167 159 156 152 164
5 159 155 144 154 155 149 158 148 162
6 161 151 149 149 157 152 148 151 161
Table 24 shows the mean heart rate measured during the study.
Figure 44. Heart Rate (mean) during the study
Figure 44 is a scatter plot of the mean heart rate measured during the study.
0
50
100
150
200
0 1 2 3 4 5 6 7 8 9
Mea
n h
eart
rat
e
1= CPAP 6 cm H2O2-8 = HFNC Flow rate in L/min
Heart Rate (mean)
Study ID 01 Study ID 02 Study ID 03 Study ID 04 Study ID 05 Study ID 06

192
Table 25. Respiratory rate (mean) during the study
Study
ID
CPAP
6 cm
H2O
HFNC
8 LPM
HFNC
7 LPM
HFNC
6 LPM
HFNC
5 LPM
HFNC
4 LPM
HFNC
3 LPM
HFNC
2 LPM
Total
study
Mean
RR
1 58 69 55 77 81 82 69
2 44 74 75 57 51 67 75 64 63
3 82 75 69 72 81 71 62 71 74
4 71 49 46 60 56 64 72 73 63
5 41 49 37 65 52 81 60 42 62
6 40 64 51 65 78 81 72 46 62
Table 25 shows the mean respiratory rate measured during the study.
Figure 45. Respiratory rate (mean) during the study
Figure 45 is a scatter plot of the mean respiratory rate measured during the study.
0
20
40
60
80
100
0 1 2 3 4 5 6 7 8 9
Res
pir
ato
ry r
ate
mea
n
1= CPAP 6 cm H2O pressure2-8= HFNC flow rates in L/min
Respiratory Rate mean
Study ID 01 Study ID 02 Study ID 03 Study ID 04 Study ID 05 Study ID 06

193
Table 26. Transcutaneous O2 saturation levels (mean %) during the study
Study
ID
CPAP
6 cm
H2O
HFNC
8 LPM
HFNC
7 LPM
HFNC
6 LPM
HFNC
5 LPM
HFNC
4 LPM
HFNC
3 LPM
HFNC
2 LPM
Total
study
Mean
SPO2
1 97.2 98.6 97.5 98.7 88.9 99.7 96.3
2 99.5 95.6 97.1 95.1 97 95 96.5 89.4 94.7
3 92 90 91.8 89.8 93.6 93 89 89.5 89.7
4 95.3 97.3 90.4 84 97.4 94 86 96.9 91.5
5 99.2 99.3 98.8 99.5 99.3 98.4 97.6 99 98.7
6 99.7 99.6 99.1 98.8 99.4 99 98.5 98.5 98.7
Table 26 shows the mean O2 saturation levels at different flow levels during the study.
Figure 46. Transcutaneous O2 saturation levels (mean %) during the study
Figure 46 shows the mean O2 saturation levels at different flow levels during the study.
82
84
86
88
90
92
94
96
98
100
102
0 1 2 3 4 5 6 7 8 9
SaO
2 %
1= CPAP 6 cm H2O pressure2-8= HFNC flow rates in L/min
Pulse Oximetry O2 Saturations
Study ID 01 Study ID 02 Study ID 03 Study ID 04 Study ID 05 Study ID 06

194
Table 27. Transcutaneous CO2 (mean) levels during the study
Study
ID
CPAP
6 cm
H2O
HFNC
8 LPM
HFNC
7 LPM
HFNC
6 LPM
HFNC
5 LPM
HFNC
4 LPM
HFNC
3 LPM
HFNC
2 LPM
Total
study
Mean
TcPCO2
1 8 7.2 7.5 7.4 6.7 7.2 6.8
2 9.7 9.4 9.1 9.0 9.1 8.9 9.6 8.8 9.3
3 7.1 8.3 7.4 7.7 7.4 7.3 7.1 7.3 7.1
4 7.4 6.9 6.6 6.7 6.7 7.1 6.8 7.1 6.4
5 5.6 5.3 4.5 5.6 5.7 5.6 5.3 5.5 5.0
6 5.8 6.8 5.9 6.0 5.7 5.9 5.9 5.7 5.6
Table 27 shows the mean transcutaneous CO2 levels measured during the study.
Figure 47. Transcutaneous CO2 (mean) levels during the study
Figure 47 shows the mean transcutaneous CO2 levels measured during the study.
0
2
4
6
8
10
12
0 1 2 3 4 5 6 7 8 9
TcP
CO
2 le
vels
in k
pa
1= CPAP 6 cm H2O pressure2-8= HFNC flow rates in L/min
Transcutaneous CO2 levels in kpa
Study ID 01 Study ID 02 Study ID 03 Study ID 04 Study ID 05 Study ID 06

195
5.6.2 Physiology parameters during respiratory support cross- over (CPAP to HFNC and
vice versa)
The following FiO2 increments had to be made during the study. These changes were within
the limits of the protocol and did not warrant withdrawal from continuing the study.
Study ID 01, 05 and 06 –No FiO2 changes were needed.
Study ID 02 - FiO2 – Increased once by 5% as per protocol (one O2 desaturation to low 80s).
Study ID 03 - FiO2 increased on two occasions as per protocol-O2 desaturations to mid-80s
(FiO2 returned to base line level at the end of the study)
Study ID 04 - FiO2 increased twice as per protocol – back to the baseline post study.
A detailed analysis of physiology parameters profile 10 minute prior to and 10 minutes after
cross over to other mode of respiratory support showed that the physiological status of the
baby was back to baseline within 10 minutes of the change. This indicates that the wash out
time of 30 minutes time adopted in the study protocol after cross over was probably sufficient.
This is illustrated in figure 48.

196
Figure 48. The physiology parameters trend with change in respiratory support mode
(CPAP to HFNC and HFNC to CPAP)
Figure 48 shows the basic respiratory physiology parameters status 10 minute before and after
respiratory support mode crossover.
0
20
40
60
80
100
120
140
160
180
HR RR SPO2 TcPCO2
162
67
95.4
7.1
167
70
95
6.1
Physiology parameters
Physiology data 10 minutes either side of respiratory support mode change
Resp mode 1 Resp mode 2

197
5.7 Safety and adverse events
None of the babies had apnoeic episodes requiring intervention.
There were no episodes of major oxygen desaturations seen during any part of the study or
handling.
One baby had one episode of oxygen desaturation with bradycardia which resolved without
intervention within seconds. This episode was similar to the baby’s pre-study entry episodes
but not frequent enough to meet exclusion criteria.
None of the babies had nasal trauma, air leak episode, escalation of respiratory support
immediately after the study or deterioration of blood gases suggesting decompensation
immediately following the study.
5.8 Conclusions
In this proof of concept physiology study, I was able to identify a suitable measuring
technique and measure satisfactory nasopharyngeal pressure in preterm infants safely. The
ability to measure nasopharyngeal gas concentrations for O2 and CO2 with the same catheter
enabled assessment of this study outcome without additional instrumentation. I was able to
use a novel tidal breathing measurement device in preterm infants during HFNC therapy and
obtain consistent measurements across all flow levels for a period of about two hours. I was
continuously monitoring the babies and was able to ensure safe conduct of the study and with
minimal interference to neonatal care needs.

198
Chapter 6. General Discussion

199
6.1 Thesis Results and Current Literature
6.1.1 Retrospective study of HFNC use over a 5-year period in Royal Victoria Infirmary
tertiary neonatal unit
This retrospective study involved a large number of babies (282 patients) treated with HFNC
and CPAP over a 5-year period and the babies who received HFNC showed worse outcomes
in terms of NIV days (22 days±15 SD in CPAP versus 49 days ±23 SDin HFNC group) and
BPD rate (1.08% in CPAP versus 13.63% in HFNC group).
Though the study has inherent limitations due to being a retrospective study, any possible role
of HFNC resulting in worse lung health outcomes needs to be considered and warrants further
research.
More recently further studies have raised similar concerns. The study by Hoffman et al
covered 2 different time epochs and was a retrospective chart review of HFNC use and
outcomes(139). They reported a trend towards a higher rate of BPD in HFNC group compared
to CPAP/BiPAP group (139). The study by Taha et al was a large retrospective review of a
neonatal database and reported that babies who received HFNC either as lone NIV or in
association with some CPAP use at some period had worse outcomes in terms of BPD (133).
The possible explanation for worse BPD outcomes noted in retrospective studies could be
because of selection bias. The sicker babies might have required prolonged NIV and since
HFNC has been increasingly used as a respiratory support often in place of CPAP there might
have been higher representation of BPD in HFNC group.
Interestingly BPD outcomes in prospective randomised, controlled trials involving HFNC as
either as primary respiratory support or as post extubation support or as a weaning mode of
therapy instead of CPAP have not shown increased rates of BPD in HFNC group(1, 96-98,
114, 127, 130).
The mechanism of any lung damage due to HFNC is largely speculative. It is more likely to
be due to under filled lung volumes rather than due to over distension since the air leak
syndromes in HFNC are less frequent compared to CPAP as indicated in some RCTs (1). The

200
under ventilated lung may be prone to atelectotrauma. The possibility of episodic supra
therapeutic levels of mean airway pressures is a theory that needs to be tested. The effects of
transient rises in pressure are not known both in terms of duration or magnitude of higher
pressures.
In light of the findings in this retrospective review it was decided to appraise available
literature regarding safety and efficacy of HFNC in preterm neonates.
6.1.2 Evidence for efficacy and safety of HFNC in preterm neonates
In this review, I reviewed RCTs comparing efficacy and safety of HFNC to CPAP or other
forms of NIV. The risk of treatment failure (needing escalation of respiratory support or
intubation, as defined by study authors) with HFNC was similar to CPAP when used as post
extubation support [RR (95% CI) of 1.09 (0.90, 1.31)].
A similar risk compared with CPAP was seen for clinical outcomes like BPD when HFNC
was used as primary respiratory support, RR 1.17 95% CI (0.72, 1.90); as post extubation
respiratory support, RR 0.88 95% CI (0.74, 1.05)] and mortality [as primary respiratory
support, RR 0.61 95% CI (0.08, 4.57); as post extubation respiratory support, RR 0.62 95%
CI (0.28, 1.39)].
Unlike CPAP, HFNC proved better when it came to complications of therapy. The
complication risk of air leak syndromes as primary respiratory support, RR 0.42, 95% CI
(0.17, 1.02); as post extubation respiratory support, RR 0.28, 95% CI (0.15, 0.55)] as well as
nasal trauma [as primary respiratory support, RR 0.50 95% CI (0.34, 0.72); as post extubation
respiratory support, RR 0.50 95% CI (0.40, 0.61)].
However, as a primary respiratory support, the risk of treatment failure was higher compared
to CPAP [RR 1.57 95% CI (1.20, 2.05)]. The reason for this difference in outcome is unclear.
The behaviour of lungs in the setting of initial RDS is likely to be different to that of the lungs
in infants who are ready to be extubated. It may be because HFNC is inherently less
efficacious in the setting of progressively worsening respiratory distress as compared to
respiratory distress which is progressively improving. The degree of respiratory support or
how much off-loading of work of breathing HFNC does has not been answered yet in the few

201
physiology studies done so far(73, 74).
In summary, on combining the studies performed to date, I conclude that HFNC is unlikely to
be harmful in the short term because it’s not associated with increased mortality or BPD and
has beneficial effect on nasal trauma and air leak syndromes rates. It does not appear to be as
effective in primary respiratory support. The long-term consequences of this support remain
uncertain and need further research.
6.1.3 Airway pressure measurement methods
In this study, I evaluated the accuracy, range and feasibility of three types of pressure
transducers.
The Gaeltec catheter tip pressure transducer has been used in earlier studies investigating
HFNC and various pressure ranges have been reported by different groups of researchers (27,
29). Earlier Lampland et al used saline filled catheters (24, 31) and Locke et al used an air
filled balloon catheter(30) for measuring oesophageal pressure as an indicator of pleural
pressure. These have the disadvantage of being influenced by gravity or height of the
transducer in relation to the measuring site and in addition the transducer is outside the body,
away from the measuring site. There is also the added effect of length of the catheter, catheter
diameter, body movements leading to artefacts on the pressure wave form and they need
considerable technical skill and expertise to reliably perform. Therefore, catheter mounted
pressure transducers became an attractive option.
The Gaeltec catheter when tested in vitro showed drift in baseline occurring within minutes
and attained levels of ± 1.3 cm H2O pressure off baseline at the end of two hours. The drift in
baseline was larger when pressures at the lower end were tested for stability. A second
catheter that was available was also tested and produced similar results. This problem
persisted despite it being sent back to the company and sensor components being re-laid and
retested in factory conditions. The linearity although was reasonable, the performance of
pressure recording was not stable at any given pressure point. Ultimately, attempts at
recording pressure in two babies did not produce reliable pressure recording.
The likely reasons for our experience with the Gaeltec catheter tip mounted pressure
transducer include firstly, a faulty batch which is less likely as it was returned to the company

202
for repair. Secondly, these sensors have a very wide pressure range from 0-300 mm Hg (or 0-
407.8 cm H2O). This range is 40 times larger than our intended pressure range. Thus, at the
very extreme ends of its range it may not be accurate enough. Thirdly, the influence of flow
dynamics in a complex anatomical space like the nasopharynx on these sensors have not been
well studied. A lateral wall mounted pressure sensor may not truly catch the pressure
dynamics in the nasopharynx. Therefore, we concluded that Gaeltec catheter was not fit for
purpose in this setting.
A thermal sensor was tested in vitro and found to be accurate with good linearity and
frequency response. However, the main limiting factor in using these sensors is they are
dependent on a flow of gas across their sensor surface in order to detect changes in
temperature and then provide an analogue output of the likely pressure. Thus, it was tested in
two babies’ in vivo and I could not get reliable pressure traces since in preterm babies the flow
through the nasopharyngeal catheter tends to be intermittent and unreliable.
The B&D pressure transducer works with a simple technique of the transducer being exposed
to two different pressure areas and the differential is picked up by a strain gage type of sensor
and an electrical signal is generated based on pressure differential and provided as an
analogue output. Thus, one pressure area is atmospheric and the other is the nasopharynx
accessed through a nasopharyngeal catheter. It does not depend on flow and as long as the
catheter is patent, the pressure differential is appreciated by the sensor. The transducer
showed excellent linearity, stability over time and adequate frequency response for neonatal
breathing frequency. I used this in two babies and obtained reliable pressure traces across all
flow rates and CPAP in one baby and across some flow rates in the second baby.
To conclude, from these measurements, the B&D differential pressure transducer provided a
consistently valid pressure signals with valid data across all flow ranges. This pressure
transducer was found to be suitable to study the nasopharyngeal airway pressures in the
context of preterm neonatal age group.
6.1.4 Airway gas concentration measurement methods during HFNC
The airway dead space wash out effect is one of the proposed mechanisms of action of HFNC.
This has been noted by tracheal gas insufflation studies earlier and subsequently by
observational clinical studies (71, 72). However, it’s not been confirmed or its relative

203
contribution to the efficacy of HFNC has not been studied. We hypothesised that
simultaneous recording of transcutaneous CO2 and airway CO2 levels would help us
understand whether HFNC has any significant role in washing out the airway dead space of
expired air CO2 content.
Firstly, in this study, I showed that it is possible to measure the nasopharyngeal airway gas
concentration quickly with breath-to-breath almost instantaneous data allowing us to compare
the other respiratory parameters at the same time. We used the same nasopharyngeal catheter
used to record pressure thus eliminating the need for invasive instrumentation.
Secondly, the relationship of transcutaneous CO2 to the nasopharyngeal CO2 measured in this
study was interesting. It has been shown in earlier studies that the End tidal CO2 measurment
trends correlate well with transcutaneous CO2 (159). The measured value of average
maximum CO2 in the nasopharyngeal space in this pilot study was always much lower than
that seen in transcutaneous CO2 simultaneously. It could be because of the wash out effect.
This effect is in the process of being tested in a larger study sample.
Finally, the shape of the CO2 trace obtained needs to be explained. The CO2 trace obtained
during high flow has smooth edges unlike that seen during capnometry during tidal breathing
obtained at pneumotach or during ventilation (160) (See Figure 49). The expired CO2
waveform can provide important information concerning airway obstruction and endotracheal
tube leak. Similarly, the shape seen in CO2 analysis from the nasopharyngeal airway during
high flow may be because of increased elimination of CO2 due to high flow and leak. Indeed,
it was seen in one study where they introduced varying amounts of leak during HFNC, the
CO2 clearance improved in the presence of leak at increasing flow levels (22). During high
flow therapy, at any given litre of flow, the volume of dead space to be flushed is determined
by the time allotted by end-expiration and the expiratory pause (22). Therefore, greater gas
flows will flush more dead space until a flow rate is reached that can flush all of the available
anatomical dead space in the available time (22).

204
Figure 49. CO2 trace during high flow, during mechanical ventilation preterm neonate
(160) and facemask ventilation via pneumotachograph (160, 161)
Figure 49 shows shape of the CO2 trace during high flow, during mechanical ventilation
preterm neonate and facemask ventilation via pneumotachograph.
CO2 trace
CO2 with
ventilation
CO2 with
pneumotach

205
The normal end tidal capnometry has a square shape and the plateau phase is truly alveolar
CO2 only when there is no obstruction in airways distal to site of CO2 measurement or there is
no washout from conducting airways allowing steady state (either of these scenarios, if
present, there will be a reduction in end tidal CO2). Therefore, a possible reason for this shape
during HFNC could be because of CO2 wash out effect of HFNC.
HFNC therapy has been postulated to provide the prescribed FiO2 concentration in view of
the high inspiratory flows well above the inspiratroy flow demands of the neonate(162). Thus
there is less room for entrainment of room air during inspiration, diluting the FiO2 in the
inspiratory limb of HFNC circuit. However, from the available gas concentration test results
in Table Number 21, there was slightly lower measured O2 concentration compared to the
administered FiO2.
6.1.5 Tidal breathing indices evaluation using Volusense in preterm neonates
There has been a renewed interest in measurement of tidal breathing indices in assessment of
respiratory function. There is a pressing need for robust infant lung function testing in view of
increasing interventions in infants for various respiratory conditions. However, the main
limiting factor in infant lung function testing has been the need for sedation or need for
instrumentation involving the face. The contact of measuring devices or a face mask on the
facial skin elicits possible reflex neurologic responses altering the breathing characteristics
and ventilation indices(78). In addition, pneumotach adds to the dead space and resistance
component. Therefore, non-invasive measurement techniques like Respiratory Inductance
Plethysmography have come into vogue. Electromagnetic Inductance Plethysmography by
Volusense being a recent method of evaluating tidal breathing indices, I evaluated the
feasibility of performing measurements using this technique in preterm neonates on HFNC
support.
The tidal breathing indices were reliably obtained in all 6 infants. The measurement was easy
to implement with minimal disruption to the neonates’ daily routine. The instrumentation did
not interfere with respiratory care, feeding and other nursing care of a preterm neonate. There
were no adverse events related to use of this device.

206
To my knowledge, there has been no similar study reported using Volusense electromagnetic
inductance plethysmography (EIP) on preterm neonates during HFNC therapy.
In a study on preterm babies of gestation 28±2 weeks with respiratory support on CPAP and
bi-level and when breathing was unsupported, Pickerd et al measured tidal breathing indices
(154). They also measured weekly measurements using electromagnetic inductance
plethysmography EIP. They could obtain consistent trends in respiratory rate and tidal volume
per kg with varying respiratory support levels in preterm neonates (154). Earlier the same
group measured tidal breathing indices using electromagnetic inductance plethysmography
(EIP) in 49 healthy spontaneously breathing infants between 32 and 42 weeks gestational
age(81).
Olden compared tidal breathing indices using electromagnetic inductance plethysmography
(EIP) in normal infants with that seen in infants with BPD(163) and concluded that it is
possible to measure tidal breathing parameters accurately, in healthy newborn infants, without
prior calibration on the infant(163).
Bentsen and colleagues measured tidal breathing indices by electromagnetic inductance
plethysmography (EIP) in 10 preterm infants weighing about 1500 grams and 10 term infants
with trained nurse performing the measurements. They concluded that measurements were
well tolerated by the infants and the repeatability was better for term infants and the
repeatability was as reported in other infant lung function tests being relatively poor compared
to older children and adults (164).
The same group compared tidal breathing indices obtained from Volusense to that obtained
via a facemask using an ultrasonic flowmeter. They found agreement within ±5.5% except for
peak tidal expiratory flow (PTEF)(157). They found that the application of the facemask
significantly increased tidal volume, minute ventilation, PTEF, the ratio of inspiratory to
expiratory time and the ratio of expiratory flow at 50% of expired volume to PTEF (157).
They concluded that Volusense electromagnetic inductance plethysmography (EIP) was well
suited for tidal breathing measurements in infants where facemask cannot be used (157).
In conclusion, I found that application of Volusense vests was easy, well tolerated by infants,
the assembling of equipment was achieved with little hindrance to routine care and the

207
procedure was well tolerated by preterm neonates. Although I did not confirm the tidal
volume accuracy with that obtained by face mask and pneumotach method, the range of tidal
volumes I obtained was within the range expected in preterm neonates.
6.2 Safety Aspects of a Respiratory Physiology Study in Preterm Neonates
The basic respiratory physiology parameters namely, respiratory rate, gas exchange
parameters including SPO2 and TcPCO2 levels were stable during the study in all cases.
Only 3 babies out of 6 needed adjustment of FiO2. This was well within the limits agreed in
the protocol for safety reasons and did not require the study to be terminated.
There were no nasal trauma or air leak complications. There were no immediate respiratory
decompensation following the study.
There were no concerns raised by clinical team, nursing staff or parents during the conduct of
the study.
6.3 Strengths and Limitations of the Study
This main strength of this study is an extensive exploration of evidences and methods of
evaluation of respiratory physiology parameters including airway pressures and gas
concentrations in nasopharyngeal airway as well as a novel method of determining tidal
breathing indices. The study showed the likely valid tools for measuring airway pressures
safely and accurately.
The airway pressures were measured with a catheter placed in nasopharyngeal airway
connected to a differential pressure transducer. This method was shown to be feasible and the
system had good agreement when checked in vitro against a control pressure source. The
continuous measurement of pressures is an ideal goal but difficult to achieve. The main reason
is because of the small size of preterm neonates; the instruments have to be of smaller calibre
and hence are prone for blockage with secretions. Therefore, one has to rely on a consistent
epoch of valid measurements at each level of respiratory support mode of interest. The
segment that one chooses to report needs to be standardised, otherwise it is prone for
reporting bias.

208
The measurement of gas concentration is an interesting aspect which has not been looked into
much by other physiology studies on HFNC therapy. One of the strengths of this study is that
I showed it is possible to rapidly obtain and record continuous gas concentration status in
these preterm neonates. The simultaneous measurement of transcutaneous CO2 gives added
information about the gas exchange status or ventilation efficacy at that point in time. A larger
study with adequate data points will help us quantify any CO2 wash out from air way dead
space during HFNC therapy.
A novel method determining tidal volumes non-invasively using Volusense was shown to be
feasible and well tolerated by preterm infants. This machine though bulky, could fit within the
space available in the neonatal unit. The study methods were demonstrated to be safe and
tolerable by this vulnerable group of preterm neonates.
The study is limited by lack of some control measurements particularly with Volusense tidal
breathing assessments. However, that would have added time and burden of instrumentation
to the babies which was the reason for not including it in the protocol. Moreover, there has
been published evidence that Volusense electromagnetic inductance plethysmography (EIP) is
a valid tool to evaluate tidal breathing indices.
Since this is a proof of concept study the number of samples obtained with pressure and air
way gas concentration techniques are not sufficient to make quantitative judgments.

209
6.4 Future Research
This study will be followed up with a larger randomised cross over study involving same
protocol to obtain sufficient numbers of data points. Then it will be possible to make
quantitative conclusions of the relative role of different mechanisms of HFNC in providing
respiratory support in addition to humidification and oxygenation.
The non-invasive tidal volume measuring technique used in this study can be used for follow
up measurements of tidal breathing indices serially for preterm infants with significant
chronic neonatal lung disease. It can also be used to study changes in pulmonary function
with different respiratory support modes and in different physiologic states such as sleep and
awake. It can also be used to evaluate tidal breathing indices in various pulmonary disease
states and response to therapy such as in bronchiolitis.
The areas where there are considerable lacunae in HFNC therapy are identifying best weaning
strategy with HFNC, whether HFNC cause harm to ELBW babies and some other areas such
as in improving quality of life to palliative patients by enabling home therapy and whether it
is possible to deliver aerosol medications effectively during HFNC. There is also need for
long term follow up of babies who received HFNC in the neonatal unit and post term babies
with severe BPD who sometimes spend weeks on HFNC to assess effects on lung function
and respiratory health.

210
6.5 My Personal Reflections about This Work
Personally, I have gained several important skills in conducting research from this project.
The process of conceptualising the ideas into an ethically acceptable and practically
implementable methodology in a protocol was an educational experience. I found that it is
important to learn the skills of ‘thinking ahead’ to work out the likely issues, problems and
seeking solutions to these issues. I had many long hours of physiology discussion with my
supervisors, which helped improve my understanding of some of the difficult concepts
involved.
The rigorous ethical approval process helped in improving my own understanding of what
these investigations would mean to the ultimate stake holders in the study ‘the preterm
neonates’. The research equipment and materials can be expensive and I learned that the
process of convincing a funding source to provide financial support can be quite challenging.
I needed to clearly know the likely benefits this research would give, to convince a committee
to part with some of their money. The support structure and monitoring process of hospital
trust showed me that at the core of this hospitals’ aim was patient safety and the research
governance team was thorough in their evaluation before giving the permission to conduct
this research.
The respiratory physiology investigations, especially in small preterm babies are challenging
to conduct. I feel there is an immense need in developing miniature diagnostic tools
particularly sensors and transducers which can be incorporated to the routine devices such as
nasogastric tube for example, to measure oesophageal pressures. I read during my literature
review the versatility of optical fibres and felt it was applicable for some of the equipment we
needed. There is also need for developing the technology and improve the quality of data in
non-invasive lung function measuring methods in infants.
By doing this project, I have improved my skills in research and I feel more confident with
my research skills to pursue my interest, respiratory physiology and lung function in infants.

211
Chapter 7. References

212
1. Wilkinson D, Andersen C, O'Donnell CPF, De Paoli AG, Manley BJ. High flow nasal
cannula for respiratory support in preterm infants. Cochrane Database of Systematic Reviews.
2016(2).
2. Haq I, Gopalakaje S, Fenton AC, McKean MC, J. O’Brien C, Brodlie M. The
evidence for high flow nasal cannula devices in infants. Paediatric Respiratory Reviews.
2014;15(2):124-34.
3. Kubicka ZJ, Limauro J, Darnall RA. Heated, Humidified High-Flow Nasal Cannula
Therapy: Yet Another Way to Deliver Continuous Positive Airway Pressure? PEDIATRICS.
2008;121(1):82-8.
4. Schroeder G, Ten Broeck, D., S. Bamford, O., Niland, W., Felino, V. and Cortez, J.
Apparatus and method for respiratory tract therapy. . US7314046B2. 1999.
5. Blackmer R. High humidity oxygen enricher apparatus. 1986( US4632677A).
6. Elsworth A, Daniell, M., Zwaan, P. and Stewart, D. . Methods of and/or apparatus for
humidifying gases. 1987(US4708831A).
7. de Klerk A. Humidified High-Flow Nasal Cannula: Is It the New and Improved
CPAP? Advances in Neonatal Care. 2008;8(2):98-106.
8. Hough JL, Shearman AD, Jardine LA, Davies MW. Humidified high flow nasal
cannulae: Current practice in Australasian nurseries, a survey. Journal of Paediatrics and
Child Health. 2012;48(2):106-13.
9. Hochwald O, Osiovich H. The use of high flow nasal cannulae in neonatal intensive
care units: Is clinical practice consistent with the evidence? Journal of Neonatal-Perinatal
Medicine. 2010;3(3):187-91.
10. Nath P, Ponnusamy V, Willis K, Bissett L, Clarke P. Current practices of high and low
flow oxygen therapy and humidification in UK neonatal units. Pediatrics International.
2010;52(6):893-4.
11. Desai P, Shetty S, Singh N, Kennea N. 396 Current Practice Regarding the use of
Humidified High Flow Nasal Cannulae (HHFNC) in UK Neonatal Units. Archives of Disease
in Childhood. 2012;97(Suppl 2):A116-A.
12. Ojha S, Gridley E, Dorling J. Use of heated humidified high-flow nasal cannula
oxygen in neonates: a UK wide survey. Acta Paediatrica. 2013;102(3):249-53.
13. Saikiran Gopalakaje, Sundeep Harigopal, Chris O'Brien, Malcolm Brodlie, Alan
Fenton. . 5-Year Trends in Neonatal Respiratory Support: Influence of High Flow Nasal
Cannula (HFNC) Oxygen Therapy on Incidence of Severe BPD. Poster Abstract.
2014;Pediatric Academic Society.
213
14. Dysart K, Miller TL, Wolfson MR, Shaffer TH. Research in high flow therapy:
Mechanisms of action. Respiratory Medicine. 2009;103(10):1400-5.
15. Kopelman AE. Airway Obstruction in Two Extremely Low Birthweight Infants
Treated with Oxygen Cannulas. Journal Of Perinatology. 2003;23:164.
16. Woodhead DD, Lambert DK, Clark JM, Christensen RD. Comparing two methods of
delivering high-flow gas therapy by nasal cannula following endotracheal extubation: a
prospective, randomized, masked, crossover trial. Journal Of Perinatology. 2006;26:481.
17. Saslow JG, Aghai ZH, Nakhla TA, Hart JJ, Lawrysh R, Stahl GE, et al. Work of
breathing using high-flow nasal cannula in preterm infants. Journal Of Perinatology.
2006;26:476.
18. Greenspan JS, Wolfson MR, Shaffer TH. Airway responsiveness to low inspired gas
temperature in preterm neonates. The Journal of Pediatrics.118(3):443-5.
19. Gregory GA, Kitterman JA, Phibbs RH, Tooley WH, Hamilton WK. Treatment of
the Idiopathic Respiratory-Distress Syndrome with Continuous Positive Airway Pressure.
New England Journal of Medicine. 1971;284(24):1333-40.
20. Sivieri EM, Gerdes JS, Abbasi S. Effect of HFNC flow rate, cannula size, and nares
diameter on generated airway pressures: An in vitro study. Pediatric Pulmonology.
2013;48(5):506-14.
21. Volsko TA, Fedor K, Amadei J, Chatburn RL. High Flow Through a Nasal Cannula
and CPAP Effect in a Simulated Infant Model. Respiratory Care. 2011;56(12):1893-900.
22. Frizzola M, Miller TL, Rodriguez ME, Zhu Y, Rojas J, Hesek A, et al. High-Flow
Nasal Cannula: Impact on Oxygenation and Ventilation in an Acute Lung Model. Pediatric
Pulmonology. 2011;46(1):67-74.
23. Hasan RA, Habib RH. Effects of flow rate and airleak at the nares and mouth opening
on positive distending pressure delivery using commercially available high-flow nasal
cannula systems: A lung model study. Pediatric Critical Care Medicine. 2011;12(1):e29-e33.
24. Sreenan C, Lemke RP, Hudson-Mason A, Osiovich H. High-Flow Nasal Cannulae in
the Management of Apnea of Prematurity: A Comparison With Conventional Nasal
Continuous Positive Airway Pressure. Pediatrics. 2001;107(5):1081-3.
25. Al-Alaiyan S, Dawoud M, Al-Hazzani F. Positive distending pressure produced by
heated, humidified high flow nasal cannula as compared to nasal continuous positive airway
pressure in premature infants. Journal of Neonatal-Perinatal Medicine. 2014;7(2):119-24.

214
26. Spence KL, Murphy D, Kilian C, McGonigle R, Kilani RA. High-flow nasal cannula
as a device to provide continuous positive airway pressure in infants. Journal Of Perinatology.
2007;27:772.
27. Wilkinson DJ, Andersen CC, Smith K, Holberton J. Pharyngeal pressure with high-
flow nasal cannulae in premature infants. Journal Of Perinatology. 2007;28:42.
28. Arora B, Mahajan P, Zidan MA, Sethuraman U. Nasopharyngeal Airway Pressures in
Bronchiolitis Patients Treated With High-Flow Nasal Cannula Oxygen Therapy. Pediatric
Emergency Care. 2012;28(11):1179-84.
29. Collins CL, Holberton JR, König K. Comparison of the pharyngeal pressure provided
by two heated, humidified high-flow nasal cannulae devices in premature infants. Journal of
Paediatrics and Child Health. 2013;49(7):554-6.
30. Locke RG, Wolfson MR, Shaffer TH, Rubenstein SD, Greenspan JS. Inadvertent
administration of positive end-distending pressure during nasal cannula flow. Pediatrics.
1993;91(1 I):135-8.
31. Lampland AL, Plumm B, Meyers PA, Worwa CT, Mammel MC. Observational Study
of Humidified High-Flow Nasal Cannula Compared with Nasal Continuous Positive Airway
Pressure. The Journal of Pediatrics. 2009;154(2):177-82.e2.
32. Bamat N. MCJ, Kirpalani H. . Continuous Distending Pressure: Springer, Cham;
2017.
33. McKiernan C, Chua LC, Visintainer PF, Allen H. High Flow Nasal Cannulae Therapy
in Infants with Bronchiolitis. The Journal of Pediatrics. 2010;156(4):634-8.
34. Abboud PA, Roth PJ, Skiles CL, Stolfi A, Rowin ME. Predictors of failure in infants
with viral bronchiolitis treated with high-flow, high-humidity nasal cannula therapy*.
Pediatric Critical Care Medicine. 2012;13(6):e343-e9.
35. Corley A, Caruana LR, Barnett AG, Tronstad O, Fraser JF. Oxygen delivery through
high-flow nasal cannulae increase end-expiratory lung volume and reduce respiratory rate in
post-cardiac surgical patients. British Journal of Anaesthesia. 2011;107(6):998-1004.
36. Lavizzari A, Veneroni C, Colnaghi M, Ciuffini F, Zannin E, Fumagalli M, et al.
Respiratory mechanics during NCPAP and HHHFNC at equal distending pressures. Archives
of Disease in Childhood - Fetal and Neonatal Edition. 2014;99(4):F315-F20.
37. Boumecid H, Rakza T, Abazine A, Klosowski S, Matran R, Storme L. Influence of
three nasal continuous positive airway pressure devices on breathing pattern in preterm
infants. Archives of Disease in Childhood - Fetal and Neonatal Edition. 2007;92(4):F298-
F300.

215
38. Manley BJ, Owen LS. High-flow nasal cannula: Mechanisms, evidence and
recommendations. Seminars in Fetal and Neonatal Medicine. 2016;21(3):139-45.
39. Shetty S, Hickey A, Rafferty GF, Peacock JL, Greenough A. Work of breathing
during CPAP and heated humidified high-flow nasal cannula. Archives of disease in
childhood Fetal and neonatal edition. 2016;101(5):F404-7.
40. Weiler T, Kamerkar A, Hotz J, Ross PA, Newth CJL, Khemani RG. The Relationship
between High Flow Nasal Cannula Flow Rate and Effort of Breathing in Children. J Pediatr.
2017;189:66-71.e3.
41. Miller TL. Role of Pressure in High Velocity Nasal Insufflation.
42. Spence CJT, Buchmann NA, Jermy MC, Moore SM. Stereoscopic PIV measurements
of flow in the nasal cavity with high flow therapy. Experiments in Fluids. 2011;50(4):1005-
17.
43. Çakmak Ö, Coşkun M, Çelik H, Büyüklü F, Özlüoğlu LN. Value of Acoustic
Rhinometry for Measuring Nasal Valve Area. The Laryngoscope. 2003;113(2):295-302.
44. Cole P. Biophysics of Nasal Airflow: A Review. American Journal of Rhinology.
2000;14(4):245-9.
45. Liu Y, Johnson MR, Matida EA, Kherani S, Marsan J. Creation of a standardized
geometry of the human nasal cavity. Journal of Applied Physiology. 2009;106(3):784-95.
46. Wolf M, Naftali S, Schroter RC, Elad D. Air-conditioning characteristics of the human
nose. The Journal of Laryngology & Otology. 2006;118(2):87-92.
47. Likus W, Gruszczyńska K, Markowski J, Machnikowska-Sokołowska M, Olczak Z,
Bajor G, et al. Correlations between selected parameters of nasal cavity in neonates and
young infants — CT study2015.
48. Djupesland PG, Lyholm B. Changes in nasal airway dimensions in infancy. Acta oto-
laryngologica. 1998;118(6):852-8.
49. Ward JJ. High-Flow Oxygen Administration by Nasal Cannula for Adult and Perinatal
Patients. Respiratory Care. 2013;58(1):98-122.
50. De Paoli AG, Davis PG, Faber B, Morley CJ. Devices and pressure sources for
administration of nasal continuous positive airway pressure (NCPAP) in preterm neonates.
Cochrane Database of Systematic Reviews. 2008(1).
51. Athikarisamy SE KA, Kritas S, Omari T, Andersen C. AIRWAY PRESSURES IN
PRETERM BABIES ON HIGH FLOW NASAL CANULAE (OPTIFLOW). Journal of
Paediatrics and Child Health 2011;47 ((Suppl. 1) ):60–116.

216
52. Chang GY, Cox CA, Shaffer TH. Nasal Cannula, CPAP, and High-Flow Nasal
Cannula: Effect of Flow on Temperature, Humidity, Pressure, and Resistance. Biomedical
Instrumentation & Technology. 2011;45(1):69-74.
53. Pyon KH AZ, Nakhla TA, Stahl GE, Saslow JG. High flow nasal cannula in preterm
infants: Effects of high flow rates on work of breathing. Proceedings of the Pediatric
Academic Societies Annual Meeting;; May 3-6; Honolulu (HI) 2008
54. Milési C, Boubal M, Jacquot A, Baleine J, Durand S, Pons-Odena M, et al. High-flow
nasal cannula: Recommendations for daily practice in pediatrics2014. 29 p.
55. Poeggel S, Tosi D, Duraibabu D, Leen G, McGrath D, Lewis E. Optical Fibre Pressure
Sensors in Medical Applications. Sensors. 2015;15(7):17115-48.
56. Evans SA, Watson L, Cowley AJ, Johnston ID, Kinnear WJ. Normal range for
transdiaphragmatic pressures during sniffs with catheter mounted transducers. Thorax.
1993;48(7):750-3.
57. Cooper MA, Fletter PC, Zaszczurynski PJ, Damaser MS. Comparison of air-charged
and water-filled urodynamic pressure measurement catheters. Neurourology and
Urodynamics. 2011;30(3):329-34.
58. Mazmanyan P, Darakchyan M, Feng S, Tatkov S. Airway pressure during nasal high
flow and CPAP in neonates. European Respiratory Journal. 2015;46(suppl 59).
59. Frey U, Stocks J, Coates A, Sly P, Bates J. Specifications for equipment used for
infant pulmonary function testing. ERS/ATS Task Force on Standards for Infant Respiratory
Function Testing. European Respiratory Society/ American Thoracic Society. European
Respiratory Journal. 2000;16(4):731-40.
60. Danan C, Dassieu G, Janaud JC, Brochard L. Efficacy of dead-space washout in
mechanically ventilated premature newborns. American Journal of Respiratory and Critical
Care Medicine. 1996;153(5):1571-6.
61. Claure N, D'Ugard C, Bancalari E. Elimination of ventilator dead space during
synchronized ventilation in premature infants. The Journal of Pediatrics. 2003;143(3):315-20.
62. Burke WC, Nahum A, Ravenscraft SA, Nakos G, Adams AB, Marcy TW, et al.
Modes of Tracheal Gas Insufflation: Comparison of Continuous and Phase-specific Gas
Injection in Normal Dogs. American Review of Respiratory Disease. 1993;148(3):562-8.
63. Dassieu G, Brochard L, Agudze E, Patkai J, Janaud JC, Danan C. Continuous tracheal
gas insufflation enables a volume reduction strategy in hyaline membrane disease: technical
aspects and clinical results. Intensive Care Med. 1998;24(10):1076-82.

217
64. Bernath MA, Henning R. Tracheal gas insufflation reduces requirements for
mechanical ventilation in a rabbit model of respiratory distress syndrome. Anaesthesia and
intensive care. 1997;25(1):15-22.
65. Nahum A. Animal and lung model studies of tracheal gas insufflation. Respir Care.
2001;46(2):149-57.
66. DASSIEU G, BROCHARD L, BENANI M, AVENEL S, DANAN C. Continuous
Tracheal Gas Insufflation in Preterm Infants with Hyaline Membrane Disease. American
Journal of Respiratory and Critical Care Medicine. 2000;162(3):826-31.
67. Zhu G, Shaffer TH, Wolfson MR. Continuous tracheal gas insufflation during partial
liquid ventilation in juvenile rabbits with acute lung injury. Journal of applied physiology
(Bethesda, Md : 1985). 2004;96(4):1415-24.
68. Oliver RE, Rozycki HJ, Greenspan JS, Wolfson MR, Shaffer TH. Tracheal gas
insufflation as a lung-protective strategy: physiologic, histologic, and biochemical markers.
Pediatric critical care medicine : a journal of the Society of Critical Care Medicine and the
World Federation of Pediatric Intensive and Critical Care Societies. 2005;6(1):64-9.
69. Nakos G, Lachana A, Prekates A, Pneumatikos J, Guillaume M, Pappas K, et al.
Respiratory effects of tracheal gas insufflation in spontaneously breathing COPD patients.
Intensive Care Med. 1995;21(11):904-12.
70. Miller TL, Blackson TJ, Shaffer TH, Touch SM. Tracheal gas insufflation-augmented
continuous positive airway pressure in a spontaneously breathing model of neonatal
respiratory distress. Pediatr Pulmonol. 2004;38(5):386-95.
71. Dewan NA, Bell CW. Effect of low flow and high flow oxygen delivery on exercise
tolerance and sensation of dyspnea. A study comparing the transtracheal catheter and nasal
prongs. Chest. 1994;105(4):1061-5.
72. Holleman-Duray D, Kaupie D, Weiss MG. Heated humidified high-flow nasal
cannula: use and a neonatal early extubation protocol. Journal of perinatology : official
journal of the California Perinatal Association. 2007;27(12):776-81.
73. Chatila W, Nugent T, Vance G, Gaughan J, Criner GJ. The effects of high-flow vs
low-flow oxygen on exercise in advanced obstructive airways disease. Chest.
2004;126(4):1108-15.
74. Malinowski T LJ. Oxygen concentrations via nasal cannula at high flowrates. Respir
Care 2002;47((9)):1039.
75. Garg R, Gupta RC. Analysis of Oxygen, Anaesthesia Agent and Flows in Anaesthesia
Machine. Indian Journal of Anaesthesia. 2013;57(5):481-8.

218
76. Langton JA, Hutton A. Respiratory gas analysis. Continuing Education in Anaesthesia
Critical Care & Pain. 2009;9(1):19-23.
77. Retory Y, Niedzialkowski P, de Picciotto C, Bonay M, Petitjean M. New Respiratory
Inductive Plethysmography (RIP) Method for Evaluating Ventilatory Adaptation during Mild
Physical Activities. PLOS ONE. 2016;11(3):e0151983.
78. Fleming PJ, Levine MR, Goncalves A. Changes in respiratory pattern resulting from
the use of a facemask to record respiration in newborn infants. Pediatric research.
1982;16(12):1031-4.
79. Stick SM, Ellis E, Lesouëf PN, Sly PD. Validation of respiratory inductance
plethysmography (“Respitrace”®) for the measurement of tidal breathing parameters in
newborns. Pediatric Pulmonology. 1992;14(3):187-91.
80. Mehra R, Strohl KP. Chapter 14 - Evaluation and Monitoring of Respiratory Function
A2 - Chokroverty, Sudhansu. Sleep Disorders Medicine (Third Edition). Philadelphia: W.B.
Saunders; 2009. p. 188-97.
81. Pickerd N, Williams EM, Kotecha S. Electromagnetic inductance plethysmography to
measure tidal breathing in preterm and term infants. Pediatric Pulmonology. 2013;48(2):160-
7.
82. Williams EM, Pickerd N, Eriksen M, Øygarden K, Kotecha S. Estimation of tidal
ventilation in preterm and term newborn infants using electromagnetic inductance
plethysmography. Physiological Measurement. 2011;32(11):1833.
83. Parke RL, McGuinness SP. Pressures delivered by nasal high flow oxygen during all
phases of the respiratory cycle. Respir Care. 2013;58(10):1621-4.
84. Möller W, Celik G, Feng S, Bartenstein P, Meyer G, Eickelberg O, et al. Nasal high
flow clears anatomical dead space in upper airway models. Journal of Applied Physiology.
2015;118(12):1525-32.
85. Moller W, Feng S, Domanski U, Franke KJ, Celik G, Bartenstein P, et al. Nasal high
flow reduces dead space. Journal of applied physiology (Bethesda, Md : 1985).
2017;122(1):191-7.
86. Sivieri EM, Foglia EE, Abbasi S. Carbon dioxide washout during high flow nasal
cannula versus nasal CPAP support: An in vitro study. Pediatr Pulmonol. 2017;52(6):792-8.
87. Shetty S, Greenough A. Review finds insufficient evidence to support the routine use
of heated, humidified high-flow nasal cannula use in neonates. Acta Paediatrica.
2014;103(9):898-903.

219
88. Shoemaker MT, Pierce MR, Yoder BA, DiGeronimo RJ. High flow nasal cannula
versus nasal CPAP for neonatal respiratory disease: a retrospective study. Journal of
perinatology : official journal of the California Perinatal Association. 2007;27(2):85-91.
89. Graham PL, 3rd, Begg MD, Larson E, Della-Latta P, Allen A, Saiman L. Risk factors
for late onset gram-negative sepsis in low birth weight infants hospitalized in the neonatal
intensive care unit. The Pediatric infectious disease journal. 2006;25(2):113-7.
90. Dreyfuss D, Soler P, Basset G, Saumon G. High Inflation Pressure Pulmonary Edema:
Respective Effects of High Airway Pressure, High Tidal Volume, and Positive End-expiratory
Pressure. American Review of Respiratory Disease. 1988;137(5):1159-64.
91. Roberts CT, Dawson JA, Alquoka E, Carew PJ, Donath SM, Davis PG, et al. Are high
flow nasal cannulae noisier than bubble CPAP for preterm infants? Archives of Disease in
Childhood - Fetal and Neonatal Edition. 2014;99(4):F291-F6.
92. Konig K, Stock EL, Jarvis M. Noise levels of neonatal high-flow nasal cannula
devices--an in-vitro study. Neonatology. 2013;103(4):264-7.
93. Jasin LR, Kern S, Thompson S, Walter C, Rone JM, Yohannan MD. Subcutaneous
scalp emphysema, pneumo-orbitis and pneumocephalus in a neonate on high humidity high
flow nasal cannula. Journal of perinatology : official journal of the California Perinatal
Association. 2008;28(11):779-81.
94. Hegde S, Prodhan P. Serious Air Leak Syndrome Complicating High-Flow Nasal
Cannula Therapy: A Report of 3 Cases. Pediatrics. 2013;131(3):e939-e44.
95. Iglesias-Deus A, Perez-Munuzuri A, Lopez-Suarez O, Crespo P, Couce ML. Tension
pneumocephalus induced by high-flow nasal cannula ventilation in a neonate. Archives of
disease in childhood Fetal and neonatal edition. 2017;102(2):F173-f5.
96. Collins CL, Holberton JR, Barfield C, Davis PG. A Randomized Controlled Trial to
Compare Heated Humidified High-Flow Nasal Cannulae with Nasal Continuous Positive
Airway Pressure Postextubation in Premature Infants. The Journal of Pediatrics.
2013;162(5):949-54.e1.
97. Yoder BA, Stoddard RA, Li M, King J, Dirnberger DR, Abbasi S. Heated, Humidified
High-Flow Nasal Cannula Versus Nasal CPAP for Respiratory Support in Neonates.
Pediatrics. 2013;131(5):e1482-e90.
98. Manley BJ, Owen LS, Doyle LW, Andersen CC, Cartwright DW, Pritchard MA,
et al. High-Flow Nasal Cannulae in Very Preterm Infants after Extubation. New England
Journal of Medicine. 2013;369(15):1425-33.

220
99. Farley RC, Hough JL, Jardine LA. Strategies for the discontinuation of humidified
high flow nasal cannula (HHFNC) in preterm infants. Cochrane Database of Systematic
Reviews. 2015(6).
100. Ricard JD, Messika J, Sztrymf B, Gaudry S. Impact on outcome of delayed intubation
with high-flow nasal cannula oxygen: is the device solely responsible? Intensive Care Med.
2015;41(6):1157-8.
101. Kang BJ, Koh Y, Lim C-M, Huh JW, Baek S, Han M, et al. Failure of high-flow nasal
cannula therapy may delay intubation and increase mortality. Intensive Care Medicine.
2015;41(4):623-32.
102. JOBE A, BANCALARI E. Bronchopulmonary Dysplasia. American Journal of
Respiratory and Critical Care Medicine. 2001;163(7):1723-9.
103. Kalikkot Thekkeveedu R, Guaman MC, Shivanna B. Bronchopulmonary dysplasia: A
review of pathogenesis and pathophysiology. Respiratory medicine. 2017;132:170-7.
104. Ahlfeld SK, Gao Y, Conway SJ, Tepper RS. Relationship of structural to functional
impairment during alveolar-capillary membrane development. The American journal of
pathology. 2015;185(4):913-9.
105. May C, Kennedy C, Milner AD, Rafferty GF, Peacock JL, Greenough A. Lung
function abnormalities in infants developing bronchopulmonary dysplasia. Archives of
Disease in Childhood. 2011;96(11):1014-9.
106. Cazzato S, Ridolfi L, Bernardi F, Faldella G, Bertelli L. Lung function outcome at
school age in very low birth weight children. Pediatric Pulmonology. 2013;48(8):830-7.
107. Simpson SJ, Hall GL, Wilson AC. Lung function following very preterm birth in the
era of ‘new’ bronchopulmonary dysplasia. Respirology. 2015;20(4):535-40.
108. Robin B, Kim Y-J, Huth J, Klocksieben J, Torres M, Tepper RS, et al. Pulmonary
function in bronchopulmonary dysplasia. Pediatric Pulmonology. 2004;37(3):236-42.
109. Filbrun AG, Popova AP, Linn MJ, McIntosh NA, Hershenson MB. Longitudinal
measures of lung function in infants with bronchopulmonary dysplasia. Pediatric
pulmonology. 2011;46(4):369-75.
110. Kotecha SJ, Adappa R, Gupta N, Watkins WJ, Kotecha S, Chakraborty M. Safety and
Efficacy of High-Flow Nasal Cannula Therapy in Preterm Infants: A Meta-analysis.
PEDIATRICS. 2015;136(3):542-53.
111. [Efficacy and safety of heated humidified high-flow nasal cannula for prevention of
extubation failure in neonates]. Zhonghua er ke za zhi = Chinese journal of pediatrics.
2014;52(4):271-6.
221
112. Elkhwad M* DJ, Jennifer G, Harriet F and Anand K. Randomized Control Trial:
Heated Humidity High Flow Nasal Cannula in Comparison with NCPAP in the Management
of RDS in Extreme Low Birth Infants in Immediate Post Extubation Period. Neonat Pediatr
Med. 2017;3(121).
113. Abdel-Hady H, Shouman B, Aly H. Early weaning from CPAP to high flow nasal
cannula in preterm infants is associated with prolonged oxygen requirement: a randomized
controlled trial. Early human development. 2011;87(3):205-8.
114. Badiee Z, Eshghi A, Mohammadizadeh M. High Flow Nasal Cannula as a Method for
Rapid Weaning From Nasal Continuous Positive Airway Pressure. International Journal of
Preventive Medicine. 2015;6:33.
115. Campbell DM, Shah PS, Shah V, Kelly EN. Nasal continuous positive airway pressure
from high flow cannula versus Infant Flow for preterm infants. Journal Of Perinatology.
2006;26:546.
116. Chen J, Gao WW, Xu F, Du LL, Zhang T, Ling X, et al. [Comparison of clinical
efficacy of heated humidified high flow nasal cannula versus nasal continuous positive airway
pressure in treatment of respiratory distress syndrome in very low birth weight infants].
Zhongguo dang dai er ke za zhi = Chinese journal of contemporary pediatrics.
2015;17(8):847-51.
117. CHEN Jia XF, ZHANG Tao, DU Lanlan, GAO Weiwei. Comparison of heated
humidified high flow nasal cannula and nasal continuous positive airway pressure for
prevention of extubation failure in extremely low birth weight infants. Chinese Journal of
Neonatology 2016 31(2).
118. Collins CL, Barfield C, Horne RSC, Davis PG. A comparison of nasal trauma in
preterm infants extubated to either heated humidified high-flow nasal cannulae or nasal
continuous positive airway pressure. European Journal of Pediatrics. 2014;173(2):181-6.
119. F. Ciuffini MC, A. Lavizzari, D. Mercadante, S. Musumeci, F. Mosca. High Flow
Nasal Cannulae in preterm infants. Ped Med Chir (Med Surg Ped). 2013;Vol 35(No 3):118-
24.
120. Fernandez-Alvarez JR, Gandhi RS, Amess P, Mahoney L, Watkins R, Rabe H. Heated
humidified high-flow nasal cannula versus low-flow nasal cannula as weaning mode from
nasal CPAP in infants </=28 weeks of gestation. Eur J Pediatr. 2014;173(1):93-8.
121. Hegde D, Mondkar J, Panchal H, Manerkar S, Jasani B, Kabra N. Heated Humidified
High Flow Nasal Cannula versus Nasal Continuous Positive Airway Pressure as Primary

222
Mode of Respiratory Support for Respiratory Distress in Preterm Infants. Indian pediatrics.
2016;53(2):129-33.
122. Iranpour R, Sadeghnia A, Hesaraki M. 393 High-Flow Nasal Cannula Versus Nasal
Continuous Positive Airway Pressure in the Management of Respiratory Distress Syndrome.
Archives of Disease in Childhood. 2012;97(Suppl 2):A115-A6.
123. Iranpour R SA, Abari SS. . High flow nasal cannula in the treatment of respiratory
distress syndrome in one day-old neonate. Br J Med Med Res. 2016;15:1–7.
124. Kadivar M, Mosayebi Z, Razi N, Nariman S, Sangsari R. High Flow Nasal Cannulae
versus Nasal Continuous Positive Airway Pressure in Neonates with Respiratory Distress
Syndrome Managed with INSURE Method: A Randomized Clinical Trial. Iranian Journal of
Medical Sciences. 2016;41(6):494-500.
125. Kang W-Q, Xu B-L, Liu D-P, Zhang Y-D, Guo J, Li Z-H, et al. [Efficacy of heated
humidified high-flow nasal cannula in preterm infants aged less than 32 weeks after ventilator
weaning]. Zhongguo dang dai er ke za zhi = Chinese journal of contemporary pediatrics.
2016;18(6):488-91.
126. Kugelman A, Riskin A, Said W, Shoris I, Mor F, Bader D. A randomized pilot study
comparing heated humidified high-flow nasal cannulae with NIPPV for RDS. Pediatric
Pulmonology. 2015;50(6):576-83.
127. Lavizzari A, Colnaghi M, Ciuffini F, et al. Heated, humidified high-flow nasal
cannula vs nasal continuous positive airway pressure for respiratory distress syndrome of
prematurity: A randomized clinical noninferiority trial. JAMA Pediatrics. 2016.
128. Mostafa‐Gharehbaghi M. Comparing the effectiveness of nasal continuous positive
airway pressure (NCPAP) and high flow nasal cannula (HFNC) in prevention of post
extubation assisted ventilation Zahedan Journal of Research in Medical Sciences. 2015;17
(6):e984.
129. Baozhi-dan W-c, Ling Li, Wanjun, Chenying, Wuqiong-qiong. Application of heated
humidified high flow nasal cannula after weaning continuous positive airway pressure in
premature infants. Chinese Journal of Maternal and Child Health 2017 28 (11).
130. Roberts CT, Owen LS, Manley BJ, Frøisland DH, Donath SM, Dalziel KM, et al.
Nasal High-Flow Therapy for Primary Respiratory Support in Preterm Infants. New England
Journal of Medicine. 2016;375(12):1142-51.
131. Shin J, Park K, Lee EH, Choi BM. Humidified High Flow Nasal Cannula versus Nasal
Continuous Positive Airway Pressure as an Initial Respiratory Support in Preterm Infants with

223
Respiratory Distress: a Randomized, Controlled Non-Inferiority Trial. Journal of Korean
Medical Science. 2017;32(4):650.
132. Soonsawad S, Swatesutipun B, Limrungsikul A, Nuntnarumit P. Heated Humidified
High-Flow Nasal Cannula for Prevention of Extubation Failure in Preterm Infants. The Indian
Journal of Pediatrics. 2017;84(4):262-6.
133. Taha DK, Kornhauser M, Greenspan JS, Dysart KC, Aghai ZH. High Flow Nasal
Cannula Use Is Associated with Increased Morbidity and Length of Hospitalization in
Extremely Low Birth Weight Infants. J Pediatr. 2016;173:50-5.e1.
134. Zheng G, Huang X-q, Zhao H-h, Jin G-X, Wang B. The Effect of the Treatment with
Heated Humidified High-Flow Nasal Cannula on Neonatal Respiratory Distress Syndrome in
China: A Single-Center Experience. Canadian Respiratory Journal. 2017;2017:3782401.
135. Miller SM, Dowd SA. High-flow nasal cannula and extubation success in the
premature infant: a comparison of two modalities. Journal Of Perinatology. 2010;30:805.
136. Phadtare R JR, Rajhans A, Patil S, Dominic S, Devaskar U. . High flow nasal cannula
oxygen (Vapotherm) in premature infants with respiratory distress syndrome: is it better than
the conventional nasal continuous positive airways pressure (CPAP)? Perinatology
2009;11(1):1–8.
137. Klingenberg C, Pettersen M, Hansen EA, Gustavsen LJ, Dahl IA, Leknessund A, et al.
Patient comfort during treatment with heated humidified high flow nasal cannulae versus
nasal continuous positive airway pressure: a randomised cross-over trial. Archives of Disease
in Childhood - Fetal and Neonatal Edition. 2013.
138. Osman M, Elsharkawy A, Abdel-Hady H. Assessment of pain during application of
nasal-continuous positive airway pressure and heated, humidified high-flow nasal cannulae in
preterm infants. Journal of perinatology : official journal of the California Perinatal
Association. 2015;35(4):263-7.
139. Hoffman SB, Terrell N, Driscoll CH, Davis NL. Impact of High-Flow Nasal Cannula
Use on Neonatal Respiratory Support Patterns and Length of Stay. Respiratory Care.
2016;61(10):1299-304.
140. Nair G KP. Comparison of the effects of Vapotherm and nasal CPAP in respiratory
distress. Pediatric Academic Societies Meeting. 2005
141. Soonsawad S, Tongsawang N, Nuntnarumit P. Heated Humidified High-Flow Nasal
Cannula for Weaning from Continuous Positive Airway Pressure in Preterm Infants: A
Randomized Controlled Trial. Neonatology. 2016;110(3):204-9.

224
142. Roberts CT, Hodgson KA. Nasal high flow treatment in preterm infants. Maternal
Health, Neonatology and Perinatology. 2017;3(1):15.
143. Kugelman A, Riskin A, Said W, Shoris I, Mor F, Bader D. A randomized pilot study
comparing heated humidified high-flow nasal cannulae with NIPPV for RDS. Pediatric
Pulmonology. 2014;50(6):576-83.
144. Lavizzari A, colnaghi M, Ciuffini F, veneroni C, Musumeci S, Cortinovis I, et al.
Heated, Humidified High-Flow Nasal Cannula vs Nasal Continuous Positive Airway Pressure
for Respiratory Distress Syndrome of Prematurity A Randomized Clinical Noninferiority
Trial2016.
145. Nair G KP. Comparison of the effects of Vapotherm and nasal CPAP in respiratory
distress in preterm infants. Pediatric Academic Societies Annual Meeting; Washington DC
2005.
146. Manley BJ, Owen LS, Doyle LW, Andersen CC, Cartwright DW, Pritchard MA, et al.
High-Flow Nasal Cannulae in Very Preterm Infants after Extubation. New England Journal of
Medicine. 2013;369(15):1425-33.
147. Abdel-Hady H, Shouman B, Aly H. Early weaning from CPAP to high flow nasal
cannula in preterm infants is associated with prolonged oxygen requirement: A randomized
controlled trial. Early Human Development. 2011;87(3):205-8.
148. Badiee Z, Eshghi A, Mohammadizadeh M. High flow nasal cannula as a method for
rapid weaning from nasal continuous positive airway pressure. International Journal of
Preventive Medicine. 2015;6(1):33.
149. Klingenberg C, Pettersen M, Hansen EA, Gustavsen LJ, Dahl IA, Leknessund A, et al.
Patient comfort during treatment with heated humidified high flow nasal cannulae versus
nasal continuous positive airway pressure: a randomised cross-over trial. Archives of Disease
in Childhood - Fetal and Neonatal Edition. 2013;99(2):F134-F7.
150. Osman M, Elsharkawy A, Abdel-Hady H. Assessment of pain during application of
nasal-continuous positive airway pressure and heated, humidified high-flow nasal cannulae in
preterm infants. Journal of Perinatology. 2014;35(4):263-7.
151. Saikiran Gopalakaje SH, Chris O’Brien, Malcolm Brodlie, Alan Fenton. 5-Year
Trends in Neonatal Respiratory Support: Influence of High Flow Nasal Cannula (HFNC)
Oxygen Therapy on Incidence of Severe BPD. 2014.
152. Gabe IT. Chapter 2 - Pressure Measurement in Experimental Physiology A2 -
BERGEL, D.H. Cardiovascular Fluid Dynamics: Academic Press; 1972. p. 11-50.

225
153. Schulze A, Davis PG. Proportional assist: time to re-evaluate a ‘new’ mode of
ventilation for neonates? Archives of Disease in Childhood - Fetal and Neonatal Edition.
2015;100(1):F4-F5.
154. Pickerd N, Williams EM, Watkins WJ, Kotecha S. Tidal breathing in preterm infants
receiving and weaning from continuous positive airway pressure. J Pediatr.
2014;164(5):1058-63.e1.
155. Williams EM, Pickerd N, Eriksen M, Øygarden K, Kotecha S. Estimation of tidal
ventilation in preterm and term newborn infants using electromagnetic inductance
plethysmography. Physiological Measurement. 2011;32(11):1833-45.
156. Pickerd N, Williams EM, Kotecha S. Electromagnetic inductance plethysmography to
measure tidal breathing in preterm and term infants. Pediatric Pulmonology. 2012;48(2):160-
7.
157. Bentsen MH, Eriksen M, Olsen MS, Markestad T, Halvorsen T. Electromagnetic
inductance plethysmography is well suited to measure tidal breathing in infants. ERJ open
research. 2016;2(4).
158. Olden C, Symes E, Seddon P. Measuring tidal breathing parameters using a
volumetric vest in neonates with and without lung disease. Pediatric Pulmonology.
2010;45(11):1070-5.
159. Orlikowski D, Prigent H, Ambrosi X, Vaugier I, Pottier S, Annane D, et al.
Comparison of ventilator-integrated end-tidal CO2 and transcutaneous CO2 monitoring in
home-ventilated neuromuscular patients. Respiratory Medicine. 2016;117:7-13.
160. Schmalisch G. Neonatal monitoring. In: Paulus DA, Gravenstein JS, Jaffe MB,
Gravenstein N, editors. Capnography. 2 ed. Cambridge: Cambridge University Press; 2011. p.
80-95.
161. Siobal MS. Monitoring Exhaled Carbon Dioxide. Respiratory Care.
2016;61(10):1397-416.
162. Lee JH, Rehder KJ, Williford L, Cheifetz IM, Turner DA. Use of high flow nasal
cannula in critically ill infants, children, and adults: a critical review of the literature.
Intensive Care Medicine. 2013;39(2):247-57.
163. Olden C, Symes E, Seddon P. Measuring tidal breathing parameters using a
volumetric vest in neonates with and without lung disease. Pediatr Pulmonol.
2010;45(11):1070-5.
164. Bentsen MHL, Haaland ØA, Lønning LB, Gudmundsdottir HK, Markestad T,
Halvorsen T. A new non-invasive method of infant spirometry demonstrates a level

226
of repeatability that is comparable to traditional methods. Acta Paediatrica.
2015;104(11):1130-7.

227
Chapter 8. Appendices

228
Contents
8.1 Study Protocol
8.2 Final IRAS application form
8.3 Ethics approval
8.4 Participant Information Sheet
8.5 Consent form
8.6 Neonatal unit observation policy
8.7 Funding approval
8.8 Research Governance site specific approval
8.9 Baseline data entry form

229
8.1 Appendix 1. Study Protcol

230

231

232

233

234

235

236

237

238

239
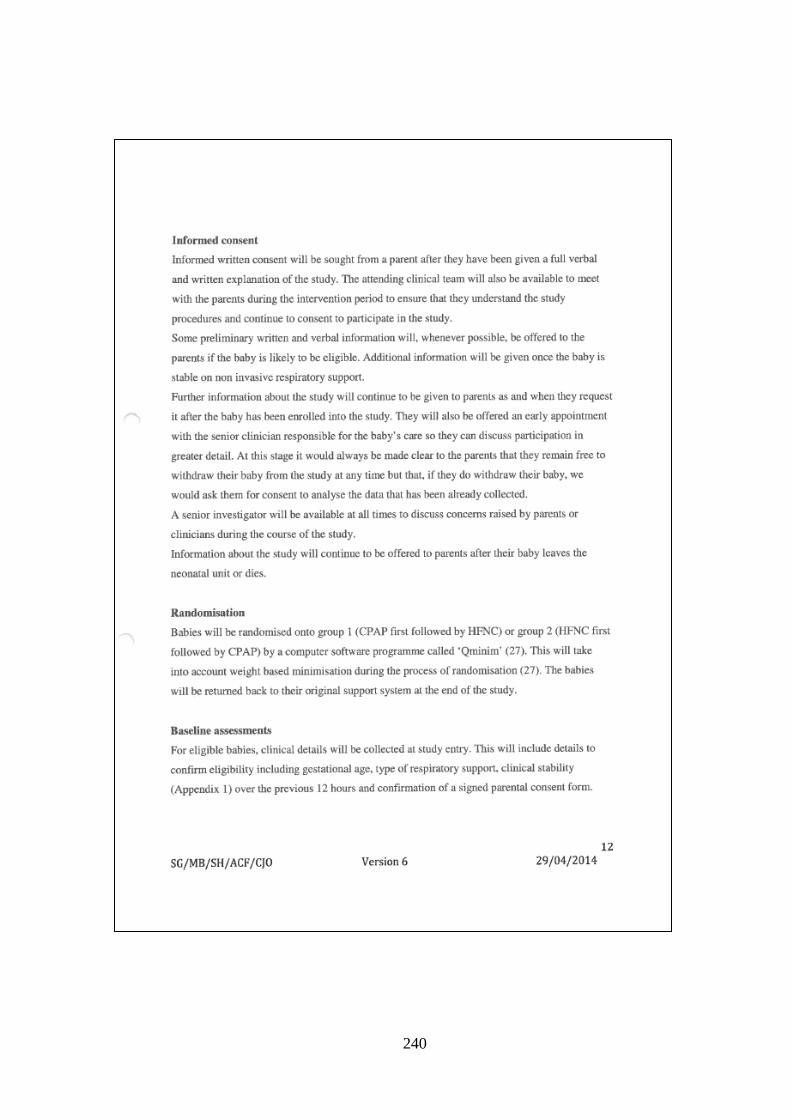
240

241

242

243

244

245

246
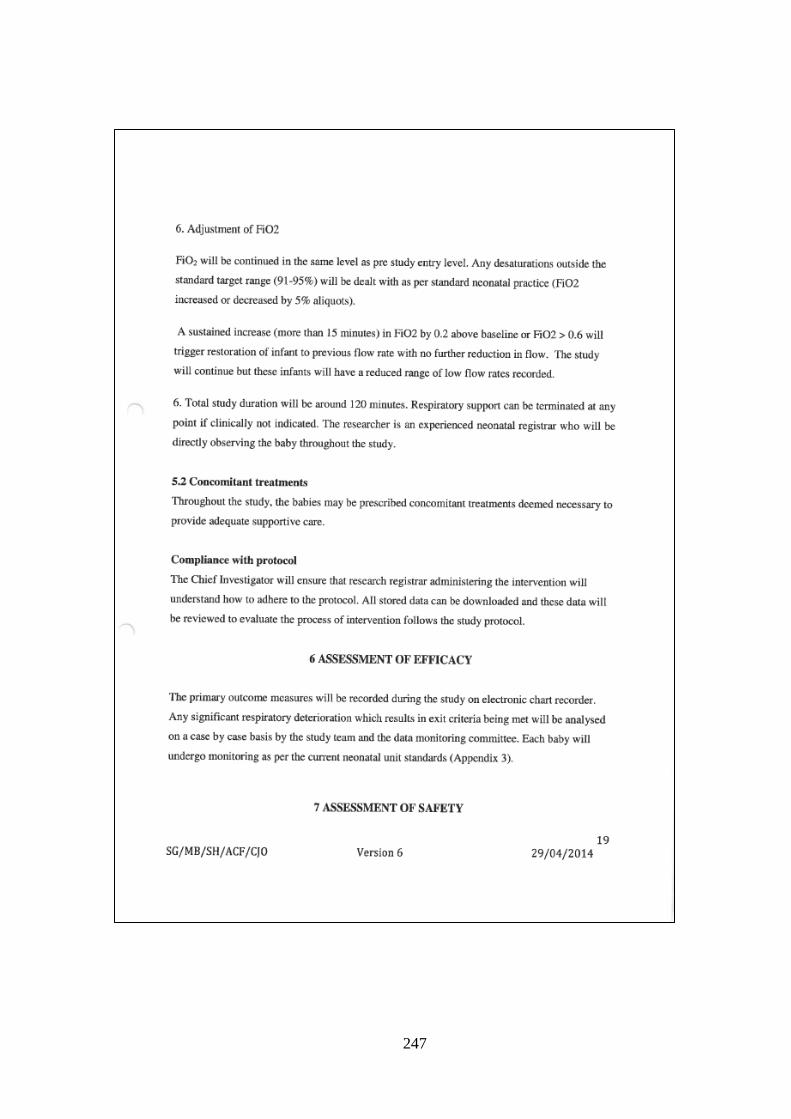
247

248

249

250

251

252

253
254

255

256

257

258
8.2 Appendix 2. IRAS integrated Research Application Form

259

260

261

262

263

264

265

266

267

268

269

270
8.3 Appendix 3. Ethics Committee Approval Letter

271

272

273

274
8.4 Appendix 4. Patient Information Sheet

275

276

277

278

279
8.5 Appendix 5. Consent Form

280
8.6 Appendix 6. Neonatal Unit Observation Charts -1

281
Appendix 6. Neonatal Unit Observation Charts -2

282
Appendix 6. Neonatal Unit Observation Charts -3
Appendix 6. Neonatal Unit Observation Charts -4

283

284
8.7 Appendix 7. Funding Approval Letter

285

286
8.8 Appendix 8. Research Governance Approval Letter

287

288
8.9 Appendix 9. Study Baseline Data Entry Form