a proposal for a green supply chain strategy
TRANSCRIPT

Journal of Industrial Engineering and ManagementJIEM, 2018 – 11(3): 445-465 – Online ISSN: 2013-0953 – Print ISSN: 2013-8423
https://doi.org/10.3926/jiem.2518
A Proposal for a Green Supply Chain Strategy
Carola Pinto Taborga , Amaia Lusa , Anna Maria Coves
Universitat Politècnica de Catalunya (Spain)
[email protected], [email protected], [email protected]
Received: November 2017Accepted: March 2018
Abstract:
Purpose: The purpose of this paper is to establish a set of steps for helping companies to create a GreenSupply Chain Strategy based on the reduction of their carbon footprint. The aim is to put forward a simpleguideline that companies can follow and guide them in achieving their carbon emission targets, as well asobtaining attractive supply chain savings.
Design/methodology/approach: Based on a literature review and benchmarking this paper proposes amethodology based on three pillars: 1) Corporate Carbon Strategy; 2) Carbon emission roadmap; and3) Implementation and tracking. Analytic Hierarchy Process (AHP) techniques were used in order to createa green strategy and support the decision-making processes to select the most interesting alternatives forcarbon emission reduction and supply chain savings. The supply chain of a metallurgical company is usedto illustrate the case study where the proposed methodology is used. The criteria used for the carbonalternatives selection was based on three factors: 1) the supply chain cost of the alternative; 2) carbonemission impact in terms of CO2 tonnes; and 3) marketing effect.
Findings: The paper identifies some specific steps for developing a Green Supply Chain Strategy. Thecase study developed, demonstrates the importance of following a proper methodology based on a set ofsteps, it also demonstrates that some alternatives focus on improving the supply chain, such as the facilitieslocation, can also improve the key performance indicator related with carbon emission.
Originality/value: The study provides guidance for manufacturing companies in implementing theirGreen Supply Chain Strategy.
Keywords: green supply chain, carbon dioxide emissions, ahp, green supply chain management
1. Introduction
Global climate change is one of the most controversial and complex topics that society is confronting today and itsimpact on industry is currently important but will soon be enormous. In order to deal with this critical situation, aclimate change accord, “The Paris agreement”, was signed by nearly 200 countries in December 2015; theagreement came into force in November 2016. The main point of the Paris agreement is to keep global warmingbelow 2ºC and it encourages world leaders to have a long-term goal for net zero emissions, which would effectivelyphase out fossil fuels.
Understanding the role of industry in the climate change, the business community is also supporting the ParisClimate Agreement. The last Conference of Parties (COP22) had the contribution of 350 companies, all of themreiterating their strong support for the Agreement. Companies are thinking more and more about emitting less CO2
in their business activities, firstly to support world agreements, secondly because it is a good way of reducing
-445-
brought to you by COREView metadata, citation and similar papers at core.ac.uk
provided by UPCommons. Portal del coneixement obert de la UPC
Journal of Industrial Engineering and Management – https://doi.org/10.3926/jiem.2518
overheads. Moreover, endorsing a carbon strategy can promote a competitive advantage and help them stand outagainst their competitors. According to some research (Carbon Trust, 2012), over 65% of consumers think that it isimportant to buy from environmentally responsible companies, which means that it can be taken as a very goodmarketing strategy.
Certainly, the concept of climate change is generating actions at governmental and business level; therefore,companies need to adapt their strategy and use this trend to generate a competitive advantage. Consequently, thereis a need to support companies and decision makers in this field.
Some guidance and standards have been developed to help companies to design effective strategies for reducingcarbon emissions. One of these tools is the GHG Protocol (WBCSD/WRI, 2004) and another is ISO 14064(International Organization for Standardization, 2006) which is coherent and compatible with the GHG Protocol.In general terms, ISO 14064 identifies the “What” and the GHG Protocol the “How” and “Why”. ISO 14064 isoriented towards audits, while the GHS protocol is oriented towards providing a set of options for reducing carbonemission. Moreover, Life Cycle Analysis (LCA) methodology is useful for evaluating the environmental impactassociated with a product, process or activity (Franchetti & Apul, 2012).
In general, in this context, there are two main schools of research: the first one considers the LCA evaluation,where the total environmental footprint (in terms of CO2 emissions) of a product or a service is considered; thesecond approach, normally based on GHG protocol, aims to quantify the carbon footprint of an organisation,rather than a product or a service itself. Due to the nature of this guidance an organizational level approach, basedon the GHG protocol, is taken.
The involvement of the scientific, political, economic, and social communities in environmental issues is increasingsteadily. Simultaneously, companies are changing their traditional way of viewing the supply chain and are includingthe green concept within their Supply Chain and creating a new concept, the “Green Supply Chain” (GSC).
Environmental factors in supply chain design have become a focus research in recent years. Studies have analysedthe implications of different transportation types regarding GHG emissions (Pan, Ballot & Fontane, 2013), as wellas of energy-saving technology (Wang, Xiaofan & Shi, 2011) in both transportation and production. The conceptGreen Supply Chain has recently appeared to include the environmental factor in supply chain design.
Together with the GSC the Green Supply Chain Strategy is arisen. A Green Supply Chain Strategy (GSCS) isdefined as a long-term action plan that integrate environmental thinking into supply-chain management to createa competitive advantage (Kumar, Teichman, & Timpernagel, 2011). The GSCS can include topics related withwater, waste and carbon emission, nevertheless this paper is specially focus on improving the carbon emissionindicator.
The GSCS creation can represent a challenge for a company and can arise with some questions, such as: How todesign a GSCS? How to integrate the environmental decisions into the supply chain strategy? How to define along-term green target? What kind of resources are needed? How can developing a GSCS give us a competitiveadvantage? What are the monetary and non-monetary benefits of developing a GSCS?.
As soon as a company has defined its GSCS some strategies and targets are established, normally a second set ofquestions arises, for instance: How to reach the Carbon Reduction targets? What kind of initiatives are needed?When should these initiatives be implemented?.
The standards and guidance already established are useful for helping in the definition of some part of theGSCS. For instance, GHG protocol is useful for defining reporting principles, determining boundaries andsetting GHG targets, whilst the PAS 2050 Guide helps in assessing the life cycle carbon footprint of productsand identifying emission reduction opportunities. Nevertheless, neither the GHG Protocol nor PAS 2020 Guidehave a formalized guide for creating a carbon strategy and helping companies to achieve the carbon reductiontargets.
Companies need to implement this kind of strategy to add value, improve brand image, reduce costs & risks andfind new revenue opportunities. The guide proposed in this paper offers practical advice for creating a Green
-446-
Journal of Industrial Engineering and Management – https://doi.org/10.3926/jiem.2518
Supply Chain Strategy. It provides step by step guidance, starting with the assessing and finishing with the trackingof results. The aim is to take advantage of the benefits of green growth and use it for marketing and to gain acompetitive advantage.
The rest of the paper is organized as follows: Section 2 includes a brief literature review; Section 3 proposes amethodology for carbon reduction; in Section 4 a case study is presented; finally, Section 5 includes the mainconclusions and recommendations.
2. Literature ReviewSupply Chain is defined as a set of processes where different stakeholders (i.e. suppliers, factories, distributors andretailers) work together to convert raw materials into final product ready to be delivered to customers andeventually collect the end of use products for reuse, remanufacture or recycle purposes (Damert, Arijit & Ruoert,2017). Within the Supply Chain two big processes can be defined 1) the Production Planning and InventoryControl Process, and 2) the Distribution Process, both working in a synchronized manner.
More than a physical flow the supply chain encompasses all the activities associated with the flow andtransformation of goods from raw materials stage (extraction), through to the end user, as well as the associatedinformation flows. Material and information flow both up and down the supply chain. “Supply Chain Management(SCM) is the integration of these activities through improved supply chain relationships to achieve a sustainablecompetitive advantage’’ (Handfield & Nichols, 1999).
A supply chain is traditionally designed based on the economic objectives (cost minimization, sales maximization)(Pinto-Varela, Barbosa-Póvoa & Novais, 2011), but due to the societal environment concerns are increasing andevery supply chain is part of the global society (Chaabane, Ramudhin & Paquet, 2010), then a supply chain shouldbe evaluated also based on the environmental objectives (carbon emissions, recycling performance, wastemanagement and energy use), and the social performances (quality of life, noise, etc.).
Sustainable development is defined as a “development that meets the needs of the present, withoutcompromising the ability of future generations to meet their own needs" (WCED, 1987). Since a supply chainhas a strong link with the society, an integrated approach linking these three pillars (economic, environmentaland social) is needed.
A Sustainable Supply Chain includes objectives related with sustainable development, economic, environmental andsocial (Seuring & Müller, 2008). A supply chain interacts with other stakeholders like customer and suppliers, whichare belong to other supply chain themselves. Therefore, a well implemented Sustainable Supply chain strategy willalso impact in customer and suppliers, then all the stakeholders will contribute to create an extended sustainablesupply chain.
Green Supply Chain Management (GSCM) is a piece of the sustainable supply chain where environmental thinkingis integrated into supply chain management (Srivastava, 2007) and it includes supplier’s selection, product design,manufacturing process, warehousing and transportation and end-of-life of the product.
Different authors such as Cordero (2013), Pinto and Coves (2014) and Dasaklis and Costas (2013) have made ageneral review of the relevant literature and current methodologies for carbon reduction into the Supply Chain and,based on a systematic categorization of the findings, they have identified carbon reduction opportunities. Inaddition, a set of guidelines for carbon reduction is listed in the Carbon Trust (2012) and authors such as Hoffman(2005) have proposed a Climate Change Strategy for companies including guidelines for Voluntary GreenhouseGas Reductions.
Nevertheless, most of the literature is based on strategies and guidelines that affect a part of the supply chain. Inmanufacturing, for instance, the strategy for carbon reduction is based on four pillars; the first is based on theimprovement of the engineering process, whether in the commissioning of new factories and lines or in theimprovement of the current equipment and process (Letmathe & Balakrishnan, 2005). The second pillar is relatedto the site improvements, with small actions like formalizing knowledge for developing new sustainable products
-447-
Journal of Industrial Engineering and Management – https://doi.org/10.3926/jiem.2518
(Trotta, 2010). The third pillar involves investment in New Technologies such as Combined Heat and Power (CHP)(Bianchi & De Pascale, 2012) or Biomass.
Research by Vujanovića, Čučekb Lidija and Zdravko (2014) highlighted energy management as the fourthpillar; it can impact on manufacturing but also on any other facility of the supply chain. The use of renewableenergy sources helps to mitigate the effects of climate change and ensures that no net greenhouse gases arereleased.
Carbon Trust (2012) revealed a guideline for properly selecting the type of the renewable energy. The guidelineproposes considering the importance of assessing the type (electricity, heat) of energy used, including thefluctuation of the energy demand per season and during the day, as well as the quantity of renewable energyneeded. As soon as an energy technology is identified, a feasibility study needs to be carried out to assess thetechnical, economic and environmental performance. Wind power, solar electricity, biomass and anaerobicdigestion are just examples of the renewable energies currently available.
Research by Hashim, Nazam, Yao, Baig and Zia-ur-Rehman (2017) showed the importance of incorporating anenvironmental objective into the conventional supplier selection. Along the same lines, Opetuk, Zolo & Dukic.(2010) demostrated how to work closely with suppliers and leverage the procurement agreements to create a longterm carbon strategy. Some criteria such as type of energy used, CO2 performance certificates, longevity ofbreeding stock, waste management methods or the use of artificial fertilizers can be included in the procurementnegotiations.
Opportunities in the transportation area are also important in a Green Supply Chain Strategy. The use of differenttransportation modes can be an excellent option for reducing carbon emissions, which can include a combinationof rail-road (Lee Lam, 2014) or water-road, included in the Li, Xu and Liu (2013) research.
On the other hand, vehicle design and fuel consumption play a key role in the transport sector and directly affectsGHG emissions. Research by Wu & Dunn (1995) explained how to use different alternative fuels (EmulsifiedDiesel, Biodiesel, Natural Gas, Propane, Ethanol-Diesel Mix) and the later research by Günther, Kannegiesser &Autenrieb (2015) and Ajanovic & Haas (2015) showed how the use of electric vehicles can significantly reducevehicle carbon emissions, especially if compared with diesel combustion.
Finally, the opportunity for carbon emission reduction in warehousing is related with the location (Wang, Zhu &Jeeva, 2013), the energy management and the storage equipment. Authors like Tian and Yang (2013) highlighted theimportance of the characteristics of energy consumption in companies’ logistics processes.
Several authors have contributed to the GSCS field, but most of them are focused on some specific areas, whileother authors are dedicated to a general compilation of them all. Additionally, previously established guidelines suchas GHG protocol or PAS 2050 define a strategy for carbon reduction, but do not include a methodology forselecting carbon reduction alternatives.
So far, most management research has focused in the carbon reduction and the climate change mitigation usingdifferent methodologies based on mathematics tools, research hypotheses or case studies. But the term corporatecarbon strategy is defined by (Damert et al., 2017) as “a complex set of actions to reduce the impact of a firm'sbusiness activities on climate change and to gain competitive advantages over time”.
For (Busch, Lehmann & Hoffmannet, 2012), a “carbon management strategy” is any corporate firm’s effort toreduce the impact on climate change, whilst (Kolk & Levy, 2001) mentions that a “climate strategy” is based on theselection of various strategic carbon options and for (Cadez & Czerny, 2016) a “climate change mitigation strategy”stand on the application of the right carbon practices.
In the (Yunus, Elijido-Ten & Abhayawansa, 2016) contribution, they give a more specific detailing that “carbonmanagement strategy” must include carbon measurement, reporting reduction, trading, risk, carbon reductionopportunities and an analysis of the carbon market place. But the term “corporate carbon strategy” is defined by(Lee, 2012) as a firm’s selection of the scope and a level of its carbon management.
-448-
Journal of Industrial Engineering and Management – https://doi.org/10.3926/jiem.2518
Moreover, (Okereke & Russel, 2010) comment that a “corporate climate strategy” links the possibility to achievemarket gains but also to keep political influence. Creating a social-political strategy can also avoid future problems,indeed for (Jeswani, Wehrmeyer & Mulugetta, 2007) a “business response to climate change” is basically the degreeof proactivity that a company has in response to the climate change mitigation.
Notwithstanding when a company pretends to develop a “carbon management strategy” the major bottlenecks arethe short-term mindset specially focused in the profit maximization (Slawinski, Pinkse, Busch & Baner, 2015). Thisapproach is normally in conflict with a long-term strategy which includes the carbon reduction. Therefore, how toaccommodate the carbon reduction long-term strategy into the short-term goal, is crucial for the success of themitigation strategies. Indeed, the short term and long-term connection is a prerequisite for any realistic assessmentof the carbon strategy effectiveness.
(Damert et al., 2017) recommend that a corporate carbon strategy should be based on three objectives: 1) carbongovernance; 2) carbon reduction; and 3) carbon competitiveness. Their conclusion mentions the “talking beforewalking” argument as an explanation for the missing link between carbon governance and carbon reductionactivities.
According to (Montabon, Sroufe & Narasimhan, 2007) a key aspect of carbon reduction strategies is theireffectiveness of delivering the desired impacts in the long-term; this contribution is seconded by (Mintzberg,2000) who concludes that a carbon reduction strategy is not mere words but words that must be translated intoactions.
The existing literature regarding business strategy and climate change investigations of corporate GHGmitigation strategies and their impact on corporate carbon performance are limited. Moreover, the availableworks does not integrate financial elements into climate change mitigation plans. Besides there is a lack GSCSwhere techniques such as Multiple Criteria Decision-Making integrate for creating a robust climate mitigationstrategy.
Multiple criteria decision-making is a very useful technique for supporting the subjective evaluation ofperformance criteria by decision-makers (Mardani, Jusoh, Nor, Khalifah, Zakwan & Valipour, 2015). MCDMmethods cover a wide range of quite distinct approaches. MCDM has increased its application in the last decadesand it has become very used in environmental, socio-economic, technical and energy planning (Al-Barqawi &Zayed, 2008).
One the most frequently MCDM method used is the Analytic Hierarchy Process (AHP), in this method a numericalscore for each alternative is selected for obtaining preferences of importance regarding to the criteria (Saaty, 1988).The main advantages of this method consist in the possibility to use quantitative and qualitative criteria, besidesthere is a good traceability due to the ordered process of the decision making.
Motivated by the research gaps outlined above, this paper aims at contributing to a better understanding of thedeveloping of a GSCS focused in a corporate carbon reduction. Specifically, this study aims at analysing thefollowing: 1) proposing a step by step guideline to create a carbon Green Supply Chain Strategy; 2) showing how tocreate a roadmap where the long-term plans related to carbon reduction are allocated; and 3) demonstrating how amultiple criteria decision-making technique can support the creation of long term plan.
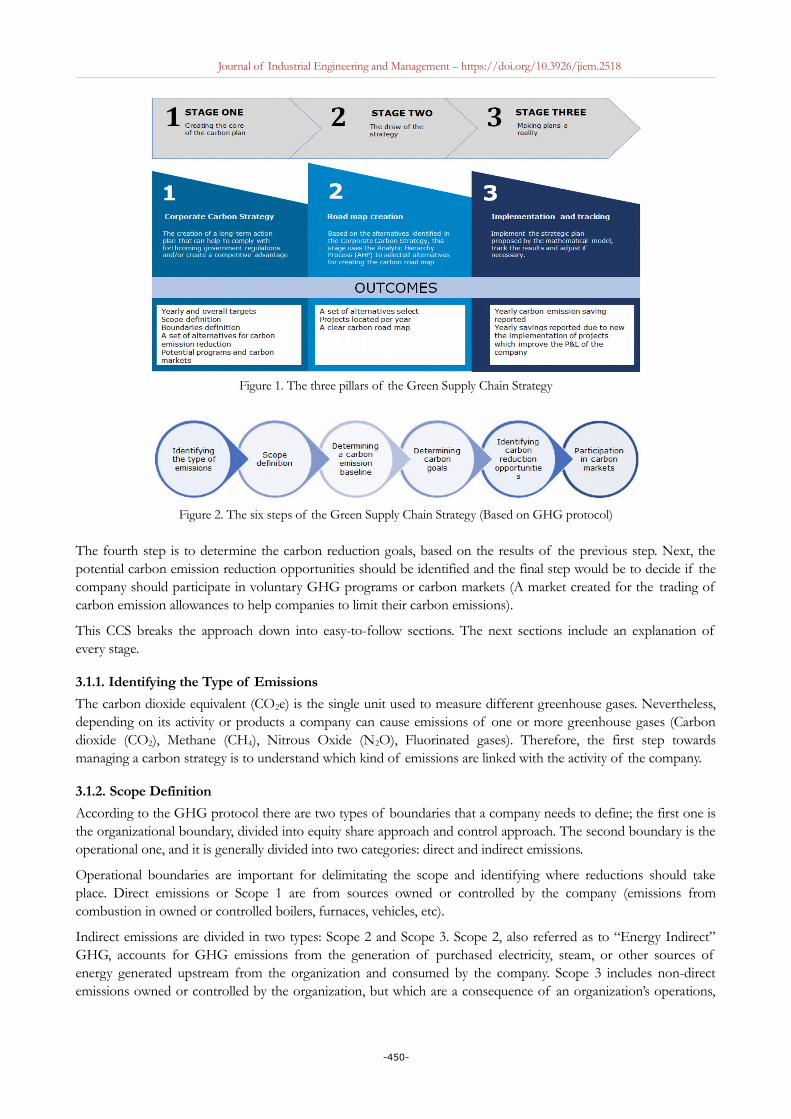
3. Green Supply Chain StrategyThe proposed Green Supply Chain Strategy, depicted in Figure 1, consists of three stages: 1) the definition of aCorporate Carbon Strategy (CCS); 2) the road map creation; and 3) the implementation, tracking and regular reviewof the results. Each of the stages is detailed in the following subsections.
3.1. Definition of a Corporate Carbon Strategy
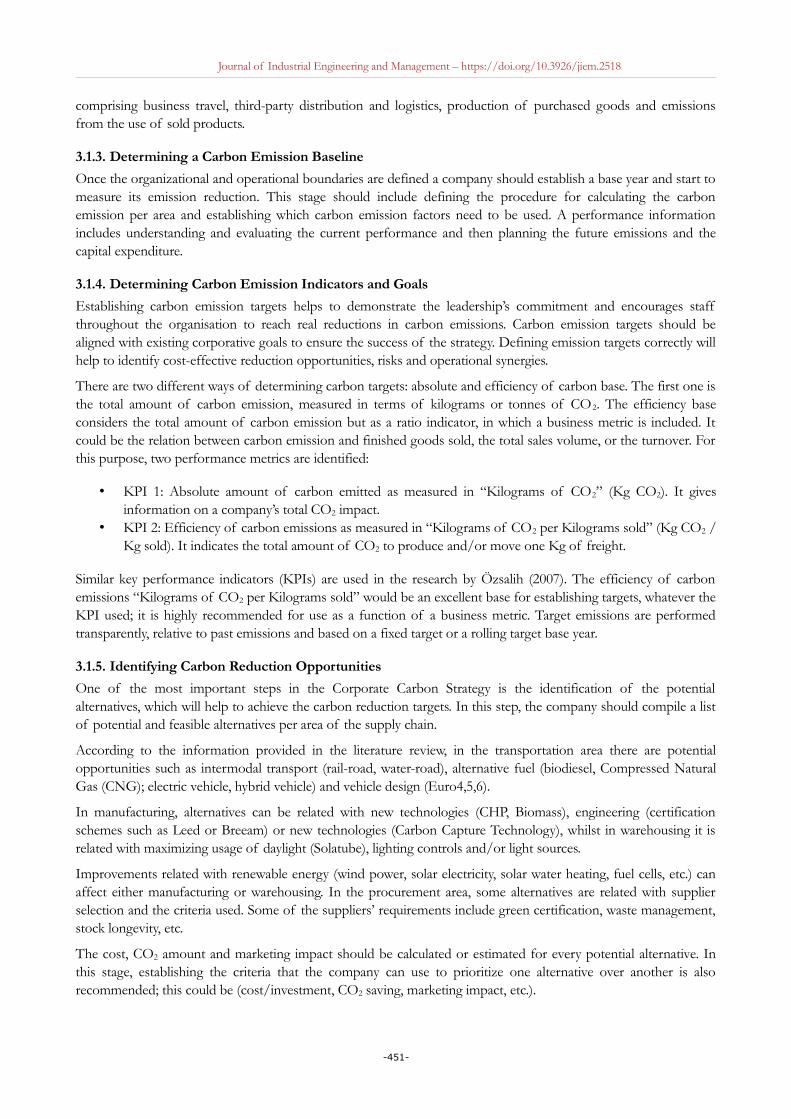
The CCS involves establishing the bases of the Green Supply Chain Strategy. As in Figure 2 the CCS starts with theidentification of the type of emissions to be reduced, the operational boundaries should be determined in order todelimit the scope of the strategy. The third step is to determine a carbon emission baseline, which meanscalculating the carbon emission for the base year.
-449-
Journal of Industrial Engineering and Management – https://doi.org/10.3926/jiem.2518
Figure 1. The three pillars of the Green Supply Chain Strategy
Figure 2. The six steps of the Green Supply Chain Strategy (Based on GHG protocol)
The fourth step is to determine the carbon reduction goals, based on the results of the previous step. Next, thepotential carbon emission reduction opportunities should be identified and the final step would be to decide if thecompany should participate in voluntary GHG programs or carbon markets (A market created for the trading ofcarbon emission allowances to help companies to limit their carbon emissions).
This CCS breaks the approach down into easy-to-follow sections. The next sections include an explanation ofevery stage.
3.1.1. Identifying the Type of Emissions
The carbon dioxide equivalent (CO2e) is the single unit used to measure different greenhouse gases. Nevertheless,depending on its activity or products a company can cause emissions of one or more greenhouse gases (Carbondioxide (CO2), Methane (CH4), Nitrous Oxide (N2O), Fluorinated gases). Therefore, the first step towardsmanaging a carbon strategy is to understand which kind of emissions are linked with the activity of the company.
3.1.2. Scope Definition
According to the GHG protocol there are two types of boundaries that a company needs to define; the first one isthe organizational boundary, divided into equity share approach and control approach. The second boundary is theoperational one, and it is generally divided into two categories: direct and indirect emissions.
Operational boundaries are important for delimitating the scope and identifying where reductions should takeplace. Direct emissions or Scope 1 are from sources owned or controlled by the company (emissions fromcombustion in owned or controlled boilers, furnaces, vehicles, etc).
Indirect emissions are divided in two types: Scope 2 and Scope 3. Scope 2, also referred as to “Energy Indirect”GHG, accounts for GHG emissions from the generation of purchased electricity, steam, or other sources ofenergy generated upstream from the organization and consumed by the company. Scope 3 includes non-directemissions owned or controlled by the organization, but which are a consequence of an organization’s operations,
-450-
Journal of Industrial Engineering and Management – https://doi.org/10.3926/jiem.2518
comprising business travel, third-party distribution and logistics, production of purchased goods and emissionsfrom the use of sold products.
3.1.3. Determining a Carbon Emission Baseline
Once the organizational and operational boundaries are defined a company should establish a base year and start tomeasure its emission reduction. This stage should include defining the procedure for calculating the carbonemission per area and establishing which carbon emission factors need to be used. A performance informationincludes understanding and evaluating the current performance and then planning the future emissions and thecapital expenditure.
3.1.4. Determining Carbon Emission Indicators and Goals
Establishing carbon emission targets helps to demonstrate the leadership’s commitment and encourages staffthroughout the organisation to reach real reductions in carbon emissions. Carbon emission targets should bealigned with existing corporative goals to ensure the success of the strategy. Defining emission targets correctly willhelp to identify cost-effective reduction opportunities, risks and operational synergies.
There are two different ways of determining carbon targets: absolute and efficiency of carbon base. The first one isthe total amount of carbon emission, measured in terms of kilograms or tonnes of CO 2. The efficiency baseconsiders the total amount of carbon emission but as a ratio indicator, in which a business metric is included. Itcould be the relation between carbon emission and finished goods sold, the total sales volume, or the turnover. Forthis purpose, two performance metrics are identified:
• KPI 1: Absolute amount of carbon emitted as measured in “Kilograms of CO2” (Kg CO2). It givesinformation on a company’s total CO2 impact.
• KPI 2: Efficiency of carbon emissions as measured in “Kilograms of CO2 per Kilograms sold” (Kg CO2 /Kg sold). It indicates the total amount of CO2 to produce and/or move one Kg of freight.
Similar key performance indicators (KPIs) are used in the research by Özsalih (2007). The efficiency of carbonemissions “Kilograms of CO2 per Kilograms sold” would be an excellent base for establishing targets, whatever theKPI used; it is highly recommended for use as a function of a business metric. Target emissions are performedtransparently, relative to past emissions and based on a fixed target or a rolling target base year.
3.1.5. Identifying Carbon Reduction Opportunities
One of the most important steps in the Corporate Carbon Strategy is the identification of the potentialalternatives, which will help to achieve the carbon reduction targets. In this step, the company should compile a listof potential and feasible alternatives per area of the supply chain.
According to the information provided in the literature review, in the transportation area there are potentialopportunities such as intermodal transport (rail-road, water-road), alternative fuel (biodiesel, Compressed NaturalGas (CNG); electric vehicle, hybrid vehicle) and vehicle design (Euro4,5,6).
In manufacturing, alternatives can be related with new technologies (CHP, Biomass), engineering (certificationschemes such as Leed or Breeam) or new technologies (Carbon Capture Technology), whilst in warehousing it isrelated with maximizing usage of daylight (Solatube), lighting controls and/or light sources.
Improvements related with renewable energy (wind power, solar electricity, solar water heating, fuel cells, etc.) canaffect either manufacturing or warehousing. In the procurement area, some alternatives are related with supplierselection and the criteria used. Some of the suppliers’ requirements include green certification, waste management,stock longevity, etc.
The cost, CO2 amount and marketing impact should be calculated or estimated for every potential alternative. Inthis stage, establishing the criteria that the company can use to prioritize one alternative over another is alsorecommended; this could be (cost/investment, CO2 saving, marketing impact, etc.).
-451-
Journal of Industrial Engineering and Management – https://doi.org/10.3926/jiem.2518
3.1.6. Evaluate the Participation in Carbon Markets
A new concept is set out in Article 17 of the Kyoto Protocol, an “emissions trading” scheme, which allowscountries and companies to optimize CO2 emissions. Under this scheme, companies can buy or sell CO2 credits,and in so doing, meet their environmental goals. This scheme is based on assigning a quota of emission credits[1 credit = the right to emit one metric ton of carbon dioxide equivalent to (t CO2e)]. Every company must managethese carbon credits in the most efficient manner possible.
The last step of the Corporate Carbon Strategy is the definition of the carbon market, where the company canparticipate. In this stage, the company should find opportunities in the carbon taxation policy levied and assess thebenefit of participating in some of those programs (Hou, Jia, Tian, Wei & Wei, 2015).
There are different carbon markets around the world (Johnson & Heinen, 2004), for instance the European UnionEmission Trading Scheme (or EU ETS), the New Zealand Emissions Trading Scheme (NZ ETS), the ChicagoClimate Exchange in the United States and the Montreal Climate Exchange in Canada.
3.2. The Carbon Roadmap Creation
An Analytic Hierarchy Process (AHP) technique is used for creating a carbon emission roadmap. This technique isuseful in supporting the decision-making processes for selecting the most interesting alternatives, which would bepart of the strategy for achieving the carbon reduction goals (Álvarez & de la Calle, 2011).
Every potential alternative, previously identified in the step 5 of the CCS, must be submitted to a reasonablycomplex hierarchy. It involves factors ranging from the tangible and precisely measurable (cost/investment,economic savings, CO2 tax benefits), through tangible but difficult to measure (carbon emission amount,government polices compliance) to the intangible and totally subjective (marketing impact, competitive advantage).
The criteria for evaluating every alternative could change according to the priorities already defined in the CCS.Nevertheless, the goal should be the same or similar - “Choose the best alternative for achieving carbon reductiongoals”.
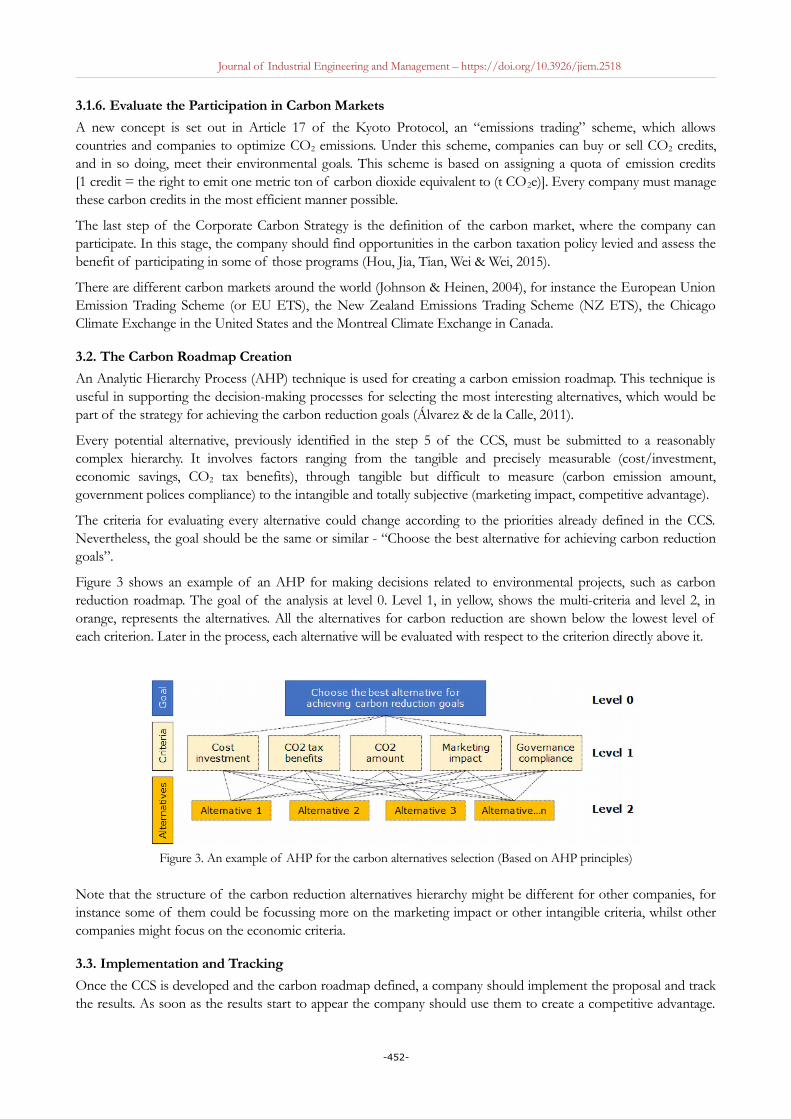
Figure 3 shows an example of an AHP for making decisions related to environmental projects, such as carbonreduction roadmap. The goal of the analysis at level 0. Level 1, in yellow, shows the multi-criteria and level 2, inorange, represents the alternatives. All the alternatives for carbon reduction are shown below the lowest level ofeach criterion. Later in the process, each alternative will be evaluated with respect to the criterion directly above it.
Figure 3. An example of AHP for the carbon alternatives selection (Based on AHP principles)
Note that the structure of the carbon reduction alternatives hierarchy might be different for other companies, forinstance some of them could be focussing more on the marketing impact or other intangible criteria, whilst othercompanies might focus on the economic criteria.
3.3. Implementation and Tracking
Once the CCS is developed and the carbon roadmap defined, a company should implement the proposal and trackthe results. As soon as the results start to appear the company should use them to create a competitive advantage.
-452-
Journal of Industrial Engineering and Management – https://doi.org/10.3926/jiem.2518
According to the Carbon Trust (2012) there are different strategies for taking advantage of the carbon reductionresults, some examples of which are: publicising the company’s achievements, gaining an accreditation, applying foran environmental award and/or participating in voluntary or carbon markets.
The publicity can be made using external communication channels, promoting green products/services, usingmedia to share the carbon roadmap progress. In addition, it is possible to find certification such as ISO14001 orBS8555 in the implementation phase, which can help in preparing for an audit as proof of the environmentalcommitment.
Applying for an environmental award is another interesting manner to publicise that commitment and motivateemployees regarding the carbon reduction goal. Besides, the carbon reduction reported yearly can be useful forparticipating in carbon markets or voluntary programs (as explained in section 3.1.6 “Identifying carbon reductionopportunities”).
In this stage reviewing and re-evaluating new alternatives for carbon reduction is also recommended. The aim is tocreate a “virtuous circle” where the company constantly looks for new opportunities and re-develops its GreenSupply Chain Strategy to keep a step ahead of its competitors.
This case study implements the Green Supply Chain Strategy proposed here in a metallurgical company. The studydemonstrates the importance of following the proposed strategy step by step, making a special analysis of thescope definition impact. It also shows how an AHP technique can be useful in defining a carbon roadmap.
This case study is organized as follows: Section 4.1 includes a description of the current supply chain; Section 4.2implements the Green Supply Chain Strategy in the case study company, including a description of all the steps ofCCS and the creation of the carbon roadmap using the AHP technique; and finally, Section 4.3 includes a sensitivityanalysis of the carbon footprint scope definition.
4. Case Study
To illustrate the proposal, the set of data of a global manufacturing company in the metallurgical sector is used. Insection 3.1 the current situation is described, whilst in section 3.2 the proposal for a Green Supply Chain Strategy isimplemented and finally in section 3.3 a sensitivity analysis of the carbon scope definition is exposed.
4.1. The Current Situation
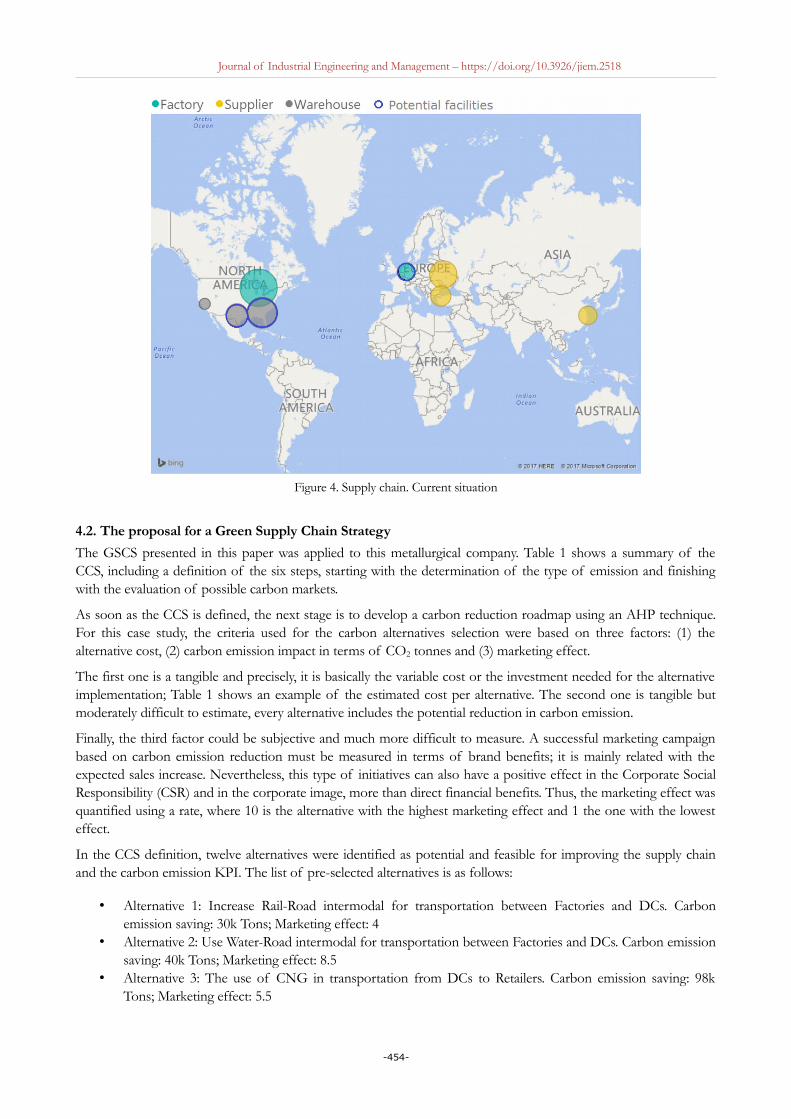
The company has a set of retailers located in the United States, which is the main market. These retailers arephysically based in Texas, Virginia, Florida, Colorado, New York, Chicago and California.
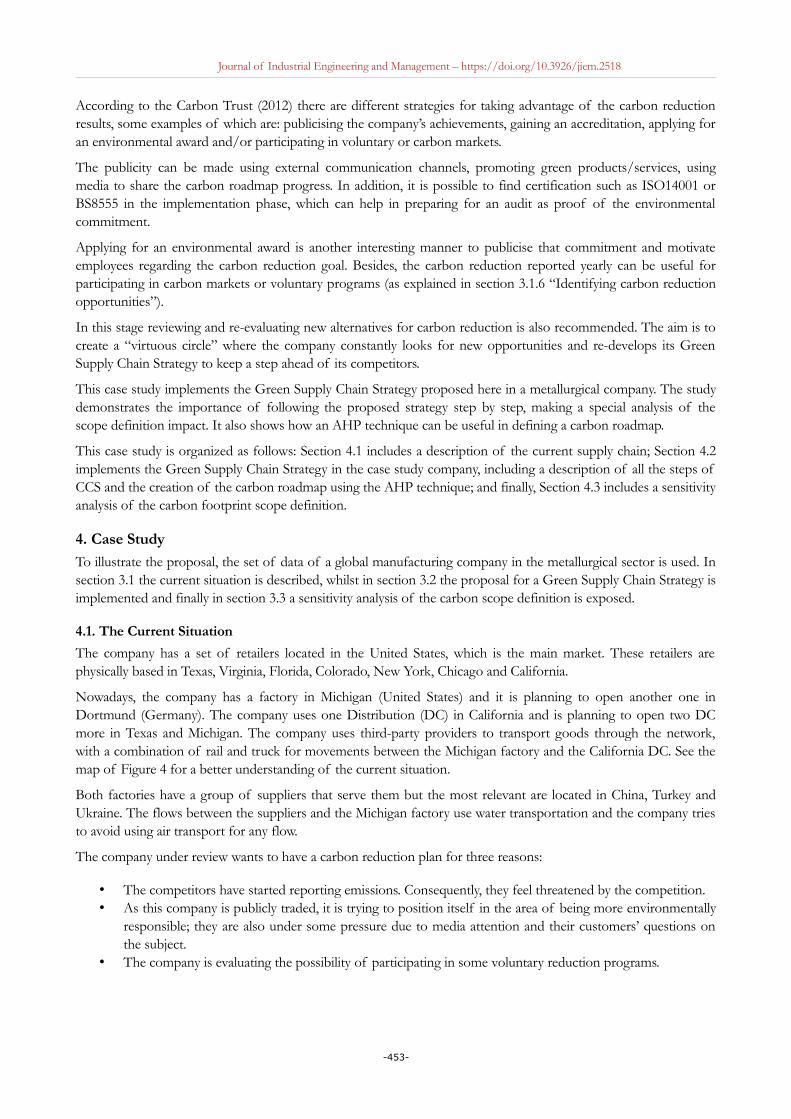
Nowadays, the company has a factory in Michigan (United States) and it is planning to open another one inDortmund (Germany). The company uses one Distribution (DC) in California and is planning to open two DCmore in Texas and Michigan. The company uses third-party providers to transport goods through the network,with a combination of rail and truck for movements between the Michigan factory and the California DC. See themap of Figure 4 for a better understanding of the current situation.
Both factories have a group of suppliers that serve them but the most relevant are located in China, Turkey andUkraine. The flows between the suppliers and the Michigan factory use water transportation and the company triesto avoid using air transport for any flow.
The company under review wants to have a carbon reduction plan for three reasons:
• The competitors have started reporting emissions. Consequently, they feel threatened by the competition.• As this company is publicly traded, it is trying to position itself in the area of being more environmentally
responsible; they are also under some pressure due to media attention and their customers’ questions onthe subject.
• The company is evaluating the possibility of participating in some voluntary reduction programs.
-453-
Journal of Industrial Engineering and Management – https://doi.org/10.3926/jiem.2518
Figure 4. Supply chain. Current situation
4.2. The proposal for a Green Supply Chain Strategy
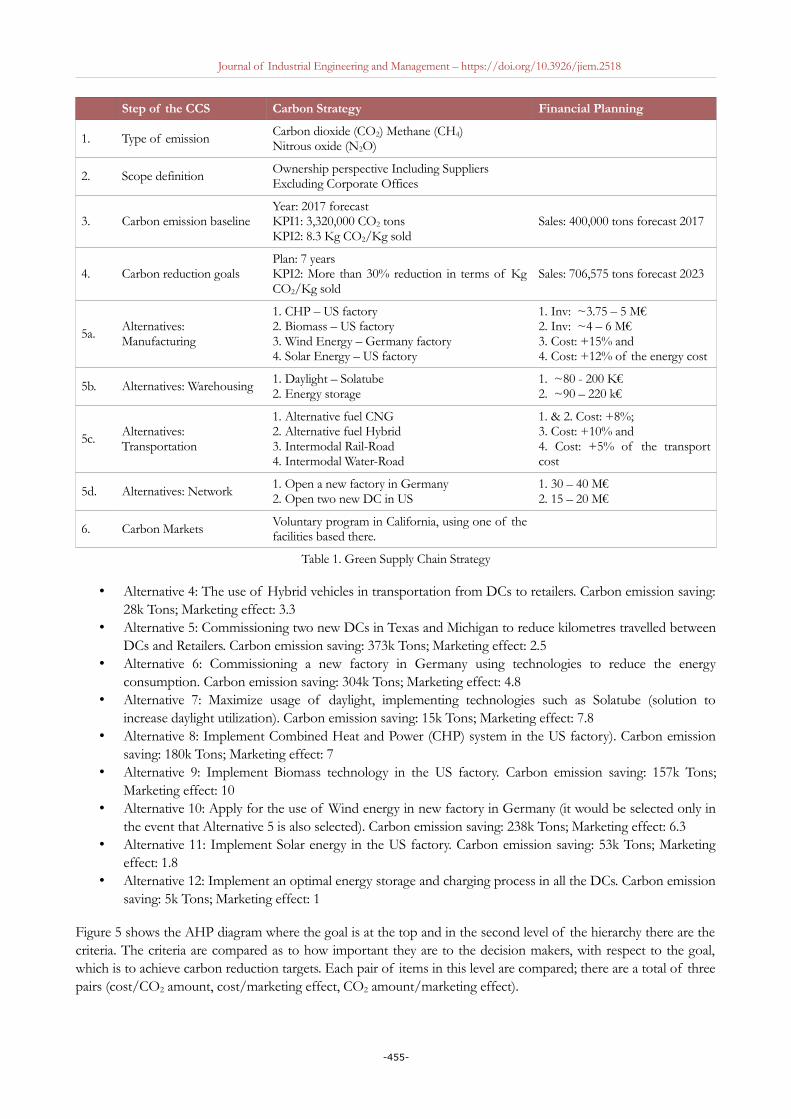
The GSCS presented in this paper was applied to this metallurgical company. Table 1 shows a summary of theCCS, including a definition of the six steps, starting with the determination of the type of emission and finishingwith the evaluation of possible carbon markets.
As soon as the CCS is defined, the next stage is to develop a carbon reduction roadmap using an AHP technique.For this case study, the criteria used for the carbon alternatives selection were based on three factors: (1) thealternative cost, (2) carbon emission impact in terms of CO2 tonnes and (3) marketing effect.
The first one is a tangible and precisely, it is basically the variable cost or the investment needed for the alternativeimplementation; Table 1 shows an example of the estimated cost per alternative. The second one is tangible butmoderately difficult to estimate, every alternative includes the potential reduction in carbon emission.
Finally, the third factor could be subjective and much more difficult to measure. A successful marketing campaignbased on carbon emission reduction must be measured in terms of brand benefits; it is mainly related with theexpected sales increase. Nevertheless, this type of initiatives can also have a positive effect in the Corporate SocialResponsibility (CSR) and in the corporate image, more than direct financial benefits. Thus, the marketing effect wasquantified using a rate, where 10 is the alternative with the highest marketing effect and 1 the one with the lowesteffect.
In the CCS definition, twelve alternatives were identified as potential and feasible for improving the supply chainand the carbon emission KPI. The list of pre-selected alternatives is as follows:
• Alternative 1: Increase Rail-Road intermodal for transportation between Factories and DCs. Carbonemission saving: 30k Tons; Marketing effect: 4
• Alternative 2: Use Water-Road intermodal for transportation between Factories and DCs. Carbon emissionsaving: 40k Tons; Marketing effect: 8.5
• Alternative 3: The use of CNG in transportation from DCs to Retailers. Carbon emission saving: 98kTons; Marketing effect: 5.5
-454-
Journal of Industrial Engineering and Management – https://doi.org/10.3926/jiem.2518
Step of the CCS Carbon Strategy Financial Planning
1. Type of emission Carbon dioxide (CO2) Methane (CH4)Nitrous oxide (N2O)
2. Scope definition Ownership perspective Including Suppliers Excluding Corporate Offices
3. Carbon emission baselineYear: 2017 forecast KPI1: 3,320,000 CO2 tonsKPI2: 8.3 Kg CO2/Kg sold
Sales: 400,000 tons forecast 2017
4. Carbon reduction goalsPlan: 7 years KPI2: More than 30% reduction in terms of KgCO2/Kg sold
Sales: 706,575 tons forecast 2023
5a. Alternatives:Manufacturing
1. CHP – US factory2. Biomass – US factory3. Wind Energy – Germany factory4. Solar Energy – US factory
1. Inv: ~3.75 – 5 M€2. Inv: ~4 – 6 M€3. Cost: +15% and4. Cost: +12% of the energy cost
5b. Alternatives: Warehousing 1. Daylight – Solatube2. Energy storage
1. ~80 - 200 K€2. ~90 – 220 k€
5c. Alternatives:Transportation
1. Alternative fuel CNG2. Alternative fuel Hybrid3. Intermodal Rail-Road4. Intermodal Water-Road
1. & 2. Cost: +8%;3. Cost: +10% and4. Cost: +5% of the transportcost
5d. Alternatives: Network 1. Open a new factory in Germany2. Open two new DC in US
1. 30 – 40 M€2. 15 – 20 M€
6. Carbon Markets Voluntary program in California, using one of thefacilities based there.
Table 1. Green Supply Chain Strategy
• Alternative 4: The use of Hybrid vehicles in transportation from DCs to retailers. Carbon emission saving:28k Tons; Marketing effect: 3.3
• Alternative 5: Commissioning two new DCs in Texas and Michigan to reduce kilometres travelled betweenDCs and Retailers. Carbon emission saving: 373k Tons; Marketing effect: 2.5
• Alternative 6: Commissioning a new factory in Germany using technologies to reduce the energyconsumption. Carbon emission saving: 304k Tons; Marketing effect: 4.8
• Alternative 7: Maximize usage of daylight, implementing technologies such as Solatube (solution toincrease daylight utilization). Carbon emission saving: 15k Tons; Marketing effect: 7.8
• Alternative 8: Implement Combined Heat and Power (CHP) system in the US factory). Carbon emissionsaving: 180k Tons; Marketing effect: 7
• Alternative 9: Implement Biomass technology in the US factory. Carbon emission saving: 157k Tons;Marketing effect: 10
• Alternative 10: Apply for the use of Wind energy in new factory in Germany (it would be selected only inthe event that Alternative 5 is also selected). Carbon emission saving: 238k Tons; Marketing effect: 6.3
• Alternative 11: Implement Solar energy in the US factory. Carbon emission saving: 53k Tons; Marketingeffect: 1.8
• Alternative 12: Implement an optimal energy storage and charging process in all the DCs. Carbon emissionsaving: 5k Tons; Marketing effect: 1
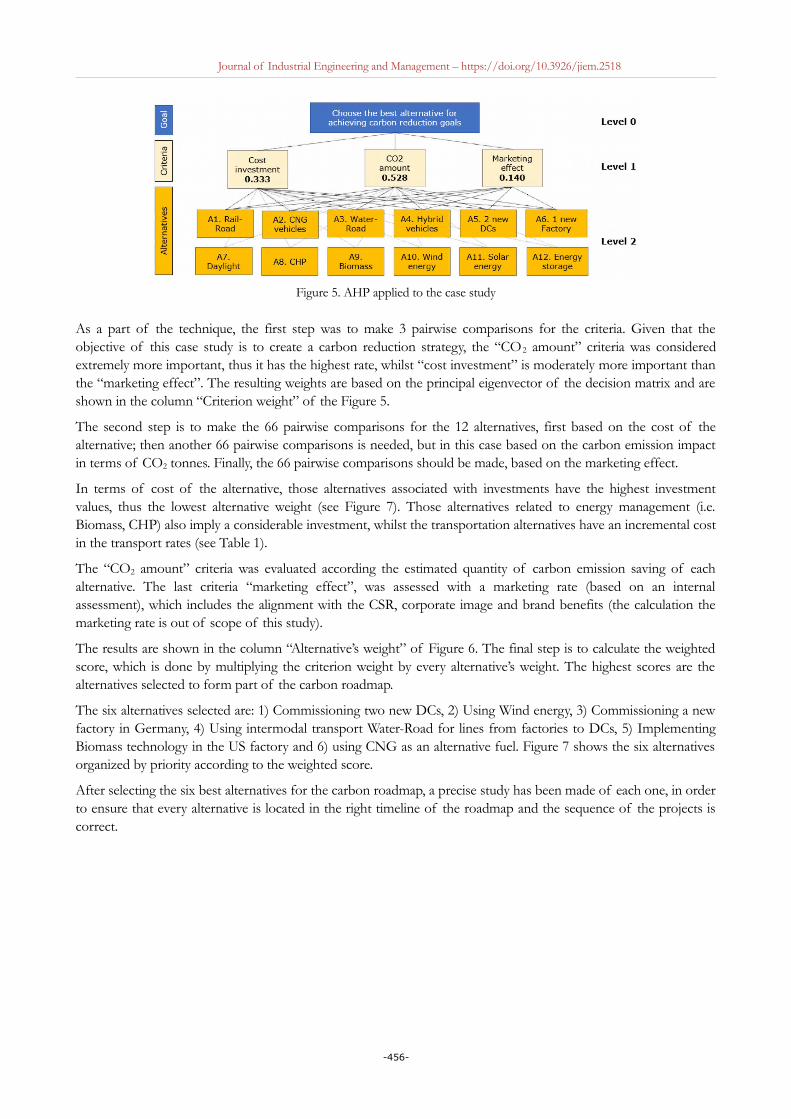
Figure 5 shows the AHP diagram where the goal is at the top and in the second level of the hierarchy there are thecriteria. The criteria are compared as to how important they are to the decision makers, with respect to the goal,which is to achieve carbon reduction targets. Each pair of items in this level are compared; there are a total of threepairs (cost/CO2 amount, cost/marketing effect, CO2 amount/marketing effect).
-455-
Journal of Industrial Engineering and Management – https://doi.org/10.3926/jiem.2518
Figure 5. AHP applied to the case study
As a part of the technique, the first step was to make 3 pairwise comparisons for the criteria. Given that theobjective of this case study is to create a carbon reduction strategy, the “CO2 amount” criteria was consideredextremely more important, thus it has the highest rate, whilst “cost investment” is moderately more important thanthe “marketing effect”. The resulting weights are based on the principal eigenvector of the decision matrix and areshown in the column “Criterion weight” of the Figure 5.
The second step is to make the 66 pairwise comparisons for the 12 alternatives, first based on the cost of thealternative; then another 66 pairwise comparisons is needed, but in this case based on the carbon emission impactin terms of CO2 tonnes. Finally, the 66 pairwise comparisons should be made, based on the marketing effect.
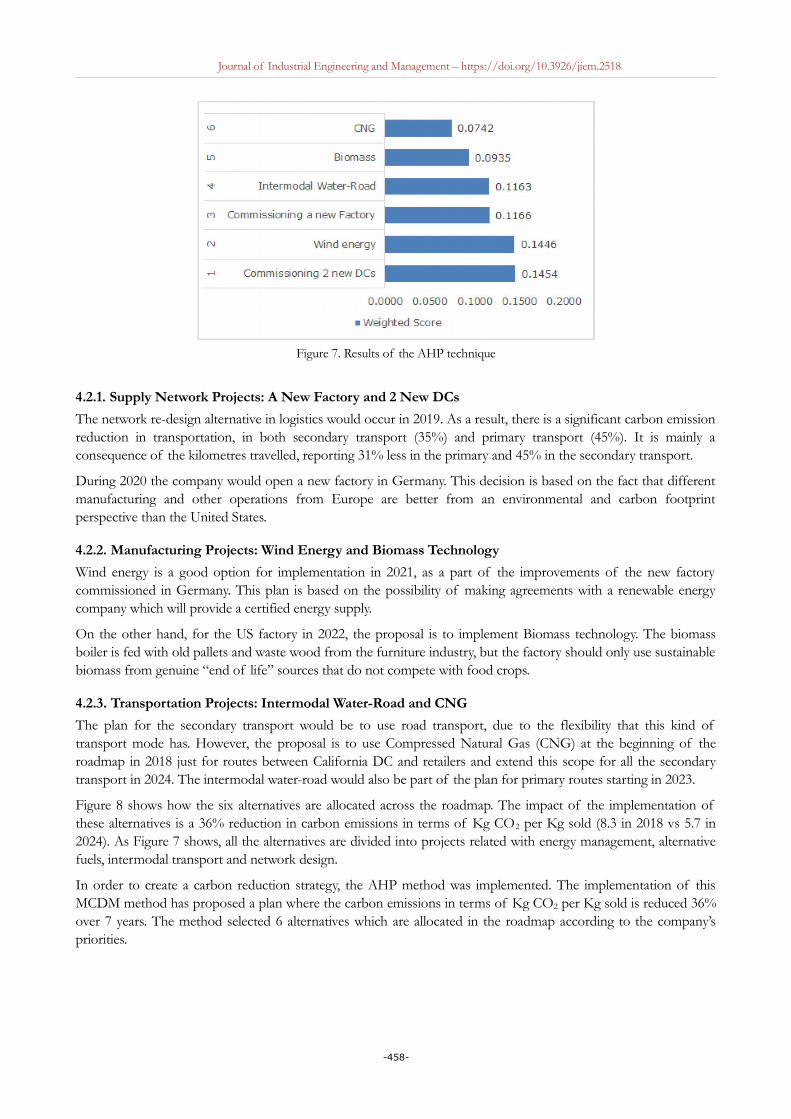
In terms of cost of the alternative, those alternatives associated with investments have the highest investmentvalues, thus the lowest alternative weight (see Figure 7). Those alternatives related to energy management (i.e.Biomass, CHP) also imply a considerable investment, whilst the transportation alternatives have an incremental costin the transport rates (see Table 1).
The “CO2 amount” criteria was evaluated according the estimated quantity of carbon emission saving of eachalternative. The last criteria “marketing effect”, was assessed with a marketing rate (based on an internalassessment), which includes the alignment with the CSR, corporate image and brand benefits (the calculation themarketing rate is out of scope of this study).
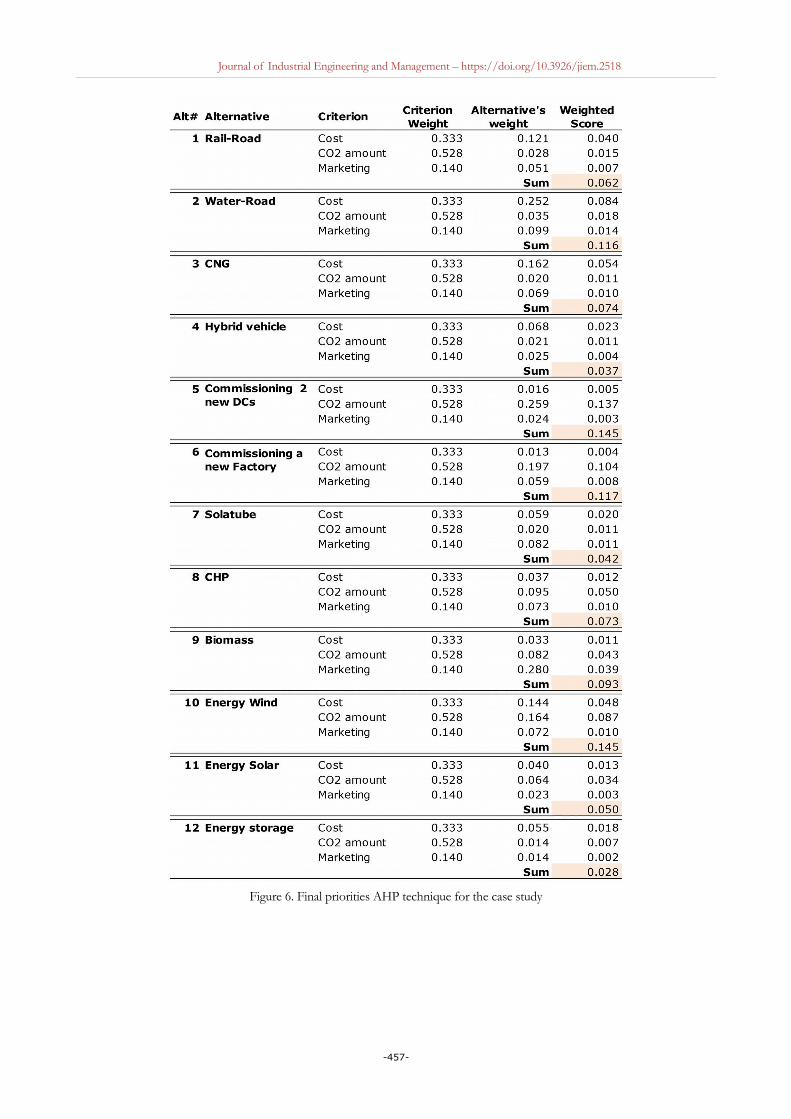
The results are shown in the column “Alternative’s weight” of Figure 6. The final step is to calculate the weightedscore, which is done by multiplying the criterion weight by every alternative’s weight. The highest scores are thealternatives selected to form part of the carbon roadmap.
The six alternatives selected are: 1) Commissioning two new DCs, 2) Using Wind energy, 3) Commissioning a newfactory in Germany, 4) Using intermodal transport Water-Road for lines from factories to DCs, 5) ImplementingBiomass technology in the US factory and 6) using CNG as an alternative fuel. Figure 7 shows the six alternativesorganized by priority according to the weighted score.
After selecting the six best alternatives for the carbon roadmap, a precise study has been made of each one, in orderto ensure that every alternative is located in the right timeline of the roadmap and the sequence of the projects iscorrect.
-456-
Journal of Industrial Engineering and Management – https://doi.org/10.3926/jiem.2518
Figure 6. Final priorities AHP technique for the case study
-457-
Journal of Industrial Engineering and Management – https://doi.org/10.3926/jiem.2518
Figure 7. Results of the AHP technique
4.2.1. Supply Network Projects: A New Factory and 2 New DCs
The network re-design alternative in logistics would occur in 2019. As a result, there is a significant carbon emissionreduction in transportation, in both secondary transport (35%) and primary transport (45%). It is mainly aconsequence of the kilometres travelled, reporting 31% less in the primary and 45% in the secondary transport.
During 2020 the company would open a new factory in Germany. This decision is based on the fact that differentmanufacturing and other operations from Europe are better from an environmental and carbon footprintperspective than the United States.
4.2.2. Manufacturing Projects: Wind Energy and Biomass Technology
Wind energy is a good option for implementation in 2021, as a part of the improvements of the new factorycommissioned in Germany. This plan is based on the possibility of making agreements with a renewable energycompany which will provide a certified energy supply.
On the other hand, for the US factory in 2022, the proposal is to implement Biomass technology. The biomassboiler is fed with old pallets and waste wood from the furniture industry, but the factory should only use sustainablebiomass from genuine “end of life” sources that do not compete with food crops.
4.2.3. Transportation Projects: Intermodal Water-Road and CNG
The plan for the secondary transport would be to use road transport, due to the flexibility that this kind oftransport mode has. However, the proposal is to use Compressed Natural Gas (CNG) at the beginning of theroadmap in 2018 just for routes between California DC and retailers and extend this scope for all the secondarytransport in 2024. The intermodal water-road would also be part of the plan for primary routes starting in 2023.
Figure 8 shows how the six alternatives are allocated across the roadmap. The impact of the implementation ofthese alternatives is a 36% reduction in carbon emissions in terms of Kg CO2 per Kg sold (8.3 in 2018 vs 5.7 in2024). As Figure 7 shows, all the alternatives are divided into projects related with energy management, alternativefuels, intermodal transport and network design.
In order to create a carbon reduction strategy, the AHP method was implemented. The implementation of thisMCDM method has proposed a plan where the carbon emissions in terms of Kg CO2 per Kg sold is reduced 36%over 7 years. The method selected 6 alternatives which are allocated in the roadmap according to the company’spriorities.
-458-

Journal of Industrial Engineering and Management – https://doi.org/10.3926/jiem.2518
Figure 8. Carbon Reduction Roadmap for the metallurgical company
The given methodology, including the set of alternatives, was presented and are in evaluation phase. So far, theassess is positive and the evaluation rates the proposal as logical, reasonable and useful for reaching the CO2 targets.The proposal is considered as very good starting point, considering that carbon corporate standards are still lackingin the corporate world where there is lots of leeway for misunderstanding and misinterpretation.
4.3. A Sensitivity Analysis of the Carbon Scope Definition
Depending on what the companies are trying to do, different scenarios can be evaluated. For instance, if only thetransportation between DCs and retailers were considered, the distance would be a key factor. Nevertheless, in thelogistics area, the agreements with the 3PLs are also another key parameter.
If the scope is extended to the factories, energy management can be even more important than the transportationaspect and again, agreements with the factory would be a significant point; for example, joint venture agreements.Furthermore, if the scope included raw materials, the supplier’s location would be important and would be relevantif the supplier also worked with some sustainable policies.
Once the carbon emission forecast is carried out, it is possible to look at all the elements of the supply chain, tounderstand the agreements with all the facilities, movements, port operations and international shipments anddefine the strategic scope to be used by the company.
In order to demonstrate the importance of the scope definition a sensitivity analysis for different scopes wascarried out, based on the 2019 carbon forecast. Three scenarios are generated in this section, the first being thequantification of the extended scope which is used in the case study. Scenario 2 includes the ownership perspective,whilst scenario 3 was developed using the scope 1 and 2 of the GHG protocol. Finally, scope 4 quantifies carbonemissions from a conservative perspective.
4.3.1. Scenario 1: The Extended Scope
The particularity of this first analysis is that it includes the emissions coming from suppliers as well as theassociated transportation. Therefore, this extended scope includes the carbon emissions of the DC facilities(California, Georgia, Texas) and factories (Michigan and Dortmund) and carbon emissions of the raw materialscoming from suppliers (based in Shanghai, Istanbul, Kiev).
The extended scope also includes the transportation from the DCs to the retailers, the transportation from factoriesto the DCs and transportation from the suppliers to the factories. Normally, the corporate offices should also beincluded, but the analysis proposed here takes into account only own facilities which are part of the supply chain(this assumption is used for all scenarios).
-459-
Journal of Industrial Engineering and Management – https://doi.org/10.3926/jiem.2518
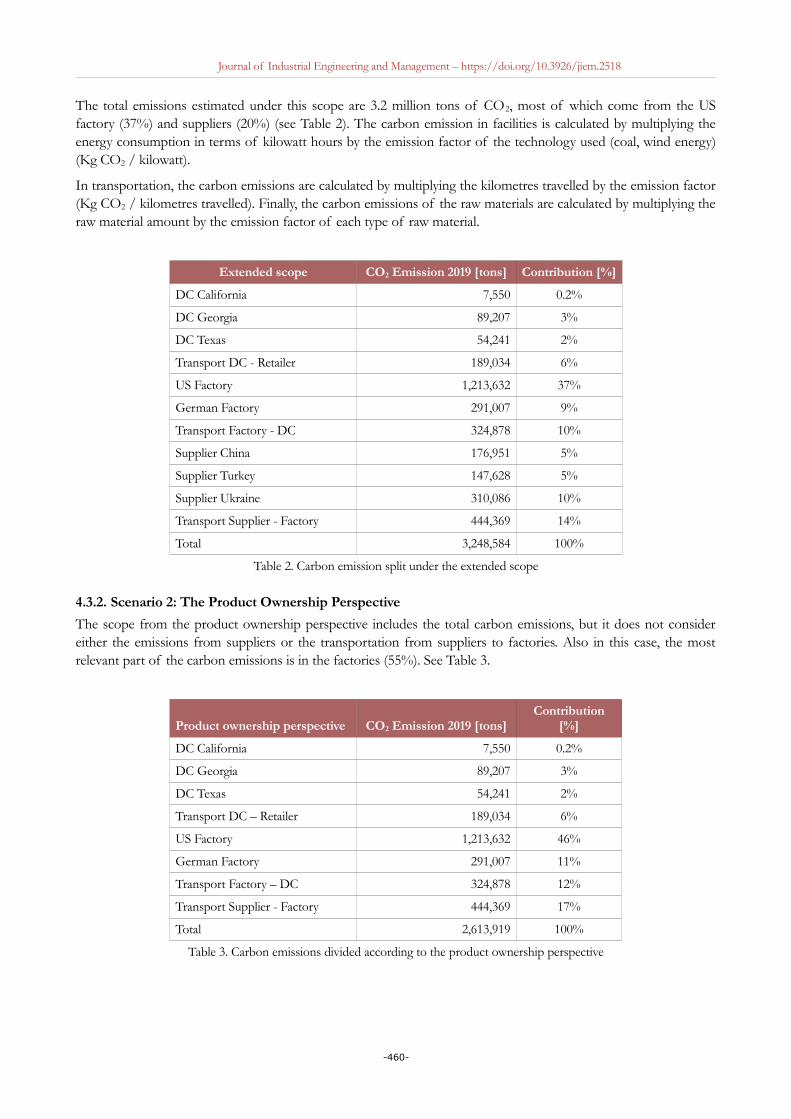
The total emissions estimated under this scope are 3.2 million tons of CO2, most of which come from the USfactory (37%) and suppliers (20%) (see Table 2). The carbon emission in facilities is calculated by multiplying theenergy consumption in terms of kilowatt hours by the emission factor of the technology used (coal, wind energy)(Kg CO2 / kilowatt).
In transportation, the carbon emissions are calculated by multiplying the kilometres travelled by the emission factor(Kg CO2 / kilometres travelled). Finally, the carbon emissions of the raw materials are calculated by multiplying theraw material amount by the emission factor of each type of raw material.
Extended scope CO2 Emission 2019 [tons] Contribution [%]
DC California 7,550 0.2%
DC Georgia 89,207 3%
DC Texas 54,241 2%
Transport DC - Retailer 189,034 6%
US Factory 1,213,632 37%
German Factory 291,007 9%
Transport Factory - DC 324,878 10%
Supplier China 176,951 5%
Supplier Turkey 147,628 5%
Supplier Ukraine 310,086 10%
Transport Supplier - Factory 444,369 14%
Total 3,248,584 100%
Table 2. Carbon emission split under the extended scope
4.3.2. Scenario 2: The Product Ownership Perspective
The scope from the product ownership perspective includes the total carbon emissions, but it does not considereither the emissions from suppliers or the transportation from suppliers to factories. Also in this case, the mostrelevant part of the carbon emissions is in the factories (55%). See Table 3.
Product ownership perspective CO2 Emission 2019 [tons]Contribution
[%]
DC California 7,550 0.2%
DC Georgia 89,207 3%
DC Texas 54,241 2%
Transport DC – Retailer 189,034 6%
US Factory 1,213,632 46%
German Factory 291,007 11%
Transport Factory – DC 324,878 12%
Transport Supplier - Factory 444,369 17%
Total 2,613,919 100%
Table 3. Carbon emissions divided according to the product ownership perspective
-460-
Journal of Industrial Engineering and Management – https://doi.org/10.3926/jiem.2518
4.3.3. Scenario 3: GHG Scope 1 & Scope 2
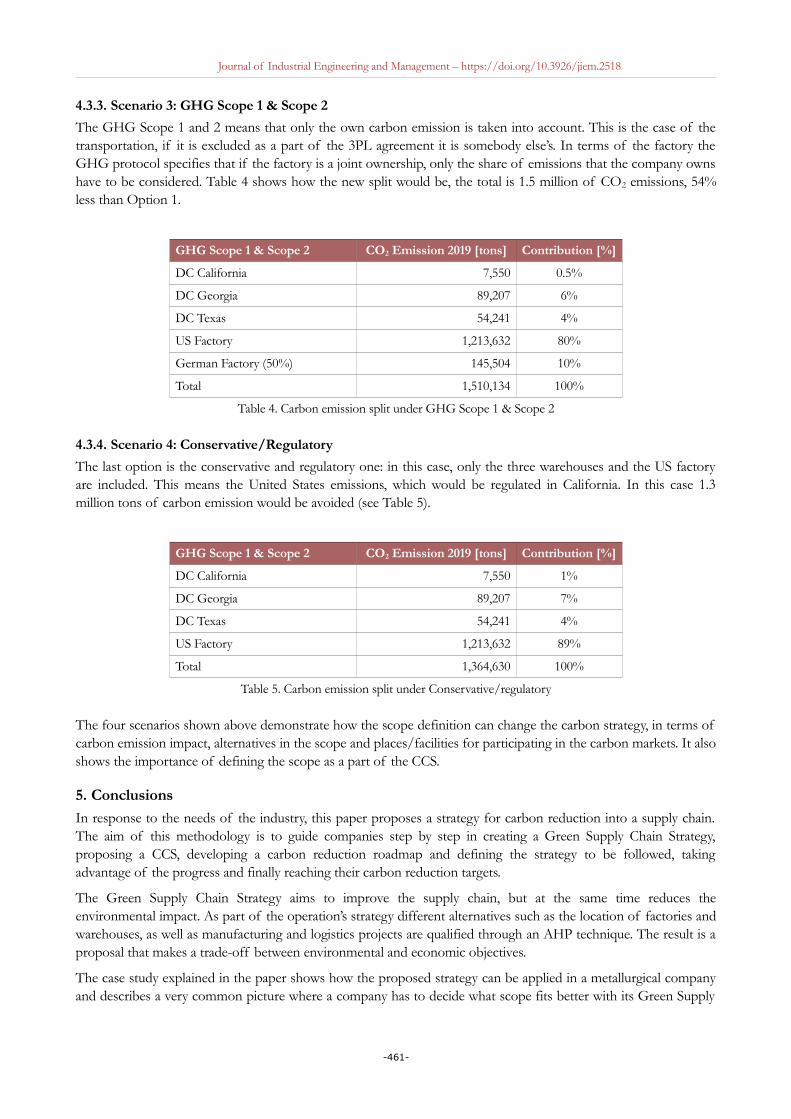
The GHG Scope 1 and 2 means that only the own carbon emission is taken into account. This is the case of thetransportation, if it is excluded as a part of the 3PL agreement it is somebody else’s. In terms of the factory theGHG protocol specifies that if the factory is a joint ownership, only the share of emissions that the company ownshave to be considered. Table 4 shows how the new split would be, the total is 1.5 million of CO2 emissions, 54%less than Option 1.
GHG Scope 1 & Scope 2 CO2 Emission 2019 [tons] Contribution [%]
DC California 7,550 0.5%
DC Georgia 89,207 6%
DC Texas 54,241 4%
US Factory 1,213,632 80%
German Factory (50%) 145,504 10%
Total 1,510,134 100%
Table 4. Carbon emission split under GHG Scope 1 & Scope 2
4.3.4. Scenario 4: Conservative/Regulatory
The last option is the conservative and regulatory one: in this case, only the three warehouses and the US factoryare included. This means the United States emissions, which would be regulated in California. In this case 1.3million tons of carbon emission would be avoided (see Table 5).
GHG Scope 1 & Scope 2 CO2 Emission 2019 [tons] Contribution [%]
DC California 7,550 1%
DC Georgia 89,207 7%
DC Texas 54,241 4%
US Factory 1,213,632 89%
Total 1,364,630 100%
Table 5. Carbon emission split under Conservative/regulatory
The four scenarios shown above demonstrate how the scope definition can change the carbon strategy, in terms ofcarbon emission impact, alternatives in the scope and places/facilities for participating in the carbon markets. It alsoshows the importance of defining the scope as a part of the CCS.
5. Conclusions
In response to the needs of the industry, this paper proposes a strategy for carbon reduction into a supply chain.The aim of this methodology is to guide companies step by step in creating a Green Supply Chain Strategy,proposing a CCS, developing a carbon reduction roadmap and defining the strategy to be followed, takingadvantage of the progress and finally reaching their carbon reduction targets.
The Green Supply Chain Strategy aims to improve the supply chain, but at the same time reduces theenvironmental impact. As part of the operation’s strategy different alternatives such as the location of factories andwarehouses, as well as manufacturing and logistics projects are qualified through an AHP technique. The result is aproposal that makes a trade-off between environmental and economic objectives.
The case study explained in the paper shows how the proposed strategy can be applied in a metallurgical companyand describes a very common picture where a company has to decide what scope fits better with its Green Supply
-461-
Journal of Industrial Engineering and Management – https://doi.org/10.3926/jiem.2518
Chain Strategy. First, the CCS is defined; a finite number of potential alternatives (twelve) are selected in the CCS;these alternatives should be quantified in terms of supply chain cost, carbon emission or marketing impact.Secondly, an AHP technique was used to select six of the twelve alternatives, then these alternatives were properlyallocated in the roadmap timeline.
In the case study the carbon emission KPI, in terms of cost Kg CO2 per Kg, is improved 36%. To achieve theseresults, the AHP technique has selected alternatives such as commissioning two Distribution Centres (Georgia andTexas), commissioning a new factory in Germany, using CNG as an alternative fuel on the secondary routes andintermodal water-road on primary routes. Additionally, the alternative in manufacturing is to implement windenergy in the factory based in Germany and to use biomass technology in the US-based factory.
The case study also demonstrates the importance of defining the scope, early in the CCS stage. Depending on theconsidered scope and on what the company wants to do with the results, the strategy may produce differentanswers. If only the transportation level is considered the distance would be the most relevant parameter; if themanufacturing emissions are included it can actually reverse the decision, even more so if the supplier is taken intoaccount, which can change the picture again.
Finally, it is important to point out the importance of the communication strategy in the implementation stage. It ishighly recommended that the whole company is committed to align the supply chain strategy with achieving thecarbon reduction targets.
AcknowledgmentsThis paper was supported by the project DPI2015-67740-P(MINECO/FEDER).
Declaration of Conflicting Interests
The authors declared no potential conflicts of interest with respect to the research, authorship, and/or publicationof this article.
Funding
The authors received no financial support for the research, authorship, and/or publication of this article.
References
Ajanovic, A., & Haas, R. (2015). Driving with the sun: Why environmentally benign electric vehicles must plug in atrenewables. Solar Energy, 121, 169-180. https://doi.org/10.1016/j.solener.2015.07.041
Al-Barqawi, H., & Zayed, T. (2008). Infrastructure Management: Integrated AHP/ANN Model to EvaluateMunicipal Water Mains’ Performance. Journal of Infrastructure Systems, 14(4), 305-318. https://doi.org/10.1061/(ASCE)1076-0342(2008)14:4(305)
Álvarez, E., & de la Calle, A. (2011). Sustainable practices in urban freight distribution in Bilbao. Journal of IndustrialEngineering and Management, 538-553. https://doi.org/10.3926/jiem.2011.v4n3.p538-553
Behzadian, M., Kazemzadeh, R., Albadvi, A., & Aghdasi, M. (2010). PROMETHEE: A comprehensive literaturereview on methodologies and applications. European Journal of Operational Research, 200(1), 198-215.https://doi.org/10.1016/j.ejor.2009.01.021
Bianchi, M., & De Pascale, A. (2012). Emission Calculation Methodologies for CHP Plants. Energy Procedia, 14,1323-1330. https://doi.org/10.1016/j.egypro.2011.12.1096
Busch, T., Lehmann, N., & Hoffmann, V. (2012). Corporate Social Responsibility, Negative Externalities, and Financial Risk:The Case of Climate Change. Amsterdam and Rotterdam: Duisenberg school of finance - Tinbergen InstituteDiscussion Paper.
Cadez, S., & Czerny, A. (2016). Climate change mitigation strategies in carbon-intensive firms. Journal of CleanerProduction, 112(5), 4132-4143. https://doi.org/10.1016/j.jclepro.2015.07.099
-462-

Journal of Industrial Engineering and Management – https://doi.org/10.3926/jiem.2518
Carbon Trust. (2012). Green your business for growth. Management Guide. London.
Chaabane, A., Ramudhin, A., & Paquet, M. (2010). Design of sustainable supply networks under the emissiontrading scheme. International Journal of Production Economics, 135, 37-49. https://doi.org/10.1016/j.ijpe.2010.10.025
Cordero, P. (2013). Carbon footprint estimation for a sustainable improvement of supply chains: state of the art.Journal of Industrial Engineering and Management, 6(3), 805-813. https://doi.org/10.3926/jiem.570
Damert, M., Arijit, P., & Ruoert, B. (2017). Exploring the determinants and long-term performance outcomes ofcorporate carbon strategies. Journal of Cleaner Production, 160, 123-138. https://doi.org/10.1016/j.jclepro.2017.03.206
Dasaklis, T.K., & Costas, P.P. (2013). Supply chain management in view of climate change: An overview of possibleimpacts and the road ahead. Journal of Industrial Engineering and Management, 6(4), 1124-1138.https://doi.org/10.3926/jiem.883
Franchetti, M., & Apul, D. (2012). Carbon Footprint Analysis: Concepts, Methods, Implementation, and Case Studies (SystemsInnovation Book Series). CRC Press. https://doi.org/10.1201/b12173
Günther, H., Kannegiesser, M., & Autenrieb, N. (2015). The role of electric vehicles for supply chain sustainabilityin the automotive industry. Journal of Cleaner Production, 90, 220-233. https://doi.org/10.1016/j.jclepro.2014.11.058
Handfield, R., & Nichols Jr., E. (1999). Introduction to supply chain management. New Jersey: Prentic-Hall.
Hashim, M., Nazam, M., Yao, L., Baig, A.S., & Zia-ur-Rehman, M. (2017). Application of multi-objectiveoptimization based on genetic algorithm for sustainable strategic supplier selection under fuzzy environment.Journal of Industrial Engineering and Management, 10(2), 182-212. https://doi.org/10.3926/jiem.2078
Hoffman, A.J. (2005). Climate Change Strategy: The Business Logic behind Voluntary Greenhouse Gas Reduction.California Management Review, 47(3). https://doi.org/10.2307/41166305
Hou, Y., Jia, M., Tian, X., Wei, F., & Wei, K. (2015). Optimal Decisions of Countries with Carbon Tax and CarbonTariff. Journal of Industrial Engineering and Management, 8(3), 981-1001. https://doi.org/10.3926/jiem.1506
International Organization for Standardization. (2006). ISO 14064. Standard, Geneva, Switzerland.
Jeswani, K., Wehrmeyer, W., & Mulugetta, Y. (2007). How warm is the corporate response to climate change?Evidence from Pakistan and the UK. Business Strategy and the Environment, 18, 46-60.
Johnson, E., & Heinen, R. (2004). Carbon trading: time for industry involvement. Environment International, 30,279-288. https://doi.org/10.1016/j.envint.2003.09.001
Kolk, A., & Levy, D. (2001). Winds of Change:: Corporate Strategy, Climate change and Oil Multinationals.European Management Journal, 19(5), 501-509. https://doi.org/10.1016/S0263-2373(01)00064-0
Kumar, S., Teichman, S., & Timpernagel, T. (2011). A green supply chain is a requirement for profitability.International Journal of Production Research, 1278-1296.
Lee Lam, J. (2014). Designing a sustainable maritime supply chain: A hybrid QFD–ANP approach. TransportationResearch Part E: Logistics and Transportation Review. https://doi.org/10.1002/bse.711
Lee, S.-Y. (2012). Corporate carbon strategies in responding to climate change. Business Strategy and the Environment,21, 33-48. https://doi.org/10.1002/bse.711
Letmathe, P., & Balakrishnan, N. (2005). Environmental considerations on the optimal product mix. EuropeanJournal of Operational Research, 167, 398-412. https://doi.org/10.1016/j.ejor.2004.04.025
Li, G., Xu, H., & Liu, W. (2013). Option of operating speed for vessels under low-carbon economy. Journal ofIndustrial Engineering and Management, 6(1), 289-296. https://doi.org/10.3926/jiem.660
Mardani, A., Jusoh, A., Nor, K.M., Khalifah, Z., Zakwan, N., & Valipour, A. (2015). Multiple criteriadecision-making techniques and their applications – a review of the literature from 2000 to 2014. EconomicResearch-Ekonomska Istraživanja, 28, 516-571. https://doi.org/10.1080/1331677X.2015.1075139
-463-
Journal of Industrial Engineering and Management – https://doi.org/10.3926/jiem.2518
Mintzberg, H. (2000). The strategy process: concepts, contexts, cases. Prentice Hall.
Montabon, F., Sroufe, R., & Narasimhan, R. (2007). An examination of corporate reporting, environmentalmanagement practices and firm performance. Journal of Operations Management, 25(5), 998-1014.https://doi.org/10.1016/j.jom.2006.10.003
Okereke, C., & Russel, D. (2010). Regulatory Pressure and Competitive Dynamics: Carbon Management Strategiesof UK Energy-Intensive Companies. California Management Review, 52, 100-124.https://doi.org/10.1525/cmr.2010.52.4.100
Opetuk, T., Zolo, I., & Dukic, G. (2010). Greening elements in the distribution networks. Journal of IndustrialEngineering and Management, 3(2), 353-363. https://doi.org/10.3926/jiem.2010.v3n2.p353-369
Özsalih, H. (2007). MSc: A methodology for transport buying companies to estimate CO2 emissions in transport: Application inUnilever European Logistics. Schaffhausen.
Pan, S., Ballot, E., & Fontane, F. (2013). The reduction of greenhouse gas emissions from freight transport bypooling supply networks. International Journal of Production Economics, 143(1), 86-94.https://doi.org/10.1016/j.ijpe.2010.10.023
Pinto, C., & Coves, A. (2014). The reduction of CO2 emission into the supply network design: A review of currenttrends in mathematical models. Annual of Industrial Enginerring 2012, 131-138. https://doi.org/10.1007/978-1-4471-5349-8_16
Pinto-Varela, T., Barbosa-Póvoa, A., & Novais, A. (2011). Bi-objective optimization approach to the design andplanning of supply chains: Economic versus environmental performances. Computers & Chemical Engineering, 35,1454-1468. https://doi.org/10.1016/j.compchemeng.2011.03.009
Saaty, T.L. (1988). Multicriteria Decision Making: The Analytic Hierarchy Process: Planning, Priority Setting, Resource Allocation.New York, USA: McGraw-Hill: New York.
Seuring, S., & Müller, M. (2008). Core issues in sustainable supply chain management – a Delphi study. BusinessStrategy and the Environment, 17, 455-466. https://doi.org/10.1002/bse.607
Slawinski, N., Pinkse, J., Busch, T., & Baner, S.B. (2015). The Role of Short-Termism and Uncertainty Avoidance inOrganizational Inaction on Climate Change. Business & Society, 56(2), 253-282.https://doi.org/10.1177/0007650315576136
Srivastava, S. (2007). Green supply chain management: a state of the art literature review. ‐ ‐ ‐ ‐ International Journal ofManagement Reviews, 9, 53-80. https://doi.org/10.1111/j.1468-2370.2007.00202.x
Tian, Y., & Yang, M. (2013). Demonstration analysis for the low-carbon factors index system of logisticsenterprises. Journal of Industrial Engineering and Management, 6(1), 297-307. https://doi.org/10.3926/jiem.681
Trotta, M.G. (2010). Product Lifecycle Management: Sustainability and knowledge management as keys in acomplex system of product development. Journal of Industrial Engineering and Management, 3(2), 309-322.https://doi.org/10.3926/jiem.2010.v3n2.p309-322
Vujanovića, A., Čučekb Lidija, P.B., & Zdravko, K. (2014). Multi-Objective Synthesis of a Company’sSupply-Network by Accounting for Several Environmental Footprints. Process Safety and Environmental Protection.https://doi.org/10.1016/j.psep.2014.03.004
Wang, F., Xiaofan, L., & Shi, N. (2011). A multi-objective optimization for green supply network network design.Decision Support Systems, 51, 262-269. https://doi.org/10.1016/j.dss.2010.11.020
Wang, Y., Zhu, X., & Jeeva, A.S. (2013). Eco-efficient based logistics network design in hybrid manufacturing/remanufacturing system in low-carbon economy. Journal of Industrial Engineering and Management, 6(1), 200-214.https://doi.org/10.3926/jiem.665
WBCSD/WRI. (2004). The Greenhouse Gas Protocol: a corporate accounting and reporting standard.
-464-

Journal of Industrial Engineering and Management – https://doi.org/10.3926/jiem.2518
WCED, W.C. (1987). Our common future. Oxford: Oxford University Press.
Wu, H., & Dunn, S. (1995). Environmentally responsible logistics systems. Journal of Physical Distribution and LogisticsManagement International, 25, 20-20. https://doi.org/10.1108/09600039510083925
Yunus, S., Elijido-Ten, E., & Abhayawansa, S. (2016). Determinants of carbon management strategy adoption:Evidence from Australia’s top 200 publicly listed firms. Managerial Auditing Journal, 31, 156-179.https://doi.org/10.1108/MAJ-09-2014-1087
Journal of Industrial Engineering and Management, 2018 (www.jiem.org)
Article’s contents are provided on an Attribution-Non Commercial 4.0 Creative commons International License. Readers areallowed to copy, distribute and communicate article’s contents, provided the author’s and Journal of Industrial Engineering andManagement’s names are included. It must not be used for commercial purposes. To see the complete license contents, please
visit https://creativecommons.org/licenses/by-nc/4.0/.
-465-