a psychological investigation on public-transport users' intention to use routes with transfers
TRANSCRIPT

International Journal of Transportation
Vol.1, No.1 (2013), pp.1-20
http://dx.doi.org/10.14257/ijt.2013.1.1.01
ISSN: 2287-7940 IJT
Copyright ⓒ 2013 SERSC
A Psychological Investigation on Public-transport Users’ Intention to
Use Routes with Transfers
Subeh Chowdhury and Avishai (Avi) Ceder (Corresponding author)
Faculty of Engineering
Department of Civil and Environmental Engineering
University of Auckland, New Zealand
Tel: 64-9-373 7599 ext: 85868 Fax: 64-9-3652808
Abstract One of the most common strategies used by authorities to promote ridership of public
transport (PT) has been to provide travelers with an integrated multimodal transport system.
Effective interconnections are a key element in the success of integrated transport systems.
This study seeks to explore the cognitive factors which influence travelers’ willingness to
make transfers. The theory of planned behavior (TPB) was adopted to investigate the role of
perceived behavioral control (PBC) in travelers’ intentions to use PT routes with transfers.
PBC was measured by being decomposed into its constituting elements: self-efficacy and
perceived controllability. The effect of travelers’ trip characteristics and socio-demographics
on their PBC and intention was assessed. A survey was undertaken in two major transport
centers in Auckland, New Zealand. Overall, the analysis demonstrated that the TPB is
capable of explaining PT users’ intention to use routes with transfers. Travel patterns related
to gender, frequency of PT use and current use of transfer routes were seen to have an effect
on intention. PT users need to feel capable (strong PBC) of making the transfers. Authorities
need to focus on developing attractive transfer routes with comfortable transfers, from a user
perspective, to encourage ridership of PT.
Keywords: public transport, transfers, travel behavior, theory of planned behavior
1. Introduction
With trip making behavior becoming more spatially and purpose-wise complex, transit
operators and planners continue to face the challenge of providing travelers with an attractive
public transport (PT) system as a viable alternative to cars [2]. The increase in trip chaining
complexity has been identified as a barrier to the ridership of PT [3]. The perceived
inconvenience caused by transfers has been shown to influence travelers’ decision to use PT
in terms of their path and destinations [4, 5]. Literature on transit connectivity has been
predominantly focused on travel time and interchange time (waiting and walking time) to
improve the ridership of transfer routes [6-9]. In comparison, there have been a limited
number of research studies [10-12] which focused on the psychological aspect of travel
behavior related to PT. To the authors’ knowledge, none of the past studies have investigated

International Journal of Transportation
Vol.1, No.1 (2013)
2 Copyright ⓒ 2013 SERSC
travelers’ psychological factors in association with their willingness to use PT routes
involving transfers.
The present study adopts the theory of planned behavior (TPB) to explore the relationship
between travelers’ perceived behavioral control (PBC) and their intention to use PT. TPB has
been used as a common psychological model to predict travelers’ actual use of PT [10, 11, 13,
14]. A user preference survey has been undertaken in Auckland, New Zealand. The data was
analyzed using structural equation modeling (SEM). Findings of the study aim to support
decision makers in developing new transfer routes and in improving the quality of existing
transfer routes for enabling a more efficient and integrated PT network.
Hereafter, Section 2 outlines the literature review, Section 3 provides the study’s
methodology, Section 4 describes the data collection process, Section 5 outlines the results
and interpretation, Section 6 is discussion and lastly, Section 7 provides the conclusion.
2. Literature Review
2.1 Trip attributes related to transfers
Transfer penalty is defined as the value which encompasses the negative perceptions
travelers have about PT routes with transfers [7]. A number of trip attributes have been
identified to be major contributors of transfer penalty. Intermodal transfers have been shown
to be more onerous than intra-modal transfers [15]. For service quality, trip attributes such as
personal safety, reliability of connection, journey time, transfer time and information related
to transfers have been shown to be key indicators for travelers’ perception of transfer routes
[16-20]. Personal safety at stations has been revealed to be the most sensitive factor in
travelers’ decision to use PT [19, 21-23]. Travel time has been revealed to be another
significant determinant of mode and route choice [24]. As such, missed connections and
delays were shown to cause anxiety to the user [25]. Hadas and Ceder [26] discussed that
missed transfers are a major contributor to the reliability issues of PT services. There is much
support for transfer waiting time being valued higher than transfer walking time [6, 9].
Transfer walking time has shown to be more onerous than entry and exit walking time [27].
Other studies have shown that integrated information systems are required to reduce the
perceived inconvenience of making transfers [20, 28, 29].
2.2 Theory of Planned Behavior
The TPB is a psychological model which has been used in past travel behavior studies to
understand the relationship between travelers’ beliefs and their willingness to use PT [12, 30-
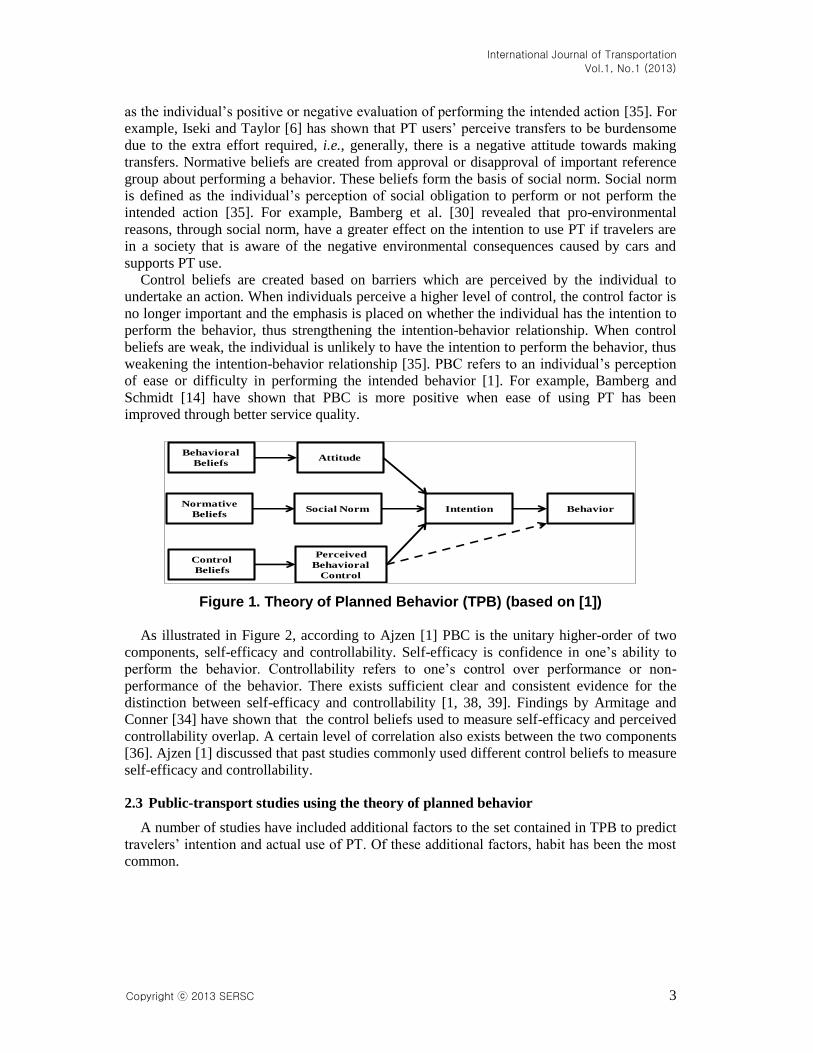
33]. As shown in Figure 1, behavior is determined by intention and at times, PBC as well.
The rationale for a direct link between PBC and behavior is that given a sufficient degree of
actual control over the behavior, people are expected to carry out their intentions when
requisite opportunities and resources (e.g., time, money, skills) are available [1]. The strength
of intention provides an indication of how hard people are willing to try, of how much effort
they are willing to exert, in order to conduct the behavior [34]. In other words, intention
captures the motivational factors which influence a behavior. According to the TPB, intention
is viewed as the resultant of three antecedents: attitude, social norm and perceived behavioral
control (PBC). These intention antecedents are based on behavioral beliefs, normative beliefs
and control beliefs, respectively [35, 36]. Ajzen [35] claims that these beliefs are the
foundation of behavior and changes in these beliefs should lead to change in behavior.
Individuals create beliefs about a behavior by associating it with certain attributes. These
beliefs are termed “behavioral beliefs” and form the basis of attitude [37]. Attitude is defined
International Journal of Transportation
Vol.1, No.1 (2013)
Copyright ⓒ 2013 SERSC 3
as the individual’s positive or negative evaluation of performing the intended action [35]. For
example, Iseki and Taylor [6] has shown that PT users’ perceive transfers to be burdensome
due to the extra effort required, i.e., generally, there is a negative attitude towards making
transfers. Normative beliefs are created from approval or disapproval of important reference
group about performing a behavior. These beliefs form the basis of social norm. Social norm
is defined as the individual’s perception of social obligation to perform or not perform the
intended action [35]. For example, Bamberg et al. [30] revealed that pro-environmental
reasons, through social norm, have a greater effect on the intention to use PT if travelers are
in a society that is aware of the negative environmental consequences caused by cars and
supports PT use.
Control beliefs are created based on barriers which are perceived by the individual to
undertake an action. When individuals perceive a higher level of control, the control factor is
no longer important and the emphasis is placed on whether the individual has the intention to
perform the behavior, thus strengthening the intention-behavior relationship. When control
beliefs are weak, the individual is unlikely to have the intention to perform the behavior, thus
weakening the intention-behavior relationship [35]. PBC refers to an individual’s perception
of ease or difficulty in performing the intended behavior [1]. For example, Bamberg and
Schmidt [14] have shown that PBC is more positive when ease of using PT has been
improved through better service quality.
Figure 1. Theory of Planned Behavior (TPB) (based on [1])
As illustrated in Figure 2, according to Ajzen [1] PBC is the unitary higher-order of two
components, self-efficacy and controllability. Self-efficacy is confidence in one’s ability to
perform the behavior. Controllability refers to one’s control over performance or non-
performance of the behavior. There exists sufficient clear and consistent evidence for the
distinction between self-efficacy and controllability [1, 38, 39]. Findings by Armitage and
Conner [34] have shown that the control beliefs used to measure self-efficacy and perceived
controllability overlap. A certain level of correlation also exists between the two components
[36]. Ajzen [1] discussed that past studies commonly used different control beliefs to measure
self-efficacy and controllability.
2.3 Public-transport studies using the theory of planned behavior
A number of studies have included additional factors to the set contained in TPB to predict
travelers’ intention and actual use of PT. Of these additional factors, habit has been the most
common.
Behavioral
Beliefs
Normative
Beliefs
Control
Beliefs
Attitude
Social Norm
Perceived
Behavioral
Control
Intention Behavior

International Journal of Transportation
Vol.1, No.1 (2013)
4 Copyright ⓒ 2013 SERSC
Figure 2. Perceived Behavioral Control (PBC) (based on [1])
For example, a study by Verplanken et al., [40] investigated habitual aspects versus
reason-based aspects, as defined by TPB, to determine mode choice between car and PT.
Results showed that the relationship between intention and behavior is mediated by the
strength of habit. Intention was shown to be a significant predictor of behavior only when
habit was weak or absent; when habit was strong or moderate the predictive power of
intention became insignificant. Another study on mode choice by Chen et al., [32] examined
travelers’ intention to switch from private vehicles to PT. The study used TPB in conjunction
with another model, the technology acceptance model (TAM) and included habit as a
construct in the combined model. All three constructs of TPB positively and significantly
influenced intention. Habit was shown to be a weaker predictor when compared to social
norm and attitude and had a significant negative effect on intention. This implied that habit of
private vehicle users would, to some extent, hinder their intentions to switch to PT.
Bamberg et al., [41] examined the effects of a fare intervention (discounted pre-paid bus
ticket) on students’ intention to use the bus. Frequency of prior behavior and habit were
included with the constructs of TPB to predict PT use. Results showed that neither prior
behavior nor habit had any significant effect on PT use after the intervention. The three
antecedents in the TPB were found to have a significant positive effect on intention and
accurately predict the reported behavior after intervention. The study concluded that in a
stable context, mode choice is based on reason with intervention. Another study by Bamberg
et al., [42] investigated the effects of a PT intervention (combination of information and a
free ticket) on car users’ mode choice in a changed decision context (moving to a new
residence). The study explored the frequency of past behavior and habit versus the set of
variables in TPB to predict car users’ intention to use PT. The results showed the three
constructs of TPB accurately predicted intentions and PT use. Past car use was shown to have
no significant effect on intention and actual PT use.
Other past studies have included additional factors such as moral norms, personal norms,
descriptive norms and pro-environmental beliefs to predict PT travel behavior. For example,
Health and Gifford [31] used the TPB to determine the effect of reduced fare, provided by the
universal bus pass program (U-pass), on university students’ bus ridership. An extension of
TPB was used by including variables: descriptive norms, moral (personal) norms,
environmental values, perceived responsibility and awareness of car-use. The study
concluded that the original three constructs of TPB are capable of explaining the changes in
behavior (increase in bus use) after the U-pass implementation. Inclusion of the other
variables improved the predictive ability of the model. Similarly, Long et al., [12] adopted an
extended version of TPB to determine commuters intention to use the future sky train in
Phnom Penh, Cambodia. The additional variables included moral obligation, awareness of
Perceived
Behavioral
Control
Self-EfficacyPerceived
Controllability
Control
BeliefsControl
Beliefs

International Journal of Transportation
Vol.1, No.1 (2013)
Copyright ⓒ 2013 SERSC 5
consequences, attitudinal aspect variables, socioeconomics and trip characteristics. Results
showed that all three constructs of the TPB were statistically significant determinants of
intention, with the model’s predictive ability being improved by the additional variables.
To the authors’ knowledge, no prior studies have investigated the psychological factors
involved in travelers’ intention to use PT routes with transfers. It is unknown to what extent
the TPB can predict PT users’ intention to use transfer routes. Thus, a research gap still exists
in the potential of psychological methods to predict travelers’ willingness to make transfers.
This study contributes by adopting the TPB to examine the psychological factors associated
with PT users’ intention to make transfers. In order to capture the multi-directional
correlations of the psychological factors along with the effects of PT users’ socio-
demographic and trip characteristics, the SEM technique has been used. The next section
discusses the application of SEM.
3. Methodology
3.1 Reduced theory of planned behavior model
Prior studies [7, 27] have shown that generally PT users’ have a negative attitude towards
transfers due to the extra effort required in making the connection. Iseki and Taylor [6]
explain that the negative attitude towards transfers is associated with PT users perception of
outside-vehicle-times to be more onerous than in-vehicle times. Hence, exploration of the
attitude-intention relationship was excluded from investigation. Other studies have
established that social norm has a significant effect on travelers’ intention to use PT [11, 30].
In this study, it was assumed that the social norm-intention relationship in users’ decision to
use PT remains the same for transfer routes. Exploration of the social norm-intention
relationship was also excluded from investigation. Literature [6, 15, 43] has well established
that travelers perceive PT transfer routes to be more onerous than PT direct routes, which is
represented by the imposed transfer penalty on routes with transfers. Therefore it can be
reasoned that the PBC-intention relationship in a traveler’s decision to use transfer routes is
not the same as the traveler’s decision to use PT. The present study investigates PT users’
PBC-intention relationship in their willingness to use transfer routes. A study by Terry and
O’Leary [38] has confirmed that a SEM containing a two-factor structure of PBC, as separate
latent variables, provide a better fit of the data.
The concept behind PBC is that the antecedent of intention represents perception of
potential constraints which are both internal (e.g., knowledge, skills, will-power) and external
(e.g., time, opportunity, money) [1, 36]. Studies [36, 38, 44] exploring the dimensional
structure of PBC have suggested that the construct to be decomposed into: (a) self-efficacy,
measured using items of “one’s confidence in ability to perform the behavior” and (b)
perceived controllability, measured by items of “perceived control over behavior”, to improve
the explanatory power of TPB. Kraft et al. [36] suggested that self-efficacy can be measured
by two types of items: (a) in terms of perceived difficulty (PD); and (b) in terms of
individuals’ confidence in ability to perform the behavior (CON). Perceived controllability
(PC) can be measured by items in terms of perceived control over performance of behavior.
PC has been suggested to be predominantly dependent on external factors such as available
resources and opportunities [34, 38]. Similarly, for the present study, control beliefs of
perceived controllability were measured using operational trip attributes: reliability of
connection, transfer walking time and transfer waiting time. Self-efficacy has been suggested
to be predominantly dependent on internal factors such as ability, perceived inconvenience
and willpower [34, 38]. For the present study, the control beliefs of self-efficacy were

International Journal of Transportation
Vol.1, No.1 (2013)
6 Copyright ⓒ 2013 SERSC
measured using trip attributes which are commonly evaluated by user perception: personal
safety at terminals [23] and need for information to make transfers [20].
3.2 Hypotheses
This section provides the theoretical rationale for the causal relationships in the
conceptualized research model shown in Figure 3. Single-headed arrows illustrate the
hypothetical direction of influence.
Figure 3. Hypothetical model explaining the casual relationship among the latent and manifest variables
A meta-analysis on social behavior studies has shown that self-efficacy is more closely
associated with intention and behavior than perceived controllability [45]. Terry and O’Leary
[38] study on exercise found that self-efficacy only predicted intention, while perceived
controllability predicted behavior. Armitage and Conner [34] study on low-fat diet showed
that both self-efficacy and PC have a significant and positive effect on intention and behavior.
Ajzen [1] provided a summary of five studies which used a decomposed version of PBC. The
results of the studies showed that the addition of self-efficacy always improved the prediction
of intention and that PC was a significant predictor of intention only when combined with
self-efficacy. Among more recent studies, Elliot and Thomson [46] examination of offending
drivers’ speeding behavior has shown that self-efficacy to be a significant predictor of
intention and behavior and the effects of perceived controllability to be insignificant. Okamura et al., [47] investigated the influential factors of seatbelt use and confined the PBC
construct to only self-efficacy. Results showed that self-efficacy has a positive significant
effect on intention and behavior. According to these points of view, the following hypothesis
is proposed.
Hypothesis 1: The stronger is PT users’ PC and self-efficacy, the greater will be their
intention to use transfer routes.
Applying the TPB to travelers’ decision to use PT routes involving transfers leads to the
following hypothesis:
Hypothesis 2: The stronger is PT users’ intention of use, the greater will be the probability of
actually using a transfer route.
Self-Efficacy
Perceived
Controllability
Socio-demographics &
Trip Characteristics
Control Beliefs
Control Beliefs
Intention Behavior
Perceived
Behavioral Control

International Journal of Transportation
Vol.1, No.1 (2013)
Copyright ⓒ 2013 SERSC 7
Travel behavior studies [10, 48-50] have shown that PT users’ socio-demographics and
trip characteristics have an effect on their travel behavior. Guo and Wilson [7] discussed that
frequent riders tend to be more familiar with the PT network and services and therefore
perceive transfers to be less onerous than infrequent riders. Findings of a study by Shiftan et
al., [51] validated the importance of including socio-demographics and trip characteristics in
travel behavior studies. A study by Iseki and Smart [22] showed that socio-demographics and
trip characteristics have an effect on PT users’ perception of transfers. Van de Walle and
Steenberghen [9] explained that the trip characteristics of a household is a factor in mode and
route choice. The study stated that households have a tendency to optimize the total time
taken to complete all activities by combining trips, for different motives, to chains.
Accordingly, for the present study, it is hypothesized that PT users’ socio-demographics and
trip characteristics have an effect on their control beliefs. The following hypothesis is
proposed:
Hypothesis 3: PT users’ socio-demographics and trip characteristics have a direct effect on
their self-efficacy and perceived controllability and an indirect effect on their intention.
3.3 Structural equation modeling
Since 1980s, SEM has been commonly used in travel behavior studies [51]. As the TPB
contains a chain of mediating causal variables, SEM provides an appropriate statistical tool to
determine the relationships among the variables [14]. Golob [52] provides a comprehensive
review of the use of SEM in travel behavior studies. Among some recent studies, Yang et al.
[50] investigated, by using SEM, the relationship among socio-demographics, activity
participation and trip chaining for male and female household heads. Islam and Habib [53]
used SEM to investigate the hierarchical relationship between trip chain and mode choice.
Farag and Lyons [48] used SEM to examine factors affecting the use and non-use of pre-trip
information on PT.
SEM analysis is composed of two parts: a measurement model and a structural model. The
measurement model explains the effect of the indicators on their latent variables. The
structural model determines the relationship between the latent variables [52]. Latent
variables are unobserved variables that are not directly measured but are inferred by the
relationships or correlations from the relevant manifest (observed) variables [54, 55]. There
are two types of latent variables, reflective and formative [56]. Latent variables are formative
when changes in the indicators determine changes in the variable. Latent variables are
reflective when indicators are seen as functions of the variable, and changes in the variable
determine changes in the observable indicators. Diamantopoulos and Siguaw [56] suggested
that the choice should be made based on the nature of the construct and its relationship to the
measures. For the present study, self-efficacy, PD, PC, PBC, and intention have all been
defined to be reflective latent constructs. Socio-demographics, trip characteristics and
behavior were defined as manifest variables. To determine goodness-of-fit of SEM,
Marcoulides [55] recommends a number of indices be used. Sample size of at least 200 is
required to make their use reliable [57].
3.4 Measurement items for SEM
Wordings for the measurement items were adapted from relevant prior studies [34, 36, 38]
with changes to make them contextually suitable. PBC was represented by two items of CON
and PD, and five items of PC. Section 3.2 discussed the trip attributes which were used to
measure the control beliefs of self-efficacy and PC. All measurement items were presented in

International Journal of Transportation
Vol.1, No.1 (2013)
8 Copyright ⓒ 2013 SERSC
the context: given travel time savings using routes with transfers, will improvement made to
the trip attribute in question cause the PT user to feel more capable of using the connections,
i.e., will the relevant control beliefs become more positive. For CON1 and CON2, the term
“more confident” was used to capture their sense of ability. For PD1 need for information, the
terms “easy or difficult” was used to assess if PT users’ felt more capable of making transfers
with better information on connection. Similarly for PD2 perception of security, the term
“comfortable or uncomfortable” was used to capture their sense of reassurance for personal
safety given good security provisions. Dzieken and Vermeulen [58] discussed that travelers
are more willing to use PT given that their fears have been addressed. Intention was measured
by two items and behavior was the only construct measured as a dichotomous variable [36].
The items for intention and behavior were presented under the assumption that the transfer
routes have high quality information services, minimized transfer waiting and walking times,
highly reliable connections and good security facilities.
Table 1 gives the measurement items for the constructs of the research model. All items
except the item for behavior were measured using a Likert scale. Participants selected either
“Yes/No” for the behavior item. The Likert scale represents one of the most adopted
approaches for generating reliable scales of individual differences [59, 60] and has been
commonly used in travel behavioral studies [11, 30, 31, 61]. A 5-point Likert scale (“1” for
strongly disagree to “5” for strongly agree) was used in the present study.
4. Survey Design
4.1 Survey Location Background and Procedure
The aim of the user preference survey was to validate the conceptual model illustrated in
Figure 3. Two key transport hubs, New Lynn Transport Center and Newmarket Train Station,
were chosen from the Auckland PT network as the survey locations due to the high
percentage of current PT users who make either an intermodal or intra-modal transfer at both
stations. New Lynn Transport Center is the main interchange station in the west and offers
high frequency connection to central Auckland. The center provides users with the
opportunity to make transfers among the train and bus services. Newmarket Train Station is a
key junction in Auckland city’s rail network. The station provides a link between the south,
west and central Auckland. The station caters to the Southern and Western lines of the
Auckland railway network [62]. Transfers occur between the train services. Site observations,
during the morning peak time, revealed the possibility of intermodal (train/bus) transfers due
to bus stops with high frequency services (on average every 10 minutes) located near the train
station. The two hubs are linked; travelers from the south can transfer at Newmarket Train
Station to reach west Auckland at New Lynn Transport Center and vice versa. The other
reason for choosing the two interchange stations was due to their similarity in terms of
architectural design and the station facilities offered to users.
The target samples of this study were existing and potential users of transfer routes. Target
participants were limited to only commuters since this group represents the highest proportion
of PT users. Participation was voluntary. After being briefly informed of the research
purpose, commuters were invited to participate and complete the survey questionnaire on the
spot. The survey was conducted during morning peak hours (7am-10am) in ten working days.
The survey approach adopted for the present study is similar to the approach used in past
studies on travel behavior [12, 32, 63].

International Journal of Transportation
Vol.1, No.1 (2013)
Copyright ⓒ 2013 SERSC 9
Table 1. Measurement statements and indicators for manifest variables
The questionnaire consisted of two sections, Section A and B. Section A contained socio-
demographic and trip characteristic questions. Section B consisted of measurement items for
PBC, intention and behavior. The questionnaire was designed to be completed within 10
minutes.
4.2 Respondents
The number of questionnaires distributed was 300, of which results of 263 participants
were usable for data analysis. Of the participants, 54% are female. About 41% of the
participants are in the age group of 18 to 24 years old, 43% are in the age group from 24 to
44, 12% in the age group from 45 to 64 and only around 4% of participants are more than 64
years old. Approximately 31% of the participants’ annual household income is less than
NZD$30,000, around 35% are between NZD$30,001 – $70,000, 20% are between
NZD$70,001 - $100,000 and about 14% have an annual household income greater than
NZD$100,000. Around 65% of the participants have access to a car. As for their trip
characteristics, about 80% of the participants are frequent riders, and around 46% currently
use a transfer route. Approximately 78% of the participants make at least one trip in addition
to their main trip. Of the 78%, about 26% of the participants use only car for the additional
International Journal of Transportation
Vol.1, No.1 (2013)
10 Copyright ⓒ 2013 SERSC
trips, around 20% uses only PT, 38% uses both PT and car to make the additional trips and
16% uses other mode of transport.
5. Results
5.1 Factor Analysis
Prior to conducting a factor analysis, the data was assessed for suitability. For self-
efficacy, the Bartlett’s Test of Sphericity was significant (p-value: 0.00) and the Kaiser-
Meyer-Olkin measure of sampling adequacy was 0.60. For PC, although the Bartlett’s Test of
Sphericity was significant (p-value: 0.00), the value for the Kaiser-Meyer-Olkin measure was
0.49 (below the recommended value of 0.6). Therefore factor analysis was undertaken only
for self-efficacy and the five PC items were included in the model as five observed variables.
A confirmatory factor analysis (CFA) was run in SPSS with Maximum likelihood extraction
and direct oblimin rotation to check for discriminant validity among the factors. Results in
Table 2 from the pattern and structure matrix show that there is discriminant validity among
the latent variables.
Table 2. Pattern and Structure Matrix
5.2 Structural equation models
The structural equation models were constructed using AMOS (version 19.0). The
notations are given in Table 1. Due to the survey data not being multivariate normal, a
Bollen-Stine bootstrapping method was used to compute the standard errors, bias-corrected
confidence intervals, and p-values for the structural paths being tested [65]. In development
of the final model, the model began with all possible structural paths. The non-significant
paths, based on the bootstrapped p-value, were removed one-by-one in order of least
significant path until all structural paths retained in the model were significant (p-value ≤
0.05). The factor loading for CON2, PD2 and Inten2 was set to 1. Figure 4 illustrates the final
basic model without trip characteristics and socio-demographic items. The regression
coefficients are included in the figure.
Only the structural paths to intention from PD, PC4 and PC5 were statistically significant.
The coefficient for PD and PC4 is positive indicating that, in general, participants who chose
a higher Likert scale (with higher scales corresponding to more agreement with statements)
for PC4 and the items of PD were more likely to select a higher Likert scale for the items of
intention. The coefficient for PC5 is negative revealing that, in general, higher Likert scale
selection for the variable corresponded to lower Likert scales being chosen for the intention
items. Specifically, the results show that, holding all other variables in the model constant, a
one unit increase in the PC5 measure is associated with a decrease of .13 units in the mean
value of intention. The path between intention and decision is shown to be positive and
significant.

International Journal of Transportation
Vol.1, No.1 (2013)
Copyright ⓒ 2013 SERSC 11
Figure 4. Final basic SEM
To this final basic model, the socio-demographic and trip characteristic items were
included as independent variables feeding into the five variables of PC and the two constructs
of self-efficacy, CON and PD. Results showed that these observed variables had statistically
insignificant effects on the latent variables. The socio-demographic and trip characteristic
items were then assessed for any effect on intention directly. Only gender, frequency of PT
use and current use of transfer routes had a significant (p-value ≤ 0.05) effect on the intention
items. Incorporating the effects of gender, frequency and use of transfer routes increased the
explained variance in intention from 20% to 27%. In both the basic final model and the model
including trip characteristics and socio-demographic items, the structural path from CON to
intention was statistically insignificant. However, CON and PD are significantly correlated
(Pearson correlation = 0.616, p-value < 0.001). This means that the latent variable PD could
be replaced by CON and the results would be similar (R2 for intention = 0.26). The final
model was developed by including self-efficacy as the higher-order construct for CON and
Inten2
PC3
PC2
PC1
PC4
PC50.208*
-0.131*
Confidence
CON1 CON2
e4 e5
Intention Decision
z1
0.287***
Inten1
e8 e9
Perceived
Difficulty
PD1 PD2
e6 e7
0.811*** 1.0
1.00.737***
0.616***
0.20
*p≤ 0.05, **p≤ 0.01, ***p≤ 0.001

International Journal of Transportation
Vol.1, No.1 (2013)
12 Copyright ⓒ 2013 SERSC
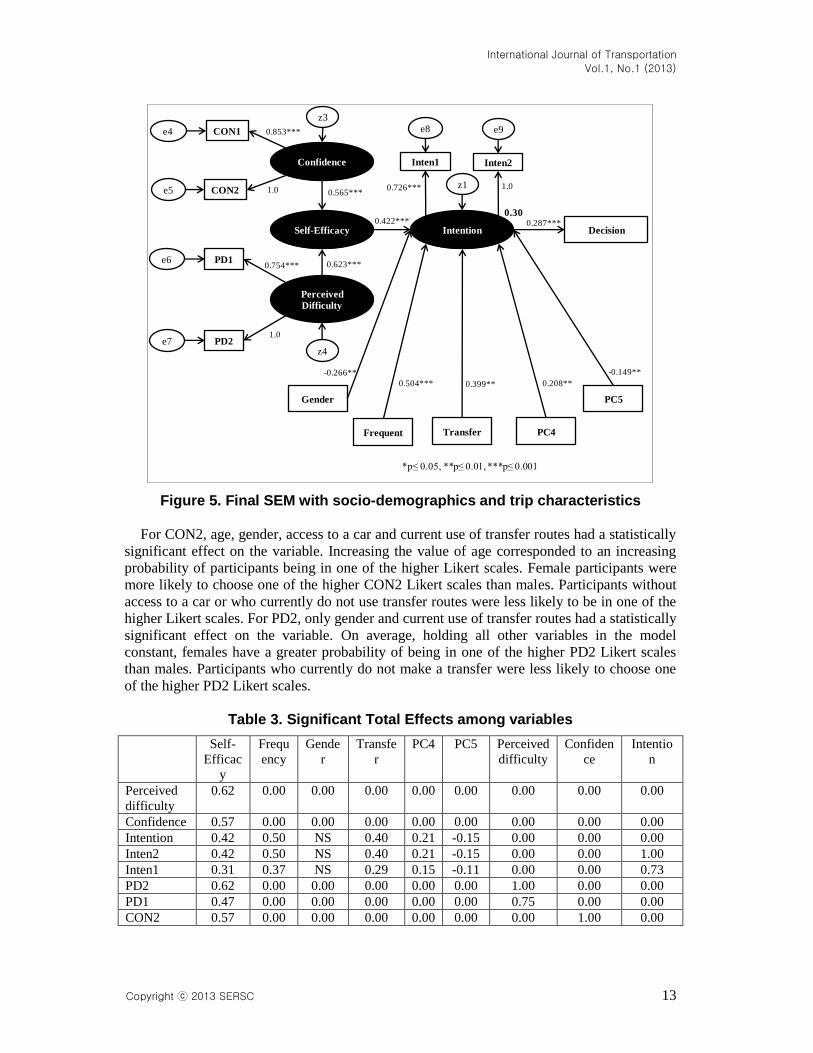
PD. The two statistically significant items for PC (PC4 and PC5) were included as single
variables. From the socio-demographic and trip characteristic items, gender, frequency and
transfer were included as single variables. Inclusion of self-efficacy as a higher order
construct increased the explained variance in intention from 27% to 30%. Figure 5 illustrates
the final model with the significant regression coefficients. The negative coefficient for the
path from PC5 to intention indicates that, holding all other variables constant, one unit
increase in the PC5 measure will decrease the mean value of intention by 0.15 units. Males
were seen to have a lower mean intention value than females; the mean intention measure for
males is 0.27 units lower than that for females. All other observed variables had a positive
effect on intention. Of the trip characteristic variables, results indicate that frequency of PT
use has a greater effect (0.50) on intention than use of current transfer routes (0.40). Results
showed that CON2 has a greater factor loading than CON1 on the latent variable CON and
PD2 has a greater factor loading than PD1on the latent variable PD. PD was seen to have a
slightly higher factor loading (0.62) on self-efficacy than CON (0.57) and self-efficacy has a
higher factor loading (0.42) on intention than the two PC variables. The path from intention to
decision is positive. In general, holding all other variables constant, one unit increase in the
mean value of intention is associated with 0.30 units increase in the mean decision value.
Comparing the model fit indices, AIC and BIC, and the Bollen-Stine p-values have shown
that the final SEM is a better fitting model than the basic final model with socio-demographic
and trip characteristic variables. The AIC and BIC values of the final SEM are smaller. For
the final SEM, the AIC and BIC values are 302.70 and 318.18, respectively. For the basic
final model with socio-demographic and trip characteristic variables, the AIC and BIC values
are 320.06 and 337.10, respectively. The Bollen-Stine bootstrap p-value for the final SEM is
greater (p-value = 0.345 > p-value = 0.190) suggesting no evidence of lack of fit. Other model
fit indices have also indicated the final SEM to be a well-fitted model. The GFI value is 0.96,
AGFI is 0.90, NFI is 0.91, CFI is 0.97 and the RMSEA is 0.04.
Table 3 gives the total effects which are significant (p-value ≤ 0.05). It should be noted that
for the final SEM, the total effects is equal to the direct effects. All other variables, except for
PC5, have a significant positive effect on decision via intention. For PC5, participants who
chose a higher Likert scale were more likely to select “no” for the decision variable.
5.3 Ordinal logistic regression
To investigate the effects of trip characteristic and socio-demographic items on CON, PD
and PC, separate ordinal logistic regressions were performed. For the variables, CON1,
CON2, PD1, PD2, PC1 and PC3 it was found that there were very few participants in the
strongly disagree category and so the strongly disagree category was combined with the
disagree category to give a dependent variable with 4 categories. Results showed that the trip
characteristics and socio-demographic items did not have any statistically significant effects
on CON1, PD1, PC3 and PC4. Table 4 provides a summary of the variables which had a
significant effect on the dependent variables CON2, PD2, PC1, PC2 and PC5.
International Journal of Transportation
Vol.1, No.1 (2013)
Copyright ⓒ 2013 SERSC 13
Figure 5. Final SEM with socio-demographics and trip characteristics
For CON2, age, gender, access to a car and current use of transfer routes had a statistically
significant effect on the variable. Increasing the value of age corresponded to an increasing
probability of participants being in one of the higher Likert scales. Female participants were
more likely to choose one of the higher CON2 Likert scales than males. Participants without
access to a car or who currently do not use transfer routes were less likely to be in one of the
higher Likert scales. For PD2, only gender and current use of transfer routes had a statistically
significant effect on the variable. On average, holding all other variables in the model
constant, females have a greater probability of being in one of the higher PD2 Likert scales
than males. Participants who currently do not make a transfer were less likely to choose one
of the higher PD2 Likert scales.
Table 3. Significant Total Effects among variables
Self-
Efficac
y
Frequ
ency
Gende
r
Transfe
r
PC4 PC5 Perceived
difficulty
Confiden
ce
Intentio
n
Perceived
difficulty
0.62 0.00 0.00 0.00 0.00 0.00 0.00 0.00 0.00
Confidence 0.57 0.00 0.00 0.00 0.00 0.00 0.00 0.00 0.00
Intention 0.42 0.50 NS 0.40 0.21 -0.15 0.00 0.00 0.00
Inten2 0.42 0.50 NS 0.40 0.21 -0.15 0.00 0.00 1.00
Inten1 0.31 0.37 NS 0.29 0.15 -0.11 0.00 0.00 0.73
PD2 0.62 0.00 0.00 0.00 0.00 0.00 1.00 0.00 0.00
PD1 0.47 0.00 0.00 0.00 0.00 0.00 0.75 0.00 0.00
CON2 0.57 0.00 0.00 0.00 0.00 0.00 0.00 1.00 0.00
Decision
PC5
Intention
z1
Inten1 Inten2
e8 e9
0.287***
0.623***
0.565***
Self-Efficacy0.422***
Gender
Frequent Transfer PC4
-0.149**
0.208**0.399**
-0.266**
0.504***
e4
e5
CON1
CON2
PD1
PD2
e6
e7
Perceived
Difficulty
z3
1.0
0.754***
Confidence
z4
0.853***
1.0
1.00.726***
0.30
*p≤ 0.05, **p≤ 0.01, ***p≤ 0.001
International Journal of Transportation
Vol.1, No.1 (2013)
14 Copyright ⓒ 2013 SERSC
CON1 0.42 0.00 0.00 0.00 0.00 0.00 0.00 0.85 0.00
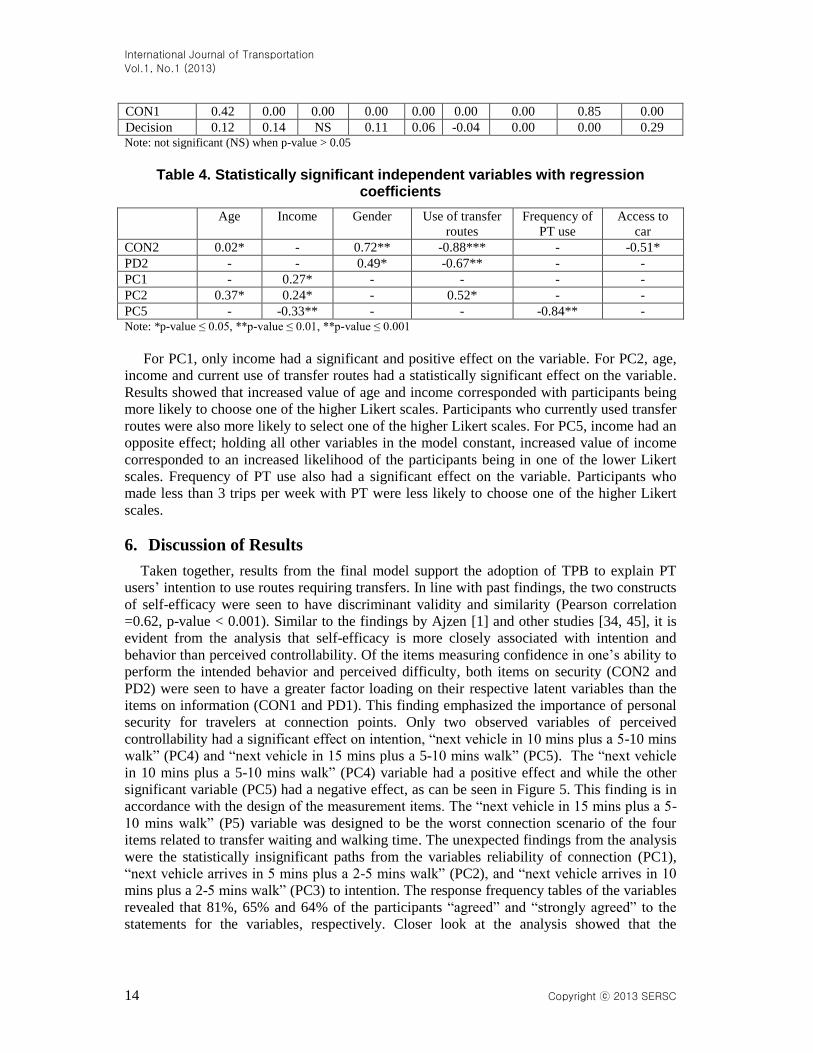
Decision 0.12 0.14 NS 0.11 0.06 -0.04 0.00 0.00 0.29 Note: not significant (NS) when p-value > 0.05
Table 4. Statistically significant independent variables with regression coefficients
Age Income Gender Use of transfer
routes
Frequency of
PT use
Access to
car
CON2 0.02* - 0.72** -0.88*** - -0.51*
PD2 - - 0.49* -0.67** - -
PC1 - 0.27* - - - -
PC2 0.37* 0.24* - 0.52* - -
PC5 - -0.33** - - -0.84** - Note: *p-value ≤ 0.05, **p-value ≤ 0.01, **p-value ≤ 0.001
For PC1, only income had a significant and positive effect on the variable. For PC2, age,
income and current use of transfer routes had a statistically significant effect on the variable.
Results showed that increased value of age and income corresponded with participants being
more likely to choose one of the higher Likert scales. Participants who currently used transfer
routes were also more likely to select one of the higher Likert scales. For PC5, income had an
opposite effect; holding all other variables in the model constant, increased value of income
corresponded to an increased likelihood of the participants being in one of the lower Likert
scales. Frequency of PT use also had a significant effect on the variable. Participants who
made less than 3 trips per week with PT were less likely to choose one of the higher Likert
scales.
6. Discussion of Results
Taken together, results from the final model support the adoption of TPB to explain PT
users’ intention to use routes requiring transfers. In line with past findings, the two constructs
of self-efficacy were seen to have discriminant validity and similarity (Pearson correlation
=0.62, p-value < 0.001). Similar to the findings by Ajzen [1] and other studies [34, 45], it is
evident from the analysis that self-efficacy is more closely associated with intention and
behavior than perceived controllability. Of the items measuring confidence in one’s ability to
perform the intended behavior and perceived difficulty, both items on security (CON2 and
PD2) were seen to have a greater factor loading on their respective latent variables than the
items on information (CON1 and PD1). This finding emphasized the importance of personal
security for travelers at connection points. Only two observed variables of perceived
controllability had a significant effect on intention, “next vehicle in 10 mins plus a 5-10 mins
walk” (PC4) and “next vehicle in 15 mins plus a 5-10 mins walk” (PC5). The “next vehicle
in 10 mins plus a 5-10 mins walk” (PC4) variable had a positive effect and while the other
significant variable (PC5) had a negative effect, as can be seen in Figure 5. This finding is in
accordance with the design of the measurement items. The “next vehicle in 15 mins plus a 5-
10 mins walk” (P5) variable was designed to be the worst connection scenario of the four
items related to transfer waiting and walking time. The unexpected findings from the analysis
were the statistically insignificant paths from the variables reliability of connection (PC1),
“next vehicle arrives in 5 mins plus a 2-5 mins walk” (PC2), and “next vehicle arrives in 10
mins plus a 2-5 mins walk” (PC3) to intention. The response frequency tables of the variables
revealed that 81%, 65% and 64% of the participants “agreed” and “strongly agreed” to the
statements for the variables, respectively. Closer look at the analysis showed that the

International Journal of Transportation
Vol.1, No.1 (2013)
Copyright ⓒ 2013 SERSC 15
responses for the variable “next vehicle arrives in 10 mins plus a 2-5 mins walk” (PC3) did
not correspond with the responses for the two intention measurement items; thus the path
from PC3 to intention was statistically insignificant. As for the variables reliability of
connection (PC1) and “next vehicle arrives in 5 mins plus a 2-5 mins walk” (PC2), the answer
lies in the high correlation with self-efficacy. The statistically significant Pearson correlations
are 0.70 and 0.35, respectively. The structural paths from the variables reliability of
connection (PC1) and “next vehicle arrives in 5 mins plus a 2-5 mins walk” (PC2) would
become statistically significant if the self-efficacy latent variable was removed from the
model. Taken together, the results seem to support Hypothesis 1: The stronger is PT users’
perceived controllability and self-efficacy, the greater will be their intention to use transfer
routes. The significant positive coefficient (0.29) for the path from intention to decision
supports Hypothesis 2.
Contrary to Hypothesis 3, it was found that socio-demographics and trip characteristics
have direct effects on intention. Only gender, frequency of PT use and current use of transfer
routes had significant effects on intention. The positive effect of frequency and current use of
transfers on intention indicates that positive control beliefs are related to regular use of PT.
Such finding is consistent with past studies which have shown that the transfer penalties given
by infrequent PT users tends to be higher than those given by regular users [7, 24]. Regular
PT users tend to be more familiar with the system and therefore are less likely to face
uncertainties when transferring [7]. Male participants were seen to be less willing to use
transfer routes than female participants. A probable reason for the gender effect is the
different travel patterns between men and women, due to household responsibilities, child
care and employment status. For example, a study by Nobis and Lenz [66] discussed that
women tend to chain their trips more often than men. Also, women living in a household with
children were seen to use more PT than men.
The ordinal regression models revealed some effects of socio-demographics and trip
characteristics on the measurement items, representing the control beliefs, for self-efficacy
and perceived controllability. The effect of gender and current use of transfer routes on PD2
and CON2 were positive and negative, respectively. This finding suggests that good security
at connection points will have a greater positive impact on female PT users to make transfers.
As for the negative effect from current use of transfer routes, a probable reason is that PT
users are not satisfied with the current safety and security provisions at the connection points.
For the controllability variables, income had a consistent significant effect. The effect of
income on the variables reliability of connection and “next vehicle arrives in 5 mins plus a 2-
5 mins walk” were positive and negative for the variable “next vehicle in 15 mins plus a 5-10
mins walk”. Such findings are in line with the design of the measurement items. Higher
income PT users generally hold a greater value for travel time [67].
7. Conclusion
This paper provides the development of a psychological model which explains the
relationship between public transport (PT) users’ perceived barriers of making transfers and
their resulting willingness to use routes with transfers. The theory of planned behavior (TPB)
was adopted and the data was analyzed using structural equation modeling. Overall, the
analysis demonstrated that the TPB is capable of modeling PT users’ intention to use routes
with transfers. PT users’ perception of trip attributes such as personal safety, information,
reliability of connection, transfer waiting time and transfer walking time were shown to be
appropriate measures to represent control beliefs of perceived behavioral control. Results
showed that high quality trip attributes, related to transfers, create positive self-efficacy and
perceived controllability which increases PT users’ intention to use routes with transfers.

International Journal of Transportation
Vol.1, No.1 (2013)
16 Copyright ⓒ 2013 SERSC
Personal security was seen to have a greater influence on PT users’ confidence and perceived
difficulty than high quality information. As for transfer waiting and walking time, PT users’
preferred the transfer time to be within 10 minutes. Travel patterns related to gender,
frequency of PT use and current use of transfer routes were also seen to have an effect on
intention.
Findings of the study have two main implications. Firstly, that the TPB is a suitable model
to investigate the psychological factors involved in travelers’ intention to use PT transfer
routes. Secondly, that PT users need to feel capable (strong control beliefs) of making the
transfers. Travelers’ perceived benefits of using the transfer routes have to be greater than
their perceived difficulty of making the connections. Therefore, authorities need to focus on
developing attractive transfer routes (e.g., reduced total travel time savings) with comfortable
transfers, from a user perspective, to encourage ridership of PT.
References
[1] I. Ajzen, "Perceived behavioral control, self-efficacy, locus of control, and the theory of planned behavior",
Journal of Applied Social Psychology, vol. 32, no. 4, (2002), pp. 665-683.
[2] D. A. Hensher and A. J. Reyes, "Trip chaining as a barrier to the propensity to use public transport",
Transportation, vol. 27, no. 4, (2000), pp. 341-361.
[3] X. Ye, R. M. Pendyala and G. Gottardi, "An exploration of the relationship between mode choice and
complexity of trip chaining patterns", Transportation Research Part B, vol. 41, (2007), pp. 96-113.
[4] Z. Guo and N. H. M. Wilson, "Assessment of the Transfer Penalty for Transit Trip", Transportation Research
Record No. 1872, (2004), pp. 10-18.
[5] A. Ceder, "Public Transit Planning and Operation: Theory, Modelling and Practice", Elsevier, Oxford, UK,
(2007).
[6] H. Iseki and B. D. Taylor, "Not All Transfers Are Created Equal: Towards a Framework Relating Transfer
Connectivity to Travel Behaviour", Transport Reviews, vol. 29, no. 6, (2009), pp. 777-800.
[7] Z. Guo and N. H. M. Wilson, "Modeling the Effect of Transit System Transfer on Travel Behaviour",
Transportation Research Record No. 2006, (2007), pp. 11-20.
[8] A. Ceder, L. -A. Yann and C. Coriat, "Measuring Public Transport Connectivity Performance Applied in
Auckland", Transport Research Record No. 2111, (2009), pp. 139-147.
[9] S. V. Walle and T. Steenberghen, "Space and time related determinants of public transport use in trip chains",
Transportation Research Part A, vol. 40, (2006), pp. 151-162.
[10] G. Beirao and J. A. Sarsfield-Cabral, "Understanding attitudes towards public transport and private car: A
qualitative study", Transport Policy, vol. 14, no. 6, (2007), pp. 478-489.
[11] G. Carrus, P. Passafaro and M. Bonnes, "Emotions, habits and rational choices in ecological behaviours: The
case of recycling and use of public transportation", Journal of Environmental Psychology, vol. 28, no. 1,
(2008), pp. 51-62.
[12] B. Long, K. Choocharukul and T. Nakatsuji, "Psychological Factors Influencing Behavioral Intention Toward
Future Sky Train Usage in Phnom Penh, Cambodia", Transportation Research Record No. 2217, (2011), pp.
63-70.
[13] Y. Healh and R. Gifford, "Extending the Theory of Planned Behaviour: Predicting the Use of Public
Transportation", Journal of Applied Social Psychology, vol. 32, no. 10, (2002), pp. 2154-2189.
[14] S. Bamberg and P. Schmidt, "Theory-Driven Subgroup-Specific Evaluation of an Intervention to Reduce
Private Car Use", Journal of Applied Social Psychology, vol. 31, no. 6, (2001), pp. 1300-1329.
[15] R. Liu, R. M. Pendyala and S. Polzin, "Assessment of Intermodal Transfer Penalties Using Stated Preference
Data", Transportation Research Record No.1607, (1997), pp. 74-80.
[16] L. Callaghan and W. Vincent, "Preliminary Evaluation of Metro Orange Line Bus Rapid Transit Project",
Transportation Research Record 2034, (2007), pp. 37-44.
[17] T. Muller and P. Furth, "Transfer Scheduling and Control to Reduce Passenger Waiting Time", Transport
Research Record No. 2112, (2009), pp. 111-118.
[18] Y. Hadas and P. Ranjitkar, "Modeling public-transit connectivity with spatial quality-of-transfer
measurements", Journal of Transport Geography, vol. 22, (2012), pp. 137-147.
[19] P. Kumar, S. Y. Kulkarni and M. Parida, "Security perceptions of Delhi commuters at Metro-bus interchange
in multi modal perspective", Journal of Transport Security, vol. 4, (2011), pp. 295-307.

International Journal of Transportation
Vol.1, No.1 (2013)
Copyright ⓒ 2013 SERSC 17
[20] E. Molin and C. Chorus, "The Need for Advanced Public Transport Information Services When Making
Transfers", European Journal of Transport and Infrastructure Research (EJTIR), vol. 4, no. 9, (2009), pp. 397-
410.
[21] L. Eboli and G. Mazzulla, "Performance indicators for an objective measure of public transport service
quality", European Transport, vol. 51, (2012), pp. 1-21.
[22] H. Iseki and M. J. Smart, "How Do People Perceive Service Attributes at Transit Facilities? An Examination
of Perceptions of Transit Service by Transit User Demographics and Trip Characteristics", Proceedings of
90th Transportation Research Board Annual Meeting, (2011), Washington D.C., USA.
[23] S. T. Atkins, "Personal security as a transport issue: a state-of-the-art review", Transportation Reviews, vol.
10, no. 2, (1990), pp. 111-125.
[24] S. Blainey, A. Hickford and J. Preston, "Barriers to passenger rail use: a review of the evidence", Transport
Reviews, vol. 32, no. 6, (2012), pp. 675-696.
[25] Y. -H. Cheng, "Exploring passenger anxiety associated with train travel", Transportation, vol. 37, no. 6,
(2010), pp. 875-896.
[26] Y. Hadas and A. Ceder, "Public Transit Network Connectivity", Transportation Research Record No. 2143,
(2010), pp. 1-8.
[27] Z. Guo and N. H. M. Wilson, "Assessing the cost of transfer inconvenience in public transport systems: A
case study of the London Underground", Transporation Research Part A: Policy and Practice, vol. 45, no. 2,
(2011), pp. 91-104.
[28] S. Bachok, "What do passengers need out of public transport information systems?", Proceedings of 29th
Conference of Australian Institute of Transport Research, (2007), 5th-7th December 2007, Adelaide,
Australia.
[29] J. W. Grotenhuis, B. W. Wiegmans and P. Rietveld, "The desired quality of integrated mulitmodal travel
information in public transport: Customer needs for time and effort savings", Transport Policy, vol. 14,
(2007), pp. 27-38.
[30] S. Bamberg, M. Hunecke and A. Blobaum, "Social context, personal norms and the use of public
transportation: Two field studies", Journal of Environmental Psychology, vol. 27, no. 3, (2007), pp. 190-203
[31] Y. Heath and R. Gifford, "Extending the Theory of Planned Behaviour: Predicting the Use of Public
Transportation", Journal of Applied Social Psychology, vol. 32, no. 10, (2002), pp. 2154-2189.
[32] C. Chen and W. Chao, "Habitual or reasoned? Using the theory of planned behavior, technology accpetance
model, and habit to examine switching intentions towards public transit", Transportation Research Part F, vol.
14, no. 2, (2011), pp. 128-137.
[33] J. Anable, "'Complacent Car Addicts' or 'Aspiring Environmentalists'? Identifying travel behaviour segments
using attitude theory", Transport Policy, vol. 12, no. 1, (2005), pp. 65-78.
[34] C. J. Armitage, "The theory of planned behaviour: Assessment of predictive validity and 'perceived control'",
British Journal of Social Psychology, vol. 38, (1999), pp. 35-54.
[35] I. Ajzen, "Attitudes, Personality and Behaviour", McGraw-Hill, New York, USA, (2005).
[36] P. Kraft, J. Rise, S. Sutton and E. Roysamb, "Perceived difficulty in the theory of planned behaviour:
Perceived behavioural control or affective attitude?", The British Psychological Society, vol. 44, (2005), pp.
479-496.
[37] I. Ajzen, "The Theory of Planned Behavior", Organizational Behavior and Human Decision Processes, vol.
50, (1991), pp. 179-211.
[38] D. J. Terry and J. E. O'Leary, "The theory of planned behaviour: The effects of perceived behavioural control
and self-efficacy", British Journal of Social Psychology, vol. 34, (1995), pp. 199-220.
[39] M. H. Hsu and C. M. Chiu, "Predicting electronic service continuance with a decomposed theory of planned
behaviour", Behaviour & Information Technology, vol. 23, no. 5, (2004), pp. 359-373.
[40] B. Verplanken, H. Aarts, A. Van Knipperberg and A. Moonen, "Habit versus planned behaviour: A field
experiment", British Journal of Social Psychology, vol. 37, (1998), pp. 111-128.
[41] S. Bamberg, I. Ajzen and P. Schmidt, "Choice of travel mode in the theory of planned behavior: The roles of
past behavior, habit and reasoned action", Basic and Applied Social Psychology, vol. 25, no. 1, (2003), pp.
175-187.
[42] S. Bamberg, D. Rolle and C. Weber, "Does habitual car use not lead to more resistance to change of travel
mode?", Transportation, vol. 30, no. 1, (2003), pp. 97-108.
[43] G. Currie, "The Demand Performance of Bus Rapid Transit", Journal of Public Transportation, vol. 8, no. 1,
(2005), pp. 41-55.
[44] D. Trafimow, P. Sheeran, M. Conner and K. A. Finlay, "Evidence that perceived behavioural control is a
multidimensional construct: Perceived control and perceived difficulty", British Journal of Social Psychology,
vol. 1, (2002), pp. 101-121.

International Journal of Transportation
Vol.1, No.1 (2013)
18 Copyright ⓒ 2013 SERSC
[45] C. J. Armitage and M. Conner, "Efficacy of the Theory of Planned Behaviour: A meta-analytic review",
British Journal of Social Psychology, vol. 40, no. 4, (2001), pp. 471-499.
[46] M. A.Elliot and J. A. Thomson, "The social cognitive determinants of offending drivers' speeding behaviour",
Accident Analysis and Prevention, vol. 42, (2010), pp. 1595-1605.
[47] K. Okamura, G. Fujita, M. Kihira, R. Kosuge and T. Mitsui, "Predicting motivational determinants of seatbelt
non-use in the front seat: A field study", Transportation Research Part F, vol. 15, no. 5, (2012), pp. 502-513.
[48] S. Farag and G. Lyons, "To use or not to use? An empirical study of pre-trip public transport information for
business and leisure trips and comparison with car travel", Transport Policy, vol. 20, (2012), pp. 82-92.
[49] M. L. Outwater, V. Modugula, S. Castleberry and P. Bhatia, "Market Segmentation Approach to Mode
Choice and Ferry Ridership Forecasting", Transportation Research Record, no. 1872, (2004), pp. 71-79.
[50] M. Yang, W. Wang, G. Ren, F. Rui, B. Qi and X. Chen, "Structural equation model to analyze
sociodemographics, activity participation, and trip chaining between household heads: survey of Shangyu,
China", Transportation Research Record, no. 2157, (2010), pp. 38-45.
[51] Y. Shiftan, M. L. Outwater and Y. Zhou, "Transit market research using structural equation modeling and
attitudinal market segmentation", Transport Policy, vol. 15, (2008), pp. 186-195.
[52] T. F. Golob, "Structural equation modeling for travel behavior research", Transportation Research Part B, vol.
37, no. 1, (2003), pp. 1-25.
[53] M. T. Islam and K. M. N. Habib, "Unraveling the relationship between trip chaining and mode choice:
evidence from a multi-week travel diary", Transporation Planning and Technology, vol. 35, no. 4, (2012), pp.
409-426.
[54] M. L. Outwater, S. Castleberry, Y. Shiftan, M. B. Akiva, Y. S. Zhou and A. Kuppam, "Attitudinal Market-
Segmentation Approach to Mode Choice and Ridership Forecasting", Transportation Research Board, no.
1854, (2003), pp. 32-42.
[55] G. A. Marcoulides, "A First Course in Structural Equation Modeling", Lawrence Erlbaum Associates, Inc.,
Publishers, New Jersey, USA, (2006).
[56] A. Diamantopoulos and J. A. Siguaw, "Formative Versus Reflective Indicators in Organizational Measure
Development: A Comparison and Empirical Illustration", British Journal of Management, vol. 17, (2006), pp.
263-282.
[57] D. Hooper, J. Coughlan and M. R. Mullen, "Structural Equation Modelling: Guidelines for Determining
Model Fit", Electronic Journal of Business Research Methods, vol. 6, no. 1, (2008), pp. 53-60.
[58] K. Dziekan and A. Vermeulen, "Psychological effects of and design preferences for real-time information
displays", Journal of Public Transportation, vol. 1, (2006), pp. 71-89.
[59] W. D. Crano and M. B. Brewer, "Principles and Methods of Social Research", Lawrence Erlbaum Associates,
Inc., Mahwah, New Jersery, (2002).
[60] R. A. Singleton Jr and B. C. Straits, "Approaches to Social Research", Oxford University Press, Inc., New
York, USA, (2005).
[61] B. Gatersleben and D. Uzzell, "Affective Appraisals of the Daily Commute", Environment and Behaviour, vol.
39, no. 3, (2007), pp. 416-431.
[62] Auckland Transport, "Newmarket Station Judged One of NZ's Best", (2011), [cited 2012 August 12],
Available from: http://www.aucklandtransport.govt.nz/aboutus/News/LatestNews/-Pages/newmarket-station-
best-design.aspx.
[63] M. M. McCord, J. Wirtz and R. G. Mishalani, "Passenger waiting time perceptions at bus stops", Journal of
Public Transportation, vol. 9, no. 2, (2006), pp. 89-106.
[64] I. Ajzen, "Construction of a standard questionnaire for the theory of planned behavior", (2002a), [cited 2012
August 3], Available from: http://www-unix.oit.umass.edu/~aizen.
[65] M. H. Ibtissem, "Application of Value Beliefs Norms Theory to the Energy Conservation Behaviour", Journal
of Sustainable Development, vol. 3, no. 2, (2010), pp. 129-139.
[66] C. Nobis and B. Lenz, "Gender differences in travel patterns: role of employment status and household
structure", Research on Women's Issues in Transportation Research Board, vol. 2, (2005), pp. 114-123.
[67] R. B. Noland and J. W. Polak, "Travel time variability: a review of theoretical and empirical issues",
Transport Reviews, vol. 2002, no. 1, (2002), pp. 39-54.

International Journal of Transportation
Vol.1, No.1 (2013)
Copyright ⓒ 2013 SERSC 19
Authors
Avishai (Avi) Ceder
Avishai (Avi) Ceder ([email protected]) is Professor and Chair
in Transportation in the Department of Civil and Environmental
Engineering at the University of Auckland (UoA), and Director of the
Transportation Research Centre (TRC) at UoA. He was Head of the
Transportation Engineering and Geo-Information Department at the
Technion and a Visiting Professor at the Massachusetts Institute of
Technology, the University of California at Berkeley, and others. In
2007, he published the book Public Transit Planning and Operation:
Theory, Modeling and Practice (Elsevier, Oxford, UK); this book was
translated to Chinese by the Tsinghua publishing house, Beijing, China,
June 2010 with its 2nd Edition to appear in early 2014.
Subeh Chowdhury
Subeh Chowdhury graduated with a Bachelor of Engineering (Civil
and Environmental) from the University of Auckland. She is currently a
doctoral student at the University of Auckland. She has published in
Transport Policy, Journal of Public Transportation and Psychology and
Behavioral Sciences.

International Journal of Transportation
Vol.1, No.1 (2013)
20 Copyright ⓒ 2013 SERSC