a public expenditure review for paraguay - world...
TRANSCRIPT

RESTRICTED
Report No. 78194-PY
A Public Expenditure Review for Paraguay
The quest for optimal tax and expenditure policies for
shared prosperity
November 25, 2013
Argentina, Paraguay and Uruguay Country Management Unit
Poverty Reduction and Economic Management
Latin America and the Caribbean Region
Document of the World Bank
Pub
lic D
iscl
osur
e A
utho
rized
Pub
lic D
iscl
osur
e A
utho
rized
Pub
lic D
iscl
osur
e A
utho
rized
Pub
lic D
iscl
osur
e A
utho
rized
CURRENCY AND EXCHANGE RATE
(As of November 25, 2013)
CURRENCY UNIT = GUARANIES
US$1.00 = Gs.4,423
FISCAL YEAR
January 1 – December 31
ABBREVIATIONS AND ACRONYMS
BCP Central Bank of Paraguay
(Banco Central de Paraguay)
LAC Latin America and the
Caribbean
BOOST Public Expenditure Database MDG Millenium Development Goal
CCT Conditional cash transfer MERCOSUR Southern Common Market
(Mercado Común del Sur)
CEPAL National Commission for Latin
America (Comisión Nacional
para América Latina
MICs Middle Income Countries
CGE Computable General
Equilibrium
PER Public Expenditure Review
CIT Corporate Income Tax PISA Program for International
Student Assessment
DEA Data Envelopment Analysis PPP Purchasing Power Parity
DGEEC National Institute of Statistics
(Dirección Nacional de
Encuestas Estadísticas y
Censos)
SET Department of Tax Revenue
Collection (Secretaria de
Estado de Tributación)
DINAC National Directorate of Civil
Aeronautics (Dirección
Nacional de Aeronáutica civil)
SITUFIN Public Financial Report
(Informe de la Situación
Financiera del país)
DPT Diphteria, Pertusis and Tetanus SNEPE National Evaluation System
of Educational Process
(Sistema Nacional de
Evaluación del Proceso
Educativo)
EPH National Household Survey
(Encuesta Permanente de
Hogares)
SOE State Owned Enterprise
FDI
Foreign Direct Investment TB Tuberculosis
GDP Gross Domestic Product UNESCO United Nations Educational,
Scientific and Cultural
Organization
GFS Goverment Finance Statistics USAID United State Agency for
International Development
HOI Human Opportunity Index VAT Value Added Tax
IMAGRO Agricultural Income Tax
(Impuesto a las Actividades
Agropecuarias)
WDI World Development
Indicators
IMF International Monetary Fund WHO World Health Organization
IRACIS Corporate Income Tax on
Commerce, Industry and
Services (Impuesto a la Renta
Comercial, Industrial o de
Servicios)
Vice President: Hasan A. Tuluy
Country Director: Penelope J. Brook
Sector Director: Rodrigo A. Chaves
Sector Manager: Auguste Tano Kouame
Sector Manager: Zafer Mustafaoglu
Task Team Leaders: Friederike (Fritzi) Koehler-Geib /
Jasmin Chakeri

iv
Table of Contents Acknowledgements ...................................................................................................................................... ix
Executive Summary ...................................................................................................................................... x
Chapter 1: Introduction: challenges and context .................................................................................... 1
1.1. The economic turnaround ................................................................................................................ 1
1.2. The economic stabilization program ................................................................................................ 4
1.3. The development dividend of stabilization ...................................................................................... 6
1.4. Challenge 1: Volatile macroeconomic environment ........................................................................ 7
1.5. Challenge 2: Limited fiscal resources that constrain spending on human development and growth-
enhancing policies ..................................................................................................................................... 8
1.6. Challenge 3: High levels of poverty and inequality remain ............................................................. 9
1.7. Transparency and data availability .................................................................................................. 9
1.8. Objective, methodology, and the value added of this PER ............................................................ 10
Chapter 2: Public Finances in a commodity driven economy .............................................................. 12
2.1 Fiscal consolidation with limited fiscal resources—the genesis of the current revenue structure . 12
2.2 The link between fiscal policy and macroeconomic volatility ....................................................... 21
2.3 Expenditures .................................................................................................................................. 26
2.4 Policy options ................................................................................................................................ 31
Chapter 3: Fiscal policy, poverty reduction and shared prosperity....................................................... 34
3.1 Fiscal policy and income redistribution ......................................................................................... 34
3.2 Fiscal policy and equity of opportunity ......................................................................................... 41
3.3 How progressive is Paraguay’s fiscal system with regard to the distribution of income and
opportunities? .......................................................................................................................................... 45
3.4 Policy options ................................................................................................................................ 49
Chapter 4: Efficiency of Public Spending and Service Delivery .......................................................... 51
4.1 The efficiency of public spending in Paraguay in international comparison ................................. 51
4.2 Within-country differences in the efficiency of public spending ................................................... 55
4.3 Case study: expenditure efficiency in State-Owned Enterprises (SOEs) ....................................... 61
4.4 Policy options ................................................................................................................................. 62
List of references ......................................................................................................................................... 63
v
Annexes ...................................................................................................................................................... 67
Annex 1.1. Volatility over time, international comparison ................................................................. 67
Annex 1.2. Volatility breaks of macro-economic variables in Paraguay ............................................. 68
Annex 1.3. Social development indicators ........................................................................................... 69
Annex 1.4. Poverty, Extreme Poverty, Inequality in Latin America and the Caribbean ...................... 70
Annex 4.1: Data envelopment analysis (DEA) .................................................................................... 71
Map ....................................................................................................................................................... 73

vi
List of Figures-Chapter 1
Figure 1.1: Real GDP and real GDP per capita .............................................................................. 2
Figure 1.2: Aggregate demand decomposition of growth (percent annual contribution) ............... 3
Figure 1.3: Sectoral decomposition of growth (percent annual contribution) ................................ 3
Figure 1.4: Revenues and expenditures .......................................................................................... 5
Figure 1.5: Fiscal balance ............................................................................................................... 5
Figure 1.6: Public debt .................................................................................................................... 6
Figure 1.7: Inflation ........................................................................................................................ 6
Figure 1.8: Public and private investment ...................................................................................... 6
Figure 1.9: Net capital inflows........................................................................................................ 6
Figure 1.10: Tax-to-GDP ratio 2011 ............................................................................................... 8
Figure 1.11: Social Expenditure ..................................................................................................... 8
List of Figures-Chapter 2
Figure 2.1: Revenues and expenditures (percent of GDP) .......................................................................... 13
Figure 2.2: Government revenues, average 2007- 2011 (percent of GDP) ................................................. 13
Figure 2.3: Share of agricultural tax revenue in internal tax revenues versus sectoral share in GDP ........ 14
Figure 2.4: Total internal tax revenue: Number of contributors versus average contribution by taxpayer 17
Figure 2.5: VAT: Number of contributors versus average contribution by taxpayer ................................. 17
Figure 2.6: IMAGRO: Number of contributors versus average contribution by tax payer ........................ 18
Figure 2.7: Corporate income tax: Number of contributors versus average contribution by tax payer ...... 18
Figure 2.8: Marginal rate on VAT tax ........................................................................................................ 18
Figure 2.9: Revenues from VAT over GDP, average 2007-2011 ............................................................... 18
Figure 2.10: Marginal rate on corporate income tax ................................................................................... 19
Figure 2.11: Revenues from corporate income tax over GDP, average 2007-2011 ................................... 19
Figure 2.12: Marginal tax on personal income tax ..................................................................................... 19
Figure 2.13: Revenues from personal income tax over GDP, average 2007-2011 ..................................... 19
Figure 2.14: VAT productivity, average 2007-2011 ................................................................................... 20
Figure 2.15: Corporate income tax productivity, average 2007-2011 ........................................................ 20
Figure 2.17: Business cycle fluctuations in Paraguay—Public consumption versus GDP ......................... 22
Figure 2.18: Business cycle fluctuations in Paraguay—Public investment versus GDP ............................ 22
Figure 2.19: Contribution of public and private demand components to real GDP growth ...................... 23
Figure 2.20: Public consumption and investment (quarterly y-o-y growth) ............................................... 24
Figure 2.21: Exports by product ................................................................................................................. 24
Figure 2.22: Fiscal Space ........................................................................................................................... 27
Figure 2.23: Public Expenditure in international comparison (average 2007-2011) .................................. 27
Figure 2.24: Paraguay’s public debt over time ........................................................................................... 27
Figure 2.25: Interest expenditure in Latin America .................................................................................... 27
Figure 2.26: Functional classification ......................................................................................................... 29
Figure 2.27: Education expenditure in international comparison (average 2007-2011) ............................. 29
Figure 2.28: Health expenditure in international comparison ..................................................................... 29
Figure 2.29: Economic classification .......................................................................................................... 30
Figure 2.30: Compensation of employees in international comparison (average 2007-2011) ................... 30
vii
Figure 2 31: Current versus capital expenditure in international comparison (average 2007-2011) .......... 30
List of Figures-Chapter 3
Figure 3.1: Public expenditure on health and education (% of total public expenditure) ............ 35
Figure 3.2: Public social spending in Paraguay and comparator countries (2009-11; % of GDP)35
Figure 3.3: Gini coefficient for each income concept in Argentina, Bolivia, Brazil, Guatemala,
Mexico, Paraguay, Peru and Uruguay .......................................................................................... 36
Figure 3.4: Inequality in Paraguay (2010) – benchmark vs. sensitivity analysis ......................... 37
Figure 3.5: Percent of direct transfer beneficiaries who are poor in Argentina, Bolivia, Brazil,
Guatemala, Mexico, Paraguay, Peru and Uruguay ....................................................................... 39
Figure 3.6: Percent of poor receiving at least one direct transfer ................................................. 39
Figure 3.7: HOI for Latin American Countries (proj. 2010) ........................................................ 42
Figure 3.8: Change in the HOI and coverage ............................................................................... 43
Figure 3.9: Coverage and HOI in Paraguay (2010) ...................................................................... 44
Figure 3.10:Concentration shares of taxes in Paraguay (2010) .................................................... 46
Figure 3.11: Concentration coefficients of public expenditure categories in Paraguay (2010) .... 47
Figure 3.12: Incidence of public education expenditure ............................................................... 48
Figure 3.13: Incidence of public health expenditure .................................................................... 49
List of Figures-Chapter 4
Figure 4. 1: Public expenditure on education vs. net primary enrolment rate .............................. 52
Figure 4.2: Public expenditure on education vs. secondary graduation rate ................................ 53
Figure 4.3: Health expenditure and maternal mortality rate ......................................................... 54
Figure 4.4: Public expenditure on education vs. selected education outcomes, by department ... 56
Figure 4.5: Public expenditure on health vs. selected health outcomes, by department ............... 59
List of Tables-Chapter 1
Table 1.1: Poverty and equity indicators ........................................................................................ 3
List of Tables-Chapter 2
Table 2.1: Government tax versus non-tax revenue (percent of GDP)......................................... 14
Table 2.2: Sectoral weights in gross value added ......................................................................... 14
Table 2.3: Sectoral contribution to total internal tax revenue ....................................................... 15
Table 2.4: Revenue by tax type..................................................................................................... 15
Table 2.5: Government tax revenue by tax type (percent of total unless stated otherwise) ......... 16
Table 2.6: Marginal tax rates over time ........................................................................................ 16
Table 2.7: Volatility of revenues and expenditures ..................................................................... 21
Table 2.8: Export by destination ................................................................................................... 24
Table 2.9: Volatility of different tax types (annual real growth) ................................................. 26
List of Tables-Chapter 3
Table 3.1: Taxes, transfers, inequality and poverty in Paraguay (2010) - benchmark ................. 37
viii
List of Tables-Chapter 4
Table 4.1: Characteristics of the SOE Sector in Paraguay............................................................ 62

ix
Acknowledgements
This report was prepared by a team led by Friederike (Fritzi) Koehler-Geib and Jasmin Chakeri (LCSPE)
under the overall supervision and guidance of Zafer Mustafaoglu (Lead Economist and Sector Leader,
LCSPR), Auguste T. Kouame (Sector Manager, LCSPE), Rodrigo A. Chaves (Sector Director, LCSPR)
and Penelope J. Brook (Country Director, LCC7C). The peer reviewers were David Rosenblatt
(Economic Advisor, DECOS), Dominique Van De Walle (Lead Economist, DECHD), Eduardo Ley
(Lead Economist, PRMED), Gallina Vincelette (Senior Economist, ECSP1), and Jose Molinas (Country
Sector Coordinator, ECSH4).
The core team included Carolina Diaz-Bonilla (LCSPP), Rossana Polastri (previous Country Manager,
LCCPY), Dante Mossi (Country Manager, LCCPY), (Eduardo Andres Estrada, Renato Busquets
(WBIOG), Elida Caballero Cabrera, Guillermo Cabral, Jorge Araujo, Miriam Beatriz Villarroel, Patricia
Chacon Holt, Patrick Rittenauer, Peter Siegenthaler, and Silvia Gulino (all LCSPE), Gloria Dure, Rosa
Arestivo de Cuentas Zavala, Telma Alvarenga Capurro (all LCCPY). Inputs and background papers were
also received from Edgardo Favaro, Julio Ramirez, Lisa Stewart, Martin Cicowiez, Nora Lustig, Osvaldo
Schenone, Sean Higgins, William Swanson (all consultants), Jose Antonio Cuesta and Pablo Suarez
Becerra (PRMPR), Eriko Togo (PRMED), Antonio Velandia-Rubiano (FABDM), Ana Mie Horigoshi
Rei, Fanny Weiner (all LCSPS), Luis Orlando Perez (LCSHH), Rafael de Hoyos (LCSHE), Juan Martin
Moreno (LCSHS), Agustin Indaco, Andres Lajer Baron, Carolina Saizar, Hannah Nielsen, Nathalie
Picarelli, Pia Maria Zanetti, Sona Varma (all LCSPE), Marijn Verhoeven (PRMPS), and Massimo
Mastruzzi (WBIOG).
Comments and inputs were also received from many colleagues working in the Paraguay country team,
including Alexandre Arrobbio, Raul Junquera (all LCSPS), Andrew Follmer, Carla Cutolo, Elena Feeney,
Mariela Alvarez, Tatiana Proskuryakova, Sabine Hader (all LCC7C), Richard Ferreira Candia, Ruth
Gonzalez Llamas (LCREA), and Graciela Sanchez Martinez (LCSSO).
The team is thankful for the excellent collaboration with the Ministry of Finance, in particular with the
Vice Ministry of the Economy including the Departments of Economic Studies, Macro Fiscal Policies,
Debt Policy, and Financial-Economic Information Systems, and the Ministries of Health, Education, and
Public Works.

x
Executive Summary
Paraguay has achieved significant progress in terms of fiscal policy over the past decade.
Fiscal consolidation was at the core of the economic stabilization program that contributed to the
economic turnaround beginning in 2003. It included an increase in tax revenues through the
implementation—albeit partial—of a tax reform package, as well as significant rationalization of
expenditures. Tax revenues increased from 8.7 percent of GDP in 2003 to 12.3 percent in 2012.
The overall fiscal surplus averaged 1 percent of GDP between 2004 and 2011, and public debt
fell from 41 percent of GDP in 2002 to 12 percent in 2012.
Despite this progress on fiscal reform, three major challenges remain: (i) a volatile
macroeconomic environment; (ii) still insufficient fiscal resources; and (iii) high levels of
poverty and inequality. First, while Paraguay’s growth in the past decade has exceeded its
average for the past three decades, it has also become more volatile in recent years. In the period
from 1960 to 2000 the standard deviation of GDP growth in Paraguay undershot the regional
mean and median, and in contrast in the past decade has exceeded them. Moreover, Paraguay is
one of the few Latin American countries that show an increasing trend comparing the standard
deviations of GDP growth for these two periods. The increased volatility renders fiscal policy,
especially planning and forecasting, more difficult. The second major challenge is the still
limited fiscal resources that constrain spending on human development and growth-enhancing
policies. Paraguay’s tax to GDP ratio is lower than that of any relevant peer group including the
average Latin American or lower middle income country. At the same time, the share of social
expenditure in GDP is also lower than that of the relevant peer countries and overall outcomes of
social services are improving at a slower pace than in other countries. Third, despite significant
poverty reduction since 2003, the incidence of poverty and inequality remains high in
international comparison and calls for further improvements in the future.
In light of these three challenges, the objective of this report is to examine the extent to
which fiscal policy in Paraguay has contributed to the social progress of the past decade,
and can serve the purpose of further reducing poverty and enhancing shared prosperity in
the years to come. Overall, fiscal policy can contribute to containing poverty and inequality by
buffering the negative impact of financial and economic crises on vulnerable parts of the
population. Moreover, tax and expenditure policies that redistribute from high- to low-income
households in a well-targeted manner can also contribute to these goals. In Paraguay,
Government intervention helped containing the negative impact of the 2009 crisis on poverty and
inequality, thereby contrasting earlier crisis that had large negative effects. In terms of
redistribution, the role of fiscal policy in Paraguay has been limited in the past partly due to the
low tax to GDP ratios as well as low expenditures in social sectors including social protection.
There is scope to increase the role of fiscal policy in reducing poverty and sharing prosperity in
Paraguay in the future due to the possibility of raising additional tax revenues, expanding the
coverage of social protection programs, and reducing remaining inefficiencies.
Fiscal policy in Paraguay remains constrained by limited tax revenues. Still today, Paraguay
is characterized by a low tax-to-GDP ratio by international standards. The tax reform in 2004
could not generate significant additional revenues for the following three main reasons: (ii) it
failed to introduce taxation in the agricultural sector to rise the sector’s fiscal contribution to a
xi
level that is proportional to its share of GDP; (ii) significant tax exemptions weakened some
reform measures and still do, as in the case of the reformed corporate income tax of the
agricultural sector (IMAGRO); and (iii) some measures, for example the personal income tax,
were not implemented for a long time. In addition, the reform did not change the actual structure
of the tax system, especially with regard to reliance on indirect taxes. In fact, reliance on indirect
taxes increased over time, rendering the system even more regressive.
The current structure of the tax system appears suboptimal in light of the identified
challenges. Even though the reliance on indirect taxes insulates public revenues from economic
volatility to a certain extent, it imposes high costs associated with sufficiency and equity of the
system. Other policy tools such as a fiscal rule or a stabilization fund could be used to manage
volatility more effectively. Furthermore, the regressivity of the tax system, as a result of a high
degree of indirect taxation, is particularly harmful in an economy with high poverty rates.
Adequate taxation of the agricultural sector is needed to level the playing field for business
development in all sectors and to address the insufficiency of taxes. While the full
implementation of the 2004 tax reform could still raise tax revenues, eliminating significant tax
exemptions could provide an additional source of fiscal revenue. Some elimination would have
to be accompanied by targeted spending increases to offset the potential negative effect on
poverty. This could help Paraguay generate the fiscal resources necessary to increase spending
on infrastructure and the social sectors and to implement countercyclical fiscal policies. In
addition, the low taxation of agriculture provides an incentive to be active in this economic
sector, which already has a heavy weight in the economy. Removing this distortion would foster
the diversification of the economy.
While fiscal policy contributes less to poverty reduction and shared prosperity in Paraguay
than in the other countries analyzed for this study, direct transfers are well targeted. The
nature of Paraguay’s fiscal system – low tax revenues and, consequently, relatively low
expenditure – represents important limitations for the scope of fiscal redistribution and basic
service delivery. As a result, fiscal policy in Paraguay reduces inequality only slightly, and fiscal
policy measures such as taxes and transfers have a net negative impact on the poverty headcount.
This is partly because the poor pay a large share of their income on taxes. In addition, transfers
do not increase the income of the poor by as much as they do in other countries: the extremely
poor receive, on average, just US$0.38 PPP per day in household per capita terms from direct
transfers. And while direct transfers (especially the conditional cash transfer program) are well
targeted, they reach only a quarter of the extreme poor. As a result, all income deciles, including
the poorest, are net contributors to the fiscal system.
Income inequality is partly a result of the inequity of opportunities, which has improved in
recent years. The Human Opportunity Index (HOI) measures how far a society is from universal
provision of basic services and goods, such as sanitation, clean water and education, and the
extent to which those goods and services are unevenly distributed. Paraguay performs below the
LAC average on the HOI, but has improved faster than other countries since 2003. This is
because the coverage of basic social services, the overall wellbeing of the population and the
distribution of disparities among population groups have all improved, and have improved in line
with increased spending. However, the inequity of opportunity remains particularly high in
services where coverage remains low, such as access to safe sanitation, completion of 9th
grade
and enrollment in pre-school.

xii
Overall, Paraguay’s fiscal system is less progressive than in other Latin American
countries analyzed. Paraguay’s reliance on indirect taxes makes its overall tax system
regressive. Furthermore, social expenditures are less progressive than in other countries: while
the CCT program is highly progressive (by design), education and health spending is much less
progressive than in other countries. Public spending on primary education is pro-poor with the
bottom 40 percent capturing 47 percent of total public resources. Conversely, public spending on
secondary education is pro-rich, with the bottom 40 percent capturing only 31 percent of total
public resources while the top 40 percent captures close to half of total public resources.
Similarly, the poorest benefit disproportionally from public expenditures on health centers, while
the richest benefit disproportionally from public expenditures on hospitals.
Even though some social programs are very effective, the expenditure efficiency in
education and health is relatively low. This partly explains why public spending does not
contribute much to the reduction of poverty and inequality. Given Paraguay’s limited fiscal
resources, getting the most value out of public spending is an important priority. However, not
only does Paraguay spend less on the social sectors than many other countries, it also achieves
relatively weak outcomes in education and health. Preliminary analysis based on international
comparisons suggests that Paraguay could improve the efficiency of public spending in these two
sectors. An area with scope for improvements is the oversight of state-owned enterprises which
provide a large share of public basic services. Services such as water and sanitation are relevant
for health sector outcomes, and existing inefficiencies in the sector of state-owned enterprises
thereby generate follow-on effects. There also appears to be significant variation in expenditure
efficiency among departments within Paraguay, which may be related to a number of factors.
More and better data is needed at the departmental level in order to better assess what drives
social outcomes in different parts of the country.
The sufficiency and efficiency of social expenditures have to be considered within the
context of fiscal prudence, which is a continuous task. This is especially important in light of
the recent expansionary fiscal stance. Only if the Government is able to sustain fiscal prudence in
the future, will it be able to maintain macroeconomic stability and performance. The
Government needs to revert quickly to tighter fiscal policies after the 2012 fiscal stimulus to
buffer the effect of a bad harvest and the run-up to the April 2013 Presidential elections. In
addition, further improvements in debt management and addressing weaknesses in the budget
process would be important to sustain past gains in the future.
Policy options
A number of policy options emerge from the analysis carried out in the PER:
Related to the volatile macroeconomic environment, policy options to address the pro-
cyclicality of fiscal policy include the introduction of a fiscal responsibility law or the
introduction of a stabilization fund. Other options include strengthening automatic stabilizers
such as unemployment insurance and other social protection measures.
Direct taxation could be increased through the elimination of exemptions and further
reforms of personal income and property taxes. The main exemptions currently apply to the

xiii
agricultural income tax (IMAGRO); corporate income tax (IRACIS); personal income tax and
property tax. The most important gains in terms of revenue would stem from changes to value
added tax, including the elimination of the suspension of VAT application to petrol imports;
replacement of the reduced VAT rate of 5 percent with a uniform rate of 10 percent as envisaged
during the 2004 reform; and elimination of the exemption of sales of the agricultural sector and
of paid interests. A reform of property taxes could base taxation of property on market valuation
as opposed to fiscal valuation in order to render property tax a more effective tax. This could
promote better land use, it could also increase municipal revenue, which in turn could increase
accountability and reduce dependency on central government transfers.
Such reforms would also help address the regressivity of the tax system. The regressivity of
Paraguay’s tax system is in large part due to its reliance on indirect taxes. Reforming key direct
taxes and increasing their share in tax collections will help make Paraguay’s fiscal system more
progressive.
Eliminating tax exemptions and reforming direct taxes would help generate additional
revenue, which could be used to strengthen the progressivity of public spending.
Simulations using a CGE model prepared for this report suggest that the reduction in exemptions
(especially VAT exemptions) and the use of these resources for social expenditure could be
beneficial for human development outcomes. The simulations look specifically at increases in
spending on education, health and water and sanitation, and on the effect of this increased
spending on MDGs. Such spending could be better targeted to improve access to basic services
used by particularly vulnerable groups, including those identified as households whose head
speaks only Guaranï and went to school for less than 6 years. Similarly, any additional resources
freed up could be used for the CCT program, which would have beneficial impacts on poverty
and inequality given that it is already well targeted.
In order to assess and enhance the efficiency of public expenditure, it is important to
continue to improve disaggregated data at the departmental level. In addition to improving
the accuracy of available data, breaking down data on total expenditure by department, including
at the program or even facility level (such as schools and health centers) would push progress
even further by allowing for better targeting of resources. More and better data on outcomes in
key sectors, as well as on socio-economic and demographic indicators at the departmental or
municipal level, would also be beneficial for policy making.
Paraguay would also benefit from participation in additional international assessments in
order to better gauge its performance vis-à-vis peer countries. For instance, taking part in the
PISA study could make education outcomes in Paraguay comparable to other countries, thus
providing important information that could guide policy making in that sector.
Finally, improved management and oversight of SOEs could contribute to better social
service provision. Specific measures include: (i) approval and implementation of the draft law
institutionalizing an independent SOE supervisory body; (ii) further reforms to strengthen the
SOE governance and oversight framework; (iii) assurance of sufficient supply and quality of
basic public services; (iv) preparation of a long- and medium-term investment plan to efficiently
address infrastructure gaps; (v) the set-up of an investment system for SOEs; (vi) a set of rules
xiv
for managing debt and fiscal risk of SOEs; and (vii) schemes on transfers, subsidies and
outstanding payments.

1
Chapter 1: Introduction: challenges and context
Paraguay’s economic turnaround started in 2003, driven by an economic stabilization program
and favorable external demand. Since then, the Government has achieved significant progress in
the areas of development and reform, yet three major challenges remain for fiscal policy. First,
although Paraguay’s growth in the decade has exceeded its historical average since 1980, it has
become more volatile in recent years. This increased volatility renders planning and forecasting
more difficult. The second major challenge is the limited fiscal resources that constrain spending
on human development and growth-enhancing policies. Third, despite significant poverty
reduction since 2003, levels of poverty remain high, and achievements appear more modest if the
period prior to the deep crisis of 2002 and 2003 is taken into account. In the same vein, in terms
of reducing inequality and sharing prosperity the country has achieved less than its regional
peers, remaining one of the most unequal economies in Latin America - the most unequal region
in the world.
The purpose of the current study is to answer the following question: given the structure and the
challenges of the Paraguayan economy, has fiscal policy served the purpose of reducing poverty
and sharing prosperity? Based on the findings related to this question, the study seeks to trigger
a public debate about on optimality of tax and expenditure policies for Paraguay.
The current study seeks to answer this question in four chapters. This first, introductory chapter
presents the background in economic developments over the last decade and spells out
remaining challenges. Following this review it will also provide the objective, methodology, and
the value added of this PER. The second chapter addresses fiscal policy in a volatile
macroeconomic environment; the third chapter covers the role of fiscal policy in reducing
poverty, inequality and sharing prosperity; and the fourth chapter deals with the efficiency of
public spending.
1.1. The economic turnaround
After a quarter century of chronic stagnation and crisis, an economic stabilization program
and favorable external demand have led a recovery in growth since 2003. Paraguay
experienced a period of fast economic growth and prosperity throughout the 1960s and 1970s
with real per capita income more than doubling and real GDP growth averaging 7 percent per
year. The construction of the Itaipu dam provided significant economic impulse during that
period but this faded with the dam’s completion in the fall of 1982. Subsequently, Paraguay
could not maintain the high growth rates and slipped into a period of recurring and costly
financial distress in the late 1990s. This translated into slow advances in per capita GDP, which
grew on average 1 percent per year between 1982 and 1996 and then declined by 14 percent
between 1997 and 2002. In terms of real GDP, an average annual growth of 3.8 percent
contrasted with a subsequent drop of 4.4 percent between 1997 and 2002. The crisis in the late
1990s was a result of rapid financial liberalization, which was allowed to take place in the

2
absence of prudential regulations and safeguards.1 Shortly thereafter, Paraguay was affected by
contagion from the regional crisis in 2002, which exacerbated inherent weaknesses in the
financial system. This undermined confidence and precipitated large deposit runs as well as a
deep financial crisis that depressed the economy further. In response to this crisis, the new
Duarte-Frutos administration adopted an ambitious stabilization program in 2003. Strong
external demand helped stabilization and recovery. It triggered fast export growth which in turn
translated into strong recovery of private consumption and investment, the main drivers behind
growth recovery in that period.
As a result, average annual real GDP growth reached 3.9 percent between 2003 and 2012
and was broadly shared for the most part. By 2008, real per capita GDP had recovered from
the crisis and had regained the pre-crisis levels of 1997. With strong real export growth of 5.4
percent per year on average between 2003 and 2012, private consumption and investment also
expanded rapidly, contributing on average 3.5 and 0.7 percentage points respectively to annual
growth in this period (Figure 1.2). The services sector contributed most to growth, accounting for
2.2 percentage points on average between 2003 and 2012, of which wholesale and retail trade,
followed by transport and communications, were the most important subsectors. Agriculture was
the second most important sector explaining on average 0.6 percentage points of growth,
followed by the electricity and water sector with 0.5 percentage points. As a consequence of
solid growth, unemployment fell from 8.1 percent in 2003 to 5.6 in 2011 and poverty was
reduced from 44 percent to 32 percent over the same period.
While the 2009 crisis temporarily interrupted Paraguay’s economic turnaround, the
impact on poverty was contained and fiscal policy remained prudent in contrast to earlier
crises. A severe drought exacerbated the impact of the international economic crisis in Paraguay,
triggering a 4 percent real contraction of the economy and a 25 percent drop in agricultural
production. Yet, record growth of 13.1 percent in 2010 illustrates how short-lived the impact
was. Paraguay’s external position remained stable throughout 2009, because the significant drop
in exports was balanced out by: the drop in imports; a lower than expected drop in remittances; a
1 IMF (2009) provides a detailed description.
Figure 1.1: Real GDP and real GDP per capita
Source: World Bank, WDI
-10
-5
0
5
10
15
20
40
60
80
100
120
140
196
0
196
2
196
4
196
6
196
8
197
0
197
2
197
4
197
6
197
8
198
0
198
2
198
4
198
6
198
8
199
0
199
2
199
4
199
6
199
8
200
0
200
2
200
4
200
6
200
8
201
0
201
2
Per
cen
t
Ind
ex (
20
05
=1
00
)
Real GDP per capita index Real GDP growth
3
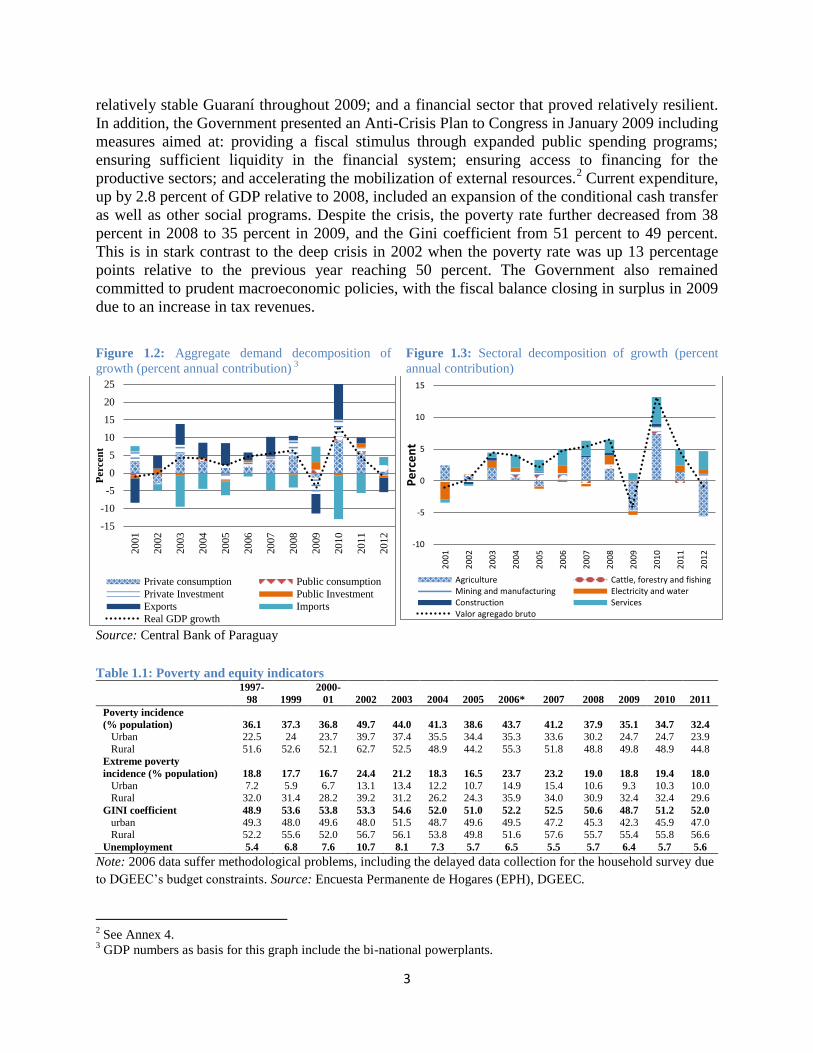
relatively stable Guaraní throughout 2009; and a financial sector that proved relatively resilient.
In addition, the Government presented an Anti-Crisis Plan to Congress in January 2009 including
measures aimed at: providing a fiscal stimulus through expanded public spending programs;
ensuring sufficient liquidity in the financial system; ensuring access to financing for the
productive sectors; and accelerating the mobilization of external resources.2 Current expenditure,
up by 2.8 percent of GDP relative to 2008, included an expansion of the conditional cash transfer
as well as other social programs. Despite the crisis, the poverty rate further decreased from 38
percent in 2008 to 35 percent in 2009, and the Gini coefficient from 51 percent to 49 percent.
This is in stark contrast to the deep crisis in 2002 when the poverty rate was up 13 percentage
points relative to the previous year reaching 50 percent. The Government also remained
committed to prudent macroeconomic policies, with the fiscal balance closing in surplus in 2009
due to an increase in tax revenues.
Figure 1.2: Aggregate demand decomposition of
growth (percent annual contribution) 3
Figure 1.3: Sectoral decomposition of growth (percent
annual contribution)
Source: Central Bank of Paraguay
Table 1.1: Poverty and equity indicators
1997-
98 1999
2000-
01 2002 2003 2004 2005 2006* 2007 2008 2009 2010 2011
Poverty incidence
(% population) 36.1 37.3 36.8 49.7 44.0 41.3 38.6 43.7 41.2 37.9 35.1 34.7 32.4
Urban 22.5 24 23.7 39.7 37.4 35.5 34.4 35.3 33.6 30.2 24.7 24.7 23.9
Rural 51.6 52.6 52.1 62.7 52.5 48.9 44.2 55.3 51.8 48.8 49.8 48.9 44.8
Extreme poverty
incidence (% population) 18.8 17.7 16.7 24.4 21.2 18.3 16.5 23.7 23.2 19.0 18.8 19.4 18.0
Urban 7.2 5.9 6.7 13.1 13.4 12.2 10.7 14.9 15.4 10.6 9.3 10.3 10.0 Rural 32.0 31.4 28.2 39.2 31.2 26.2 24.3 35.9 34.0 30.9 32.4 32.4 29.6
GINI coefficient 48.9 53.6 53.8 53.3 54.6 52.0 51.0 52.2 52.5 50.6 48.7 51.2 52.0
urban 49.3 48.0 49.6 48.0 51.5 48.7 49.6 49.5 47.2 45.3 42.3 45.9 47.0 Rural 52.2 55.6 52.0 56.7 56.1 53.8 49.8 51.6 57.6 55.7 55.4 55.8 56.6
Unemployment 5.4 6.8 7.6 10.7 8.1 7.3 5.7 6.5 5.5 5.7 6.4 5.7 5.6
Note: 2006 data suffer methodological problems, including the delayed data collection for the household survey due
to DGEEC’s budget constraints. Source: Encuesta Permanente de Hogares (EPH), DGEEC.
2 See Annex 4. 3 GDP numbers as basis for this graph include the bi-national powerplants.
-15
-10
-5
0
5
10
15
20
25
20
01
20
02
20
03
20
04
20
05
20
06
20
07
20
08
20
09
20
10
20
11
20
12
Percen
t
Private consumption Public consumption
Private Investment Public Investment
Exports Imports
Real GDP growth
-10
-5
0
5
10
15
200
1
200
2
200
3
200
4
200
5
200
6
200
7
200
8
200
9
201
0
201
1
201
2
Pe
rce
nt
Agriculture Cattle, forestry and fishingMining and manufacturing Electricity and waterConstruction ServicesValor agregado bruto

4
1.2. The economic stabilization program
At the core of the Government’s economic stabilization program was fiscal consolidation
that allowed for the reduction of the debt-to-GDP ratio and also kept inflation in check. After high public spending in the late 1990s and early 2000s, the Government’s consolidation
resulted in overall fiscal surpluses for the eight consecutive years between 2004 and 2011. These
surpluses averaged 1 percent of GDP. The combination of continuous surpluses and solid
economic growth also reduced the debt-to-GDP ratio from 41 percent in 2002 to 12 percent in
2012. Additionally, sound fiscal policies together with the Central Bank’s focus on price stability
resulted in single-digit inflation for most years.
Table 1.2: Paraguay’s fiscal accounts (percent of GDP)
Source: Ministerio de Hacienda
2005 2006 2007 2008 2009 2010 2011 2012
Total revenues 15.7 16.0 15.6 15.8 17.5 16.9 17.4 18.4
Current revenues 15.6 15.9 15.6 15.8 17.2 16.7 16.8 17.9
Tax revenues 10.1 10.5 10.1 10.7 11.6 12.0 12.1 12.3
Non-tax revenues 5.0 4.9 4.8 4.1 4.8 4.0 4.0 4.9
o/w contributions to pension fund 1.0 0.9 1.1 1.1 1.3 1.2 1.2 1.5
o/w royalties 3.1 3.1 2.9 2.3 2.9 2.1 2.1 2.7
Grants 0.1 0.1 0.3 0.3 0.1 0.0 0.0 0.0
Transfers 0.3 0.4 0.3 0.5 0.6 0.7 0.7 0.7
Capital revenues 0.1 0.1 0.0 0.0 0.3 0.2 0.6 0.4
Total expenditures and net lending 15.0 15.5 14.8 13.5 17.5 15.9 16.7 20.1
Total expenditures 15.0 15.6 14.8 13.6 17.5 15.9 16.7 20.1
Current expenditures 11.5 11.9 11.5 11.1 13.4 12.5 12.8 15.5
o/w personal services 6.2 6.5 6.4 6.5 7.7 7.3 7.4 9.3
o/w goods and services 1.0 1.1 1.0 0.9 1.3 1.4 1.5 1.6
o/w interest 1.0 0.9 0.7 0.6 0.5 0.4 0.3 0.2
o/w current transfers 3.3 3.3 3.3 3.1 3.7 3.4 3.6 4.3
Capital expenditures 3.5 3.7 3.3 2.5 4.1 3.4 3.9 4.7
o/w physical investment 2.7 2.6 2.2 1.5 2.6 2.4 2.2 2.5
Net lending -0.1 0.0 0.0 0.0 0.0 0.0 0.0 0.0
Overall balance 0.7 0.4 0.9 2.3 0.1 1.0 0.7 -1.7
Primary balance 1.7 1.3 1.6 2.8 0.6 1.4 1.0 -1.5

5
Figure 1.4: Revenues and expenditures Figure 1.5: Fiscal balance
Source: Ministerio de Hacienda Source: Ministerio de Hacienda
The Government’s stabilization program focused first on immediate macro-economic
imbalances and since 2006 has shifted towards medium-term growth and institutional
issues.4
Immediately after the crisis, the Government addressed fiscal consolidation on the
revenue and expenditure sides. Major reforms from 2003 to 2005 included the reform of the
public pension scheme in late 2003 together with restrictions on employment and wage increases
within selected sectors; a tax policy reform and a new legal framework for revenue
administration were implemented in 2004 as was a new customs code. Financial sector reform
started in 2003 with the adaption of the bank resolution law and the adoption of regulations by
the BCP Board of Directors on asset classification, provisioning requirements, and imputation of
accrued interest, followed by the adaption of the public banking law in 2005. As it became clear
in 2005 that the economy had been stabilized, the Government shifted focus towards structural
reforms with the objective of fostering economic growth while continuing with reforms aimed at
sustaining stability. Reforms in this second phase included: the oversight mandate of state-owned
enterprises; internal control mechanisms in the public sector; and the introduction of the
conditional cash transfer program: Tekopora in 2005; and its subsequent expansion.
4 For a comprehensive description please refer to IMF (2009).
0
5
10
15
20
25
198
0
198
2
198
4
198
6
198
8
199
0
199
2
199
4
199
6
199
8
200
0
200
2
200
4
200
6
200
8
201
0
201
2
Per
cen
t o
f G
DP
Revenues/GDP Expenditures/GDP
-6
-4
-2
0
2
4
6
198
01
98
21
98
41
98
61
98
81
99
01
99
21
99
41
99
61
99
82
00
02
00
22
00
42
00
62
00
82
01
02
01
2
Per
cem
t o
f G
DP
Fiscal balance/GDP Primary balance/GDP

6
Figure 1.6: Public debt Figure 1.7: Inflation (CPI, period average)
Source: BCP Source: BCP
1.3. The development dividend of stabilization
The stabilization generated the environment for the private sector to invest with greater
confidence and grow. In the period from 2003 to 2008, investment ratios as a percentage of
GDP increased from 15 percent to 18 percent respectively. This development was partly reversed
as a result of the 2009 crisis when private investment dropped to 17 percent of GDP, but it has
been recovering since then. FDI inflows have also stabilized over the same period and
unemployment dropped from 8.1 percent in 2003 to 5.6 percent in 2011.
Figure 1.8: Public and private investment Figure 1.9: Net capital inflows
Source: BCP Source: BCP
The development dividend of this stabilization was mainly a reduction in poverty;
prosperity that was broadly shared for the most part; and a modest improvement in
inequality. Real per capita GDP increased by 22 percent between 2003 and 2011. Compared to
the crisis years of 2002 and 2003, poverty fell significantly from 49.7 percent and 44 percent
respectively, to 32.4 percent in 2011. Progress in terms of extreme poverty is similarly
significant with rates dropping from 24.4 percent in 2002 to 18 percent in 2011 (Table 1.1).
0
10
20
30
40
50
199
11
99
21
99
31
99
41
99
51
99
61
99
71
99
81
99
92
00
02
00
12
00
22
00
32
00
42
00
52
00
62
00
72
00
82
00
92
01
02
01
12
01
2
Per
cen
t
External Debt/GDP Domestic Debt/GDP
0
5
10
15
20
25
30
35
40
199
0
199
2
199
4
199
6
199
8
200
0
200
2
200
4
200
6
200
8
201
0
201
2
Per
cen
t
0
5
10
15
20
25
19
97
19
98
19
99
20
00
20
01
20
02
20
03
20
04
20
05
20
06
20
07
20
08
20
09
20
10
20
11
20
12
Pe
rce
nt
of
GD
P
Public investment Private investment
-5
0
5
10
15
19
95
19
96
19
97
19
98
19
99
20
00
20
01
20
02
20
03
20
04
20
05
20
06
20
07
20
08
20
09
20
10
20
11
20
12
Pe
rce
nt
of
GD
P
Foreign direct investment Portfolio investmentDerivatives Other investmentTotal
7
Between 2004 and 2011 the bottom 40 percent of the population5 also shared in this economic
growth. Their household income grew by 4.6 percent on average compared to the 3.3 percent
average for the overall population. Yet, three caveats apply to this overall positive development:
(i) income growth of the bottom 40 percent was lower than the regional average, and particularly
than that of neighboring countries; (ii) inequality among this bottom 40 percent has increased;
and (iii) recovery after the 2009 crisis was not as strong for the bottom 40 percent as it was for
the rest of the population and thus, overall inequality has risen since then. Compared to 2003,
Paraguay also witnessed a moderate reduction in inequality with the Gini coefficient falling from
0.55 in 2003 to 0.52 in 2011. It had actually dropped to 0.487 by 2009, but the crisis that year
reversed the positive benefits of this reduction and it rose to 0.52 by 2011.
Despite these critical advances, stabilization and structural reforms could not dispel a
number of major challenges so that the continuation and deepening of the reform effort
will be essential to fully unlock Paraguay’s productivity. In contrast to other Latin American
countries, as for example Peru, stabilization and structural reforms could not reduce the volatility
of the macro-economic environment in Paraguay, where volatility had in fact increased in recent
years In addition, fiscal resources remain limited and are constraining spending on human
development and growth-enhancing policies. Poverty and inequality in Paraguay remain among
the highest in the region. The next three sections describe these three major challenges.
1.4. Challenge 1: Volatile macroeconomic environment
A first key challenge for public financial management in Paraguay is the increase in
volatility of GDP growth, rendering it one of the most volatile economies in the region. In
contrast, many other countries in the region have managed to reduce volatility. In the period
from 1960 to 2000 Paraguay’s volatility was significantly below the regional mean and median,
yet in the last decade it has been above (see Table Annex 1.1). In addition, it is not only
economic growth that has become more volatile: most macroeconomic variables in Paraguay
currently share this pattern, and this poses a challenge to fiscal policy by rendering revenue and
expenditure forecasting more difficult. It also increases the risks of pro-cyclicality of fiscal
policies (see Table Annex 1.2).
The increase in volatility is concerning and needs to be understood thoroughly given its
significant costs in terms of welfare, economic growth, and equality.6 World Bank (2013)
provides an in depth analysis of the sources, effects, and options for managing volatility.
Designing policies that help mitigate the impact of shocks to the economy and that help increase
a country’s resilience is particularly relevant in the light of increased volatility. They are also
5 The time period is dictated by the availability of comparable data. For more details on the topic please refer to
Lopez-Calva, Lugo, and Barriga Cabanillas (2013) forthcoming. 6 A comprehensive economic literature has documented these impacts; for example Loayza, Ranciere, Serven, and
Ventura (2007), Athanasoulis and van Wincoop (2000), World Bank (2000) on the impact of volatility on welfare,
Hnatkovska and Loayza (2005) and Calderon and Schmitt-Hebbel (2003) and Berument, Dincer, and Mustafaoglu
(2011) on the growth impact, and Breen and Garcia Penalosa (2004), Garcia-Penalosa and Turnovsky (2004), or
Huang, Fang and Miller (2012) for the impact on equality.

8
important because Paraguay still has a low per capita income compared to its neighbors and
suffers from a persistent high degree of inequality and poverty.
1.5. Challenge 2: Limited fiscal resources that constrain spending on
human development and growth-enhancing policies
The inability to raise tax revenues has resulted in low levels of spending in social sectors
and infrastructure. Despite important improvements on the back of fiscal policy and
administration reforms, Paraguay is characterized by a low tax to GDP ratio by international
standards. It undershoots by a large margin the tax to GDP ratio of its MERCOSUR neighbors;
the ratios in Argentina and Brazil are twice as high as in Paraguay. Compared to all relevant peer
groups, be it lower middle income countries (MICs), Latin American and Caribbean countries, or
countries that have similar characteristics in terms of GDP per capita and population, Paraguay
collects very little in the way of taxes (see Figure 1.9).7 In this environment fiscal surpluses for
eight consecutive years from 2004 to 2011 explain relative caution when it comes to spending.
Despite fast growth in recent years, social expenditure in Paraguay is lower than in comparator
countries (Figure 1.11) and overall outcomes of social services are also improving at a slower
pace than in other countries. This explains Paraguay’s weak performance in terms of the Human
Development Indicator and other social development indicators (see Annex 1.3 for details).
Lack of disaggregated data on social spending and outcomes limits the ability to assess the
efficiency of public spending. Both in health and education, around 80 percent of expenditure is
classified as alcance nacional - spending at the national level. Attribution to specific departments
7 The peer group of countries with similar GDP and population characteristics comprises the ten countries for which
the equally weighted average of Population and GDP per capita is closest to Paraguay. The countries are: Bolivia,
Bulgaria, El Salvador, Georgia, Honduras, Jordan, Nicaragua, Papua New Guinea, Serbia, and Turkmenistan.
Figure 1.10: Tax-to-GDP ratio 2011 Figure 1.11: Social Expenditure
Source: SET and USAID Source: CEPAL (2009-2011)
0
5
10
15
20
25
30
35
Par
aguay
Arg
enti
na
Bra
zil
Uru
gu
ay
Ho
ndu
ras
Ser
bia
Ecu
ado
r
Geo
rgia
Gu
atem
ala
LM
ICs
UM
ICs
Lac
Per
cen
t o
f G
DP
0
5
10
15
20
25
30
35
Arg
enti
na
Boli
via
Bra
zil
Bulg
aria
El
Sal
vad
or
Ho
ndu
ras
Nic
arag
ua
Par
aguay
Ser
bia
Uru
gu
ay
LA
C
Per
cen
t o
f G
DP
9
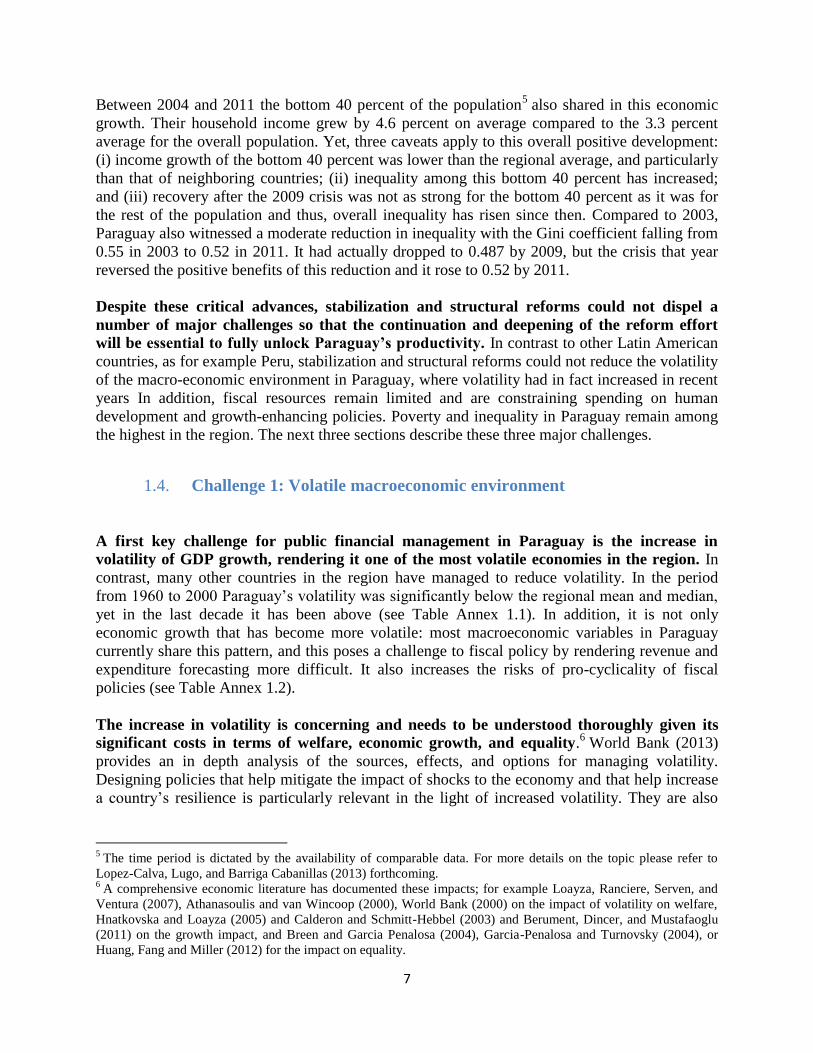
is only possible for 20 percent of all expenditures. Outcome data is also very limited at the
departmental level, which constrains analysis of the efficiency of public spending at this level.8
In the case of education, the national attainment test SNEPE is only representative at the national
level, so that education outcomes at the departmental level cannot be assessed. This is a serious
limitation as the discourse about performance between different departments offers an excellent
opportunity to understand differences in the administration and processes and the exchange of
best practices. A further limitation to assessing the efficiency of public spending in education in
Paraguay is that the country does not participate in international tests that would allow
comparison with other countries.
1.6. Challenge 3: High levels of poverty and inequality remain
Despite significant improvements over the past decade, Paraguay’s poverty rates and
inequality remains among the highest in Latin America and the Caribbean—the most
unequal region in the World (Annex 1.4). A major reason behind the still high poverty and
inequality is the negative impact that continuous crises between 1998 and 2002 have had on the
population. Compared to the 2002 crisis, the 2009 crisis had only a minor impact, partly due to
Government intervention that buffered the effects. As a result, overall achievements in Paraguay
appear modest, when comparing current poverty numbers with the pre-crisis year of 1997 when
poverty was at 36.1 percent and extreme poverty at 18.8. In terms of equality, results look less
favorable, with the Gini coefficient at 0.52 in 2011 exceeding that of 0.49 in 1997.
This third challenge is closely linked to the two other challenges, through the negative
impact of volatility on poverty reduction and inequality and the question of redistribution.
As argued in Lopez-Calva, Lugo, and Barriga Cabanilas (2013), the high degree of volatility
may be the weak link between solid average growth performance and employment generation.
The uncertainty resulting from volatile economic growth may reduce the incentive for firms to
employ new staff. Also, persistently high levels of inequality may be linked to high volatility
because citizens at the lower end of the income distribution have reduced access to insurance
mechanisms and therefore suffer more from negative shocks. Together, lagging employment
generation and continued high levels of inequality pose important challenges for Paraguay in the
eradication of extreme poverty. In terms of redistribution, the question is whether tax and
expenditure policies have contributed to income redistribution from high- to low-income
households in a well-targeted manner, and to what extent fiscal policy has contributed to
reducing poverty and inequality.
1.7. Transparency and data availability
The PER supported the government’s efforts to improve the transparency of economic
data through three key tools: (i) the BOOST database of comprehensive treasury data; (ii)
the Social Accountability Matrix; and (iii) the Computable General Equilibrium Model.
Each of these tools was developed as part of the PER and served as the basis for the analysis
presented in the following chapters. But their usefulness reaches beyond this report, as they can
8 For more information on data issues, please see Box 2 in Chapter 4.

10
be used by the government for a number of analytical purposes and contribute to improved
transparency and accountability.
The publication of a BOOST database represents a significant policy change towards
greater transparency of fiscal data. Available through the Ministry of Finance’s website9, the
BOOST platform provides disaggregated budget data for all levels of government in a user-
friendly format for the years 2003 to 2012. Paraguay is the first country in Latin America and the
Caribbean, and the fourth in the world to release budget data to the public using BOOST. The
tool supports government efforts to improve the quality of expenditure analysis, and shows the
government’s commitment towards greater budget transparency. The preparation of the platform
has also contributed to capacity building in the Ministry of Finance as well as to improved
information exchange within the Ministry and with the line ministries.
The preparation and planned publication of a well-documented and updated social
accountability matrix is also an important milestone. The background work for this PER
contains the preparation of a social accountability matrix as a key ingredient of a computable
general equilibrium model. The social accountability matrix has been prepared in close
collaboration with the Ministry of Finance and the Central Bank. It includes data from
Paraguay’s National Accounts, Fiscal Accounts, Balance of Payments, and Permanent
Household Survey, and builds on an Input-Output Table created by the Central Bank.10
The
publication of the matrix in itself will be another step towards greater transparency in Paraguay
and is expected to facilitate future research.
The dynamic-recursive computable general equilibrium (CGE) model allows the
government to assess the distributional and poverty impact of different policy alternatives.
The CGE model is complemented by a microsimulation model that translates the CGE results
into poverty and inequality outcomes. The model makes it possible to estimate how government
spending and taxation, foreign aid, and exogenous conditions (including world markets) together
influence and are influenced by human development.11
For both the social accountability matrix
and the preparation of the computable general equilibrium model, an important element of
capacity building has taken place and builds the basis for future collaboration. At the same time,
further improvements in data quality and availability would be important for enhanced policy
making (see Box 2 in Chapter 4 for more detail).
1.8. Objective, methodology, and the value added of this PER
Has fiscal policy served the purpose of reducing poverty and sharing prosperity? This is the
overarching question that the current PER seeks to answer in light of the developments of the
past decade and the remaining major challenges. Based on the findings related to this question
9 http://www.openlooksolutions.com/boost_paraguay/.
10 The Input-Output Table is for 1994 and was created by the Central Bank of Paraguay, which is the only official
provider of the data and is in charge of the collection and processing of National Accounts data. 11
For more information on the Social Accountability Matrix and the CGE model, see Chapter 4 of Volume II of this
report.

11
the study aims to trigger a public debate about the optimality of tax and expenditure policies for
Paraguay.
This PER has been prepared at the request of the Paraguayan authorities and in close
collaboration with them, based on a variety of economic and econometric techniques. While
this first volume of the report presents the overall storyline of the challenges to fiscal policy in
Paraguay and discusses policy options to address them. The second volume presents the research
papers that have been prepared as a background to this report in the course of the past two years.
The background papers rely on a variety of economic and econometric techniques, including
VAT estimation, incidence analysis, and the construction of a computable general equilibrium
model. Both the preparation of the BOOST database and of the social accountability matrix are
contributions of this report. The preparation of this report would not have been possible without
the invaluable collaboration with the Ministry of Finance and the Central Bank of Paraguay.
The report provides an overall narrative of remaining challenges for fiscal policy in
Paraguay and a discussion of policy options to address them. To this end, the PER pulls
together existing literature on fiscal policies and economic growth in Paraguay and combines it
with new analysis in the form of background papers presented in volume 2 of the report.
Another contribution is the quantification of characteristics of fiscal policy in Paraguay
that are generally known but have so far eluded discussion due to the lack of concrete
numbers and comparisons. The benefit of providing quantitative analysis for topics that are
widely recognized in Paraguay is that it pulls them into the arena of public discourse. Examples
of such topics in the context of the present PER are: the quantification and international
comparison of the regressivity and progressivity of taxation and expenditures; the quantification
of the dependence of children’s access to public services based on their parents’ socio-economic
background; and the quantification of tax expenditures.
12
Chapter 2: Public Finances in a commodity driven economy
While prudent fiscal policy allowed for macroeconomic stabilization, it also led to low levels of
public spending given limited fiscal resources. Still today, Paraguay is characterized by a low
tax-to-GDP ratio by international standards. A tax reform in 2004 could not generate significant
additional revenues for three main reasons: (i) it failed to introduce taxation in the agricultural
sector proportional to its share of GDP; (ii) significant tax exemptions weakened some reform
measures and still do, as in the case of reformed corporate income tax in the agricultural sector
(IMAGRO); and (iii) some reform measures were not implemented for a long time, for example
the personal income tax. In addition, the reform did not change the actual structure of the tax
system, especially with regard to indirect taxes. In fact, reliance on indirect taxes has increased
over time rendering the system even more regressive than before. While this insulates public
revenues from economic volatility to a certain extent, it imposes high costs associated with
sufficiency and equity of the system. As a result, the current structure of the tax system appears
suboptimal: Other policy tools such as a fiscal rule or a stabilization fund could be used to
manage volatility, and the regressivity is particularly harmful in an economy with high poverty
rates. While the full implementation of the 2004 tax reform could still raise tax revenues,
adequate taxation of the agricultural sector is needed to level the playing field for business
development in all sectors and to address the insufficiency of taxes. An additional source of
fiscal resources would be the elimination of significant tax exemptions. Some of these would
have to be accompanied by targeted spending increases to off-set the potential negative effect on
poverty. This could help Paraguay generate the fiscal resources necessary to increase spending
on infrastructure and on the social sectors and to implement countercyclical fiscal policies. In
terms of expenditures, and in light of the recent expansionary fiscal stance, it appears important
to ensure that fiscal prudence is considered a continuous task. Only if the Government is able to
sustain fiscal prudence in the future, will it be able to maintain macroeconomic stabilization and
performance.
This chapter is structured as follows: section 2.1 provides an overview of the fiscal consolidation
with limited fiscal resources covering the resulting structure of revenues. Section 2.2 describes
the links between fiscal policy and macro-economic volatility. Section 2.3 gives an overview of
the current structure of expenditures, kept brief to avoid overlap with the presentation of social
spending and human development outcomes in sections 1.5 and in Chapters 3 and 4. Section 2.4
concludes with policy recommendations emerging from the findings.
2.1 Fiscal consolidation with limited fiscal resources—the genesis of the
current revenue structure
The Government addressed fiscal consolidation from the perspectives of revenue and
spending, however the main adjustments fell onto spending due to limited revenue
increases. On the revenue side, major changes included the tax policy reform and a new legal
framework for revenue administration. These were implemented in 2004, as was a new customs
code. Yet, the results in terms of additional revenue collection were limited with the tax-to-GDP
13
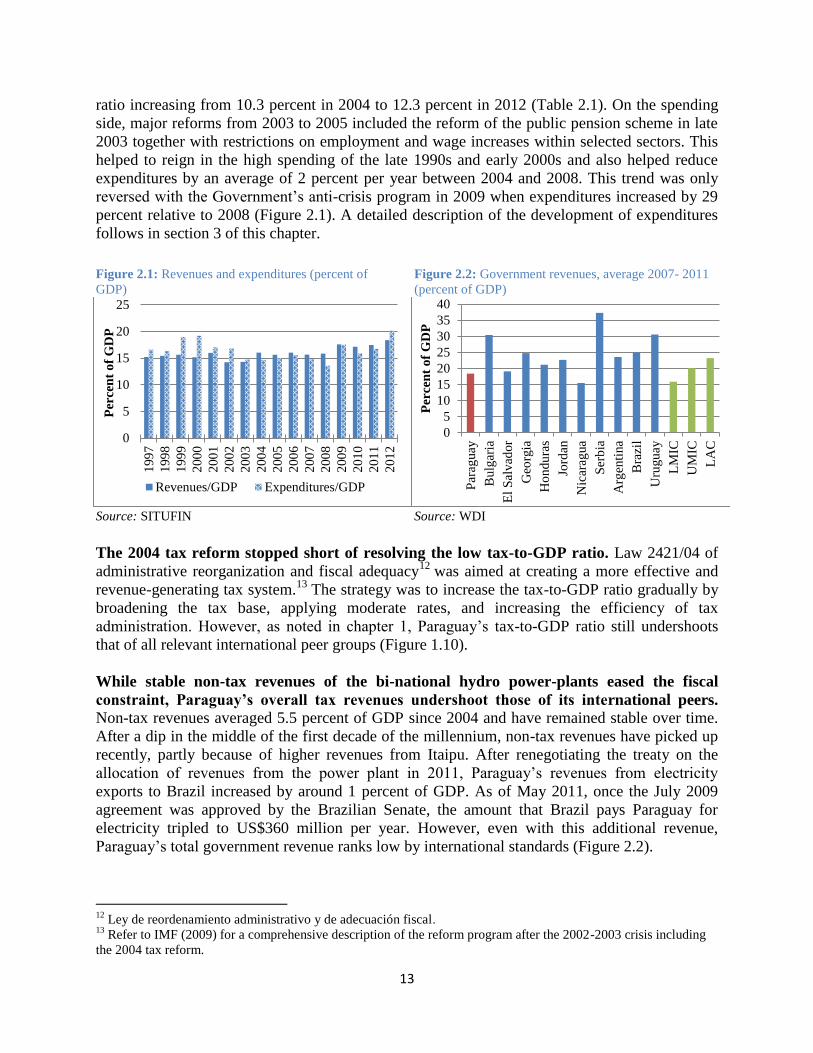
ratio increasing from 10.3 percent in 2004 to 12.3 percent in 2012 (Table 2.1). On the spending
side, major reforms from 2003 to 2005 included the reform of the public pension scheme in late
2003 together with restrictions on employment and wage increases within selected sectors. This
helped to reign in the high spending of the late 1990s and early 2000s and also helped reduce
expenditures by an average of 2 percent per year between 2004 and 2008. This trend was only
reversed with the Government’s anti-crisis program in 2009 when expenditures increased by 29
percent relative to 2008 (Figure 2.1). A detailed description of the development of expenditures
follows in section 3 of this chapter.
The 2004 tax reform stopped short of resolving the low tax-to-GDP ratio. Law 2421/04 of
administrative reorganization and fiscal adequacy12
was aimed at creating a more effective and
revenue-generating tax system.13
The strategy was to increase the tax-to-GDP ratio gradually by
broadening the tax base, applying moderate rates, and increasing the efficiency of tax
administration. However, as noted in chapter 1, Paraguay’s tax-to-GDP ratio still undershoots
that of all relevant international peer groups (Figure 1.10).
While stable non-tax revenues of the bi-national hydro power-plants eased the fiscal
constraint, Paraguay’s overall tax revenues undershoot those of its international peers.
Non-tax revenues averaged 5.5 percent of GDP since 2004 and have remained stable over time.
After a dip in the middle of the first decade of the millennium, non-tax revenues have picked up
recently, partly because of higher revenues from Itaipu. After renegotiating the treaty on the
allocation of revenues from the power plant in 2011, Paraguay’s revenues from electricity
exports to Brazil increased by around 1 percent of GDP. As of May 2011, once the July 2009
agreement was approved by the Brazilian Senate, the amount that Brazil pays Paraguay for
electricity tripled to US$360 million per year. However, even with this additional revenue,
Paraguay’s total government revenue ranks low by international standards (Figure 2.2).
12
Ley de reordenamiento administrativo y de adecuación fiscal. 13
Refer to IMF (2009) for a comprehensive description of the reform program after the 2002-2003 crisis including
the 2004 tax reform.
Figure 2.1: Revenues and expenditures (percent of
GDP)
Figure 2.2: Government revenues, average 2007- 2011
(percent of GDP)
Source: SITUFIN Source: WDI
0
5
10
15
20
25
199
7
199
8
199
9
200
0
200
1
200
2
200
3
200
4
200
5
200
6
200
7
200
8
200
9
201
0
201
1
201
2
Per
cen
t o
f G
DP
Revenues/GDP Expenditures/GDP
0
5
10
15
20
25
30
35
40
Par
aguay
Bulg
aria
El
Sal
vad
or
Geo
rgia
Ho
ndu
ras
Jord
an
Nic
arag
ua
Ser
bia
Arg
enti
na
Bra
zil
Uru
gu
ay
LM
IC
UM
IC
LA
C
Per
cen
t o
f G
DP

14
Box 1. Royalties from bi-national power plants
Royalties from the bi-national hydropower plants at Itaipu and Yacyreta have accounted for between 2
and 3 percent of GDP between 2005 and 2012, equivalent to between 15 and 20 percent of total revenue.
With the renegotiation of royalties from the bi-national hydroelectric power plant Itaipu, revenues have
increased by around 1 percent of GDP to reach US$ 360 million. In September 2012, the government set
up the Fondo Nacional de Inversion Publica y de Desarollo (FONACIDE) to channel this additional
revenue from the binationals to education, health and infrastructure. Some existing projections vary in a
range of five to ten years with respect to the time horizon for which revenues will remain up due to
growing electricity demand in Paraguay on the back of economic growth. These funds are earmarked by
law, with 28 percent distributed to the national treasury for infrastructure programs and projects, 30
percent to a fund for education and research, 7 percent for the Development Finance Agency (Agencia
Financiera de Desarrollo) and 10 percent for the National Health Fund (Fondo Nacional Para la Salud),
all at the national level. 25 percent of the funds are assigned to departmental governments and
municipalities out of which 50 percent are earmarked for infrastructure in education.
One of the reasons for the limited results of the 2004 tax reform was its failure to introduce
taxation in the agricultural sector proportional to its share of GDP. Prior to the 2004 reform,
the IMAGRO rate was 0.9 percent of the official land valuation. This led to very low revenues
because official land valuations fell short of real values. For example, a 100 hectare property in
14
Internal tax revenue refers to tax revenue excluding import and export duties.
Table 2.1: Tax revenue versus non-tax revenue (percent of GDP)
Source: Ministry of Finance, SITUFIN
Figure 2.3: Share of agricultural tax revenue in internal
tax revenues versus sectoral share in GDP14
Table 2.2: Sectoral weights in gross value added
Source: WDI Source: Central Bank of Paraguay
1980s 1990s 2000 2001 2002 2003 2004 2005 2006 2007 2008 2009 2010 2011 2012
Tax revenue 7.6 9.3 9.4 9.1 8.1 8.7 10.3 10.1 10.5 10.1 10.7 11.6 12.0 12.1 12.3
Non-tax revenue 1.3 4.5 5.5 6.7 6.0 5.6 5.6 5.5 5.5 5.5 5.1 5.9 5.1 5.3 6.0
Total revenue 8.9 13.8 14.9 15.8 14.0 14.3 15.9 15.7 16.0 15.6 15.8 17.5 17.1 17.4 18.4
0
5
10
15
20
25
20
00
20
01
20
02
20
03
20
04
20
05
20
06
20
07
20
08
20
09
20
10
20
11
Percen
t
Share of agriculture in internal tax revenueShare of agriculture in GDP
Share in gross value
added (average 2010 -
2012)
Agriculture 18
Cattle, forestry and fishing 7
Mining and manufacturing 11
Electricity and water 14
Construction 4
Transport and communication 8
Wholesale and retail trade 12
Financial services 2
Other services 25

15
Oviedo had a 1997 official value of Gs.116,691 per hectare. Tax was paid on 80 hectares: the
annual IMAGRO payment was Gs.101,517, or less than US$3 per month. This benefited
primarily farmers with large landholdings, which increasingly dominate the sector with the
expansion of soy cultivation. With the reform, taxes are now assessed based on a net income
criterion. Overall, the tax collection from agriculture increased from 2.7 percent of total tax
revenues in 2004 to 6.4 percent in 2011 (Figure 2.3 and Table 2.3). This low contribution to
overall tax revenues is in stark contrast with the sector’s weight in GDP which has increased
over time from about 12 percent in the second half of the 1990s to over 18 percent in 2010 and
2011 (Figure 2.3 and Table 2.2).
As with other measures of the 2004 tax reform, the new IMAGRO was immediately
weakened by significant tax exemptions and remains so. One of the main reasons behind the
continued low tax collection of the reformed IMAGRO is that VAT paid on purchases of goods
and services as inputs for agricultural production can be credited against the IMAGRO liability
of the agricultural producer. Even though this tax credit was abolished in September 2008,
accrued claims still reduced IMAGRO collections until decree 8279 was announced in 2012 and
suspended the possibility to claim back past VAT credits. Tax exemptions that stem from the
exemptions of VAT taxes to the agricultural sector amount to 0.33 percent of GDP.
Total tax exemptions are estimated to amount to 1.3 percent of GDP. This is particularly
significant when compared to Paraguay’s tax-to-GDP ratio. Besides VAT exemptions to the
agricultural sector of 0.3 percent of GDP, the other main exemptions include: exemptions on
interest related to VAT (0.25 percent of GDP); a reduced VAT rate of 5 percent as opposed to
the usual 10 percent for basic consumer goods (0.29 percent of GDP); a special tax regime for
fuels (0.3 percent of GDP); and exemptions from import duties (0.15 percent of GDP) (see
Schenone (2012) and (2010)).
Table 2.3: Sectoral contribution to total internal tax
revenue
Table 2.4: Revenue by tax type
Source: SET Source: SITUFIN
Revenue by economic activity
Average
2000 to 2004
(percent of total)
Average
2005 to 2011
(percent of total)
Industry 27 22
Wholesale and retail trade 14 24
Financial Intermediation 17 13
Electricity, gas, and water 8 5
Transport 9 12
Public admin and defense 7 4
Agrobusiness sector 2 5
Other sectors 16 15
Revenue by tax
Average
2000 to 2004
(percent of total)
Average
2005 to 2012
(percent of total)
VAT + other consumption taxes 64 66
Income taxes 17 21
Other taxes 18 13

16
Table 2.5: Government tax revenue by tax type (percent of total unless stated otherwise)
Source: Ministry of Finance, SITUFIN, SET
While the expansion of the tax base compensated for exemptions and lower marginal tax
rates relative to the pre-reform period, Paraguay still does not fully exploit its tax potential. In fact, the reform introduced a simple structure of taxes where corporate income, personal
income, agricultural income, small business income, and value added are generally all taxed with
a 10 percent uniform tax rate. In the case of the corporate income tax, this meant a 20 percentage
point reduction in the marginal tax rate (Table 2.6). The reform was successful in formalizing the
economy, as the number of contributors tripled between 2003 and 2011, and the tax revenue in
real terms more than doubled. At the same time, the average contribution per taxpayer dropped
by around 20 percent (Figure 2.4). While the broader tax base compensated for the exemptions
and the decrease in marginal tax rates, the average tax burden per contributor continues to be
relatively low by international standards and Paraguay’s marginal tax rates are lower than in
international comparator countries. Table 2.6: Marginal tax rates over time
Source: SET, CADEP, Schenone (2012)
Notes: * The basis for IMAGRO before the reform was the official valuation of the land, after the crisis the basis is net income.
An exception to the 10 percent rate is small farms with less than 300 hectares in the Eastern region or 1500 hectares in Western
part of Paraguay, to which a tax rate of 2.5 percent applies.
** Despite being created as part of the 2004 tax reform, the personal income tax was only implemented in August 2012.
*** IRPC (Corporate Income tax for small corporations) simplified procedures for small business with less than Gs 100 million
(around USD 22'500) in total sales per year.
**** ISC COMB (Consumption tax for fuels goods) has a maximum of 50 percent, but different tax rates below 50 percent apply
to different types of fuels.
****** IVA (value added tax) is in general 10 percent, however exceptions for a number of products exist for example
agriculture products of the basic food basket and pharmaceutical products to which a 5 percent rate applies.
******* The 2004 reform replaced TU (Tributo Unico--corporate income tax for small corporations).
1980s 1990s 2000 2001 2002 2003 2004 2005 2006 2007 2008 2009 2010 2011 2012
Income taxes 18.0 18.4 17.9 16.1 20.0 17.0 17.9 17.4 15.2 17.5 18.2 23.8 18.4 19.8 20.9
IRACIS - 17.1 16.6 14.9 16.8 15.5 16.8 16.9 15.8 17.5 17.9 23.1 18.3 18.9 -
IMAGRO - 0.3 0.9 0.9 1.0 0.0 0.8 0.0 0.0 0.0 0.0 0.0 0.0 0.8 -
Wealth taxes 6.3 0.9 0.0 0.2 0.0 0.0 0.0 0.0 0.0 0.0 0.0 0.0 0.0 0.0 0.0
Export taxes 1.3 0.7 0.0 0.0 0.0 0.0 0.0 0.0 0.0 0.0 0.0 0.0 0.0 0.0 0.0
Import taxes 14.9 20.6 18.2 17.5 16.7 18.1 18.3 14.9 14.6 11.9 12.3 10.6 13.4 12.9 11.8
Value added tax 0.0 31.8 43.0 42.2 42.9 42.7 39.3 43.9 44.8 50.2 52.1 48.3 51.8 51.4 51.0
Consumption tax 54.6 21.3 16.5 20.3 18.4 19.3 20.6 18.8 17.6 18.7 16.1 16.3 15.7 15.3 15.5
Fuel 7.6 7.3 11.1 14.8 14.4 15.6 16.6 14.1 13.2 14.2 11.8 11.4 10.6 10.8 10.8
Other goods 47.1 14.1 5.4 5.5 4.1 3.6 3.9 4.7 4.5 4.5 4.4 4.9 5.1 4.5 4.8
Other taxes 4.9 6.2 4.4 3.8 2.0 3.0 3.9 5.0 7.8 1.7 1.3 1.0 0.8 0.6 0.7
Total tax revenue in percent of GDP 8.9 13.8 14.9 15.8 14.0 14.3 15.9 15.7 16.0 15.6 15.8 17.5 17.1 17.4 18.4
2000 2001 2002 2003 2004 2005 2006 2007 2008 2009 2010 2011
ACTOS Y DOCUMENTOS (Financial transaction tax) 1.25 1.25 1.25 1.25 1.25 0.01 0.01 0 0 0 0 0
IMAGRO (Corporate income tax for agriculture)* 0.9 0.9 0.9 0.9 0.9 10 10 10 10 10 10 10
IRACIS (Corporate income tax for commercial, industrial and services activities) 30 30 30 30 30 20 10 10 10 10 10 10
IRP (Personal Income tax)** 10 10 10 10
IRPC (Corporate Income tax for small corporations)*** 4 4 4 4 4 10 10 10 10 10 10 10
ISC COMB (Consumption tax for fuels)**** 50 50 50 50 50 50 50 50 50 50 50 50
ISC OTROS (Consumption tax for selected goods, other than fuels)***** 9 9 9 9 9 10 10 10 10 10 10 10
IVA (Value added tax)****** 10 10 10 10 10 10 10 10 10 10 10 10
TU (Tributo Unico-- Corporate income tax for small corporations)******* 4 4 4 4 4

17
The tax reform increased the number of contributors significantly for all taxes, while the
average contribution per taxpayer dropped; corporate income tax is an exception where
average contribution actually increased. For VAT, tax revenue in real terms doubled, the
average contribution per taxpayer dropped by almost 50 percent between 2003 and 2011,
however this loss was offset by a quadrupling of the number of contributors during that period.
This led to an average VAT contribution per taxpayer of around US$1,300 in current terms in
2011. IMAGRO revenues also tripled in real terms between 2003 and 2011 reaching 0.8 percent
of total tax revenue and less than 0.1 percent of GDP in 2011 (Table 2.5). The number of
contributors to this tax more than doubled over this period, while the contribution per taxpayer in
real terms dropped by 15 percent. As a result, the average contribution per taxpayer to IMAGRO
reached around US$200 in 2011. In contrast, the corporate income tax, IRACIS, is the only tax
for which both the number of contributors and the average contribution per taxpayer increased,
they increased by 100 and 40 percent respectively. As a result, the average contributor paid
around US$2,800 in 2011. IRACIS revenues displayed the highest increase in tax revenue in real
terms between 2003 and 2011 – a five-fold increase. Yet, in terms of its share in total tax revenue
it remains far behind VAT revenues (Table 2.5).
Figure 2.4: Total internal tax revenue: Number of
contributors versus average contribution by taxpayer
Figure 2.5: VAT: Number of contributors versus average
contribution by taxpayer
Source: SET Source: SET
0
200
400
600
800
1000
1200
0
1
2
3
4
5
6
20
03
20
04
20
05
20
06
20
07
20
08
20
09
20
10
20
11
Th
ou
san
ds
of
con
stri
bu
tors
Con
sta
nt
20
03
mil
lion
Gu
ara
nie
s
Number of contributors (RHS)
Average revenue per contributor
0
100
200
300
400
500
600
700
0
1
2
3
4
5
6
720
03
20
04
20
05
20
06
20
07
20
08
20
09
20
10
20
11
Th
ou
san
ds
of
con
stri
bu
tors
Con
sta
nt
20
03
mil
lion
Gu
ara
nie
s
Number of contributors (RHS)
Average revenue per contributor
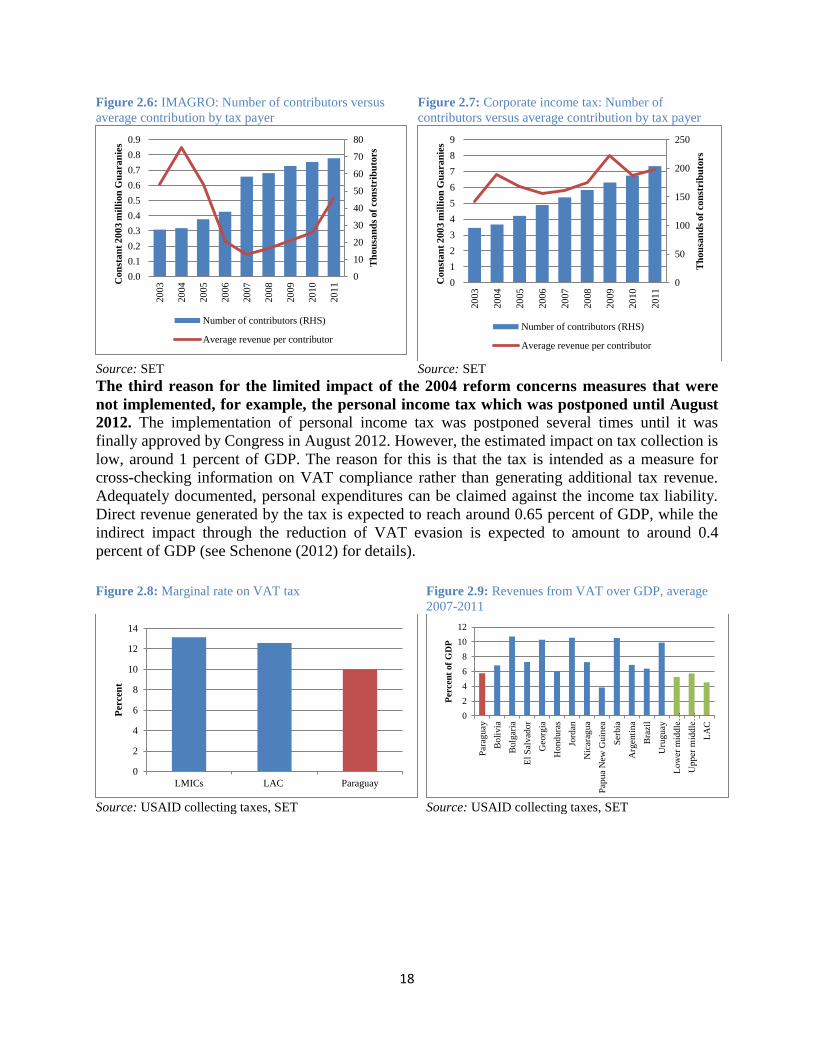
18
The third reason for the limited impact of the 2004 reform concerns measures that were
not implemented, for example, the personal income tax which was postponed until August
2012. The implementation of personal income tax was postponed several times until it was
finally approved by Congress in August 2012. However, the estimated impact on tax collection is
low, around 1 percent of GDP. The reason for this is that the tax is intended as a measure for
cross-checking information on VAT compliance rather than generating additional tax revenue.
Adequately documented, personal expenditures can be claimed against the income tax liability.
Direct revenue generated by the tax is expected to reach around 0.65 percent of GDP, while the
indirect impact through the reduction of VAT evasion is expected to amount to around 0.4
percent of GDP (see Schenone (2012) for details).
Figure 2.6: IMAGRO: Number of contributors versus
average contribution by tax payer
Figure 2.7: Corporate income tax: Number of
contributors versus average contribution by tax payer
Source: SET Source: SET
Figure 2.8: Marginal rate on VAT tax Figure 2.9: Revenues from VAT over GDP, average
2007-2011
Source: USAID collecting taxes, SET Source: USAID collecting taxes, SET
0
10
20
30
40
50
60
70
80
0.0
0.1
0.2
0.3
0.4
0.5
0.6
0.7
0.8
0.9
20
03
20
04
20
05
20
06
20
07
20
08
20
09
20
10
20
11
Th
ou
san
ds
of
con
strib
uto
rs
Con
sta
nt
20
03
mil
lion
Gu
ara
nie
s
Number of contributors (RHS)
Average revenue per contributor
0
50
100
150
200
250
0
1
2
3
4
5
6
7
8
9
20
03
20
04
20
05
20
06
20
07
20
08
20
09
20
10
20
11
Th
ou
san
ds
of
con
stri
bu
tors
Con
sta
nt
20
03
mil
lion
Gu
ara
nie
s
Number of contributors (RHS)
Average revenue per contributor
0
2
4
6
8
10
12
14
LMICs LAC Paraguay
Per
cen
t
0
2
4
6
8
10
12
Par
agu
ay
Boli
via
Bulg
aria
El
Sal
vad
or
Geo
rgia
Hond
ura
s
Jord
an
Nic
arag
ua
Pap
ua
New
Guin
ea
Ser
bia
Arg
enti
na
Bra
zil
Uru
guay
Low
er m
iddle
…
Upper
mid
dle
…
LA
C
Percen
t of
GD
P

19
The reform did not change the structure of the tax system: the reliance on indirect taxes is
a feature that remained and has further increased over time, rendering the system more
regressive. By not addressing problems inherent to the structure of the tax system, the 2004
reform has contributed little to resolving the challenges of high poverty and inequality. As will
be explained in detail in chapter 3, tax revenue collection in Paraguay is more regressive than in
other Latin American countries, and to a large extent this stems from a strong reliance on indirect
taxes such as VAT and consumption taxes. The 2004 reform actually increased this reliance from
64 percent before the reform to 66 percent after the reform (Table 2.4). By their nature, indirect
taxes are more regressive than direct taxes.
Figure 2.10: Marginal rate on corporate income tax Figure 2.11: Revenues from corporate income tax over
GDP, average 2007-2011
Source: USAID collecting taxes, SET Source: USAID collecting taxes, SET
Figure 2.12: Marginal tax on personal income tax Figure 2.13: Revenues from personal income tax over
GDP, average 2007-2011
Source: USAID collecting taxes, SET Source: USAID collecting taxes, SET
0
5
10
15
20
25
30
LMICs LAC Paraguay
Per
cen
t
01234567
Par
agu
ay
Boli
via
Bulg
aria
El
Sal
vad
or
Geo
rgia
Hon
dura
s
Jord
an
Pap
ua
New
Guin
ea
Ser
bia
Arg
enti
na
Bra
zil
Uru
gu
ay
Low
er m
iddle
…
Upp
er m
iddle
…
LA
C
Per
cen
t of
GD
P
0
5
10
15
20
25
30
LMICs LAC Paraguay
Per
cen
t
0123456789
Par
agu
ay
Bulg
aria
El
Sal
vad
or
Geo
rgia
Hon
dura
s
Jord
an
Nic
arag
ua
Pap
ua
New
…
Ser
bia
Arg
enti
na
Bra
zil
Uru
gu
ay
Low
er m
iddle
…
Upp
er m
iddle
…
LA
C
Percen
t of
GD
P

20
While a strong reliance on VAT tax revenue is a feature that Paraguay shares with
emerging economies, Paraguay’s reliance is heavier than international comparators.
Despite the low marginal tax rate, VAT is Paraguay’s main source of tax revenue and
represented 5.7 percent of GDP or 51 percent of total tax revenue on average between 2007 and
2011 (Figure 2.8). This is more than in the average Latin American country (4.5 percent of GDP
or 24 percent of total tax revenue); the average low middle income country (5.3 percent of GDP
or 29 percent of total tax revenue); and also more than in the average upper middle income
country (5.7 percent of GDP or 29 percent of total tax revenue) (Figure 2.9). In the peer group of
countries with similar population and GDP per capita only in Georgia, Serbia, and Uruguay VAT
does tax revenue represent around 50 percent of GDP, in the other countries this share is lower.
At the same time, Paraguay falls short of its peer countries in terms of the revenue contribution
of corporate income taxes and personal income taxes, both relative to GDP and relative to total
tax revenue (Figure 2.11 and 2.13).
Low marginal tax rates and relatively high or average tax revenue collection in Paraguay
suggest a productive tax system by international standards. Paraguay’s marginal tax rates are
low by international comparison (Figures 2.8, 2.10, and 2.12). At the same time, VAT revenue as
a percentage of GDP is higher in Paraguay than in comparator countries and as a result, VAT
productivity in Paraguay, with a rate of 0.57 percent, is higher than in the average lower middle
income country, which has a rate of 0.4 percent, or in the average Latin American country where
the rate is 0.36 percent (Figure 2.13).15
VAT is the most productive tax in Paraguay (Figure 2.13,
2.14, and 2.15). Also, in the case of corporate income tax, Paraguay has proven to be more
productive than its peers. Paraguay only underperformed its peers from 2007 to 2011 in terms of
personal income tax, a result of the tax not having been implemented until 2012.
Tax productivity in Paraguay has been increasing, and with the implementation of
personal income tax reforms in 2012 and the suspension of VAT credit against IMAGRO,
further improvements are expected. With unchanged marginal rates and increasing tax
revenue, the Paraguayan tax system has become more productive over time. This increase in
productivity can be explained by the expansion of the tax base and also by efficiency gains
15
Productivity is measured as the ratio of revenue relative to GDP over the marginal tax rate.
Figure 2.14: VAT productivity, average 2007-2011
Figure 2.15: Corporate income tax productivity,
average 2007-2011
Source: USAID collecting taxes, SET
0.00
0.10
0.20
0.30
0.40
0.50
0.60
0.70
LMICs LAC Paraguay
Rev
enu
e over
GD
P /
ra
te
0.00
0.05
0.10
0.15
0.20
0.25
LMICs LAC Paraguay
Rev
enu
e over
GD
P /
ra
te

21
through improvements in tax administration. One important advance in recent years has been the
introduction and implementation of a large taxpayer unit within the tax revenue department.
While the direct revenue effect of personal income tax is estimated to be moderate, it will help
raise additional revenue through continued formalization of the economy. Additional tax revenue
can be expected by suspending the possibility to claim past VAT credits as stated in Decree 8279
of 2012.
Further reforms are needed to address the insufficiency of tax revenue to cover the public
provision of social services. Additional revenues, which are expected to come from the
introduction of personal income tax and the suspension of VAT credit against IMAGRO will not
be enough to provide fiscal resources to catch up with international peer countries in terms of the
public provision of social services. Section 2.5 provides a discussion of policy options which is
intended as a basis for further dialog on continuing the reform program.
2.2 The link between fiscal policy and macroeconomic volatility
The volatile macroeconomic environment impacts revenues and expenditures with both
variables being similarly volatile and expenditures mirroring the recent increase in overall
volatility. Measured by simple metrics as standard deviation or coefficient of variation, revenues
and expenditures show a similar degree of volatility. A significant drop in volatility in the third
quarter of 2004 can be observed when analyzing quarterly y-o-y changes of fiscal revenues with
the help of the methodology developed by Inclan and Tiao (1994) (Table Annex 1.2). The time
of the break in volatility coincides with the 2004 tax reform. In contrast, public consumption and
investment have become more volatile, with volatility of public consumption increasing twice in
the second quarter of 2000 and then again in the first quarter of 2009. Public investment
temporarily became less volatile between the second quarter of 2002 and the second quarter of
2008.
Table 2.7: Volatility of revenues and expenditures
Source: Central Bank of Paraguay
Total revenueTotal tax
revenuesExpenditures
Total
revenues
Total tax
revenuesExpenditures
1980-2012 10.3 9.4 12.2 4.3 6.9 4.4
Standard deviation of real growth rates Coefficient of variation of real growth rates
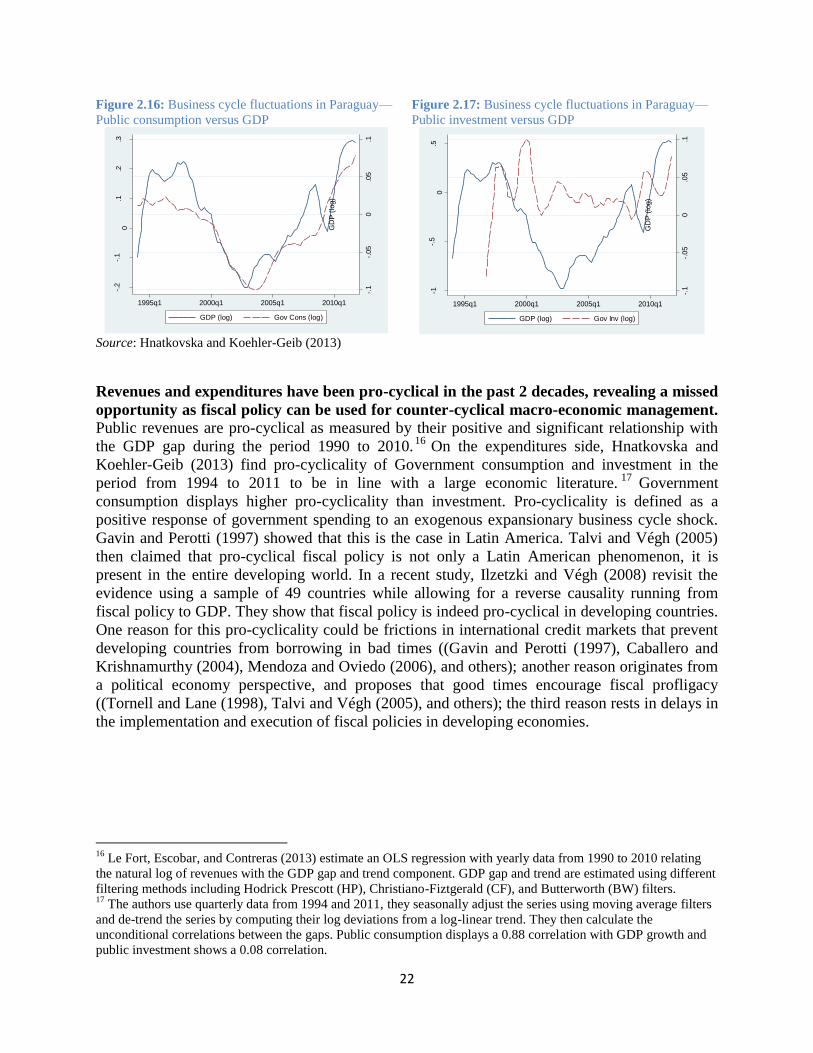
22
Revenues and expenditures have been pro-cyclical in the past 2 decades, revealing a missed
opportunity as fiscal policy can be used for counter-cyclical macro-economic management. Public revenues are pro-cyclical as measured by their positive and significant relationship with
the GDP gap during the period 1990 to 2010.16
On the expenditures side, Hnatkovska and
Koehler-Geib (2013) find pro-cyclicality of Government consumption and investment in the
period from 1994 to 2011 to be in line with a large economic literature.17
Government
consumption displays higher pro-cyclicality than investment. Pro-cyclicality is defined as a
positive response of government spending to an exogenous expansionary business cycle shock.
Gavin and Perotti (1997) showed that this is the case in Latin America. Talvi and Végh (2005)
then claimed that pro-cyclical fiscal policy is not only a Latin American phenomenon, it is
present in the entire developing world. In a recent study, Ilzetzki and Végh (2008) revisit the
evidence using a sample of 49 countries while allowing for a reverse causality running from
fiscal policy to GDP. They show that fiscal policy is indeed pro-cyclical in developing countries.
One reason for this pro-cyclicality could be frictions in international credit markets that prevent
developing countries from borrowing in bad times ((Gavin and Perotti (1997), Caballero and
Krishnamurthy (2004), Mendoza and Oviedo (2006), and others); another reason originates from
a political economy perspective, and proposes that good times encourage fiscal profligacy
((Tornell and Lane (1998), Talvi and Végh (2005), and others); the third reason rests in delays in
the implementation and execution of fiscal policies in developing economies.
16
Le Fort, Escobar, and Contreras (2013) estimate an OLS regression with yearly data from 1990 to 2010 relating
the natural log of revenues with the GDP gap and trend component. GDP gap and trend are estimated using different
filtering methods including Hodrick Prescott (HP), Christiano-Fiztgerald (CF), and Butterworth (BW) filters. 17
The authors use quarterly data from 1994 and 2011, they seasonally adjust the series using moving average filters
and de-trend the series by computing their log deviations from a log-linear trend. They then calculate the
unconditional correlations between the gaps. Public consumption displays a 0.88 correlation with GDP growth and
public investment shows a 0.08 correlation.
Figure 2.16: Business cycle fluctuations in Paraguay—
Public consumption versus GDP
Figure 2.17: Business cycle fluctuations in Paraguay—
Public investment versus GDP
Source: Hnatkovska and Koehler-Geib (2013)
-.2
-.1
0.1
.2.3
Gov C
ons (
log)
-.1
-.05
0.0
5.1
GD
P (
log)
1995q1 2000q1 2005q1 2010q1
GDP (log) Gov Cons (log)
-1-.
50
.5
Gov Inv (
log)
-.1
-.05
0.0
5.1
GD
P (
log)
1995q1 2000q1 2005q1 2010q1
GDP (log) Gov Inv (log)

23
Figure 2.18: Contribution of public and private demand components to real GDP growth
Source: Central Bank of Paraguay
Yet, while fiscal policies have appeared pro-cyclical over the past two decades, a look at the
data suggests that public demand was counter-cyclical during the contractions of 2009 and
2012. Public sector demand expanded when private demand—and as a consequence economic
growth—collapsed in the four quarters of 2009 (see Figure 2.18).18
The decomposition of real
growth into the components of aggregate demand reveals that public demand components
together contributed positively to real growth in the four quarters of 2009 while private demand
contracted heavily. The expansion of public demand was based on strong increases in both
public investment and consumption (see Figure 2.16). Public demand ceased to be anti-cyclical
by the first quarter of 2010, when it expanded at the same time as private demand was already
recovering strongly. Only in the third quarter of 2010 does public demand contribute negatively
amidst a fast private sector expansion. A similar pattern can be observed in 2012 with the same
challenge of withdrawing expansionary expenditure fast enough when private sector growth
recovers.
18
Public demand components comprise public consumption, public investment, and the share of the public sector in
imports and changes in inventories.
-15
-10
-5
0
5
10
15
20
200
1 Q
1
200
1 Q
3
200
2 Q
1
200
2 Q
3
200
3 Q
1
200
3 Q
3
200
4 Q
1
200
4 Q
3
200
5Q
1
200
5Q
3
200
6 Q
1
200
6 Q
3
200
7 Q
1
200
7 Q
3
200
8 Q
1
200
8 Q
3
200
9 Q
1
200
9 Q
3
201
0 Q
1
201
0 Q
3
201
1 Q
1
201
1 Q
3
201
2 Q
1
201
2 Q
3
Per
cen
t y
-o-y
rea
l g
row
th a
nd
per
cen
tag
e co
ntr
ibu
tio
n
Public demand Private Demand GDP growth

24
Figure 2.19: Public consumption and investment (quarterly y-o-y growth)
Source: Central Bank of Paraguay
If fiscal policy were to become more counter-cyclical, it would play an important role in
Paraguay, given that a shock to international commodity prices similar to that of 2009
would threaten growth and poverty reduction. Agricultural GDP in Paraguay has become
more volatile in recent years and together with the cattle, forestry and fishing sectors is
Paraguay’s most important sector (Table 2.2 and refer to World Bank (2013), forthcoming for an
in depth analysis of this phenomenon and its impact on the economy). The agricultural sector
focuses on few products and few export destinations: soy and beef alone made up an average of
34 percent of total exports over the past 5 years and exports to Brazil and Argentina alone
-60
-40
-20
0
20
40
60
80
100
120
200
8 Q
1
200
8 Q
2
200
8 Q
3
200
8 Q
4
200
9 Q
1
200
9 Q
2
200
9 Q
3
200
9 Q
4
201
0 Q
1
201
0 Q
2
201
0 Q
3
201
0 Q
4
201
1 Q
1
201
1 Q
2
201
1 Q
3
201
1 Q
4
201
2 Q
1
201
2 Q
2
201
2 Q
3
201
2 Q
4Per
cen
t q
ua
rter
ly y
-o-y
rea
l g
row
th
Public consumption Public Investment
Figure 2.20: Exports by product Table 2.8: Export by destination
Source: Central Bank of Paraguay
0
5
10
15
20
25
30
35
40
45
50
0
10
20
30
40
50
60
70
80
90
100
19
94
19
95
19
96
19
97
19
98
19
99
20
00
20
01
20
02
20
03
20
04
20
05
20
06
20
07
20
08
20
09
20
10
20
11
20
12
Per
cen
t of
GD
P
Per
cen
t of
tota
l ex
port
s
Other Grains
Beef Soy beans
Electricity Total in percent of GDP(RHS)
Argentina Brazil Uruguay
Total
MERCOSUR
Continental
China
Rest of the
World
average
since 200013 47 6 66 1 33
average
since 200811 37 1 49 1 50

25
reached almost 50 percent of total exports in the period since 2008. Any decrease in the world
export price of soy and beef, similar to that observed in 2009, would have strong negative effects
on the economy. A Computable General Equilibrium (CGE) model is used to track the macro
and micro economic effects that a 25 percent decrease in soy and beef prices in 2013 (maintained
through 2018) would have in Paraguay, (see Diaz-Bonilla and Cicowiez (2013)) for a detailed
description of the model, the base line scenario and simulation results). Any decrease in the
world export prices of soy and beef would result in slower GDP growth than under the baseline
scenario; accompanying negative impacts on the private sector (reduced employment growth,
reduced private consumption) means that poverty would decrease to 25.8 percent by 2018 and
not 24.5 percent as in the baseline simulation. Inequality and millennium development goals
would remain practically unchanged. If the price of all of Paraguay’s export products were to
drop, this would have a strong negative impact on the country’s progress towards the millennium
development goals and inequality, and given the persistent high levels of poverty and inequality
in Paraguay, such potential impacts would support the need for fiscal policy to buffer the effects
of any shift in international commodity prices.
The value of soy and beef exports has a positive and significant impact on fiscal revenues
and as such it is important to take commodity prices into account. A positive and significant
relationship can be established between soy and beef prices versus fiscal revenues, modeling the
relationship in a two-step approach. Favaro, Koehler-Geib, Picarelli, and Indaco (2013) find beef
and soybean exports respond strongly to prices (using the canonical Nerlove (1959) model), they
then find a positive and statistically significant relationship between tax revenue collection and
the value of exported beef and soybean. A caveat to the analysis at the first step is that due to
data restrictions export volumes instead of production volumes are used. The response in actual
production may be lower than the estimated elasticities in this approach. The result of the second
step is not trivial given the low direct taxation of the agricultural sector. The results seem to
indicate that the positive relationship is due to value added tax. Beef and soybean production
generate income that is spent inside Paraguay for the most part. Part of this expenditure generates
tax revenue via VAT and another part generates revenue through corporate income tax. The
elasticity of soy exports to price changes exceeds that of beef, which could be linked to the
limited time that soybean brokers have to hold the crop rather than commercialize it while there
is more room for timing decisions in the case of beef. When it comes to the relationship between
tax revenues versus soy and beef exports, the elasticity of revenues is higher in the case of beef.
This is in line with how much more labor intensive beef is than soy and how it is more integrated
into the value chain in Paraguay.19
While the strong reliance on indirect taxes has insulated fiscal revenues from
macroeconomic volatility to a certain extent, it comes at a high cost in terms of sufficiency
and equity of the tax system. One advantage of VAT tax collection vis-à-vis other tax revenues
is that it is has fluctuated less. In terms of the simple metrics of standard deviations and
coefficients of variation, real VAT tax collections were the most stable source of income over the
past 2 decades (Table 2.8). However, as discussed in section 2.1, collecting little in direct taxes
19
It seems to be important to take into account the indirect way in which commodity prices impact fiscal revenues,
in a cointegration analysis of fiscal revenues versus beef and soy prices with yearly data from 1990 to 2010, Le Fort
(2013) cannot detect a statistically significant relationship.

26
adds to the low tax-to-GDP ratio which is at the core of Paraguay’s challenge of low fiscal
resources that constrain spending on human development and growth-enhancing policies.
Moreover, as will be discussed in depth in Chapter 3, the cost in terms of the regressivity of the
tax system are high, a fact that prevents fiscal policy from more aggressively addressing the
persistent challenge of high poverty and levels of inequality.
Table 2.9: Volatility of different tax types (annual real growth)
Source: SITUFIN
This high reliance on indirect taxes is suboptimal given that alternative fiscal policy tools
are available to manage macroeconomic volatility. In section 2.4 policy options implemented
by other countries will be discussed including a fiscal responsibility law; the establishment of a
stabilization fund; and the strengthening of automatic stabilizers.
2.3 Expenditures
Even though Paraguay’s public expenditure has increased both in absolute terms and as a
percentage of GDP, it is low by international standards. Total public expenditure reached 20
percent of GDP in 2012, representing an increase of 5 percentage points since 2003 (Figure 2.1).
Yet, when Paraguay’s expenditure is compared with the average Latin American country; with
its peer group in terms of population and GDP per capita; or with lower middle income countries
over the past 5 years, Paraguay spends the least. This also is true when looking at figures from
2011.
The fiscal space for the expenditure increase has stemmed mainly from an increase in
revenue and a reduction in interest payments, a result of the significant reduction in public
debt. Fiscal space is measured as the flexible part of expenditure (that which remains after
interest payments, wages, pensions, and transfers to other Government entities are covered) over
total revenues. Fiscal prudence (as measured by this simple metric), together with solid growth
rates successfully reduced Paraguay’s public debt-to-GDP ratio from 41 percent in 2002 to 12
percent in 2012 (Figure 2.24). This has led to a significant decrease in interest payments. As a
1994-2012 1994-2004 2005-2012 1994-2012 1994-2004 2005-2012
Tax revenue 8.6 11.1 3.9 3.3 4.0 1.6
Income taxes 18.1 18.8 18.5 3.8 4.6 3.2
Import taxes 18.9 21.0 16.5 18.4 6.5 -8.3
Value added tax 8.0 9.7 4.6 2.1 4.0 0.8
Consumption tax 12.7 15.2 6.2 3.5 2.2 -6.0
Fuel 41.7 54.2 7.9 5.4 3.5 -2.8
Other goods 18.7 23.4 10.8 3.6 4.7 2.0
Other taxes 36.5 34.8 40.7 -14.1 77.0 -6.0
Non-tax revenue 11.8 13.4 10.1 6.2 5.6 8.2
Total Government Revenue 6.4 7.7 4.6 3.0 3.4 2.4
Coefficient of variationStandard deviation

27
result, Paraguay was the country with the lowest burden of interest as a percentage of GDP in
Latin America in 2011 (Figure 2.25).
The reduction in interest payments stem to a large extent from good debt management
practices, but three challenges remain to be addressed to sustain these past gains in the
future. First, while an implicit medium debt management strategy exists in the Ministry of
Finance, its legal formalization and the publication of annual borrowing plans would support the
predictability of public debt issuance in the domestic market and thereby increase demand.
Second, the fragmentation of debt management between the General Directorate of Public Credit
and Debt (DGCDP) and the Directorate of Debt Policy introduces frictions into the debt
management process. Third, in the absence of a strengthened legal framework and the promotion
of a more active domestic debt market, Paraguay remains dependent on international financing.
In particular, the improvement of the institutional structure for debt management and
establishing an effective debt management capacity is essential as a weak institutional structure
pose significant risks for the future.
Figure 2.21: Fiscal Space Figure 2.22: Public Expenditure in international
comparison (average 2007-2011)
Source: SITUFIN Source: IMF GFS
Figure 2.23: Paraguay’s public debt over time Figure 2.24: Interest expenditure in Latin America
Source: Central Bank of Paraguay Source: IMF GFS, 2011 or latest available
0
10
20
30
40
50
200
0
200
1
200
2
200
3
200
4
200
5
200
6
200
7
200
8
200
9
201
0
201
1
201
2
Per
cen
t
05
1015202530354045
Par
aguay
Boli
via
Bulg
aria
El
Sal
vad
or
Geo
rgia
Ho
ndu
ras
Jord
an
Nic
arag
ua
Ser
bia
Bra
zil
Uru
gu
ay
LM
IC
Per
cen
t o
f G
DP
0
5
10
15
20
25
30
35
40
45
19
91
19
92
19
93
19
94
19
95
19
96
19
97
19
98
19
99
20
00
20
01
20
02
20
03
20
04
20
05
20
06
20
07
20
08
20
09
20
10
20
11
20
12
Percen
t
External Debt/GDP Domestic Debt/GDP
0
2
4
6
8
10
12
Jam
aica
St. K
itts
an
d N
evis
Bra
zil
Bar
bad
os
Bel
ize
Trin
idad
an
d T
ob
ago
Bah
amas
, Th
e
Co
lom
bia
Uru
guay
St. V
ince
nt
and
th
e…
Gre
nad
a
Co
sta
Ric
a
El S
alva
do
r
Do
min
ican
Rep
ub
lic
Gu
atem
ala
Ho
nd
ura
s
Per
u
Nic
arag
ua
Ch
ile
Par
agu
ay
Pe
rcen
t o
f G
DP

28
The creation of fiscal space has also been at risk due to the unclear division of
responsibilities between the executive and the legislature in the budget approval.20 Unclear
responsibilities affect the budget preparation process and complicate planning. They have also
led to spending increases in the past. As described in detail in IMF (2009), the State Financial
Administration Law (LAFE) of 1999 and the annual budget law represent the legal framework
for the budget process. Despite Article 17 of the LAFE law, which establishes that Congress
cannot reallocate resources from capital to current spending and that it can only increase capital
spending after a proper identification of financing, Congress introduces substantial modifications
and increases to the executive budget proposal.21
Congress augments not only capital but also
current expenditure allocations, which are supposedly “financed” with unrealistic upward
revisions in revenue projections or by the authorization of improbable domestic debt issues. The
result is a budgetary process that neglects aggregate fiscal constraints and threatens
macroeconomic stability, misallocates resources, and makes the budget vulnerable to undue
influence by vested interests.
While some of the challenges in budget preparation and budget execution are being
addressed through the development of a Medium Term Fiscal Framework, further
improvements are needed.22 The Ministry of Finance has started to prepare a fiscal policy
report containing, three-year macroeconomic and fiscal projections. The first such report was
published jointly with the 2011 budget law. The ministry’s macro-fiscal unit is moving towards
preparing macro-fiscal projections, identifying contingent risks, and preparing reports on the
macro-fiscal outlook. The link between expenditures and the high level objectives defined in the
Government’s budget could be further strengthened by integrating the medium-term fiscal
framework into the budget, identifying and assessing fiscal risks and reporting them in budget
documents, and by further developing a medium-term expenditure framework.
In terms of functional classification, Paraguay spends most on education followed by public
administration and social security, and social protection. In 2012, expenditure on education
amounted to 21 percent of the budget; administration absorbed 19 percent and social security and
social protection 18. In contrast, health expenditure, with the steepest increase, has tripled since
2003, followed by justice (doubled) and education (increased by 64 percent). In 2003,
administration, followed by debt service, were the two biggest line items. These increases in
expenditure on education and health are very positive developments for Paraguay given
Paraguay’s history of low social expenditure.
Both health and education spending increased rapidly, however, while Paraguay caught up
with many international comparators on health spending this was not the case for
education. Per capita public spending on education increased at an average annual rate of 17
percent, while per capita health expenditure rose by an average of 22 percent every year between
2003 and 2011. In the same period, coverage of key education and health services improved
20
This paragraph draws on IMF (2009), chapter 9. 21
From a legal point of view, Paraguay does not have higher-ranking laws or organic laws to regulate the budget
process. The LAFE is an ordinary law, and congress has interpreted that to mean that it can be modified by another
ordinary law such as the annual budget law. The LAFE (a permanent law) should have higher hierarchy than the
annual budget law (a transitory law), in which case the executive branch could challenge the legality of congress’s
budget amendments in the courts. 22
See IMF (2011) for more details.

29
markedly. It is important to note though that a large share of the spending increase has been on
public sector wages. Paraguay has caught up with comparator countries in terms of health
spending relative to GDP, but this is not the case for overall social spending and in education for
example, where Paraguay spends less than comparator countries (Figures 1.11, 2.26, and 2.27).
Figure 2.25: Functional classification
Source: BOOST database
Figure 2.26: Education expenditure in international
comparison (average 2007-2011)
Figure 2.27: Health expenditure in international
comparison
Source: GFS
When it comes to economic classification, the most notable feature of Paraguay’s spending
is the high share of spending on wages. The share of wage spending of the total budget
increased from 38 percent in 2003 to 44 percent in 2012. The biggest increase occurred between
0
0.5
1
1.5
2
2.5
3
3.5
4
4.5
5
Ed
uca
tion
& C
ult
ure
Ad
min
istr
atio
n
So
cial
Sec
uri
ty &
pro
tect
ion
Hea
lth &
san
itat
ion
Def
ense
& n
atio
nal
sec
uri
ty
Just
ice
Deb
t se
rvic
e
Oth
ers
Tra
nsp
ort
En
erg
y &
Min
ing
Com
unic
atio
ns
Reg
ula
tio
n
Per
cen
t o
f G
DP
2003 2006 2009 2012
0123456789
Par
aguay
Boli
via
Bulg
aria
El
Sal
vad
or
Geo
rgia
Nic
arag
ua
Ser
bia
Arg
enti
na
Bra
zil
LA
C
LM
IC
Per
cen
t o
f G
DP
0
1
2
3
4
5
6
7
Par
aguay
Boli
via
Bulg
aria
El
Sal
vad
or
Geo
rgia
Ho
ndu
ras
Jord
an
Nic
arag
ua
Pap
ua
New
…
Ser
bia
Tu
rkm
enis
tan
Arg
enti
na
Bra
zil
Uru
gu
ay
LM
IC
LA
C
Per
cen
t o
f G
DP
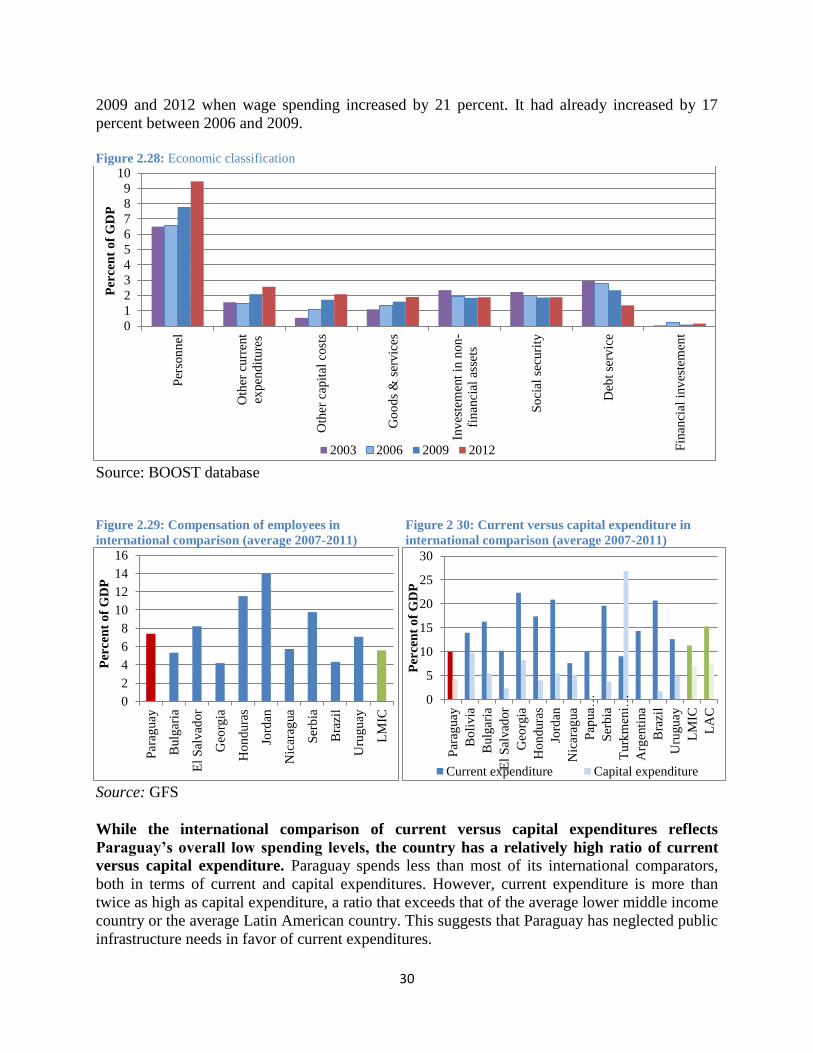
30
2009 and 2012 when wage spending increased by 21 percent. It had already increased by 17
percent between 2006 and 2009.
Figure 2.28: Economic classification
Source: BOOST database
While the international comparison of current versus capital expenditures reflects
Paraguay’s overall low spending levels, the country has a relatively high ratio of current
versus capital expenditure. Paraguay spends less than most of its international comparators,
both in terms of current and capital expenditures. However, current expenditure is more than
twice as high as capital expenditure, a ratio that exceeds that of the average lower middle income
country or the average Latin American country. This suggests that Paraguay has neglected public
infrastructure needs in favor of current expenditures.
0
1
2
3
4
5
6
7
8
9
10P
erso
nn
el
Oth
er c
urr
ent
expen
dit
ure
s
Oth
er c
apit
al c
ost
s
Go
ods
& s
erv
ices
Inv
este
men
t in
non
-
fin
anci
al a
sset
s
So
cial
sec
uri
ty
Deb
t se
rvic
e
Fin
anci
al i
nv
este
men
t
Per
cen
t o
f G
DP
2003 2006 2009 2012
Figure 2.29: Compensation of employees in
international comparison (average 2007-2011)
Figure 2 30: Current versus capital expenditure in
international comparison (average 2007-2011)
Source: GFS
0
2
4
6
8
10
12
14
16
Par
aguay
Bulg
aria
El
Sal
vad
or
Geo
rgia
Ho
ndu
ras
Jord
an
Nic
arag
ua
Ser
bia
Bra
zil
Uru
gu
ay
LM
IC
Per
cen
t o
f G
DP
0
5
10
15
20
25
30
Par
aguay
Boli
via
Bulg
aria
El
Sal
vad
or
Geo
rgia
Ho
ndu
ras
Jord
an
Nic
arag
ua
Pap
ua…
Ser
bia
Tu
rkm
eni…
Arg
enti
na
Bra
zil
Uru
gu
ay
LM
IC
LA
C
Per
cen
t o
f G
DP
Current expenditure Capital expenditure

31
In light of the recent worsening of the fiscal stance, it is important to consider fiscal
prudence a continuous task. Only if the Government is able to sustain fiscal prudence in the
future, will it be able to maintain macroeconomic stabilization and performance. After 8 years of
fiscal surpluses, the government recorded its first 12-month accumulated overall fiscal deficit in
May 2012. In the fourth quarter of 2012 the fiscal deficit was nearly 3.5 times higher than in
December 2011. Yet, in terms of GDP fiscal deficits remain moderate: in 2012, the fiscal deficit
amounted to 1.7 percent of GDP, compared with a surplus of 0.7 percent of GDP in 2011.
Following expansionary fiscal policy in 2012 due to fiscal stimulus and increased spending
in the run-up to the 2013 election, an immediate return to a tighter fiscal stance would be
critical to demonstrate the commitment to fiscal prudence. Following a bad harvest and poor
economic prospects at the beginning of 2012, the government relied on its Plan de aumento de la
inversion y el consumo with a more expansionary fiscal policy to stimulate the economy. The
run-up to the April 2013 presidential election also led to higher spending. In terms of GDP, as of
December 2012, wages and salaries increased by 26 percent; capital expenditure increased by 20
percent.
2.4 Policy options
The findings of the previous sections suggest a number of measures that could increase
revenue from tax collection and could help the tax system contribute more to the reduction
of poverty and inequality. The following recommendations draw on the technical analysis and
also take into considerations institutional and other constraints that, as history has shown, present
obstacles to improvements in the country’s tax system.
In order to ensure that the agricultural sector is adequately taxed, the government could
consider making some changes to the IMAGRO. The introduction of a new IMAGRO as part
of the 2004 reforms was an important step towards incorporating the agricultural sector into the
tax base; and the phasing out of the VAT credit contributed to improved collections. However, a
number of additional measures would be important to make the tax more effective. These
include: (i) eliminating special regimes for large and medium enterprises; (ii) establishing an
obligation for all taxpayers (excluding small farms of less than 20 hectares in the eastern part of
the country and less than 100 hectares in the western part) to liquidate tax through the general
mechanism of gross income minus production costs; (iii) eliminating the exemption for losses in
cattle, currently at up to 3 percent of total income, without proof; (iv) eliminating deductions for
personal expenditures and investments; and (v) eliminating deductions for expenditures on
neighboring farms.
The most important gains from reducing exemptions would stem from changes to value
added tax. The analysis in this chapter shows that even though VAT productivity is high, there
are significant tax exemptions that create distortions and reduce revenue collections. The
following measured could be considered by the government: (i) elimination of the suspension of
VAT applied to petrol imports; (ii) elimination of all cases where a reduced VAT rate of 5
percent is applied, a uniform rate of 10 percent would be used as envisaged during the 2004
reform. This could be realized by gradually increasing the rate to 7.5 percent in the first year and

32
to 10 percent in the second year; (iii) elimination of the exemption of sales of the agricultural
sector and gradually increase the rate to 10 percent over a three year period; (iv) elimination of
exemption of paid interests.
Reforms of the IRACIS could also contribute to an increase in tax revenues. Despite the
lowering of the tax rate, revenue from the IRACIS has increased five-fold between 2003 and
2011; it now contributes 19 percent of total tax revenue, up from 17 percent in 2003. Revenue
could be further increased by replacing the 1 percent tax for exporters (Maquila regime) and
treating profits equally across corporations. In addition, the government could consider
eliminating the benefits of law 60/90 on dividends and profits and interest exemptions.
Any gains from the reduction of exemptions could be used to expand targeted social
interventions. An argument in favor of the exemption of sales in the agricultural sector is that
these are basic consumer goods and the exemption therefore benefits the poor. As pointed out in
Diaz-Bonilla and Cicowiez (2013), the elimination of VAT exemptions for agricultural goods
may indeed produce a negative impact on the incidence of poverty. It is also well established,
however that exemptions benefit the rich as well as the poor, the former may benefit even more
due to higher levels of consumption. In many cases, eliminating exemptions can have a positive
effect on the equalizing properties of the tax system. As is demonstrated with the help of the
CGE model for Paraguay, if the additional fiscal resources gained through the elimination of
expenditures are invested into expanding CCT programs, poverty and inequality reduction would
in fact be accelerated.
Reforms to the personal income tax and the property tax could contribute to higher tax
revenues and could potentially reduce the regressivity of the tax system. The personal
income tax does not currently generate much revenue, due to its design as a tool to strengthen
VAT compliance. However, it could be improved significantly by (i) eliminating the exemptions
for pensions, interest, and foreign exchange gains; and by creating final withholding taxes on
interest paid by the financial system and on dividends on the personal income tax. As for the
property tax, the challenge is to ensure that property valuations reflect actual market conditions.
Basing the taxation of property on market valuation as opposed to fiscal valuation would make
the tax more effective, promote better land use, and increase municipal revenue to enhance
accountability and reduce dependency on central government transfers.23
The following policy options could help increase the counter-cyclicality of fiscal policy and
to improve the management of macroeconomic volatility: (i) Introduce a fiscal responsibility
law and move towards fiscal management with the help of a fiscal rule. This approach is by no
means perfect and has a number of advantages and disadvantages. However, it could prove
useful if country-specific conditions are taken into account. (ii) Introduce a stabilization fund to
ensure public expenditure levels during any downturn. For resource-rich countries, stabilization
funds are designed to guard against volatility in international markets. When revenues and prices
are high, payments are made into the stabilization fund and diverted from expenditures. When
revenues are lower than expected, payments are made from the fund to the budget, avoiding
reductions in expenditure. Stabilization funds aim to reduce the impact of volatile revenue on the
government and on the economy. Country examples include Chile, Mexico, Norway. (iii)
23
See World Bank (2007).

33
Strengthen automatic stabilizers such as unemployment insurance and other social protection
measures. (iv) Expand existing transfer programs to cover a higher share of the poor and the
extreme poor, and increase transfers. This would be an important step in Paraguay to mitigate the
impact on the poor. To date only a small share of the poor is covered through the cash transfer
programs and hence is exposed to the risks. (For details refer to section 3.4).
In terms of debt management, the following policy options could be considered: (i)
institutionalizing the formulation of a medium-term debt management strategy through the
approval of the strategy as a Ministerial decree and its submission to Congress as part of the
annual budget process; (ii) creating one debt management office with clearly defined
responsibilities. A second best solution is to keep the back office with the General Directorate of
Public Credit and Debt (DGCDP) in the Subsecretaría de Estado de Administración Financiera
(SSEAF) while the front and middle office stay with Directorate of Debt Policy (DPE) in the
Subsecretaría de Estado de Economía e Integración (SSEEI)24
; and (iii) strengthening of the
domestic debt market. For details refer to IMF and World Bank (2012).
Finally, weaknesses in the budget process could be addressed with the following
measures:25
(i) strengthening the legal framework for the budget by spelling out the roles and
responsibilities of the three government branches on budget matters to ensure sustainability and
higher accountability of fiscal policy. This could be done by amending the LAFE. Ideally, the
LAFE would also be granted higher legal hierarchy than the annual budget law; and (ii)
consensus among the executive and legislative branches on possible mechanisms to define
binding and sustainable fiscal policy objectives. One possible mechanism could involve setting
up a two-stage process of budget approval, where Congress first agrees on the expenditure
envelope before voting on specific appropriations. This approach is used in a number of
industrialized countries—France, Italy, Spain, Sweden, and the United States—and in emerging
economies such as Brazil, Colombia, Mexico, Poland, and the Czech Republic. Another
mechanism would be to specify that every expenditure-increasing change introduced by congress
is accompanied by specific and credible revenue increases (balanced-budget power), and to
publish as an attachment to the approved budget all the changes introduced in the process of
legislative approval.
24
This topic was discussed in detail in World Bank and IMF (2010), pp 11-13 this is a second best solution
compared to having a consolidated debt management office. See also “Strengthening government debt and cash
management” IMF report, March 2012. 25
This Paragraph draws on IMF (2009) chapter 9.
34
Chapter 3: Fiscal policy, poverty reduction and shared prosperity
One of the reasons for limited poverty reduction in the past 15 years is that Paraguay’s fiscal
policy contributes much less to poverty reduction and shared prosperity than fiscal policy in
other countries in Latin America. It does not effectively contribute to improving the equity of
opportunity either. The overall tax system is regressive and social spending is not as progressive
as in Latin American comparator countries. Fiscal policy could become a more effective tool if
taxes were less regressive (less dependence on indirect taxes, more on progressive direct taxes),
a greater share of the extreme poor was covered by direct transfers and received higher benefits;
and if spending on health and education was better targeted towards those households with
fewer opportunities.
As discussed in Chapter 1, Paraguay has made some progress in the reduction of poverty and
inequality in recent years, which has helped reverse the negative effects of the crisis. However,
longer term trends in the reduction of poverty and inequality are weak and present a key public
policy challenge. Among other negative effects, the literature shows that higher inequality is
associated with higher poverty. Poverty, in turn, has been shown to negatively affect growth.26
Beyond the economic arguments for a reduction in inequality and poverty, there tends to be a
perception of inequality as an issue of fairness: in fact, 80 percent of Paraguayans believe that
the distribution of income in their country is unjust.27
This chapter examines the extent to which Paraguay’s fiscal policy is an effective tool for
reducing poverty and inequality. Fiscal policy impacts poverty and inequality in several ways.
Redistribution through taxes and social expenditures affects household income. The expenditure
side of fiscal policy also affects the equity of opportunity, by determining to what extent access to
basic social services is provided equitably irrespective of circumstances beyond a person’s
control. This chapter examines different aspects of the linkage between fiscal policy and the
reduction of poverty and inequality and is organized as follows: Section 3.1 will analyze the role
of fiscal policy with respect to income redistribution, and Section 3.2 will analyze the same with
respect to the equity of opportunity. Section 3.3 will examine the incidence and progressivity of
fiscal policy. The chapter concludes with recommendations on how to make fiscal policy a more
effective tool in the fight against poverty and inequality in Paraguay.
3.1 Fiscal policy and income redistribution
The nature of Paraguay’s fiscal system represents important limitations for the scope of
fiscal redistribution and basic service delivery. Tax collections have increased from 9.4
percent of GDP in 2000 to 12.3 percent in 2012, but remain among the lowest in Latin America.
Revenue from direct taxes, which represent the main instrument of redistribution in most
countries, is very limited, not least because there was no personal income tax in effect until 2012.
The tax system is therefore heavily skewed towards indirect taxes (especially the VAT), which
tend to be regressive. On the expenditure side, the scope for redistribution is limited by the
overall small government budget, with total annual expenditures reaching 16 percent of GDP on
average between 2000 and 2012. Even though public spending on the social sectors has
26
Goñi et al (2010). 27
Latinobarometro 2010

35
increased its share in total public spending significantly since 2003 (Figure 3.1), it remains below
the Latin American and Caribbean average as a share of GDP: average public expenditure on
education has been around 4.1 percent of GDP per year and on health 3.4 percent. As a result,
Paraguay spends less on social sectors as a share of GDP than comparator countries and the LAC
average (Figure 3.2).
Figure 3.1: Public expenditure on health and education (%
of total public expenditure) Figure 3.2: Public social spending in Paraguay and
comparator countries (2009-11; % of GDP)
Source: BOOST database Source: CEPAL
The breakdown of household income into different concepts makes it possible to assess the
effects of fiscal policy instruments on inequality and poverty. Lustig et al (2012) use five
“stages” of household income in relation to taxes and transfers. Market income includes wages
and salaries as well as capital and transfer income, prior to any taxes. Net market income is
market income minus direct taxes, primarily local and regional taxes as reported in the EPH
household survey. Disposable income is net market income minus direct transfers, which
includes CCT program benefits. Post-fiscal income is disposable income minus indirect taxes
(VAT and combustibles tax) and indirect subsidies (social tariff for electricity). Final income is
post-fiscal income minus user fees and co-payments (as reported in the EPH) as well as in-kind
transfers (public spending on education and health). At each stage, the analysis conducted by
Lustig et al (2012) re-calculates the Gini coefficient and poverty incidence, which allows for a
disaggregated analysis of the impact of different fiscal policy instruments on household income.
The analysis shows that, in comparison with other Latin American countries,28
fiscal policy
in Paraguay has a limited effect on inequality. The Gini coefficient for market income, i.e.
before fiscal policy, in Paraguay is 0.50, placing it at the lower end of the sample of Latin
American countries analyzed (Argentina, Bolivia, Brazil, Guatemala, Mexico, Paraguay, Peru,
and Uruguay) in terms of inequality before government intervention. However, direct taxes and
transfers reduce the Gini coefficient by less than one percent, and indirect taxes reverse this
progress: the post-fiscal income Gini coefficient is slightly higher than the market income Gini.
28
The comparisons with other countries come from country studies in the Commitment to Equity (CEQ) project.
These studies are synthesized in Lustig and Pessino (2013) for Argentina, Paz et al. (2013) for Bolivia, Higgins and
Pereira (2013) for Brazil, Morán and Cabrera (2012) for Guatemala, Scott (2013) for Mexico, Jaramillo (2013) for
Brazil, and Bucheli et al. (2013) for Uruguay.
0
2
4
6
8
10
12
14
16
2003 2004 2005 2006 2007 2008 2009 2010 2011 2012
Education Health
0
5
10
15
20
25
30
Arg
en
tin
a
Bu
lgari
a
Bra
zil
Uru
gu
ay
Bo
liv
ia
Serb
ia
El
Salv
ador
Nic
ara
gu
a
Ho
nd
ura
s
Para
gu
ay
LAC average

36
Education and health spending are equalizing, but their effect is also limited compared to other
counties. In terms of final income, Paraguay is the most unequal country of the sample, with a
Gini coefficient of 0.48. From market income to final income, Paraguay only reduces inequality
by 4.1 percent, which is less than all other countries in our sample: Guatemala reduces inequality
by 5.2 percent, Peru by 7.6 percent, Bolivia by 12.4 percent, Mexico by 15.9 percent, Uruguay
by 20.2 percent, Brazil by 24.1 percent, and Argentina by 25.2 percent (Figure 3.3).
However, this positive effect on inequality depends to some extent on whether pensions are
treated as transfers in the analysis. Contributory pensions and non-contributory pensions29
are
counted as part of market income in the benchmark case (discussed above) but considered a
government transfer in the sensitivity analysis. Figure 3.4 presents the evolution of inequality
across income concepts in the benchmark case and in the sensitivity analysis. Because pensions
are unequalizing in Paraguay, and because they are large compared to other transfers, how they
are treated changes the qualitative assessment of direct transfers. When they are not included in
government transfers (the benchmark case), overall direct transfers are equalizing and the
disposable income Gini coefficient is lower than the market income coefficient. When they are
instead considered a government transfer (the sensitivity analysis), overall direct transfers are
29 The latter could not be separated from contributory pensions in the survey or by using program rules.
Figure 3.3: Gini coefficient for each income concept in Argentina, Bolivia, Brazil, Guatemala, Mexico, Paraguay,
Peru and Uruguay
Note: The Ginis in this figure correspond to the benchmark case.
Source: For Paraguay, authors’ calculations using Encuesta Permanente de Hogares (2010) and National Accounts.
For Argentina, Lustig and Pessino (2013); for Bolivia, Paz et al. (2013); for Brazil, Higgins and Pereira (2013); for
Guatemala, Morán and Cabrera (2013); for Mexico, Scott (2013); for Peru, Jaramillo (2013); for Uruguay, Bucheli
et al. (2013).
0.360
0.410
0.460
0.510
0.560
Market Income Net Market Income Disposable Income Post-fiscal Income Final Income
Gin
i
Argentina
Bolivia
Brazil
Guatemala
Mexico
Paraguay
Peru
Uruguay

37
unequalizing, with the Gini coefficient of disposable income being higher than that of market
income.
Figure 3.4: Inequality in Paraguay (2010) – benchmark vs. sensitivity analysis
Source: Lustig et al. (2012)
Fiscal policy instruments such as taxes and transfer have a net negative impact on the
poverty headcount index. Taxes have a relatively large negative impact on poverty: a
significant number of the near-poor pay enough direct taxes to make them poor.30
The headcount
index for net market income using the US$4 PPP per day poverty line, at 28.3 percent, is over
one percentage point higher than the market income headcount index. This is unique to Paraguay
among countries in the sample: the others have much smaller increases in poverty caused by
direct taxes. This finding is particularly striking given that until 2012, Paraguay did not have a
personal income tax and direct taxes only account for 2.6 percent of GDP (equivalent to 21
percent of total tax revenue). Furthermore, direct transfers do not fully offset the negative impact
of taxes because of their limited reach and small size: post-fiscal income poverty is higher than
market income poverty using both the US$2.50 and US$4 PPP per day poverty lines (Table 3.1).
Table 3.1: Taxes, transfers, inequality and poverty in Paraguay (2010) - benchmark
Indicator Market
Income
Net
Market
Income
Disposable
Income
Post-
fiscal
Income
Final
Income
Gini 0.500 0.499 0.495 0.502 0.480
Headcount index at US$2.5
PPP/day
14.6% 14.9% 14.4% 16.2%
Headcount index at US$4
PPP/day
27.2% 28.3% 28.0% 30.1%
Source: Lustig et al (2012)
30
Direct taxes include property taxes, municipal taxes, and other taxes, and are asked directly in the survey.
Paraguay did not have a federal income tax at the time of the survey.
0.480
0.485
0.490
0.495
0.500
0.505
Market
Income
Net Market
Income
Disposable
Income
Post-Fiscal
Income
Gin
i
Benchmark Case
Sensitivity Analysis

38
This is partly because the poor pay a large share of their income on taxes. Although the rich
pay a higher proportion of their income in direct taxes than the poor, all deciles pay between one
and five percent of their income in direct taxes. This explains why net market income inequality
is barely lower than market income inequality, and why net market income poverty is
substantially higher. In most countries, the poorest deciles pay essentially none of their income in
direct taxes. Indirect taxes are even more detrimental to the poor: the poorest decile spends 28
percent of its income, on average, on indirect taxes (VAT and combustibles tax), compared to
6.3 percent in Mexico and 6.6 percent in Peru..31
In addition, transfers in Paraguay do not increase the income of the poor by as much as
they do in other countries. Direct transfers, indirect subsidies, and in-kind transfers in the form
of free education and health services all benefit individuals in the poorer deciles more than those
in richer deciles. However, when compared to other countries in Latin America, the percentage
increase in income for the poor from these transfers is low. For example, individuals in the
poorest decile experience an income increase of 6 percent, on average, from the CCT Tekoporã.
Although this figure is similar to the increase experienced by the poorest decile from CCTs in
Bolivia in Peru, it is much lower than the increase in other countries: in Brazil, Bolsa Família
increases the incomes of the poorest decile by 29 percent on average.32
Furthermore, it is far
below the 72 percent increase in income that the extreme poor would need, on average, to be
lifted out of extreme poverty. This is because the size of the benefit is small in Paraguay: an
extremely poor individual whose household benefits from at least one direct transfer program
receives, on average, just US$0.38 PPP per day in household per capita terms. In many cases,
this transfer will not be enough to raise the household above the US$2.50 PPP per day extreme
poverty line.
While direct transfers are well targeted, a significant share of the poor is not covered. 47
percent of direct transfers in Paraguay reach the extreme poor (those living on less than US$2.50
PPP per day, in terms of household per capita market income), which is among the highest of the
countries analyzed. Furthermore, 68 percent of direct transfers reach the moderate or extreme
poor (those living on less than US$4 PPP per day), again among the highest of the countries
analyzed. 85 percent of beneficiaries are moderately or extremely poor in Paraguay, making
direct transfers more pro-poor by this metric than in any other country (Figure 3.5). However,
just 24 percent of the extreme poor are beneficiaries of direct transfer programs in Paraguay.
This proportion is significantly lower than in any other country analyzed here. Furthermore, just
39 percent of the total poor (extreme plus moderate) are beneficiaries of direct transfer programs,
which is a lower proportion than in all of the other countries except Guatemala (Figure 3.6).
As a result, all income deciles, including the poorest, are net contributors to the fiscal
system. Considering only direct taxes and direct transfers, individuals become net payers to the
fiscal system in the second decile on average. This means that many poor individuals are paying
more in direct taxes than they receive in direct benefits, which further impoverishes them despite
the fact that they may already be unable to buy a basket of basic needs. In other countries, the
poorest three deciles are always net recipients from the fiscal system when only direct taxes and
direct transfers are taken into account: the poorest decile that is a net payer ranges from the
31 One reason why indirect taxes as a share of income are so high is that indirect taxes are computed using
consumption data, which for the poorest decile is higher than income. 32 Higgins and Pereira (2013).

39
fourth decile (Mexico) to the tenth (Brazil). When indirect taxes are taken into account, all
deciles are net payers to the fiscal system, on average, in Paraguay. This is the only country in
the sample where this occurs: in the other countries, the poorest decile that is a net payer to the
fiscal system including indirect taxes is usually the third or fourth decile.
Figure 3.5: Percent of direct transfer beneficiaries who are poor in Argentina, Bolivia, Brazil, Guatemala, Mexico,
Paraguay, Peru and Uruguay
Note: The extreme poor have household per capita market income below $2.50 PPP per day. The moderate poor
have household per capita market income between $2.50 PPP per day and $4 PPP per day.
Source: For Paraguay, authors’ calculations using Encuesta Permanente de Hogares (2010) and National Accounts;
for Argentina, Lustig and Pessino (2013); for Bolivia, Paz et al. (2013); for Brazil, Higgins and Pereira (2013); for
Guatemala, Morán and Cabrera (2013); for Mexico, Scott (2013); for Peru, Jaramillo (2013); for Uruguay, Bucheli
et al. (2013).
Figure 3.6: Percent of poor receiving at least one direct transfer
27.2% 23.3% 32.5%
46.6%
17.2% 27.2%
34.4%
11.7%
15.5% 14.6%
18.8%
20.6%
11.7%
57.9%
22.2%
14.1%
57.3% 62.1% 48.7%
32.7%
71.1%
14.8%
43.5%
74.2%
0%
10%
20%
30%
40%
50%
60%
70%
80%
90%
100%
Arg
enti
na
Bo
livia
Bra
zil
Guat
emal
a
Mex
ico
Par
aguay
Per
u
Uru
guay
Non-poor
Moderate Poor
Extreme Poor

40
Note: The extreme poor have household per capita market income below $2.50 PPP per day. The moderate poor
have household per capita market income between $2.50 PPP per day and $4 PPP per day.
Source: For Paraguay, authors’ calculations using Encuesta Permanente de Hogares (2010) and National Accounts;
for Argentina, Lustig and Pessino (2013); for Bolivia, Paz et al. (2013); for Brazil, Higgins and Pereira (2013); for
Guatemala, Morán and Cabrera (2013); for Mexico, Scott (2013); for Peru, Jaramillo (2013); for Uruguay, Bucheli
et al. (2013).
Despite the limited effect of its fiscal policy on inequality, Paraguay is more effective at
reducing inequality than a number of other countries. The effectiveness indicator is defined
as the effect on inequality or the effect on poverty of the transfers being analyzed divided by
their relative size.33
Given Paraguay’s low spending, although it always has the lowest or second
lowest reduction in inequality among the eight countries analyzed, it is not always the least
effective. Its redistributive effectiveness indicator for disposable income is higher than that of
Bolivia and Brazil (two high-spending countries that accomplish low reduction relative to the
amount they spend). Its redistributive effectiveness indicator for final income is higher than
Bolivia and Brazil, and similar to two small-government countries that achieve low inequality
reductions given the amount they spend: Mexico and Peru. In other words, although Paraguay is
the worst performer in terms of reducing inequality, when both direct and in-kind benefits are
considered, the country performs in the middle of the pack in terms of the efficiency of each
dollar spent at reducing inequality.
33
For direct transfers, the effectiveness indicator is the proportional fall between the net market income and
disposable income Ginis, divided by the size of direct transfers as a percent of GDP. Although the size of direct
transfers is measured by budget size according to national accounts, only direct transfer programs that are captured
by the survey (or otherwise estimated by the authors) are included, since they are the only programs that can lead to
an observed change in income.33
For direct and in-kind transfers, the effectiveness indicator is the proportional fall
between the net market income and final income Ginis, divided by the size of the sum of direct transfers, education
spending, and health spending as a percent of GDP.
92% 88% 93%
45%
74%
24%
58%
97%
87% 86% 85%
36%
65%
39% 50%
95%
0.0%
10.0%
20.0%
30.0%
40.0%
50.0%
60.0%
70.0%
80.0%
90.0%
100.0%
Arg
enti
na
Bo
livia
Bra
zil
Guat
emal
a
Mex
ico
Par
aguay
Per
u
Uru
guay
Extreme Poor
Moderate orExtreme Poor

41
However, fiscal policy in Paraguay is relatively ineffective at reducing poverty. Paraguay
performs worse than the seven other countries in terms of poverty reduction, and it also has a low
effectiveness of every dollar it spends (the lowest at the US$4 PPP per day poverty line and
third-lowest at US$2.50 PPP per day).
3.2 Fiscal policy and equity of opportunity
Another way to assess to what extent fiscal policy contributes to greater equity is to focus
on the equity of opportunity. An analysis of a sample of Latin American countries (which did
not include Paraguay) found that between one-fifth and one-third of total income inequality is
explained by the inequity in opportunity, i.e. access to public services.34
Equity of opportunity is
also important because it can determine future poverty and inequality, by providing the children
of the current poor with the opportunity to unshackle themselves from circumstances such as
their region of birth and residence and parents’ educational attainments and socioeconomic
status, which may limit their ability to realize their full potential in life. These limitations on
potential could take the form of barriers to education up to a certain level, the inability to work in
an occupation befitting their level of human capital, or simply restrictions on the ability to
migrate to search for better economic opportunities.
The Human Opportunity Index (HOI) offers an alternative to the traditional concept of
income inequality. The HOI measures how far a society is from universal provision of basic
services and goods, such as sanitation, clean water and education, and the extent to which those
goods and services are unevenly distributed.35
A key feature of the HOI is that it not only takes
into account the overall coverage rates of these services, but also how equally the coverage is
distributed—by measuring the extent to which those without coverage are concentrated in groups
with particular circumstances (for example, economic status, gender, parental education,
ethnicity, and so on), the conditions into which a child is typically born. More specifically, HOI
is an inequity-sensitive coverage rate that incorporates: (i) the average coverage of a good or
service that society accepts should be universal (which implies that the individual is not held
responsible for lack of access) and (ii) whether it is allocated according to an equity of
opportunity principle.
Paraguay performs below the LAC average in terms of ensuring equity of opportunity, but
has improved faster than other countries. In 2010, Paraguay ranked 12th
out of 18 Latin
American countries in the overall HOI, which shows that there is much space for improvement
(Figure 3.7). An opportunity where Paraguay ranks particularly low is access to public sanitation
(18th
out of 18 countries). However, the pace of improvement is faster in Paraguay than in many
other countries in the region: between 1995 and 2010, Paraguay’s HOI improved by 1.1
percentage points per year, compared to 1 percentage points for the LAC region.
34
Paes de Barro et al. (2009). 35
This discussion draws from three sources: Barros et al. (2009) and Molinas et al. (2010).

42
Figure 3.7: HOI for Latin American Countries (proj. 2010)
Source: Molina et al (2010)
Coverage of basic social services and equity of opportunity have been improving in line
with increased spending. In line with the increase in the share of the budget dedicated to the
social sectors, coverage of key education and health services improved markedly. Between 2003
and 2010, coverage of all basic services improved, albeit at different speeds (Figure 3.8).
Similarly, opportunities also improved, most notably preschool attendance, on time completion
of sixth grade and completion of ninth grade. However, some opportunities experienced
significant fluctuations, such as attending pre-school, starting first grade on time and finishing
sixth grade on time. In fact, there does not appear to be a clear relationship between initial
opportunity gaps and subsequent trends in education opportunities. In the case of health
opportunities and access to water and electricity, the gap between coverage and the respective
HOI has shrunk over time, while the gap for sanitation access has not changed much.
0 20 40 60 80 100
Nicaragua
Honduras
Guatemala
El Salvador
Panama
Peru
Paraguay
Rep. Dominicana
Brazil
Ecuador
Colombia
Jamaica
Mexico
Venezuela
Costa Rica
Argentina
Uruguay
Chile
LAC Average (73)
71

43
Figure 3.8: Change in the HOI and coverage
(a) Attend school (age 5-17) (b) Finish 9th
grade
(c) Access to health care (age 0-17) (d) Access to safe sanitation (age 0-17)
Source: Cuesta and Suárez Becerra (2013).
In fact, much of the improvement in the HOI between 2003 and 2010 is due to the overall
improvement in circumstances of the population and the expansion in coverage. Changes in
HOI between 2003 and 2010 are decomposed into three effects: (i) composition - changes in the
distribution of circumstances in the population; (ii) scale - changes in coverage; and (iii)
equalization - changes in the distribution of disparities across groups. The decomposition
analysis confirms two important results with regard to access inequalities. First, the equalization
effect is typically a positive contributor to increasing the HOI across opportunities. This implies
that there has been an overall reduction in access disparities across circumstance groups for most
opportunities. Second, the contribution of equalization effects is much smaller than scale and
composition effects. Equalization explains only between 1 and 25 percent of the HOI inter
temporal changes. This implies that there is still a lot of room for equalizing policies to
effectively reduce disparities across groups for most opportunities analyzed in Paraguay.
This also means that inequity of opportunity is particularly high in services where coverage
remains low. The services that have lowest coverage are safe sanitation (48 percent of 0 to 17
81.182.3 82.2 82.0 82.3
83.284.6 85.2
84.785.7 86.3
85.1 85.8 86.487.7 87.9
70
80
90
100
2003 2004 2005 2006 2007 2008 2009 2010
Pe
rce
nta
ge
HOI Coverage
42.7 44.042.1
46.848.5
50.854.0
51.0
51.153.5
51.4
55.757.6
60.3 62.3 59.9
35
45
55
65
75
85
2003 2004 2005 2006 2007 2008 2009 2010
Perc
en
tag
e
HOI Coverage
40.546.0
53.7
66.0
76.4 74.5 73.6
50.354.8
63.0
75.0
81.5 79.5 78.5
20
40
60
80
100
2003 2004 2005 2006 2007 2008 2009 2010
Po
rcen
tag
e
HOI Coverage
34.8 36.939.8 41.5
44.948.5 47.8 47.7
50.6 52.456.1 56.3
60.363.4 63.4 63.1
20
40
60
80
100
2003 2004 2005 2006 2007 2008 2009 2010
Pe
rcen
tag
e
HOI Coverage

44
year olds have access), 9th
grade on time (51 percent coverage for 16 to 17 year olds), preschool
(56 percent of 5 year olds), 6th
grade on time (61 percent of 13 year olds), starting school on time
(72 percent of 6 to 7 year olds), and access to health care (74 percent of 0 to 17 year olds have
access). For these services, the equity of opportunity also tends to be lower. By contrast,
inequities in those opportunities that are close to universal are very limited (Figure 3.9).
Figure 3.9: Coverage and HOI in Paraguay (2010)
Source: Cuesta and Suárez (2012)
There are a number of drivers behind these disparities in opportunities. For school
attendance and completion of 6th
and 9th
grade, the most important factor is the level of education
of the head of household. This suggests that demand and parental preferences play a role in
education decisions. On the other hand, the main language spoken in the household is the key
determinant for beginning school on time. Expressed in terms of the probability of having low
educational opportunities, children of households where the head has low level of education or
where the main language spoken is Guaraní are more likely to belong to vulnerable groups. In
the case of health and housing opportunities, the bulk of the disparities can be explained by the
geographic location of the household (urban/rural and region), which suggests that supply factors
are important in determining these opportunities.
85.2
72.2
61.1
51.056.0
73.6
93.9
47.7
95.2
40
50
60
70
80
90
100
AttendSchool(5-17)
StartSchool
on Time
(6-7)
Finish 6thGrade
on Time
(13)
Finish 9thGrade(16-17)
AttendPre-School
(5)
Access toHealthCare
(0-17)
Housing:Water(0-17)
Housing:Sanitation
(0-17)
Housing:Electricity
(0-17)
Perc
en
tag
e
HOI UB(95) LB(95)
87.9
75.0
69.3
59.961.2
78.5
95.6
63.1
97.0
40Attendschool(5-17)
Startschoolon time
(6-7)
Finish6th gradeon time
(13)
Finish9th grade(16-17)
Attendprechool
(5)
Access tohealth care
(0-17)
Access toclean water
(0-17)
Accessto safe
sanitation
(0-17)
Access toelectricity
(0-17)
UB(95) LB(95) Coverage

45
3.3 How progressive is Paraguay’s fiscal system with regard to the
distribution of income and opportunities?36
Paraguay’s reliance on indirect taxes makes its tax system regressive. Despite the burden
that direct taxes represent even for the poorest, the rich pay a higher share of their income on
these taxes, which means that these taxes are progressive. Indirect taxes, on the other hand, are
regressive. Given the relatively small role that direct taxes play in Paraguay’s fiscal system,
overall taxes are also slightly regressive (Figure 3.10). In contrast, overall taxes in some
countries, such as Guatemala, Mexico, Peru, and Uruguay, are progressive.
Furthermore, social expenditures are less progressive than in other countries. This finding
is supported by two separate analyses using household surveys from two different years (2009
and 2010) and different categorizations of expenditures. Analysis 1 uses traditional benefit
incidence analysis with respect to the distribution of household income; analysis 2 includes both
the distribution of income and of opportunities.
Analysis 1: 2010 household survey37
A detailed analysis of the concentration coefficient38
of spending categories using the 2010
household survey shows that most public expenditure is less progressive than in other
countries. Social spending overall is progressive in relative terms, with a concentration
coefficient of 0.14 (Figure 3.11). In other countries, social spending is more progressive, with a
concentration coefficient ranging from -0.17 (Uruguay) to 0.06 (Guatemala). Social spending is
progressive in absolute terms in all countries in the sample except Guatemala and Paraguay.
However, Paraguay fares well when it comes to the progressivity of its CCT program: Tekoporã
is highly progressive in absolute terms, with a concentration coefficient of -0.47; this is more
progressive than Bolivia’s universal CCT Bono Juancito Pinto (-0.25) and Guatemala’s Mi
Familia Progresa (-0.41), and less progressive than Argentina’s Asignación Universal por Hijo (-
0.52), Mexico’s Oportunidades (-0.54), Brazil’s Bolsa Família (-0.58), Uruguay’s Asignaciones
Familiares (-0.61), and Peru’s Juntos (-0.65). Overall education spending (including tertiary
education) is progressive in relative terms, with a concentration coefficient of 0.12. In contrast,
in all of the other countries included in the analysis, total education spending is progressive in
absolute terms and has a negative concentration coefficient, ranging from -0.17 in Peru to -0.01
in Guatemala. The progressivity of primary (-0.11) and secondary (0.27) education spending is
counterbalanced by the regressivity of tertiary education (0.55). It should be noted that all other
countries in the analysis have tertiary education spending that is progressive in relative terms
36
According to the definition used in this paper, taxes are progressive (regressive) if the proportion paid is lower
(higher) than the share of income for the poor and the opposite happens at the top of the income scale. A transfer is
progressive (regressive) if the proportion received is higher (lower) than the share of income for the poor and the
opposite happens at the top of the income scale. Furthermore, a transfer is progressive in absolute terms if the
proportion received is higher, not only than the share of income, but also the population share for the poorest decile
and this relationship declines as we move up to higher deciles. 37
This analysis (Lustig et al (2012)) categorizes education spending into primary, secondary and tertiary. Health
spending includes all public expenditure on public health and the IPS. 38
The concentration coefficient (CC) ranges in value from -1 (perfect progressivity) to 1 (perfect regressivity). A
CC between -1 and 0 signifies progressivity in absolute terms; a CC between 0 and the Gini coefficient signifies
progressivity in relative terms. A CC above the Gini signifies regressivity.

46
except Guatemala (0.59), ranging from only slightly progressive (0.47 in Uruguay) to
substantially progressive in relative terms (0.24 in Argentina). Total health spending is
progressive only in relative terms, with a concentration coefficient of 0.20. The public health
systems in other Latin American countries range from having similar levels of progressivity in
Guatemala and Peru to being progressive in absolute terms in Argentina, Bolivia, Brazil, and
Uruguay.
Figure 3.10:Concentration shares of taxes in Paraguay (2010)
(a) Direct taxes (blue) and market income (red) (b) Indirect taxes (blue) and market income
(red)
(c) Direct + indirect taxes (blue) and market income (red)
Source: Lustig et al (2012)
0%
10%
20%
30%
40%
50%
60%
1 2 3 4 5 6 7 8 9 10
Co
nce
ntr
atio
in S
har
e
Decile
0%
5%
10%
15%
20%
25%
30%
35%
40%
1 2 3 4 5 6 7 8 9 10
Co
nce
ntr
atio
in S
har
e
Decile
0%
5%
10%
15%
20%
25%
30%
35%
40%
45%
1 2 3 4 5 6 7 8 9 10
Co
nce
ntr
atio
in S
har
e
Decile

47
Figure 3.11: Concentration coefficients of public expenditure categories in Paraguay (2010)
Source: Lustig et al (2012).
Analysis 2: 2009 household survey39
The second analysis finds that public spending on primary education is pro-poor, while
spending on secondary (and tertiary) education is pro-rich. Public spending benefits decrease
as the consumption of household increases for primary education, while the opposite occurs in
the case of secondary education. The bottom 40 percent of the distribution of beneficiaries of
primary education capture 47 percent of total public resources on primary education. The same
percentage of public spending on secondary education goes to the top 40 percent of the income
distribution.
Considering the distribution of opportunities instead of household income, a similar
incidence is observed. For combined public spending on primary and secondary education,
having a set of circumstances, which are less favorable for attending school does not make a
large difference in the public benefits that a child will receive. Only children with the most
favorable set of circumstances receive fewer public benefits than their share in the population
would suggest. The main reason is that these children opt for private education. Results
39
This analysis categorizes education expenditure into primary and secondary education. Primary education
includes preschool as well as the first, second and third cycles of primary education. It also includes special
education for preschool and primary education and special permanent primary education. Secondary education
includes high school, permanent professional secondary education, alternative secondary education and secondary
distance education. Health expenditure includes facilities managed by the Ministry of Health as well as IPS. In
addition, this analysis includes the incidence of public education and public health care along the distribution of
opportunities (in addition to income). The distribution of opportunities is obtained by estimating the probability of
each child to access a given opportunity (such as attending school) given his or her set of circumstances.
0.55
0.51
0.50
0.50
0.50
0.48
0.47
0.39
0.20
0.14
0.12
0.09
-0.11
-0.11
-0.13
-0.47
-0.54
-0.8 -0.6 -0.4 -0.2 0.0 0.2 0.4 0.6 0.8
Tertiary School
Post-fiscal Income
Market Income
Net Market Income
Disposable Income
Final Income
Final Income*
Health / IPS
Total Health
Social Spending
Total Education
Secondary School
Tariffa Social
Primary School
Free Health Care
Tekopora
Other Transfers
Concentration Coefficient (or Gini when specified)
Regressive
Progressive in absolute terms
Progressive in
relative terms
Gini
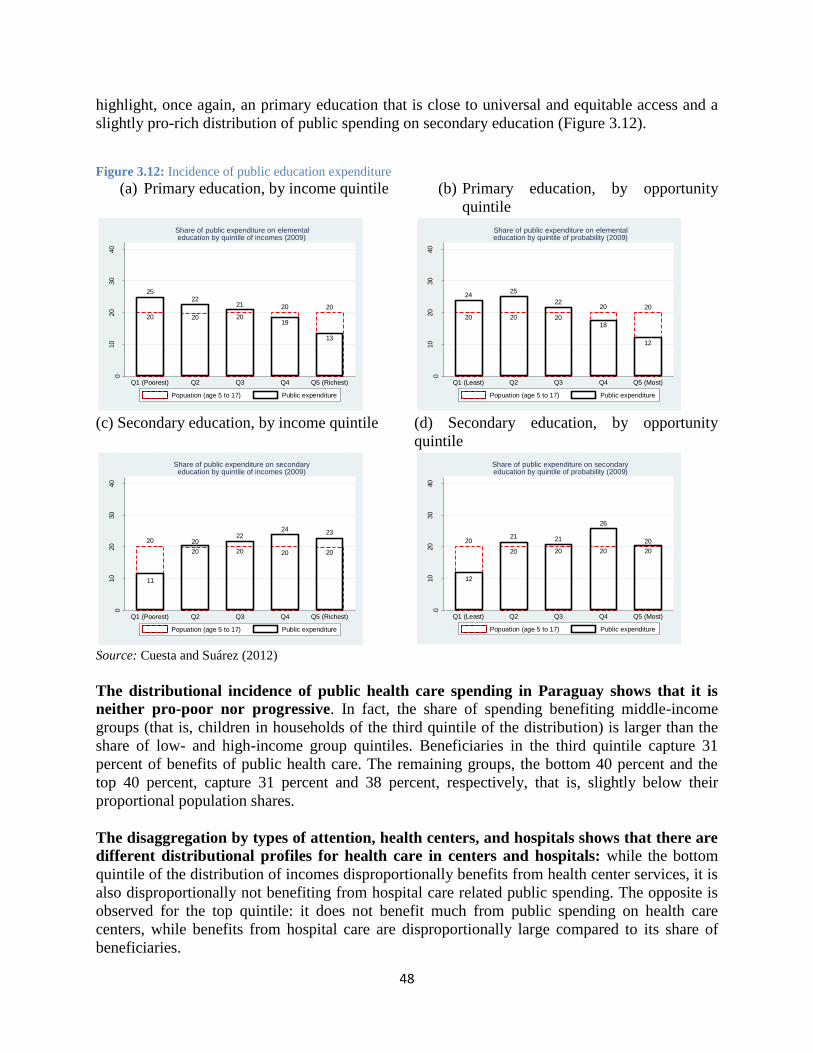
48
highlight, once again, an primary education that is close to universal and equitable access and a
slightly pro-rich distribution of public spending on secondary education (Figure 3.12).
Figure 3.12: Incidence of public education expenditure
(a) Primary education, by income quintile (b) Primary education, by opportunity
quintile
(c) Secondary education, by income quintile (d) Secondary education, by opportunity
quintile
Source: Cuesta and Suárez (2012)
The distributional incidence of public health care spending in Paraguay shows that it is
neither pro-poor nor progressive. In fact, the share of spending benefiting middle-income
groups (that is, children in households of the third quintile of the distribution) is larger than the
share of low- and high-income group quintiles. Beneficiaries in the third quintile capture 31
percent of benefits of public health care. The remaining groups, the bottom 40 percent and the
top 40 percent, capture 31 percent and 38 percent, respectively, that is, slightly below their
proportional population shares.
The disaggregation by types of attention, health centers, and hospitals shows that there are
different distributional profiles for health care in centers and hospitals: while the bottom
quintile of the distribution of incomes disproportionally benefits from health center services, it is
also disproportionally not benefiting from hospital care related public spending. The opposite is
observed for the top quintile: it does not benefit much from public spending on health care
centers, while benefits from hospital care are disproportionally large compared to its share of
beneficiaries.
20
25
20
22
20
21 20
19
20
13
010
20
30
40
Perc
en
tag
e
Q1 (Poorest) Q2 Q3 Q4 Q5 (Richest)
Share of public expenditure on elementaleducation by quintile of incomes (2009)
Popuation (age 5 to 17) Public expenditure
20
24
20
25
20
2220
18
20
12
010
20
30
40
Perc
en
tag
eQ1 (Least) Q2 Q3 Q4 Q5 (Most)
Share of public expenditure on elementaleducation by quintile of probability (2009)
Popuation (age 5 to 17) Public expenditure
20
11
20
20 20
22
20
24
20
23
010
20
30
40
Perc
en
tag
e
Q1 (Poorest) Q2 Q3 Q4 Q5 (Richest)
Share of public expenditure on secondaryeducation by quintile of incomes (2009)
Popuation (age 5 to 17) Public expenditure
20
12
20
21
20
21
20
26
20
20
010
20
30
40
Perc
en
tag
e
Q1 (Least) Q2 Q3 Q4 Q5 (Most)
Share of public expenditure on secondaryeducation by quintile of probability (2009)
Popuation (age 5 to 17) Public expenditure

49
Similarly, benefit incidence with respect to the distribution of opportunities depends on the
level of public health care. Children with the least favorable set of circumstances, i.e. the
bottom two quintiles in the probability distribution, only capture 29 percent of benefits. The
disaggregation by nature of the attention, health center, or hospital related indicates that there are
marked distributional differences as well. Medical attention in health centers benefits those with
less favorable circumstances: the bottom 40 percent captures some 54 percent of such benefits.
However, hospital care spending favors those in the higher opportunity quintiles: the bottom 40
percent of the distribution captures only 19 percent of all benefits associated with hospital care.
Figure 3.13: Incidence of public health expenditure
(a) Health center care, by income quintile (b) Health center care, by opportunity
quintile
(c) Hospital care, by income quintile (d) Hospital care, by opportunity quintile
Source: Cuesta and Suárez (2012)
3.4 Policy options
On the revenue side, the key challenge is to address the regressivity of taxes. This would
require a gradual increase in the collection of direct taxes compared to indirect taxes, and the
elimination of exemptions. For concrete suggestions refer to section 2.4 as the recommendations
to ease the fiscal restraint and to address the regressivity of the system coincide.
These measures would also help generate additional revenue, which could be used to
strengthen the progressivity of public spending. Simulations using a CGE model prepared for
20
28
20
14
20
28
20
23
20
7
010
20
30
40
Perc
en
tag
e
Q1 (Poorest) Q2 Q3 Q4 Q5 (Richest)
Share of public expenditure on health center careby quintile of incomes (2009)
Popuation (age 0 to 17- ill only) Public expenditure
20
29
20
25
20
14
20
24
20
10
010
20
30
40
Perc
en
tag
e
Q1 (Least) Q2 Q3 Q4 Q5 (Most)
Share of public expenditure on health center careby quintile of probability (2009)
Popuation (age 0 to 17- ill only) Public expenditure
20
8
20
1820
32
20
1920
23
010
20
30
40
Perc
en
tag
e
Q1 (Poorest) Q2 Q3 Q4 Q5 (Richest)
Share of public expenditure on hospital careby quintile of incomes (2009)
Popuation (age 0 to 17- ill only) Public expenditure
20
8
20
11
20
36
20
21
20
24
010
20
30
40
Perc
en
tag
e
Q1 (Least) Q2 Q3 Q4 Q5 (Most)
Share of public expenditure on hospital careby quintile of probability (2009)
Popuation (age 0 to 17- ill only) Public expenditure

50
this report40
suggest that the reduction in exemptions (especially VAT exemptions) and the use
of these resources for social expenditure could have a beneficial effect for human development
outcomes, while not significantly affecting GDP growth.41
The simulations look specifically at
increases in spending on education, health and water and sanitation, and on the effect of this
increased spending on MDGs. Such spending could be better targeted to improve access to basic
services care by particularly vulnerable groups, such as households whose head speaks only
Guarani and went to school for less than 6 years. Similarly, additional resources freed up could
be used for the CCT program, which would have beneficial impacts on poverty, inequity and
inequality given that it is already well targeted
In order to ensure that additional spending is used efficiently, the monitoring of
expenditure could be improved through: (i) the geographic disaggregation of social
expenditures that are currently not attributed to a specific department but are classified as
“national level” (alcance nacional); (ii) the improvement in the quality and an increase in the
number of social outcome indicators that are available at the departmental level; and (iii)
participation in other international assessments (for example, PISA in the case of education) to
make the indicators of outcomes of public service provision in Paraguay comparable to other
countries.
40
The CGE model prepared for this PER provides a useful tool for policy makers to simulate the effect of policy
changes on poverty, inequality and MDGs. Various different policy options could be simulated this way. 41
Conversely, if the resources were spent on infrastructure, poverty rates and human development outcomes would
remain unchanged, while GDP growth would increase slightly. These alternative scenarios allow quantifying the
trade-off between higher private investment and consequently higher economic growth and lower poverty, versus
higher levels of human development expenditure in education, health, water and sanitation.

51
Chapter 4: Efficiency of Public Spending and Service Delivery
Given Paraguay’s limited fiscal resources, getting the most value out of public spending is an
important priority. Not only does Paraguay spend less on the social sectors than many other
countries, it also achieves relatively weak outcomes in education and health. Preliminary
analyses suggest that Paraguay could improve the efficiency of public spending in these two
sectors. There also appears to be significant variation in expenditure efficiency among
departments within Paraguay, which may be related to a number of factors. Improving the
efficiency of public service SOEs could contribute to better outcomes. More and better data is
needed at the disaggregated level in order to better assess what drives social outcomes in
different parts of the country.
As shown in Chapter 3, Paraguay’s public expenditure in the social sectors is low in comparison
to peer countries and to its neighbors. Even though spending on education and health as a share
of total spending has increased over time, Paraguay still spends less on these sectors (as a share
of GDP) than countries of a similar size and than the Latin American average.
The fiscal incidence analysis in Chapter 3 also shows that despite the low spending, some of
Paraguay’s social programs are very effective. The effectiveness of Paraguay’s social spending
on reducing inequality is better than in a number of other Latin American countries. Most
notably, the CCT program is well targeted and thus represents an effective tool for reducing
extreme poverty.
This chapter analyzes to what extent Paraguay uses its limited public resources efficiently for the
benefit of human development. Poverty reduction over the past two decades has been modest,
and Paraguay ranks among the lower third of comparator countries in most health and
education results. To what extent are these results due to Paraguay’s low social expenditure?
Can the limited fiscal resources be used more efficiently to achieve higher outcomes? To what
extent does expenditure efficiency vary among different regions within the country? And what
may be some of the factors contributing to low expenditure efficiency? This chapter attempts to
provide preliminary answers to these questions, based on the available data. It is organized as
follows. Section 4.1 analyzes the efficiency of public expenditure on health and education in
comparison with other countries. Section 4.2 examines the variations in efficiency among the 18
Paraguayan departments. Section 4.3 presents a case study of the expenditure efficiency in
SOEs, which provide basic public services. Section 4.4 concludes with policy recommendations.
4.1 The efficiency of public spending in Paraguay in international comparison
Education
A comparison of Paraguay’s education outcomes with that of other countries is difficult.
Paraguay does not participate in the Program for International Student Assessment (PISA) to
measure student performance. As a result, the following analysis uses proxy indicators such as
enrollment rates, average years of schooling, gender parity, drop-out and repeater rates, which
are available for a wide range of countries including Paraguay.
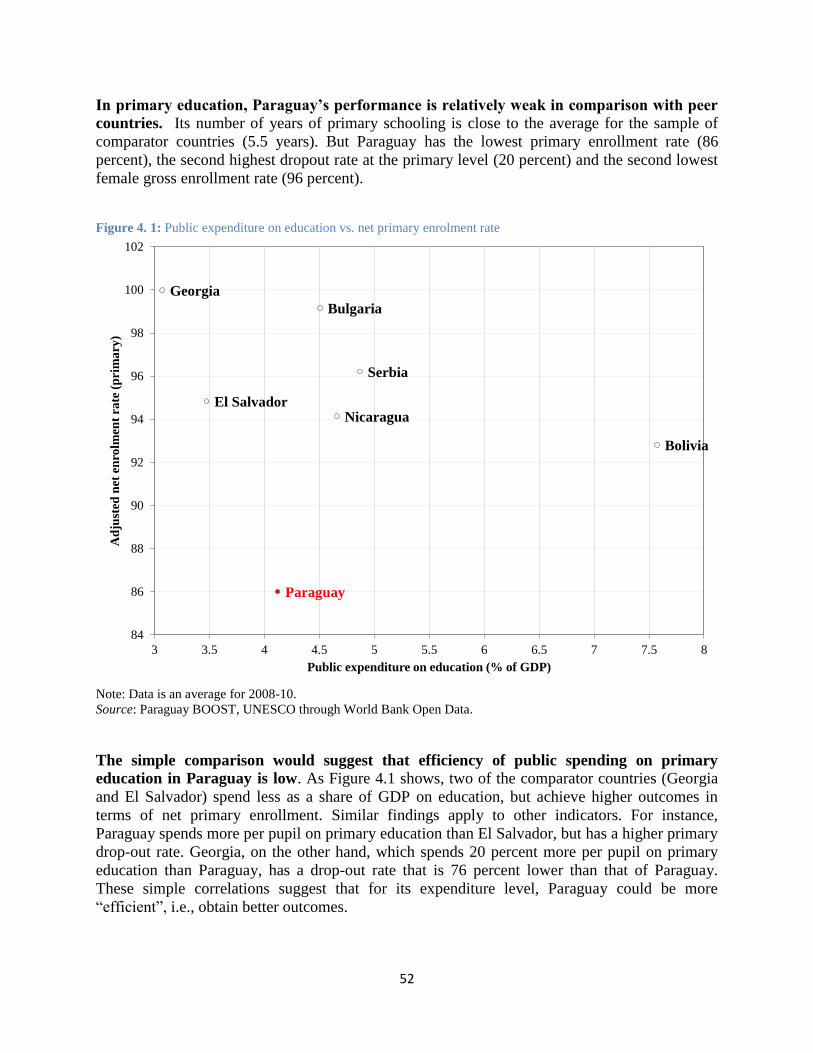
52
In primary education, Paraguay’s performance is relatively weak in comparison with peer
countries. Its number of years of primary schooling is close to the average for the sample of
comparator countries (5.5 years). But Paraguay has the lowest primary enrollment rate (86
percent), the second highest dropout rate at the primary level (20 percent) and the second lowest
female gross enrollment rate (96 percent).
Figure 4. 1: Public expenditure on education vs. net primary enrolment rate
Note: Data is an average for 2008-10.
Source: Paraguay BOOST, UNESCO through World Bank Open Data.
The simple comparison would suggest that efficiency of public spending on primary
education in Paraguay is low. As Figure 4.1 shows, two of the comparator countries (Georgia
and El Salvador) spend less as a share of GDP on education, but achieve higher outcomes in
terms of net primary enrollment. Similar findings apply to other indicators. For instance,
Paraguay spends more per pupil on primary education than El Salvador, but has a higher primary
drop-out rate. Georgia, on the other hand, which spends 20 percent more per pupil on primary
education than Paraguay, has a drop-out rate that is 76 percent lower than that of Paraguay.
These simple correlations suggest that for its expenditure level, Paraguay could be more
“efficient”, i.e., obtain better outcomes.
Paraguay
Bolivia
Bulgaria
El Salvador
Georgia
Nicaragua
Serbia
84
86
88
90
92
94
96
98
100
102
3 3.5 4 4.5 5 5.5 6 6.5 7 7.5 8
Ad
just
ed n
et e
nro
lmen
t ra
te (
pri
ma
ry)
Public expenditure on education (% of GDP)

53
Figure 4.2: Public expenditure on education vs. secondary graduation rate
Note: Data is an average for 2008-10.
Source: Paraguay BOOST, UNESCO through World Bank Open Data.
With regards to secondary education, Paraguay’s performance is similarly weak. It has the
second lowest graduation rate in the sample, even though per pupil spending on secondary
education is relatively high. A number of countries, such as Bolivia and Serbia, spend less per
pupil but have graduation rates of 80 and 95 percent, respectively, compared to 66 percent in
Paraguay (Figure 4.2). Secondary net enrollment rates are also comparatively low given the level
of expenditures.
A more rigorous analysis confirms that Paraguay’s expenditure efficiency in education is
low. Using Data Envelopment Analysis (DEA), which computes an efficiency frontier based on
those observations that have the lowest input for the highest output (or set of outputs), it is
possible to assess how efficient Paraguay’s public expenditure on education is in relation to a set
of education outcomes.42
These include, in the case of primary education, the average number of
years of primary schooling, gender parity in gross enrollment, gross enrollment rate and repeater
rate; and in the case of secondary education, gender parity in gross enrollment, gross enrollment
rate, repeater rate and lower secondary gross graduation rate. The results show that Paraguay is
42
See Annex 1 for more information on the methodology.
Argentina
Paraguay
Bolivia
El Salvador
Georgia
Jordan
Nicaragua
Serbia
40
50
60
70
80
90
100
0 5 10 15 20 25 30
Gro
ss l
ow
er s
eco
nd
ary
gra
du
ati
on
ra
te
Public expenditure per pupil in secondary education (% of per capita GDP)

54
the least efficient country in the sample with regards to primary education, and the second least
efficient in the case of secondary education.
Health
Health sector performance appears to be somewhat better. Paraguay places in the middle of
the sample group in terms of vaccination and maternal mortality rates, as well as life expectancy.
For example, at 100 per 100,000 live births, Paraguay’s maternal mortality rate is significantly
lower than that of Papua New Guinea and Bolivia, and comparable to that of Nicaragua and
Honduras (Figure 4.3). At the same time, it also spends more per capita on health (US$270) than
these four countries, as well as two countries that have lower maternal mortality rates,
Turkmenistan (US$108) and El Salvador (US$239).
Similar to the education sector, the DEA results confirm that Paraguay’s efficiency in the
health sector is among the lowest in the sample. Taking health spending as an input and three
health indicators as outputs (DPT immunization, life expectancy and infant mortality), the DEA
finds that Paraguay spends less efficiently than the other countries in the sample.
Figure 4.3: Health expenditure and maternal mortality rate
Note: Data is an average for 2008-10.
Source: Paraguay BOOST, World Bank Health Statistics and WHO Health Accounts.
Argentina
Bulgaria
Bolivia
Brazil
Georgia
Honduras
Jordan
Nicaragua
Papua New
Guinea
Paraguay
El Salvador
Serbia
Turkmenistan
Uruguay
0
50
100
150
200
250
0 100 200 300 400 500 600 700 800 900 1000
Ma
tern
al
mo
rta
lity
ra
te (
mo
del
ed e
st., p
er 1
00
,00
0 l
ive
bir
ths)
Health expenditure per capita (current US$)
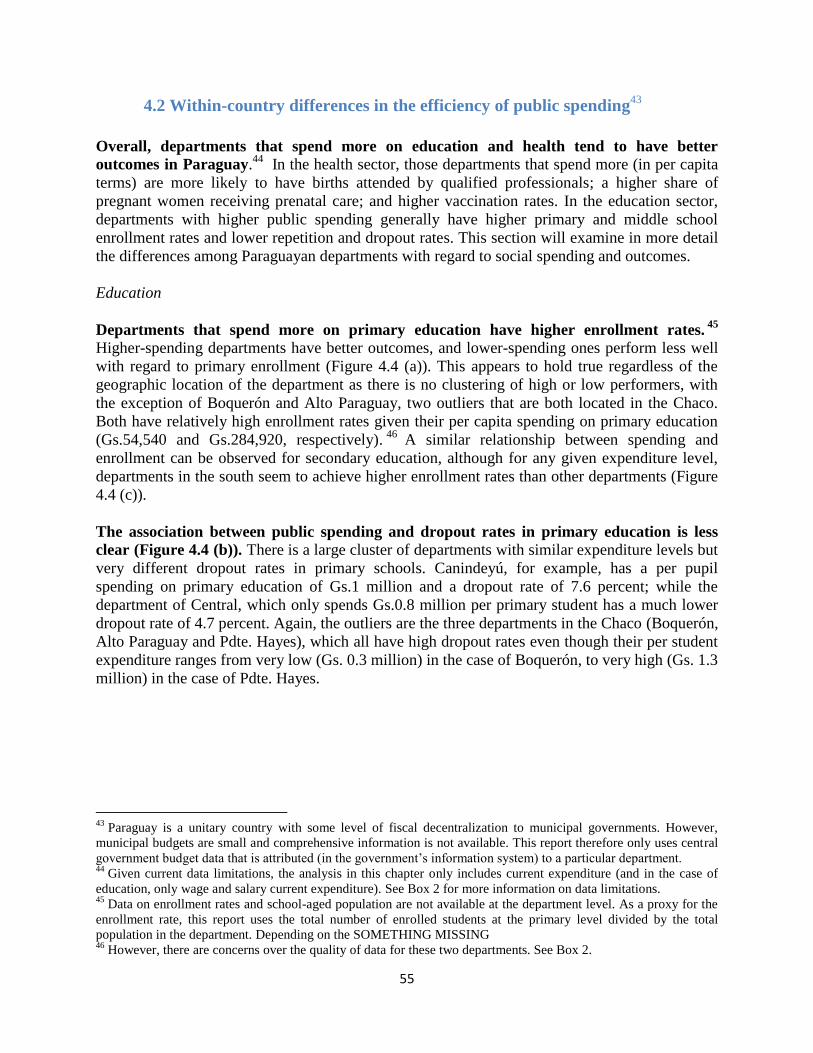
55
4.2 Within-country differences in the efficiency of public spending43
Overall, departments that spend more on education and health tend to have better
outcomes in Paraguay.44
In the health sector, those departments that spend more (in per capita
terms) are more likely to have births attended by qualified professionals; a higher share of
pregnant women receiving prenatal care; and higher vaccination rates. In the education sector,
departments with higher public spending generally have higher primary and middle school
enrollment rates and lower repetition and dropout rates. This section will examine in more detail
the differences among Paraguayan departments with regard to social spending and outcomes.
Education
Departments that spend more on primary education have higher enrollment rates.45
Higher-spending departments have better outcomes, and lower-spending ones perform less well
with regard to primary enrollment (Figure 4.4 (a)). This appears to hold true regardless of the
geographic location of the department as there is no clustering of high or low performers, with
the exception of Boquerón and Alto Paraguay, two outliers that are both located in the Chaco.
Both have relatively high enrollment rates given their per capita spending on primary education
(Gs.54,540 and Gs.284,920, respectively).46
A similar relationship between spending and
enrollment can be observed for secondary education, although for any given expenditure level,
departments in the south seem to achieve higher enrollment rates than other departments (Figure
4.4 (c)).
The association between public spending and dropout rates in primary education is less
clear (Figure 4.4 (b)). There is a large cluster of departments with similar expenditure levels but
very different dropout rates in primary schools. Canindeyú, for example, has a per pupil
spending on primary education of Gs.1 million and a dropout rate of 7.6 percent; while the
department of Central, which only spends Gs.0.8 million per primary student has a much lower
dropout rate of 4.7 percent. Again, the outliers are the three departments in the Chaco (Boquerón,
Alto Paraguay and Pdte. Hayes), which all have high dropout rates even though their per student
expenditure ranges from very low (Gs. 0.3 million) in the case of Boquerón, to very high (Gs. 1.3
million) in the case of Pdte. Hayes.
43
Paraguay is a unitary country with some level of fiscal decentralization to municipal governments. However,
municipal budgets are small and comprehensive information is not available. This report therefore only uses central
government budget data that is attributed (in the government’s information system) to a particular department. 44
Given current data limitations, the analysis in this chapter only includes current expenditure (and in the case of
education, only wage and salary current expenditure). See Box 2 for more information on data limitations. 45
Data on enrollment rates and school-aged population are not available at the department level. As a proxy for the
enrollment rate, this report uses the total number of enrolled students at the primary level divided by the total
population in the department. Depending on the SOMETHING MISSING 46
However, there are concerns over the quality of data for these two departments. See Box 2.
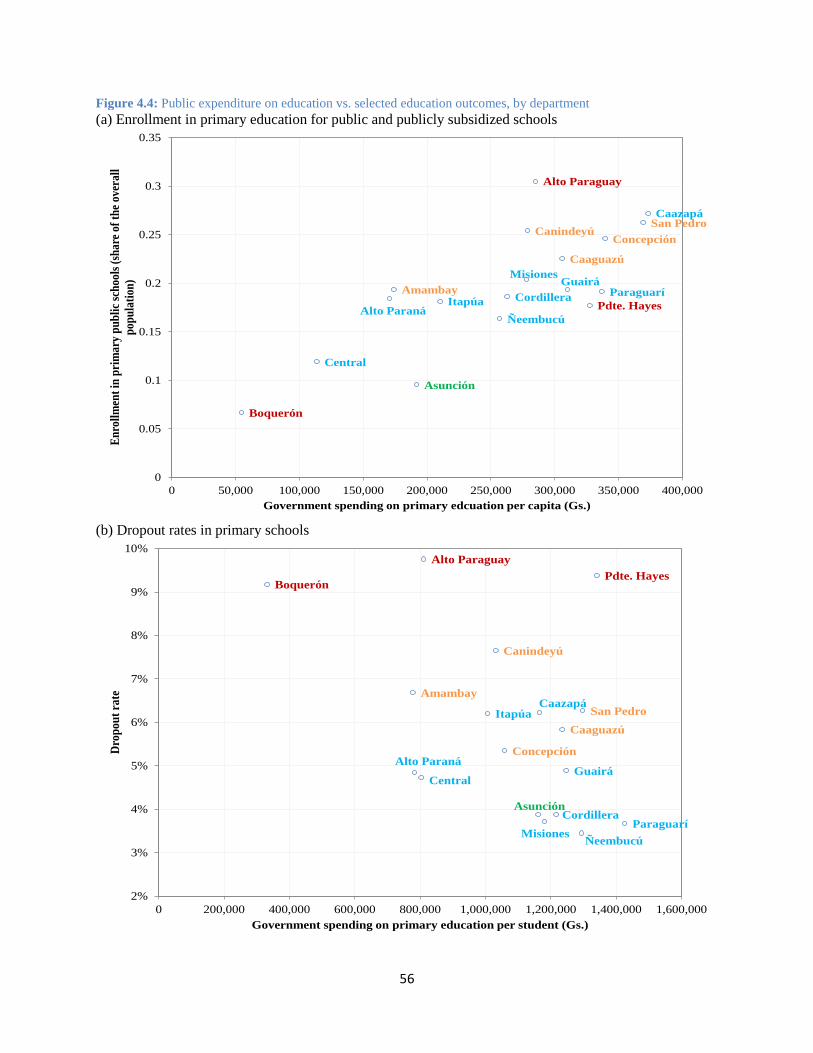
56
Figure 4.4: Public expenditure on education vs. selected education outcomes, by department
(a) Enrollment in primary education for public and publicly subsidized schools
(b) Dropout rates in primary schools
Asunción
Concepción
San Pedro
Cordillera
Guairá
Caaguazú
Caazapá
Itapúa
Misiones
Paraguarí
Alto Paraná
Central
Ñeembucú
Amambay
Canindeyú
Pdte. Hayes
Boquerón
Alto Paraguay
0
0.05
0.1
0.15
0.2
0.25
0.3
0.35
0 50,000 100,000 150,000 200,000 250,000 300,000 350,000 400,000
En
roll
men
t in
pri
mar
y p
ub
lic
sch
ools
(sh
are
of t
he
over
all
pop
ula
tion
)
Government spending on primary edcuation per capita (Gs.)
Asunción
Concepción
San Pedro
Cordillera
Guairá
Caaguazú
CaazapáItapúa
MisionesParaguarí
Alto Paraná
Central
Ñeembucú
Amambay
Canindeyú
Pdte. HayesBoquerón
Alto Paraguay
2%
3%
4%
5%
6%
7%
8%
9%
10%
0 200,000 400,000 600,000 800,000 1,000,000 1,200,000 1,400,000 1,600,000
Dro
po
ut
rate
Government spending on primary education per student (Gs.)

57
(c) Enrollment in secondary education for public and publicly subsidized schools
Source: Paraguay BOOST and Ministry of Education.
The DEA analysis shows that five departments have low efficiency scores for both primary
and secondary education. When various outcomes for primary and secondary education are
taken together, Pdte. Hayes (Chaco), Caaguazú (north), San Pedro (north), Itapúa (south) and
Canindeyú (north) are found to be less efficient than other departments.47
It is also noteworthy
that the low-performing departments are concentrated in the north of the country, which tends to
be poorer.
Health
Departments that spend more on health do not necessarily have better outcomes. The
departments of Misiones and Ñeembucú, both located in the south of the country, achieve high
outcomes in terms of attended births, but have vaccinations rates below 70 percent (placing them
in the lower third of all departments). A number of other departments that spend less on health
achieve similar results, suggesting that they are more efficient in the use of their resources. The
main outlier is the department of Asunción, which spends most on health and has the highest or
second highest outcomes for maternal mortality, vaccination rates and prenatal care. This is not
surprising as hospitals tend to be concentrated in the capital city, and there is greater access to
health services for the population.
47
The other two departments in the Chaco (Boquerón and Alto Paraguay) were not included in the DEA because of
concerns over the quality of their data.
Asunción
Concepción
San Pedro
Cordillera
Guairá
Caaguazú
Caazapá
Itapúa
MisionesParaguarí
Alto Paraná
Central
Ñeembucú
Amambay
Canindeyú
Pdte. Hayes
Boquerón
Alto Paraguay
0
0.01
0.02
0.03
0.04
0.05
0.06
0.07
0 20,000 40,000 60,000 80,000 100,000 120,000 140,000 160,000 180,000 200,000
En
roll
men
t in
sec
on
dar
y p
ub
lic
an
d p
ub
licl
y s
ub
sid
ized
sch
oo
ls
(sh
are
of
ov
era
ll p
op
ula
tion
)
Government spending on secondary education per capita (Gs.)
58
There is also no clear geographical distinction in the spending/performance relationship.
Departments in the south of the country (blue) tend to have a higher share of births attended by
professionals even though per capita expenditure on health varies widely. For northern
departments (orange), on the other hand, outcomes range from above average (Amambay) to
very low (Caindeyú). As for TB vaccination rates, departments in the north tend to have better
outcomes (ranging from 76 percent in San Pedro to 99 percent in Amambay), while those in the
south have rates between 60 and 75 percent. Departments in the Chaco, the western part of the
country, rank in the middle of the group, both in terms of health spending and outcomes. These
relationships between spending and results suggest that there is no clear pattern between health
expenditure and health outcomes in general.
Using the DEA methodology, there is no indication that inefficient departments are
concentrated in a particular part of the country. The results suggest that Ñeembucú (south) is
by far the least efficient department when public health spending is considered in conjunction
with the maternal mortality rate, DTP vaccination rate and the share of women receiving prenatal
care. Pdte. Hayes (Chaco), Paraguarí (south) and Misiones (south) are also found to be among
the least efficient departments.
The findings of the analysis of within-country differences in efficiency have to be
interpreted with care. Data limitations (see Box 2) make it difficult to assess with certainty the
relationship between public expenditure and social outcomes. The lack of other socio-economic
data at the departmental level means that more rigorous regression analysis is also difficult to
conduct. The analysis presented in this chapter therefore only offers preliminary insights into the
differences in efficiency across departments, which could be complemented by further
qualitative and quantitative work.

59
Figure 4.5: Public expenditure on health vs. selected health outcomes, by department
(a) Birth attended by skilled professionals
(b) TB vaccination rates
Note: Excludes Alto Paraguay. Colors indicate region: blue – south; organge – north; red – west;
and green – capital city.
Source: BOOST, Ministry of Health.
Asunción
Concepción
San Pedro
Cordillera
Guairá
Caaguazú
Caazapá
Itapúa
Misiones
Paraguarí
Alto Paraná
Central
Ñeembucú
Amambay
Canindeyú
Pdte. Hayes
Boquerón
75
80
85
90
95
100
0 20,000 40,000 60,000 80,000 100,000 120,000 140,000 160,000 180,000 200,000
Att
end
ed b
irth
s (%
)
Current public health expenditure (Gs. per capita)
Asunción
Concepción
San Pedro
Cordillera
Guairá
Caaguazú
Caazapá
Itapúa
Misiones
Paraguarí
Alto Paraná
Central
Ñeembucú
Amambay
Canindeyú
Pdte. Hayes
Boquerón
50
55
60
65
70
75
80
85
90
95
100
0 20,000 40,000 60,000 80,000 100,000 120,000 140,000 160,000 180,000 200,000
TB
va
ccin
ati
on r
ate
(%
)
Current public health expenditure (Gs. per capita)
60
Box 2. Education and Health Data for Paraguay
This chapter’s analysis of performance in the education and health systems in Paraguay uses data on
expenditure and outcomes (intermediate and final) as well as socio-economic and demographic statistics.
Data were provided by the authorities.
The Ministry of Finance provided outturn (obligado) data for Central Government expenditure at the
line item level for 2003-12. For the analysis, education spending was defined by functional categories
associated with education - this covers spending by several ministries, including Education and
Culture as well as Justice and Labor.1 Spending on education was then broken down by level using
the categorization for Public Expenditure Review (Variables Clave) in primary (Educación
Elemental) and secondary education (Educación Media y Técnica). Health expenditure includes all
spending items under the functional category of health (Salud) under the Ministry of Health.
The analysis compares education spending at the primary and secondary level with indicators of
outputs and outcomes at each level broken down by Department - the results of these data were made
available by the Ministries of Education and Health.
The sources for socio-economic and demographic data on population distribution and income are
from the Ministries of Health and Education, as well as from the Directorate General of Statistics,
Surveys and Census (DGEEC).
These data are useful for analyzing the impact of government spending and policies on education and
health results across departments, and as such they provide valuable information for motivating policy
decisions. But results need to be interpreted with caution due to some data weaknesses:
1. A large portion of education and health spending is not broken down by department. The share of
health spending not broken down by department and recorded under “alcance nacional” is particularly
large, amounting for 63 percent of total health spending. In the case of education, the share of
spending not recorded under a department is smaller, approximately 20 percent - but this includes the
bulk of non-wage spending in primary and secondary education. As a result, the available data do not
provide meaningful insights into the allocation of funds between wages, goods such as teaching
supplies, and capital investment across departments. In research for other countries, the allocation
between such categories of spending has been found to be critical for understanding the impact on
outcomes of education spending.
2. Large swings from year to year in indicators of results in education and health suggest that the data
may not always be accurate. For example, the share of pregnant women receiving prenatal care in
Alto Paraguay went from 72 percent in 2006 to 12 percent in 2007; in Alto Paraná this indicator
jumped to 36 percent in 2007 while it was around 18 percent before and after. As of 2008, volatility
seems less strong and data appear more reliable - most of the analysis in this section (except the
statistical part) uses data from 2008 and later.
3. Some of the data for Alto Paraguay and Boquerón strongly differs from other departments. For
example, the 2005-10 average spending per student in primary education reported for Boquerón is
only 10 percent of the average across departments. Meanwhile, spending on secondary education per
student in Alto Paraguay seems too high - over the same period it is 225 percent of the average
spending level across departments and almost twice as high as Presidente Hayes, the next high-
spending department. All three of these departments are located in the Chaco, the sparsely populated
and less developed western part of the country. To prevent outliers from driving findings, Alto
Paraguay and Boquerón have been excluded from the DEA and statistical analysis.
__________________________ 1These categories are: 341–Educación Elemental, 342-Educación Media y Técnica, 343–Educación Superior y
Universitaria, 346–Asistencia a Excepcionales, and 349–Educación y Cultura sin Discriminar.
61
4.3 Case study: expenditure efficiency in State-Owned Enterprises (SOEs)
Paraguay’s state-owned enterprises (SOEs) deliver a significant share of basic public
services, and the efficiency of their expenditure is important for social outcomes. They
provide electricity distribution (Administración Nacional de Electricidad, ANDE),
telecommunications (Compañía Paraguaya de Comunicaciones, COPACO) and water and
sanitation (Empresa de Servicios Sanitarios del Paraguay, ESSAP) in urban areas.48
In rural
areas or cities with less than 10,000 inhabitants, water and sanitation services are provided by
SENASA, part of the Ministry of Health. Yet other municipalities have water associations
(Juntas de Saneamiento). Both ANDE and ESSAP offer subsidized tariffs to low-income
customers. SOEs have thus contributed to the expansion in access to services and improvements
in the Human Opportunity Index analyzed in Chapter 3.
While the Government has started a thorough reform process to improve the monitoring
and oversight of SOEs, the transparency and adequate oversight of public spending
remains a challenge. Significant progress has been made in the areas of oversight, ownership
arrangements, disclosure of audited financial statements, and improvements in SOE
management, but shortcomings remain in procurement processes, merit-based appointments of
directors, managers and staff, and an accountability framework which are not yet sufficiently
embedded in the corporate governance framework. This has led to mismanagement, inefficiency
and an inflated payroll in some SOEs. Similarly, procurement processes lack transparency and
rigorous processes to ensure value-for-money in the acquisition of goods and services.
The operational performance of SOEs remains weak. They are struggling to meet the
demands arising from population growth and increasing urbanization. In addition, technical and
non-technical losses are high in electricity and water distribution due to outdated infrastructure.
Investment needs are significant but SOEs are currently not in a position to adequately anticipate
and plan for these needs.
Finally, the financial links with the central government are opaque. Paraguay’s SOEs have
contributed more than US$130 million to the national budget in recent years, with ANDE alone
accounting for US$80 million. However, these transfers are not predictable and can vary from
year to year. In addition, Government institutions have significant outstanding debt for non-
payment of utility bills with SOEs, which affects their financial viability.
48 Other SOEs are operating in petroleum import and distribution, transport management, and cement and beverage
production.

62
Table 4.1: Characteristics of the SOE Sector in Paraguay
Sector SOE
Budget of SOEs
As a % of the national
budget As a % of GDP
Petroleum Petróleos Paraguayos (PETROPAR) 13.8 6.3
Electricity Administración Nacional de Electricidad
(ANDE)
11.4 5.2
Telecommunications Compañía Paraguaya de Comunicaciones
(COPACO)
3.2 1.5
Construction Industria Nacional del Cemento (INC) 1.7 0.7
Water and
Sanitation
Empresa de Servicios Sanitarios del Paraguay
(ESSAP)
0.8 0.4
Transport
Dirección Nacional de Aeronáutica Civil (DINAC) 0.5 0.2
Administración Nacional de Navegación y Puertos
(ANNP)
0.3 0.1
Ferrocarriles del Paraguay (FEPASA) 0.0 0.0
Beverages Cañas Paraguayas (CAPASA) 0.1 0.0
TOTAL 31.8 14.4
Source: UMEP, Ministry of Finance
4.4 Policy options
More and better disaggregated data at the department level would significantly improve
inputs for public policy making. In addition to improving the accuracy of available data,
breaking down data on total expenditure by department, including at the program or even facility
level (such as schools and health centers) would push progress even further by allowing for
better targeting of resources. More and better data on outcomes in key sectors, as well as on
socio-economic and demographic indicators at the departmental or municipal level, would also
be important.
Paraguay would also benefit from the participation in international assessments in order to
better gauge its performance vis-à-vis peer countries. Paraguay participated in the Second
Regional Comparative and Explanatory Study (SERCE), which evaluates learning achievements
in 17 Latin American countries. Taking part in the PISA study could make indicators of
education outcomes in Paraguay comparable to more countries, thus providing important
information that could guide policy making in that sector.
Improved management and oversight of SOEs could contribute to better social service
provision. Specific measures include: (i) approval and implementation of the draft law
institutionalizing an independent SOE supervisory body; (ii) further reforms to strengthen the
SOE governance and oversight framework; (iii) assurance of sufficient supply and quality of
basic public services; (iv) preparation of a long- and medium-term investment plan to efficiently
address infrastructure gaps; (v) the set-up of an investment system for SOEs; (vi) a set of rules
for managing debt and fiscal risk of SOEs; and (vii) schemes on transfers, subsidies and
outstanding payments.

63
List of references
Athanasoulis, S., and E. van Wincoop (2000). “Growth Uncertainty and Risk-Sharing.” Journal
of Monetary Economics 45(3):477–505.
Berument, H., Dincer, N. and Z. Mustafaoglu (2011). “Total factor productivity and
macroeconomic instability”, The Journal of International Trade & Economic Development, Vol.
20, No. 5, pp. 605–629.
Breen, R. and C. García-Peñalosa (2005). "Income Inequality and Macroeconomic Volatility: An
Empirical Investigation,"Review of Development Economics, Wiley Blackwell, vol. 9(3), pages
380-398.
Bucheli, Marisa, Nora Lustig, Máximo Rossi and Florencia Amábile (2013). “Social Spending,
Taxes and Income Redistribution in Uruguay.” Public Finance Review, forthcoming.
Calderon, C. and K. Schmidt-Hebbel (2003). "Macroeconomic policies and performance in Latin
America,"Journal of International Money and Finance, Elsevier, vol. 22(7), pages 895-923,
December.
Cuesta, Jose and Pablo Suárez Becerra (2013). Equality of Opportunities and Public Spending in
Paraguay. Background paper prepared for the Paraguay PER.
Diaz Bonilla, C. and Cicowiez, M. (2013). “Assessing the Poverty and Social Impact of Tax
Exemptions and World Price Shocks in Paraguay”, Volume 2, Paraguay Public Expenditure
Review, The World Bank, Washington D.C..
Favaro, E., Koehler-Geib, F., Picarelli, N., and A. Indaco (2013). Paraguay: Agriculture
commodity prices and tax revenue collection, background paper for Paraguay Public Expenditure
Review (2013), World Bank, forthcoming
Garcia-Penalosa, C. and Turnovsky, S. (2004). “Macroeconomic Volatility and Income
Inequality in a Stochastically Growing Economy”, conference volume of “Economic Growth and
Income Distribution: On the Nature and Causes of the Wealth of Nations,” conference held in
Lucca, Italy, June 16-18.
Gavin, Michael and Roberto Perotti (1997). “Fiscal Policy in Latin America,” NBER
Macroeconomics Annual.
Goñi, E., J.H. López and Luis Servén (2008). Fiscal Redistribution and Income Inequality in
Latin America. Policy Research Working Paper No. 4487. Washington, DC: World Bank.
Higgins, Sean and Claudiney Pereira (2013). “The Effects of Brazil’s Taxation and Social
Spending on the Distribution of Household Income.” Public Finance Review, forthcoming.
64
Hnatkovska, V. and F. Koehler-Geib (2013). “Business Cycle Accounting for Paraguay“,
Volume 2 of World Bank report:”Growth volatiltity in Paraguay—sources, effects, options”,
World Bank 2013, Washington D.C., (forthcoming).
Hnatkovska, V., Loayza, N. (2003). “Volatility and growth”. World Bank Policy Research
Working Paper No. 3184
Huang, H., Fang, W. and S. Miller (2012). “The Effect of Growth Volatility on Income
Inequality”, University of Nevada Working paper.
Ilzetzki, Ethan and Carlos A. Vegh (2008). "Procyclical Fiscal Policy in Developing Countries:
Truth or Fiction?," NBER Working Papers 14191, National Bureau of Economic Research, Inc.
IMF (2009). “Paraguay, addressing the stagnation and instability trap”, edited by Alejandro
Santos, Washington DC.
IMF (2011). “Paraguay Article IV consultations—staff report”, IMF, August 2011.
IMF (2012). “Strengthening government debt and cash management”, IMF report, March 2012.
Inclan, C. and G. Tiao: “Use of Cumulative Sums of Squares for Retrospective Detection of
Changes of Variance”, 1994
Jaramillo, Miguel (2013). “The Incidence of Social Spending and Taxes in Peru.” Public
Finance Review, forthcoming.
Le Fort, G., Escobar, G., and D. Contreras (2013). “Paraguay: Estimation of the Structural Fiscal
Balance and Fiscal Rule Proposal”, Volume 2, Paraguay Public Expenditure Review, The World
Bank, Washington D.C..
Lopez-Calva, L., Lugo, M. and O. Barriga Cabanillas (2013). “Paraguay Equity Assessment”,
The World Bank, Washington, D.C., forthcoming.
Lustig, Nora and Sean Higgins (2012). “Commitment to Equity Assessment (CEQ): Estimating
the Incidence of Social Spending, Subsidies and Taxes Handbook.” Tulane University
Department of Economics Working Paper 1219.
Lustig, Nora, Sean Higgins, Julio Ramirez and Billy Swanson (2012). Social Spending, Taxes
and Income Redistribution in Paraguay. Background paper prepared for the Paraguay PER.
Lustig, Nora and Carola Pessino (2013). “Social Spending and Income Redistribution in
Argentina During the 2000s: the Rising Role of Noncontributory Pensions.” Public Finance
Review, forthcoming.

65
Lustig, Nora, Carola Pessino, and John Scott (2013). “The Impact of Taxes and Social Spending
on Inequality and Poverty in Argentina, Bolivia, Brazil, Mexico and Peru: An Overview.” Public
Finance Review, forthcoming.
Mendoza, Enrique G. and P. Marcelo Oviedo (2006). "Fiscal Policy and Macroeconomic
Uncertainty in Developing Countries: The Tale of the Tormented Insurer," NBER Working
Papers 12586, National Bureau of Economic Research, Inc.
Morán and Cabrera (2012) for Guatemala
Paes de Barros, R., F.H.G. Ferreira, J.R. Molinas Vega and J. Saavedra Chanduvi (2009).
Measuring Inequality of Opportunities in Latin America. Washington, DC: World Bank.
Paz Arauco, Verónica, George Gray Molina, Wilson Jiménez Pozo, and Ernesto Yáñez Aguilar
(2013). “Explaining Low Redistributive Impact in Bolivia.” Public Finance Review,
forthcoming.
Schenone, O. (2010). “El Gasto Tributario en Paraguay”, Mimeo, The World Bank, Washington
D.C., August 2010.
Schenone, O. (2013). “Evolution and composition of tax revenues in Paraguay—Effects of the
tax reform of 2004”, Volume 2, Paraguay Public Expenditure Review, The World Bank,
Washington D.C.
Scott, John (2013). “Redistributive Impact and Efficiency of Mexico's Fiscal System.” Public
Finance Review, forthcoming.
Talvi, E., and Carlos A. Végh, 2005. “Tax Base Variability and Procyclical Fiscal Policy in
Developing Countries,” Journal of Development Economics 78, pages 156-190.
Verhoeven, M., Gunnarson, V., and S. Lugaresi (2007). ” The Health Sector in the Slovak
Republic: Efficiency and Reform”, IMF Working Paper, 07/226.
World Bank (2000). “Securing Our Future in a Global Economy”, The World Bank,
Washington, D.C.
World Bank (2007). “Paraguay Real Property Tax – Key to Fiscal Decentralization and Better
Land Use”, The World Bank, Washington D.C.
World Bank (2012). “Public Expenditure Review for Peru—Spending for Results”, The World
Bank, Washington D.C.
World Bank (2013). “Growth Volatility in Paraguay—Sources, Effects, Options”, The World
Bank, Washington D.C., forthcoming.
World Bank and IMF (2010). “Paraguay-Compendium of recommendations on debt
management”. Joint WB-IMF MTDS report, December, 2010.

66
World Bank and IMF (2012). Joint WB-IMF MTDS report, October, 2012.
Zhu (2003). Quantitative models for performance evaluation and benchmarking: data
envelopment analysis with spreadsheets and DEA excel solver. Massachusetts: Kluwer
Academic Publisher.
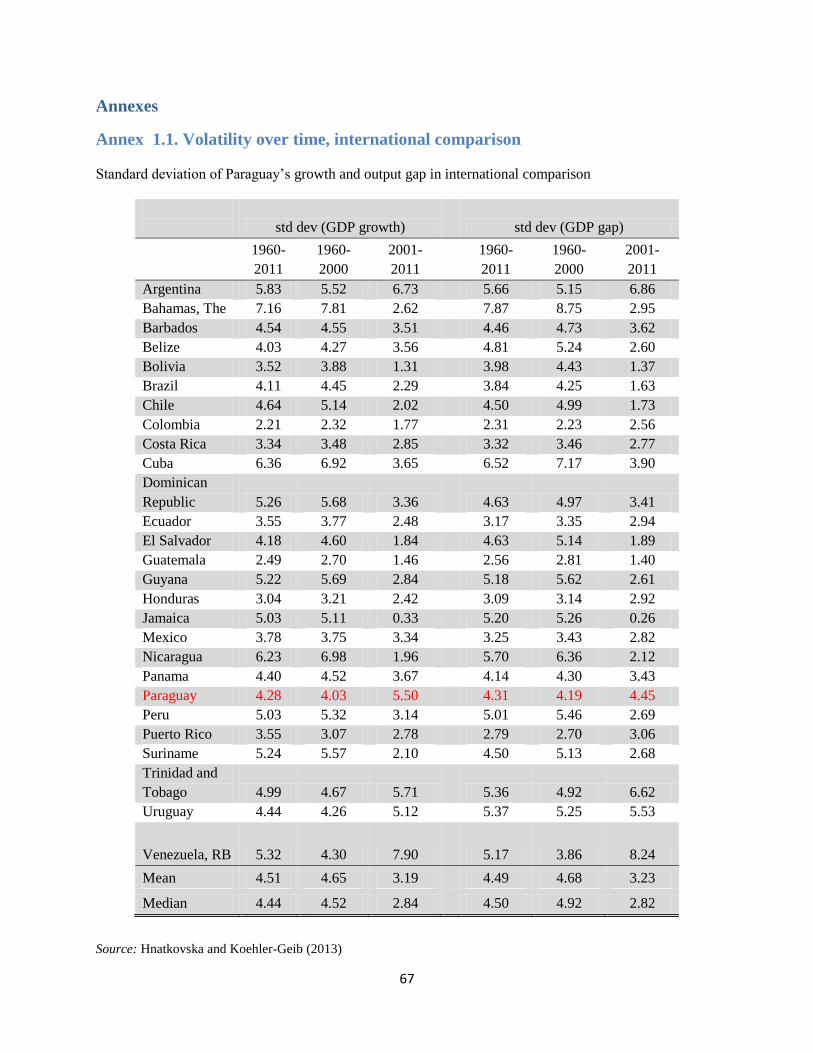
67
Annexes
Annex 1.1. Volatility over time, international comparison
Standard deviation of Paraguay’s growth and output gap in international comparison
std dev (GDP growth)
std dev (GDP gap)
1960-
2011
1960-
2000
2001-
2011
1960-
2011
1960-
2000
2001-
2011
Argentina 5.83 5.52 6.73
5.66 5.15 6.86
Bahamas, The 7.16 7.81 2.62
7.87 8.75 2.95
Barbados 4.54 4.55 3.51
4.46 4.73 3.62
Belize 4.03 4.27 3.56
4.81 5.24 2.60
Bolivia 3.52 3.88 1.31
3.98 4.43 1.37
Brazil 4.11 4.45 2.29
3.84 4.25 1.63
Chile 4.64 5.14 2.02
4.50 4.99 1.73
Colombia 2.21 2.32 1.77
2.31 2.23 2.56
Costa Rica 3.34 3.48 2.85
3.32 3.46 2.77
Cuba 6.36 6.92 3.65
6.52 7.17 3.90
Dominican
Republic 5.26 5.68 3.36
4.63 4.97 3.41
Ecuador 3.55 3.77 2.48
3.17 3.35 2.94
El Salvador 4.18 4.60 1.84
4.63 5.14 1.89
Guatemala 2.49 2.70 1.46
2.56 2.81 1.40
Guyana 5.22 5.69 2.84
5.18 5.62 2.61
Honduras 3.04 3.21 2.42
3.09 3.14 2.92
Jamaica 5.03 5.11 0.33
5.20 5.26 0.26
Mexico 3.78 3.75 3.34
3.25 3.43 2.82
Nicaragua 6.23 6.98 1.96
5.70 6.36 2.12
Panama 4.40 4.52 3.67
4.14 4.30 3.43
Paraguay 4.28 4.03 5.50
4.31 4.19 4.45
Peru 5.03 5.32 3.14
5.01 5.46 2.69
Puerto Rico 3.55 3.07 2.78
2.79 2.70 3.06
Suriname 5.24 5.57 2.10
4.50 5.13 2.68
Trinidad and
Tobago 4.99 4.67 5.71
5.36 4.92 6.62
Uruguay 4.44 4.26 5.12
5.37 5.25 5.53
Venezuela, RB 5.32 4.30 7.90
5.17 3.86 8.24
Mean 4.51 4.65 3.19
4.49 4.68 3.23
Median 4.44 4.52 2.84
4.50 4.92 2.82
Source: Hnatkovska and Koehler-Geib (2013)
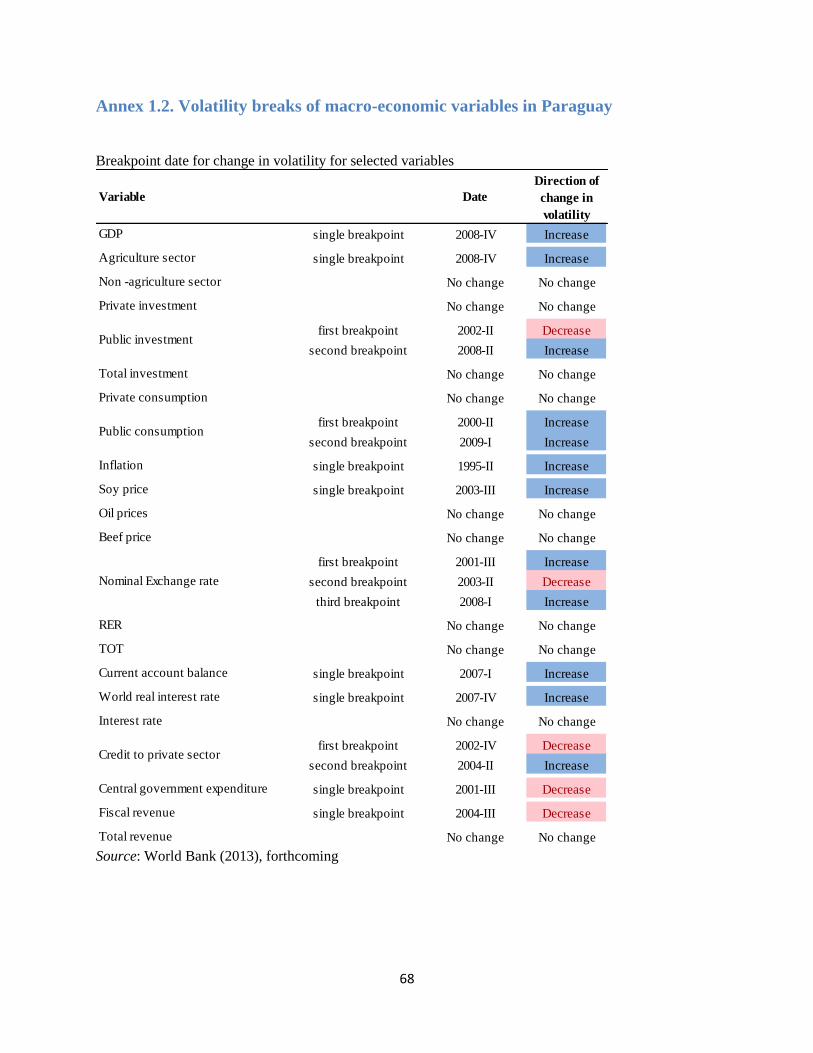
68
Annex 1.2. Volatility breaks of macro-economic variables in Paraguay
Breakpoint date for change in volatility for selected variables
Source: World Bank (2013), forthcoming
GDP single breakpoint 2008-IV Increase
Agriculture sector single breakpoint 2008-IV Increase
Non -agriculture sector No change No change
Private investment No change No change
first breakpoint 2002-II Decrease
second breakpoint 2008-II Increase
Total investment No change No change
Private consumption No change No change
first breakpoint 2000-II Increase
second breakpoint 2009-I Increase
Inflation single breakpoint 1995-II Increase
Soy price single breakpoint 2003-III Increase
Oil prices No change No change
Beef price No change No change
first breakpoint 2001-III Increase
second breakpoint 2003-II Decrease
third breakpoint 2008-I Increase
RER No change No change
TOT No change No change
Current account balance single breakpoint 2007-I Increase
World real interest rate single breakpoint 2007-IV Increase
Interest rate No change No change
first breakpoint 2002-IV Decrease
second breakpoint 2004-II Increase
Central government expenditure single breakpoint 2001-III Decrease
Fiscal revenue single breakpoint 2004-III Decrease
Total revenue No change No change
Credit to private sector
Nominal Exchange rate
Variable Date
Public consumption
Direction of
change in
volatility
Public investment
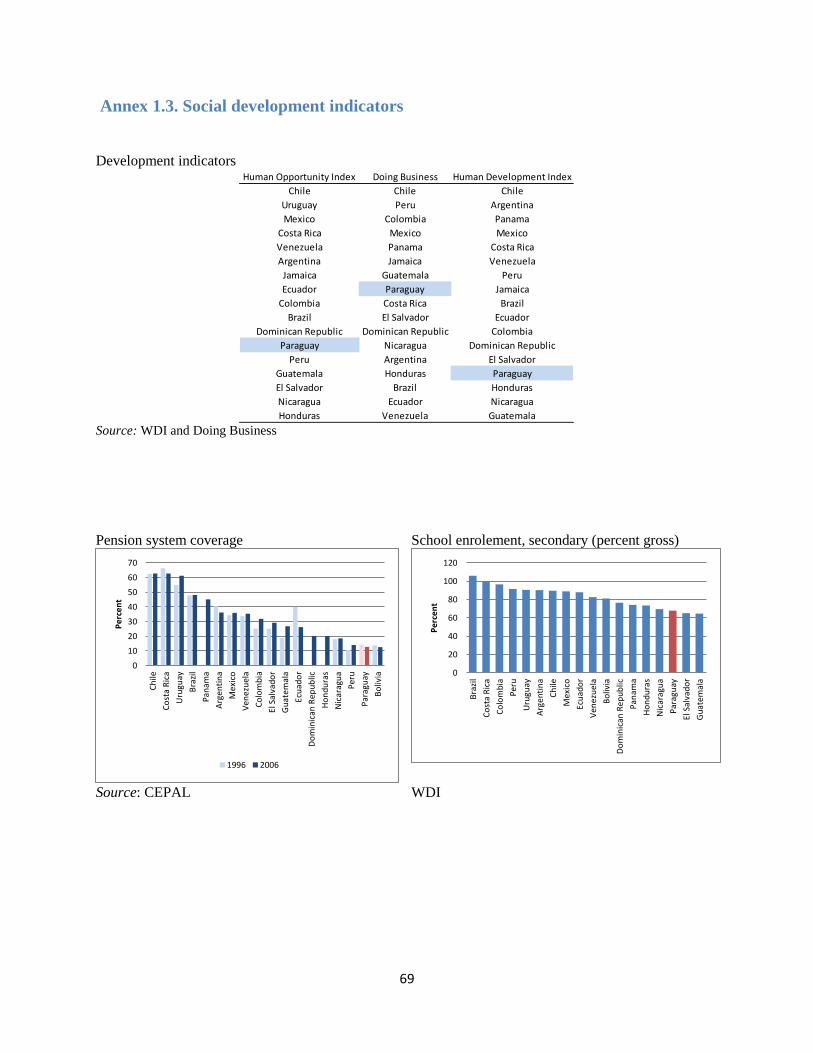
69
Annex 1.3. Social development indicators
Development indicators
Source: WDI and Doing Business
Pension system coverage School enrolement, secondary (percent gross)
Source: CEPAL WDI
Human Opportunity Index Doing Business Human Development Index
Chile Chile Chile
Uruguay Peru Argentina
Mexico Colombia Panama
Costa Rica Mexico Mexico
Venezuela Panama Costa Rica
Argentina Jamaica Venezuela
Jamaica Guatemala Peru
Ecuador Paraguay Jamaica
Colombia Costa Rica Brazil
Brazil El Salvador Ecuador
Dominican Republic Dominican Republic Colombia
Paraguay Nicaragua Dominican Republic
Peru Argentina El Salvador
Guatemala Honduras Paraguay
El Salvador Brazil Honduras
Nicaragua Ecuador Nicaragua
Honduras Venezuela Guatemala
0
10
20
30
40
50
60
70
Ch
ile
Co
sta
Ric
a
Uru
guay
Bra
zil
Pan
ama
Arg
enti
na
Mex
ico
Ve
nez
uel
a
Co
lom
bia
El S
alva
do
r
Gu
atem
ala
Ecu
ado
r
Do
min
ican
Rep
ub
lic
Ho
nd
ura
s
Nic
arag
ua
Per
u
Par
agu
ay
Bo
livia
Pe
rcen
t
1996 2006
0
20
40
60
80
100
120
Bra
zil
Co
sta
Ric
a
Co
lom
bia
Per
u
Uru
guay
Arg
enti
na
Ch
ile
Mex
ico
Ecu
ado
r
Ve
nez
uel
a
Bo
livia
Do
min
ican
Rep
ub
lic
Pan
ama
Ho
nd
ura
s
Nic
arag
ua
Par
agu
ay
El S
alva
do
r
Gu
atem
ala
Pe
rcen
t
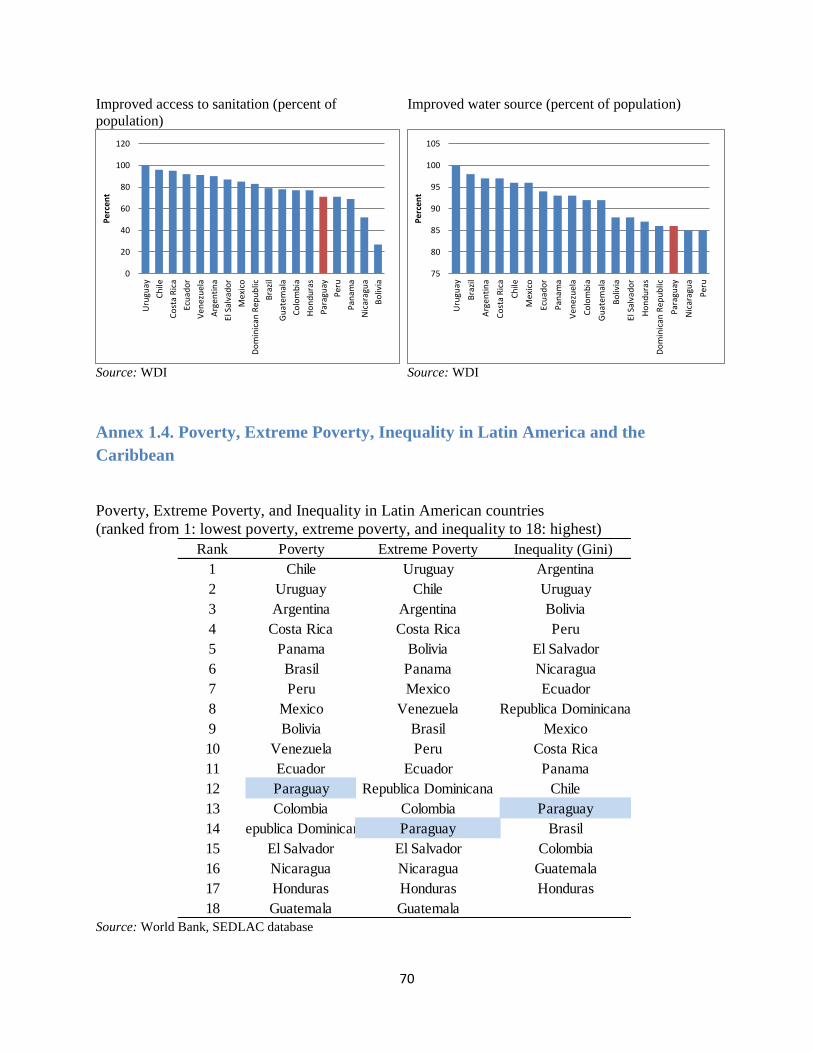
70
Improved access to sanitation (percent of
population)
Improved water source (percent of population)
Source: WDI Source: WDI
Annex 1.4. Poverty, Extreme Poverty, Inequality in Latin America and the
Caribbean
Poverty, Extreme Poverty, and Inequality in Latin American countries
(ranked from 1: lowest poverty, extreme poverty, and inequality to 18: highest)
Source: World Bank, SEDLAC database
0
20
40
60
80
100
120U
rugu
ay
Ch
ile
Co
sta
Ric
a
Ecu
ado
r
Ve
nez
uel
a
Arg
enti
na
El S
alva
do
r
Mex
ico
Do
min
ican
Rep
ub
lic
Bra
zil
Gu
atem
ala
Co
lom
bia
Ho
nd
ura
s
Par
agu
ay
Per
u
Pan
ama
Nic
arag
ua
Bo
livia
Pe
rcen
t
75
80
85
90
95
100
105
Uru
guay
Bra
zil
Arg
enti
na
Co
sta
Ric
a
Ch
ile
Mex
ico
Ecu
ado
r
Pan
ama
Ve
nez
uel
a
Co
lom
bia
Gu
atem
ala
Bo
livia
El S
alva
do
r
Ho
nd
ura
s
Do
min
ican
Rep
ub
lic
Par
agu
ay
Nic
arag
ua
Per
u
Pe
rcen
t
Rank Poverty Extreme Poverty Inequity (Gini)
1 Chile Uruguay Argentina
2 Uruguay Chile Uruguay
3 Argentina Argentina Bolivia
4 Costa Rica Costa Rica Peru
5 Panama Bolivia El Salvador
6 Brasil Panama Nicaragua
7 Peru Mexico Ecuador
8 Mexico Venezuela Republica Dominicana
9 Bolivia Brasil Mexico
10 Venezuela Peru Costa Rica
11 Ecuador Ecuador Panama
12 Paraguay Republica Dominicana Chile
13 Colombia Colombia Paraguay
14 Republica Dominicana Paraguay Brasil
15 El Salvador El Salvador Colombia
16 Nicaragua Nicaragua Guatemala
17 Honduras Honduras Honduras
18 Guatemala Guatemala
Inequality (Gini)

71
Annex 4.1: Data envelopment analysis (DEA)
Relative efficiency of spending is assessed by comparing expenditure levels and outcomes in
Paraguay and a sample of countries with a similar population and per capita income as well as in a
within country comparison at the departmental level. As described and applied in Verhoeven,
Gunnarson, and Lugaresi (2007), this is done using DEA, which was developed for estimating best-
practice frontiers and relative efficiency in business applications. In this case, DEA is used to assess
the relationship between spending (inputs) and outcomes (production) across countries or in the
second analysis across departments.
Efficiency and the Best-Practice Frontier
Verhoeven, Gunnarson, and Lugaresi (2007)
The framework of production efficiency can be used to assess the relative efficiency with which
production units convert input items into production items (i.e., technical efficiency). In the figure
above, as production unit A achieves the same or more product items as production unit E with fewer
input items, unit A is more efficient16 than unit E. Similarly, unit E is less efficient than units B, C,
and D. The difference between the input items used by units A and E can be used to measure the
inefficiency of unit E relative to unit A. (Alternatively, this could be measured by the difference in
production items.) The most efficient units in a sample provide the parameters for an initial estimate
of the best-practice frontier. One of the most common ways for determining the best-practice (or
production possibility) frontier is DEA (a more detailed discussion of DEA can be found in Zhu,
2003). The best-practice frontier is illustrated in the figure above by the solid line that connects the
best-practice units A, B, C, and F. Because these are the most efficient units in the sample, they are
assigned an efficiency score of 1. The efficiency scores of the less efficient units (D and E) depend
on their distance to the best-practice frontier. Several measures of the distance to the frontier can be
used. In the current analysis the Farrell input efficiency score is used.
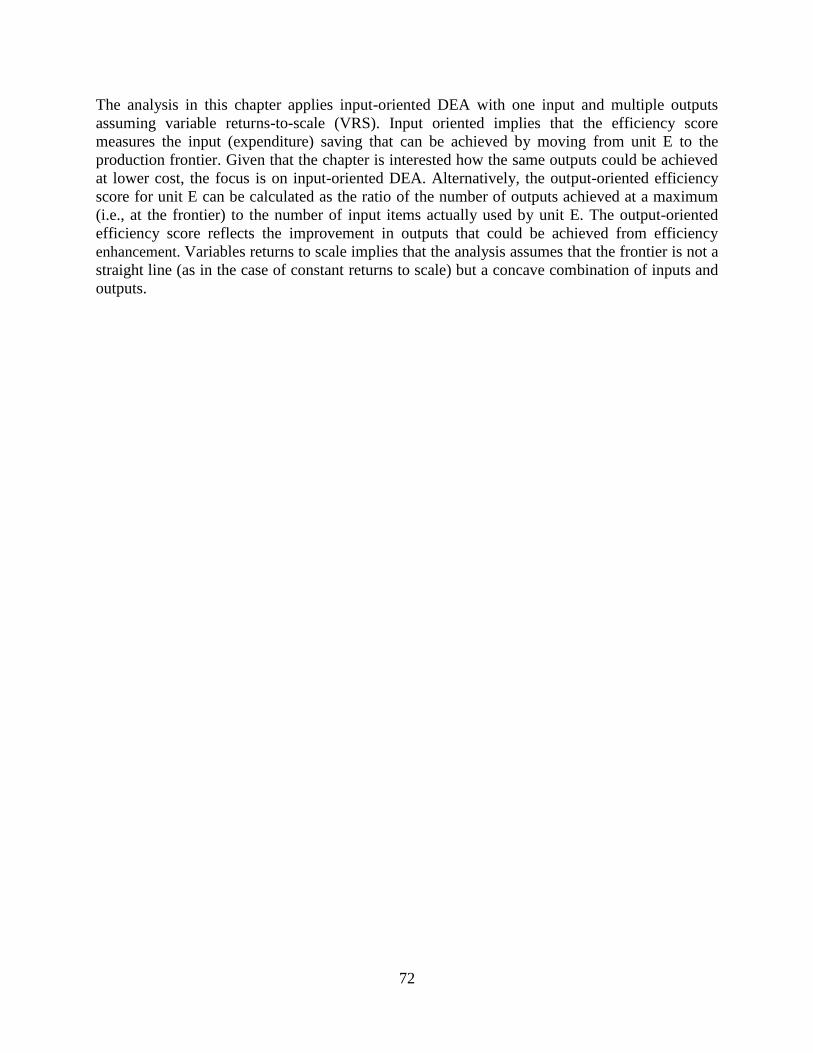
72
The analysis in this chapter applies input-oriented DEA with one input and multiple outputs
assuming variable returns-to-scale (VRS). Input oriented implies that the efficiency score
measures the input (expenditure) saving that can be achieved by moving from unit E to the
production frontier. Given that the chapter is interested how the same outputs could be achieved
at lower cost, the focus is on input-oriented DEA. Alternatively, the output-oriented efficiency
score for unit E can be calculated as the ratio of the number of outputs achieved at a maximum
(i.e., at the frontier) to the number of input items actually used by unit E. The output-oriented
efficiency score reflects the improvement in outputs that could be achieved from efficiency
enhancement. Variables returns to scale implies that the analysis assumes that the frontier is not a
straight line (as in the case of constant returns to scale) but a concave combination of inputs and
outputs.
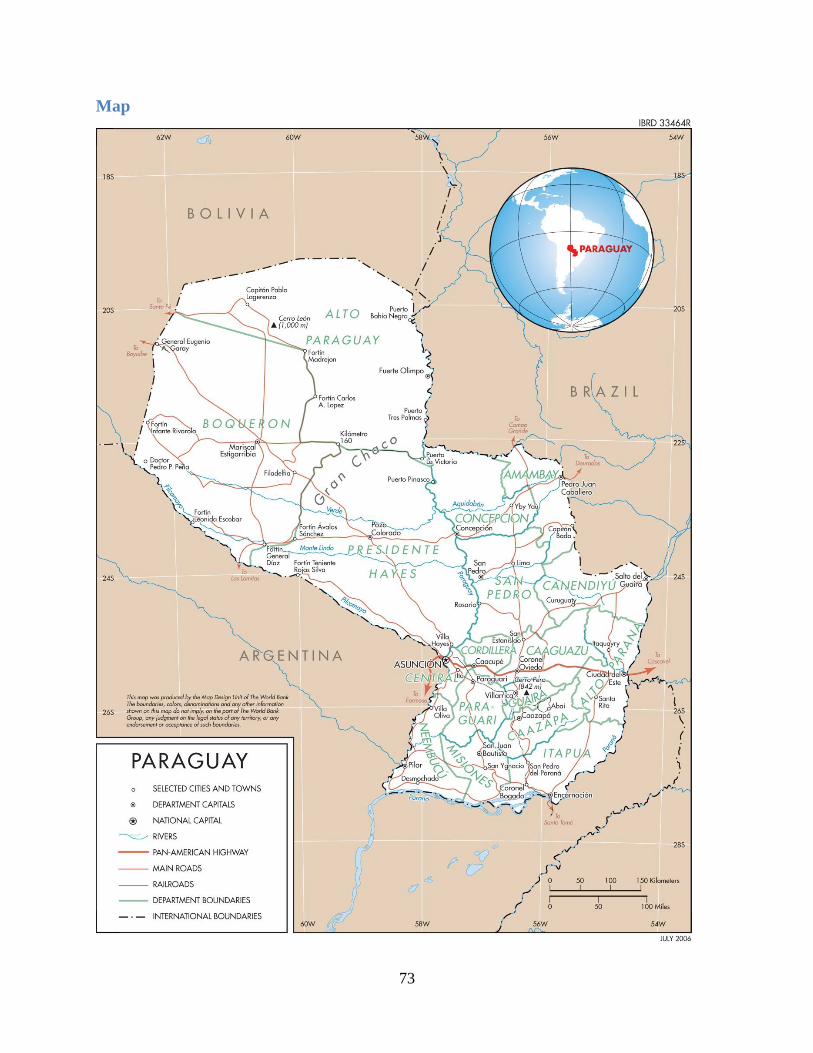
73
Map