a publication of the arizona governor’s moving forward! police science journal vol 3... · sity...
TRANSCRIPT


Welcome to the fourth issue of the Ari-
zona Police Science Journal. The Gov-
ernor’s Office of Highway Safety (GOHS)
has continued to actively support this
publication over the last three years
since its inception.
In 2012, awareness of the APSJ has
grown tremendously. The “Journal” has
been presented to the National Highway
Transportation Safety Administration, the
International Association of Chiefs of
Police, and many law enforcement and
public safety agencies throughout the
Southwest.
Officers and attorneys throughout the
state have expressed their appreciation
for training and updates, such as Case
Moving Forward!
Abstract:
OHV recreation is one of the fastest growing
activities on public lands in the nation. The challenges
that this recreational activity has presented to land man-
agement agencies and conservation agencies are vast.
As stewards of wildlife and the habitats that they dwell in,
the Arizona Game and Fish Department (AGFD) must
meet the challenge of managing OHV recreation through
dedicated efforts in law enforcement, information and
education and habitat management. Additionally, the
AGFD has taken the responsibility to proactively form
collaborative alliances with a common goal of decreasing
the number of OHV injuries and fatalities in Arizona.
Truth in Science
February, 2013
Volume 3, Issue 1
Arizona Police Science Journal
Inside this issue:
Moving Forward! 1
The Arizona Game & Fish De-
partment Off-Highway Vehicle
(OHV) Program
1
Impaired Driver Program Up-
dates and Expectations
6
Tire-Road Friction, Drag Factor
Deceleration
7
Integrity in the Learning Environ-
ment
18
Miranda Warnings & FSTs 19
Article Submission Require-
ments and Protocols
20
Editorial Staff 21
Advisory Board Members 22
Law Review and Legal Updates, and
technical scientific articles such as
those provided by Dr. Rudy Limpert and
the DPS Crime Laboratory. Much of
this training and information is not easily
accessible outside of the metropolitan
areas in the state.
This Journal serves not only as a train-
ing and information sharing medium,
but also as an avenue for officers and
criminalists to publish and share infor-
mation. We invite you to submit your
work and research, or timely training
content for publication.
Daven Byrd
Executive Editor, APSJ
A publication of the Arizona Governor’s
Office of Highway Safety
THE ARIZONA GAME AND FISH DEPARTMENT
OFF-HIGHWAY VEHICLE (OHV) PROGRAM
Jimmy Simmons, OHV Law Enforcement Program Manager
The Growth of the OHV Industry
The OHV industry has grown dramatically in
the past 20 years. New technology and machines
appear on the market just about every year. Fueled by
the American culture to have the latest and greatest,
the fastest selling OHV machines are the sport side-by-
side models that are rated at speeds over 60 miles per
hour with 1000 cc motors and incredible suspension
systems. Bigger engines and structural design im-
provements now allow previously unforeseen high
travel speeds over rough terrain. Some of the newer
machines have unbelievable capabilities and they are
only getting more advanced. To demonstrate the
growth of OHV’s in Arizona, Figure 1 contains registra-
tion and titling data from the Arizona Motor Vehicle
D e p a r t m e n t .

Page 3 Volume 3, Issue 1
Arizona Game and Fish Department
OHV Program Philosophy
To be the leader in Arizona off highway vehicle education and habitat protection efforts by providing effective information and enforcement programs that promote safe, ethical and responsible OHV
use across Arizona

In December 1998, there were 51,453 All Ter-
rain Vehicles (ATV’s) & All Terrain Cycles (ATC’s), bet-
ter known as quads and three wheelers in Arizona. In
December 2010, there were 277,152 ATV’s & ATC’s
titled or registered in Arizona, a 438% increase in 12
years. Current Arizona Game and Fish Department and
MVD estimates indicate there are in excess of over
400,000 OHV’s in Arizona, and that number is growing
just as rapidly as the industry meets the demand.
OHV Injuries in Arizona
The rapid growth in the OHV industry and
overwhelming public attraction to OHV recreation has
resulted in a statewide increase in injuries and fatalities.
According to the Arizona Department of Health Services
(ADHS) data, between 2003 and 2010, there were 209
OHV-related fatalities (an average of 30 per year), 500
inpatient hospitalizations and 1,921 emergency depart-
ment visits (not including data from federal or tribal hos-
pitals). Many of these injuries and fatalities may be
attributed to a lack of OHV safety education for the op-
erators, riding beyond an operator’s ability, inability for
land management agencies to manage OHV recreation
at a pace consistent with growth, a shortage of law en-
forcement officers specific to OHV management and a
lack of appropriate OHV laws that enable officers to
enforce irresponsible, unsafe OHV operation.
Other Concerns
In addition to the public safety concerns, irre-
sponsible, unsafe OHV operation creates habitat dam-
age and a proliferation of roads across the landscape.
In reaction to these types of operation, state and federal
land management agencies have or are in the process
of re-evaluating their travel management rules which will
undoubtedly result in some of the existing access on
United States Forest Service (USFS) and Bureau of
Land Management (BLM) lands to be redefined, limited
or closed indefinitely. This is in addition to those lands
that have already been closed or access that has been
limited due to prior actions by these agencies in re-
sponse to OHV recreation. The AGFD is heavily in-
volved in OHV recreation management because of its
associated impacts to the environment and because the
agency’s public trust responsibility to protect Arizona’s
diverse wildlife resources.
Legislation and Funding
Until Senate Bill 1167 passed in June 2008
and became effective January 2009, the AGFD’s efforts
to protect wildlife resources from OHV damage and to
provide programs for safe OHV recreation in Arizona
were limited. Senate Bill 1167 amended Article 20 of
Page 4 Volume 3, Issue 1
Arizona Revised Statutes by adding several statutes that
allow AGFD and other law enforcement agencies state-
wide to effectively enforce unsafe and irresponsible OHV
operation. The legislation also created the OHV user
indicia, more commonly referred to as the “OHV Decal”.
The legislation requires that an OHV decal must be dis-
played on all vehicles that are specifically designed by
the manufacturer for travel over unimproved terrain, hav-
ing an unladen weight of 1,800 pounds or less, while the
vehicle is being operated on public or state trust lands.
Funding from the $25.00 decal goes to the OHV
Recreation Fund which is divided between the Arizona
State Parks Department (60%), Arizona State Land De-
partment (5%) and the AGFD (35%). The 35% appropri-
ated to the AGFD is used to provide OHV information and
education programs related to OHV safety, OHV impacts
on the environment and responsible OHV use, as well as
implementing and supporting a statewide OHV law en-
forcement program.
The AGFD is mandated by state statute to em-
ploy seven full-time law enforcement officers to enforce
OHV laws statewide. To date, the AGFD has employed
the seven full-time officers and has hired two additional
officers that are partially funded from other sources to
assist in OHV law enforcement efforts across the state.
New Officers and Their Duties
To train and equip these officers, the AGFD
purchased trucks, bullet proof vests, firearms, home of-
fice equipment, and patrol equipment, including fully
marked law enforcement OHV’s to allow officers to patrol
remote OHVareas.
The authorities granted by the legislation and
subsequent deployment of specific OHV law enforcement
officers has expanded the AGFD role as a resource con-
servation agency. Historically, the AGFD has only en-
forced Arizona Revised Statutes (A.R.S.) Title 17 (Game
and Fish) and A.R.S. Title 5 (state boating laws) but the
new legislation was primarily placed within A.R.S. Title 28
(Transportation and Traffic Laws). Enforcing boating
laws is somewhat similar to Title 28 and has long re-
quired AGFD officers to become proficient in the use of
Horizontal Gaze Nystagmus (HGN) and other seated field
sobriety tests to detect impaired operation although,
AGFD officers rarely took traffic enforcement actions
unless an immediate public safety threat occurred in their
presence (i.e. reckless driving or DUI). Even then, AGFD
officers generally requested officers from other agencies
such as DPS, county, or municipal agencies to take dis-
position of these cases because it was not within the
scope of the agency’s eligible or allowable duties. Subse-
quent to the new legislation, AGFD recognized the neces-
sity to educate and train officers in the subject matter of
Driving Under the Influence (DUI) enforcement and civil
traffic law and has taken several steps towards this goal.
Recently, the AGFD collaborated with the
Department of Public Safety (DPS) to train 25 AGFD
officers in the Advanced Roadside Impaired Driver En-
forcement (ARIDE). Additionally, eight AGFD officers
have become Drug Recognition Experts which will en-
able the AGFD to better detect and apprehend drugged
boaters and OHV users.
Adapting Through Training
The AGFD has transitioned from an agency
that traditionally only enforced wildlife conservation laws
to a statewide recreational law enforcement organiza-
tion. AGFD has embraced the role and responsibility of
being the lead boating enforcement and OHV enforce-
ment agency for the State.
Because of this expanding role, more and
more conservation officers throughout the United States
are facing lethal force encounters. The equipment and
officer safety and situational awareness training that
AGFD officers receive allow them to operate alone, in
remote settings, while maintaining safety and depend-
ability.
New OHV enforcement officers and wildlife
managers attend a 40 hour OHV Law Enforcement
School as part of their post academy training and prior
to heading to the field with Field Training Officers.
Officers receive training in basic riding safety skill, OHV
laws and legalities, DUI, natural resource violation, evi-
dence collection, tactical firearm courses from an OHV,
and OHV breakdowns and maintenance. These classes
culminate in a final day of advanced riding skills, includ-
ing an all day ride with as many challenges as possible
to strengthen the students riding abilities.
Page 5 Volume 3, Issue 1
The AGFD currently requires officers and em-
ployees to be trained in the basic ATV Saftey Institute
(ASI) four hour riding course. This training is also pro-
vided to other law enforcement and conservation agency
personnel by the Department. An Arizona specific on-line
safety course is currently available on the AGFD website
at www.azgfd.gov/ohv and a public hands-on OHV safety
course is currently being developed. The AGFD is com-
mitted to being the best state wildlife conservation agency
through continuous evaluation and improvement of its
programs and through professional development of its
employees.
Safety and Education
Ensuring safe OHV recreation requires commit-
ted collaborative efforts to assure a culture of safety by
the state’s recreational OHV community. By forming alli-
ances with groups such as the Arizona Department of
Health Services (ADHS), Injury Prevention Advisory
Council (IPAC), Southwest Alliance for Recreational
Safety (SWA4RS), OHV Ambassadors (OHVA), the Na-
tional OHV Conservation Council (NOHVCC) and the
OHV Advisory Group (OHVAG), the AGFD and partners
will continue to educate the public about safe, responsi-
ble OHV use. Although each of these groups have
unique missions, all share the common goal to promote
OHV safety and education at a level that will significantly
reduce OHV injuries and fatalities in Arizona. AGFD will
continue to work closely with these groups and others to
inform OHV users about the importance of wearing
proper OHV safety equipment (goggles, helmets, etc.) as
well as safe, responsible riding practices.
Final Considerations
The AGFD recognizes that OHV recreation and related
industry will continue to grow and become more popular
across the nation and although the challenges in OHV
law enforcement and safety education are large, the

Page 6 Volume 3, Issue 1
4. Schacter, Alana (October 26, 2011). Arizona Depart-
ment of Health Services (ADHS), Off-Highway Vehicle
Injuries Among Arizona Residents, Power Point for the
Arizona Game and Fish Department, Off-Highway Vehi-
cle Conference.
Jimmy Simmons has served in law enforcement for over
18 years, both with the Arizona Game and Fish Depart-
ment and the Arizona Department of Public Safety as an
officer, and is currently the Off Highway Vehicle Law En-
forcement Program Manager at the Phoenix Headquar-
ters of the Arizona Game and Fish Department. Jimmy is
also an Advisory Board Member for the Arizona Police
Science Journal.
agency i s commi t ted to i t s m iss ion .
The AGFD will strive to proactively meet those chal-
lenges by effectively reducing OHV collisions and work-
ing with OHV users and land management agencies to
maintain public access for safe, responsible OHV riding
practices.
References
1. Forty-Eighth Legislature (2008). Senate Bill 1167,
State of Arizona Senate, Second Regular
S e s s i o n .
2. Matthew Bender & Company, Inc. (2010). Arizona
Criminal and Traffic Law Manual (2010-2011
Edition).
3. Point in Time Vehicles Registered by County (July
31, 2011). Retrieved October 20, 2011, from
http://www.azdot/mvd/statistics/registered
Vehicles.asp
the toughest DUI/Impaired Driver laws in the nation.
Every stride made toward stricter DUI laws in Arizona is a
result of your collective enforcement effort.
Arizona law enforcement personnel exhibit a high level of
expertise in impaired driver recognition for two main rea-
sons: training and adherence to program standards. We
cannot overstate the importance of recognizing the im-
paired driver. Nor can we overstate the importance of
adherence to program standards associated with im-
paired driver recognition.
Expectations remain high for those attending HGN/SFST,
ARIDE and DRE training, and not just from a practical
standpoint. The training classes associated with impaired
driver recognition carry the expectation of maintaining
strict standards at the National and State level.
We would like to take this opportunity to thank you for
continuing the fight against impaired driving. The time
you all spend on the road during regular enforcement
and special details during DUI Task Force events
counts. The time you endure away from your families
and personal lives to attend training or teach counts.
The time you take to make sure every impaired driver
faces justice in court counts. Time spent training, en-
forcing and prosecuting impaired drivers continues to
reinforce the dedication you all have toward making city,
county, and state roadways safer for our communities
as well as for each other. The effort to maintain high
standards in DUI enforcement and seek additional ways
to enhance the process to the benefit of the victims as
well as prevention of the crime provided encouragement
to our state lawmakers fueling the desire to construct
Governor’s Office of Highway Safety
Impaired Driver Program
Bridget Reutter, Impaired Driver Programs Coordinator

Page 7 Volume 3, Issue 1
family is relying on you to exemplify integrity in testimony.
A requirement to increase training hours to retain certifi-
cation assists in securing the premier status Arizona con-
t i nues to ma in ta in among the s ta tes .
Recent revisions to the State Standards reflect the desire
to ensure Arizona law enforcement personnel receive the
most current training available in the area of impaired
driver recognition. The Governor’s Office of Highway
Safety maintains a high level of support for the programs,
participants and practitioners as well as the ultimate re-
sponsibility for ensuring program accountability.
Knowing and understanding the purpose of the training
as well as the training standards is imperative.
In light of the recent decision from courts to apply the
Daubert standard, recitation of your training, knowing
the background of the impaired driver recognition pro-
grams associated with your training, and adherence to
the training standards are pertinent to your ability to
provide effective (and admissible) testimony. Someone
is relying on your knowledge, skills and ability to recog-
nize impairment, know and follow training standards,
and articulate the facts of a case. A victim or victim’s
Tire-Road Friction, Drag Factor and Deceleration
Rudy Limpert and Dennis Andrews
www.pcbrakeinc.com
After-impact decelerations are of critical importance
when calculating impact speeds. They are used to com-
pute speeds immediately after impact, which then are
used in the impulse analysis to compute speeds immedi-
ately before impact. Before-impact decelerations are
extremely critical for travel speed calculations and cau-
sation and accident avoidance analysis.
Basic Physics
Only the fundamentals are reviewed here. Vehicle
Motion Analysis is discussed in “Motor Vehicle Accident
Reconstruction and Cause Analysis”, 7th edition by Rudolf
L i m p e r t , 2 0 1 2 , L e x i s N e x i s P u b l i s h e r .
Introduction
Many years ago when SAE International sold our
reconstruction software LARM2 software, I received a
phone call from a Reconstructionist who had bought the
program. He stated that he was very disappointed that
LARM2 did not provide any drag factors for vehicles
after impact. When I asked him what the case was all
about, he did not know – he just needed the numbers.
When I told him that the after-impact drag factor de-
pends on the run-out dynamics including information on
wheel(s) locked, terrain, grade, secondary energy such
as impact with trees, rolling resistance, drag sled factor,
skid tests, etc. he was surprised.

The MARC1 software programs discussed in this paper
are available from www.pcbrakeinc.com as a fully func-
tioning no-charge MARC1-2013 download.
A vehicle slows its speed when it decelerates. De-
celeration is velocity change or decrease divided by the
time period during which the vehicle decelerates.
Deceleration a = (V2 –V1) / (t2 -t1); ft/sec2
Subscript 1 designates beginning of braking, subscript 2
end of braking. No matter, what terms are used, a vehi-
cle slows only when its velocity measured in ft/sec
changes its value per unit time, measured in seconds.
When coming to a complete stop and assuming decel-
eration is constant, the distance is:
Stopping Distance S = V2/(2a); ft
Deceleration a is measured in ft/sec2, velocity V in ft/
sec.
Many motion equations use these two terms and
other coherent measuring units. Coherent units means
that the left side of the equation {feet} relates directly in
a one-to-one relationship to the right side of the equa-
tion {(ft/sec)2/(ft/sec2) = feet} However, for short-term
convenience, stopping distance equations are often
used where velocity is measured in miles per hour, de-
celeration in g-units, and distance in feet. An example
of a popular and widely used incoherent equation is S =
V2/(30f) where velocity V is measured in mph, f in g-
units and distance S in ft. The number 30 is a conver-
Page 8 Volume 3, Issue 1
sion number deriving from using an incoherent mixture of
units. See page 20-41 of the 7th edition for derivation
details. Matters become confusing when concepts are
used where coherent units must be used such as in en-
ergy balance which is measured in lb/ft.
Case 1: The Accident Scene
We will discuss an actual accident illustrated below in
the police scene photograph. A pickup truck impacted a
boy riding a bicycle. The bike came from the right side of
the truck with the truck traveling south.
The left front tire skidded approximately 88 feet, the right
front 86 feet. No rear tire skid marks were observed at the
scene. The bike was impacted by the left front corner of
the truck approximately 9 feet before the truck came to
rest. The legal speed limit was 30 mph. The truck had
the legal right-of-way. The rider of the bike was a young 7
-year old boy.
Inspection of the accident scene photographs clearly
show the front tire skid marks with darker tread edge
markings of the right front tire. The tire marks continued
to the rest position of the truck’s front tires. No rear tire
skid marks were shown in any of the photographs.
An inspection of the 1982 Dodge flatbed pickup truck
showed that one rear brake was leaking thus not produc-
ing any rear braking force. The static front and rear axle
loads, wheel base were measured, the empty center-of-
gravity height estimated.

We must compute the most probable speed of the
truck at the beginning of skid marks, the travel speed,
the impact speed against the bike, and perform an acci-
dent avoidance analysis. To do that, we must determine
the probable deceleration or drag factor of the subject
truck at the time of the accident.
Case 1: Dodge Accident Site Tire Road Friction Co-
efficient
At the time of our accident site inspection no case-
specific tire marks were visible. The truck was not avail-
able for skid measurements. Consequently, our first job
is to determine the “stickiness” of the accident site
where the skid marks were measured by the police. It is
important to make any tire-road friction coefficient meas-
urements under conditions similar to those existing at
the time of the accident. Using a common drag boot
frequently employed by investigating officers and ex-
perts yielded the following: an average drag force of 37
lb in five tests for a drag boot weight of 50 lb resulted in
an average drag boot factor of 37/50 = 0.74. All we
have accomplished thus far is giving the road a name in
terms of a 0.74 drag boot factor existing at the time of
our inspection. This number does not tell us anything
about the deceleration the truck actually experienced at
the time of the crash. However, in many cases the
“stickiness name” of the road measured with a drag boot
is all we have to start with!
At the accident site we also used a pickup truck to
conduct maximum braking effectiveness stops from a
speed of 35 mph using a G-analyst resulting in an aver-
age deceleration of 0.84g in five skid tests. In each test
the ABS system began to modulate on all four brakes.
Now we have given the accident site an additional name
indicating an average deceleration of 0.84g with all four
brakes ABS modulating with our truck tires.
What tire-road friction coefficient the braked tires of
the subject truck experienced depends upon how our
truck tires compare to the subject tires, and how much
difference exists between a locked tire (Dodge) and
peak friction tire (our truck). However, we safely assume
that it is larger than the drag boot and lower than the
ABS value. Braking force/slip (µ-slip) curves typically
show little difference between peak and sliding friction
for dry roadways (Figure 22-3 of 7th edition). Conse-
quently, we assign a tire-road friction coefficient of fsite =
(0.74 + 0.84)/2 = 0.79 to the subject road at the time of
the accident. Consequently, assuming no other case-
specific data become available, we must support and
defend in court an accident-site specific tire-road friction
coefficient of 0.79. As we will see from the speed analy-
sis, in this particular case an accurate probable drag
factor is more important than if the skid mark length had
Page 9 Volume 3, Issue 1
been 200 feet instead of only 88 feet.
Comparing the measured tire road friction coefficient
of 0.79 to typical values published in the literature shows
ranges 0.65 – 0.9 for sliding and 0.80 to 1.00 for peak
friction on concrete/asphalt, polished to new, dry (Table
22-3 of 7th edition).
State highway departments regularly measure wet
skid resistance of highways for inventory and statistical
analysis. Test method and equipment are covered by
standard ASTM E 274 (American Society of Testing and
Materials). The test tires to be used with the skid trailer
are specified in ribbed (treaded) ASTM E 501, and
smooth (bald) in ASTM E 524. From a reconstruction
view point, these numbers only give a particular highway
a “ wet friction” name and may not indicate what the wet
friction of a specific tire may have been. However, de-
pending upon the accident, it may be an additional data
source.
Case 1: Deceleration of the Dodge Pickup Truck
We must now determine how much of the tire-road
friction of 0.79 did the Dodge actually use at the time of
the accident. Experts often stumble around by quoting
braking efficiencies and other short cuts, especially for
commercial vehicle equipped with air brakes.
The deceleration of a vehicle is determined from
Newton’s second law of motion as well as specific vehicle
dimensions and static load distribution. Newton’s second
law states that the deceleration or drag factor is equal to
all slowing forces acting on the vehicle divided by vehicle
weight:
a/g = ΣF/W = FfrontBrake/W; g-units
The driver-only Dodge flatbed truck had static axle loads
of front 3200 lb and rear 3100 lb, wheel base 11.8 ft and
center-of-gravity height 29 inches estimated.
The front braking force based on the static front axle load
is:
Fx = (Fz)(fsite) = (3200)(0.79) = 2528 lb.
Consequently, the approximate deceleration based on
the static front axle load is:
(a/g)static = (2528)/6300 = 0.401g
Using a deceleration of 0.401g produces a load transfer
upon the front axle to further increase the front braking
force. MARC1-E4 was developed to make the first and
second calculation.
We use MARC1- E4 to determine the probable decel-
eration. MARC1- E4 printout is shown below. Using the
specific vehicle dimensions and a tire-road friction coeffi-

cient of 0.79 yields a deceleration of 0.466g or 15.00 ft/
sec2 with the only front brakes.
Varying the center-of-gravity height by +/- 3 inches will
only slightly affect deceleration. The deceleration of
0.466g includes the contribution of load transfer as
shown in the MARC1=E5 printout. The front braking
force without load transfer of (2)(1264) lb has increased
to (2)(1468) lb.
Had the rear brakes been working properly and the front
brakes failed, the drag factor would have been only
0.326g.
Page 10 Volume 3, Issue 1
Had all brakes been functioning properly, the decelera-
tion would have been 0.79g with all four brakes locked.
Case 1: Speed of the Dodge Truck when Brake Pedal
Is Applied.
The probable speed of the Dodge at the moment of
brake lockup would have been:
V = [(2)(15.00)(88)]1/2 = 51.38 ft/sec or 35.05 mph
The speed of the truck at the moment the brake pedal
was first applied was approximately 36.33 mph as shown
by MARC1-S. The increase in speed above the value at

brake lockup is caused by some deceleration that exists
when the deceleration increases from zero value to the
maximum deceleration at the moment of brake lockup.
Stated differently, the travel speed slows from a higher
value to the level at brake lockup. In this case, decelera-
tion build-up time is greater since the hydraulic rear
brake failure causes a longer brake pedal travel.
The driver began to react to the bike approaching from
his right side 212.98 feet or approximately 213 from the
point of rest. Using the data from MARC1-S, for a driver
reaction time of 1.5 sec, vehicle deceleration began to
rise approximately 213 – (80 + 32) = 101 feet from the
point of rest.
The speed of the truck at the moment of impact with the
bike was:
V = [(51.38)2 - (2)(15.00)(88 – 9)]1/2 = 16.43 ft/sec or
11.21 mph.
Case 1: Accident Causation Analysis
Page 11 Volume 3, Issue 1
Travelling at the Speed Limit of 30 mph
When traveling at 30 mph or 44 ft/sec and locking the
front brake the stopping distance would have been:
S = (442)/[(2)(15.00)] = 64.5ft
Consequently, had the driver driven at the speed limit of
30 mph and locked the front brakes at the same location
as in the accident, the truck would have stopped ap-
proximately 88 – 9 – 64.5 = 14.5 ft from POI.
Traveling at 36.33 mph with Good Brakes
With good brakes and all brakes locked the deceleration
would have been (0.79)(32.2) = 25.44 ft/sec2. The drag
factor is 0.79g. The speed is (36.33)(1.466) = 53.26 ft/
sec. The stopping distance would have been:
S = (53.262)/[(2)(25.44))] = 55.75 ft.
Consequently, the truck would have stopped 88 – 9 –
55.75 = 23.25 ft from POI.
The case settled due to excessive speed and defective
safety inspection.

Case 1: Assume the Dodge Accident Site Had a 7-
degree Down-slope
A slope angle α = 7 degrees equals a slope 12.2%,
since tan7 = 0.122.
The tire forces between ground and Dodge change. See
Case 3 for details. The vertical weight force becomes
Wcosα, and the downhill gravity force becomes Wsinα.
The downhill force will do two things, namely place more
weight onto the front axle due to weight transfer similar
to the regular load transfer due to braking as well as it
forces the Dodge move downhill. The MARC1 – E5 is
shown below. The deceleration now becomes 0.344g or
11.08 ft/sec2. The probable speed at begin of skidding
with a drag factor of 0.344 would have been 30 mph
instead of 35.2 mph on the level road with a drag factor
Page 12 Volume 3, Issue 1
of 0.466g.
Using any simplified method of subtracting the slope from
the level deceleration such as 0.47 – 0.12 = 0.35g, a
slightly larger value than 0.344g.
If the rear brakes had been functioning properly and the
front brakes failed, the drag factor would have been only
0.205g indicating that on a downhill slope the rear brakes
are not as effective as the front brakes. On a seven-
degree uphill grade the rear brakes-only drag factor
would have been 0.442g
If the rear brakes had also been locked, then the decel-
eration would have been 0.662g as shown in the MARC1-
E5 below. The approximate downhill drag factor would
have been 0.79 – 0.12 = 0.67g.

Before we leave Case 1, view the next photo-
graph . The tire marks were made by a Toyota Camry
with the brakes applied at maximum pedal effort near
150 lb. The vehicle was decelerating at maximum
wheels-unlocked effectiveness with the ABS system not
noticeably modulating. The roadway was a stretch of
highway not used for regular traffic. The tire marks are
visible when viewed in the direction of travel as shown in
the photo and are only faintly visible in the other direc-
tion. Without any additional information relative to pedal
force, etc. what “stickiness” name can be assigned to
the road? The tire marks appear to indicate front tire
braking marks. Since the tire tread edges appear to be
Page 13 Volume 3, Issue 1
darkened, we can assume some above-moderate braking
effort. Since the photograph indicates that both front
brakes were working effectively, we can safely assume
that the rear brakes were working also. This conclusion is
based upon the Camry’s diagonal brake system where
the individual front brakes are connected to the opposite
rear brakes. However, without an inspection of the sub-
ject vehicle’s brake system, we cannot be entirely certain
what the rear brakes did.
Assuming the inspection shows no brake system de-
fect, and no drag boot or other skid test has been per-
formed, the stickiness of the roadway would most likely

be 0.80 to 0.90 based solely on published data (Table
22-3 of 7th Edition).
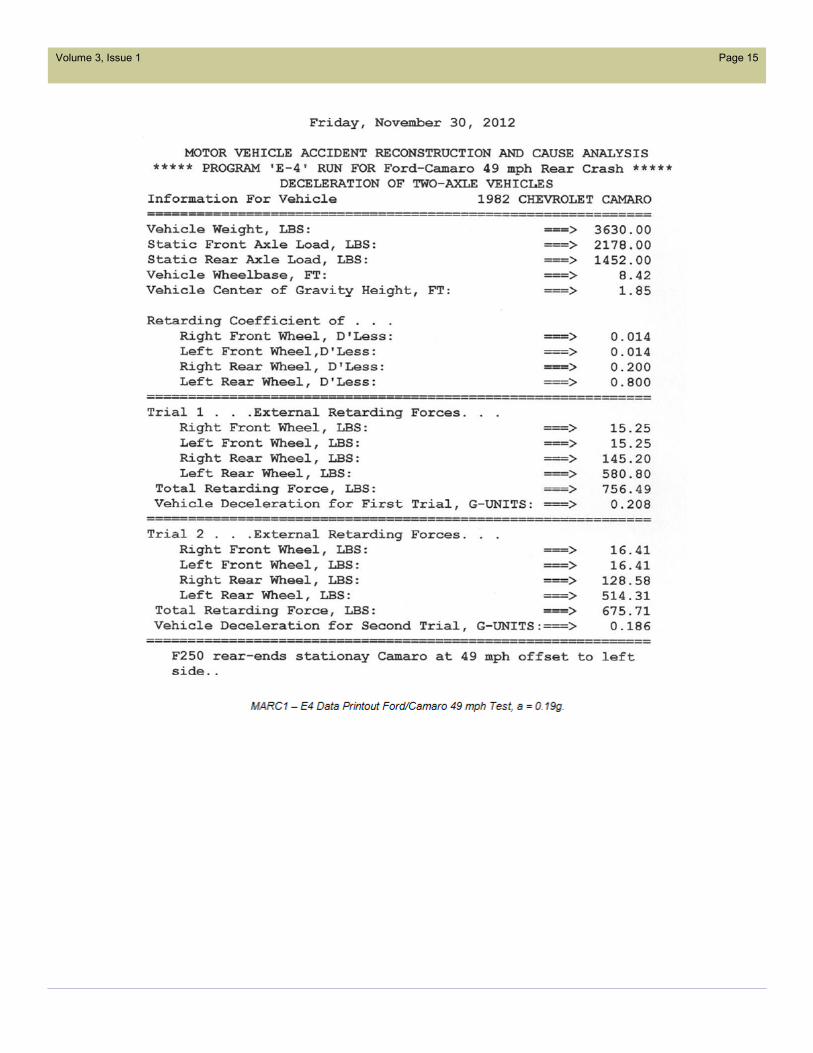
Case 2: Ford Pickup Truck Rear-Ends Stationary
Camaro
Two crash tests are described in Short Paper PCB 2-
2006, IN-LINE COLLISIONS available from
www.pcbraekinc.com. In the two off-set rear end tests a
Ford F250 travelling at 49 mph and 39 mph, respectively
impacted a stationary Camaro. We will only discuss the
after-impact deceleration used in the reconstruction of
impact speed. The left rear tire was “locked” by sheet
metal crush in each test. A lesser retarding coefficient
of 0.2 was assumed for the right rear tire in the 49 mph
Page 14 Volume 3, Issue 1
test. Normal rolling resistance was used for the front tires.
MARC1- E4 printout shows a drag factor of 0.186g or 6 ft/
sec2. For more details and damage photographs see the
short paper.
The reader should note, that with the rear wheel locked,
the deceleration decreases when load transfer is included
in the deceleration analysis. The retarding force of the left
rear wheel decreases due to less normal force.
An impact speed of 39 mph was the probable impact
speed at the time of the crash. Both the crush damage
and distances traveled after impact of approximately 106
ft were consistent with actual accident scene measure-
ments.
Page 15 Volume 3, Issue 1
Page 16 Volume 3, Issue 1
Newton’s second law states that:
W(a/g) = (Wcosα)(flevel) - Wsinα or
(a/g) = (cosα)(flevel) - sinα; g-units
The prevailing wisdom equation is:
(a/g) = (flevel) - slope; g-units
For example, for α = 10 degrees and flevel = 0.9 the cor-
rect answer is:
(a/g) = (cos10)(0.9) - sin10 = (0.9848)(0.9) – 0.1736
= 0.7127g
The approximate answer is 0.9 - 0.1763 = 0.7237. The
difference might be considered small in view of the uncer-
tainties associated with tire-road friction coefficient meas-
urements. However, as slope increases, so does the
difference. For example, an accident site with a slope of
20 degrees and flevel = 0.9, yields a/g = 0.50 exact versus
approximate of 0.54g. MARC1-E6 applies.
As slope increases a critical level will be
reached when friction force and downhill gravity force
balance. At that point the vehicle will neither accelerate
nor decelerate down-hill.
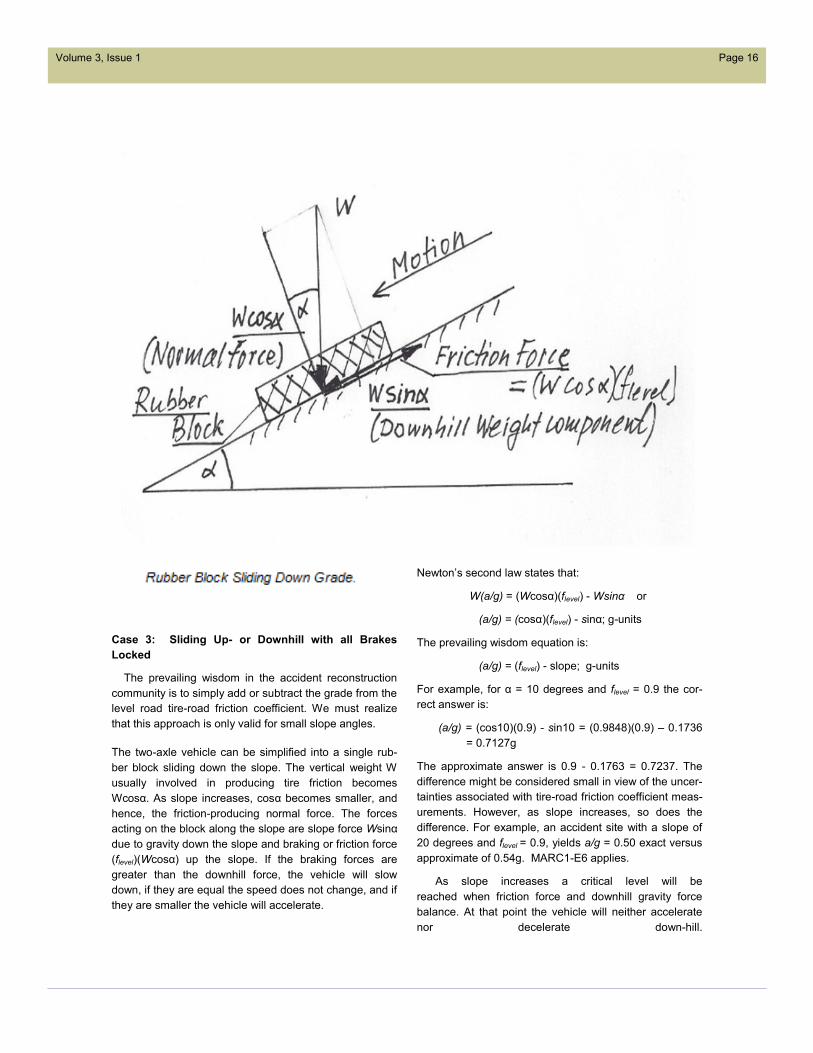
Case 3: Sliding Up- or Downhill with all Brakes
Locked
The prevailing wisdom in the accident reconstruction
community is to simply add or subtract the grade from the
level road tire-road friction coefficient. We must realize
that this approach is only valid for small slope angles.
The two-axle vehicle can be simplified into a single rub-
ber block sliding down the slope. The vertical weight W
usually involved in producing tire friction becomes
Wcosα. As slope increases, cosα becomes smaller, and
hence, the friction-producing normal force. The forces
acting on the block along the slope are slope force Wsinα
due to gravity down the slope and braking or friction force
(flevel)(Wcosα) up the slope. If the braking forces are
greater than the downhill force, the vehicle will slow
down, if they are equal the speed does not change, and if
they are smaller the vehicle will accelerate.

The critical slope is reached when (flevel)= tanα. Of course, this is the equation we implemented in high school physics
many years ago when measuring the friction coefficient of different mating surfaces by raising a hinged slope with an
angle measuring device. Once the body began to slide, we read the slope angle and taking tanα we knew the static
friction coefficient.
Conclusions
1. Give the accident scene/site a “stickiness” name providing a place to start for the speed analysis. Doing this is of
particular importance when dealing with non-typical surfaces such as median, gravel, wet, snow, oils or diesel fuel
spills, muddy construction zones, oiled pavements, etc. Having measured some accident scene data points and
analyzing them is better than to have measured nothing and trying “analyze” that.
2. As a minimum, use a drag boot for item 1 or similar device.
3. If possible, use subject vehicle or other vehicle for skid/ABS testing at accident scene.
4. Interpret accident scene tire marks correctly. If not certain, run both ABS and skid tests.
5. Inspect subject vehicle(s) for any brake system defects.
6. Determine if subject vehicle had ABS actuation from tire marks, and data recorder.
7. Inspect subject tires for any traction force affecting conditions. Measure inflation pressure. Note tread depths and
unusual wear patterns.
8. Use proper method to determine, if possible, probable drag factor or deceleration of subject vehicle at time of acci-
dent from original “stickiness” data.
9. Check your drag factor results against published data generally accepted by reconstruction community.
10. For slope angles less than 10 degrees the “prevailing wisdom” equation may be used, meaning you can subtract
the downhill slope as fraction (percent x 100) from the drag factor the subject vehicle would have experienced on a
level road. Do the opposite for an uphill slope.
11. Compute probable vehicle speed(s) using a reasonable data range.
12. Use the DIMS or Does It Make Sense check of your data against any other case specific data such as crush dam-
age, witness statements, view analysis, etc.
Page 17 Volume 3, Issue 1

Page 18 Volume 3, Issue 1
reflect back on the agency. The officer is responsible for
the material they receive when attending training whether
initial or advanced officer training. The learning process
continues regardless of the officer’s presence in the
classroom. So how does the officer testify that he or she
attended all days and hours of training if they were re-
peatedly leaving the classroom to answer or make phone
calls? How much information did the officer miss while
carrying on a conversation during class? How much re-
spect does the officer or the instructor have for the class
or even other instructors if he or she is carrying on a con-
versation while others are teaching?
Integrity and respect for oneself are integral parts of be-
ing a sworn law enforcement officer. Having respect for
yourself does not mean you are more important. Respect
for yourself also does not mean you can or should treat
other people including officers with less respect or be-
come condescending because you hold a position, rank
or title. Holding a position, rank or title should convey an
expectation of respect for others.
All of this is stated to make a point about our expecta-
tions of law enforcement officers and instructors of all
ranks and titles who are attending classes. Retain your
integrity by exhibiting respect and providing a model for
others to follow. You are not your position, rank or title.
You are a person who is continuing to learn. Be sure to
provide others around you the same opportunity while in
a learning environment.
Integrity in the Learning Environment
Bridget Reutter, GOHS Impaired Driver Program’s Coordinator
While attending the law enforcement academy as a
recruit, we hear about the importance of integrity from
every person teaching every class. All day, every day,
from the quarters and pennies found on the ground to
the number of bags of chips that come out of the vend-
ing machines and the avalanche of memos that follow,
the expectation is for all officers to exhibit integrity. The
presence of integrity in law enforcement is all encom-
passing, regardless of the subject matter. The reason
we hear integrity preached so much is that without it, a
law enforcement officer loses credibility. Without credi-
bility, a law enforcement officer becomes ineffective. An
officer without integrity is, well, not an officer…at least
not a credible officer.
Back at the academy, we learned to listen to an instruc-
tor with rapt attention out of respect as well as a desire
not to run the trails. Regardless, we did listen respect-
fully. The instructors teaching at the academy earned
the title of instructor as well as the right to teach new
officers. They shared knowledge and their experience in
an effort to steer the recruit officers around some of the
problems they would face in patrol… including some of
the problems not listed in the index of any manuals.
Interruptions in class did not happen unless an individ-
ual of higher rank entered the classroom and an appro-
priate greeting ensued.
How does the first paragraph relate to the second? A
code of conduct governs every officer at every agency.
The actions or inactions of an officer during training will

Officers investigating DUI offenses are frequently faced
with the question of whether Miranda applies to the field
sobriety tests and the DRE investigation. Even if the
defendant is in custody at the time they are adminis-
tered, the Fifth Amendment’s right against compelled
self-incrimination does not apply to field sobriety tests or
the majority of the DRE examination.
Arizona courts have repeatedly held field sobriety tests
consist of physical, not testimonial evidence because
they do not reveal an individual’s subjective knowledge
or thought process. State v. Theriault, 144 Ariz. 166,
167, 696 P.2d 718, 719 (App. 1984); State v. Lee, 184
Ariz. 230, 908 P.2d 44 (App. 1995). Accordingly, the
Fifth Amendment protections against self incrimination
do not apply to them. Miranda warnings, therefore, are
not required prior to administering the FSTs even if the
defendant is already under arrest. Lee, supra.
The US Supreme Court has come to the same conclu-
sion. Initially in Berkemer v. McCarty, 468 U.S. 420
(1984), the High Court found that routine roadside ques-
tioning of drivers detained after a traffic stop did not
constitute custodial interrogation under the Fifth Amend-
ment. Later, in Pennsylvania v. Muniz, 496 U.S. 582
(1990), the Court specifically addressed the FSTs and
held that physical observations made during the per-
formance of the field sobriety tests, including speech
characteristics, are not testimonial and do not require
Miranda warnings. The Court noted that to be found
testimonial, communication must “explicitly or implicitly,
relate a factual assertion or disclose information.” Id.
The verbal portions of the field sobriety tests simply do
not require the suspect to disclose information within the
meaning of the Fifth Amendment.
Like the FSTs, the vast majority of the DRE examination
is not going to be testimonial evidence or subject to
Miranda. DRE officers are trained to ensure the suspect
has been advised of the Miranda warnings prior to start-
ing the DRE examination. This is good practice as it
Page 19 Volume 3, Issue 1
ensures any admissions which are the result of custodial
interrogation will be admissible at trial. Other than the
questioning/interrogation portion of the DRE protocol,
however, none of the DRE examination should be testi-
monial. This is because blood pressure, pulse rate, body
temperature, pupil size, and the other observations made
during the DRE protocol do not reveal an individual’s
subjective knowledge or thought process. They are not
factual assertions and are not subject to Miranda.
As to the specimen collection portion of the DRE exami-
nation, asking a defendant to provide a urine sample is
not “interrogation.” United States v. Edmo, 140 F.3d 1289
(9th Cir. 1998). Nor is asking a defendant to undergo a
blood or breath test. South Dakota v. Neville, 459 U.S.
553, 554, n. 15, 130 S.Ct. 916, 74 L.Ed.2d 748 (1983)
(blood); Lee, supra.(breath test and FSTs). Miranda does
not apply. Additionally, booking questions going to bio-
graphical information have been held a specific exception
to the Miranda rule. State v. Jeney, 163 Ariz. 293, 787
P.2d 1089 (App. 1990).
Of course, any time a suspect is subject to custodial
questioning, the Miranda warnings do apply. Officers
should not look for ways to avoid advising a suspect of
the Miranda rights.
Miranda Warnings and FSTs
Beth Barnes, Arizona GOHS Traffic Safety Resource Prosecutor

Page 20 Volume 3, Issue 1
Article Submission Requirements and Protocols
Editorial Staff
The Arizona Police Science Journal publishes peer-reviewed scientific papers and works significant and rele-
vant to the law enforcement community. APSJ also publishes editorials and training articles that, while based
on science or relevant to science, may not include new scientific research or theories. The goal of APSJ is to
provide a combination of works written by well-renowned and credible authors, as well as prosecutors, criminal-
ists, officers and engineers who may be new to the writing process, but have relevant and important information
to share.
The Arizona Police Science Journal is committed to publishing twice yearly. The journal will be e-published at
www.azgohs.gov. APSJ, in its entirety, will be available to the public.
The editorial staff is committed to providing quality training and information that is timely. Papers or work sub-
mitted to the editorial staff undergo a strict review process starting with the editors. Selected papers are then
sent to experts or peers for a double blind, independent peer review process. If there are revisions, corrections
or comments from the peer-reviewers, the editorial staff then coordinates between the author and the reviewers
until a final work product is completed. The papers are then again peer-reviewed by experts and the APSJ
Advisory Board for accuracy and quality. Only then will the articles be published.
Any submissions should be made electronically to facilitate the rigorous review process and level of quality a
publication such as this demands. Authors should submit their work in Microsoft Word in a easy to read and
standard format, accompanied by any images or photographs, also in a standard format. The submitted work
should include a title page with the author’s name, address, phone and email contact information. If the paper
is of a highly specialized nature, the author may submit a list of at least three persons with the credentials and
experience necessary to be qualified as peer-reviewers. The work must also include an abstract and a very
short biography or “Author’s Note”.
Additional information on submitted papers or works may be found at www.azgohs.gov
For more information, please contact the Arizona Police Science Journal Editorial Staff.

Page 21 Volume 3, Issue 1
Daven Byrd — Executive Editor
Arizona Department of Public Safety
Operational Training
Advanced Academy & Field Training
Coordinator
Mail Drop 2900, P.O. Box 6638
Phoenix, Arizona 85005
602-223-2126 Office
Frank Griego — Co-Editor
Arizona Department of Public Safety
Major Crimes District
General Investigations Unit
Mail Drop 3100, P.O. Box 6638
Phoenix, Arizona 85005
602-223-2129 Office
Mark Malinski — Co-Editor
Glendale Police Department
Training Unit Sergeant
11550 West Glendale Avenue
Glendale, Arizona 85307
623-772-7111 Office
Cam Siewert — Graphics Editor
Arizona Department of Public Safety
Major Crimes District
Vehicular Crimes Unit
Mail Drop 3100, P.O. Box 6638
Phoenix, Arizona 85005
602-223-2323 Office
Daniel Collins — Co-Editor
Arizona Department of Public Safety
Major Crimes District
Vehicular Crimes Unit
Mail Drop 3100, P.O. Box 6638
Phoenix, Arizona 85005
602-223-2407 Office
Arizona Police Science Journal
A publication of the Arizona Governor’s Office of Highway Safety
Editorial Staff
Audrey N. Hajek — Co-Editor
Peoria Police Department
Patrol Bureau
8351 West Cinnabar Avenue
Peoria, Arizona 85345
623-773-8311 Office

Page 22 Volume 3, Issue 1
Arizona Police Science Journal
APSJ Advisory Board Members
Christopher Andreacola Tucson Police Department
Beth Barnes GOHS Traffic Safety Resource Prosecutor
James Brown Peoria Police Department
Nathaniel Clark Gila River Indian Community Police Department
Adam Dyas Gilbert Police Department
Patt Ficere Arizona Department of Public Safety
Robert Garduno Chandler Police Department
Trevor Graff Arizona Department of Public Safety
D. J. Hansen Arizona Department of Public Safety
Ken Harmon Tempe Police Department (Retired)
Nancy Jefferys Phoenix College
Jennifer Kochanski Arizona Department of Public Safety
Kemp Layden Phoenix Police Department
Louis Lombari Salt River Police Department
Brandon Nabozny Arizona Department of Public Safety
Thomas Page Los Angeles Police Department (Retired)
Sean Privett Peoria Police Department
Daniel Raiss Yavapai County Sheriff’s Office
Bridget Reutter Governor’s Office of Highway Safety
Jeff Rogers Goodyear Police Department
Jimmy Simmons Arizona Game and Fish Department
Thomas Simon Arizona Department of Public Safety
Ronald Skwartz Arizona Department of Public Safety
Richard Studdard Los Angeles Police Department (Retired)
Brian Swanty Arizona Department of Public Safety
Cathee Tankersly Phoenix College
Michael Thomas Arizona Department of Public Safety
Scott Tyman Arizona Department of Public Safety
Robert Weeks Arizona Department of Public Safety
Ezekiel Zesiger Arizona Department of Public Safety