a purchasing intention audit of the audience of powder/bulk solids portrait of respondents
TRANSCRIPT

A Purchasing Intention Auditof the Audience of Powder/Bulk Solids
Portrait of Respondents

• Prepared by third party research firm, Martin Akel & Associates, Chester, NJ
• Survey sent to combined audience of Powder/Bulk Solids magazine, recipients of PBS newsletters, and visitors of powderbulksolids.com
• 1,240 returns for a 95% confidence level
Methodology
Survey Methodology/Responses

Portrait of Respondents by End Market
Chemicals32%
Food/Beverage23%
Other45%
Portrait of Respondents
PBS represents the key markets

Portrait of Respondents by Job Title
Portrait of Respondents
Engineers compose the largest job segment
39.7%
20.7%
16.2%
9.7%
3.5%
10.2%
% Engineering
% Production, Plant Operations, Maintenance
% R&D/Quality Control
% Administration
% Purchasing
% Other

Portrait of Respondents
• Over 90% indicated involvement in product adoption decisions
• Decisions/recommendations are extensive– More than half (55%) impact purchasing enterprise wide– 91% make decisions affecting entire department, division,
or wider• Enterprise wide (multiple sites) 55.2%
• Division or department 90.8%
• PBS audience members influence an average of 5.3 plants; among engineering titles, 6.6 plants
Portrait of Respondents
Readers are highly involved in purchasing decisions

Conclusion
• PBS audience represents professionals who are heavily involved in technology decisions
• PBS readers represent key decision makers for suppliers of products, equipment, and systems
Portrait of Respondents
Technology Investment Trends
Technology Investment
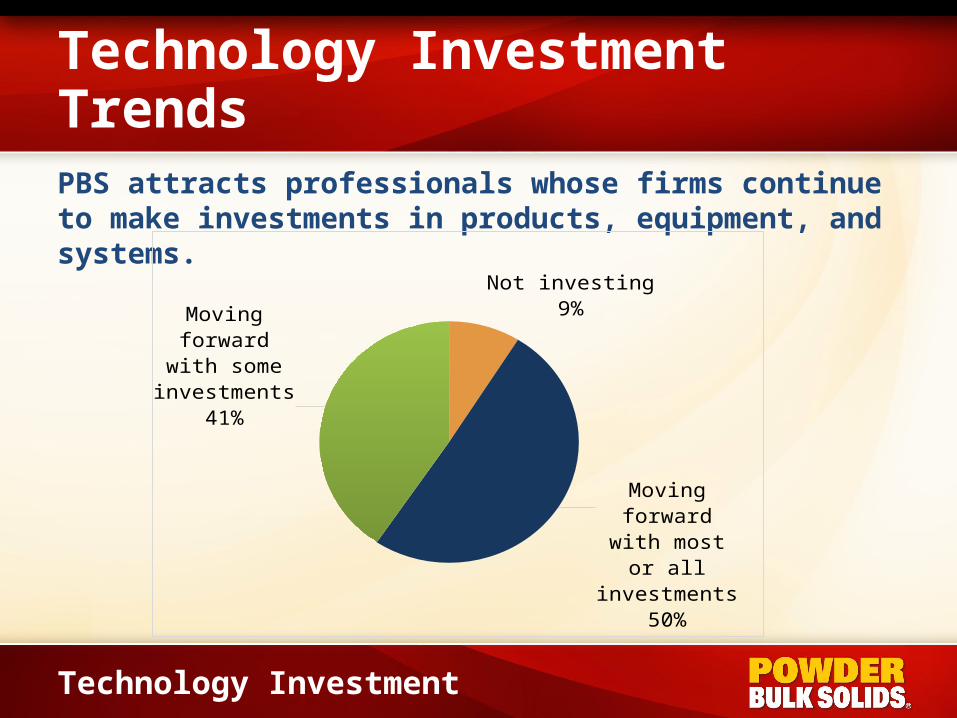
PBS attracts professionals whose firms continue to make investments in products, equipment, and systems.
Not investing9%
Moving forward with most or all
investments50%
Moving forward with some in-
vestments41%
Attitudes: Technological Investments
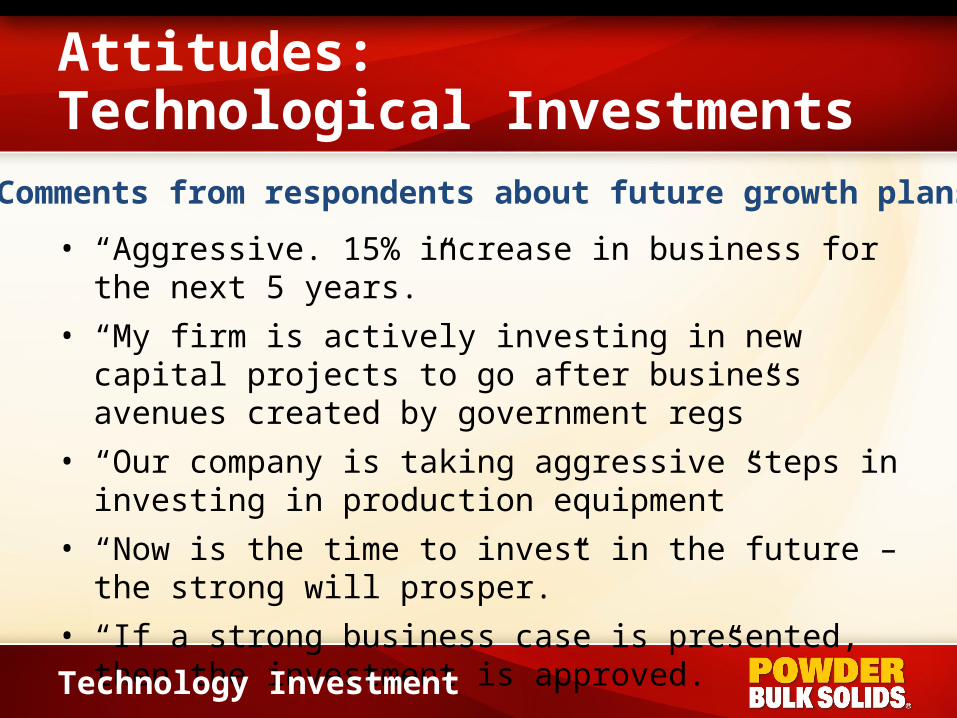
• “Aggressive. 15% increase in business for the next 5 years.”
• “My firm is actively investing in new capital projects to go after business avenues created by government regs”
• “Our company is taking aggressive steps in investing in production equipment”
• “Now is the time to invest in the future – the strong will prosper.”
• “If a strong business case is presented, then the investment is approved.”
Technology Investment
Comments from respondents about future growth plans.
Age & Technological Capabilities
of Major Systems
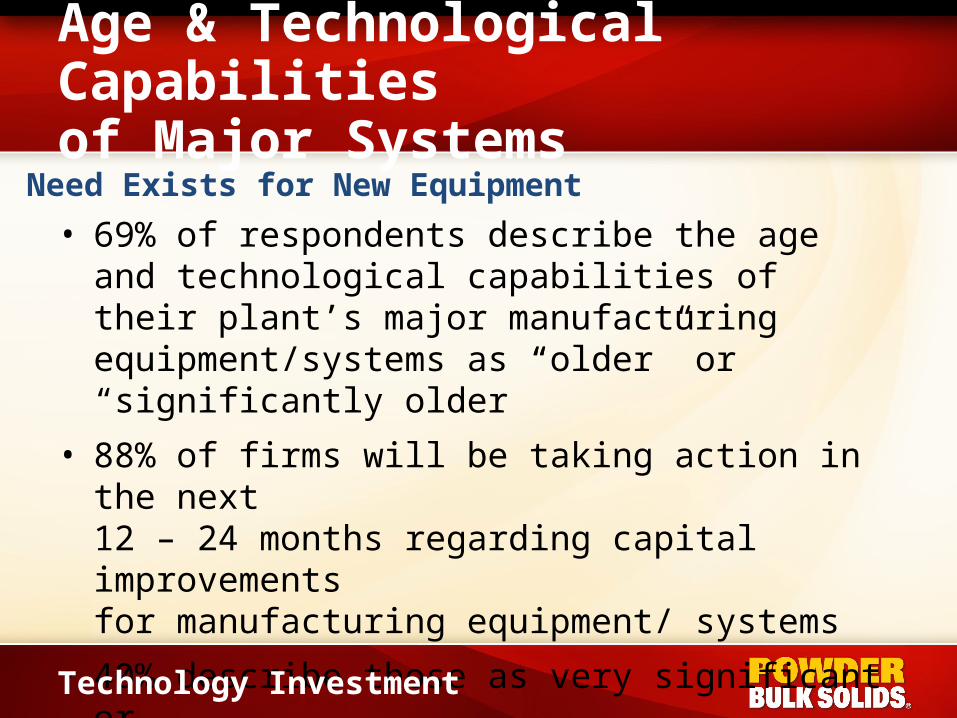
• 69% of respondents describe the age and technological capabilities of their plant’s major manufacturing equipment/systems as “older” or “significantly older”
• 88% of firms will be taking action in the next 12 – 24 months regarding capital improvements for manufacturing equipment/ systems
• 40% describe those as very significant or significant improvements
Technology Investment
Need Exists for New Equipment
Plant Construction /Modernization
With
in 6
mos.
With
in 1
2 mos.
With
in 2
4 mos.
Beyond 2
4 ...
Start
within
24...
No curre
nt p...
0.0%
5.0%
10.0%
15.0%
20.0%
25.0%
30.0%
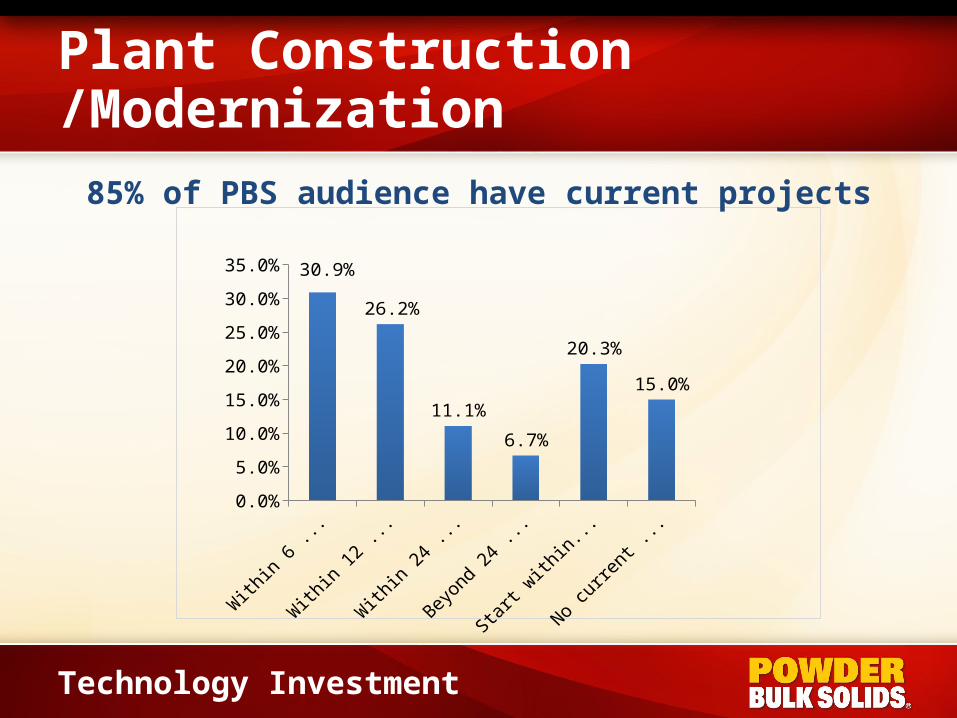
35.0% 30.9%
26.2%
11.1%
6.7%
20.3%
15.0%
Technology Investment
85% of PBS audience have current projects

Conclusion
• PBS attracts professionals at organizations that continue to invest in new products, equipment, and systems
• Their organizations recognize the importance of making necessary investments such as additional product lines, capital investments, and new plants and plant modernization
• Suppliers seeking to identify where potential new sales will come from will find a substantial number of buyers across the PBS audience
Technology Investment

Early Phase Middle Phase Final Phase
52.7%45.6%
22.3%
Purchasing
Purchasing
76% of audience is currently involved in the purchasing process. Projects range from being in early, middle or late phases.
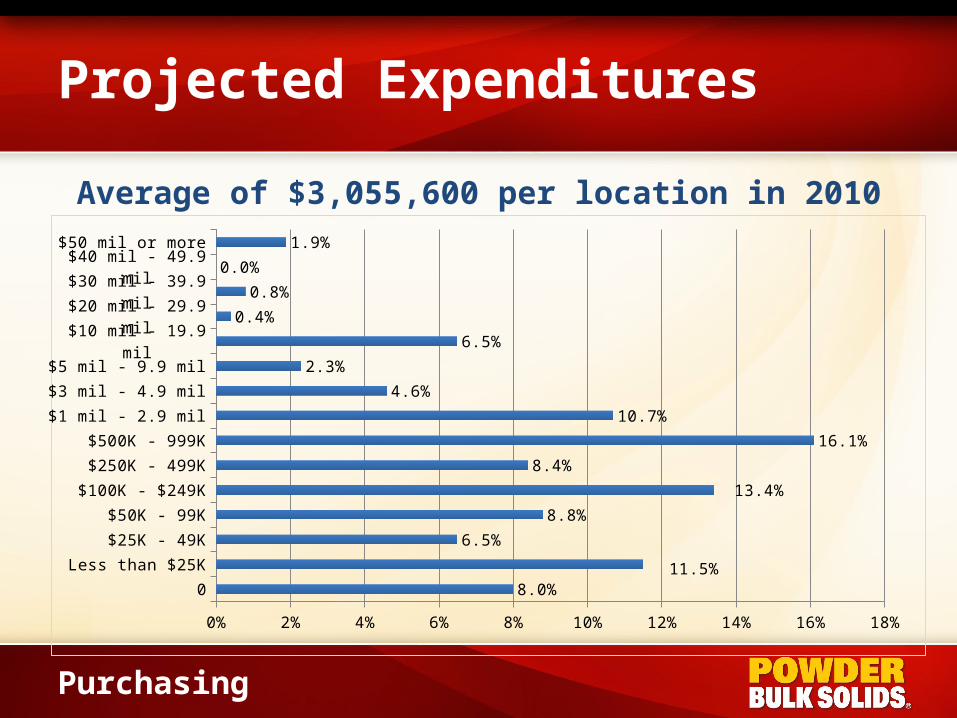
Projected Expenditures
0
Less than $25K
$25K - 49K
$50K - 99K
$100K - $249K
$250K - 499K
$500K - 999K
$1 mil - 2.9 mil
$3 mil - 4.9 mil
$5 mil - 9.9 mil
$10 mil - 19.9 mil
$20 mil - 29.9 mil
$30 mil - 39.9 mil
$40 mil - 49.9 mil
$50 mil or more
0% 2% 4% 6% 8% 10% 12% 14% 16% 18%
8.0%11.5%
6.5%
8.8%
13.4%
8.4%
16.1%
10.7%
4.6%
2.3%
6.5%
0.4%
0.8%
0.0%
1.9%
Purchasing
Average of $3,055,600 per location in 2010

Projected Expenditures
• 44% foresee expenditure increases for ALL dry processing-related technology and services
• 50% foresee expenditures to stay the same
• Only 8% forecast declines
• Net change will be +17.5%
Purchasing
Expenditure increases anticipated

Audience Usage by Product CategoryProduct % Using This Category % with Purchasing Plans in 24 mos.
Drying & thermal solids processors 54.2 46.4
Dust collection & air pollution control equipment 85.4 57.6
Feeders 76.7 57.0
Instrumentation & control equipment 93.0 74.9
Material handling & transportation 88.2 56.9
Mechanical conveying equipment 81.8 59.7
Mixers & blenders 80.2 45.4
Packaging & bagging products/equipment 73.8 55.8
Particle enlargers & formers 27.2 30.6
Pneumatic conveying equipment 69.3 48.1
Screening & separation equipment 67.8 46.4
Size reduction equipment 58.0 39.7
Storage equipment 80.5 39.7
Valves, gates, & airlocks 85.3 70.2
Weighing systems & scales 91.4 41.7
Purchasing

2010 Expenditures by Product CategoryProduct % with 2010 Expenditures Avg. Expenditure per Subscriber
Drying & thermal solids processors 28.9 $476,900
Dust collection & air pollution control equipment 57.0 $252,380
Feeders 44.4 $117,950
Instrumentation & control equipment 74.8 $309,890
Material handling & transportation 58.7 $243,970
Mechanical conveying equipment 49.4 $261,330
Mixers & blenders 42.9 $194,420
Packaging & bagging products/equipment 44.0 $308,170
Particle enlargers & formers 10.7 $191,780
Pneumatic conveying equipment 39.9 $327.660
Screening & separation equipment 34.0 $143,640
Size reduction equipment 23.2 $216,970
Storage equipment 39.9 $337,000
Valves, gates, & airlocks 61.9 $133,160
Weighing systems & scales 58.6 $180,340
Purchasing

Expenditure Projections
Product Projected Average Total 2010 Expenditures
Drying & thermal solids processors $2,133,000,000
Dust collection & air pollution control equipment $2,266,000,000
Feeders $784,000,000
Instrumentation & control equipment $3,728,000,000
Material handling & transportation $2,286,000,000
Mechanical conveying equipment $2,094,000,000
Mixers & blenders $1,337,000,000
Packaging & bagging products/equipment $2,133,000,000
Particle enlargers & formers $143,000,000
Pneumatic conveying equipment $2,150,000,000
Screening & separation equipment $719,000,000
Size reduction equipment $834,000,000
Storage equipment $1,928,000,000
Valves, gates, & airlocks $1,323,000,000
Weighing systems & scales $1,379,000,000
Purchasing
Conclusions
• Through PBS, you reach professionals who have serious purchasing intentions for 2010 and 2011
• PBS’s technology-focused editorial is proven to attract those who represent primary purchasing targets for suppliers
Purchasing

Public
atio
ns
Directo
ries
E-new
slette
rs
Newsle
tters
Whi
te p
aper
s
Web
sites
Other
dig
ital m
edia
Trade
show
s
Other
med
ia d
evice
s0%
10%
20%
30%
40%
50%
60%
70%
80%
90%
100%98.2%
54.0%49.3%
25.9%
40.2%
97.1%
70.2%
80.9%
52.0%
Use of Media
Use of Media
How do professionals stay current? Publications are still the top choice.

Print magazinesDigital magazines
DirectoriesE-newsletters
Print newslettersWhite papers
Websites from magazines
Websites from associa-tions
Websites from online only providers
Supplier websitesSearch engines
RSS feedsWebinars
Online videosPodcasts
BlogsVirtual trade shows
Work-related social mediaGeneral social media
Trade showsConferences
Mobile devicesDVD/CDs
0% 10% 20% 30% 40% 50% 60% 70% 80% 90%80.3%
55.0%54.0%
49.3%25.9%
40.2%58.9%
44.6%24.4%
76.6%66.7%
15.4%47.6%
31.0%7.4%7.6%
12.1%11.3%
13.8%73.3%
50.5%16.8%
44.8%
Use of Media
Use of Media
The types of media have increased

Trend in Time Spent with Media
Use of Media
75% spend more time with all media than 3-4 yrs ago
Increase; 74.5%
No change; 17.0%
Decrease; 8.5%

Desirability of Print Magazines
• Reliable way to be updated 70.7%
• Portable 67.7%
• Tangible 62.2%
• Convenient 57.7%
• Very visual 57.5%
• Random access 45.4%
• Easy to save 42.9%
• Less time on computer 35.3%
• Write notes, highlights 34.2%
• Personal and relevant 18.5%
• Do not find print pubs desirable 4.6%
Use of Media
95% of professionals studied find print publications desirable for the following reasons
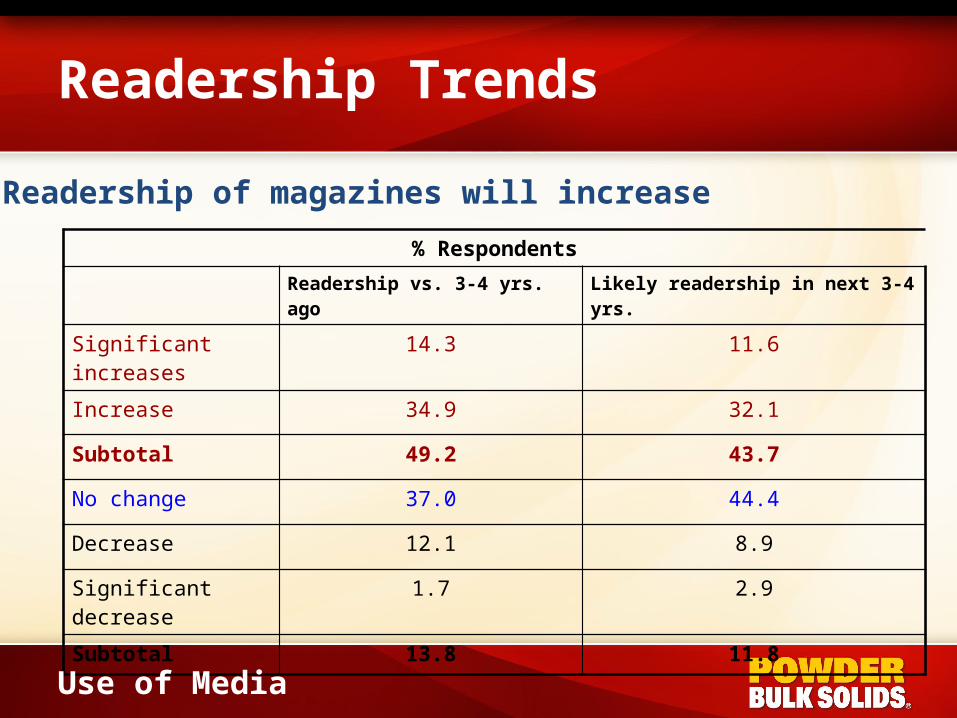
Readership Trends
% Respondents
Readership vs. 3-4 yrs. ago Likely readership in next 3-4 yrs.
Significant increases 14.3 11.6
Increase 34.9 32.1
Subtotal 49.2 43.7
No change 37.0 44.4
Decrease 12.1 8.9
Significant decrease 1.7 2.9
Subtotal 13.8 11.8
Use of Media
Readership of magazines will increase

Why do they read your ads?
% Respondents
Alert me to potential solutions 76.7%
Alert me to new suppliers 60.2%
Help position individual suppliers in my mind 59.0%
Continuing education on current technologies 51.0%
Information to request/access more details 52.5%
Alert me to changes at suppliers 50.4%
Ads are a quick way to stay current 30.6%
Keep me up-to-date on new models/upgrades 18.3%
Do not find ads worthwhile 3%
Use of Media
97% find advertising to be desirable

Conclusion
• All professionals continue reading publications; readership remains strong
• Professionals value publication advertising because it alerts them to potential solutions
• Despite some opinions, magazines and magazine advertising continue to be highly effective media for contacting primary customers and prospects
Use of Media

Mag
azin
es
Searc
h en
gine
s
Suppl
ier w
ebsit
es
Print d
irecto
ries
Mag
azin
e web
sites
E-new
slette
rs
Sales
reps
Trade
show
s
Unaffil
iate
d web
sites
Direct
mai
l
Other
dig
ital m
edia
0.0%
10.0%
20.0%
30.0%
40.0%
50.0%
60.0%
Mention #1
Mention #1 or 2
How different media are used
Use of Media
Media via which professionals first learn about new products/services—Magazines are the top choice

Media by which professionals first learn about new products/suppliers (version 2)
Average score (ranked 1 as highest)
Articles & ads in magazines 2.7
Search engines 3.8
Websites from suppliers 4.2
Trade shows 4.3
Sales reps 4.5
Websites from magazines 4.8
Printed directories/buyer’s guides 4.9
E-newsletters 5.3
Direct mail from suppliers 5.3
Unaffiliated websites 5.5
Other digital media (blogs, videos, etc.) 5.9
Use of Media

43.1%
7.8%6.7%
31.3%
5.3%
2.9% 2.9%
Magazine articles/adsE-newslettersMagazine websitesSearch enginesTrade showsOther websitesDirect mail
Professionals first learn about supplier websites
Use of Media
58% chose either publications, their newsletters, or websites

Which suppliers are investigated?
• 74% are likely to investigate companies they’ve become familiar with via communications programs
• 46% are likely to seek more information from suppliers they’ve heard of but are not familiar with
• Only 33% are likely to do so with suppliers they’ve never heard of
• Branding of companies and products prior to use of search engine marketing is essential
Use of Media
Suppliers with communications programs

Multiple media helps brand adoption
• 75% believe multiple media make them more likely to remain aware of the supplier
• 76% are more likely to contact suppliers that use multiple media when beginning to evaluate that class of product
Use of Media

Multiple media improves branding
% Respondents that believe multimedia assists them during the brand adoption process
Much more likely
More likely
SubtotalNo
differenceLess likely
Much less likely
Subtotal
Remain aware of the supplier
16.8 58.5 75.3 23.3 1.0 0.4 1.4
Form lasting impressions
11.2 50.4 61.6 33.5 4.4 0.4 4.8
Position their products vs. competitor
11.3 50.6 61.9 35.7 1.9 0.4 2.3
Contact that supplier
22.6 53.7 76.3 21.4 1.5 0.8 2.3
Use of Media
Conclusions
• Magazines continue to be a major medium to initiate relationships. Publications are where inititial branding takes place
• Different media contribute different strengths and perform different roles in the adoption process
• A mix of media throughout the buying process will enable suppliers to achieve marketing objectives more effectively.
Use of Media

26.0%
46.1%
13.2%
6.1%
6.6% 2.0%
All issuesMost issuesHalf the issuesLess than halfA few
Why PBS?
Why PBS?
72% of subscribers look into/read all or most issues

Time Spent with PBS Will Increase
% Respondents
Likely spend much more time 1.8
More time 11.8
Same amount of time 78.3
Subtotal, same amount or more 91.9
Less time 6.8
Much less time 1.2
Subtotal, less time 8.0
Why PBS?

Time Spent with PBS Will Increase
Same or more time Less time0%
10%
20%
30%
40%
50%
60%
70%
80%
90%
100%92%
8%
Why PBS?
92% will spend the same or more time reading PBS in the future
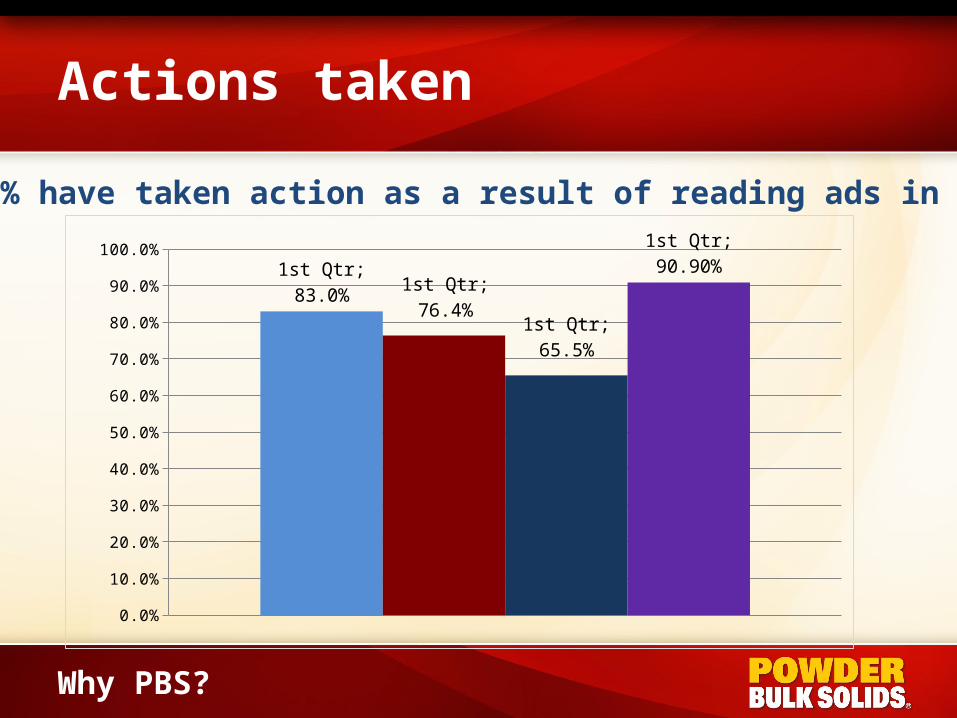
Actions taken
0.0%
10.0%
20.0%
30.0%
40.0%
50.0%
60.0%
70.0%
80.0%
90.0%
100.0%
1st Qtr; 83.0%1st Qtr; 76.4%
1st Qtr; 65.5%
1st Qtr; 90.90%
Why PBS?
91% have taken action as a result of reading ads in PBS

Detailed actions taken
Phone
d su
pplie
r
Visite
d su
pplie
r web
site
Sent e
to s
uppli
er
Stopp
ed a
t sup
plier
trad
e sh
ow b
...
Asked
sta
ff m
embe
r to
follo
w up
Sugge
sted
pro
duct
s be
use
dPas
sed
ad o
n
0% 10% 20% 30% 40% 50% 60% 70% 80%
43.8%18.7%
69.9%31.7%
29.2%3.4%
18.8%27.2%
17.3%
32.1%23.3%
32.1%
32.1%9.1%
Why PBS?
91% have taken action as a result of reading ads in PBS
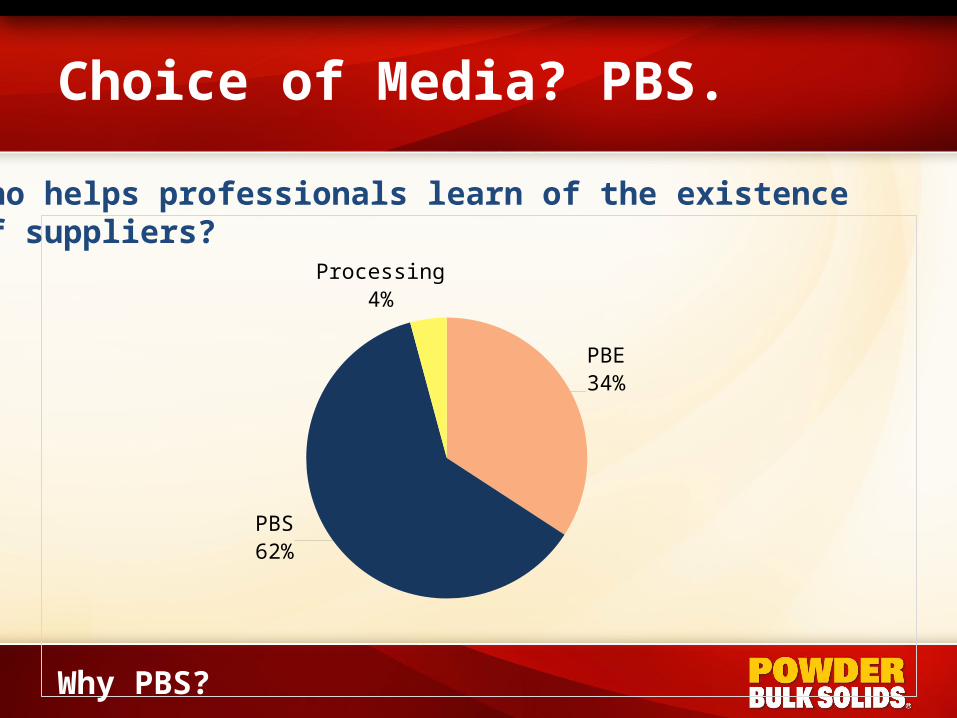
PBE34%
PBS62%
Processing4%
Why PBS?
Who helps professionals learn of the existence of suppliers?
Choice of Media? PBS.

PBE36.2%
PBS56.6%
Processing7.2%
Why PBS?
Who helps form impressions about features/ benefits of a supplier and their equipment? PBS.
Choice of Media? PBS.
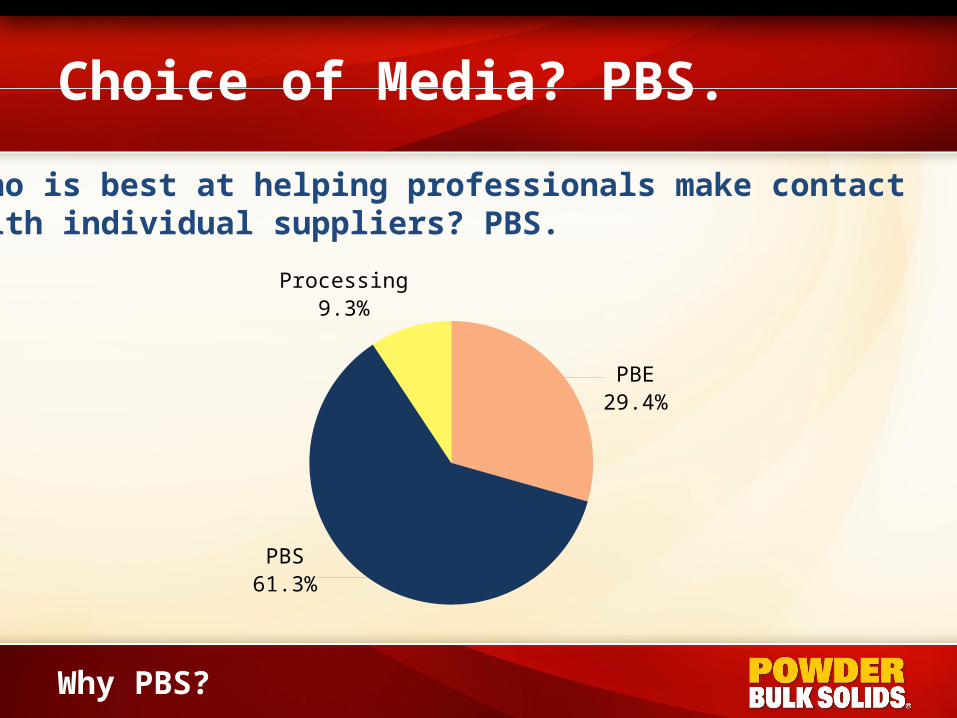
PBE29.4%
PBS61.3%
Processing9.3%
Why PBS?
Who is best at helping professionals make contact with individual suppliers? PBS.
Choice of Media? PBS.

Other Publications NOT being Read Regularly
PBE Processing Neither0.0%
10.0%
20.0%
30.0%
40.0%
50.0%
60.0%
70.0%
PBE; 40.2%
Processing; 64.6%
Neither; 28.3%
Why PBS?
These PBS readers CANNOT be reached by PBE and Processing
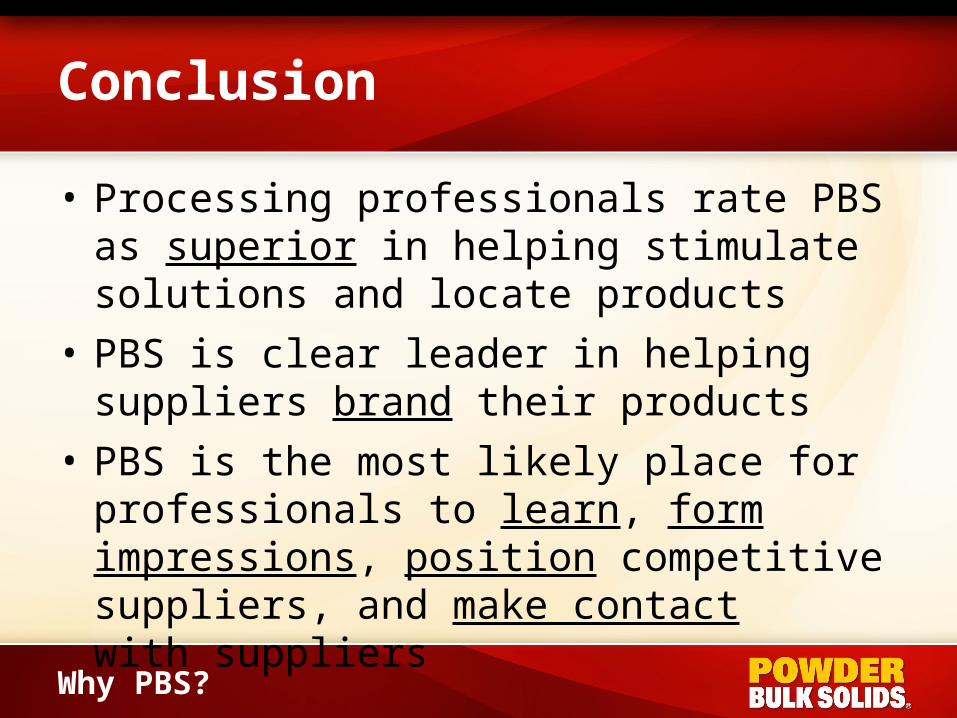
Conclusion
• Processing professionals rate PBS as superior in helping stimulate solutions and locate products
• PBS is clear leader in helping suppliers brand their products
• PBS is the most likely place for professionals to learn, form impressions, position competitive suppliers, and make contact with suppliers
Why PBS?
Summary
• In the dry particulate industry, there is substantial purchasing activity underway with the readers of Powder/Bulk Solids.
• They are looking for suppliers.
• They are using the various media channels offered by PBS to find them.
• A multi-channel communications program with PBS will plug you into these buyers.
Summary