a quantitative analysis of cellular manufacturing in
TRANSCRIPT
Journal of Industrial Engineering and ManagementJIEM, 2014 – 7(5): 1385-1396 – Online ISSN: 2013-0953 – Print ISSN: 2013-8423
http://dx.doi.org/10.3926/jiem.1184
A Quantitative Analysis of Cellular Manufacturing in Apparel Industry
by Using Simulation
Guoqiang Pan
College of Mechanical Engineering, Zhejiang University of Technology (China)
Department of Mechanotronics and Aviation, Zhejiang Institute of Communications (China)
Received: May 2014Accepted: November 2014
Abstract:
Purpose: This research, by using the SIMIO simulation platform, provides a quantitative and
comparative analysis of how the efficiency of four different cell production modes is affected.
It is hoped that the results will be of some help for garment factories to optimize their
production lines.
Design/methodology/approach: The SIMIO simulation platform was employed in the
research and comparisons were made of the simulation test results about the four popular
cellular manufacturing modes.
Findings: The operation mode, number of operators, and number of buffer areas are key
factors affecting the production line efficiency, and need to be reasonably set to achieve the
highest efficiency.
Originality/value: As most research literature so far is qualitative, this research provided a
simulation-based quantitative analysis of the production efficiency under different cell
production modes.
Keywords: cell production, SIMIO, simulation, apparel industry
-1385-
Journal of Industrial Engineering and Management – http://dx.doi.org/10.3926/jiem.1184
1. Introduction
Cell production refers to a kind of production mode in which the production line is arranged as
an integrated unit of equipment and workstations based on the operation procedures and in a
particular order (for example U-shape layout). The American Apparel Manufacturing
Association has defined cell manufacturing as “a contained manageable work unit of 5 to 17
people performing a measurable task. The operators are interchangeable among tasks within
the group to the extent practical and incentive compensation is based on the team’s output of
first quality output”. In a cell system, processes are grouped into a module instead of being
divided into their smallest components, and fewer numbers of multi-functional operators stand
still, or move counterclockwise within the particular production area to perform the assigned
tasks. Compared with the traditionally specialized flow-line production method, cell production
can swiftly adapt to variable order type and quantity. When appropriately applied, it ensures
flexible production capacity, lower labor and equipment cost, improved production efficiency. It
therefore becomes a significant component of the lean production where JIT is pursued, and is
widely adopted by many industries including apparel manufacturing, electronics assembly and
machining in Japan, Europe and America.
The ever improving living standards and rapidly changing fashion trends are pushing apparel
manufacturers to respond as fast as possible to model and quantity changes and to produce
high-quality, low-cost products. Given this challenge, new production systems were adopted
and experimented in the apparel industry, and the cell production is widely favored.
2. Review of the literature
Researches about cell production mainly focused on two aspects: one was about the
advantages of cell production, while the other was about performance of various cell
production modes, though most researches include these two aspects at the same time.
Fatma and Canan (2007) introduced that the cell system was first implemented at Toyota in
1978 as part of JIT, and was known in the 1980s in the West as the Toyota Sewing System
(TSS). They cited other researchers’ research findings and listed advantages of cell productions
modes. Bischak (1996) examined the performance of a manufacturing module with moving
workers and found that the production system helped to achieve quality products at lower
costs and reduced lead time. Besides, it could easily adapt to high employee mobility.
Researchers favored simulation in studying performances of different cell production modes.
Wang and Ziemke (1991) simulated a system based on the Toyota Sewing System (TTS) and
found that the system showed high performance, even though the operation times of each
station differed considerably with each other. They also noticed that after some time of
-1386-
Journal of Industrial Engineering and Management – http://dx.doi.org/10.3926/jiem.1184
operation, the workers would form their own work patterns. Adams and Schroer (1999)
established a simulation based on the Rabbit Chase (RC) mode of cloth manufacturing, and
worked out the law between output volume and time consumed. Black and Schroer (1993) put
forward the Linked Cell (LC) production mode which used decouplers to connect, balance and
buffer elements within the cell so as to achieve high efficiency. Wang and Tang (2009) studied
the cell management method for manufacturing systems where parts were processed across
different cells. They constructed a model and algorithm, and used a simulation to verify the
effectiveness of its method. Schlors like Netland (2013), Walter and Tubin (2013), Karim and
Arif-Uz-Zaman (2013) and Amin and Karim (2013) studied the assembly line layouts of cell
production systems and evaluated their performances. These research finds are of great values
for further studies.
Past researches are of limited value for the real manufacturing world, as they mainly validated
the effectiveness of cell production system or focused on particular cell production modes.
There was a lack of quantitative comparison between these different cell production modes.
Besides, for a particular cell production mode, important elements that affect the overall
performance of the system were not adequately studied. This paper aims, by using simulation,
to compare four major cell production modes that are most frequently adopted in the clothing
making industry, and try to find out the key factors that impact the overall performances of
these different cell production modes.
3. Popular cell production modes
There are many different cell production modes being used in the production industry, however
the Sub Cell, Shared Cell, Rabbit Chase and Toyota Sewing System are most frequently applied
in the apparel industry. This chapter will give a description of the operation of the above four
cell production modes.
3.1. Sub Cell (SC)
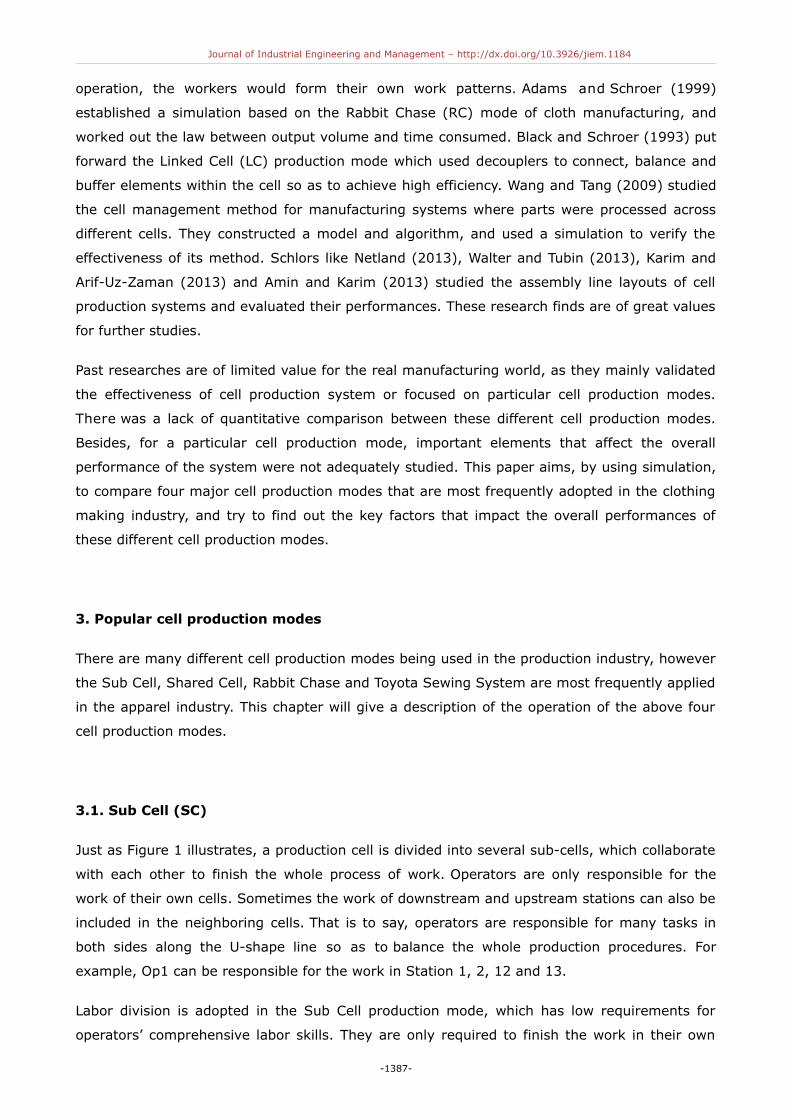
Just as Figure 1 illustrates, a production cell is divided into several sub-cells, which collaborate
with each other to finish the whole process of work. Operators are only responsible for the
work of their own cells. Sometimes the work of downstream and upstream stations can also be
included in the neighboring cells. That is to say, operators are responsible for many tasks in
both sides along the U-shape line so as to balance the whole production procedures. For
example, Op1 can be responsible for the work in Station 1, 2, 12 and 13.
Labor division is adopted in the Sub Cell production mode, which has low requirements for
operators’ comprehensive labor skills. They are only required to finish the work in their own
-1387-
Journal of Industrial Engineering and Management – http://dx.doi.org/10.3926/jiem.1184
cells. While enjoying less investment of equipment, Sub Cell mode requires labor division to
balance the production line. When necessary, a product buffer area in the sub-cell is necessary
so as to reduce the loss when the production line is not in balance. The quantity of work-in-
progress in the buffer area depends on the demands of production balance, and there are
usually much work-in-progress.
Figure 1. Sub-Cell (SC)
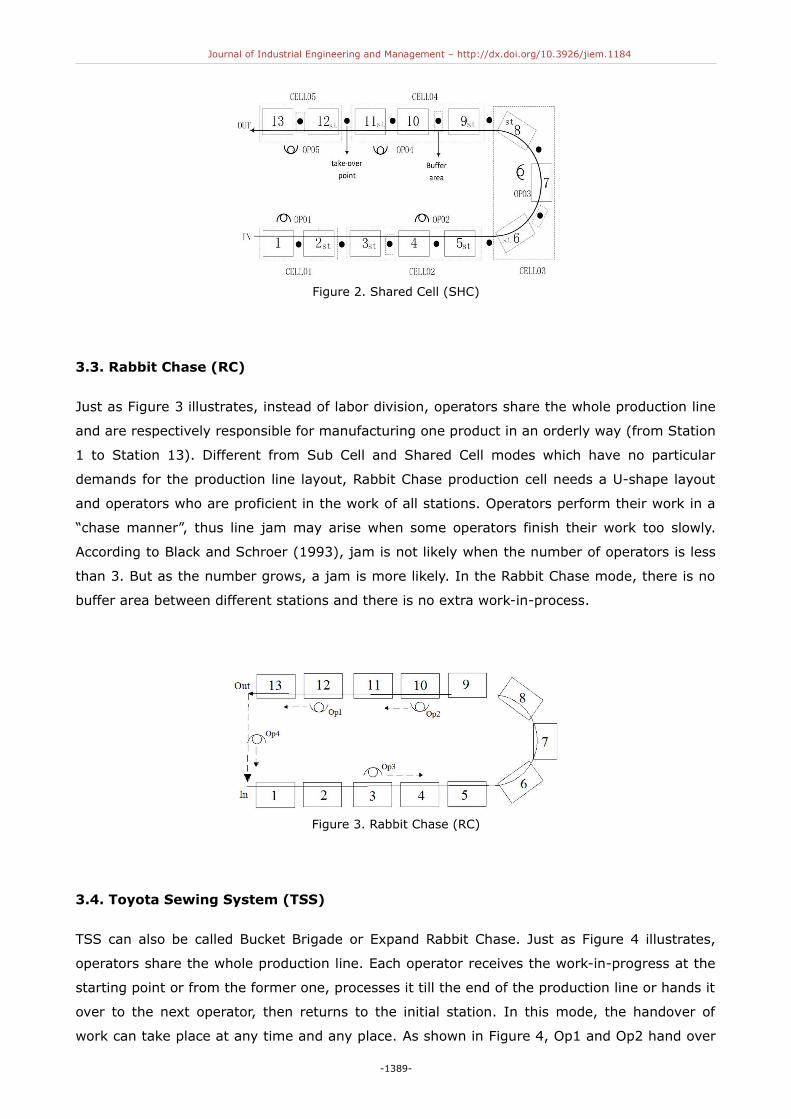
3.2. Shared Cell (SHC)
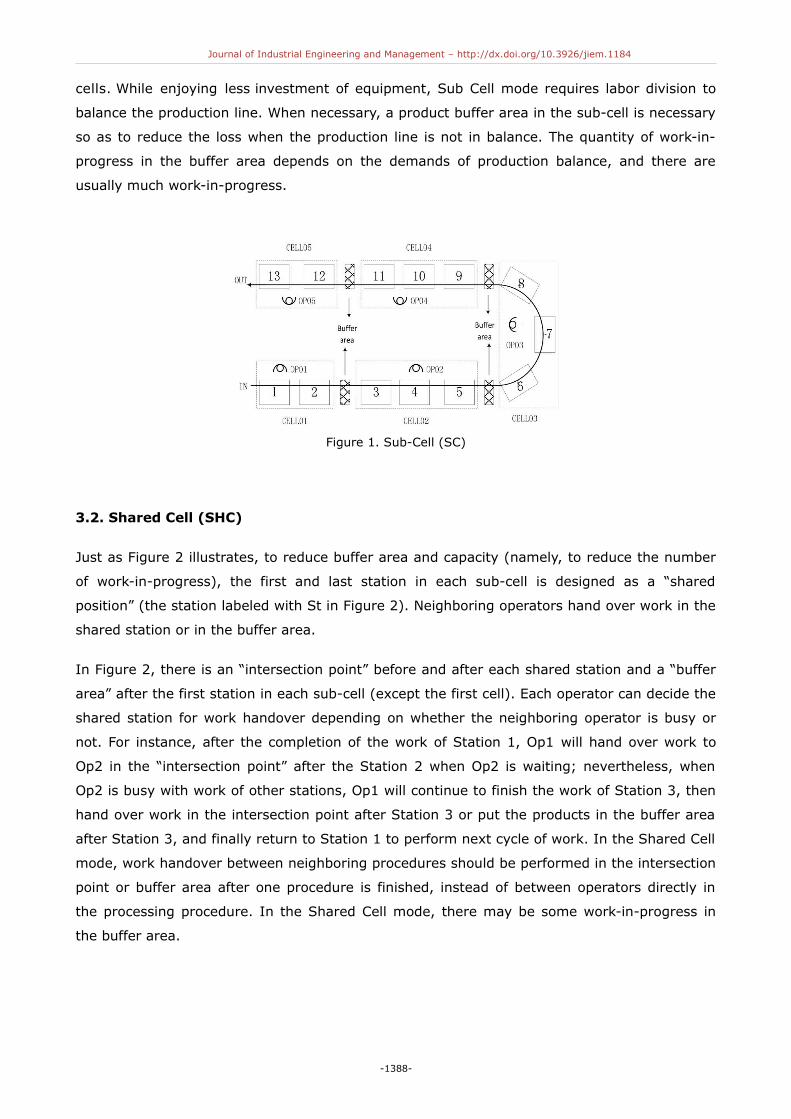
Just as Figure 2 illustrates, to reduce buffer area and capacity (namely, to reduce the number
of work-in-progress), the first and last station in each sub-cell is designed as a “shared
position” (the station labeled with St in Figure 2). Neighboring operators hand over work in the
shared station or in the buffer area.
In Figure 2, there is an “intersection point” before and after each shared station and a “buffer
area” after the first station in each sub-cell (except the first cell). Each operator can decide the
shared station for work handover depending on whether the neighboring operator is busy or
not. For instance, after the completion of the work of Station 1, Op1 will hand over work to
Op2 in the “intersection point” after the Station 2 when Op2 is waiting; nevertheless, when
Op2 is busy with work of other stations, Op1 will continue to finish the work of Station 3, then
hand over work in the intersection point after Station 3 or put the products in the buffer area
after Station 3, and finally return to Station 1 to perform next cycle of work. In the Shared Cell
mode, work handover between neighboring procedures should be performed in the intersection
point or buffer area after one procedure is finished, instead of between operators directly in
the processing procedure. In the Shared Cell mode, there may be some work-in-progress in
the buffer area.
-1388-
Journal of Industrial Engineering and Management – http://dx.doi.org/10.3926/jiem.1184
Figure 2. Shared Cell (SHC)
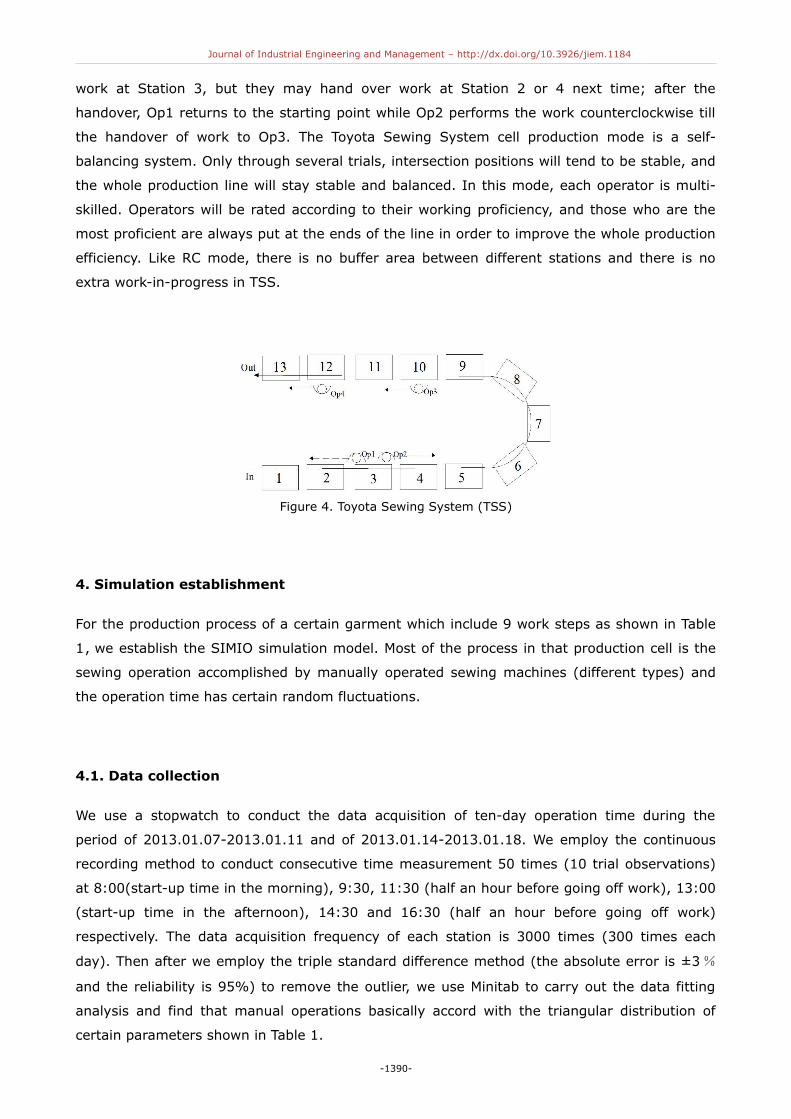
3.3. Rabbit Chase (RC)
Just as Figure 3 illustrates, instead of labor division, operators share the whole production line
and are respectively responsible for manufacturing one product in an orderly way (from Station
1 to Station 13). Different from Sub Cell and Shared Cell modes which have no particular
demands for the production line layout, Rabbit Chase production cell needs a U-shape layout
and operators who are proficient in the work of all stations. Operators perform their work in a
“chase manner”, thus line jam may arise when some operators finish their work too slowly.
According to Black and Schroer (1993), jam is not likely when the number of operators is less
than 3. But as the number grows, a jam is more likely. In the Rabbit Chase mode, there is no
buffer area between different stations and there is no extra work-in-process.
Figure 3. Rabbit Chase (RC)
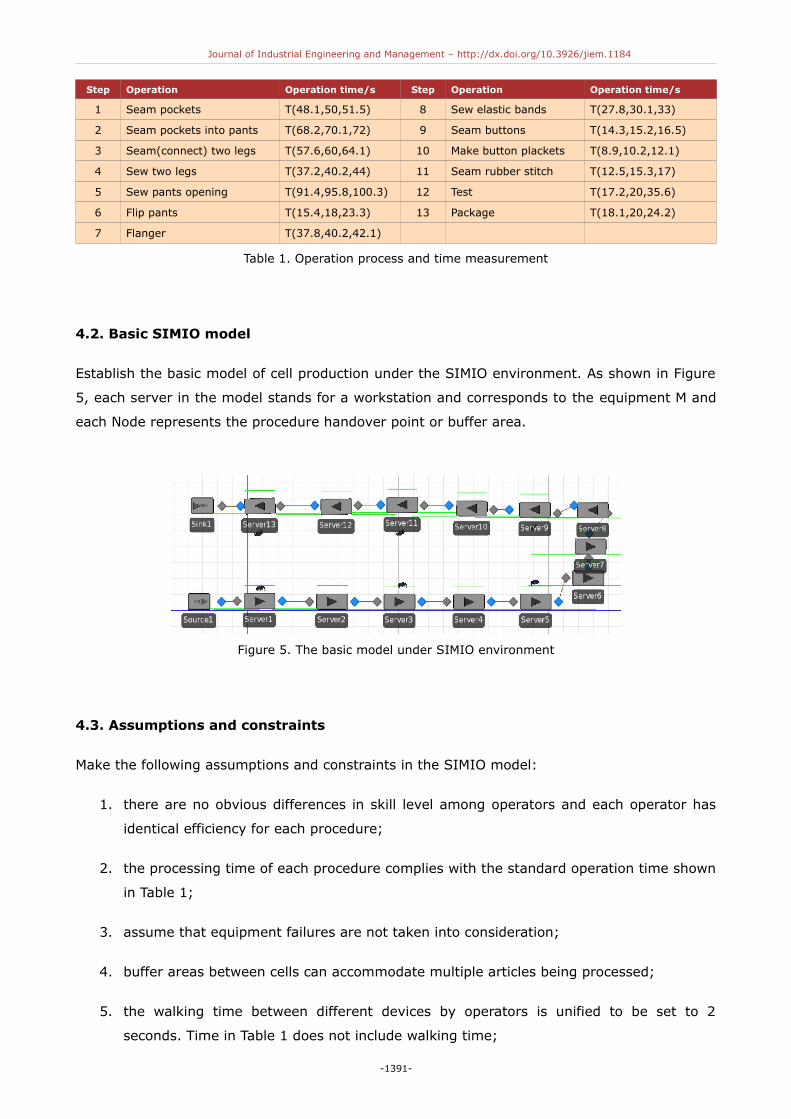
3.4. Toyota Sewing System (TSS)
TSS can also be called Bucket Brigade or Expand Rabbit Chase. Just as Figure 4 illustrates,
operators share the whole production line. Each operator receives the work-in-progress at the
starting point or from the former one, processes it till the end of the production line or hands it
over to the next operator, then returns to the initial station. In this mode, the handover of
work can take place at any time and any place. As shown in Figure 4, Op1 and Op2 hand over
-1389-
Journal of Industrial Engineering and Management – http://dx.doi.org/10.3926/jiem.1184
work at Station 3, but they may hand over work at Station 2 or 4 next time; after the
handover, Op1 returns to the starting point while Op2 performs the work counterclockwise till
the handover of work to Op3. The Toyota Sewing System cell production mode is a self-
balancing system. Only through several trials, intersection positions will tend to be stable, and
the whole production line will stay stable and balanced. In this mode, each operator is multi-
skilled. Operators will be rated according to their working proficiency, and those who are the
most proficient are always put at the ends of the line in order to improve the whole production
efficiency. Like RC mode, there is no buffer area between different stations and there is no
extra work-in-progress in TSS.
Figure 4. Toyota Sewing System (TSS)
4. Simulation establishment
For the production process of a certain garment which include 9 work steps as shown in Table
1, we establish the SIMIO simulation model. Most of the process in that production cell is the
sewing operation accomplished by manually operated sewing machines (different types) and
the operation time has certain random fluctuations.
4.1. Data collection
We use a stopwatch to conduct the data acquisition of ten-day operation time during the
period of 2013.01.07-2013.01.11 and of 2013.01.14-2013.01.18. We employ the continuous
recording method to conduct consecutive time measurement 50 times (10 trial observations)
at 8:00(start-up time in the morning), 9:30, 11:30 (half an hour before going off work), 13:00
(start-up time in the afternoon), 14:30 and 16:30 (half an hour before going off work)
respectively. The data acquisition frequency of each station is 3000 times (300 times each
day). Then after we employ the triple standard difference method (the absolute error is ±3%
and the reliability is 95%) to remove the outlier, we use Minitab to carry out the data fitting
analysis and find that manual operations basically accord with the triangular distribution of
certain parameters shown in Table 1.
-1390-
Journal of Industrial Engineering and Management – http://dx.doi.org/10.3926/jiem.1184
Step Operation Operation time/s Step Operation Operation time/s
1 Seam pockets T(48.1,50,51.5) 8 Sew elastic bands T(27.8,30.1,33)
2 Seam pockets into pants T(68.2,70.1,72) 9 Seam buttons T(14.3,15.2,16.5)
3 Seam(connect) two legs T(57.6,60,64.1) 10 Make button plackets T(8.9,10.2,12.1)
4 Sew two legs T(37.2,40.2,44) 11 Seam rubber stitch T(12.5,15.3,17)
5 Sew pants opening T(91.4,95.8,100.3) 12 Test T(17.2,20,35.6)
6 Flip pants T(15.4,18,23.3) 13 Package T(18.1,20,24.2)
7 Flanger T(37.8,40.2,42.1)
Table 1. Operation process and time measurement
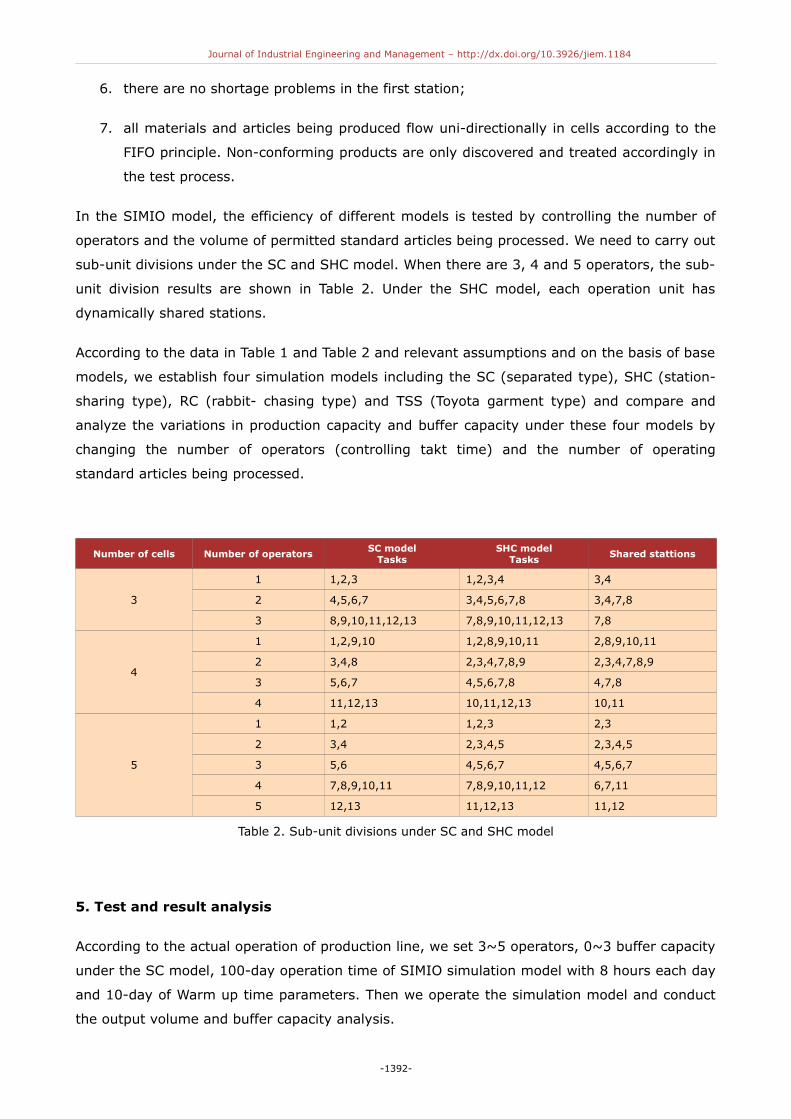
4.2. Basic SIMIO model
Establish the basic model of cell production under the SIMIO environment. As shown in Figure
5, each server in the model stands for a workstation and corresponds to the equipment M and
each Node represents the procedure handover point or buffer area.
Figure 5. The basic model under SIMIO environment
4.3. Assumptions and constraints
Make the following assumptions and constraints in the SIMIO model:
1. there are no obvious differences in skill level among operators and each operator has
identical efficiency for each procedure;
2. the processing time of each procedure complies with the standard operation time shown
in Table 1;
3. assume that equipment failures are not taken into consideration;
4. buffer areas between cells can accommodate multiple articles being processed;
5. the walking time between different devices by operators is unified to be set to 2
seconds. Time in Table 1 does not include walking time;
-1391-
Journal of Industrial Engineering and Management – http://dx.doi.org/10.3926/jiem.1184
6. there are no shortage problems in the first station;
7. all materials and articles being produced flow uni-directionally in cells according to the
FIFO principle. Non-conforming products are only discovered and treated accordingly in
the test process.
In the SIMIO model, the efficiency of different models is tested by controlling the number of
operators and the volume of permitted standard articles being processed. We need to carry out
sub-unit divisions under the SC and SHC model. When there are 3, 4 and 5 operators, the sub-
unit division results are shown in Table 2. Under the SHC model, each operation unit has
dynamically shared stations.
According to the data in Table 1 and Table 2 and relevant assumptions and on the basis of base
models, we establish four simulation models including the SC (separated type), SHC (station-
sharing type), RC (rabbit- chasing type) and TSS (Toyota garment type) and compare and
analyze the variations in production capacity and buffer capacity under these four models by
changing the number of operators (controlling takt time) and the number of operating
standard articles being processed.
Number of cells Number of operators SC modelTasks
SHC modelTasks
Shared stattions
3
1 1,2,3 1,2,3,4 3,4
2 4,5,6,7 3,4,5,6,7,8 3,4,7,8
3 8,9,10,11,12,13 7,8,9,10,11,12,13 7,8
4
1 1,2,9,10 1,2,8,9,10,11 2,8,9,10,11
2 3,4,8 2,3,4,7,8,9 2,3,4,7,8,9
3 5,6,7 4,5,6,7,8 4,7,8
4 11,12,13 10,11,12,13 10,11
5
1 1,2 1,2,3 2,3
2 3,4 2,3,4,5 2,3,4,5
3 5,6 4,5,6,7 4,5,6,7
4 7,8,9,10,11 7,8,9,10,11,12 6,7,11
5 12,13 11,12,13 11,12
Table 2. Sub-unit divisions under SC and SHC model
5. Test and result analysis
According to the actual operation of production line, we set 3~5 operators, 0~3 buffer capacity
under the SC model, 100-day operation time of SIMIO simulation model with 8 hours each day
and 10-day of Warm up time parameters. Then we operate the simulation model and conduct
the output volume and buffer capacity analysis.
-1392-
Journal of Industrial Engineering and Management – http://dx.doi.org/10.3926/jiem.1184
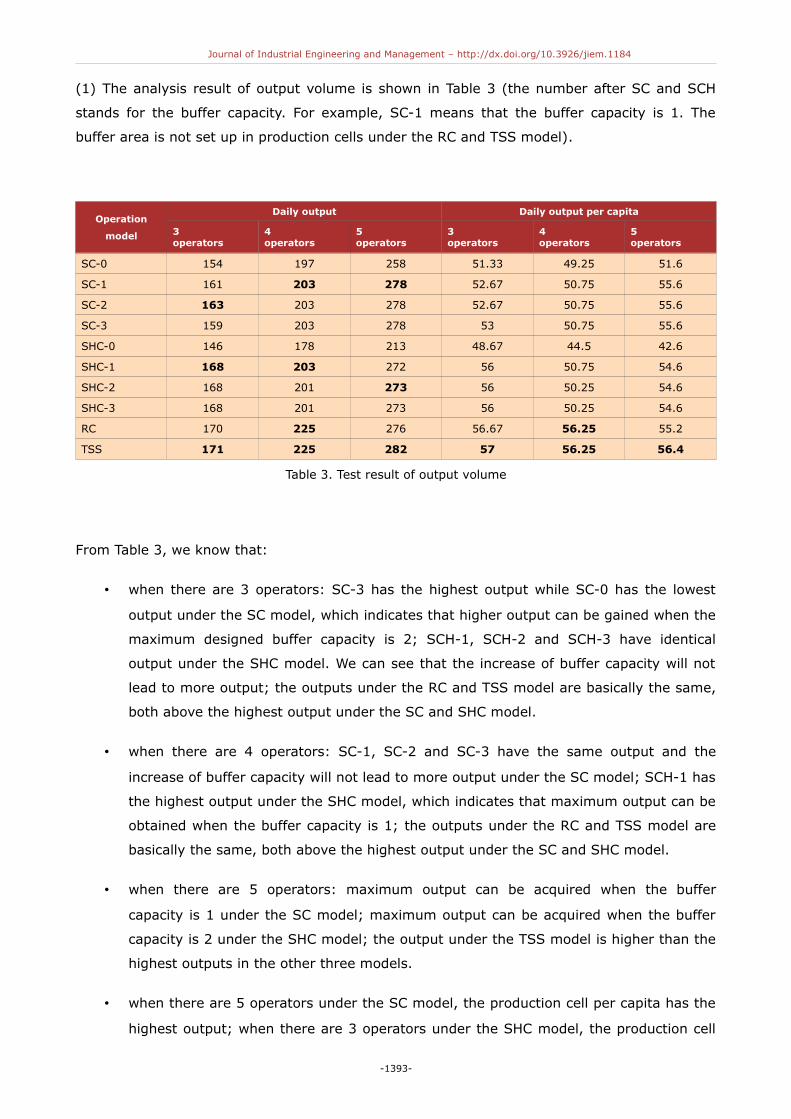
(1) The analysis result of output volume is shown in Table 3 (the number after SC and SCH
stands for the buffer capacity. For example, SC-1 means that the buffer capacity is 1. The
buffer area is not set up in production cells under the RC and TSS model).
Operation
model
Daily output Daily output per capita
3operators
4operators
5operators
3operators
4operators
5operators
SC-0 154 197 258 51.33 49.25 51.6
SC-1 161 203 278 52.67 50.75 55.6
SC-2 163 203 278 52.67 50.75 55.6
SC-3 159 203 278 53 50.75 55.6
SHC-0 146 178 213 48.67 44.5 42.6
SHC-1 168 203 272 56 50.75 54.6
SHC-2 168 201 273 56 50.25 54.6
SHC-3 168 201 273 56 50.25 54.6
RC 170 225 276 56.67 56.25 55.2
TSS 171 225 282 57 56.25 56.4
Table 3. Test result of output volume
From Table 3, we know that:
• when there are 3 operators: SC-3 has the highest output while SC-0 has the lowest
output under the SC model, which indicates that higher output can be gained when the
maximum designed buffer capacity is 2; SCH-1, SCH-2 and SCH-3 have identical
output under the SHC model. We can see that the increase of buffer capacity will not
lead to more output; the outputs under the RC and TSS model are basically the same,
both above the highest output under the SC and SHC model.
• when there are 4 operators: SC-1, SC-2 and SC-3 have the same output and the
increase of buffer capacity will not lead to more output under the SC model; SCH-1 has
the highest output under the SHC model, which indicates that maximum output can be
obtained when the buffer capacity is 1; the outputs under the RC and TSS model are
basically the same, both above the highest output under the SC and SHC model.
• when there are 5 operators: maximum output can be acquired when the buffer
capacity is 1 under the SC model; maximum output can be acquired when the buffer
capacity is 2 under the SHC model; the output under the TSS model is higher than the
highest outputs in the other three models.
• when there are 5 operators under the SC model, the production cell per capita has the
highest output; when there are 3 operators under the SHC model, the production cell
-1393-
Journal of Industrial Engineering and Management – http://dx.doi.org/10.3926/jiem.1184
per capita has the highest output; when there are 3 or 4 operators under the RC
model, the production cell per capita has the highest output; when there are 3
operators under the TSS model, the production cell per capita has the highest output.
Therefore, from the perspective of output, when there are 3~4 operators, we should prioritize
the TSS or RC model; when there are 5 people, we should prioritize the TSS model. From the
perspective of output per capita, we should prioritize the TSS model. When production demand
has been fixed, we can set a reasonable number of people based on production demand and
choose the appropriate operation mode according to Table 3 to obtain the maximum
productivity.
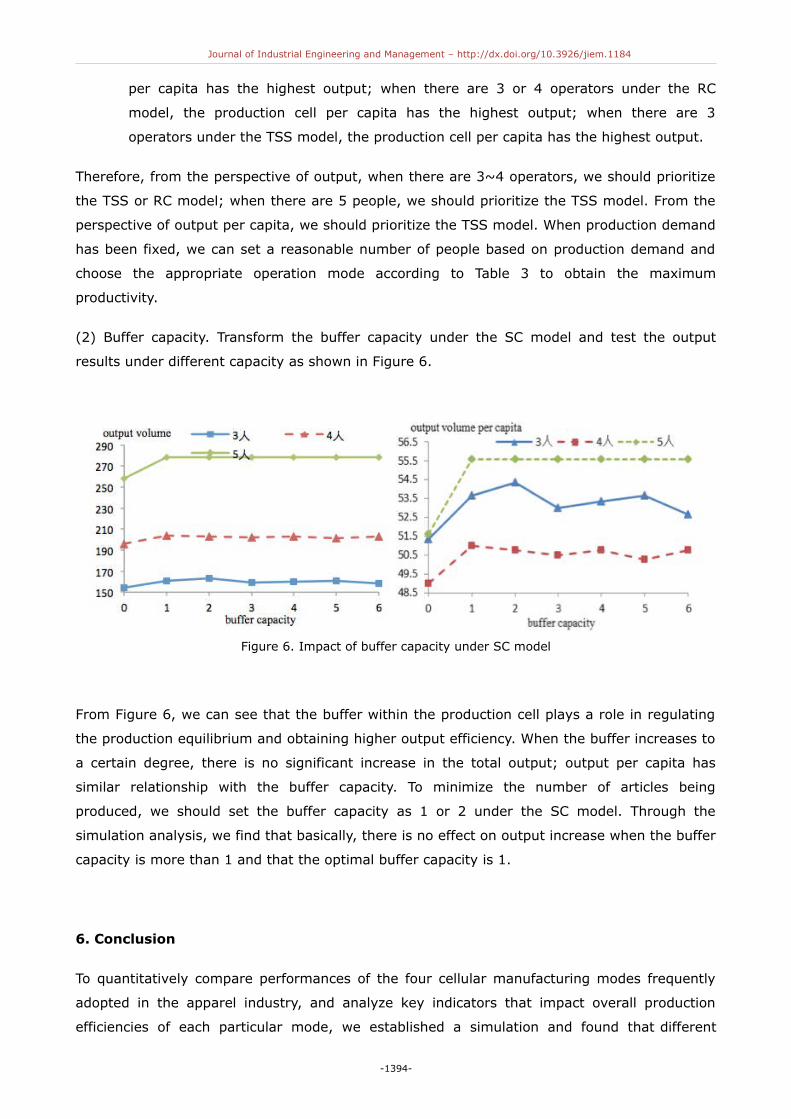
(2) Buffer capacity. Transform the buffer capacity under the SC model and test the output
results under different capacity as shown in Figure 6.
Figure 6. Impact of buffer capacity under SC model
From Figure 6, we can see that the buffer within the production cell plays a role in regulating
the production equilibrium and obtaining higher output efficiency. When the buffer increases to
a certain degree, there is no significant increase in the total output; output per capita has
similar relationship with the buffer capacity. To minimize the number of articles being
produced, we should set the buffer capacity as 1 or 2 under the SC model. Through the
simulation analysis, we find that basically, there is no effect on output increase when the buffer
capacity is more than 1 and that the optimal buffer capacity is 1.
6. Conclusion
To quantitatively compare performances of the four cellular manufacturing modes frequently
adopted in the apparel industry, and analyze key indicators that impact overall production
efficiencies of each particular mode, we established a simulation and found that different
-1394-
Journal of Industrial Engineering and Management – http://dx.doi.org/10.3926/jiem.1184
operation modes and the number of buffers have impacts on the cellular production mode. For
the apparel production line in this paper, to obtain the maximum output, we should prioritize
the TSS or TC model when there are 3~4 operators and the TSS mode when there are 5
operators. Therefore, to obtain the highest output per capita, we should prioritize the TSS
mode.
The research result of this paper indicates that in order to obtain higher total output and
output per capita, some key indicators including the number of operators, operation modes and
the number of buffers should be reasonably set for the particular apparel manufacturing line.
Acknowledgments
This research was supported by Foundation of Zhejiang Provincial Science Technology
Department (Grant No. 2012C31012) and Foundation of Zhejiang Provincial Education
Department (Grant No. LJ2013020).
References
Adams, M., & Schroer, B.J. (1999). Simulation as a tool for continuous process improvement.
Winter Simulation Conference Proceedings.
Amin, M.A., & Karim, M.A. (2013). A time-based quantitative approach for selecting lean
strategies for manufacturing organizations. International Journal of Production Research,
51(4), 1146-1167. http://dx.doi.org/10.1080/00207543.2012.693639
Black, J.T., & Schroer, B.J. (1993). Simulation of an apparel assembly cell with walking workers
a n d d e c o u p l e r s . Jou rna l o f Manu fac tu r i ng Sys tems, 12(2), 170-180.http://dx.doi.org/10.1016/0278-6125(93)90016-M
Bischak, D.P. (1996). Performance of a manufacturing module with moving workers. IIE
transactions, 28(9), 723-733.
Fatma, K., & Canan, S. (2007). Analysis of modular manufacturing mystem in clothing industry
by using simulation. Fibres & Textiles in Eastern Europe, 15(2), 93-96.
Karim, A., & Arif-Uz-Zaman, K. (2013). A methodology for effective implementation of lean
strategies and its performance evaluation in manufacturing organizations. Business Process
Management Journal, 19(1), 169-196. http://dx.doi.org/10.1108/14637151311294912
-1395-
Journal of Industrial Engineering and Management – http://dx.doi.org/10.3926/jiem.1184
Netland, T. (2013). Exploring the phenomenon of company-specific production systems: One-
best-way or own-best-way. International Journal of Production Research, 51(4), 1084-1097.http://dx.doi.org/10.1080/00207543.2012.676686
Walter, O.M., & Tubin, D.F. (2013). Assessment methods of lean manufacturing: Literature
review and classification. Gestao e Producao, 20(1), 23-45. http://dx.doi.org/10.1590/S0104-
530X2013000100003
Wang, X. & Tang, J. (2009). Cell management considering parts processed on machines in
multiple cells based on scatter search approach. Journal of mechanical engineering, 45(10),
125-131. http://dx.doi.org/10.3901/JME.2009.10.125
Wang, J., & Ziemke, M.C. (1991). Understanding modular manufacturing in the apparel
industry using simulation. Proceedings of Winter Simulation Conference.
Journal of Industrial Engineering and Management, 2014 (www.jiem.org)
Article's contents are provided on a Attribution-Non Commercial 3.0 Creative commons license. Readers are allowed to copy, distribute
and communicate article's contents, provided the author's and Journal of Industrial Engineering and Management's names are included.
It must not be used for commercial purposes. To see the complete license contents, please visit
http://creativecommons.org/licenses/by-nc/3.0/.
-1396-