a quantitative approach to selecting nozzle flow rate and
TRANSCRIPT
Close
A Quantitative Approach to Selecting Nozzle FlowRate and Stream, Part 1
BY JASON N. VESTAL AND ERIC A. BRIDGE
On a large scale, the American fire service has adopted a minimum initial attack handline flow of 150 gallonsper minute (gpm) for an aggressive interior attack in residential structure fires.1 National Fire ProtectionAssociation (NFPA) 1410, Standard on Training for Initial Emergency Scene Operations, 2010 edition, and1710, Standard for the Organization and Deployment of Fire Suppression Operations, Emergency MedicalOperations, and Special Operations to the Public by Career Fire Departments, 2010 edition, recommend thatthe first two handlines placed in service flow a combined total of 300 gpm once all first-alarm resources havearrived on scene. Several of the standard initial attack evolutions cited by NFPA 1410 provide that the firsttwo lines flow 150 gpm each.2-3 In one specific incident, this minimum flow rate recommendation wasaccepted by a department only after experiencing several significant firefighter injuries and a line-of-dutydeath.4
Revisiting the issue of initial attack handline flow rates is critical, given the increase in flashover and rapidfire progression incidents that are injuring and killing firefighters in residential structure fires. Since contentsin the typical residential structure in the United States have trended away from organic and cellulose-basedmaterials toward a greater percentage of hydrocarbons, the American fire service must seriously reconsiderthe manner in which the NFPA 1710 initial attack flow rate is met and applied, as well as consider anincrease in the minimum acceptable target flow rate. Today’s fire conditions leave little room for error.
The question we must ask is whether or not the first attack line used to make an offensive interior attack toprotect firefighters and rescue trapped occupants, often without vertical ventilation or a backup line in place,is supplying a flow rate that is capable of rapidly knocking down a worst-case fire progression scenario andcapable of instantly interrupting the fire’s progression to flashover. This flow rate must immediately cool thehigh-temperature gases and smoke at the ceiling level while absorbing enough heat to effectively cool thesurrounding walls, ceilings, floors, and other combustible contents that are about to flash over.
Several authors have examined and presented qualitative analyses of the various means by which firefightersmount an aggressive, yet safe, interior attack using 150 gpm. Many fire departments experience the successesassociated with an aggressive interior attack using initial attack target flow rates of 150 to 185 gpm. We willuse the interrelations of these authors’ experiences and philosophies, engineering and thermodynamicresearch, and our recent nozzle flow-rate research to provide a quantitative methodology to answer the

following question:
What is the safest, most effective, and most efficient single-handline flow rate and type for an initialresidential structure interior attack?
FIRST-ALARM RESPONSE TIME STANDARDSThe American fire service prides itself on a rapid, aggressive interior attack. In light of this philosophy, thetime-critical nature of applying the correct amount of water on the fire depends on understanding at whatpoint in the development of a fire firefighters typically arrive and enter a burning structure. The efficiencyand speed with which today’s firefighters respond to occupied dwellings profoundly affect how precise theinitial handline flow rate must be to deal with modern heat-release rates and the potential for flashover.National response time standards suggest that the initial arriving engine company typically making anoffensive interior attack with just a single handline will often arrive at approximately the same time as manyfires are approaching the flashover stage.
NFPA 1221The first-time component that we must understand is the time from when a fire is first reported to the timewhen first-alarm resources initiate their response. According to NFPA 1221, Standard for the Installation,Maintenance and Use of Emergency Services Communications Systems, 2010 edition, an emergencycommunications center must answer the call for a report of a fire within 15 to 40 seconds from when it isreceived.5 Correspondingly, the standard also recommends that fire call processing and dispatching becompleted within 60 to 80 seconds after the call has been answered. (5) The worst-case scenario presents asituation in which 130 seconds (two minutes and 10 seconds) have passed from the time the reporting partyattempted to notify the fire department of the fire to when the initial attack resources were notified.
NFPA 1710This standard provides several first-alarm time and response standards for career fire departments. Withrespect to response times, once an alarm is received, the recommended turnout time is one minute and 20seconds. (5) NFPA 1710 subsequently recommends that from the time the response begins until the firstengine arrives at the scene should be four minutes maximum. (3) As a result, the first-arriving enginecompany that will begin the initial attack should expect to arrive within six minutes of the receipt of thealarm.
NFPA 1410This standard provides several standards for first-alarm fireground operations, including minimum flowsfrom handlines, supply lines, and master streams. Furthermore, NFPA 1410 provides time standards forvarious fireground operations initial attack resources can expect to put into operation. For purposes of thisdiscussion, NFPA 1710 recommends that the sum of the two first handlines placed into operation at astructure fire be a minimum of 300 gpm and that the first handline flow be a minimum of 100 gpm. (3)
NFPA 1410 provides that the first two lines will be stretched, charged, and in operation with a water supplyestablished within three minutes of the first engine company’s arrival. (2) An initial arriving engine companywill likely make an offensive interior attack without a backup line or water supply in place prior to enteringthe fire compartment if occupants are trapped. Considering this, two minutes is a reasonable time for the first
line to be placed into operation within the structure from time of arrival. A two-minute time allowance wouldbe expected from time of arrival until water is applied into the main fire compartment. This accounts for thefirst-arriving officer’s providing an arrival report, performing a thorough size-up, and providing properdirection to personnel prior to advancing the line into and through the burning structure to the seat of the fire.
As the preceding NFPA standards exist as recommendations that many fire departments strive to meet, theyprovide a reasonable estimate of the expected time frame within which an initial arriving engine company islikely to arrive at the scene of a reported structure fire. These standards, when considered together, providethat the first nozzle team will enter into the fire area in approximately eight minutes from the time the initialreporting call is made. What all firefighters must consider is that during the response to and suppression of astructure fire, there is truly no way to precisely determine how long the fire has been burning and the phase ofdevelopment the fire is approaching.
2010 REPORT ON RESIDENTIAL FIREGROUND FIELDEXPERIMENTSIn April 2010, the National Institute of Standards and Technology (NIST) released Technical Note 1661,“Report on Residential Fireground Field Experiments.”6 In this research, live-fire studies were conductedusing a burn prop built to the NFPA 1710 low-hazard residential structure parameters of 2,000 ft2. One of theprimary goals of this research was to study the effects that varying crew sizes have on reflex and operationaltimes at structure fires and provide true operating times for typical fireground operations and tasks at acommon residential structure fire.
The significance of the 2010 NIST report is that it provides true scale operational times using actualfirefighters at a true structure fire and provides data that can be accurately applied to approximate at whattime in the fire development curve firefighters most likely arrive on the scene, prepare to make entry, stretchlines to the fire compartment, and initiate fire attack. This report also used response time standards fromNFPA 1221 and 1710.
In the study, times for firefighters to begin their travel to the fire started at 31⁄2 minutes from when the firestarted, and response times were three and five minutes. (6, 31) These times placed the first-due enginearriving at 61⁄2 minutes and 81⁄2 minutes from when the fire started.
The next timed parameter was “Advance Attack Line Time,” which was the time from when the first enginearrived and stretched the first line and was in a position to initiate fire attack. (6, 38) The report states that athree-person engine company took 3 minutes and 36 seconds, and a four-person engine company took 3minutes and 2 seconds to stretch the initial attack line to the fire. The time at which water was first applied tothe room-and-contents fire area (“Time to Water”) for the first-due engine company was 9 minutes and 15seconds for the three-person company and 8 minutes and 41 seconds for the four-person company—a 34-second or 6-percent difference. (6, 39) Correspondingly, this recent research provides accurate evidencerelative to the time the modern engine company arrives at the scene of a typical residential structure fire andbegins fire attack operations.
FLASHOVER RESEARCH: TIME VS. TEMPERATURENFPA 921, Guide for Fire and Explosion Investigations, 2008 edition, defines flashover as follows:
A transitional phase in the development of a compartment fire in which surfaces exposed to thermalradiation reach ignition temperature more or less simultaneously and fire spreads rapidly throughout
the space, resulting in full room involvement or total involvement of the compartment or enclosed area.
As a fire develops, heat and smoke from burning contents in a structure reach the ceiling, accumulate, andradiate extreme heat downward to combustibles at floor level, causing these materials to ignite.7 Scientificresearch over the past 30 years reveals two facts: The growth of a compartmentalized structural fire oftendevelops into flashover in less than 10 minutes from ignition, and the ceiling temperature associated withflashover is approximately 1,112ºF.8 As stated in NFPA 1710, flashover “hypothetically occurs in the roomof origin” between eight to 10 minutes after ignition. (3) This estimate of eight to 10 minutes correspondswith research conducted by Spearpoint, Mowrer, and McGrattan, who compared flashover time models withactual fire measurements. Their research showed that flashover conditions developed in a furnished room 17feet × 15 feet × 8 feet high within four minutes of igniting a loveseat and that flashover temperatures andsigns were observed between nine and 10 minutes after initial ignition of the loveseat.9
We will discuss later how a ceiling temperature of 1,112ºF plays a critical role in initial attack flow rate andstream selection choices. The heat-release rate (HRR) produced by superheated ceiling gases is discussedhere to help us appreciate how quickly flashover can occur, even faster than within the previously indicatedtime frame of nine to 10 minutes. As presented by Kennedy and Kennedy, a radiant heat value of 20 kW/m2
detected at floor level, associated with ceiling gas temperatures of 1,112ºF, is a significant “trigger point” thatcan cause a fire compartment to flash over. (8)
Researchers examined the time required for flashover to occur with an upper gas temperature of 1,112ºF(and) or a heat flux at floor level of 20 kW/m2. In this study, many of the wall-covering materials testedflashed in less than 3 minutes and 20 seconds from the start of the test.10 As will be examined later, once thepreflashover ceiling gas temperature of 1,112ºF is reached in a structural fire, a HRR greater than or equal to1 megawatt (MW) is produced. (A watt is one joule of energy per second, and a megawatt is one millionwatts.) When materials in a room are subjected to radiant heat values greater than or equal to 20 kW/m2, thecombustible contents can flash over, leading to entire compartment involvement in less than two minutes.(10, 618) Furthermore, in the 2009 NIST report, “Firefighting Tactics for Wind-Driven Fires,” a full-scaleapartment fire displayed flashover conditions within five to six minutes of ignition.11
As mentioned above, the recently released NIST “Report on Residential Fireground Field Experiments”provides data on operational timeline, benchmarks, and reflex times and compares these times against thedevelopment of a residential structure fire. Although countless research projects provide that flashover can beexpected to occur on average between eight and 10 minutes from ignition, one thing that must be consideredis the variability of fire growth rates, which affects the time to which the peak HRR is reached. When a HRRof 1 MW is reached, a minimum radiant heat flux value at floor level of 20 kW/m2 can be expected, whichcan rapidly lead to flashover and full involvement of the fire compartment, as well as rapid spread beyond theoriginal compartment. (6, 46). However, not all fires burn at the same speed, or rate. The peak HRR and rateof growth of any particular fire is greatly affected by physical and chemical properties of the contentsburning, including mass, surface area to volume ratios, and hydrocarbon content.
As an example, NIST states in this report that “a typical upholstered chair burning at its peak would producea 1-MW fire, while a large sofa at its burning peak would produce roughly a 2-MW fire.” (6, 46) With this inmind, the 2010 NIST residential fire study provided estimates of when the fire compartments, at slow,medium, and fast growth rates used in their research, would reach peak HRR values of 1 and 2 MW, bothproducing peak HRRs that could lead to flashover and total compartment involvement in the “absence ofsuppression.” (6, 46) The times reported for these HRRs and respective growth rates are summarized below:
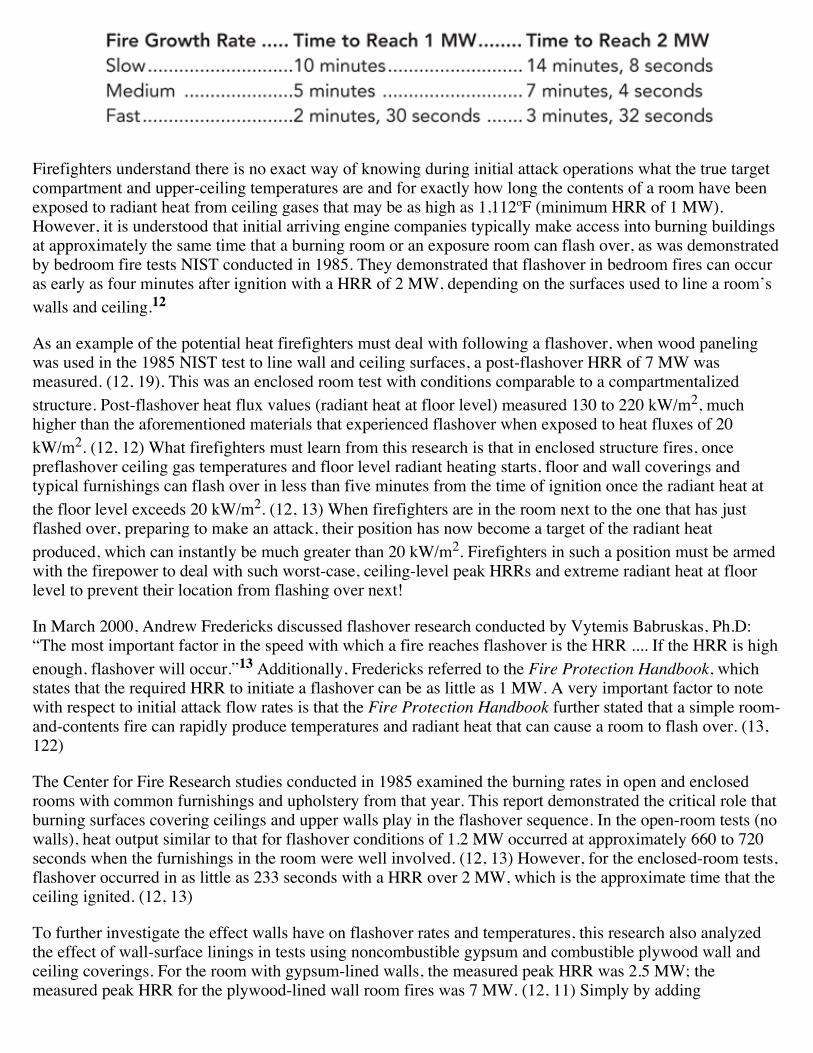
Firefighters understand there is no exact way of knowing during initial attack operations what the true targetcompartment and upper-ceiling temperatures are and for exactly how long the contents of a room have beenexposed to radiant heat from ceiling gases that may be as high as 1,112ºF (minimum HRR of 1 MW).However, it is understood that initial arriving engine companies typically make access into burning buildingsat approximately the same time that a burning room or an exposure room can flash over, as was demonstratedby bedroom fire tests NIST conducted in 1985. They demonstrated that flashover in bedroom fires can occuras early as four minutes after ignition with a HRR of 2 MW, depending on the surfaces used to line a room’swalls and ceiling.12
As an example of the potential heat firefighters must deal with following a flashover, when wood panelingwas used in the 1985 NIST test to line wall and ceiling surfaces, a post-flashover HRR of 7 MW wasmeasured. (12, 19). This was an enclosed room test with conditions comparable to a compartmentalizedstructure. Post-flashover heat flux values (radiant heat at floor level) measured 130 to 220 kW/m2, muchhigher than the aforementioned materials that experienced flashover when exposed to heat fluxes of 20kW/m2. (12, 12) What firefighters must learn from this research is that in enclosed structure fires, oncepreflashover ceiling gas temperatures and floor level radiant heating starts, floor and wall coverings andtypical furnishings can flash over in less than five minutes from the time of ignition once the radiant heat atthe floor level exceeds 20 kW/m2. (12, 13) When firefighters are in the room next to the one that has justflashed over, preparing to make an attack, their position has now become a target of the radiant heatproduced, which can instantly be much greater than 20 kW/m2. Firefighters in such a position must be armedwith the firepower to deal with such worst-case, ceiling-level peak HRRs and extreme radiant heat at floorlevel to prevent their location from flashing over next!
In March 2000, Andrew Fredericks discussed flashover research conducted by Vytemis Babruskas, Ph.D:“The most important factor in the speed with which a fire reaches flashover is the HRR .... If the HRR is highenough, flashover will occur.”13 Additionally, Fredericks referred to the Fire Protection Handbook, whichstates that the required HRR to initiate a flashover can be as little as 1 MW. A very important factor to notewith respect to initial attack flow rates is that the Fire Protection Handbook further stated that a simple room-and-contents fire can rapidly produce temperatures and radiant heat that can cause a room to flash over. (13,122)
The Center for Fire Research studies conducted in 1985 examined the burning rates in open and enclosedrooms with common furnishings and upholstery from that year. This report demonstrated the critical role thatburning surfaces covering ceilings and upper walls play in the flashover sequence. In the open-room tests (nowalls), heat output similar to that for flashover conditions of 1.2 MW occurred at approximately 660 to 720seconds when the furnishings in the room were well involved. (12, 13) However, for the enclosed-room tests,flashover occurred in as little as 233 seconds with a HRR over 2 MW, which is the approximate time that theceiling ignited. (12, 13)
To further investigate the effect walls have on flashover rates and temperatures, this research also analyzedthe effect of wall-surface linings in tests using noncombustible gypsum and combustible plywood wall andceiling coverings. For the room with gypsum-lined walls, the measured peak HRR was 2.5 MW; themeasured peak HRR for the plywood-lined wall room fires was 7 MW. (12, 11) Simply by adding

combustible materials to the wall and ceiling surfaces, the HRR increased by 4.5 MW. This report furtherfound that when the ceiling surface ignited, the burning rate of furnishings was significantly enhanced in allopen-door room burn tests. (12, 19)
These full-scale fire tests measured the effects fire had on the standard furnishings in a typical United StatesPark Service (USPS) bedroom that was 8 feet wide, 12 feet deep, and 8 feet high with a floor area of 96square feet. (12, 4) Room furnishings consisted of plywood furniture and a wood-frame bed with syntheticbedding materials. There were no televisions, radios, or other electronic devices. (12, 5) The fire load of thisexperimental room when lined with plywood walls was 3.03 pounds per square foot (lb/ft2), almost two-thirds the fire load of the average recreational room in a metropolitan Washington, DC, single-family home in1985, reported as 4.71 lb/ft2. (12, 6)
With respect to the heat output of various materials commonly found in residential structures, wood, paper,cloth, and cotton produce 7,000 to 8,000 British thermal units per pound (Btu/lb). Plastic furnishings usingpolyurethane produce 12,000 Btu/lb, and those using polystyrene plastics produce 18,000 Btu/lb.14 For eachpound, plastics can yield approximately twice as many Btus than materials and items composed primarily ofwood and other natural organic materials. As the fraction of hydrocarbon-based plastics in fire loads inmodern construction materials and furniture increases, and since the amount of electronics in typical homeshas increased since 1985, firefighters should anticipate the peak HRR in a room fire to be higher than the 7MW recorded in the aforementioned bedroom fire study in which there were no electronics. Because of this,along with the increased use of energy-efficient building materials and windows engineered to contain heat,firefighters should expect a peak HRR greater than 7 MW, a greater amount of radiant heat at floor level, andan increased likelihood of flashovers occurring in less than eight to 10 minutes following ignition. (13, 120)
The 1985 NIST study’s open-room tests (the fire area had no walls to contain heat and products ofcombustion) showed that the fire produced the minimum floor radiant heat level—20 kW/m2—needed forflashover. However, in the closed-room tests, the measured floor heat flux was 130 to 220 kW/m2 when thefires were not extinguished early. (12, 12) Firefighters making the initial interior attack will be operating inan enclosed environment that will have walls. Therefore, they must expect radiant heat levels equal to orgreater than 20 kW/m2 from adjacent fully involved compartments to affect unignited contents in the room inwhich they are operating or from which they are directing a stream.
This should sound an alarm for all firefighters: If a flashover of contents and materials at floor levels isinitiated by a radiant heat level of 20 kW/m2 in less than eight minutes, realize that flashover could very welloccur in less than eight minutes in enclosed fire compartments with a possible floor heat flux of up to 130 to220 kW/m2 from upper surface and upper/gas smoke layers. Clearly, it is possible for a flashover to occur inless than five minutes from ignition.
With rooms in residential structure fires having potential peak heat outputs of 7 MW or more, when suchpreflashover conditions exist, there is little room for error, and the initial attack crew must select a stream thathas the reach, thermal penetration, and droplet size to reach not only the burning fuel base but also theprimary radiant heat sources that lead to flashover—the ceiling gases and smoke, the burning ceiling, and theburning wall materials simultaneously. This stream, at a minimum, must be capable of absorbing themaximum potential HRR at the ceiling. At the same time, it also must have enough heat-absorbing capacityand mass so that a significant portion of the stream will not turn to steam. These unevaporated droplets, ifthey are big enough, will then fall to the floor in droplet form, suppressing the primary fuel source andpreventing unignited combustibles from flashing over.
HOW MUCH HEAT?
To estimate the adequacy of a flow rate for a single initial attack handline, we must first estimate the HRR ofa given fire compartment or area. Once the worst-case peak HRR has been estimated, we can assess theability of the selected stream to absorb the predicted amount of heat produced.
As referenced above, a HRR of 1 to 2 MW is commonly associated with the minimum upper-level gastemperature that can produce enough radiant heat to induce a flashover. Based on the square footage of theUSPS/NIST test, the gypsum-lined rooms had a HRR per square foot of 0.023 HRR/ft2, and the plywood-lined rooms a value of 0.07 MW/ft2. The HRR/ft2 value of 0.07 MW/ft2 was recorded for the USPS test whenplywood was used to line the ceiling and walls. Although the USPS tests produced a maximum HRR of 7MW following flashover, the fire loading of an average home at that time was 1.55 times greater than the fireload of that room used in the test. With an increase in fire loading, a rough field estimate of the HRR could beexpected to be up to or greater than 10.9 MW for a room of similar dimensions. Such an approximation islikely to be an oversimplification of the physics and thermodynamics behind fuel loading and the associatedHRR. However, firefighters in the streets need a straightforward, user-friendly field value to help themroughly determine if their flow rates are in the “ballpark” of the flow rate needed to combat worst-casescenario HRRs that can rapidly lead to a flashover when no backup line is in place.
An office-type fire burning at 100 percent efficiency produces a HRR per square meter of 0.25MW/m2.15
Converting this HRR per-area value to square footage yields a value of 0.023 MW/ft2, which is the samevalue reported in the NIST/USPS test for the gypsum-lined walls. Although most homes use gypsum-linedwalls, the walls may have combustible covers such as wainscoting, paints, wallpaper, pictures, paintings, andso on, so a value of 0.07 MW/ft2, three times that of 0.023 MW/ft2, provides a reasonable safety margin inestimating possible HRRs. This value also provides a margin of safety for those homes with high degrees ofclutter, storage, and other fire hazards that so often are found in residential structures in which fires occur.
The NIST Building and Fire Research Laboratory (BFRL) published Technical Note 1618, “Fire FightingTactics Under Wind-Driven Conditions: Laboratory Experiments,” in January 2009. In this research, a full-scale apartment was constructed in a fire test laboratory. It consisted of a bedroom, a living room, and a targetroom; all were connected by a common hallway that opened to a corridor (similar to a center-hallwayapartment). The bedroom, selected as the fire’s point of origin, measured 16 feet wide × 12 feet deep × 8 feettall and was 192 ft2. The fuel loading throughout the apartment consisted of carpeting, carpet padding, atelevision and lamps, and furniture such as chairs and mattresses; all were manufactured during 1998 and1999. The walls and ceilings were latex-painted gypsum board. The calculated combustible fuel load in thebedroom was 4.02 lb/ft2; in the living room, 2.5 lb/ft2; and in the hallway, 0.98 lb/ft2. (11) The fire wasignited in the bedroom in a trash can filled with paper positioned between an upholstered chair and a bed.(11, 64)

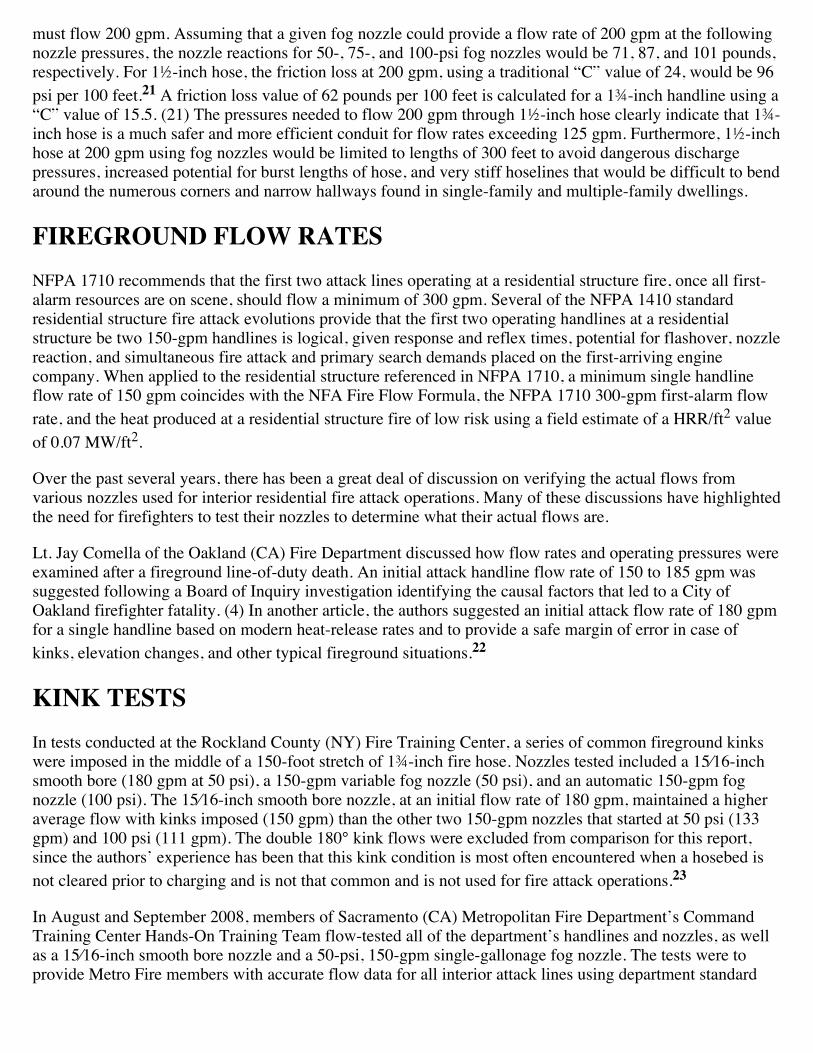
(1) A closeup of the larger dropletsfrom a 15⁄16-inch smooth borenozzle at 180 gpm. (Photos byJason Vestal.)
The bedroom fires continued to grow until the bedroom glass window began to fail, producing anapproximate HRR of 1 MW, which is equal to the value of 1 MW reported by the NFPA Fire ProtectionHandbook as the minimum HRR needed to initiate “flashover (in) a room with a normal sized opening.” (13,122). At this time, a researcher completely removed the window, and the fire was allowed to burn unchecked.Post-flashover observations of conditions made shortly thereafter revealed HRR values of 15 to 20 MW. Apeak HRR for the bedroom-control test just after flashover conditions were observed was 14 MW. (11, 354)
As stated previously, a ceiling temperature of 1,112°F is required to produce enough radiant heat at floorlevel (heat flux) to cause contents, such as flooring and furnishings, to flash over. The square footage and theHRR of the bedroom in the wind-driven fire study provides a HRR/ft2 of 0.073 MW/ft2 with a fuel load of4.0 lb/ft2, only one pound greater per square foot than the 1985 NIST/USPS test, using modern-dayfurnishings. This most recent study excluded the fuel load contributions from the oriented strand board (OSB)subfloor and latex-painted gypsum walls and floors. These HRR values were obtained during the controlportion of the NIST/DHS 2008 experiments (no wind applied to the structure while it was burning). The post-flashover peak HRR value of 14 MW in this most recent NIST test with gypsum-lined walls produced aHRR/ft2 similar to the post-flashover HRR/ft2 value from the 1985 NIST tests, in which the walls and ceilingwere lined with plywood. This comparison suggests that in the 2008 test with noncombustible walls and asimilar fuel load, a higher post-flashover peak HRR likely resulted from increased combustibility of themodern furniture in the 2008 tests.
In 2004, NIST released the “Cook County Administration Building Fire October 17, 2003: Heat Release RateExperiments and FDS Simulations.” The researchers examined the factors that led to this fatal fire. This studyproduced very precise heat-release rates for full-scale office fires, using building materials, office furniture,and electronics collected from areas of the Cook County (IL) Administration Building that were notdestroyed in 2003. In previous office workstation fires, NIST discussed research that had produced a HRR/ft2
value of 0.169 MW/ft2, based on a combustible fuel load of 18 lb/ft2.16 The 2003-2004 NIST full-scale officetests recreated burning conditions at the Cook County Administration Building Fire and produced a HRR/ft2

value of 0.103 MW/ft2 using a fuel load of 17 lb/ft2. (16)
Comparing the results from the 1985 NIST/USPS, the 2003-2004 NIST office fire studies with much higherfuel loads, and the 2009 NIST/DHS Firefighting Tactics Under Wind-Driven Conditions suggests that a valueof 0.07 MW/ft2 is an accurate figure to use to estimate the possible worst-case HRR at residential structurefires. The value of 0.07 MW/ft2 for residential structures is consistent with real-scale fire test results over thepast 20 years and correlates well against HRRs produced in office fires using similarly aged combustibles.However, with higher fuel loadings and more plastic electronic devices per square foot—i.e., a residentialbedroom vs. an office workstation—these factors suggest that this value provides a margin of safety whenattempting to establish a field value to estimate single-room peak HRR for contemporary furnishings andinterior contents in residential structures based on the square footage of a fire compartment.
As noted above, flashover can be initiated with a peak HRR as low as 1 to 3 MW and a heat flux of 20kW/m2 radiating from ceiling gases to floor level. As will be discussed in greater detail below, firefighters infull structural personal protective equipment (PPE) can at best endure 500°F temperatures and a heat flux of20 kW/m2 for only 30 seconds. (11, 335) For a single stream operating from within a threatened compartmentto be rapidly effective against a possible flashover, that stream must be capable of absorbing the heatproduced from the worst-case scenario HRR for that particular compartment or an adjacent involvedcompartment within 30 seconds to provide the best chance for the survival of firefighters operating within oroccupants that may be trapped in that space. When preflashover or rapid fire progression conditions areobserved, firefighters committed to interior positions who cannot instantly exit the threatened area must beable to reduce flashover-inducing HRRs and heat flux with a single stream in less than 30 seconds.
With decreased sensory awareness, firefighters have a reduced ability to accurately and quickly determineenvironmental conditions and changes. In the most extreme cases of zero visibility, it is often difficult at bestto observe flames in the overhead or other visual clues. Since flashover can occur at approximately the sametime as the first hoseline is placed in operation in an offensive interior attack, firefighters may not have thethermal reference history to be able to recognize subtle temperature fluctuations and interior environmentaltransitions that can occur in a matter of seconds and initiate a flashover. This can cause firefighters toovercommit to an interior position so that if a flashover were to occur and their handline flow rate does nothave the heat-absorbing capability to prevent or stop the fire’s progression, they are likely in a fatal situation.Even with the most modern PPE, they likely would not have enough time to exit the structure withoutincurring serious thermal injury.
A given fire requires a specific amount of water to successfully absorb the heat produced in a relatively shorttime so that a developing flashover can be effectively stopped and occupants not wearing structural PPE canbe instantly protected. With many modern residential structures having larger master bedrooms, familyrooms, and kitchens, firefighters must expect a HRR greater than that associated with an 8- × 8-foot bedroom.The more floor space available, the more combustible materials inhabitants are likely to accumulate. Asdiscussed above, firefighters can calculate field estimates of worst-case HRRs for residential, commercial,and office structure fires based on the square footage of the area compartment involved.
An average value of 0.07 MW/ft2 is suggested for estimating the potential HRR from average residentialbedroom fuel loads. For example, a fire that has flashed over in a room 10 feet × 10 feet, similar to that of asmall bedroom fire, can be estimated to produce a peak HRR at flashover of 7 MW. However, for a largerroom, such as a living room that measures 20 feet × 20 feet, a peak HRR of 28 MW can be estimated. Manymodern residential structures contain master bedrooms, family rooms, or garages measuring at least 20 feet ×20 feet. When operating in an interior exposure position, firefighters who have advanced to an interiorposition close to the seat of the fire must be concerned with the peak HRR from adjacent rooms—open doors,hallways, and uncompartmented areas. Once flashed over, they can instantly expose adjacent exposure
compartments to flashover-inducing HRRs and radiant heat levels at the floor where firefighters areoperating.
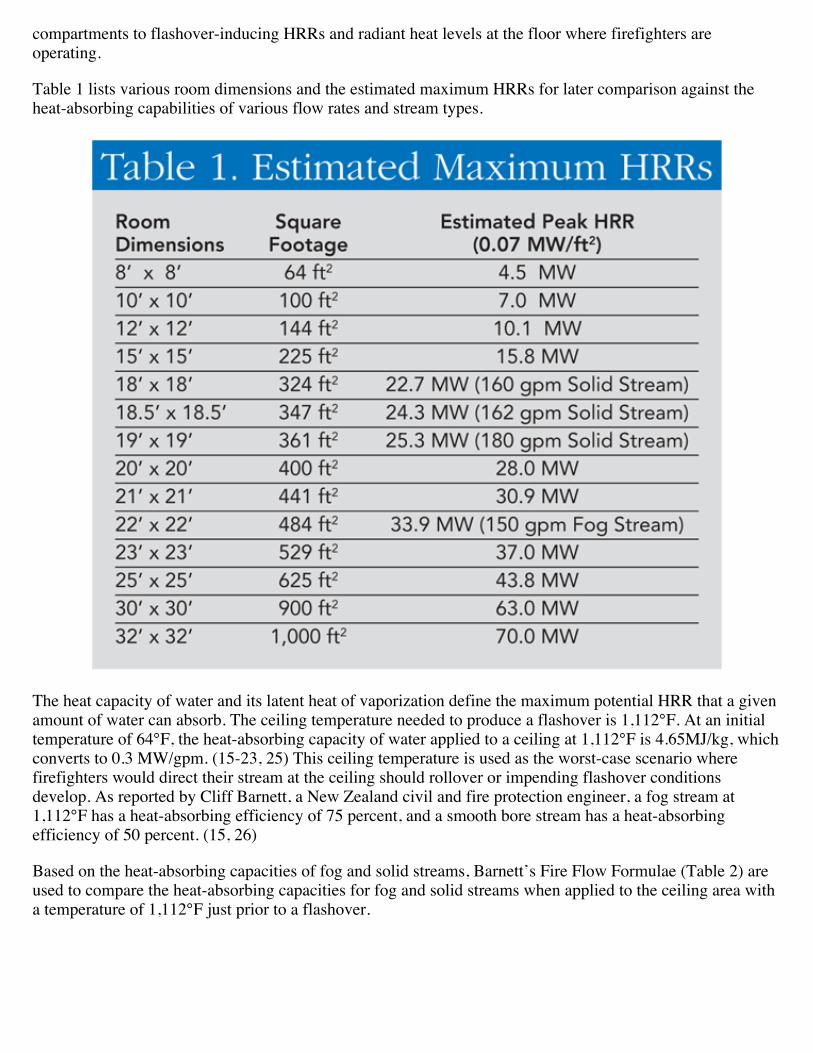
Table 1 lists various room dimensions and the estimated maximum HRRs for later comparison against theheat-absorbing capabilities of various flow rates and stream types.
The heat capacity of water and its latent heat of vaporization define the maximum potential HRR that a givenamount of water can absorb. The ceiling temperature needed to produce a flashover is 1,112°F. At an initialtemperature of 64°F, the heat-absorbing capacity of water applied to a ceiling at 1,112°F is 4.65MJ/kg, whichconverts to 0.3 MW/gpm. (15-23, 25) This ceiling temperature is used as the worst-case scenario wherefirefighters would direct their stream at the ceiling should rollover or impending flashover conditionsdevelop. As reported by Cliff Barnett, a New Zealand civil and fire protection engineer, a fog stream at1,112°F has a heat-absorbing efficiency of 75 percent, and a smooth bore stream has a heat-absorbingefficiency of 50 percent. (15, 26)
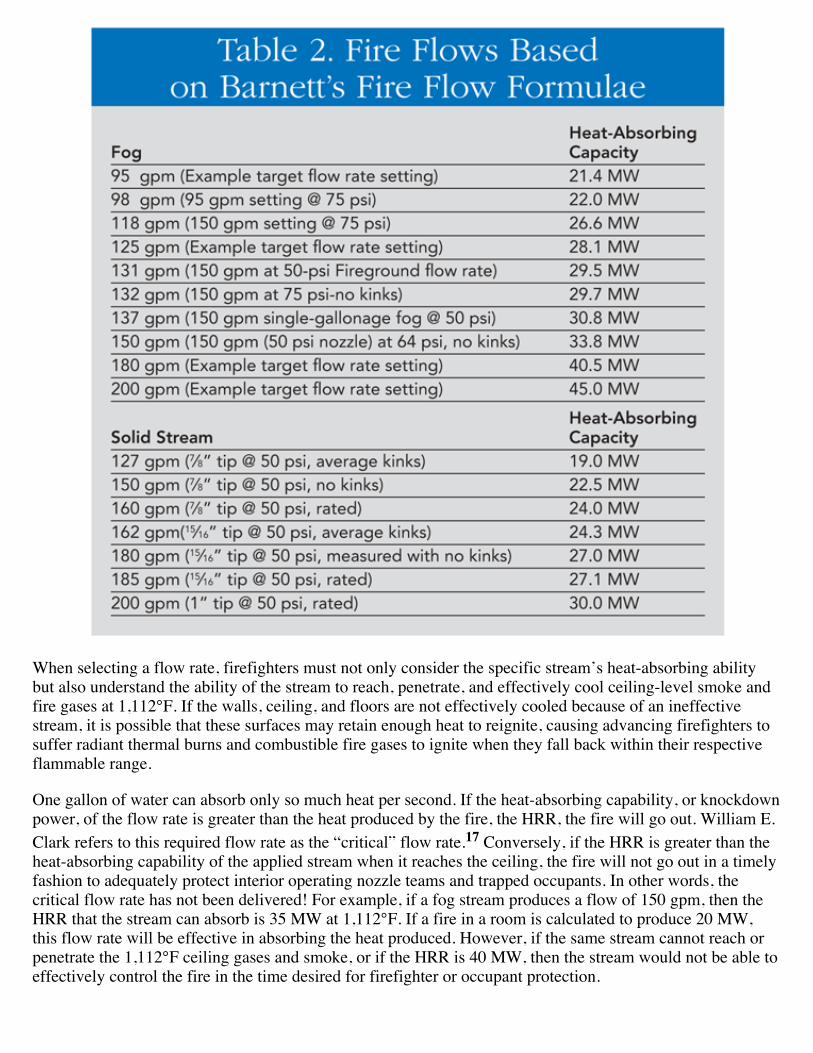
Based on the heat-absorbing capacities of fog and solid streams, Barnett’s Fire Flow Formulae (Table 2) areused to compare the heat-absorbing capacities for fog and solid streams when applied to the ceiling area witha temperature of 1,112°F just prior to a flashover.
When selecting a flow rate, firefighters must not only consider the specific stream’s heat-absorbing abilitybut also understand the ability of the stream to reach, penetrate, and effectively cool ceiling-level smoke andfire gases at 1,112°F. If the walls, ceiling, and floors are not effectively cooled because of an ineffectivestream, it is possible that these surfaces may retain enough heat to reignite, causing advancing firefighters tosuffer radiant thermal burns and combustible fire gases to ignite when they fall back within their respectiveflammable range.
One gallon of water can absorb only so much heat per second. If the heat-absorbing capability, or knockdownpower, of the flow rate is greater than the heat produced by the fire, the HRR, the fire will go out. William E.Clark refers to this required flow rate as the “critical” flow rate.17 Conversely, if the HRR is greater than theheat-absorbing capability of the applied stream when it reaches the ceiling, the fire will not go out in a timelyfashion to adequately protect interior operating nozzle teams and trapped occupants. In other words, thecritical flow rate has not been delivered! For example, if a fog stream produces a flow of 150 gpm, then theHRR that the stream can absorb is 35 MW at 1,112°F. If a fire in a room is calculated to produce 20 MW,this flow rate will be effective in absorbing the heat produced. However, if the same stream cannot reach orpenetrate the 1,112°F ceiling gases and smoke, or if the HRR is 40 MW, then the stream would not be able toeffectively control the fire in the time desired for firefighter or occupant protection.
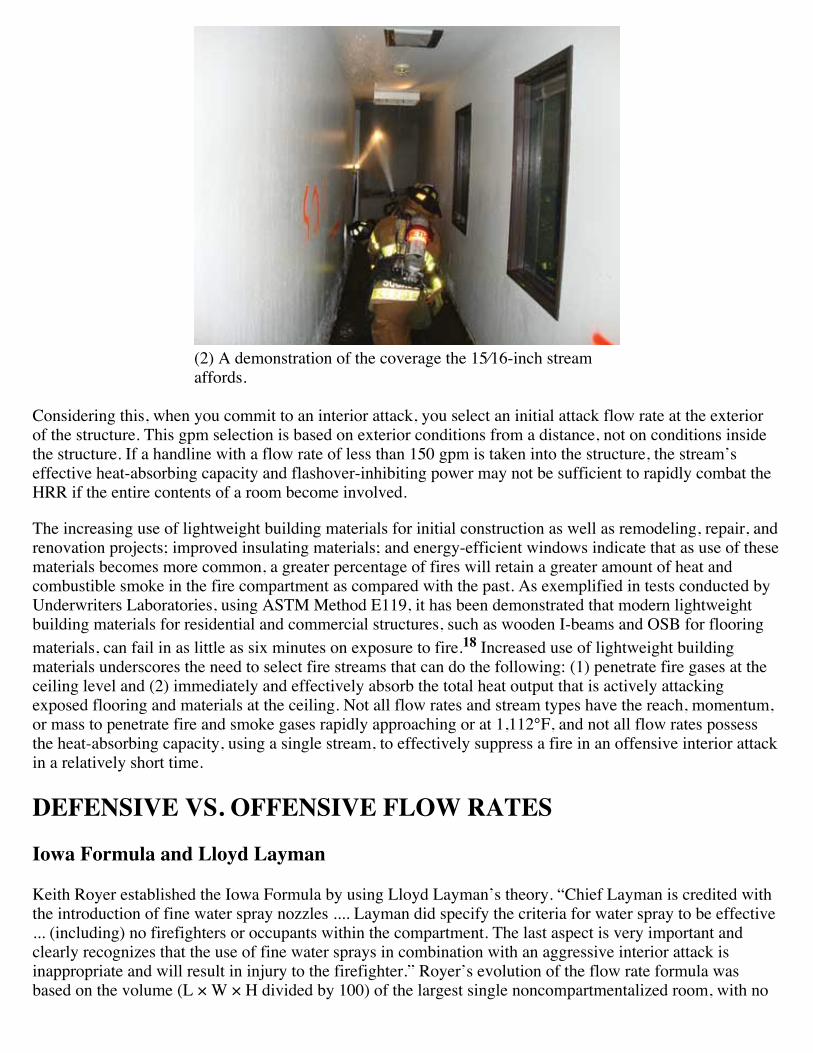
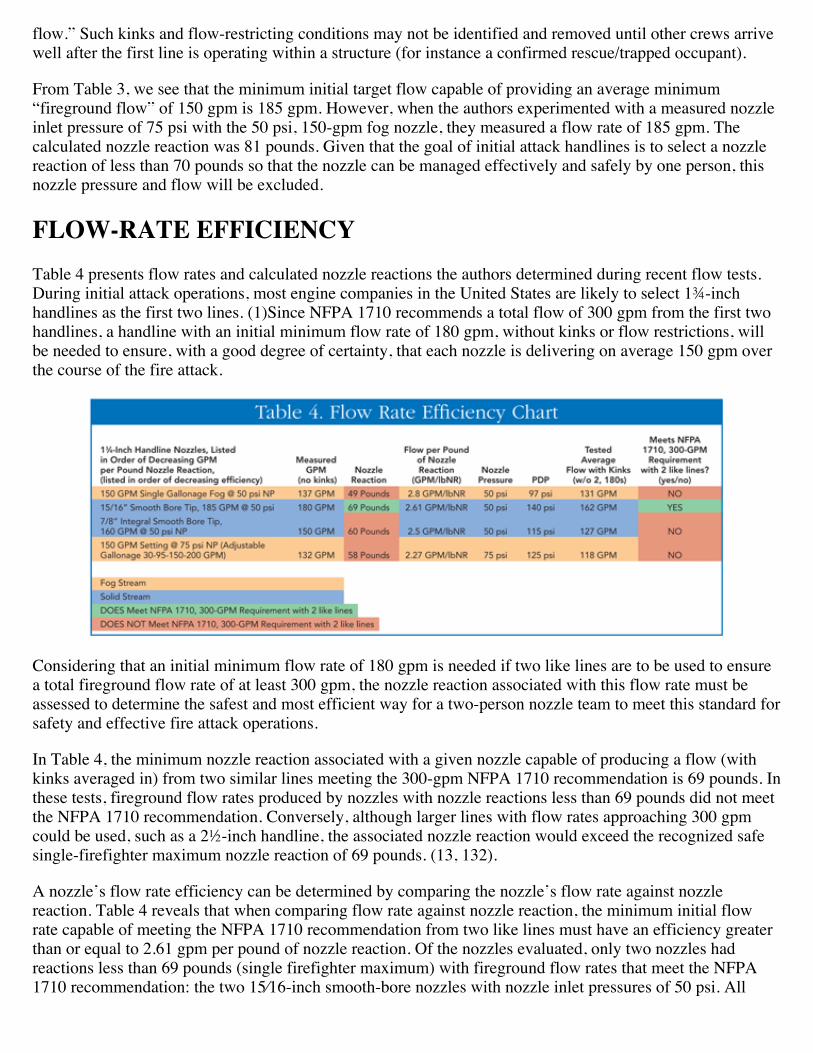
(2) A demonstration of the coverage the 15⁄16-inch streamaffords.
Considering this, when you commit to an interior attack, you select an initial attack flow rate at the exteriorof the structure. This gpm selection is based on exterior conditions from a distance, not on conditions insidethe structure. If a handline with a flow rate of less than 150 gpm is taken into the structure, the stream’seffective heat-absorbing capacity and flashover-inhibiting power may not be sufficient to rapidly combat theHRR if the entire contents of a room become involved.
The increasing use of lightweight building materials for initial construction as well as remodeling, repair, andrenovation projects; improved insulating materials; and energy-efficient windows indicate that as use of thesematerials becomes more common, a greater percentage of fires will retain a greater amount of heat andcombustible smoke in the fire compartment as compared with the past. As exemplified in tests conducted byUnderwriters Laboratories, using ASTM Method E119, it has been demonstrated that modern lightweightbuilding materials for residential and commercial structures, such as wooden I-beams and OSB for flooringmaterials, can fail in as little as six minutes on exposure to fire.18 Increased use of lightweight buildingmaterials underscores the need to select fire streams that can do the following: (1) penetrate fire gases at theceiling level and (2) immediately and effectively absorb the total heat output that is actively attackingexposed flooring and materials at the ceiling. Not all flow rates and stream types have the reach, momentum,or mass to penetrate fire and smoke gases rapidly approaching or at 1,112°F, and not all flow rates possessthe heat-absorbing capacity, using a single stream, to effectively suppress a fire in an offensive interior attackin a relatively short time.
DEFENSIVE VS. OFFENSIVE FLOW RATES
Iowa Formula and Lloyd Layman
Keith Royer established the Iowa Formula by using Lloyd Layman’s theory. “Chief Layman is credited withthe introduction of fine water spray nozzles .... Layman did specify the criteria for water spray to be effective... (including) no firefighters or occupants within the compartment. The last aspect is very important andclearly recognizes that the use of fine water sprays in combination with an aggressive interior attack isinappropriate and will result in injury to the firefighter.” Royer’s evolution of the flow rate formula wasbased on the volume (L × W × H divided by 100) of the largest single noncompartmentalized room, with no
interior life hazard, in which multiple 30° fog lines were used simultaneously to indirectly attack the fire for30 seconds.19 This form of attack assumed no offensive interior operations until after the fire was darkeneddown. Furthermore, this form of attack was based on the concept that all necessary handlines and the totalvolume needed were on scene prior to initiating the exterior attack. (19, 2)
National Fire Academy Flow
In the early 1980s, instructors at the National Fire Academy (NFA) “examined the practicality of the Iowaformula for normal operations,” including use for an offensive interior attack initiated by a single enginecompany, concurrent search operations, vertical and horizontal ventilation, and sequential support operations.(19, 3) The instructors then surveyed a number of NFA students in simulated fire scenes, where the firebuilding was assumed to be 50 percent involved, the fire attack initiated with a single interior attack line, and“primary search and ventilation operations would be achieved simultaneously with fire flow operations.” (19,3) The students provided their own assessment of needed flows per line to operate such an interior attack.Based on their estimates, the instructors determined the corresponding average flow rate based on squarefootage vs. the estimated flow rate. The corresponding formula is (Area)/3.
Using the square footage NFPA 1710 provides for a two-story residential structure no more than 50 percentinvolved in fire, the NFA flow formula calls for a rate of 666 gpm. This could include total involvement ofthe entire second floor, totaling 1,000 ft2 for multiple compartments. It is highly unlikely that any singlecompartment on the second floor of a typical residential structure would be 1,000 ft2. As discussed above, aroom measuring 23 feet × 23 feet, similar to that of a two-car garage or a large family/bonus room, covers asquare footage of just over 500 ft2. The corresponding single-line flow rate for such an area using thisformula would be 167 gpm.
Using the HRR/ft2 value of 0.07 MW/ft2 discussed above, if a two-story residential structure of 2,000 ft2
were 50 percent involved (1,000 ft2), a total HRR of all simultaneously involved compartments would beestimated to be 70 MW. Based on the heat-absorbing capabilities of a single fog or smooth bore handlinelisted above at manageable nozzle reactions for a single person, more than one handline would be needed forthis extent of involvement. However, for a room of 500 ft2, an estimated peak HRR would be 35 MW, whichwould be much more likely to be controlled by the heat-absorbing capabilities from a stream with a flow ratein the range of 150 to 185 gpm.
NFPA 1710 FLOW RATENFPA 1710, Section 5.2.4.2.2 requires the “establishment of an effective water-flow application rate of 1,110L/min (300 gpm) from two handlines, each of which shall have a minimum of 370 L/min (100 gpm).” (3, 9)In a personal communication with Chief (Ret.) Alan Brunacini, NFPA 1710 chair, the intent of selecting 300gpm as the first-alarm interior attack flow rate was based on the ability to confine and extinguish an averagesingle room-and-contents fire in a two-story residential structure fire of 2,000 square feet. This flow rate doesnot account for more than the involvement of one room.20 Furthermore, this standard is based on a residentialstructure of low-hazard and with no basement and no exposures. (6,16) Firefighters must make the necessaryadjustments and base their flow rates on the fires they are more likely to face and/or be injured on and face ahigher rate of fire growth or flashover risk: high-hazard residential structures of multiple room involvementon arrival.
To meet the 300-gpm standard identified in NFPA 1710, the use of a 100-gpm handline is consistent with theNFPA 1710 standard of using handlines with a minimum flow rate of 100 gpm; however, the second handline
must flow 200 gpm. Assuming that a given fog nozzle could provide a flow rate of 200 gpm at the followingnozzle pressures, the nozzle reactions for 50-, 75-, and 100-psi fog nozzles would be 71, 87, and 101 pounds,respectively. For 1½-inch hose, the friction loss at 200 gpm, using a traditional “C” value of 24, would be 96psi per 100 feet.21 A friction loss value of 62 pounds per 100 feet is calculated for a 1¾-inch handline using a“C” value of 15.5. (21) The pressures needed to flow 200 gpm through 1½-inch hose clearly indicate that 1¾-inch hose is a much safer and more efficient conduit for flow rates exceeding 125 gpm. Furthermore, 1½-inchhose at 200 gpm using fog nozzles would be limited to lengths of 300 feet to avoid dangerous dischargepressures, increased potential for burst lengths of hose, and very stiff hoselines that would be difficult to bendaround the numerous corners and narrow hallways found in single-family and multiple-family dwellings.
FIREGROUND FLOW RATESNFPA 1710 recommends that the first two attack lines operating at a residential structure fire, once all first-alarm resources are on scene, should flow a minimum of 300 gpm. Several of the NFPA 1410 standardresidential structure fire attack evolutions provide that the first two operating handlines at a residentialstructure be two 150-gpm handlines is logical, given response and reflex times, potential for flashover, nozzlereaction, and simultaneous fire attack and primary search demands placed on the first-arriving enginecompany. When applied to the residential structure referenced in NFPA 1710, a minimum single handlineflow rate of 150 gpm coincides with the NFA Fire Flow Formula, the NFPA 1710 300-gpm first-alarm flowrate, and the heat produced at a residential structure fire of low risk using a field estimate of a HRR/ft2 valueof 0.07 MW/ft2.
Over the past several years, there has been a great deal of discussion on verifying the actual flows fromvarious nozzles used for interior residential fire attack operations. Many of these discussions have highlightedthe need for firefighters to test their nozzles to determine what their actual flows are.
Lt. Jay Comella of the Oakland (CA) Fire Department discussed how flow rates and operating pressures wereexamined after a fireground line-of-duty death. An initial attack handline flow rate of 150 to 185 gpm wassuggested following a Board of Inquiry investigation identifying the causal factors that led to a City ofOakland firefighter fatality. (4) In another article, the authors suggested an initial attack flow rate of 180 gpmfor a single handline based on modern heat-release rates and to provide a safe margin of error in case ofkinks, elevation changes, and other typical fireground situations.22
KINK TESTSIn tests conducted at the Rockland County (NY) Fire Training Center, a series of common fireground kinkswere imposed in the middle of a 150-foot stretch of 1¾-inch fire hose. Nozzles tested included a 15⁄16-inchsmooth bore (180 gpm at 50 psi), a 150-gpm variable fog nozzle (50 psi), and an automatic 150-gpm fognozzle (100 psi). The 15⁄16-inch smooth bore nozzle, at an initial flow rate of 180 gpm, maintained a higheraverage flow with kinks imposed (150 gpm) than the other two 150-gpm nozzles that started at 50 psi (133gpm) and 100 psi (111 gpm). The double 180° kink flows were excluded from comparison for this report,since the authors’ experience has been that this kink condition is most often encountered when a hosebed isnot cleared prior to charging and is not that common and is not used for fire attack operations.23
In August and September 2008, members of Sacramento (CA) Metropolitan Fire Department’s CommandTraining Center Hands-On Training Team flow-tested all of the department’s handlines and nozzles, as wellas a 15⁄16-inch smooth bore nozzle and a 50-psi, 150-gpm single-gallonage fog nozzle. The tests were toprovide Metro Fire members with accurate flow data for all interior attack lines using department standard

fog and smooth bore nozzles. All nozzles were operated and flow-tested at the manufacturers’ designedpressure of 50 psi (smooth bore) or 75 psi (fog). As reported in previous studies, actual flows from fognozzles were found to be less than the stated flow. Conversely, from all smooth bore nozzles, flows eithermet or exceeded the flow rate for the specific tip diameter at 50 psi. Although 1½.-, 1¾-, and 2½-inchhandlines were tested, only the results of the tests for the 1¾-inch handlines are discussed in this article.
Another component of the Metro Fire tests included imposing the same kinks as was done in the RocklandCounty research. Wooden templates were constructed to ensure that the exact same angles were imposed oneach repetitive test. In the Metro Fire tests, hose lengths of 200 feet were used, since most attack linessubjected to this extent of kinking in this department’s experience exceed 150 feet. (Metro Fire uses a single150-foot preconnected attack line; all other handline beds are dead/static loads of 400 feet or greater.) Thefirst 50 feet and the last 50 feet of hose were kept kink free; kinks were imposed on the middle two hosesections. The results of the Metro Fire flow tests closely paralleled those of the Rockland County tests.
Table 3 provides the average flows with kinks imposed (excluding the double 180° kinks) from the MetroFire tests. Note that all standard Metro Fire fog nozzles use an integral smooth bore tip should an enginecompany officer elect to use a smooth bore nozzle for fire attack operations. The standard Metro Fire fognozzle used on 1¾-inch handlines is an adjustable-gallonage fog nozzle rated to flow 30 to 200 gpm at 75 psi,tested at the 150-gpm setting with an integral 7⁄8-inch tip rated to flow 160 gpm at 50 psi. The other nozzlestested were a 15⁄16-inch smooth bore nozzle and a single-gallonage fog nozzle rated to flow 150 gpm at 50psi, with an integral 15⁄16-inch tip rated to flow 185 gpm at 50 psi.
One of the more significant findings was the ability of the solid streams, at similar initial flows and at lowernozzle pressures (50 psi), to maintain a higher average flow when kinks were imposed. Very similar resultswere produced in the Rockland tests. One interesting finding for fog nozzles is that as the design nozzlepressure increased from 50 to 75 to 100 psi for the 150-gpm fog nozzles, the average flow with kinksdecreased from 135 gpm (50 psi fog) for Metro and 133 gpm for Rockland (50 psi fog) to 118 gpm for Metro(75 psi fog) and 111 gpm-Rockland (100 psi fog), respectively. This indicates that as the required nozzlepressure increases, the ability to maintain a flow near 150 gpm decreases when kinks are imposed on thehoseline—in other words, as the required operating pressure for a fog nozzle increases, it is more susceptibleto flow reduction by kinks.
The flow that a nozzle team fights fire with must account for typical initial attack line problems such askinks, car tires, unsecured doors, narrow hallways, and so on. This is even more true of engine companiesoperating with only three personnel, where two personnel are stretching and operating the handline with noadditional assistance in the first few critical minutes of an initial attack. For purposes of identifying targetflow, the authors call this average flow that takes into account reductions from standard kinks the “fireground
flow.” Such kinks and flow-restricting conditions may not be identified and removed until other crews arrivewell after the first line is operating within a structure (for instance a confirmed rescue/trapped occupant).
From Table 3, we see that the minimum initial target flow capable of providing an average minimum“fireground flow” of 150 gpm is 185 gpm. However, when the authors experimented with a measured nozzleinlet pressure of 75 psi with the 50 psi, 150-gpm fog nozzle, they measured a flow rate of 185 gpm. Thecalculated nozzle reaction was 81 pounds. Given that the goal of initial attack handlines is to select a nozzlereaction of less than 70 pounds so that the nozzle can be managed effectively and safely by one person, thisnozzle pressure and flow will be excluded.
FLOW-RATE EFFICIENCYTable 4 presents flow rates and calculated nozzle reactions the authors determined during recent flow tests.During initial attack operations, most engine companies in the United States are likely to select 1¾-inchhandlines as the first two lines. (1)Since NFPA 1710 recommends a total flow of 300 gpm from the first twohandlines, a handline with an initial minimum flow rate of 180 gpm, without kinks or flow restrictions, willbe needed to ensure, with a good degree of certainty, that each nozzle is delivering on average 150 gpm overthe course of the fire attack.
Considering that an initial minimum flow rate of 180 gpm is needed if two like lines are to be used to ensurea total fireground flow rate of at least 300 gpm, the nozzle reaction associated with this flow rate must beassessed to determine the safest and most efficient way for a two-person nozzle team to meet this standard forsafety and effective fire attack operations.
In Table 4, the minimum nozzle reaction associated with a given nozzle capable of producing a flow (withkinks averaged in) from two similar lines meeting the 300-gpm NFPA 1710 recommendation is 69 pounds. Inthese tests, fireground flow rates produced by nozzles with nozzle reactions less than 69 pounds did not meetthe NFPA 1710 recommendation. Conversely, although larger lines with flow rates approaching 300 gpmcould be used, such as a 2½-inch handline, the associated nozzle reaction would exceed the recognized safesingle-firefighter maximum nozzle reaction of 69 pounds. (13, 132).
A nozzle’s flow rate efficiency can be determined by comparing the nozzle’s flow rate against nozzlereaction. Table 4 reveals that when comparing flow rate against nozzle reaction, the minimum initial flowrate capable of meeting the NFPA 1710 recommendation from two like lines must have an efficiency greaterthan or equal to 2.61 gpm per pound of nozzle reaction. Of the nozzles evaluated, only two nozzles hadreactions less than 69 pounds (single firefighter maximum) with fireground flow rates that meet the NFPA1710 recommendation: the two 15⁄16-inch smooth-bore nozzles with nozzle inlet pressures of 50 psi. All
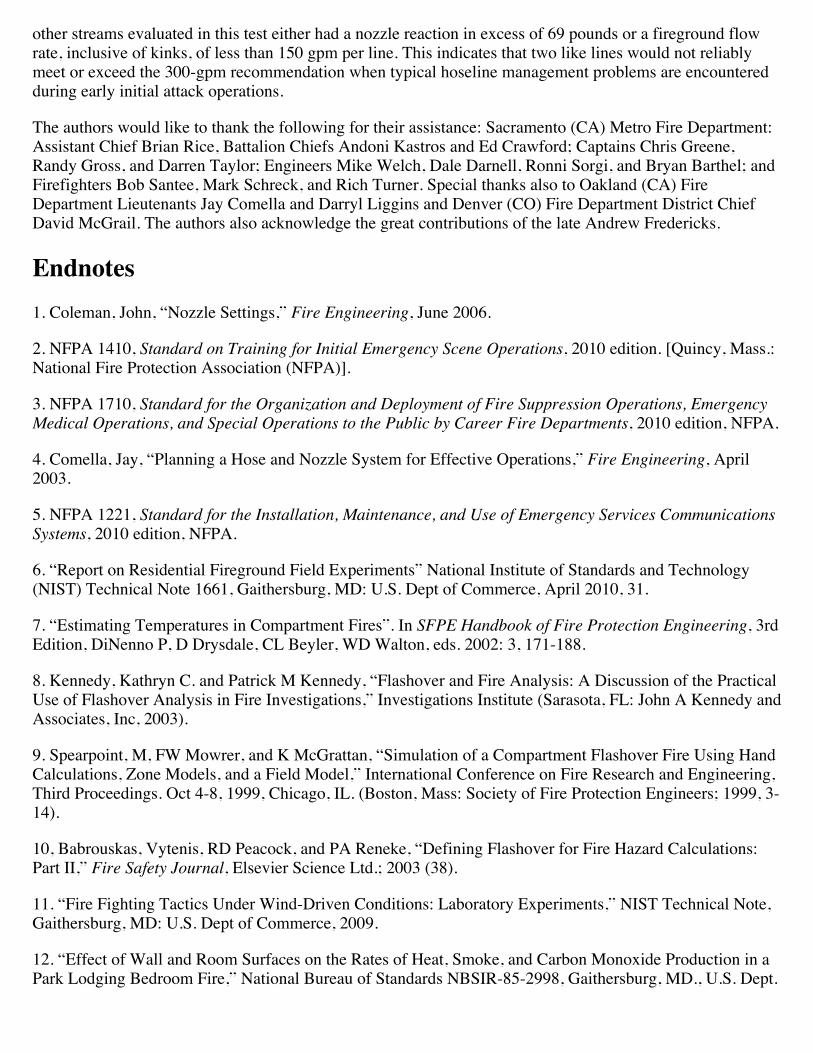
other streams evaluated in this test either had a nozzle reaction in excess of 69 pounds or a fireground flowrate, inclusive of kinks, of less than 150 gpm per line. This indicates that two like lines would not reliablymeet or exceed the 300-gpm recommendation when typical hoseline management problems are encounteredduring early initial attack operations.
The authors would like to thank the following for their assistance: Sacramento (CA) Metro Fire Department:Assistant Chief Brian Rice, Battalion Chiefs Andoni Kastros and Ed Crawford; Captains Chris Greene,Randy Gross, and Darren Taylor; Engineers Mike Welch, Dale Darnell, Ronni Sorgi, and Bryan Barthel; andFirefighters Bob Santee, Mark Schreck, and Rich Turner. Special thanks also to Oakland (CA) FireDepartment Lieutenants Jay Comella and Darryl Liggins and Denver (CO) Fire Department District ChiefDavid McGrail. The authors also acknowledge the great contributions of the late Andrew Fredericks.
Endnotes1. Coleman, John, “Nozzle Settings,” Fire Engineering, June 2006.
2. NFPA 1410, Standard on Training for Initial Emergency Scene Operations, 2010 edition. [Quincy, Mass.:National Fire Protection Association (NFPA)].
3. NFPA 1710, Standard for the Organization and Deployment of Fire Suppression Operations, EmergencyMedical Operations, and Special Operations to the Public by Career Fire Departments, 2010 edition, NFPA.
4. Comella, Jay, “Planning a Hose and Nozzle System for Effective Operations,” Fire Engineering, April2003.
5. NFPA 1221, Standard for the Installation, Maintenance, and Use of Emergency Services CommunicationsSystems, 2010 edition, NFPA.
6. “Report on Residential Fireground Field Experiments” National Institute of Standards and Technology(NIST) Technical Note 1661, Gaithersburg, MD: U.S. Dept of Commerce, April 2010, 31.
7. “Estimating Temperatures in Compartment Fires”. In SFPE Handbook of Fire Protection Engineering, 3rdEdition, DiNenno P, D Drysdale, CL Beyler, WD Walton, eds. 2002: 3, 171-188.
8. Kennedy, Kathryn C. and Patrick M Kennedy, “Flashover and Fire Analysis: A Discussion of the PracticalUse of Flashover Analysis in Fire Investigations,” Investigations Institute (Sarasota, FL: John A Kennedy andAssociates, Inc, 2003).
9. Spearpoint, M, FW Mowrer, and K McGrattan, “Simulation of a Compartment Flashover Fire Using HandCalculations, Zone Models, and a Field Model,” International Conference on Fire Research and Engineering,Third Proceedings. Oct 4-8, 1999, Chicago, IL. (Boston, Mass: Society of Fire Protection Engineers; 1999, 3-14).
10, Babrouskas, Vytenis, RD Peacock, and PA Reneke, “Defining Flashover for Fire Hazard Calculations:Part II,” Fire Safety Journal, Elsevier Science Ltd.; 2003 (38).
11. “Fire Fighting Tactics Under Wind-Driven Conditions: Laboratory Experiments,” NIST Technical Note,Gaithersburg, MD: U.S. Dept of Commerce, 2009.
12. “Effect of Wall and Room Surfaces on the Rates of Heat, Smoke, and Carbon Monoxide Production in aPark Lodging Bedroom Fire,” National Bureau of Standards NBSIR-85-2998, Gaithersburg, MD., U.S. Dept.
of Commerce, 1985, 13.
13. Fredericks, Andrew A, “Little Drops of Water: 50 Years Later, Part II,” Fire Engineering, March 2000,12.
14. Dunn, Vincent. Strategy of Firefighting. [Tulsa, OK: Pennwell Corporation, 2007, 40].
15. Grimwood, Paul and C Barnett, “Fire-Fighting Flow Rate,” www.firetactics.com, Jan 2005, 38.
16. “Cook County Administration Building Fire, Heat Release Rate Experiments and FDS Simulations.”NIST Special Publication SP-1021, Gaithersburg, MD: U.S. Dept of Commerce, 2004, 75.
17. Clark, William E. Firefighting Principles and Practices, 2nd Edition. (Saddle Brook, NJ: FireEngineering Books and Videos, 1991, 34).
18. “Structural Stability of Engineered Lumber in Fire Conditions,” Online Course.” UnderwritersLaboratories. U.S. Department of Homeland Security; 2008. Available Online:htttp://www.ul.com/global/eng/pages/offerings/industries/buildingmaterials/fire/structural/.
19. Burns, Edward and BW Phelps, “Redefining Needed Fire Flow for Structure Firefighting,” FireEngineering, Nov 1994, 22.
20. Brunacini, Alan, telephone conversation, Jan 9, 2009.
21. ”Pumping Apparatus Operations,” IFSTA, 186..
22. Flatley, Christopher, J Knapp, and T Pillsworth, “Testing Your Target Flow,” Fire Engineering, Oct2006.
23. Leihbacher, Doug, C Flatley, J Knapp, and T Pillsworth, “How Kinks Affect Your Fire Attack System,”Fire Engineering, Oct 2007.
JASON N. VESTAL has 14 years of experience as a career firefighter. He is a captain with the SacramentoMetropolitan (CA) Fire Department, where he has worked since 2000. He has an A.S. in fire science fromAllan Hancock and a B.S. degree in environmental and resource sciences with an emphasis in hydrobiologyfrom the University of California at Davis.
ERIC A. BRIDGE has been a career firefighter for 17 years and is a battalion chief with the SacramentoMetropolitan (CA) Fire Department, where he has worked since 1994. He has an A.S. in fire science and aB.S. in occupational studies from California State University-Long Beach.
More Fire Engineering Issue ArticlesFire Engineering Archives
To access this Article, go to: http://www.fireengineering.com/content/fe/en/articles/print/volume-163/issue-10/features/a-quantitative-approach-to-selecting-nozzle-flow-rate-and-stream-part-1.html