a quantitative comparison of chrysanthine theory and...
TRANSCRIPT

A Quantitative Comparison of Chrysanthine
Theory and Performance Practice of Scale
Tuning, Steps, and Prominence of the Octoechos
in Byzantine Chant ∗
Maria Panteli1, Hendrik Purwins2,3
1Department of Computer Science University of Cyprus1 University Avenue, 2109 Aglantzia, Cyprus
2Neurotechnology Group, Berlin Institute of TechnologyMarchstr. 23, 10587 Berlin, Germany
3Sound & Music Computing Group Aalborg University CopenhagenA.C. Meyers Vænge 15, DK-2450 Copenhagen SV, Denmark
Abstract
Byzantine Chant performance practice is computationally comparedto the Chrysanthine theory of the eight Byzantine Tones (octoechos). In-tonation, steps, and prominence of scale degrees are quantified, based onpitch class profiles. The novel procedure introduced here comprises thefollowing analysis steps: 1) The pitch trajectory is extracted and post pro-cessed with music-specific filters. 2) Pitch class histograms are calculatedby kernel smoothing. 3) Histogram peaks are detected. 4) Phrase endinganalysis aids the finding of the tonic to align pitch histograms. 5) Thetheoretical scale degrees are mapped to the empirical ones. 6) A schemaof statistical tests detects significant deviations of theoretical scale tuningand steps from the estimated ones in performance practice. 7) The rankedhistogram peak amplitudes are compared to the theoretic prominence ofparticular scale degrees. The analysis of 94 Byzantine Chants performedby 4 singers shows a tendency of the singers to level theoretic particu-larities of the echos that stand out of the general norm in the octoechos:theoretically extremely large steps are diminished in performance. Theempirical intonation of the IV. scale degree as the frame of the first tetra-chord is more consistent with the theory than the VI. and the VII. scaledegree. In practice, smaller scale degree steps (67-133 cents) appear to beincreased and the highest scale step of 333 cents appears to be decreasedcompared to theory. In practice, the first four scale degrees in decreasingorder of prominence I, III, II, IV are more prominent than the V., VI.,and the VII..
Keywords: Byzantine Chant, modes, Byzantine Tones, Chrysanthinetheory, Octoechos, pitch class profile, echos, computational ethnomusicol-
∗Preprint of: Maria Panteli and Hendrik Purwins: A Quantitative Comparison of Chrysan-thine Theory and Performance Practice of Scale Tuning, Steps, and Prominence of the Oc-toechos in Byzantine Chant, Journal of New Music Research, 42 (3), 2013, pp. 205-221.
1

ogy, kernel smoothing, non-parametric density estimation, peak picking,tonic detection
1 Introduction
Byzantine Chant is the Christian liturgical song of the Eastern Roman Empire(Byzantium) that gradually emerged from the Roman Empire from the 4th cen-tury on. Since then up to now, Byzantine Chant has been the dominant liturgyof the Eastern orthodox Christianity. Since the earliest surviving manuscriptswith notation of Byzantine Chant dating to the 9th century, and the earliesttheoretic accounts of Byzantine Chant dating to the 10th century, several no-tation systems and theories have been introduced, including the Chrysanthinenotation and theory, still used in the official chant books of several Christianorthodox churches practicing Byzantine Chant (Levy & Troelsgard, 2011). How-ever, Levy and Troelsgard (2011) refer to medieval treaties on Byzantine Chant:‘most of them were intended for those already proficient in the performance ofchant, and they are often imprecise with regard to basic questions of rhythm,ornamentation, the exact tuning of scales’. Referring to various theoretic ac-counts on Byzantine Chant, Zannos in (Zannos, 1990) argues that ‘none of themcan be said to correspond with contemporary empirical study’. In this paper, itwill be investigated to what extent performance practice is in accordance withChrysanthine theory.
Music theory and performance practice can be compared using Music In-formation Retrieval (MIR), a relatively young multidisciplinary research fieldat the cross section of musicology, music psychology, signal processing, andstatistics. With these methods, large collections of recorded music can be anal-ysed. The field of computational ethnomusicology (Tzanetakis, Kapur, SchlossAndrew, & Wright, 2007) comprises the computational analysis of ethnic ortraditional music styles. This approach is particularly useful for the study ofpredominantly orally transmitted music traditions such as Byzantine Chant,since manual transcriptions might be subjective or erroneous if created by peo-ple with different criteria and musical backgrounds (Toiviainen & Eerola, 2006),in particular with respect to subtle nuances in intonation or temperament. Inaddition, manual analysis of scores and recordings is a time consuming task,thus restricting studies on relatively small and statistically insignificant musiccollections.
The present research studies a theoretical model of Byzantine music withdeveloped MIR techniques. Precisely, a theoretical model of Byzantine Chant,namely the Chrysanthine theory, is computationally compared to empirical dataextracted from Byzantine recordings. The main analysis tool used is a pitch classprofile (Tzanetakis, Ermolinskyi, & Cook, 2002) with fine pitch resolution, ex-tracted from audio recordings with the aid of specifically designed algorithms.These are applied on a large music collection of Byzantine Chant . The overallbehavior and consistency of empirical scale tuning, of the steps between con-secutive scale degrees, and of the prominence of scale degrees is contrasted totheory through a series of tests and experiments.
This paper is organized as follows. First the Byzantine Tones, the Chrysan-thine theory, and the used music corpus are introduced. Then the compu-tational analysis procedure is explained, consisting of pitch detection, pitch
2

histogram smoothing, scale degree alignment, and statistical tests. Results ontheory-practice comparison are given with respect to the tuning, scale steps,and prominence of scale degrees. The paper concludes with a discussion of theanalysis.
2 The Octoechos and the Chrysanthine Theory
According to Winnington-Ingrams Mode in Ancient Greek Music (Winnington-Ingram, 1936) a ‘mode is essentially a question of the internal relationships ofnotes within a scale, especially of the predominance of one of them over theothers as a tonic, its predominance being established in any or all of a numberof ways: e.g., frequent recurrence, its appearance in a prominent position as thefirst note or the last, the delaying of its expected occurrence by some kind ofembellishment’.
The tone (singular: echos, plural echoi) in Byzantine Chant is based on theconcept of the mode. According to Mavroeidis (1999) and Thoukididi (2003),an echos is defined by the following five characteristics: 1) the scale degree stepsbetween consecutive scale degrees, 2) the most prominent scale degrees (two orthree scale degrees out of which I - III and I - IV are the most reoccurring scaledegree pairs), 3) a short introductory phrase that marks the reference tone, 4)the cadences in the middle and at the end of a phrase, and 5) the modulations(alterations) applied to particular scale notes depending on whether they arereached by an ascending or a descending melody.
In Byzantine Chant, the number of echoi and the tuning of their scale de-gree steps have been discussed during the long history of Byzantine Chant no-tation and theory that developed through the following three stages: 1) thePalaeo-Byzantine method (10th − 12th century), 2) the middle Byzantine no-tation (mid-12th− about 1815), and 3) the new (Chrysanthine) notation (fromthe 1820s) (Levy & Troelsgard, 2011). The latter is attributed to the threeteachers Chrysanthos of Madytos, Chourmouzios the Archivist and Gregoriosthe Protopsaltes. Subject to a reform in the 1880s concerning the tuning ofthe scale degrees in particular, the Chrysanthine notation method is used inthe official chant books of the Greek Orthodox Church up to now (Levy &Troelsgard, 2011). In the 20th century, Karas (1970) suggested an alternativeByzantine notation by re-introducing some old (palaeographic) qualitative signs,reconstructing the interval structure and revising the classification of the modes.However, his theory is controversial among scholars and performers of ByzantineChant (Angelopoulos, 1986). In this paper, we use the Chrysanthine theory asa reference.
In Chrysanthine theory, the octave is divided into 72 equal partitions, eachof 16.67 cents1 (morio, plural: moria). The scale degree steps are measuredin multiples of a morio. Scale degree steps can be of the size of a semitone(100 cents = 6 moria) and a whole tone (200 cents = 12 moria). But also stepsizes between the halftone and the whole tone are frequently used: the minortone (166.67 cents = 10 moria) and the minimal tone (133.33 cents = 8 moria)(Thoukididi, 2003).
1According to Mavroeidis (1999) the morio of Chrysanthine theory is 17 cents as the12th part of a Pythagorean whole tone of 204 cents. However, we assume 72-tone equaltemperament resulting in a morio of 16.67 cents.
3

The Chrysanthine theory defines in total eight basic echoi, a system alsoreferred to as octoechos (‘eight’ + ‘mode’). These eight modes occur in pairs ofauthentic and corresponding plagal modes2: First Authentic, Second Authentic,Third Authentic, Fourth Authentic, First Plagal, Second Plagal, Grave, FourthPlagal. The First Authentic/Plagal and Third Authentic/Grave echoi pairs eachshare the same sequence of scale steps (cf. Table 1). The plagal mode has adifferent reference tone (tonic) than its authentic counterpart, usually a perfectfifth lower than the one of the authentic mode3. Furthermore, both differ inmelodic characteristics.
The seven scale degree steps of an echos are constructed in the followingway. The octave is divided into a fourth, whole tone, and another fourth. Thefirst fourth (first tetrachord) is further subdivided by 2 tones yielding three scalesteps. The subdivision proportions are identically repeated for the second fourth(second tetrachord). To give an example, the tetrachord of the First echos isdefined by the scale step sequence minor - minimal - whole tone (10 − 8 − 12moria) which is repeated after the whole tone step (12 moria) that lies in themiddle of the scale (cf. Table 1). Only the Fourth echos deviates from thistetrachord structure.
The scale degree steps may vary according to the chant genre: Heirmoi(singular: Heirmos) are chants in a relatively fast tempo with each note corre-sponding to one syllable. Stichera (singular: Sticheron) are in medium tempowith more than one note corresponding to the same syllable (melisma). Pa-padika (singular: Papadikon) are sung in a slow tempo with a phrase of notescorresponding to one syllable (Mavroeidis, 1999; Thoukididi, 2003).
To give an example, some of the echoi such as the Grave consist of differentscale degree steps depending on whether the chant type is Heirmos/Sticheronor Papadikon. Similarly, the Fourth authentic, consists of different scale degreesteps for chants of Heirmos type and chants of Sticheron/Papadikon type.
Our study is limited to the basic and simplest echos scales4 (cf. Table 1). Wewill not consider the fact that scale degree steps of an echos can be modulated(altered) based on the melodic characteristics of a chant or other criteria (cf.Mavroeidis (1999), Thoukididi (2003)).
3 Music Corpus
In the long history of Byzantine music, choirs and various musical instrumentshave been used in the liturgical ceremonies (Braun, 1980). However, musical in-struments are forbidden in Orthodox ecclesiastic music to this day (Thoukididi,2003). The singing voice, as the main instrument is used solo or in choirs. Thecorpus of music analysed in this study consists of recorded monophonic chants
2The notion of the authentic and plagal modes in Byzantine music should not be confusedwith the notion of church modes in Roman theory.
3The Grave shares the same scale degree steps with the Third Authentic as well as thesame reference tone.
4For the Grave echos the scale of Heirmos/Sticheron chant type is considered, and for theFourth authentic the scale of Heirmos chant type, since these are the most basic and commonlyused scales for the corresponding echoi (Mavroeidis, 1999). Chants of the Heirmoi genre ofthe Second, Heirmoi of Second Plagal, Papadika of Grave, Stichera and Papadika of Fourth,and Papadika of Fourth Plagal use different scales than the eight basic echoi. Thus they areomitted in this study.
4
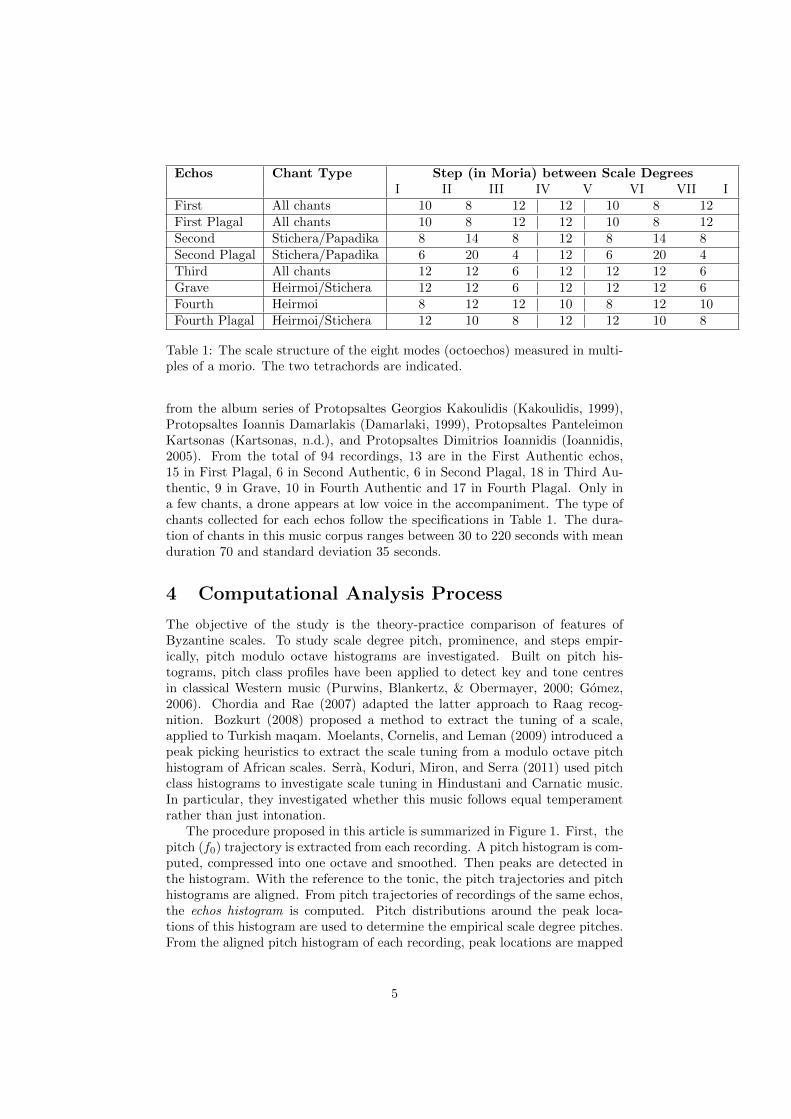
Echos Chant Type Step (in Moria) between Scale DegreesI II III IV V VI VII I
First All chants 10 8 12 | 12 | 10 8 12First Plagal All chants 10 8 12 | 12 | 10 8 12Second Stichera/Papadika 8 14 8 | 12 | 8 14 8Second Plagal Stichera/Papadika 6 20 4 | 12 | 6 20 4Third All chants 12 12 6 | 12 | 12 12 6Grave Heirmoi/Stichera 12 12 6 | 12 | 12 12 6Fourth Heirmoi 8 12 12 | 10 | 8 12 10Fourth Plagal Heirmoi/Stichera 12 10 8 | 12 | 12 10 8
Table 1: The scale structure of the eight modes (octoechos) measured in multi-ples of a morio. The two tetrachords are indicated.
from the album series of Protopsaltes Georgios Kakoulidis (Kakoulidis, 1999),Protopsaltes Ioannis Damarlakis (Damarlaki, 1999), Protopsaltes PanteleimonKartsonas (Kartsonas, n.d.), and Protopsaltes Dimitrios Ioannidis (Ioannidis,2005). From the total of 94 recordings, 13 are in the First Authentic echos,15 in First Plagal, 6 in Second Authentic, 6 in Second Plagal, 18 in Third Au-thentic, 9 in Grave, 10 in Fourth Authentic and 17 in Fourth Plagal. Only ina few chants, a drone appears at low voice in the accompaniment. The type ofchants collected for each echos follow the specifications in Table 1. The dura-tion of chants in this music corpus ranges between 30 to 220 seconds with meanduration 70 and standard deviation 35 seconds.
4 Computational Analysis Process
The objective of the study is the theory-practice comparison of features ofByzantine scales. To study scale degree pitch, prominence, and steps empir-ically, pitch modulo octave histograms are investigated. Built on pitch his-tograms, pitch class profiles have been applied to detect key and tone centresin classical Western music (Purwins, Blankertz, & Obermayer, 2000; Gomez,2006). Chordia and Rae (2007) adapted the latter approach to Raag recog-nition. Bozkurt (2008) proposed a method to extract the tuning of a scale,applied to Turkish maqam. Moelants, Cornelis, and Leman (2009) introduced apeak picking heuristics to extract the scale tuning from a modulo octave pitchhistogram of African scales. Serra, Koduri, Miron, and Serra (2011) used pitchclass histograms to investigate scale tuning in Hindustani and Carnatic music.In particular, they investigated whether this music follows equal temperamentrather than just intonation.
The procedure proposed in this article is summarized in Figure 1. First, thepitch (f0) trajectory is extracted from each recording. A pitch histogram is com-puted, compressed into one octave and smoothed. Then peaks are detected inthe histogram. With the reference to the tonic, the pitch trajectories and pitchhistograms are aligned. From pitch trajectories of recordings of the same echos,the echos histogram is computed. Pitch distributions around the peak loca-tions of this histogram are used to determine the empirical scale degree pitches.From the aligned pitch histogram of each recording, peak locations are mapped
5

to theoretical scale degree pitches. The interval sizes between consecutive peaklocations are employed to determine the usage of scale steps between consec-utive scale degrees. Finally, a sequence of statistical tests is used to comparethe estimated empirical scale tuning and scale step sizes with the theoreticalones. The ranked peak amplitudes are compared with theoretic prominence ofparticular scale degrees.
4.1 Pitch Trajectory via F0 Detection
Algorithmic pitch estimation is usually done assuming a close relationship of theperceived pitch and the fundamental frequency (f0) of the signal. In the currentstudy, we use the f0 estimation Yin algorithm (de Cheveigne & Kawahara,2002). The algorithm is based on the autocorrelation method (Rabiner, 1977)with a number of modifications that improve its performance. The error rateof the Yin frequency estimates depends on the acoustic characteristics of thesignal. Considering the melodic characteristics of the analysed music as well asthe particularities of the singing voice, the following post processing filters aredesigned:
1. Noise: An aperiodicity threshold θn is applied to eliminate erroneous fre-quency estimates at the noisy parts of the recording. Assuming min maxnormalization of the aperiodicity variable in the range [0, 1], the aperiod-icity threshold is set to θn = 0.8.
2. Silent Gaps: A loudness threshold θs is applied to remove frequenciescorresponding to silent and/or quiet parts. Assuming min max normaliza-tion of the instantaneous power variable in the range [0, 1], the loudnessthreshold is set to θs = 0.05.
3. Octave/fifth errors: To avoid false estimates due to confusion withother harmonics of the fundamental frequency (octave/fifth errors), anoctave/fifth correction algorithm is designed. Based on some initial as-sumptions, the algorithm recalculates an instantaneous frequency valuewhenever an interval greater than a fifth is found between consecutivetime-ordered pitches.
As a result, a trajectory of estimated pitches p = (p1, . . . , pN )(1 ≤ n ≤ N)is generated for each recording, where n denotes indexes through time-orderedpitches.
4.1.1 Behavioral F0 Trajectory Evaluation Experiment
The efficiency of the f0 trajectory extraction algorithm as well as the tonic de-tection Algorithm 2 was evaluated with a behavioral experiment. We decidedto perform the evaluation with few expert singers of Byzantine Chant ratherthan with a large number of non-experts, since, in general, the subtleties of de-tecting the tonic in Byzantine Chant make the tonic-detection task too difficultfor non-experts. As subjects, we chose three accomplished singers of ByzantineChant. For the stimuli, 20 chant endings were selected, stemming from all 8main echos types and all singers of the music corpus. The experiment consistedof two parts: the first one for evaluating the estimated pitch trajectory, andthe second one for evaluating the estimated tonic (cf. Section 4.4.2). For pitch
6

F0 Detection
Histogram Computation
Audio Recording
Peak Extraction
Practice-Theory Aligned SD
Peak Matching
Tonic Detection
Pitch Trajectory
Pitch Histogram
Histogram Peaks
Practice-Theory Comparison
Histogram AlignmentPitch Trajectory Alignment
Echos Histogram Computation
For recordings of the same echos
Pitch Distribution Matching
Analysis / Statistical Testing
SD StepsSD Freq. SD Ampl. Rank
Figure 1: Flow diagram of the analysis process of a recording yielding a theory-practice comparison of the scale tuning, the scale step sizes, and the scale toneprominence (SD=Scale Degree).
7

Figure 2: Yin f0 estimations before and after post processing.
trajectory evaluation, the subjects were asked to first listen to an excerpt of aByzantine chant and then listen to a synthesized version of the estimated pitchtrajectory. Choosing from a scale of 1 to 5, where 1 corresponds to “no matchat all” and 5 corresponds to “perfect match”, the subjects were asked to evalu-ate how well the melody of the original matches the melody of the synthesizedversion. The three experts evaluated the estimated pitches for 20 Byzantineexcerpts with an average value of 4.2/5. One melody was evaluated, on av-erage, below 3.5, and this corresponds to a recording with a relatively noisybackground. In general, our f0 detection algorithm works sufficiently well.
4.2 Pitch Histogram via Kernel Smoothing
Pitch histograms are used as an analytic tool for scale estimation (Akkoc, 2002;Bozkurt, 2008; Moelants et al., 2009; Chordia & Rae, 2007). Ideally, the his-togram distribution peaks at the most frequently appearing notes of the melody.By definition, a pitch histogram c = cp,b = (cp,b1 , . . . , cp,bk ) partitions the data pinto K distinct bins of width h and then counts the number of p observationsfalling in each bin. This can be expressed as
cp,bk =
N∑n=1
qr(pn − bk
h) (1)
where bk is the centre of the bin k for k = 1, . . . ,K, and qr(u) the rectangularkernel function defined as
qr(u) =
{1 if |u| ≤ 1
20 otherwise.
8

Figure 3: Histogram with no smoothing (rectangular kernel qr, h = 6 cents,top), with relatively small smoothing factor (Gaussian kernel, , h = 12 cents,middle), with relatively large smoothing factor (Gaussian kernel, h = 18 cents,bottom). The circled peaks of the middle graph differ by less than 4 moria (67cents) and are merged in the bottom graph thus avoiding an - according totheory - false scale-tone peak.
The choice of h is critical for the subsequent stage of peak picking, since atoo high h can eliminate relevant peaks whereas a too small h can create spu-rious peaks in the pitch histogram. Used in Turkish music theory, the Holdriancomma provides a K = 53 equal temperament division of the octave. Basedon that division, Bozkurt (2008) yields h = 1200
53·3 . For Byzantine Chant, theChrysanthine theory divides the octave into 72 equal partitions and we mul-tiply this division by 3 arriving at h = 1200
72·3 , thereby yielding sufficient binresolution and robustness. We consider the equally spaced modulo octave pitchclass histogram defined by
cp,bk =
N∑n=1
qr(u) (2)
where
u =(bk − (pn − p0) mod 1200) + p0
h(3)
and p0 is the pitch offset.Although a large h increases the smoothness of the pitch histogram, discon-
tinuities in the histogram remain. These discontinuities are artefacts due tothe partitioning of the pitches in a discrete set of predefined bins. A smooth-ing of the histogram has the effect of simplifying its shape and making it lessdependent on the variance of the data from which it is generated.
9

Figure 4: Peak detection applied to the three-histogram copies, where the mid-dle part avoids the peak discontinuities at the edges of the original (single)histogram.
The sharp-edged rectangular kernel function qr(u) in Equation (2) can bereplaced by a smooth Gaussian kernel function (Bishop, 2006) yielding thehistogram
cp,bk =
N∑n=1
1√2πh
e−(pn−bk)2
2h2 (4)
for k = 1, . . . ,K.In the smoothed histogram, the Gaussian kernel replaces each single pitch
point by a smooth Gaussian and then adds up all Gaussians across all pitchpoints. As with the rectangular kernel, the bandwidth h determines the smooth-ness of the histogram. Again there is a trade-off between noise sensitivity atsmall h and over-smoothing at large h values. Tests with data-driven determina-tion of h (Sheather & Jones, 1991) gave overly smoothed curves eliminating toomany peaks. The selection of the appropriate smoothing parameter h has to beguided by the task the histogram is used for. Whereas e.g. for characterizing asinger’s ornamentation, a small h, i.e. a detailed histogram may be appropriate,for estimation of scale degree tuning, as one of the objectives of this study, arelatively high smoothing factor is employed to avoid spurious peaks in a toodetailed histogram. To determine an adequate h, the following assumptionis made: Byzantine theory recognizing 4 moria (67 cents) as the smallest scaledegree step and choosing the quartertone (δmin = 50 cents) as the smallestacceptable distance between two histogram peak positions allows for a marginfor investigating the deviations between theory and practice. Experimentingwith h and looking at the resulting histograms (cf. Figure 3), the assumptionis satisfied when h is set to 18 cents.
10

Figure 5: The histogram peaks (λ, π) can be interpreted as the pitches (peaklocations λ) and the prominences (peak heights π) of the scale degrees.
4.3 Histogram Peak Extraction
Adjusting the smoothing factor of the histogram is an important step in ourapproach. The smoothed histogram distribution is expected to peak at exactlyseven maxima (the seven scale notes of the melody), thus, eliminating spuriouspeaks. Peaks that lie closer than the theoretical boundary predicts, are merged(with appropriate amount of smoothing) to a single peak with centre frequencyadjusted according to the properties of the histogram distribution. Alterna-tively, the centre frequencies of the seven scale notes could be estimated viathe k-means method applied to the non-smoothed histogram distribution. The7-means method was tested but failed to identify correctly the seven scale notesdue to the significant deemphasis of the scale degrees VI and VII (cf. Figure 9).
To overcome the smoothing artifacts at both borders of the histogram, wecopy the histogram three times, pasting it next to each other, yielding thethree-histogram (cf. Figure 4). From the three-histogram copies, the middle onehas accurately smoothed edges due to the continuation beyond the histogramborders, and therefore is the only one considered for further processing.
Using a peak extraction algorithm, from the smoothed pitch class histogram,c, U peaks (λ, π) can be detected consisting of peak locations λ = (λ1, . . . , λU )and peak heights π = (π1, . . . , πU ) (cf. Figure 5). Moelants et al. (2009) pro-posed a couple of heuristics to be used in peak picking, such as the considerationof size and height of peaks and intervals between peaks. Here Algorithm 1 is pro-posed. The number U of peaks to be detected and the minimum peak distanceδmin have to be determined beforehand.
From the histogram c= (c1, . . . , cK), the peak picking algorithm (cf. Algo-rithm 1) iteratively chooses the peak location λu = bku with maximum peak
11

height πu = cku , then removing the potential location candidates in a ±δminneighborhood around the selected peak position, to chose the next peak untilU peaks are picked. U is determined as follows: According to Byzantine theoryeach echos has at least 7 scale notes. In addition, Byzantine theory knows ofnote alterations. To account for further intonation variants in practice, we setU = 12. δmin = 50 cents is chosen as the minimum neighborhood.
Algorithm 1 Peak picking algorithm.
VariablesMinimum peak distance δminNumber of peaks UPitch class histogram c1, . . . , ckBins b = (b1, . . . , bK)InitializationΓ1 = (1, 2, . . . ,K)For u = 1 to Uku = argmaxk∈ΓuckΓu+1 = Γu \ {ν : |ν − bku | < δmin}λu = bk, πu = ckEnd For
4.4 Practice-Theory Aligned Scale Degrees
4.4.1 Tonic Detection
It would be advantageous to compare pitch histograms in a way that is invariantto pitch transpositions. Scale degrees could then be compared to their positionrelative to the tonic rather than to their absolute pitch (Purwins, Blankertz,Dornhege, & Obermayer, 2004). This way, two instances of the same echoscould be compared, even if their tonics are different. To make the first bin b1correspond to the tonic, the histogram has to be circularly (modulo K) shiftedby −p0, with p0 being the bin of the tonic. Gedik, Ali C and Bozkurt (2008)applied kernel smoothing to each of the makam scale prototypes. Then theycalculated the cross correlation between all scale prototypes and all circularlyshifted versions of a histogram. The pitch shift −p0 that gives the maximumcross-correlation corresponds to the estimated tonic and is used to circularlyshift the latter histogram. Exploiting the scale structure of the octoechos fortonic detection would be likely to improve the tonic estimate. However, in ourapproach we will not use this information at this point, because we want tominimize the used musical knowledge and the resulting bias in the subsequenttesting.
In order to compare empirical profiles with the theoretical tonic and scaledegrees, we aim at increasing the reliability of detecting tonic p0 by incorporat-ing more musical knowledge into the tonic (p0) detection algorithm, followingan idea in (Bozkurt, 2008). According to theory, the tonic of a Byzantine echosis stated at the end of the phrase in most of the cases. Although there areexceptions to this general rule in the majority of the chants this rule appliesand we will build our analysis on this assumption. We present a novel tonicdetection algorithm that computes the pitch of the last phrase note from theonset and frequency information. A couple of heuristics are implemented to
12

increase the noise robustness of the method. The algorithm makes the followingassumptions:
1. The last note in the recording is the last note of the melodic phrase.
2. The final phrase note lasts for at least half a second.
Assumption 1 is fulfilled if the complete song is recorded. Presegmentationhowever is employed to standardise the number of similar musical phrases inthe excerpts. Assumption 2 is generally met in religious singing in ByzantineChant.
Onsets in the estimated pitch p = (p1, . . . , pN ) are detected based on theonset detection function
dn =1
r
n+ 32 r−1∑
m=n+ r2
pm −n− r2∑
m=n− 32 r+1
pm
, (3
2r ≤ n ≤ N − 3
2r + 1), (5)
which takes the difference dn of sums of an even number of r instantaneouspitches left and right from pitch pn.
To give a short explanatory example, apply Equation 5 to r = 10 and n = 15and
pm =
{10 for m < 1520 otherwise
. (6)
Then dn = 110 (∑29m=20 pm −
∑10m=1 pm) = 10.
Applying Algorithm 1 for extracting U = 100 peaks gives onset candidatelocations o′′ = {o′′1 , . . . , o′′U} from which the ones with an onset detection functiondq above pitch threshold θf · max(o′′) are considered: o′ = {oq ∈ o′′ : dq >θf · max(o′′)}. Analogously, onsets o∗ are detected based on the log energy,computed from the output of YIN algorithm, and energy threshold θe, insteadof pitches p. Onsets due to pitch as well as energy are united to o = o′ ∪ o∗.From these, the ones at least a minimal inter onset interval ∆min apart fromtheir predecessor are extracted: o = {oq ∈ o : oq − oq−1 > ∆min}. In the sequel,the following parameter settings are used: r = 32, θf = 0.1, energy thresholdθe = 0.005 and ∆min = 0.1s.
The accuracy of detecting the tonic from the musical phrase ending is limitedby the characteristics of the analysed music and particularly the frequent useof vibrato on the last note. For example, in extreme cases vibrato ranges upto ±2 semitones and false onsets due to pitch variation are detected on frameswith instantaneous frequency that differs more than a semitone from the actualpitch of the last note (cf. Algorithm 2). Additionally, onsets due to energyvariation fail to detect the attack of the last note if melismatic ornamentationis employed at the phrase end, e.g. if the singer softly introduces the final notewithout changing the syllable and without a noticeable energy variation.
Empirical tests showed that for our music collection the onset detectionalgorithm usually detects up to three onsets within the last note, as a result ofenergy and pitch variations. The algorithm implemented takes into account thisfact, and compensates pitch inaccuracies with a final alignment of the tonic tothe closest histogram peak (cf. Figure 6).
13

Figure 6: The tonic detected from the last phrase note may deviate from theempirical scale degree pitches (locations of histogram peaks) due to vibrato.With the post processing step of tonic refinement to the closest histogram peakthis inaccuracy is resolved.
Algorithm 2 Tonic refinement algorithm.
PreprocessingDetect the last three onsets oo−2, oo−1, ooPitch trajectory pGet the three index sets Πo−2,Πo−1,Πo of the pitches p corresponding to theprevious inter-onset-intervals.Last Note DetectionIF max0≤i≤j≤2|po−i−po−j | < 100 cents(Small vibrato range or no vibrato)Calculate tonic as average of instantaneous frequencies of frames of three inter-onset-intervals po = 1
|Π|∑n∈Π pn,Π = ∪0≤i≤2Πo−i
ELSEIF the last two frequencies lie within a semitone |po − po−1| < 100 cents(Vibrato range larger than a semitone or first of the three onsets is false)Calculate tonic as average of instantaneous frequencies of frames of last twointer-onset-intervals po = 1
|Π|∑n∈Π pn,Π = ∪0≤i≤1Πo−i
ELSE(Vibrato range larger than a semitone or first two onsets are false)Calculate tonic po as average of instantaneous frequencies of frames of the lasthalf-second of the melodyENDPostprocessingReset tonic estimate to highest/closest peak location in histogram:Get right (λ1, π1) and left (λ2, π2) location/height peak pair closest to poIF |λ1 − λ2| < 100 cents THENp∗ : = argmax1≤i≤2(πi)ELSEp∗ : = argmin1≤i≤2(|po − λi|)ENDpo : = λn∗
14

4.4.2 Behavioral Tonic Detection Evaluation Experiment
The efficiency of the tonic detection algorithm was evaluated with a behavioraltonic-finding experiment jointly with the f0 trajectory evaluation experiment.For further details cf. Section 4.1.1. Programmed in a Matlab interface, thesubject heard a chant ending and then was asked to move the slider “so that thetonic produced represents the tonic of the original song”. The slider controlledthe pitch of a sine tone and was moved until the subject agreed that the sine tonewould represent the tonic of the excerpt. The subjects could repeat listeningto the stimulus and adjusting the tonic pitch as often as they wanted beforemoving on to the next excerpt.
For 18 of the 20 stimuli, the subjects’ responses’ standard deviation wasbelow 42 cents. Only for 2 excerpts, one expert disagreed with the other experts,resulting in a larger standard deviation of 189 and 262 cents among the experts.For two out of the 20 excerpts the computed tonic differed greatly from themean of the subject’s response distribution. One recording of the First Plagalechos and one recording of the Third echos are detected with a wrong tonic.These are exactly two of the few exceptions in which the final note of the chantdoes not end on the tonic. This occurs for instance when the current chantanticipates the following chant in the course of the Byzantine liturgy. However,since these cases are relatively rare, we will see that they do not distort theresults of the analysis to an important extent. Cf. the discussion of these resultsin Section 6.
4.5 Practice-Theory Comparison
4.5.1 Scale Degree Assignment
The objective is to assess the deviation between scale degree tuning of a partic-ular echos according to theory and scale degree tuning in musical practice. Thenormalized theoretical scale degree pitches are defined as a set of scale degreepitches (locations) νθ = (νθ1 , . . . , ν
θL), with normalization νθ0 = 0 (in cents) and
L = 7.5 For all recordings 1 ≤ m ≤Mi of echos i, the pitch histogram ci = cp,b
is built from the pitches p of these recordings and bins
b = (0,1200
216,
2 · 1200
216, . . . ,
215 · 1200
216). (7)
From histogram ci, peaks (λ, π) with pitches λ = (λ1, . . . , λU ) and amplitudesπ = (π1, . . . , πU ) are selected via Algorithm 1 (peak picking). From (λ, π), theempirical scale degree pitches are estimated. Then only those peaks (λu, πu)are selected that correspond to a theoretic scale note in νθ. For each theoreticalscale degree pitch νθl , the closest pitch λu is chosen. If this way, one pitch λu isassociated with several theoretical scale degree pitches νθl , pitch λu is assignedonly to the closest theoretical scale degree pitch νθl . Then the pitches λu areselected that lie within a ∆A = 150 cents distance from their assigned theoreticalscale degree pitch µθl . If two or more pitches λu fulfill this condition, the peakwith highest associated amplitude πu is selected: Formally, the estimated scaledegree pitches ν = (λt1 , . . . , λtL′ ) are defined by tl = arg max|λt−νθl |≤∆A
(πt).
5Exceptions with L = 8 theoretical scale degree pitches exist in some variations of echoinot included here.
15

If no pitch λu lies within the range ∆A around the theoretical pitch νθl , tl isnot defined and the estimated scale ν = (ν1, . . . , νL′) has less degrees than thetheoretical scale νθ, i.e. 1 ≤ L′ < L.
From the estimated empirical scale degrees ν and for all recordings of thesame echos, consider Nl pitches
pl = (pl,1, . . . , pl,Nl) (8)
that lie within a 2-moria distance of the estimated scale degree pitch νl of scaledegree l, selected from the instantaneous pitch trajectory p = (p1, . . . , pNi),consisting of Ni pitches of all recordings of a particular echos i. The 2-moriadistance defines half the size of the smallest theoretical scale interval (cf. Ta-ble 1). This is done to apply statistical testing to check whether pitches pl
are drawn from a distribution with mean equal to the theoretical scale degreepitches νθl (see details below).
Now let us explain how to calculate the scale steps δ = (δ1, . . . , δL) betweenconsecutive scale degrees of one echos. Instead of calculating the histograms forall the recordings of one echos all together as done in the previous paragraphs,we now calculate the histograms individually for each recording 1 ≤ m ≤Mi ofechos i: cm,i = cp
m,i,b (Equation 3) where pm,i is the instantaneous pitch tra-jectory of recording m of echos i and b are the 216 bins per octave (Equation 7).From histogram cm,i, peaks (λ, π) with pitches λ and amplitudes π are selectedvia Algorithm 1 (peak picking). From the peaks (λ, π) the estimated scaledegree pitches ν = (ν1, . . . , νL′) are calculated. From the estimated scale stepsν, the scale steps δ = (δ1, . . . , δL) can be calculated as the difference betweenthe lth and the l − 1th estimated scale degree pitches δl = νl − ν(l−2)modL+1
.
The scale steps are the intervals between consecutive scale degrees. From thepeak amplitudes πm,il associated with the empirical scale degree pitches νm,il ,we define the average scale degree amplitude by
πl =1∑I
i=1Mi
I∑i=1
Mi∑m=1
πml (9)
where Mi are the number of recordings of echos 1 ≤ i ≤ I. This conceptof average scale degree amplitudes indicates prominences of scale degrees andis similar to Krumhansl’s probe tone ratings, constant Q profiles or harmonicpitch class profiles but it generalizes to other than 12-equal temperament tunings(Purwins et al., 2000).
4.5.2 Statistical Testing
To assess the deviation between theoretic and empirical scale degree pitches andsteps, we apply a chain of tests as an analytical instrument. As a first step, theShapiro-Wilk test is applied, to determine whether the pitches pl are normallydistributed around the estimated scale degree pitches νl across all Mi instancesof the same echos i. If the p value is above significance level α = 0.05, weassume normal distribution and apply the t-test to pl. In case the Shapiro-Wilk rejects the normality hypothesis, the Wilcoxon signed-rank test is appliedinstead. The hypothesis to be tested by the Wilcoxon signed-rank test is thefollowing. For echos i, the l-th estimated scale degree pitches pl are derived
16

from a distribution with median equal to the l-th theoretical scale interval νθl .We perform n = 48 (6 scale degree pitches6 times 8 echos types) tests. Inmultiple testing, there is an increased chance to falsely reject a hypothesis. Inorder to counterbalance this effect, we apply the Bonferroni correction (Dunn,1961). To reject a hypothesis with a significance level of α = 0.05, we determinethe Bonferroni corrected threshold for the p values of the individual n = 48tests as: αB = α
n = 0.0548 ≈ 0.001. If p < αB , we reject the null hypothesis and
conclude that the theoretical scale degree pitch νθ,il deviates significantly fromthe empirical scale degree pitch νil for echos i.
In order to determine if some empirical scale degree pitches deviate fromtheory more than others, we calculate the differences between theoretical scaledegree pitch and the Nm instantaneous scale degree pitch pm,il,n ,
∆m,il,n = νθ,il − p
m,il,n (10)
for recordings m = 1, . . . ,Mi of echos i, and scale degree l = 1, . . . , L. For eachscale degree l of echos i, we calculate the mean scale degree difference definedby
∆il =
1∑Mi
m=1Nm(
Mi∑m=1
Nm∑n=1
∆m,il,n ) (11)
. To assess practice-theory deviation of scale degree pitches across all echoi, themean absolute scale degree difference
∆l =1
I
I∑i=1
|∆il| (12)
is computed from the mean deviations for each scale degree l,(1 ≤ l ≤ L′), andacross all echoi i, (1 ≤ i ≤ I).
Another objective of this study is to assess the deviation between theoreticscale steps and scale steps in practice. For each of the theoretical scale stepsδθ = (δθ1 , . . . , δ
θQ) = (67, 100, 133, 167, 200, 233, 333) (in cents) corresponding to
the Q = 7 steps of 4, 6, 8, 10, 12, 14, and 20 moria we aim at estimating theempirical scale steps δπ = (δπ1 , . . . , δ
πQ). We define the set of all scale steps
N = {δ : ∃l ∈ {1, . . . , L},m ∈ {1, . . . ,M} so that δ = δml }, (13)
for scale degree l = 1, . . . , L and recordings m = 1, . . . ,M . Then we collectthe scale steps δml that are within a ±1 moria (16.67 cents) neighborhood Nqaround the q-th theoretical scale step δθq , i.e.,
Nq = {δ : ∃l ∈ {1, . . . , L},m ∈ {1, . . . ,M} so that δ = δml and |δ − δθq | ≤ 16.67}. (14)
Note that for scale degree q = Q of 333 cents, we define a neighborhood of ±4moria around the theoretical value to account for the relatively large distancebetween this and the previous theoretical interval at 233 cents.
6The scale degree pitches are normalized with respect to scale degree I, therefore only 6scale degree pitches remain.
17

The empirical scale steps δπ can be approximated by the estimated empiricalsteps δ = (δ1, . . . , δQ), defined by the empirical means
δq =1
|Nq|∑δ∈Nq
δ (15)
for q = 1, . . . , Q. To assess the significance of theory-practice deviations in thesizes of the scale steps, first the Shapiro-Wilk test on normality is performed. Ifthe hypothesis of normality is rejected, the Wilcoxon signed-rank test is applied.Otherwise, the t-test is employed. For the Wilcoxon signed-rank test, the nullhypotheses to be tested are that the δ in the set Nq around the theoreticalscale steps δθq is drawn from a distribution with median δθq . Since we perform 7tests for Q = 7 scale steps, a significance level of of α = 0.05 corresponds to acorrected Bonferroni threshold of αB = α
7 ≈ 0.007 (cf. Table 3).We also construct the scale step histogram using the notation for the set N
all scale degree steps (Equation 13):
d = cN ,b (16)
with an octave division of 216 bins according to Equation 7. This histogram isthen smoothed with a moving average filter of 3 bins length (cf. Figure 7).
The prominence of empirical scale degree pitches is analysed via two ap-proaches. First, to investigate whether some scale degrees are particularly em-phasized in Byzantine Chant, which ones are these and to what degree thishappens, the average scale degree amplitude π = (π1, . . . , πL) averaged acrossall recordings of all echoi is considered. Also, the average scale degree ampli-tude of Byzantine echoi are compared to a related music tradition, the Turkishmakams.
Another aim is to assess the deviation between the prominent scale degreesin theory and practice. As defined in theory, the set of the most prominentscale tones is one of the elementary characteristics of the echos. This set usu-ally consists of 2 or 3 scale degrees and it may be differently defined in thesub-categories of chants (Heirmoi etc.) of the same echos (cf. Table 4). Forcomparison, the echos average scale degree amplitude
πil =1
Mi
Mi∑m=1
πml (17)
is calculated for each echos i (cf. Figure 8). The three scale degrees (lt1 , lt2 , lt3)with the highest amplitudes πil are taken as the set of the most prominent scaledegrees of the empirical data (cf. Table 4).
5 Results
In this section, we present our findings referring to three particular aspects ofpitch histograms in Byzantine echoi in performance practice, namely the tuningof scale degrees, the interval sizes between consecutive scale degrees (steps), andthe prominence of scale degrees. The smoothed histograms for all echoi can befound in Figure 9.
18

5.1 Tuning of Scale
The tuning of the Byzantine scales is investigated by comparing the pitches ofempirical and theoretical scale notes. A series of statistical tests is employedto determine for which scale degrees practice and theory of tuning deviate. Forall recordings m of a given echos i, the histogram c across all instantaneouspitches p is calculated. From that, the echo-specific estimated scale degreepitches v are calculated. For each estimated scale degree pitch vl of scale degreel, all instantaneous pitches pl are collected that lie within a ±2 moria rangearound vl. For each scale degree pitch and each echos the Shapiro-Wilk test onnormality is performed on pl. The results show that for all scale degrees andall echoi the normality hypothesis is rejected, given significance level α = 5%.The Wilcoxon Signed-Rank Test (W -test) with significance level α = 0.05%,corresponding to a corrected Bonferroni treshold of αB = 0.001%, is thereforeapplied to test the null hypothesis that the median of the empirical pitches isthe same as the theoretical pitch of a particular scale degree in a particularechos.
Table 2 reveals that the majority of empirical scale degrees of all echoi differsignificantly from theory, except for the scale degrees V of First, VII of FirstPlagal, VI of Second Plagal, and II of Third and Grave. The Second, Fourth andFourth Plagal echoi have all their empirical scale degrees significantly deviatingfrom theory. In the sequel, we will discuss in detail significant theory-practicedeviations of more than 2 moria (cf. Table 2). The VI. scale degree of the Firstand First Plagal has a relatively large mean scale degree difference (Equation 11)value with negative sign, i.e., the empirical scale degree pitch is smaller than thetheoretical one. This could be due to the fact that for these echoi the VI. scaledegree is diminished when the melody is descending, according to theory. Otherlarge negative mean scale degree differences appear for the VII. scale degree ofSecond Authentic as well as the III. and VII. scale degrees of Second Plagal.These scale degrees are reached by relatively large theoretical scale degree steps;the VII scale degree of Second Authentic is reached by the VI-VII scale step of14 moria (233 cents) whereas the III. and VII. scale degrees of Second Plagalare both reached by a scale step of 20 moria (333 cents, cf. Table 1). Theempirical scale degrees are smaller than the theoretical ones, i.e. in practice, thetheoretically largest scale degree steps (14 and 20 moria) tend to be diminished.In practice, in the Fourth echos, the V is significantly diminished comparedto its theoretical scale degree pitch. This could be related to the fact thatthe Fourth is the only echos, in which the first tetrachord is extended by twomoria up to 32 moria in comparison to the other echoi which are based on afirst tetrachord of 30 moria. An interpretation could be that the singer tendsto diminish the abnormally high tetrachord pitch of this echos by diminishingthe adjacent scale degree, i.e., the V. In Fourth, also scale degree step VII-I(theoretically 10 moria) tends to be diminished towards the more common stepVII-I of 8 moria.
For scale degree pitches, the question is addressed, how much practice devi-ates from theory across all echoi. For all chants of all echoi, the mean absolutescale degree differences (Equation 12) are calculated between empirical and the-oretical scale degree pitches. It is investigated, whether the absolute scale degreedifference is less for some empirical scale degrees in comparison to other scaledegrees. For scale degrees II-VII the mean absolute scale degree differences
19

Echos Feature Scale DegreesII III IV V VI VII
First (13) p (W -test) 0 0 0 0.0032 0 0Mean SD Difference −16.65 11.25 10.45 0.84 −43.89 5.79
First Plagal (15) p (W -test) 0 0 0.0001 0 0 0.8767Mean SD Difference 28.06 −5.65 −0.91 4.98 −50.06 −0.06
Second (7) p (W -test) 0 0 0 0 0 0Mean SD Difference 5.79 −5.56 −6.55 10.36 20.95 −49.64
Second Plagal (7) p (W -test) 0 0 0 0 0.1592 0Mean SD Difference 11.20 −44.32 5.06 10.79 0.47 −138.47
Third (18) p (W -test) 0.0048 0 0 0 0 –Mean SD Difference 0.45 −21.70 −11.19 −5.48 −11.16 –
Grave (8) p (W -test) 0.0233 0 0 0 0 –Mean SD Difference −0.44 −27.81 −11.05 −17.42 −10.53 –
Fourth (11) p (W -test) 0 0 0 0 0 0Mean SD Difference 5.27 5.58 −5.21 −39.14 11.13 38.85
Fourth Plagal (16) p (W -test) 0 0 0 0 0 0Mean SD Difference 22.06 11.17 16.63 17.86 17.00 22.25
Table 2: Significance of the mean scale degree difference between practice andtheory for all echoi (number of instances in brakets). Since all echoi are alignedto pitch 0 for scale degree I, only II-VII are shown. For scale degrees II-VII thep-value of the test statistic of the Wilcoxon Signed-Rank test (W-test) and themean scale degree difference (in cents, Equation 11) between practice and theoryare indicated. Zero p-values correspond to values smaller than 10−5. Practice-theory differences (cf. Table 1) greater/smaller than ±2 moria (33 cents) arecolored and discussed in the text. For the VII. scale degree of the Third and theGrave echoi, no peaks were detected in the corresponding echos histogram (cf.Figure 9), hence no further analysis was considered (indicated with ‘-’ symbol).
20

Figure 7: Scale step size histogram computed with 216 bin resolution andsmoothed using a moving average with a filter length of 3 bins .
are ∆ = (11.2, 16.6, 8.4, 13.4, 20.7, 42.5). The practice-theory deviation for scaledegree IV is significantly less than for the VI. and the VII. scale degree. Thestability of the fourth can be related to the role of the fourth as the frame of thefirst tetrachord building block of the scale. From Figure 9 one can infer thatthe pitch content of the echoi is mostly concentrated in the first 4 scale degreesthat lie within the first tetrachord range.
5.2 Scale Steps
The theoretical scale steps are compared to the estimated empirical steps. Thequestions addressed are: 1) Which intervals are most frequently used in Byzan-tine music? 2) Which ones deviate significantly between theory and practice?
In Figure 7, the smoothed scale step histogram d = cN ,b is shown, based onthe scale degree steps between all L consecutive scale degrees in all I echoi andthe bins b = (0, . . . , 71
216 ). A moving average filter of 3 bins length is used forsmoothing. The histogram displays the frequencies of occurrence of these scalesteps in practice. The most frequently used scale steps in Byzantine music arethe whole tone (with theoretical size of 200 cents) and the minimal tone (133cents), followed by the minor tone (167 cents) and the semitone (100 cents).The 14-moria (233 cents) theoretical scale step occurs also with significant fre-quency whereas the smallest and largest theoretical scale steps (67 and 333 centsrespectively) are not used so often.
To assess the significance of theory-practice deviations in the sizes of thescale steps, we calculate the set of empirical scale steps Nq (Equation 14)around the Q = 7 theoretical scale step δθq = (4, 6, 8, 10, 12, 14, 20). First theShapiro-Wilk test is performed in order to determine whether δ ∈ Nq is normally
21

Theoretical scale Steps 4 6 8 10 12 14 20δθq (in moria)
δθq (in cents) 66.7 100 133.3 166.7 200 233.3 333.3
Estimated Empirical Steps 81.4 107.5 136.8 174.6 201.0 231.7 277.1
δq (in cents)Deviation from Theory 14.7 7.5 3.5 7.9 1.0 -1.6 -56.2
δq − δθq (in cents)
p (Wilcoxon test) 0.0007 0 0.0028 0 0.1024 0.1957 0
Table 3: Scale degree step size analysis. The estimated empirical steps (Equa-tion 15) are compared to the theoretical scale steps. Scale degree step sizessignificantly different from theory are highlighted in boldface. Zero p-valuescorrespond to values smaller than 10−5. It appears that the first four scale de-gree steps differ significantly from theory. The largest absolute theory-practicedifferences can be found for scale degree step sizes of 4 and 20 moria.
distributed for 1 ≤ q ≤ Q. With a significance level of α = 5% the normalityhypothesis is rejected for 6 out of the 7 scale steps and the Wilcoxon signed-rank test is applied to test the null hypothesis that Nq has a mean equal tothe theoretical scale step δθq at the α = 0.05 significance level corresponding toa corrected Bonferroni threshold of αB = 0.007. In Table 3, results show thattheoretic steps of 67 cents, the semitone (100 cents), the minor (133.3 cents),and minimal tone (166.7 cents), and the interval of 333 cents differ significantlyfrom practice. On the other hand, for the whole tone and the interval of 233cents there is no significant difference between empirical and theoretical steps.The smallest and largest scale steps (67 and 333 cents respectively) display thelargest difference between theory and practice. For the majority of the steps,the estimated empirical steps δq are larger than the theoretical steps δθq . Thetwo largest theoretical intervals (233 and 333 cents respectively), are diminishedin practice.
5.3 Prominence of Scale Degrees
The prominence of scale degrees for all Byzantine recordings is studied via theaverage scale degree amplitudes πl and compared to the average scale degreeamplitudes of Turkish makams in Figure 8. Results reveal that the most promi-nent scale degrees in Byzantine Chant are the I, III, II, IV in descending orderwith I (the tonic) having the highest amplitude. From Table 4, we can see thatin the shown echoi / chant genres according to theory, the most prominent scaledegrees are I, III, IV, II in descending order starting from I. Only the order ofII and IV is exchanged when comparing theory to practice. Melodic concen-tration on mainly the first four scale degrees is further supported by the shortpitch range of Byzantine melodies and the importance of the tetrachordal entityas a pitch frame in scale and melody construction. For comparison, makamsfrom religious Turkish music of the artists Kani Karaca and Bekir Sıdkı Sezginhave been chosen. The Turkish makams have been processed the same wayas the Byzantine Chants as indicated in Figure 1. In Figure 8 (bottom) theaverage scale degree amplitudes πl for 69 Turkish makams are shown. In con-trast to the Byzantine Chant, for the Turkish makams, a strong emphasis of the
22

Figure 8: Average scale degree amplitude πl (in frames) in Byzantine echoi(top) and scale degree histograms of religious Turkish makams (bottom). Thedecreasing emphasis with a relatively strong III in Byzantine scale degrees iscontrasted with a strong V in Turkish makams.
I and to a lesser extent of the V and a deemphasis of the III, II, and IV canbe observed. The high prominence of I and V in Turkish makams appears asthe most important distinguishing feature between Byzantine and Turkish scaledegree prominence.
The prominence of scale degrees for each echos individually is studied viaa comparison of the set of theoretically most prominent scale degrees with thethree highest average scale degree amplitudes in practice as shown in Table 8.In 14 of 21 echoi/chant genres, the empirical scale degree prominences are con-sistent with the theoretical ones. Theoretical and empirical scale degree promi-nence coincide for First Heirmoi, Third, and Fourth Heirmoi. Whereas theII is a theoretically prominent scale degree only for the Grave, the II appearsamong the three highest average scale degree amplitudes for six echoi (for FirstAuthentic only for the genre Stichera). The three highest average scale degreeamplitudes appear in the three adjacent scale degrees I-III except of the FirstAuthentic of Heirmoi type, the Second Plagal, and the Fourth Plagal echos. Inthe Second Plagal echos, the three empirically most prominent scale degrees donot contain the I. scale degree, in contrast to Chrysanthine theory. The V. scaledegree, never listed among the most prominent scale degrees in Chrysanthinetheory, appears as the second most prominent scale degree for the Second Pla-gal and the Fourth Plagal. For the majority of echoi, the empirical set of mostprominent scale degrees consists of the scale degrees I, II, III, with I usuallybeing the most prominent scale degree.
23

Echos Chant Genre Theory/ Theoretically Most Prominent Scale Degrees/Practice Highest Average Scale Degree Amplitudes
First Heirmoi Theory I IVPractice I III IV
Stichera Theory I IIIPractice I II III
First Plagal Heirmoi Theory I IIIPractice I II III
Stichera Theory I IVPractice I II III
Second Stichera/Papadika Theory I IIIPractice I II III
Second Plagal Stichera/Papadika Theory I IVPractice III IV V
Third All chants Theory I IIIPractice I II III
Grave Heirmoi/Stichera Theory I II IVPractice I II III
Fourth Heirmoi Theory I IIIPractice I II III
Fourth Plagal Heirmoi/Stichera Theory I IIIPractice I III V
Count Prominence Theory 10 1 6 4 0Practice 9 7 10 2 2
Table 4: Scale tone prominence in theory and practice. Chrysanthine theoryprovides two or three most prominent scale degrees respectively. Highlightedcells correspond to the three most prominent scale degrees in practice as sug-gested by the echos average scale degree amplitudes πil (Equation 17). Thedarkest colour represents the most prominent amplitude and the lightest colourthe third largest amplitude. In the two bottom rows, for theory and practice,prominences are counted across all echoi/ chant genres. In practice, scale de-grees II and V are more prominent than in Chrysanthine theory.
24

6 Discussion
We would like to review the processing steps and discuss how the statisticalresults could have been biased.
The extraction of the pitch (f0) trajectory has been introduced in Section 4.1.Its evaluation in Section 4.1.1 indicated that for one recording of the Graveechos the estimated pitch trajectory is relatively distorted. It appears that thisdistortion is due to the presence of drone tones in the pauses of the singingvoice, when the singing voice does not dominate the relatively low voice dronetone. As a result, the I. could be overemphasized in the echos average scaledegree amplitude (Equation 17). However, this artifact is not likely to affectthe empirical scale degree pitches ν a lot. Previously filtering out the dronepitch could reduce noise in the f0 detection of the melody.
In Section 4.4.2, Algorithm 2 for tonic detection is evaluated. As an evalu-ation result the tonic was detected incorrectly in two out of 20 of the excerpts.These are exactly two of the few exceptions in which the final note of the chantdoes not end on the tonic. This occurs for instance when the ending of onechant harmonically prepares the start of the following chant in the course ofthe Byzantine liturgy. Given the small sample size in the tonic detection ex-periment, we cannnot state the exact percentage of echoi with this non-tonicalending notes with high confidence. However a percentage of 10% would be areasonable estimate. This introduces noise in the plots of the echoi in Figure 9and a bias in the statistical results in Table 2 and 3. This bias is limited bythe fact that the Wilcoxon signed-rank test tests for the median. Therefore,distorted pitches would bias the outcome much less than in the case of a test(e.g. t-test) that considers the mean. In future work, the tonic detection algo-rithm could be improved to handle these cases. The cross-correlation methodas applied in (Gedik, Ali C & Bozkurt, 2008) could be used for this objective,at the cost of introducing another bias in estimating the theory-practice devia-tions by using music theory information more excessively when processing thedata from performance practice. This bias could be reduced by only correlatingthe down-transpositions of the theoretical scale degree pitches in Table 1 by aminor third, fourth, and fifth. When employing the cross-correlation methodusing the theoretical scale degree pitches (Table 1 ), one would have to decidehow to account for the different amplitudes across the scale degrees. The scaledegree amplitudes could be estimated empirically. But when using the empiri-cal data to determine the theoretical scale degree amplitudes, this, again, wouldintroduce a bias to the subsequent tests.
In Section 4.2, a slight shifting of the reference pitch during the performancecould happen. As a consequence, the peaks of the pitch histogram c wouldbe smeared out. This effect is likely to be small in the case of professionalsingers. Also the vibrato range contributes to the width of the peaks. Therelatively irregular patterns of vibrato and other micro-intonation in the singingvoice makes it hard to derive sharp pitch histogram peaks in the case of thesinging voice. The bandwidth h for kernel smoothing is selected manually.A change of the smoothing bandwidth h affects the histogram peak locationsλ = (λ1, . . . , λU ) in Section 4.3. However, due to the large sample size of theinstantaneous pitch vector p this bias may be limited. When considering theinstantaneous pitches pl (Equation 8) around scale degree l in Section 4.5.1,the tails of the distribution for each scale degree are cut off. Also there is
25

a dependency between adjacent scale degrees and between the empirical peakpositions and the nearest theoretical scale degree pitch to which they have beenmapped. However, an informal inspection reveals that the empirical peaks arerelatively close to the theoretical peaks, which indicates that this bias is limited.Since the empirical scale degree pitches ν = (ν1, . . . , νL) are normalized withrespect to scale degree I, the estimation error for scale degree pitches in themiddle (IV and V) in between two octaves of scale degree I are larger than forthe scale degree steps close to I, such as II and VII. This effect appears to belimited since in Table 2 there are much larger deviations for scale degrees VI,VII and III than for scale degrees IV and V.
However, the impact of the bias of the preprocessing on the statistical resultsis limited. This paper presents a novel statistical framework for the quantitativeanalysis of scale degrees that leaves some refinement of the statistical analysisfor future work.
7 Conclusion
In this paper, a new method has been introduced to empirically study partic-ular aspects of pitch usage in performance practice, namely tuning, steps, andprominence of scale degrees. The method has been applied to the analysis ofByzantine Chants. In particular, a methodology has been introduced to test towhat degree performance practice of Byzantine Chant follows the widely knownChrysanthine theory. The theoretic hypotheses have been tested on a corpus ofrecordings of chants of the octoechos. An approach combining pitch estimationwith appropriate post filtering, kernel smoothing, and statistical tests has beenapplied to the recordings. Among the novel methods proposed here are thehistogram computation and smoothing and the tonic detection algorithm. Theformer comprises the use of Gaussian kernels in histogram computation andsuitable tuning of the smoothing factor. The latter includes a robust method oftonic detection from the last phrase note. In addition, a statistical frameworkhas been introduced to study scale degrees.
In general, the analysis shows that performance practice follows Chrysan-thine theory. However, the analysis results also indicate subtleties in perfor-mance practice of Byzantine Chant: The singer shows the tendency to diminishthe largest step sizes (14, 20 moria: II-III, VI-VII in Second Authentic/Plagal)among all scale steps within the octoechos. The theoretical scale degree IV inthe Fourth Authentic is exceptionally higher than in all other echoi. In thisechos, the singer diminishes the theoretical V in practice. In Fourth, also scaledegree step VII-I (theoretically 10 moria) tends to be diminished towards themore common step VII-I of 8 moria. This gives support to the conjecture thatthe singer levels the extreme step and scale degrees particularities within the oc-toechos. The IV., the frame of the first tetrachord is the scale degree with leasttheory-practice deviation. The scale degree tuning within the first tetrachorddeviates less from theory than the scale degrees outside the first tetrachord.
The analysis of the scale steps reveals that the most frequently used scalesteps are the whole tone and the minimal tone, followed by the minor toneand the semitone. The smallest and largest theoretical steps do not occur asoften. Whereas the smallest scale step (67 cents), the semitone, the minor andthe minimal tone are significantly larger in practice compared to theory, the
26

opposite is true for the largest scale step of 333 cents.Regarding the prominence of the scale degrees, the scale degrees within the
first tetrachord occur more often than the other scale degrees with a decreasingprominence of scale degrees I (maximum), III, II, and IV.
The present study, as a first step towards a computational analysis of pitchpatterns of Byzantine Chant, can be extended in many ways. In particular,the analysis of micro-intonation in the range of a few cents, embellishmentsand cadential clauses, the consideration of rhythmical/metrical context and ofmelodic contour could aid the understanding of pitch usage. Furthermore, be-yond the eight echoi, the echoi genres (Heirmoi, Stichera and Papadika) shouldbe studied. In this study we intended to minimize the employed musical priorkowledge. However for an effective echos recognition application, the tonic de-tection algorithm could be improved in future work by integrating feedback fromtonic detection via the cross-correlation method as applied in (Gedik, Ali C &Bozkurt, 2008).
It has been shown in this article that the presented system serves for empir-ically testing a theoretic model of Byzantine Chant. The empirical findings canthen help to refine the theoretical model and to let it reflect the musical perfor-mance practice. Furthermore, the methodology introduced here has applicationsto a wide range of oral music traditions, in particular to the ones that sharesimilarities with the modal system of Byzantine music, e.g. Greek, Cypriot andTurkish folk music that have been historically influenced by Byzantine music.
8 Acknowledgments
H. P. was supported in part by the German “Bundesministerium fur Bildungund Forschung” (BMBF), Grant BFNT, No. 01GQ0850. We are grateful toDaniel Bartz from Berlin Institute of Technology for helpful discussion andproof reading the manuscript.
References
Akkoc, C. (2002). Non-deterministic scales used in traditional Turkish music.Journal of New Music Research, 31 (4), 285–293(9).
Angelopoulos, L. (1986). The importance of simon karas re-search and teaching regarding the taxonomy and transcrip-tion of the effect of the signs of cheironomy: Oral interpreta-tion of the written interpretation. Retrieved 30/03/2011, fromhttp://www.psaltiki.net/journal/2.1/angelopoulos/angelopoulos karas.html
Bishop, C. M. (2006). Pattern Recognition and Machine Learning. New York:Springer.
Bozkurt, B. (2008, March). An Automatic Pitch Analysis Method for TurkishMaqam Music. Journal of New Music Research, 37 (1), 1–13.
Braun, J. (1980). Musical Instruments in Byzantine Illuminated Manuscripts.Early Music, 8 (3), 312–327.
Chordia, P., & Rae, A. (2007). Raag recognition using pitch-class and pitch-class dyad distributions. In S. Dixon, D. Bainbridge, & R. Typke (Eds.),
27

Proceedings of the international conference on music information retrieval(pp. 431–436).
Damarlaki, I. (1999). Pws tha mathw na psallw praktika [learn how to performthe byzantine chants] [audio cd]. Crete: Polychronakis.
de Cheveigne, A., & Kawahara, H. (2002). YIN, a fundamental frequencyestimator for speech and music. The Journal of the Acoustical Society ofAmerica, 111 (4), 1917. doi: 10.1121/1.1458024
Dunn, O. J. (1961). Multiple comparisons among means. Journal of the Amer-ican Statistical Association, 56 (293), 52–64.
Gedik, Ali C, & Bozkurt, B. (2008). Automatic Classification of Turkish Tradi-tional Art Music Recordings by Arel Theory. In Proceedings of the fourthconference on interdisciplinary musicology (cim08) (Vol. 56). Thessaloniki,Greece.
Gomez, E. (2006). Tonal Description of Music Audio Signals (Vol. 192).Unpublished doctoral dissertation, Universitat Pompeu Fabra. doi:10.1086/508205
Ioannidis, D. (2005). H theoria tis byzantinis mousikis stin praxi [theory ofbyzantine music in practice]. Athens: Ioannidis Dimitrios.
Kakoulidis, G. I. (1999). Pws na vriskoume praktika tous okto ihous tis byzan-tinis mousikis [how to estimate empirically the eight modes of byzantinemusic]. Athens.
Karas, S. (1970). Ta geni kai diastimata eis tin byzantini mousiki [genres andintervals in byzantine music]. Athens.
Kartsonas, P. (n.d.). Praktiki methodos ekmathisis tis psaltikis tehnis [practicemethods for learning byzantine chant] [audio cd]. The Hunt of St. GeorgeMount Athos.
Levy, K., & Troelsgard, C. (2011). Byzantine chant.Oxford Music Online. Retrieved 24/08/2011, fromhttp://www.oxfordmusiconline.com/subscriber/article/grove/music/04494
Mavroeidis, M. (1999). Oi mousikoi tropoi stin anatoliki mesogeio [the musicalmodes in east mediterranean]. Athens: Fagotto.
Moelants, D., Cornelis, O., & Leman, M. (2009). Exploring African Tone Scales.10th International Society for Music Information Retrieval Conference(ISMIR), 489–494.
Purwins, H., Blankertz, B., Dornhege, G., & Obermayer, K. (2004). Scaledegree profiles from audio investigated with machine learning. In Audioengineering society convention 116.
Purwins, H., Blankertz, B., & Obermayer, K. (2000). A new method for track-ing modulations in tonal music in audio data format. In Neural networks,2000. ijcnn 2000, proceedings of the ieee-inns-enns international joint con-ference on (Vol. 6, pp. 270–275).
Rabiner, L. (1977). On the use of autocorrelation analysis for pitch detection.IEEE Transactions on Acoustics, Speech and Signal Processing , 25 (1),24–33.
Serra, J., Koduri, G. K., Miron, M., & Serra, X. (2011). Assessing the tuningof sung indian classical music. In Ismir (pp. 157–162). Retrieved fromhttp://ismir2011.ismir.net/papers/OS2-2.pdf
Sheather, S. J., & Jones, C. (1991). A reliable data-based bandwidth selectionmethod for kernel density estimation. Journal of the Royal Statistical
28

Society Series B Methodological , 53 (3), 683–690.Thoukididi, A. (2003). Kripida byzantinis mousikis [foundations of byzantine
music]. Cyprus: Kykkos Church.Toiviainen, P., & Eerola, T. (2006). Visualization in comparative music research.
In Computational statistics compstat 2006 (pp. 209–219). Springer.Tzanetakis, G., Ermolinskyi, A., & Cook, P. (2002). Pitch Histograms in
Audio and Symbolic Music Information Retrieval. Journal of New MusicResearch, 32 (2), 143–152.
Tzanetakis, G., Kapur, A., Schloss Andrew, W., & Wright, M. (2007). Com-putational Ethnomusicology. Journal of Interdisciplinary Music Studies,1 (2), 1–24.
Winnington-Ingram, R. P. (1936). Mode in Ancient Greek Music. Cambridge[Eng.]: The University press.
Zannos, I. (1990). Intonation in Theory and Practice of Greek and TurkishMusic. Yearbook For Traditional Music, 22 (1990), 42.
9 Appendix: Pitch Histograms and TheoreticalScale Degree Pitches for all Echoi
29

Figure 9: For all recordings of all echoi, the pitch histograms are displayed. Thevertical lines indicate pitches of scale degrees according to Chrysanthine theory(cf. Table 1). The y axis represents the normalized histogram count. The boldred lines represent the echos histogram computed from pitch trajectories acrossall recordings of the same echos.
30