a quantitative model for describing snowunes in the
TRANSCRIPT
8oI.lG-USP, Publ.Esp., 8:75-88,1991.
A QUANTITATIVE MODEL FOR DESCRIBING SNOWUNES IN THE CENTRAL
ANDES MOUNTAINS
ABSTRACT
The modem snowline elevation of the central Andes can be descrlbed numerlcally from
available data in terms of regional varlations in climate anel topography. Multiple regression analysls of
modem climatic anel snowline data for locations in the Andes between 10 0 anel 30 o south latitude produces
an equation which relates snowline elevatlon to rnean annual temperature, precipltaton, anel the elevatlon of
the annual O o C isotherm. The coefficient of correlation (R = 0.83) for this model Is considered to be
significant because most of the rernaining error can be attrlbuted to the varlabillty of the reported snowline
observations which have not yet been evaluated for errors. An Inversion of the mode! should ultlmately
a1low, for the flrst time, a quantltative reconstruction of Andean paleoc1imates from Pleistocene snowline
data. The ultimate goal is to determine the differences between glacial anel modem climates, not only for the
Andes but for other major mountaln beIts of the worlcl.
INTRODUCTlON
The evaluation of present anel past snowline elevations is important for climatic
interpretations because they reflect the net interaction between weather systems and topography.
Geomorphic evidence of former valley and cirque glaciers below the modem snowline in the central Andes
demonstrates that significant climate change has occurred durlng the late Quaternary. The term snowllne
as applied in thispaper refers to the lowest Iimit of perrnanent snow on mountain slopes averaged
, Departament of GeologicaJ Scienees-Snee HalI, ComeU University, Ithaca, New Vorle 14853 USA.
regionallyanel over many years (I.e., cJimatic snowline). Snowllne e1evatlons ànd6ràdient~:.'àtong with the
size and distribution of glaciers, are determined by cJimate (temperature, precipitatlon, anel wlnd direction)
and topography (mountain elevation and morphology). The investigation of the relationship between this
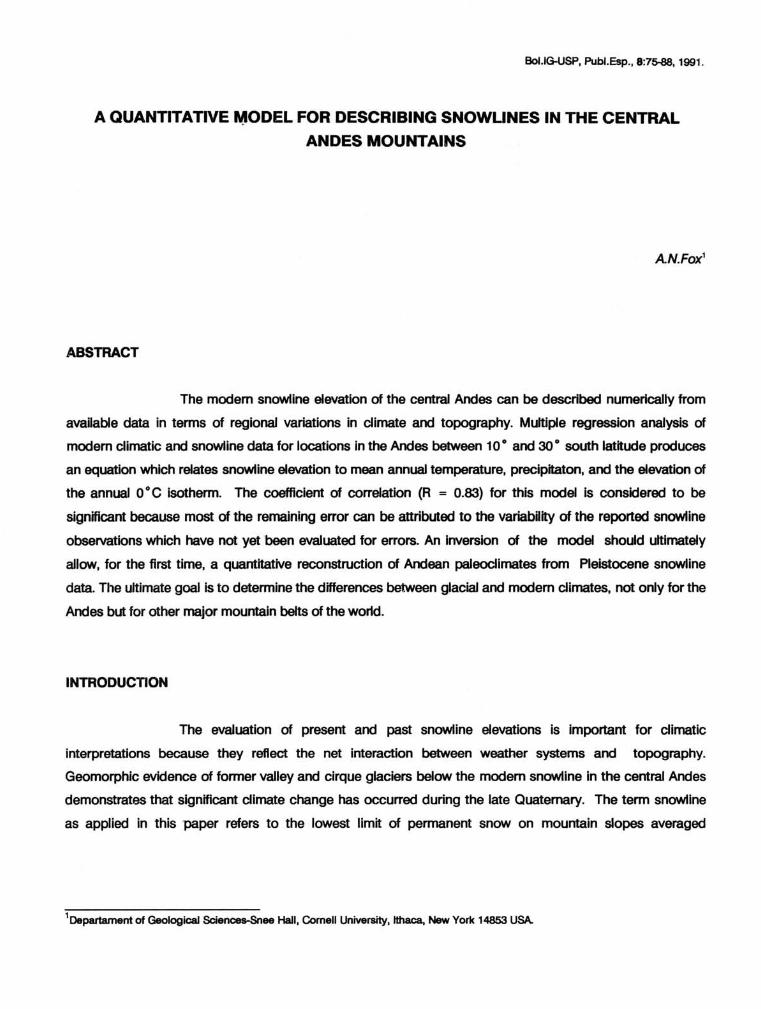
variables is comp/icated between 23 o anel 32 o south latitude in a significant zone of regionally abrupt
changes in ali of the above factors (Fig. 1). This situation provides a unique opportunity to study the
interrelationship of spatially and temporally changing climatic and topographic variables on Iandscape
evolution, anel is the primary reason why this portion of the central Andes was selectecl for investigation.
The observed vertical change in snowline e1evation through time permits inferences about temporal
variations in climate as long as there is a demonstrable relationship between snowline e1evation and climatic
parameters.
THE ANDEAN SNOWUNE MODEL
Data compilation analysis
I have compiled available data on snowline positions and climatic parameters trom
numerous published anel unpublished sources, including values of surface temperature, precipitation and
evaporation. A1though the database contains records for the entire Andes, this study concentrates on the
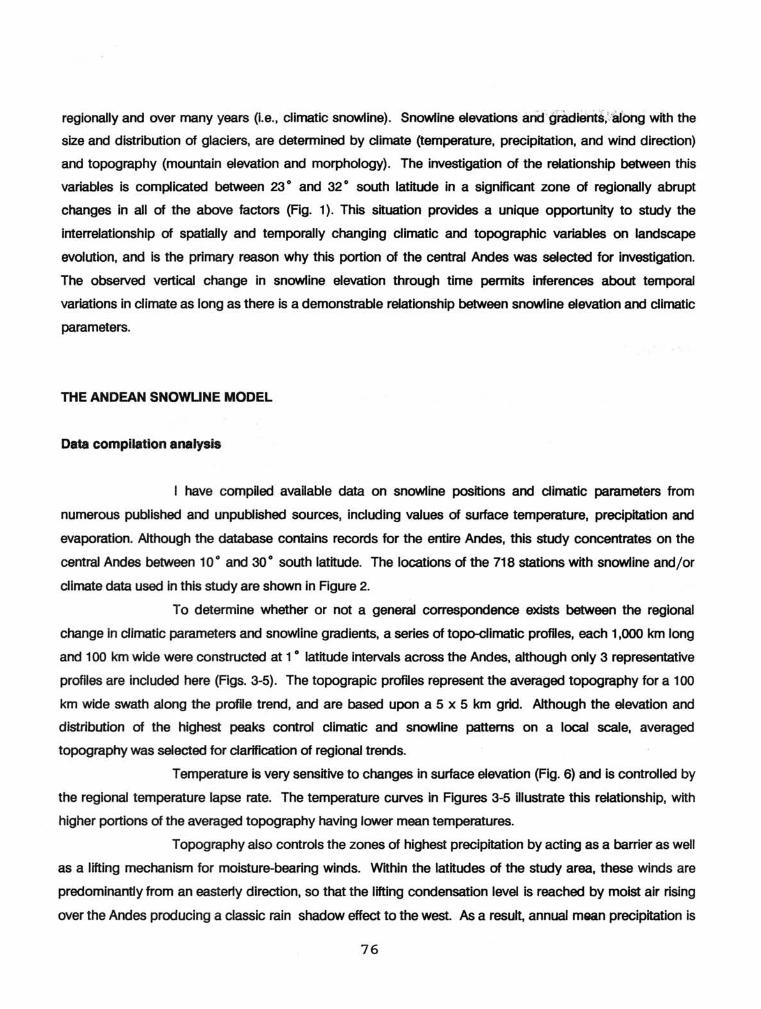
central Andes between 10 0 anel 30 0 south latitude. The locations of the 718 stations with snowline andjor
climate data used in this study are shown in Figure 2.
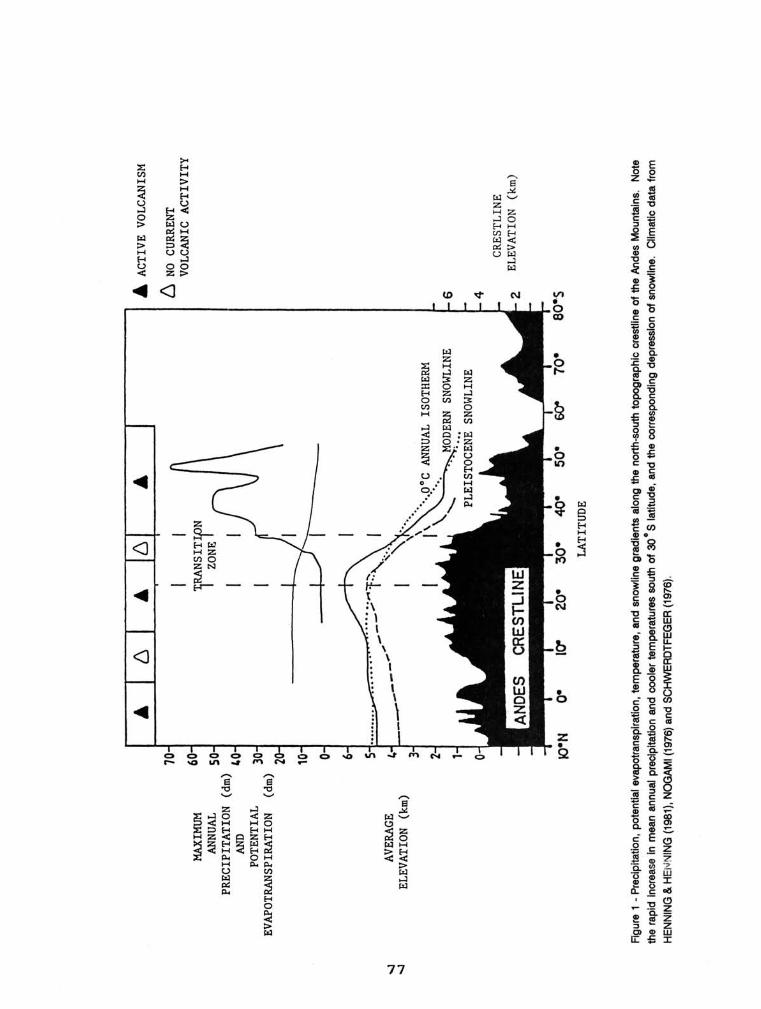
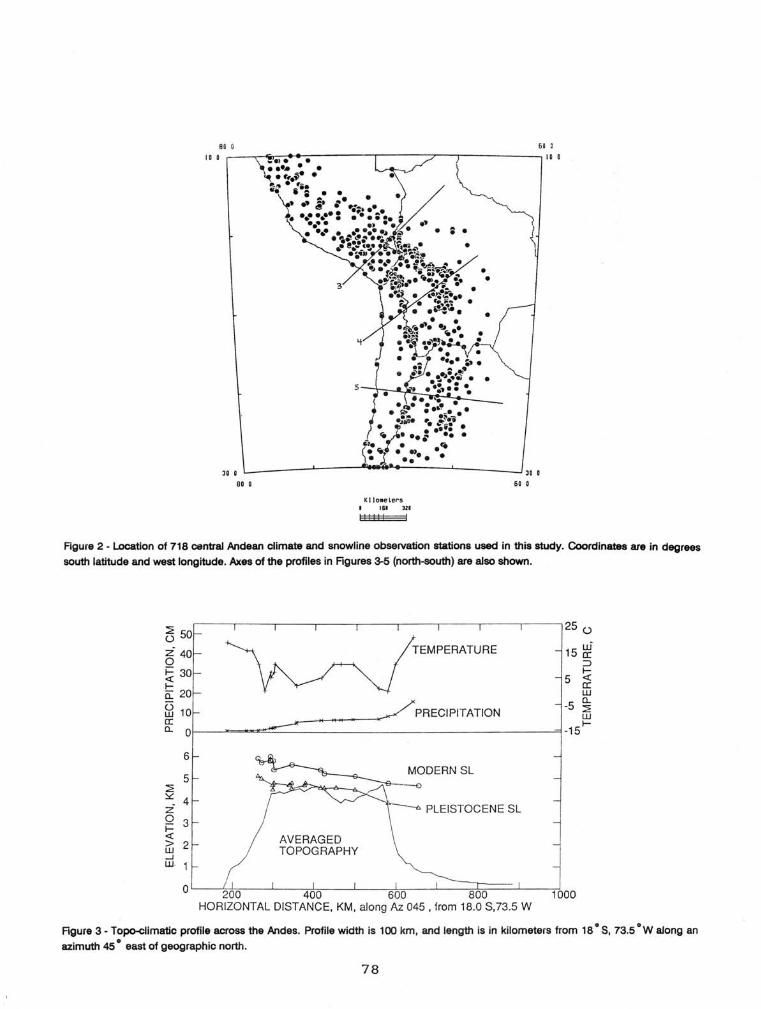
To determine whether or not a general correspondence exists between the regional
change in cJlmatic parameters anel snowline gradients, a series of topo-climatic profiles, each 1,000 km long
and 100 km wide were constructed at 1 o latitude intervals across the Andes, aJthough only 3 representative
profiles are included here (Figs. 3-5). The topograpic profiles represent the averaged topography for a 100
km wide swath a10ng the profile trend, and are based upon a 5 x 5 km gricl. A1though the e1evation and
distribution of the highest peaks control climatic anel snowline pattems on a local scale, averaged
topography was selected for cJarification of regional trends.
Temperature is very sensitive to changes in surface e/evation (Fig. 6) and is controlled by
the regional temperature lapse rate. The temperature curves in Figures 3-5 iIIustrate this relationship, with
higher portions of the averaged topography having lower mean temperatures.
Topography a1so controls the zones of highest precipitation by acting as a barrier as well
as a lifting mechanism for moisture-bearing winds. Within the latitudes of the study area, these winds are
predominantly from an easterly direction, so that the lifting condensation levei is reached by molst air rising
over the Andes producing a classic rain shadow effect to the west. As a result, annual m&an precipitation is
76
-..J
-..J
MA
XlM
UM
AN
NUAL
PR
ECIP
ITA
TIO
N
(dm
) AN
D
POTE
NTI
AL
EVA
POTR
AN
SPlR
ATI
ON
(d
m)
AVER
AGE
ELEV
ATI
ON
(k
m)
IO-N
O
· 10
-
'l;R
AN
SITI
PN
I ZO
N!':
I I
~
~
ANNU
AL
ISO
THER
M
SNOW
LINE
20-
30
· 40
-50
· ro
-7
0·
LATI
TUD
E
~ A
CTIV
E V
OLC
AN
ISM
6 NO
CU
RREN
T V
OLC
AN
IC
AC
TIV
ITY
6 4 C
RES
TLIN
E 2
ELEV
ATI
ON
(k
m)
Fig
ure
1 -
Pre
cipi
tatio
n, p
oten
tial
evap
otra
nspi
ratio
n, t
em
pe
ratu
re,
and
snow
line
gra
die
nts
alo
ng t
he n
orth
-sou
th t
op
og
rap
hic
cre
stlin
e o
f th
e A
ndes
Mou
ntai
ns.
Not
e
the
rapi
d in
crea
se i
n m
ean
annu
al p
reci
pita
tion
and
coo
ler
tem
pera
ture
s so
uth
of
30
o S
lat
itude
, an
d th
e co
rres
pond
ing
depr
essl
on o
f sn
owlin
e.
Oim
ati
c d
ata
fro
m
HE
NN
ING
& H
EN
NIN
G (
1981
), N
OG
AM
I (1
976)
and
SC
HW
ER
DT
FE
GE
R (
1976
).
10 O
80 O 60 O
r---~~~~~----------,-------~r---'------------.IO O
30 O
3
. ; . •
• •
• •
•
•
L---------~------~~~ .. --------~---------J30 o
80 O 60 o
16. III """
Flgure 2 - Location of 718 central Andean c/imate and snowline observation stations used in this study. Coordinates are in degrees
south latitude and west longitude. Axes of the profiles in Flgures 3-5 (north-south) are also shown.
~ ,---,----,---,------.---,---,-------,--,-----,25 ü ü 50 z· 40 TEMPERATURE 15 ~ O ::> ~ 30 5 ~ ~~ ffi - ·5 9:: fil 10 PRECIPITATION ~ oc ~ a.. O ·15
6
5 MODERN SL
~ ::.::: 4 Z PLEISTOCENE SL O 3 f= « AVERAGED > 2 w TOPOGRAPHY ...J w
O 1000
Flgure 3 - To~imatic profile acr088 the Andes. Profile width is 100 km. and length is in kilometers from 18 o S. 73.5 °w along an
azimuth 45 o east of geographic north.
78
~ 50 ü
z' 40 O ~ 30 l-ã: 20 (3 w a: n..
10
O
6
5 ~ ::.:::: 4 z O 3 ~ [ij 2 ...J W
PRECIPITATION
MODERN SL ~~~~---&~~~
~----.!l~_6 .
~ PLEISTOCENE SL
25 ü
15 g! :::>
5 ~ a: w
·5 n.. ~ w l-
·15
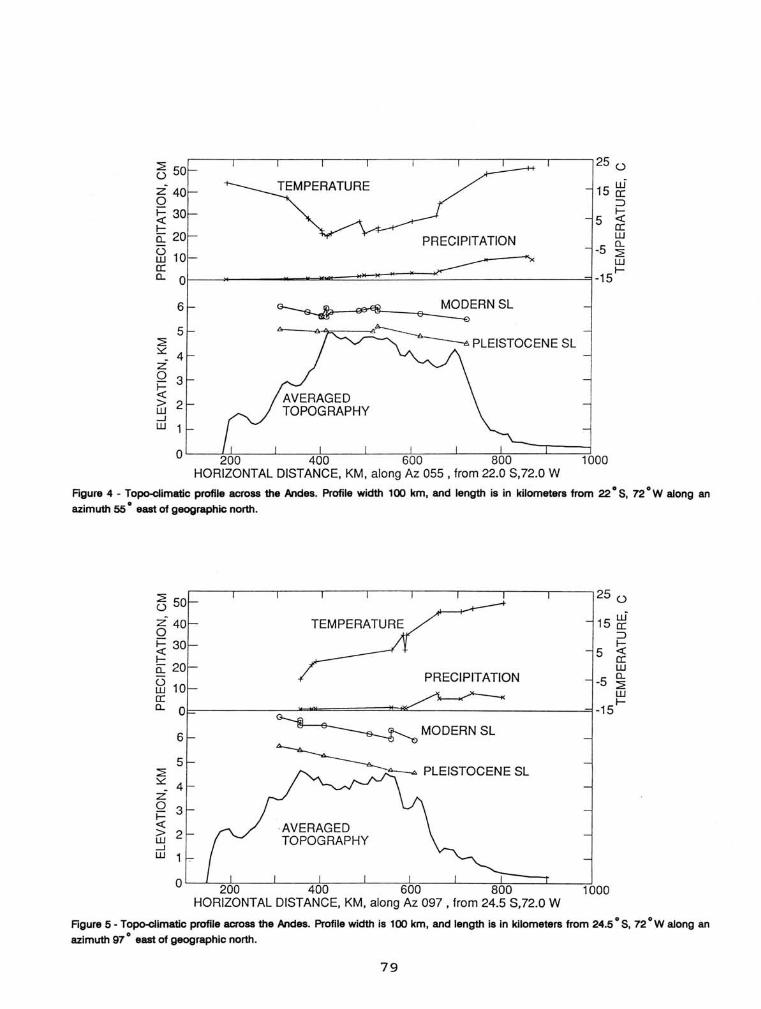
Figure 4 · To~imatic profile across the Andes. Profile width 100 km, and length is in kilometers from 22°8, 72°W a10ng an
azimuth 55 ° east of geographic north.
~ 50 ü
z 40 O ~ 30 I-ã: 20
@ 10 a: n.. O
6
5 ~ ::.:::: 4 z O 3 i= « > 2 w ...J W
O
TEMPERATURE
PRECIPIT ATION
25 ü
15 g! :::>
5 ~ a: w
·5 ~ w I
b----~~~======~~~--------~-15
1000
Figure 5 - To~imatic profile across the Andes. Profile width is 100 km, and length is in kilometers from 24.5°8, 72°W a10ng an
azimuth 97 ° east of geographic north.
79
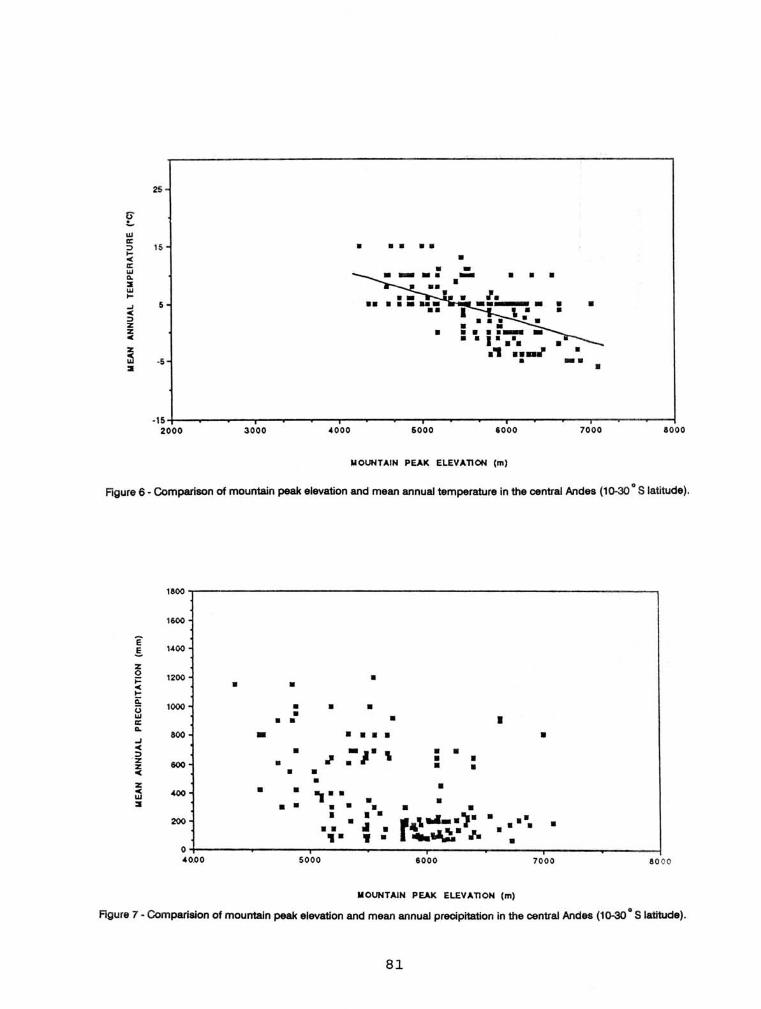
greater on the eastem side of the Andean Cordillera in the study area (Figs. 3-5). A comparison of scatter
plots in Figures 6 and 7 show that precipitation is less sensitive than temperature to variations in elevation.
The combined temperaturejprecipitation effect on snowline position is interesting, however, because higher
peaks tend to have higher modem snowlines (Fig. 8). Most snowlines are within 1 km below nearby
mountaln peaks, regardless of snowllne elevation or clirnatic regime. This relationship suggests a dynamic
feedback mechanism between cllmate and topography.
In general, snowline gradients are consistent with climatic trends. Snowllnes are lower to
the east where annual precipitation is greater. An apparent contradiction exists between the eastward drop
in snowline elevatlon and a general rlse In temperature to the east, where surfaces are warmer because they
are lower (Flgs. 3-5). The loglcal explanation is that higher precipitation ettectively maintalns lower snowline
positions despite s1ightly higher surface temperatures.
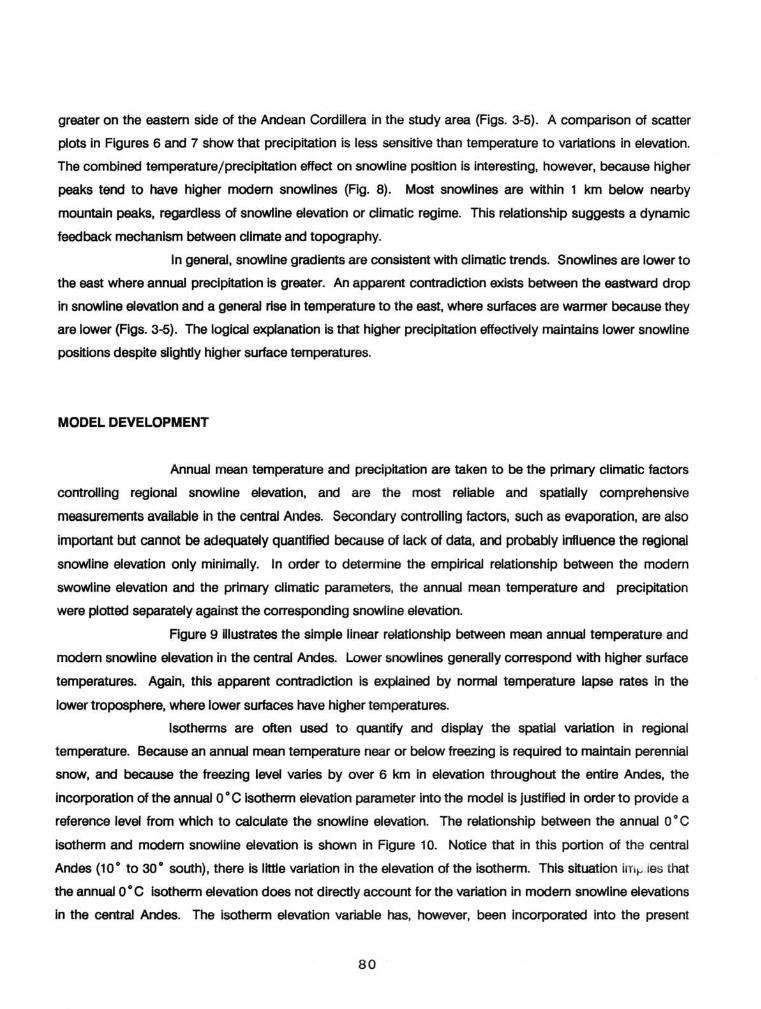
MODELDEVELOPMENT
Annual mean temperature and precipitation are taken to be the prlmary climatic factors
controlling regional snowllne elevation, and are the most reliable and spatially comprehensive
measurements available in the central Andes. Secondary controlling factors, such as evaporation, are a1so
important but cannot be adequately quantified because of lack of data, anel probably influence the regional
snowline elevation only minimally. In order to determine the empirlcal relationship between the modem
swowline elevation and the prirnary cllmatic parameters, the annual mean temperature and precipitation
were plotted separately against the corresponding snowline elevation.
Figure 9 iIIustrates the simple linear relatlonship between mean annual temperature and
modem snowline elevation in the central Andes. Lower snowlines generally correspond with higher surface
temperatures. Again, this apparent contradiction is explained by normal temperature lapse rates in the
lower troposphere, where lower surfaces have higher temperatures.
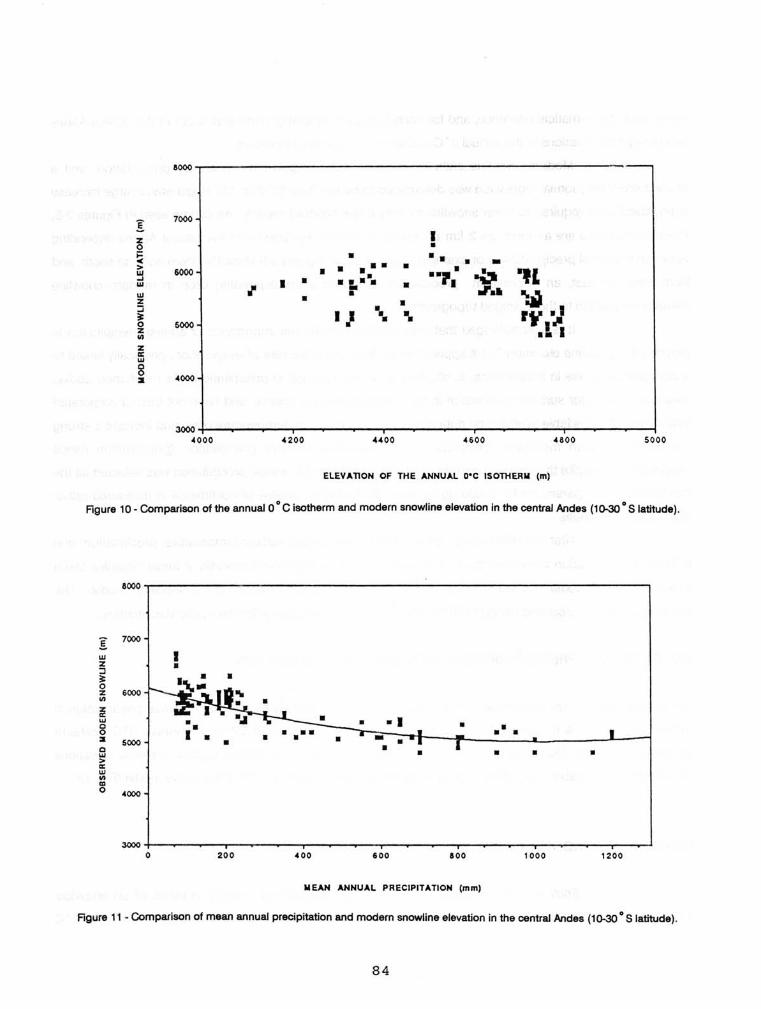
lsotherms are often used to quantify and display the spatial variatlon in regional
temperature. Because an annual mean temperature near or below freezing is required to maintain perennial
snow, and because the freezing levei varies by over 6 km in elevation throughout the entire Andes, the
incorporation of the annual O o C isotherm elevation parameter into the model is justified in order to provide a
reference levei from which to calculate the snowline elevation. The relationship between the annual O o C
isotherm and modem snowline elevation is shown in Figure 10. Notice that in this portion of the central
Andes (10 0 to 30 0 south), there is Iittle variation in the elevation of the isotherm. This situation ilTl~ .ies that
the annual O o C isotherm elevation does not directly account for the variation in modem snowline elevations
in the central Andes. The isotherm elevation variable has, however, been incorporated into the present
80
25
() ~
w a: ~ 15 • • • •• I- • < a: • w Q. - • • • ::I • w I. I-
... 5 •• ._-- • • < , . • ~ • • • • • Z • • z • • • ._- -< • .. -.-. ~ • '1 .... rI •
-5 • -. ::I •
-15+---~--~~r-----~--~----------~------~--r---------~--~------~ 2000 3000 4000 5000 6000 7000 aooo
1oI0UNTAIN PEAK ELEVATlON (m)
Figure 6 - Comparison of mountain peak elevation and mean annual temperature in the central Andes (10-30 o S latitude).
laoo
1600
Ê 1400 !.
Z o 1200 • ~ < • • I-Q:
1000 • • • i3 w • • a: • • • Q.
800 - • • • • • ... < • .- J.. • • ~ ,
· Z • ri • • z 600 • • o< • • Z • • • • < 400 .... w • • ::I • • • • • • •
200 • • • r' .... ·)· · •••• • • • •• • \.~·h • ,. I • • o 40.00 5000 6000 7000 40 00
MOUNTAIN PEAK ELEVATlON (m)
Figure 7 - Comparision of mountain peak elevatlon and mean annual precipitation in the central Andes (10-30 o S latitude).
81

101 Z :::J ~ O Z 111
Z CC 101
8 ::I
a~~----------------------------------------------------------'
5000
• -• • -.. -I.
• • • • • -~. rl •••
M'e.- .. ·1 , .. , •• !t • ... ~ ..... .... • 11 • • • I ... \I • • - •
• •
3~4-----~-----r----~-----'----~~----r-----~----~----------~ 3000 ~ooo 6000 8000 7000 8000
REPRESENTATlVE MOUNTAIN PEAK ElEVATlON (m)
Rgure 8 - Compari80n 01 mountain peak elevation and modern snowlime elevation in the central Andes (10-30 o S latitude).
~~------------------------------------------------------------------~
:[ 1000
z o ;: o( • • ~ -I l1OOO 101
101 • Z ::::;
~ 5000 z 111
Z cc 101
8 ::I .000
~+---------~----------~--------~----------~--------~--------~ -, o o 10 20
MUH AHHUAL TEMPERATlJRE ("C)
Rgure 9 - Compari80n of mean annual temperature and modem snowline elevation in the central Andes (10-30 o S latitude).
82
model as a mathematical reference, and for intended future modeling north and south of the central Andes
where regional variations in the annual O o C isotherm elevation are significant.
Modem snowline altitude was a1so plotted against mean annual precipitation, and a
second-order polynomial regression was determined to be the "best fil" (Fig. 11). In general, a large increase
in precipitation is required to lower snowline by only a few hundred meters. As can be seen in Figures 3-5,
modem snowlines are as much as 2 km above the averaged topography in the central Andes depending
upon mean annual precipitation. For example, the profiles in Figures 3-5 show that from north to south, and
from west to east, an increase in precipitation produces a corresponding drop in modem snowline
elevation in relation to the avaraged topography.
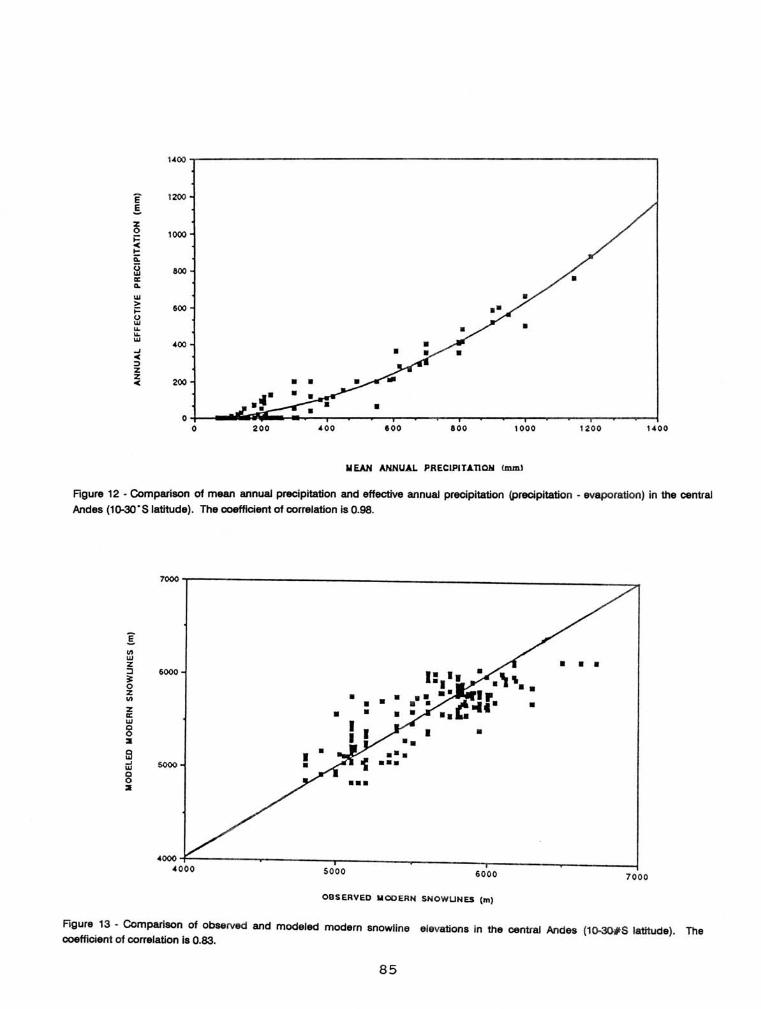
It is acknowledged that evaporation modifies the importance of annual precipitation in
determining snowline elevation, but it appers that an increase in the rate of evaporation, physically linked to
a corresponding rise in temperature, is offset by a similar increase in precipitation. As mentioned above,
measured values for surface evaporation in the central Andes are sparse, and have not been incorporated
into the model. Available evaporation data are based empirically on temperature data, and indicate a strong
correlation between measured precipitation and calculated effective precipitation (precipitation minus
evaporation). Despite the strong correlation illustrated in Figure 12, annual precipitation was selected as the
more appropriate parameter for modeling bacause of the higher degree of confidence in measured rather
than calculated values.
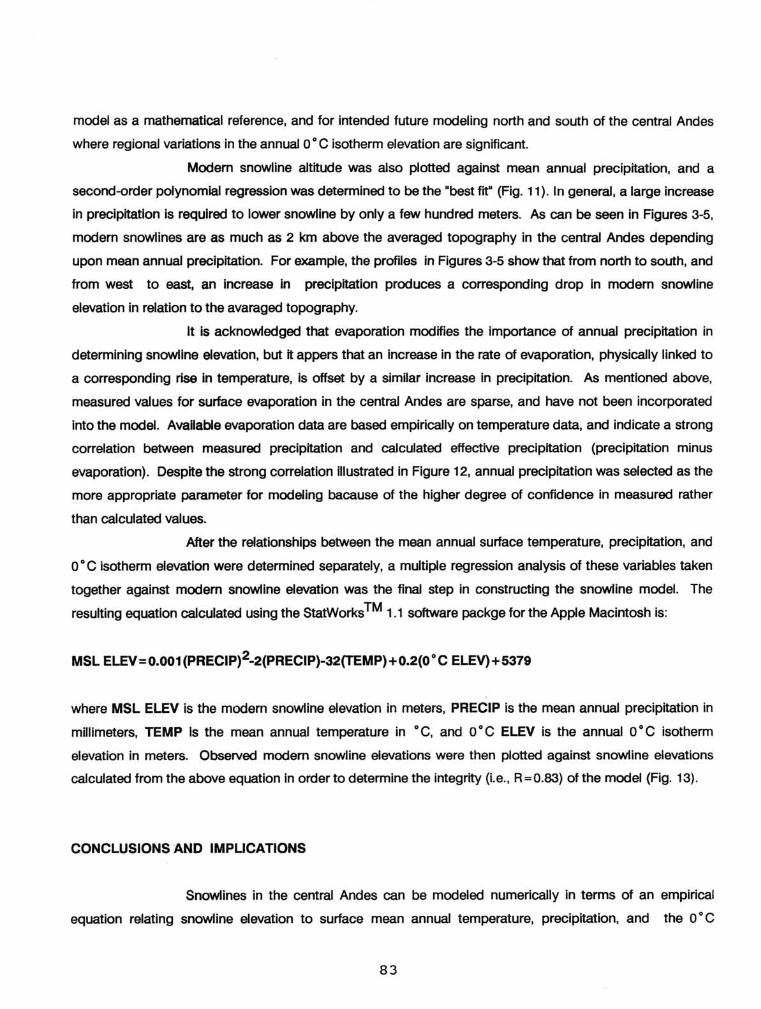
After the relationships between the mean annual surface temperature, precipitation, and
O o C isotherm elevation were determined separately, a multiple regression analysis of these variables taken
together against modem snowline elevation was the final step in constructing the snowline model. The
resulting equation calculated using the StatWorks ™ 1.1 software packge for the Apple Macintosh is:
MSL ELEV = 0.001 (PRECIP)2_2(PRECIP)-32(TEMP) + 0.2(0 o C ELEV) + 5379
where MSL ELEV is the modem snowline elevation in meters, PRECIP is the mean annual precipitation in
millimeters, TEMP is the mean annual temperature in o C, and O o C ELEV is the annual O o C isotherm
elevation in meters. Observed modem snowline elevations were then plotted against snowline elevations
calculated from the above equation in order to determine the integrity (Le., R=O.83) of the model (Fig. 13).
CONCLUSIONS ANO IMPLlCATIONS
Snowlines in the central Andes can be modeled numerically in terms of an empirical
equation relating snowline elevation to surface mean annual temperature, precipitation, and the O o C
83
&~~------------------------------------~----~-------------------
! 7000
Z I O • i= • •• o( • -> • • • • • • 'l w 6000 • • •••• ··rl ..... .... • • W
~ • • J" •• w • -:.l z • • :J • rv·' ~ I} •• .. O SOOO ,--Z ••• 111
Z a: w 8
.~ :li
~;---~--~--~--~----~--~--~------~------------r---~------~ .000 .200 .600 HOO 5000
ELEVAnON OF THE ANNUAL O'C ISOTHERN (m)
Rgure 10 - Comparison of the annual O o C isotherm and modern snowline elevation in the central Andes (1D-30 o S latitude).
8~~-------------------------------------------------------------------------,
! 7000
w I z • ::l • ~ o Z 6000 11'1
~ • I UJ • • o • o • •• • • :li • • • • - • 5000 • o • • • • UJ
> a: w 11'1 !li o .000
~+----------r---------'----------r-~------~--~~---r------~-'----~ o 200 400 600 &00 1000 1200
NEAN ANNUAL PRECIPITATION (mm)
Rgure 11 - Comparison of mean annual precipitation and modern snowline elevation in the central Andes (1D-30 o S latitude).
84
1400
Ê 1200
! Z O 1000 i= oC ... ii: ~ 800 a: Co
w > 600 i= (.) LU "-"-LU
400 ..J oC :J Z Z
200 oC
O O 200 400 .00 800 1000 1200 1400
"UH ANNUAL PREClPlT.l.TION !Jnm}
Figure 12 - Comparison of mean annual precipitation and eftective annual precipitation (precipitation - evaporation) in the central Andes (10-30· S latitude). The ooefticient of correlation is 0.98.
7000,-----------------________________________________________ ~
:[ In LU Z :J 6000 ~ o z • • •• In • • • • z • • a: LU
:5 • ::I
53 • -' 5000 LU o o ::I
4000~~--------~----------,-----------~----------r_----------~------__ ~ 4000 5000 6000 7000
OBSERVED MOOERN SNOWUNES (m)
Figure 13 - Comparison of observed and modeled modern snowline elevations in the central Andes (10-30#S latitude). The ooefticient of correlation is 0.83.
85

isotherm elevation. The coefficient of correlation for this model (R = 0.83) is considered to be significant
because discrepancies between snowline elevations reported by different authors at different times are
assumed to be the source of most of the uncertainty in the model. Ali reported values for snowline, not yet
evaluated for error, were included in the dataset used to construct this model. Analysis of available remotely
sensecl imagery and evaluation of the criteria usecl to define snowline position by the various authors are
required before select observations can be justifiably removecl from the database. Now that an empirical
relationship has been developed for paleoclimatic modeling purposes, the task of reevaluating reported
snowline observations, and the collection of new ones has become more worthwhile.
The modem latltudinal and longitudinal variation of climatic zones in the Andes allOWS
one to model the results of changing one or more of the factors responsible for glaciation. The model can
be appliecl to proxy dl~tic data (i.e., cirque floor elevations) of former snowline positions to quantitatively
estimate Pleistocene temperature and precipitation values. The late Pleistocene glacial-age snowline
elevations are about 800 m lower, on the average, in altitude and generally parallel to modem ones (Figs. 3-
5 and 14). This suggests a strong similarity in wind and moisture regimes throughout much of the late
Ouaternary in the central Andes. An inversion of the derivecl snowline model should ultimately allow a
quantitative reconstruclon of Andean paleoclimates from late Pleistocene snowline data. Independently
derivecl estimates for temperature from pollen data, and precipitation trom closed basin hydrologic budget
modeling will help test the validity of this model. The ultimate goaJ is to regionally map climatic conditions
for the Andes at various times during the late Ouaternary. Further work in the Andes, especially in the
important climatic transition zone between 23 o and 32 o south latitude where there are only sparse snowline
and climatic data, is required.
Extensive summits and plateaus between 21 o and 26 o south latitude are above the
altitude of the annual O o C isotherm today, cold enough for permanent snowfields and active rock glaciers
but toe dry to support major valley glaciers as they did at least twice in the past. The position of the present
summer O o C isotherm below the modem and Pleistocene snowlines in this area implies that no decrease in
temperature would be required to initiate glaciation, but simply an increase in the amount of pecipitation.
This evidence, however, does not preclude a probable lower temperature for the central Andes during
Pleistocene glaciations.
Figure 15 shows the areas above late Pleistocene glacial-age snowlines as determined
by the author from topographic information integrated with snowline observations compiled by NOGAMI
(1976) and by STRECKER (1976). This map iIIustrates the relative extent of land surfaces subjected one or
more times to intense glacial and periglacial modification during the late Ouaternary, and serves as a useful
guide for selecting sitas for future work designed to further increase our knowledge of late Ouaternary
climates in the Andean Cordillera.
86

7~~----------------------------------------------------------~
g li 6000
;::
"" • C > .., •• • ..J .., • • .., • z :;
5000 • • .. '" ~ O z ...... o> .., .. ~~ Z .., U . ~ . • O •• • t-o>
~~ • I -• ill ..J • ... • •
~+-----~-------r------~----~------~-----' __ ----------~ 3000 ~ooo 5000 6000 7000
MODERN SNOWUNE ELEVATION (111)
Figure 14 - Compari80n of modern and late Pleistocene glacial-age snowline elevations in the central Andes (10-30 o S latitude).
61 l
"I r---~~~Y-----------~------~~---'----------~I : I
~ SI I
'z
Kllo.eLet"s 111 UI
li. L---~-----L------~~~--------~----____ -Jl' I SI • 60 •
Figure 15 - Mapped extent of areas above late Pleistocene glacial..age snowline in the central Andes based on available data
(NOGAMI, 1976 and STRECKER, 1987). The observed distribution of perennially snow-covered areas reflects the latltudinal variatíon
in late Plelstocene climate and topography. Coordinates are in degrees south latitude and west longitude.
87

ACKNOWLEDGEMENTS
Research for this paper was supportecl by NASA-JPL SIR-B continuation contract
number 956926, Task Order RE-185 to ComeU University. I thank Professor Bryan lsacks for constructing
the topo-climatic profiles anel his assistance in refining the scope of this paper. Special thanks are also due
Professor Arthur Bloom for his guidance during the development of the snowline model, anel Chalmes
Oapperton for ecIiting the manuscript
REFERENCES
HENNING, I. & HENNING, D. (1981) Potential evapotranspiration in Mountain geoecosystems of different
altitudes anel latitudes. Mountain Research anel Development, 1(3-4):267-274.
NOGAMI, M. (1976) Altitude of the modem anel Pleistocene snowline in the Aneles. Geographical Reporta
ofTokyo Metropolitan University, 11:71-86.
SCHWERDTFEGER, W. (1976) Clirnatea of Central and South America Amsterdam, Elsevier. 532p.
(Wor1d Survey of Oimatology, 12).
STRECKER, M.R. (1987) Late Cenozoic lanelscape development the Santa Marina Valley, northwest
Argentina. Ithaca, 261 p. (Ph.D. Thesis - Comell University).
88