a quarterly publication of dbjc issn : 2248-9711 july - september_2015.pdf · jain spire a...
TRANSCRIPT

D B J CJournal of Business Research
Jain SpireA QUARTERLY PUBLICATION OF DBJC ISSN : 2248-9711
Vol. I No. 1 Issue No. 18 Price 100 July - September 2015
CONTENTS
Sl.No. Name Title P. No.
1 G. Ramkumar Pre-Merger Financial Performance of Bank of Rajasthan Ltd 2
2 G. Sivabalan &Dr. B.Poornachandran
Brand Preference of Mobile Network Customers- A Study with reference to Chennai City 7
3 V. Sujatha &Dr. S. Kumaresan
A Relationship between Lifestyle and online shopping attitude of Customers in Chennai City 14
4 K. Rajalakshmi & Dr. R. Nagarajan
Impact of stress on Employee Performance-A Study with reference to Public Sector Employees 21
5 M. R. Hemamalini Investors’ Risk Behavior Towards Share Market Investment- A Study With Reference To Chennai City 29
6 Maya.Elizabeth.Augustine &Dr. B. Sudha
Reasons for brand shift of Smartphone Customers-A Study with Reference to Chennai City 35
7 R. Selvi &Dr. V. Dheenadhayalan
Financial Performance of Pharmaceutical Industry in India: with reference to select Indian bulk Drugs and Formulations Companies 41
8 D. Rajaprabu & Dr. V. Dheenadhayalan
Study on Financial Performance of new Generation Private Sector Banks in India 48
9 V R Sridhar &Dr. M. Sakthivel Murugan Importance of Corporate Governance under Companies Act, 2013 57
10 Dr. R. UsharaniEmployment and Employability for Commerce Graduates in Villupuram District of Tamil Nadu 63
11Mr. M. Shanmugam &Dr. V. Selvanathan
A Case Study approach for Evaluation of Employee Training Effectiveness and Development of Employees of selected Information Technology (IT) Companies in Chennai City
67
12Mrs. T.S. Bhuvaneswari & Dr. V. Selvanathan
Entrepreneurial Training Perception on MSME-DI (Micro, Small and Medium Enterprise -Development Institute) 75
13S. Ganapathy &Dr. M. Sakthivel Murugan
A Case Study of Indian Overseas Bank: the post backdrop fi nancial performance and strategies for Recovery Mechanism 82

D.B. Jain College
1
From the Editor’s Desk
Happiness is when what you think,What you say and what you do are in harmony” - Mahatma Gandhi
“Never Worry about numbers. Help one person at a time, and always start with the person nearest you” - Mother Teresa
“That some achieve great Success, is proof to all that othersCan achieve it as well” - Abraham Lincoln
“Truth is the only safe groundto stand on” - Elizabeth Cady Stanton
“Coming together is a begining. Keeping together is progressWorking together is success” - Henry Ford
“You grow more when you get more people’s perspectives - Mark Zuckerbery, the co-founder of Facebook
Learning is both art and science. Once can become learned on the successful quest for knowledge and relating the knowledge to practice. It is important to learn how to learn rather stuffi ng one’s head full of all facts and fi gures that might be outdated. No doubt that certain amount of facts is necessary, but having the skills and ability to appropriately learn is also equally critical. DBJC would be happy to see this journal as a common platform for appropriate learning. One of the key objectives of research is its usability and application. The Research papers of this journal focus on Financial performance of Banks and Pharmaceutical Industry, Brand preference of Mobile Network customers, Employee performance, Investors' Risk Behaviour, Smartphone customers, Corporate Governance, Employment and Employability, Employee Training Effectiveness and Entrepreneurial Training.
DBJC Journal of Business Research (Jainspire) is committed to expanding research frontiers and it encourages submission of high quality manuscripts with innovative ideas. Expanding its horizon will further enhance the quality and the journal will continue to provide an outlet for established and rising scholars to publish innovative research papers.
Best Wishes and Season’s Greetings
Dr. M. Sakthivel Murugan
Editor
DBJC Journal of Business Research

D.B. Jain College
2
PRE-MERGER FINANCIAL PERFORMANCE OF BANK OF RAJASTHAN LTD
G.RamkumarAssistant Professor,D.G.Vaishnav College (Autonomous), Chennai, T.N.
Introduction:
With Liberal ideas India in 1991 opened its Prime sectors for both Private and Foreign Companies. The Government followed Liberalisation in Licensing Procedures, Privatisation in Sectoral Investments and Globalisation by allowing Foreign Direct Investments. Banking Sector also had its fi llip and many Private banks came into the Musterroll.There were also many Private Banks existing at that time which are functioning many decades. Bank of Rajasthan (BoR) was incorporated in the year 1943 as a Private Bank by Mansingha Brothers in Udaipur, Rajasthan. The administrative offi ce is in Jaipur and registered offi ce is in Udaipur. In the year 1948 the bank became a scheduled bank and also serving Rajasthan Ministry.
In the year 2008, the Bank was facing with drop down in market business and escalating Non Performing Assets (NPA). Bank also had Fines Imposed from Reserve Bank of India to the extent of Rs 25 Lakhs and also had Notice from Jaipur Stock Exchange for Violations of Clause 36 Listing Agreement. The Banks Financial position came down in 2009 and profi t was eroding. By the end of the year 2010 the bank was incurring loss. Due to its deteriorating nature and mismanagement Reserve bank of India directed the bank on several issues. RBI also made open announcement for taking over the bank. In the year 2009 Many Public and private banks did not give positive reply due to the condition of the bank.
ICICI Bank was the only one which chooses to takeover the company and Merge. In the year 2010 Bank of Rajasthan Ltd was offi cially merged with ICICI Bank Ltd.While other banks were uninterested ICICI Bank saw this opportunity positively. The signifi cance of merger to be analysed positively by Beena (2000) Bank of Rajasthan was at the time of Merger, i.e. 2010 having 463 Branches all over India and with a work force of 3983 employees. Merger and Acquisition will have rule in the next decades by Freidham Cyrus (1999).
The Primary purpose of Merger is to improve Overall Performance by Michael lubatkin (1983) The Bank is fairly small when comparing with big giants like ICICI Bank Ltd.Nowadays banks have diversifi ed their operations in wide areas for which they infrastructure. To enhance the ability of the merged entity to capitalize on the growth opportunities in the Indian economy it would combine Bank of Rajasthan branch franchise with ICICI Bank’s strong capital base. In order to meet these changing scenario banks adopt Merger and Acquisition. Merger and Acquisition should be carefully structured by Andrej Bertoncelj (2007).This tendency is driven by heavy competition prevailing in the market. There is need to reduce the cost, better fi nancial planning multi expansion of the business whether in India or abroad and technological development by Robert.M.Grant (2008).
Review of Literature:
Literature Review on Merger:
1. Marek Malucha (2009) Mergers and Acquisitions have become a big part of the corporate world, and are among the most strategic and tactical decisions made by companies. Wall Street investment
D.B. Jain College
3
bankers arrange many M&A transactions everyday, which bring separate companies together to form larger ones.
2. Vivek Singla (2013) Banks play a substantial role in capital accumulation, fi rm’s growth and economic prosperity. A sound and profi table banking system is better able to face the negative shocks and contribute to the stability of the fi nancial system.
3. Ashima (2014) Announcement of M&A immediately impact a acquiring company’s stock price as a result of change in the stock market equity investor also see the profi tability factor in the trading company. The impact of announcement on the increase and decrease in the share price
4. Neha Verma et al. (2014) Mergers and Acquisitions facilitate a fi rm to implement a strategy of diversifi cation or vertical integration, where vertical integration and diversifi cations are corporate-level strategy options; M&A is a vehicle or mode of entry. The M&A activity is the means by which a fi rm can achieve its growth strategy.
5. Ms.Astha Dewan One of the signifi cant objectives of any corporate sector is to achieve high rate of economic growth. Mergers are a source for corporate growth. It is evaluated as Pre - Post merger analysis with fi nancial ratios using paired sample t .test. The results of the analysis reveal that there is signifi cant difference between the fi nancial performance of the companies before and after the merger.
6. Sukanya Ghosh et al (2012) Mergers and acquisitions had a signifi cant impact on the banking industry in India and around the world, in the global regime. As a result, many bank employees have experienced numerous psychological effects of mergers and acquisition. Acquisitions often have negative impacts on employee's behavior, resulting in counter productive practices, absenteeism, low morale and job dissatisfaction.
7. Siddharth Saboo (2009) Mergers and acquisitions are used for improving competitiveness of companies and gaining competitive advantage over other fi rms through gaining greater market share, broadening the portfolio to reduce business risk, entering new markets and Geographies and capitalising on economies of scale etc. Indian companies have been actively involved in mergers and acquisitions in India domestically as well as internationally.
8. Brajesh Kumar Tiwari (2014) The goal of a bank merger is to increase the bank’s value in one way or another It can be achieved by combining complementary strengths, giving a better geographical spread, serving a larger number of customers in a better way with more diversifi ed products and skills, realizing the opportunities for cross-selling, containing the cost of the merged entity, reduced competition, better utilization of available resources and deriving economies of scale
9. Azeem Ahmad Khan et al (2012) The present study is to test the effi ciency of the Indian Stock Market with respect to the announcement of Mergers and Acquisitions (M&A) in the Indian Banking Sector by employing the Standard Risk Adjusted Event Study Methodology. It is observed that neither before nor after the merger announcement investors are able to earn abnormal/excess return.
10. Carl .B.McGowan Jr et al (2008) Researchers have studied the effects of M&A on the value of both the acquiring fi rm and the bidder fi rm. The evidence on mergers indicates that the stockholders of target fi rms have earned signifi cant abnormal/excess return not only around the announcement period, but also in the weeks after the announcement. These earnings are temporary in nature and fi nds to settle down within a period of very short term.
D.B. Jain College
4
Gap in the Literature:
Several Studies have thrown Light on Merger and Acquisition but they were more concerned with Pre-Post Merger activities in Shares and Stock Exchanges. There is not much review on the Financial Performance of Acquired Company after the Merger. The researchers have made less review on this concept.
Studies evaluate the Merger and Acquisition with either single ratio or few DuPont Ratios. A Study on Financial performance need elaborate study to examine the Post Merger performance. Financial and Business Indicators were taken for ascertaining the impact of fi nancial performance of the Banks.The Study also pointed out lack of Generalised theories on Merger and Acquisition process and also Standardised method to substantiate the Impact of Merger. This Gap was also noted during the review of various literatures from books and research journals.
Many a review was concentrating on employees who are affected by the Merger. There has been thrown enough light on the Cultural disturbance and also fi nancial benefi ts available to the employees. Studies have not pointed out about the employees retrenched during the Merger. Not all the employees of the Target Company get placed in the New Merged Company.
Many empirical study has given importance to the motives of Merger but was absent with its gaining acceptance in the Indian Industrial and Financial sector as a replacement method for restructuring the Corporate growth. Merger was prevalent in Public sector banks like Oriental Commerce, Indian Overseas Bank and Bank of India. State Bank of India also went into Merger with two of its Subsidiaries such as State Bank of Saurashtra and State Bank of Indore.Private Bank Mergers were least and also given less Importance. It is only after the emergence of ICICI Bank and Other big private banks, Private banking sector were given a respectful place in India.
When merger was considered Merger as an important tool for development we should also be equally giving importance when it is not producing its desired results. When Merger is a failure or less successful then we must try to analyse the reason for such failure. This aspect also is taken as a Gap in the Review of Literature.
Objectives of the Study:
1) To Study about Merger and Acquisition in Indian Private Banking Sector
2) To Study the Outcomes of Merger and Acquisition of ICICI Bank Ltd and Bank of Rajasthan Ltd.
Research Methodology:
This Study is on the basis of Secondary data Collection. Data was collected from Annual Reports of the Bank and various other Sources. The period of evaluation was 2005 to 2010. The research was to be defi ned as research for knowledge through an objective.
The researcher uses fi nancial ratios in order to understand the position of Bank of Rajasthan during the period of Pre-Merger. Ratio Analysis was applied to understand the trends in banking business and fi nancial performance.

D.B. Jain College
5
Research Ratio Analysis:
Ratio 2005-06 2006-07 2007-08 2008-09 2009-10Current Ratio 5.2426 3.3736 3.3721 2.1304 2.9540Liquid Ratio 4.9583 3.1748 3.1422 1.8931 1.0669Debt Equity Ratio
26.1165 25.5109 26.3268 23.6039 27.8254
NPA 0.99 0.24 0.42 0.73 1.60Net Profi t per Branch
0.0379 0.2502 0.2488 0.2542 (0.2206)
(Source: From the Annual report of Bank of Rajasthan Ltd)
The above table gives us an understanding about the Financial performance of Bank of Rajasthan Ltd. Current ratio was dropping down as the assets were deteriorating. The NPA was growing high as the Bank was unable to control the Dead Assets. Debt equity ratio was growing as debt is more and also profi t per branch is not that signifi cant. The Overall performance of the Bank is moving towards loss which occurred by 2009-2010.The Company was not able to meet its administrative expenses which escalated during the period as with 463 branches and around 3983 employees. The Overall assets and advances made were not showing any reactions in the annual reports. Even with Directives by Reserve Bank of India and also periodical Audit procedures the bank was not able to stand.
Finding and Conclusions:
• The Staff Cost has escalated during the period of Analysis
• The Banks Profi tability deteriorated during the analysis period
• Current and Liquid Ratios were stumbling
• NPA was escalating and the company has not made any separate arrangements
• Net Profi t per branch or employee also came down
• Ratio analysis is one of the most Important and a reliable technique used to measure the performance of the Banks. It gives a measurement on Cost economies of scale and also Asset Management
• The Economic reforms program has really given a fi llip to the Merger and Acquisition role in the Indian Banking Industry
All these analysis shows that pre-merger fi nancial performance of Bank of Rajasthan was almost becoming out of order.So the Reserve Bank Directive for making a merger announcement for taking over the branch by other fi nancially strong branch was justifi ed.
References:
1. Beena.P.L.(2000 ‘Towards Understanding the Merger wave in the Indian Corporate Sector – A Comparative perspective – Working Paper 355,February,CDS,Trivandrum, pp 1-44.
2. Stephen. Cyrus.Frieheim(1999) was a Chief executive in Sun in 1999 and Started his self business Cyrus Capital Partners in 2005
3. Micheal lubatkin (1983) - Wichita State University - Academy of Management Review, 1983, Vol.

D.B. Jain College
6
8, No. 2. 218-225.
4. Andrej Bertoncelj, Darko Kovac(2007) An integrated approach for a higher success 2007 • vol. 25 • sv. 1 • 167-188
5. Robert.M.Grant, (2008), Contemporary Strategy Analysis, Eighth Edition, pp 40-46.07 • vol. 25 • sv. 1 • 167-188
6. Marek Maluch(2009) in his Phd thesis ‘ Business Valuation in Merger and Acquisition’ 2009, Szczecin University, Poland, pp 3-5
7. Vivek Singla (2013) in his Research Paper on ‘ Analysis of Productivity of Indian Banks – International Journalof Company and Business Research, Vol 4 , Issue 2 , May 2013.
8. Ms.Ashima (2014) – in Profi tability Impact on Equity Investors – After Merger and Acquisition – with Stock Price variance after M&A announcement, Research Journal’s, Journal of Commerce, Vol21, No 3,May 2014.
9. Dr.Rahul Sharma and Ms.Neha Verma (2012) ‘Impact of Mergers and Acquisition on fi rms Long-term performance- A Pre-Post Analysis of the Indian Telecom Industry – IRACST – IJRMT, Vol 4 , No1 , Feb 2014 , pp 2-4.
10. Sukanya Ghosh,Md.Shahanur Islam,Parta Pratim Sengupta,Samir Chandra Basu (2012), ‘The Behavioral aspect of Merger and Acquisition – A Case Study from India, Global Journal of Business Research, Vol 6 , No 3, 2012.
11. Siddharth Saboo and Sunil Gopi (2009), Comparison of Post-Merger Performance of Acquiring fi rms(India) Involved in Domestic and Cross border acquisitions- Munich Personal RePEc archive – IIM Kozhikode – MPRA paper No 19274,2009.
12. BrajeshKumar Tiwari (2014) ‘Effectiveness of Banks after M&A,American Journal of Industrial and Business Management,2014,4,1-8,pp1-2.
13. Azeem Ahmad Khan and Sana Ikram (2012), ‘ Testing the effi ciency of Indian Stock Market Vis A Vis Merger and Acquisition – A Study of Indian Banking Sector – International Journal on Latest Trends in Finance, Economic and Science,Vol2,issue2 pp 1-2, June 2012.
14. Carl B McGowan Jr and Zunaidah Sulong (2008)– A Note on the effect of Merger and Acquisition announcements on Stock Price behaviour and Financial performance – International Business and Economic Research Journal, Sept 2008,Vol 7, No 9 pp 1-2

D.B. Jain College
7
BRAND PREFERENCE OF MOBILE NETWORK CUSTOMERS- A STUDY WITH REFERENCE TO CHENNAI CITY
G.SIVABALAN Dr.B.POORNACHANDRANResearch Scholar, Research Supervisor,Pachaiyappa’s College For Men, Associate Professor & Head of the Department,Kanchipuram. Pachaiyappa’s College For Men Kanchipuram.
INTRODUCTION
The Indian telecom industry is the world’s fastest growing telecom industry. It is also the second largest telecommunication network in the world. In terms of number of wireless connection after China. Cellular service can be divided into two categories. They are the Global System for Mobile communication (GSM) and the Code Division Multiple Access (CDMA).The GSM sector is dominated by various networks. The ITU (International Telecommunication Union) demands quality of service as a set of quality requirement on the collective behavior of one or more objects. It is basically the level of guaranteed service to the customer’s satisfaction that prefers the brand.
In corporate identifi cation are valuable assets in marketing in both domestic and international markets. Brand allows customers to identify product or services which will promise specifi es between such as price, quality or Image. Brand preferences utilize a joint estimation approach to identify the submarkets. Customers value give markets a direction on how best to satisfy customers made and increase brand preferences.
LITERATURE REVIEWS
Mei-Jian, Haibo&Qoing, (2012), suggested that brand emotion of the web consumers, group effect, enterprises networking marketing methods, perceived brand identity are the four factors that infl uenced the choice behavior of web consumer in a different degree and way. The former two factors will affect choice behavior through the consumer preference. Whereas the second two factors affect brand choice behavior indirectly through preference. By empirical study, they concluded that the promotion have neither signifi cantly positive effects nor signifi cant negative ones. Perceived brand identity does not directly produce effect on choice behavior through the preference, but affects it through the brand emotion of web consumers.
Anthony Dadzie, (2013), examined that the reason for switching subscribers to competitor brand is due to network and tariff related issues. And six key attributes call rates, access cost, connection fees, handset features, special offers and call cost of mobile to mobile have signifi cant impact on consumers while making decision to choose particular service provider.
Keller, K.L. (2013), express that brand loyalty and Brand equity constitute Brand Preference therefore brand managers should concentrate on brand loyalty related issues. In their study conducted in Finland mobile industry, they have identifi ed certain factors which signifi cant impact on choosing particular service provider are call rates, services and network coverage.
Zaid.et al., (2013), in other study researcher try to fi nd out how students of university make decision for purchasing mobile phone in Jordan. Researcher use random sampling method and collect the primary data from 395 students of different public and private universities of Jordan, the results of this study shows that university students of Jordan have perfectionist style of purchasing mobile phone, they are price and brand conscious, they are confused to try new brand. Researcher also mentioned that there is a
D.B. Jain College
8
difference of mobile phone selection between the male and female students of Jordan.
Chu-Mei Liu, (2013), inferred that Branding is important to manufacturers, retailers and consumers. Brands with higher brand equity have higher sales. The growth of mobile phone subscriptions is considerably faster in the Philippines. And promotions are undertaken through cooperation between the service providers and mobile phone manufacturers. The study tries to fi nd out the effects of the different activities on consumer choice of mobile phone brands.
Ajax Persaud, IrfanAzhar, (2013), concludes that consumers' shopping style, brand trust, and value are key motivations for engaging in mobile marketing through their smart phones. Further research should focus on specifi c tactics marketers use to engage customers beyond marketing messages, that is, how they engage customers in dialogue to build relationships, encourage purchases and build loyalty. This could reveal how customers really want to engage in mobile marketing.
RESEARCH GAP
After reviewing the literature pertaining to brand preference and customer satisfaction, researcher identifi ed three predominant lacunae regarding the relation between brand preference and customer satisfaction. The fi rst lacunae focuses on identifying the direct factors infl uencing brand preference of customers and the second issue so far not addressed at the International, National, State and District level is to measure a satisfaction level empirically. The third research gap is to establish the nature of relationships between customer satisfaction and brand preference.
OBJECTIVES OF THE STUDY
The objectives of the study are to ascertain brand preferences and satisfaction level of customers of mobile network.
• To study the socio economic profi le of mobile network users in Chennai city.
• To identify the factors infl uencing brand preference of mobile network customers.
METHODOLOGY
The methodology of the study is based on the primary as well as secondary data. The study depends mainly on the primary data collected through a well-framed and structured questionnaire to elicit the well-considered opinions of the respondents. Multi-stage and two-stage random sampling is adopted to obtain the responses from the consumers using various mobile networks in Chennai city. This study employs both analytical and descriptive type of methodology. The study is conducted in two stages format, with a preliminary pilot study followed by the main study. The secondary data are collected from journals, magazines, publications, reports, books, dailies, periodicals, articles, research papers, websites, company publications, manuals and booklets.
A total of 200 questionnaires were distributed, only 149 questionnaires were returned by the consumers and 39 questionnaires were not completed properly. So, only 110 responses were considered for the research. Hence the exact sample size of the study is 510.
DATA ANALYSIS
The Primary data collected are analyzed statistically with the help of following statistical tools.
1. Factor Analysis by Principal Component Method is used to identify the predominant factors infl uencing

D.B. Jain College
9
brand preference .
2. Non-Parametric chi-square analysis is brought to fi nd the nature of associations between three clusters of brand preference and customer satisfaction with demographic details and mobile network details.
3. One way Analysis of Variance (ANOVA) is applied to ascertain the signifi cant infl uence of demographic details on the factors of brand preference and customer satisfaction.
ANALYSIS AND DISCUSSION
Factor analysis has been applied to analyze a large number of Variables by identifying common and unique sets variance that are referred to as dimensions, factors, or components. It allows the researcher to summarize and reduce the data. The process of summary and reduction allows the data to be described by a much smaller number of Variables than the original. In this study, the researcher has taken all elements of brand preference of mobile network. Factor analysis by the principal component method is applied on all 21 Variables of brand preference. The following results are obtained for the classifi cation of the factors.
Table 1 KMO and Bartlett's Test
Kaiser-Meyer-Olkin Measure of Sampling Adequacy. .821Bartlett's Test of SpheriDist Approx. Chi-Square 2119.665
df 210Sig. .000
From the above table it is found that KMO measure of sampling adequacy is 0.821, Bartlett's Test of SpheriDist with approximated chi-square value 2119.66 are statistically signifi cant at 5 percentage level. This indicates all the twenty one Variables are normally distributed and suitable for data reduction.
Table 2Communalities
Variables Initial ExtractionSocial status and perceived prestige
1.000 .580
Service quality effi ciency 1.000 .582Good network coverage 1.000 .620High reliability and confi dence 1.000 .560Brand image 1.000 .418Best offers and discounts 1.000 .518Good data usage packages, 2G and 3G
1.000 .586
Call cost of the service 1.000 .486Customer care cell services 1.000 .546The add on services 1.000 .524The brand is used by my friends or colleague
1.000 .655
Network Coverage effi ciency 1.000 .557

D.B. Jain College
10
Lucrative Price/Recharge value Price/Recharge value
1.000 .695
The existing product/service worth the purchase price
1.000 .526
The comparative price the product/service
1.000 .519
Easy utility of the brand 1.000 .370Appropriate Responsiveness 1.000 .460Touch of professionalism in service and technology
1.000 .574
Customer need based services 1.000 .511Advanced technology 1.000 .467Immediate grievance mechanism
1.000 .508
Source: Extraction Method: Principal Component Analysis.
From the above table it is found that twenty one Variables of brand preference factors exhibit the variance 0.370 to 0.655. This implies these six Variables establish considerable variance 37% to 65.5%. This variance range is statistically signifi cant at 5% level and the segmentation process can be done for these twenty one Variables.
Table 3 Total Variance Explained
Component Initial Eigen values Rotation Sums of Squared LoadingsTotal % of
VarianceCumulative %
Total % of Variance
Cumulative %
1 4.729 22.520 22.520 2.753 13.108 13.1082 1.727 8.226 30.746 1.981 9.435 22.5433 1.419 6.759 37.504 1.661 7.911 30.4544 1.333 6.348 43.853 1.659 7.898 38.3525 1.051 5.007 48.859 1.617 7.699 46.0516 1.003 4.775 53.635 1.593 7.583 53.6357 .932 4.440 58.0748 .917 4.365 62.4409 .831 3.955 66.39510 .780 3.716 70.11111 .753 3.586 73.69612 .728 3.467 77.16413 .689 3.283 80.44614 .621 2.957 83.40315 .613 2.919 86.32216 .599 2.852 89.17417 .527 2.510 91.684

D.B. Jain College
11
18 .490 2.334 94.01819 .466 2.220 96.23820 .420 1.999 98.23721 .370 1.763 100.000
From the above table it is found that twenty one Variables are reduced into six predominant factors with individual variances 13.108, 9.435, 7.911, 7.898, 7.699, 7.583 and the total variance 53.635%. This shows that the twenty one Variables of brand preference factors are reduced into six predominant factors to represent their respective underlying Variables. The following information clearly explains the Variables loadings in each factor.
Table 4 Rotated Component Matrix (a)
Variables Component1 2 3 4 5 6
Good network coverage .649Good data usage packages, 2G & 3G .633Network coverage effi ciency .603Touch of Professionalism in service and technology
.566
Advanced technology .564Service quality effi ciency .422Customer care cell services .698Customer need based services .674Social status and perceived prestige .653The brand is used by my friends or colleague .793Best offers and discounts .731Lucrative Price/Recharge value price/Recharge value
.562
The existing product/service worth the purchase price
.665
The comparative price of product/service .641Call cost of the service .600High reliability and confi dence .695Brand image .628The add on services .513Easy utility of the brand .742Appropriate responsiveness .642Immediate grievance mechanism .531
Source: Extraction Method: Principal Component Analysis. Rotation Method: Varimax with Kaiser Normalization.
From the above table it is found that the fi rst factor comprises of fi ve Variables namely

D.B. Jain College
12
Good network coverage (.649)
Good data usage packages, 2G & 3G (.633)
Network coverage effi ciency (.603)
Touch of Professionalism in service and technology (.566)
Advanced technology (.564)
Therefore this factor is named as “Technology Approach”
The second factor comprises of three Variables namely:
Service quality effi ciency (.422)
Customer care cell services (.698)
Customer need based services (.674)
Therefore this factor is named as “Service effi ciency”
The third factor comprised of two factors namely:
Social status and perceived prestige (.653)
The brand is used by my friends or colleague (.793)
Therefore this factor is named as “Brand delight”
The fourth factor comprises of fi ve Variables namely:
Best offers and discounts (.731)
Lucrative Price/Recharge value price/Recharge value (.562)
The existing product/service worth the purchase price (.665)
The comparative price of product/service (.641)
Call cost of the service (.600)
Therefore this factor is named as “Cost Effectiveness”
The fi fth factor comprises of three Variables namely
High reliability and confi dence (.695)
Brand image (.628)
The add on services (.513)
Therefore this factor is named as “Extensive Reliability”
The sixth factor comprises of three Variables namely
Easy utility of the brand (.742)
D.B. Jain College
13
Appropriate responsiveness (.642)
Immediate grievance mechanism (.531)
This factor is named as “User friendly Approach”
Therefore it is concluded that the customers using mobile network give importance to the brand that gives a good product with best price and service after sale. The brand should have a good network with application of advanced technology that increases their social status and prestige in the society when using the product.
FINDINGS AND CONCLUSIONS.
The customers using mobile network strongly agreed that there is a good network, service effi ciency, good image, gives best offers on talk times, good data usage package, 2G, 3G and is used by all their friends and colleagues because of its lucrative price, recharge value , which is worth in purchasing this product. The technology used is advanced easy to use and there is professional touch in the service and technology adopted in manufacturing this product.
The twenty one Variables of brand preference are reduced into six predominant factors named as Technology approach, service effi ciency, brand delight, cost effectiveness, extensive reliability and User friendly Approach concluding that Mobile network gives importance to the brand that gives a good product with best price and service after sale
REFERENCES.
Anthony Dadzie, (2013). Brand Preference for Mobile Phone Operator Services in the Cape Coast Metropolis, International Journal of Business and Management, Vol. 6, No.11; November 2011, pp.190-205.
Ajax Persaud, IrfanAzhar, (2013),. “Customer churn analysis: Churn determinants and mediation effects of partial defection in the Korean mobile telecommunications service industry”, Telecommunications Policy, Volume 30, Pages 552-568.
Chu-Mai Liu(2013). Assessing the effects of quality, value, and customer satisfaction on consumer behavioral intentions in service environments. Journal of Retailing, 76(2), 193-218.
Mei-Jian, Haibo&Qoing (2012): Canadian Subject Form: Consumer behavior:
international Journal of Business Research, 2012
D.B. Jain College
14
A RELATIONSHIP BETWEEN LIFESTYLE AND ONLINE SHOPPING ATTITUDE OF CUSTOMERS IN CHENNAI CITY
V.SUJATHA Dr. S. KUMARESANResearch scholar, Research Guide and Supervisor,Pachiyappa’s College, Associate Professor,Chennai - 30. Pachiyappa’s College, Chennai - 30.
INTRODUCTION:
Lifestyle is the way a person lives including the person’s individual attitude to the world. Market is known for positioning the trends and people follow it with bursting eagerness. Especially in India, Lifestyle depends on person’s background, family, education and nature of the work. Websites have sprung up to good number of people to try out new lifestyle techniques. Consumer needs and preference changes continuously with given changes in the factors like demographics and lifestyles. These changes can become great business opportunities for alert marketers and threats for marketers who fail to adapt. It is very essential to know how buyers behave in modern marketing fi eld. Buyer behaviour is also infl uenced by personality, socio-demographic characteristics, and lifestyle. Consumer buying behaviour helps to students understand the internal variables like motivation, personality, perception, learning, and attitude, and peripheral variables like reference groups, family, social class, and culture and their infl uence on consumer decision-making process. The term consumer buying behaviour is defi ned as the behaviour that consumer display in searching for purchasing, using evaluating and disposing of products/services that are required for satisfying their needs. Buyer behaviour focuses how individual decision processes diverse during spend of their needs. Buyer behaviour focuses how individual decision processes varied during spend of their resources (Time, Money and efforts) on consumption related items. Buyer behaviour has changed signifi cantly post liberalisation of the markets. Today, customary methods of purchasing goods and services have been changing. Buyers are relying on online order. Many people have replaced their daily newspaper and collecting the information through other resources. Student can access the universities related information by online facilities rather lying mailed catalogue send by the universities. If people want to sell their old products there is no need to advertise this information in local newspapers. People in the world differ in various ways during the purchase or use of the products/services. Buyer behaviour has changed drastically post liberalisation. Today, traditional methods of purchasing goods and services have been changing. Buyers are relying on online order. Many people have replaced their daily newspaper and collect the information through other resources. A highly demanding lifestyle is compelling consumers, worldwide to adopt internet shopping as an alternative brick and mortar shopping. People, in order to save time and money are motivated to purchase products and services online. Companies are investing profoundly on technology to make best use of internet as the shopping channel. There is barely any product, service or commodity which is not being sold through internet. Online retailing is unanimously accepted and accredited as a cost-effective, profi table and accessible medium to shop. It therefore becomes imperative for online retailers to study online consumerism and how it taking shape in today’s era of rapid globalisation.
NEED FOR STUDY CONSUMER BEHAVIOUR:
Most products eventually end up in private households even though they will pass through a number of steps on their way from producer to end user. Producers and traders form perpendicular chains or networks, called value chains, at the end of which are the consumer. Understanding consumer behaviour is not only important for the producer but for all the other actors in the chain. The value of the consumer
D.B. Jain College
15
puts on the goods or service limits what everyone else can get from the value chain.
To understand the buying behaviour of rural consumers, we must go into the factors that infl uence their abundance, buying behaviour and fi nally the decision making. The factors include: Social Environment, Cultural Environment, Education, Occupation, Media and Involvement of the users. All the above factors persuade and galvanize the buying behaviour of rural consumer and helps in decision making as well.
Human beings are social and nowadays, consumers are participating in variety of activities, from consuming content to sharing knowledge, experiences, opinions, and involved in discussion with other consumers online (Heinonen, 2011). Today, with the growth of Internet, online social networks have become important communication channels and also virtual communities have emerged. Online world has become a new kind of social Communication, connecting people to variety of online communities has been growing during past decade. Groups that may never meet in the physical world but nevertheless they are able to affect behaviour including purchasing decisions (Evans, Jamal & Foxall, 2009). Internet is a social place where created new forum for consumers. Virtual communities, blog, and online social networking sites provide a platform to infl uence consumers ’purchase decisions.
Women, as well as the rest of any population, have their own interests and follow the news not only inside the country but also outside the country and they have their impact on the social and economic policies of the nation and the rest of the world (Kucukemiroglu, 1999). The lifestyle of people is a very important factor for any market researcher who wants to study the behaviour of specifi c market segments in any country. Variables of lifestyle are a very important basis for the study of consumer behaviour and they help the decision makers prepare for better production and sales policies, not only from year to year but also from day to day.
REVIEW OF LITERATURE:
1. Zuroni and Goh(2012) in his study the factors infl uencing online shopping. The main purpose of the study was to determine the factors infl uencing consumers’ attitude towards e-commerce purchases. The fi ndings revealed that there was no signifi cant difference in attitude towards online shopping among age group but there is a signifi cant difference in attitude towards online shopping among income group. The study also showed that there was no signifi cant relationship between consumers’ risk and attitude towards online shopping among the respondents.
2. Halimi, Anahita Bagherzad and Chavosh, Alireza and Choshalyc, Sahar Hosseinikhah and Esferjani, Pejman Sheibani and Doghezlou, Aliakbar Hozhabri ( 2012) they presented the factor affecting consumers attitude towards online purchasing. The study revealed that the product characteristics have not any signifi cant relationship with the customer’s attitude towards online shopping in the case of Singaporean degree holders. Also, assured that they can obtain more success the if customers personal information would be kept safe and can increase their trust by providing facilities that provide more safe transactions for them when they do online purchasing. Suggested that E-retailers should design more user friendly websites.
3. Hemamalini (2013) in an innovative study empirically examined the product types of online shopping within a proposed model with respect to factors like personal internet awareness, product involvement, attitude and reason to shop online. The study found that product involvement, attitude and reason for online shopping varied with different product types.
4. Mahla Khalil (2013) the study reveals the factors affecting the customers attitude directly for online shopping. The invention of the internet has created a new pattern of traditional way people shop.

D.B. Jain College
16
Today, online shopping is ideal for many of people with disabilities, people with children, people with hectic schedules and other who just may not have the time or the energy to spend all days walking around the mall.
5. Wen gong (2013) the study investigates the perceptions of online customers. A online customers become progressively global and multicultural, more cross cultural research for online customer purchase behaviour. They found that there is signifi cance different in perception regarding the relative advantage, ease of use, and risk of shopping on the internet.
6. Vegiayan, K.D., Ming, C.W., & Harun, M.L.O. (2013), they wrote that the purchase quality (wide ranges, covers interest, purchase process, adequate security and safety) variable shows to have highest relationship with the customer. The study suggested that customer also do fi nd, their inquiries regarding their purchases are not being answered promptly, some retailer takes a week or more to response to customers. Suggests retailers need to take this issue in to consideration and perform improvement. This also includes of elements increase the interest of the customer to make their purchase.
7. Cheng boon liat(2014) the study focused on infl uence customers online purchase intention among university students. E-Commerce is one of the crucial trading methods worldwide. Hence, it is important to understand consumers’ online purchase intention. Consumers are increasingly adopting electronic channels for purchasing their daily needed products. The globalization of competition and development of information technology haven handed customer infl uences and created a situation where people prefer shopping online rather than migrating as online shopping provides quality products as well as saves time .
8. Rakshitapuranik and Alokbansal(2014) the study examined that the factors that infl uence the Internet users' perception towards e-shopping. The growth of Internet usage has provided the new way of marketing and distribution of the goods and services. Internet has save the time and become a convenience medium for the users because with few clicks the users can purchase the product of their choice. Therefore, a need has created to understand how the internet users perceive online shopping.
9. Preethi Khitoliya (2014) examined the customer attitude and perception towards online shopping in Delhi. The results of the study indicated that there is a strong relationship between age and frequency of online shopping and privacy and security is the main concerned for online shopping.
10. Hong, Weiyin and Thong, James Y.L. and Tam, Karya (May 2014) observed that a good fi t between the information format and the shopping task will result in signifi cant improvements in online shopping performance. Their fi ndings suggested that given the same information content, varying the information format is capable of infl uencing the customers’ online shopping behaviour.
OBJECTIVES OF THE STUDY:
1. To identify lifestyle dimensions of online customers.
2. To fi nd the relationship between the lifestyle dimension and attitude of online consumers.
HYPOTHESIS:
1. The lifestyle dimensions of online customer do not differ signifi cantly.
2. There is no relationship between lifestyle dimension and attitude of online consumer.
METHODOLOGY:

D.B. Jain College
17
The study is based on primary data obtained from online customers in Chennai city. The researcher used a well structured questionnaire to obtain the responses towards existing lifestyle as well as the attitude towards online shopping. The convenient sampling method is applied to obtain 200 respondents from different parts of Chennai city.
ANALYSIS AND DISCUSSION:
In this section the factor analysis principal component method is applied to derive the factors of lifestyle perception. The principle component method derive fi ve lifestyle perception namely frivolous time, rigorous approach, meticulous approach, peculiarity, domestic approach, go getters, product characteristics, purchase materialisation, quality conscious and perceived notions towards the online shopping attitude.
The following table indicates lifestyle characteristics and signifi cance of attitude orientation of online consumers.
TABLE NO: 1Lifestyle characteristic
Purchase interested cluster
Family oriented cluster
Innovative cluster
F Sig F Sig F SigFrivolous time 0.001 0.975 1.282 0.258 0.131 0.718Gregarious approach
3.779 0.053 0.022 0.881 0.333 0.566
Meticulous approach
2.677 0.103 0.338 0.561 6.017 0.016*
Peculiarity 0.182 0.670 2.365 0.125 0.983 0.325Domestic approach
2.727 0.100 0.000 0.998 0.578 0.449
Go-getters 1.551 0.214 0.940 0.333 1.159 0.285Product characteristics
1.432 0.233 0.097 0.756 1.311 0.256
Purchase materialisation
0.320 0.572 2.537 0.112 0.522 0.472
Quality conscious 0.601 0.439 1.077 0.300 0.953 0.332Perceived notions 2.266 0.134 3.662 0.056 9.675 0.003*
From the above table it is found that three clusters are formed out of ten lifestyle dimensions. These attitude of online customers are classifi ed in to purchase interested customers, family oriented customers and innovative customers.
In this table the F value indicates the perfect discrimination of online customers with respect to their attitude. Therefore in this juncture regression analysis is applied to relate lifestyle perception and attitude on online customers.
TABLE NO: 2
Model Summary

D.B. Jain College
18
Model R R Square Adjusted R Square
Std. Error of the Estimate
1 .460(a) .212 .198 .754
a Predictors: (Constant), LS19.10, LS19.1, LS19.8, LS19.5, LS19.3, LS19.9, LS19.7, LS19.2, LS19.4, LS19.6From the above table it is found that R= .460, R2 =.212, adjusted R2=.198; and Standard error of the estimate = .754 are statistically signifi cant at 5% level. This shows that the lifestyle perception explain 21.2% variance over the attitude of the online customers.
The regression is verifi ed in the following ANOVA table.
TABLE NO: 3
ANOVA(b)Model Sum of
Squaresdf Mean
SquareF Sig.
1 Regression 85.344 10 8.534 15.029 .000(a) Residual 317.444 559 .568 Total 402.788 569
a Predictors: (Constant), LS19.10, LS19.1, LS19.8, LS19.5, LS19.3, LS19.9, LS19.7, LS19.2, LS19.4, LS19.6
b Dependent Variable: attitude
From the above table it is found that F=15.029, T=.000 are statistically signifi cant at 5% level. This lead to individual infl uence of lifestyle dimensions of the attitude of online customers.
TABLE NO: 4
Coeffi cients(a)Model Unstandardized
Coeffi cientsStandardized Coeffi cients
t Sig.
D.B. Jain College
19
1 (Constant)
Frivolous time Gregarious approach
Meticulous approach
Peculiarity
Domestic approach
Go-getters
Product characteristics
Purchase materialisation
Quality conscious
Perceived notions
B Std. Error Beta B Std. Error3.712
-.089
-.007
-.061
-.002
-.143
.083
.057
-.228
-.059
-.030
.215
.035
.036
.041
.038
.030
.037
.042
.030
.034
.034
-.104
-.008
-.069
-.002
-.212
.106
.064
-.325
-.073
-.037
17.262
-2.567
-.189
-1.492
-.052
-4.744
2.222
1.353
-7.694
-1.705
-.883
.000
.011
.850
.136
.958
.000
.027
.177
.000
.089
.378a Dependent Variable: attitude
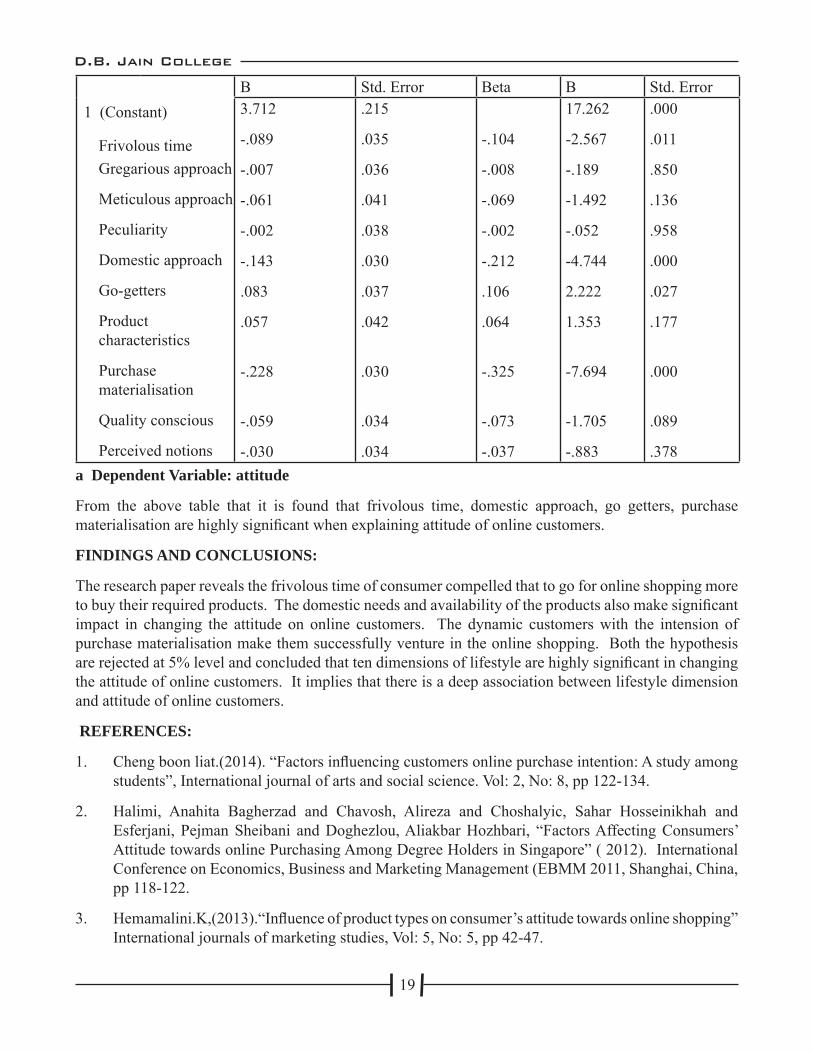
From the above table that it is found that frivolous time, domestic approach, go getters, purchase materialisation are highly signifi cant when explaining attitude of online customers.
FINDINGS AND CONCLUSIONS:
The research paper reveals the frivolous time of consumer compelled that to go for online shopping more to buy their required products. The domestic needs and availability of the products also make signifi cant impact in changing the attitude on online customers. The dynamic customers with the intension of purchase materialisation make them successfully venture in the online shopping. Both the hypothesis are rejected at 5% level and concluded that ten dimensions of lifestyle are highly signifi cant in changing the attitude of online customers. It implies that there is a deep association between lifestyle dimension and attitude of online customers.
REFERENCES:
1. Cheng boon liat.(2014). “Factors infl uencing customers online purchase intention: A study among students”, International journal of arts and social science. Vol: 2, No: 8, pp 122-134.
2. Halimi, Anahita Bagherzad and Chavosh, Alireza and Choshalyic, Sahar Hosseinikhah and Esferjani, Pejman Sheibani and Doghezlou, Aliakbar Hozhbari, “Factors Affecting Consumers’ Attitude towards online Purchasing Among Degree Holders in Singapore” ( 2012). International Conference on Economics, Business and Marketing Management (EBMM 2011, Shanghai, China, pp 118-122.
3. Hemamalini.K,(2013).“Infl uence of product types on consumer’s attitude towards online shopping” International journals of marketing studies, Vol: 5, No: 5, pp 42-47.

D.B. Jain College
20
4. Hong, Welyin and Thong, James Y.L. and Tam, Kar Yan, (2014) “The Effects of Information Format and shopping Task on Consumers’ online shopping Behaviour: A Cognitive fi t Perspective” Journal of Management Information System, Vol. 20 No.3 PP 149-184
5. Mahla Khalil. (2013). “Factors affecting the consumer’s attitude on online shopping”, international journals of scientifi c and research publication, Vol: 4, No: 11, pp55-67.
6. Preeti Khitoliya (2014) “Customer Attitude and Perception Towards online Shopping” Indian Journal of Research, Vol:3 pp 18-21.
7. Rakshitapuranik and Alok basal, (2014). “A study of internet user’s perception towards E-shopping” journal of specifi c review international, Vol: 6, No: 9, pp 37-44.
8. Wen gong. (2013). “Attitude towards online shopping: A comparison of online consumers”, international journals of E-business development, Vol: 2, No: 2, pp28-35.
9. Vegiayan, K.D., Ming, C.W., Harun, M.L.O. (2013) “ Online Shopping and Customer Satisfaction in Malaysia” International Journal of Marketing Practices – UMP Vol,1,No., pp 43-51
10. Zuroni, M. J., &Goh, H. L.(2012) “Factors infl uencing consumers’ attitude towards e-commerce purchases through online shopping”. International Journal of Humanities and Social Science, Vol: 2, No.4, pp 235-354.
D.B. Jain College
21
IMPACT OF STRESS ON EMPLOYEE PERFORMANCE-A STUDY WITH REFERENCE TO PUBLIC SECTOR EMPLOYEES
K.RAJALAKSHMI Dr.R.NAGARAJANResearch Scholar (Part Time), Associate Professor and Research Supervisor (Retd),Dept. of Commerce, PG & Research Dept. of Commerce,D.G.Vaishnav College, Arumbakkam , Chennai-106. D.G.Vaishnav College, Arumbakkam , Chennai-106.
INTRODUCTION
The term stress has become a universal experience in this present era. The tremendous change in economic policies of Liberalisation, Privatisation and Globalisation has made the world to turn on the industrial growth along with the Human values. In this Global era, factors such as growth in Global competition, corporate restructuring, and downsizing have all brought a great change in employees to be committed for longer hours inorder to meet the demands and targets.This has an impact on the performance and effi ciency in terms of both individuals and organization.Ifpeople response to these targets resulting in mental or physical tension the organization has toconcern about it. The word stress begins when demands arises threatening ones capabilities and resources for meeting it.The words like strain, tension, anger, depression, rage, emotions, sadness, seclusions, feebleness, act as a combining factor for the dreadful word stress. Stress occurs due to the pressure from external environment or an external event that impacts on physical or mental effects in our body.The increase in diseases like heart related problems, strokes and diseases through hereditary conditions are threatening India’s growth prospects, most of the research said.Workplace stress is the harmful physical and emotional response that occurs when there is a poor match between job demands and the capabilities, resources, or needs of the worker. These conditions may lead to poor work performance or even injury. Job stress is also associated with various biological reactions that may lead ultimately to compromised health, such as cardiovascular disease. Stress is a prevalent and costly problem in today’s workplace. The stress can be positive or sometimes it can be a negative one. The sources of stress may be environmental issues, organisation issue, extra organisation issue, and individual factors. Since the stress results in physical symptoms, psychological symptoms, and behavioural symptoms that impacts on the growth of the fi rm. The public or private sector should defi nitely concentrate in Management measures to have a healthy perpetual life in terms of both individual and organisation.
REVIEW OF LITERATURE
1. WarraichUsman Ali, Ahmed RizwanRaheem, Ahmad Nawaz, and KhosoImamuddin, (2014) the authors conducted an empirical study of the employees of private sector universities of Karachi, to fi nd out the factorscausing stress among employees, it impacts on the job performance and the result found affi rms that work load, role confl ict and inadequate monetary rewards are the main causes of stress which reduces the work performance.
2. GeetaKumari and K.M.Pandey, (2011), In an innovative research the researcher intended to conduct a case study of Avatar Steel Industries and found that much of stress at work is caused not only by work overload and time pressure but also by lack of rewards and praise, lack of autonomy in work, dissatisfaction in the grievance handling procedure. The author suggests the organisation to enhance the psychological well-being and health of the employees, to ensure both increase in revenue and retention of employees.
3. Neha Sharma, Surender Kumar Gupta, (2014), in an innovative research the author intended
D.B. Jain College
22
to study the work stress and its impact on employee’s performance in IT sector and found that work pressure, uncared by the organisation, feelings of being underutilized, employees disliking to work for organisation, dissatisfaction with the work environment as their major fi ndings.
4. T.Gopi and K.Saidireddy, (2015), in an innovative research the author intended to study the causes, stress management strategies, and to suggest some strategies. The researcher found that majority of the employees face severe stress-related ailments and lot of psychological problems which impacts in positive sense as excitement and stimulus to achievement, and in negative sense it seriously impair the quality of work life, reduction in personal and job effectiveness. They suggest that it is important and useful to invest in mental and physical health promotion.
5. Usman Bashir, Muhammad Ismail Ramay, (2010), in an innovative research the researchers examines the relationship between job stress and job performance on Bank Employees in Pakistan found that employees do their job regularly but due to workloads and time constraints their performance gets reduced.
6. Harish Shukla and RachitaGarg, (2013) in an innovative research the researcher intended to study the causes, effects, effects on productivity, effects on health of employees, effects of overload of stress and its interventional strategies among bank employees and the ways used by the employees to overcome the stress generated at workplace. The researcher found that majority of employees faces stress due to overload in work, non-achievement of target, obey boss order by sacrifi cing important domestic function, family related problems and confl ict among employees.They also suggest that free from fear generating quality of performance and positive steps to make the employees feel free from stress as the measures to overcome stress.
7. RajendranJayashree, (2010) in an innovative research the author intended to investigate and compare the level of stress and its attributes experienced by employees of Nationalised Banks. The author found that both professional and personal reasons, overburden of work load, work life imbalance, and the importance of interventional strategies is felt more at organisational level.
8. Amit Gupta and Rajesh Chandwani, (2009) in a study the job stress and performance found that external factors like organisation and work-family confl ict and other internal factors are responsible for job stress. The researcher also mentioned that where there is high emotional involvement the occupations are certain to be more stressful.
9. RamezanJahanian, Seyyed Mohammad Tabatabaei,BehnazBehdad, (2012), in a study of stress management in the workplace found that managers, staff and client will have the special psychological moods which directly refl ects in activities and productivity of the organisation. The author suggests that by training managers and personnel effectively the organisations can prevent the negative stress.
10. C. Mahadeva Murthy, Veena K.P, (2014), studied the pros and cons of stress on employees and examined the causes, problems, stress management measures among employees and offer suggestions. The researchers found that majority of the employees face severe stress and psychological problems and stress rise in banking sector is especially due to work pressure and work life imbalance and they suggest that the organisations should encourage taking up roles that help them to support both work and family.
RESEARCH GAPS
Many national and international reviews addressed the causes and effectives of stress but they did not address the issue of relating stress management with individual performance of the employees and
D.B. Jain College
23
organizational performance. Nevertheless the international studies argued the individual coping strategies and effectiveness but did not highlight organizational stress management and their effectiveness. These lacunae made the researcherto attempt innovative approach towards organizational and individual performance and their overall effectiveness.
OBJECTIVES
1. To analyse the factors causing stress among the employees in the study domain.2. To measure the infl uence of stress management practices on the performance of individual employees and organisation. HYPOTHESIS
1. The factors causing stress do not differ signifi cantly.2. There is no signifi cant difference in impact of stress management on theperformance of individual employees and organization.METHODOLOGY
The study is based on both primary as well as secondary data. The primary data is obtained through a structured questionnaire obtained from public sector employees. The questionnaire consists of demographic profi les, causes of stress and impact of stress. The responses are ascertained through Likert’s fi ve point scale which ranges from strongly agree to strongly disagree.
The researcher used convenience sampling method to obtain the responses from public sector employees. 200 responses are collected from various designations of employees within the geographic base of Chennai city.
DATA ANALYSIS
The Primary Data obtained from the Public sector employees is systematically tabulated and analysed using both uni-variate and multi-variate statistical techniques in particular Factor analysis, Linear multiple regression analysis, f-test and t-test are subsequently used to measure the impact of stress.
ANALYSIS AND DISCUSSION.
IMPACT OF STRESS INFLUENCERS ON THE INDIVIDUAL PERFORMANCE.
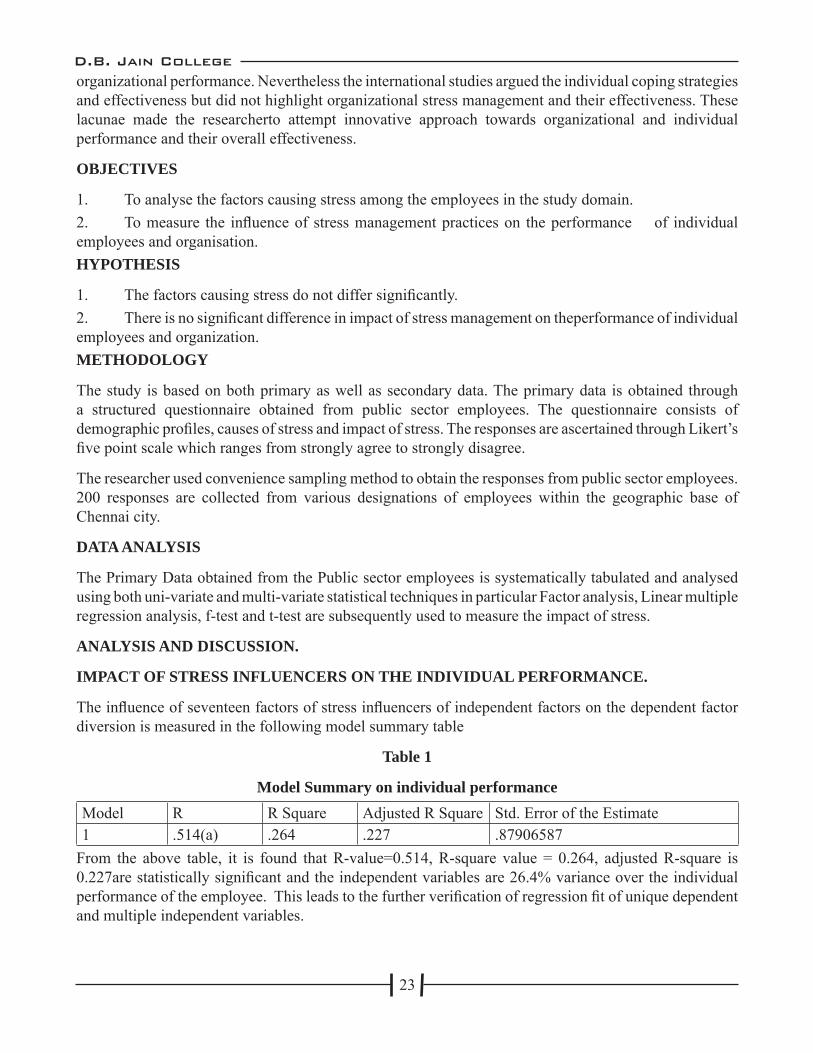
The infl uence of seventeen factors of stress infl uencers of independent factors on the dependent factor diversion is measured in the following model summary table
Table 1
Model Summary on individual performanceModel R R Square Adjusted R Square Std. Error of the Estimate1 .514(a) .264 .227 .87906587
From the above table, it is found that R-value=0.514, R-square value = 0.264, adjusted R-square is 0.227are statistically signifi cant and the independent variables are 26.4% variance over the individual performance of the employee. This leads to the further verifi cation of regression fi t of unique dependent and multiple independent variables.
D.B. Jain College
24
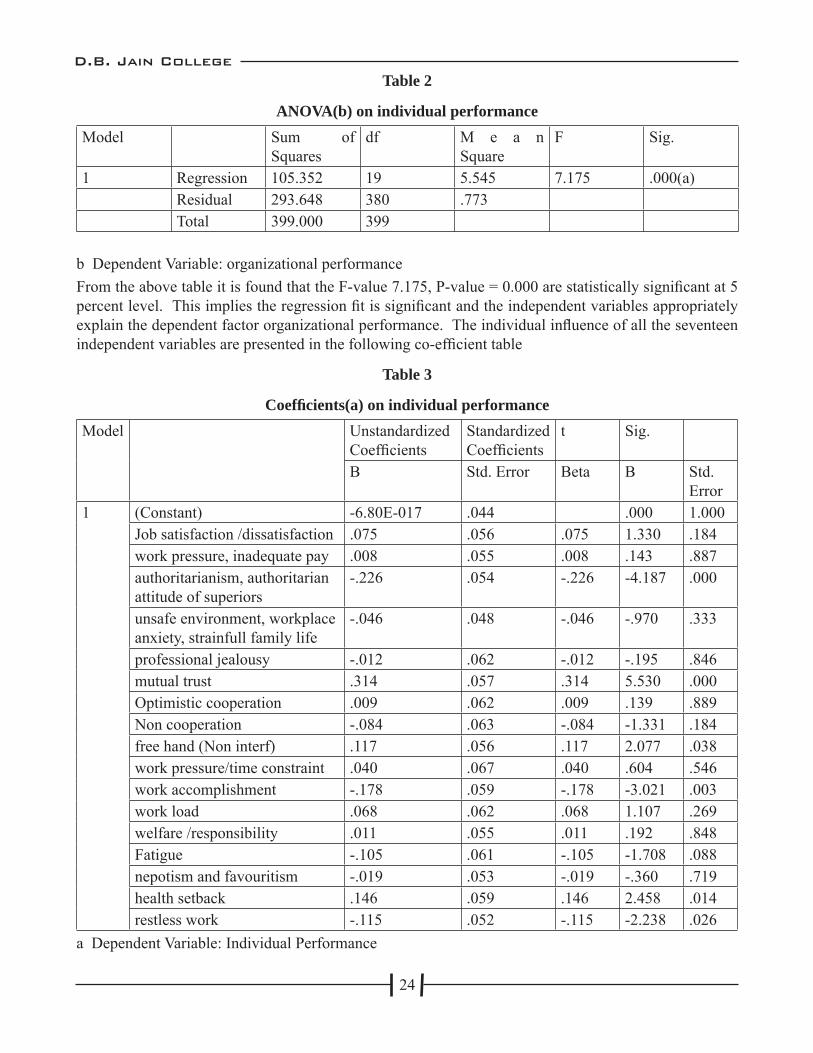
Table 2
ANOVA(b) on individual performanceModel Sum of
Squaresdf M e a n
SquareF Sig.
1 Regression 105.352 19 5.545 7.175 .000(a)Residual 293.648 380 .773Total 399.000 399
b Dependent Variable: organizational performanceFrom the above table it is found that the F-value 7.175, P-value = 0.000 are statistically signifi cant at 5 percent level. This implies the regression fi t is signifi cant and the independent variables appropriately explain the dependent factor organizational performance. The individual infl uence of all the seventeen independent variables are presented in the following co-effi cient table
Table 3
Coeffi cients(a) on individual performanceModel Unstandardized
Coeffi cientsStandardized Coeffi cients
t Sig.
B Std. Error Beta B Std. Error
1 (Constant) -6.80E-017 .044 .000 1.000Job satisfaction /dissatisfaction .075 .056 .075 1.330 .184work pressure, inadequate pay .008 .055 .008 .143 .887authoritarianism, authoritarian attitude of superiors
-.226 .054 -.226 -4.187 .000
unsafe environment, workplace anxiety, strainfull family life
-.046 .048 -.046 -.970 .333
professional jealousy -.012 .062 -.012 -.195 .846mutual trust .314 .057 .314 5.530 .000Optimistic cooperation .009 .062 .009 .139 .889Non cooperation -.084 .063 -.084 -1.331 .184free hand (Non interf) .117 .056 .117 2.077 .038work pressure/time constraint .040 .067 .040 .604 .546work accomplishment -.178 .059 -.178 -3.021 .003work load .068 .062 .068 1.107 .269welfare /responsibility .011 .055 .011 .192 .848Fatigue -.105 .061 -.105 -1.708 .088nepotism and favouritism -.019 .053 -.019 -.360 .719health setback .146 .059 .146 2.458 .014restless work -.115 .052 -.115 -2.238 .026
a Dependent Variable: Individual Performance
D.B. Jain College
25
From the above table it is found that authoritarianism, authoritarian attitude of superiors (t=-4.187, p=0.000), mutual trust (t=5.530, p=0.000), free hand (t=2.077, p=0.038), work accomplishment (t=-3.021, p=0.003) health setback (t=2.458, p=0.014), restless work (t=-2.238, p=0.026) are signifi cant towards individual performance. Therefore authoritarian attitude of superiors is the main cause expressed by the employees that creates stress in their job and makes them adopt the strategies to increase their individual performance
IMPACT OF STRESS INFLUENCERS ON THE FACTORS OF ORGANIZATIONAL PERFORMANCE.
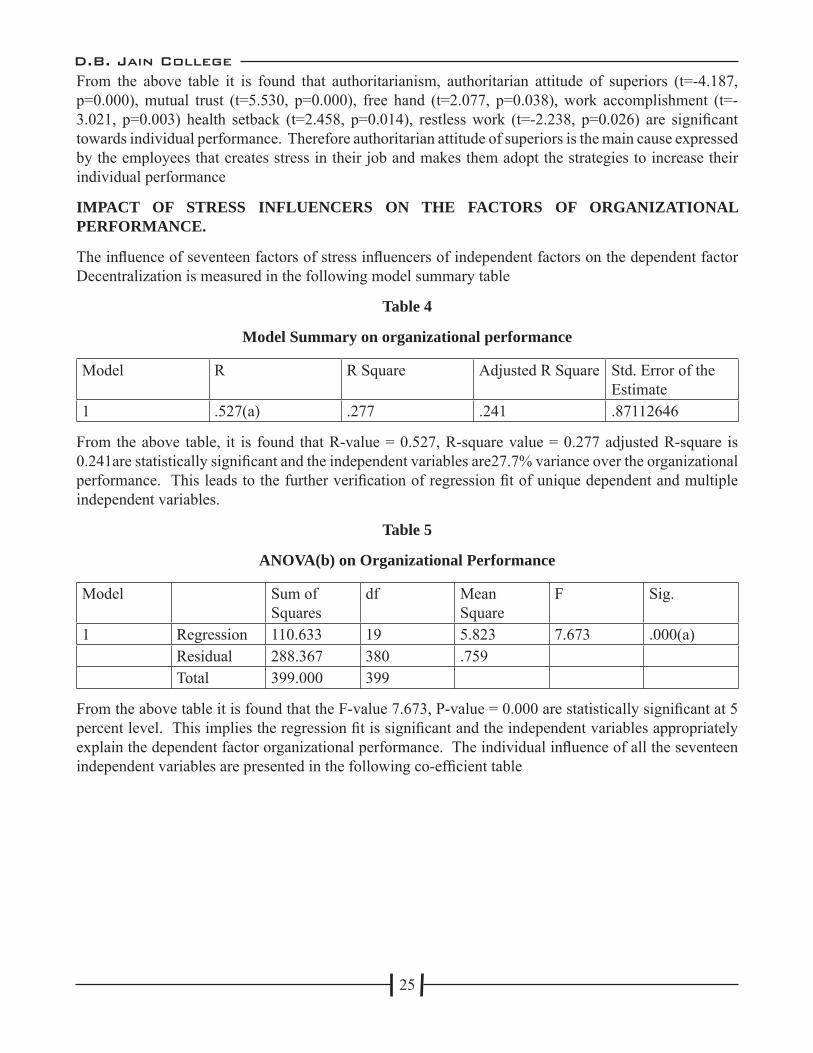
The infl uence of seventeen factors of stress infl uencers of independent factors on the dependent factor Decentralization is measured in the following model summary table
Table 4
Model Summary on organizational performance
Model R R Square Adjusted R Square Std. Error of the Estimate
1 .527(a) .277 .241 .87112646
From the above table, it is found that R-value = 0.527, R-square value = 0.277 adjusted R-square is 0.241are statistically signifi cant and the independent variables are27.7% variance over the organizational performance. This leads to the further verifi cation of regression fi t of unique dependent and multiple independent variables.
Table 5
ANOVA(b) on Organizational Performance
Model Sum of Squares
df Mean Square
F Sig.
1 Regression 110.633 19 5.823 7.673 .000(a)Residual 288.367 380 .759Total 399.000 399
From the above table it is found that the F-value 7.673, P-value = 0.000 are statistically signifi cant at 5 percent level. This implies the regression fi t is signifi cant and the independent variables appropriately explain the dependent factor organizational performance. The individual infl uence of all the seventeen independent variables are presented in the following co-effi cient table
D.B. Jain College
26
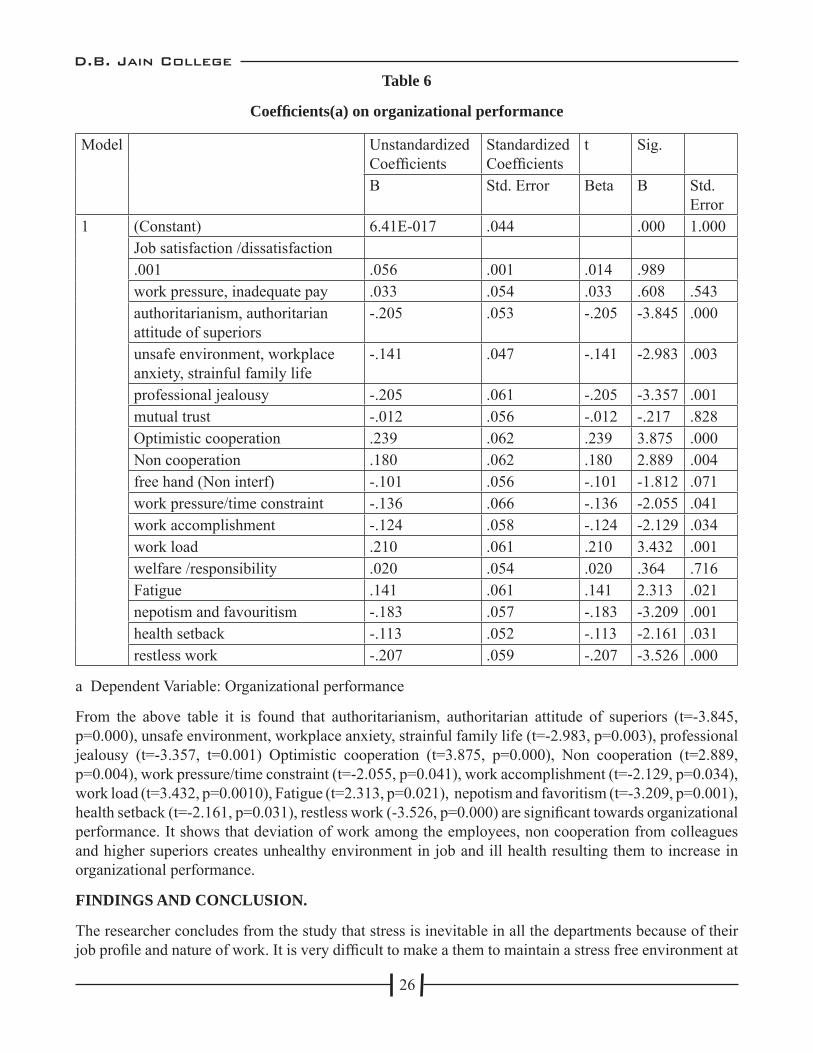
Table 6
Coeffi cients(a) on organizational performance
Model Unstandardized Coeffi cients
Standardized Coeffi cients
t Sig.
B Std. Error Beta B Std. Error
1
(Constant) 6.41E-017 .044 .000 1.000Job satisfaction /dissatisfaction.001 .056 .001 .014 .989work pressure, inadequate pay .033 .054 .033 .608 .543authoritarianism, authoritarian attitude of superiors
-.205 .053 -.205 -3.845 .000
unsafe environment, workplace anxiety, strainful family life
-.141 .047 -.141 -2.983 .003
professional jealousy -.205 .061 -.205 -3.357 .001mutual trust -.012 .056 -.012 -.217 .828Optimistic cooperation .239 .062 .239 3.875 .000Non cooperation .180 .062 .180 2.889 .004free hand (Non interf) -.101 .056 -.101 -1.812 .071work pressure/time constraint -.136 .066 -.136 -2.055 .041work accomplishment -.124 .058 -.124 -2.129 .034work load .210 .061 .210 3.432 .001welfare /responsibility .020 .054 .020 .364 .716Fatigue .141 .061 .141 2.313 .021nepotism and favouritism -.183 .057 -.183 -3.209 .001health setback -.113 .052 -.113 -2.161 .031restless work -.207 .059 -.207 -3.526 .000
a Dependent Variable: Organizational performance
From the above table it is found that authoritarianism, authoritarian attitude of superiors (t=-3.845, p=0.000), unsafe environment, workplace anxiety, strainful family life (t=-2.983, p=0.003), professional jealousy (t=-3.357, t=0.001) Optimistic cooperation (t=3.875, p=0.000), Non cooperation (t=2.889, p=0.004), work pressure/time constraint (t=-2.055, p=0.041), work accomplishment (t=-2.129, p=0.034), work load (t=3.432, p=0.0010), Fatigue (t=2.313, p=0.021), nepotism and favoritism (t=-3.209, p=0.001), health setback (t=-2.161, p=0.031), restless work (-3.526, p=0.000) are signifi cant towards organizational performance. It shows that deviation of work among the employees, non cooperation from colleagues and higher superiors creates unhealthy environment in job and ill health resulting them to increase in organizational performance.
FINDINGS AND CONCLUSION.
The researcher concludes from the study that stress is inevitable in all the departments because of their job profi le and nature of work. It is very diffi cult to make a them to maintain a stress free environment at

D.B. Jain College
27
work place, but few steps can be taken to reduce stress among the employees.
Stress- free work zone is the key factor of creating a stress-free environment among the employees is setting clear expectations, having a regular and consistent reward and recognition programme, emphasizing on training and employees development, creating a transparent and open work culture with clear channels of communication. This adds up in creating a work environment that is secure and minimizes stress in employees.
Training in job provided to the employees regularly increases the knowledge and skills of the employees for particular job in which they are recruited as the major outcome of training is learning of new habits, refi ned skills, and useful knowledge that helps him improve performance and prevent stress.
REFERENCES
1. Amit Gupta and Rajesh Chandwani, (2009), “Job Stress and Performance”, Tejas@IIMB an IIMB Management Review initiative, www.tejas.iimb.ac.in/articles/24.php
2. C. Mahadeva Murthy, Veena K.P, (2014), “Pros and Cons of Stress on Canara Bank Employees in Mysore City”, International Journal of Business and Administration Research Review, vol.3, no.5, pp.no:75-82.
3. GeetaKumari and K.M.Pandey, (2011), “Studies on Stress Management: A Case Study of Avatar Steel Industries, Chennai, India”, International Journal of Innovation Management and Technology, Vol.2, No.5, pp.no:360-367.
4. Harish Shukla and RachitaGarg, (2013), “A Study on Stress Management among the Employees of Nationalised Banks”, Stress Management Voice of Research, Vol.2, Issue 3, pp.no: 72-75.
5. MonideepaTarafdar, QiangTu, Bhanu S. Ragu-Nathan and T. S. Ragu-Nathan, (2013), “The Impact of Technostress on Role stress and Productivity”, Journal of Management Information System, vol.24, no.1, pp.no:301-328.
6. Neha Sharma, Surender Kumar Gupta, (2014), “Work Stress and its Impact on Employees Performance”, International Journal of Research in IT and Management, Vol.4, No.6, pg.no. 29-38.
7. RajendranJayashree, (2010) “Stress Management with special reference to Public Sector Bank Employees in Chennai”, International Journal of Enterprise and Innovation Management Studies, Vol.1, No.3, pp.no:34-39.www.ijcns.com/pdf/34-39.pdf
8. RamezanJahanian, Seyyed Mohammad Tabatabaei,BehnazBehdad, (2012), “Stress Management in the Workplace”, International Journal of Academic Research in Economics and Management Sciences”, vol.1, no.6, pp.no:1-9.
9. Syed MubasherHussainNaqvi, MuhammadAsif Khan, AftabQadir Kant, Shabana Nawaz Khan, (2013), “Job stress and Employee’s Productivity: Case of Azad Kashmir Public Health Sector”, Interdisciplinary Journal of Contemporary Research in Business, vol.5, no.3, pp.no:525-542.
10. T.Gopi and K.Saidireddy, (2015), “Occupational Stress its an Impacts and Strategies-A Study”, Asian Journal of Research in Business Economics and Management, Vol.5, No.2, pp.55-63.

D.B. Jain College
28
11. Usman Bashir, Muhammad Ismail Ramay, (2010), “Impact of Stress on Employees Job Performance A Study on Banking Sector of Pakistani”, International Journal of Marketing Studies”, Vol.2, No.1, pp.no:122-126.
12. WarraichUsman Ali, Ahmed RizwanRaheem, Ahmad Nawaz, and KhosoImamuddin, (2014), “Impact of stress on Job Performance : An Empirical study of the Employees of Private sector Universities of Karachi, Pakistan”, Research Journal of Management Sciences, International ScienceCongress Association, Vol.3(7), Pg.No.14-17.

D.B. Jain College
29
INVESTORS’ RISK BEHAVIOR TOWARDS SHARE MARKET INVESTMENT- A STUDY WITH REFERENCE TO CHENNAI CITY
M.R.Hemamalini Ph.D. Research Scholar (Part Time),Pachaiyappa’s college for men, Kanchipuram.
INTRODUCTION
Stock Market is the nerve centre of investment sectors in any country. It immense platform to integrate the buyers and sellers to purchase and sell towards Share, Bonds, Debentures etc. Parallely, the investors were rapidly increased, due to the high return of attraction on investment. So they were actively participated in stock market investments.
In Practice, Investors preference to be on the safe side on their investment with good returns. The main attraction for high return in stock market were,
High Return (in case of dividend)
Easy available of Liquid assets
Micro Level Investments in Business activities.
The above said factor which illuminate the investors to maximize their returns. But the investor’s has to keep on their mind about the risk perception towards investments.
Risk refers to “the expected return which cannot be predicted” (or) “possibility the actual return may differ from the expected outcome”.
SOURCES OF RISK
In General, each and every investor is associated with risk tolerance, while investing in the Stock markets. So therefore, an ample of questions is raised like, (how to invest and were to invest) to the investors towards risk. Before investing in the stock market the investor has to fi nd the various sources of risk factors in the stock markets.
The Source of Risk araise due to the following factors like,
• Lack of awareness in Finance Markets
• Interest rate fl uctuation in Stock Markets
• Basic factors like Economic, Social and political cause in the country.
• Lack of security and trustworthy in fi nancial institutions, which impact on high risk towards investment purpose.
The above listed point which highlighted about the source of risk. So every investor has to understand the risk tolerance before investing in the stock market. Based on the demographical factors, the investors accelerate the investment decisions. Here the decision making plays a vital role on this investment process, due to investment are subject to market risk. Subsequently the investors should be very cautious while investing.
D.B. Jain College
30
REVIEW OF LITERATURE
The researcher is interested to reivew the previous research works on Risk Perception of Investors with reference to Stock Market Investors, both national and international review are in their Chronological Order.
Rajarajan, (2002), In his study it was found that the relationship between demographical factors of the investors, and their risk capacity.
Rajarajan, (2003), This study explains about the portfolio choice of the individual investors. Expected return from a particular investment and risk tolerance had positive relationship with the invested investors. Maintaining focus on control is the inverse relationship between choices of the investors.
Bose, Suchistma (2006), It denotes that derivative products helps towards economic aspects like, risk away from the investors. Derivative helps in price fl uctuation in stock markets. Parallely it denotes their disadvantage (threat) towards risk in stock market and the overall economical problems.
Gigerenzer (2006), He denotes that, emotion and risk perception may affect behavioral changes in the stock markets.
Sen Shankar Sorn and Gosh Santanu Kumar (2006), Here the study deals with the relationship between stock market liquidity and sudden changes in risk factors. It has been identifi ed that, there is a negative relationship between risk and stock market liquidity. The fi nal statement revealed that with regard to turnover, there is no relationship between the liquidity and trading activity.
Zen, (2006), It refers to, small investors and professional investors are mainly depend on getting the information through public disclosure and various channels. This lead to a huge information gap and risk perception is raised in the stock market.
Al-Ajmi (2008) Bahrain, The study explains that decline towards risk tolerance in order to fi nancial commitment towards individual retirement stage.
Ajmi Jy.A. (2008) This study refers to, men are less risk averse than women, less educated investors are less likely to take risk and demographical factor is also important in risk tolerance and also investors are more risk tolerance than the less wealthy investors.
Kabra.et.al (2010), The study undertaken that, the factors infl uence towards risk tolerance and decision making process on the basis of age and gender of the investors.
Shanmnga Sundaram V (2011), Here the study explains that, perception and but behavior are infl uenced by psychological and behavioral factors in the stock market. This intends to sudden change in stock market fl uctuations, decline in stock indices and lack of confi dence towards investments. Risk denotes a major cause on this context.
GAPS IN LITERATURE
National and International literature pertaining to risk involved in investment did not address the factors causing risk, impact of risk and the effectiveness of risk. Secondly many researchers study the specifi c demographics directly correlated the risk perception of the investors. But the present study intended to investigate the infl uence of demographics of all the factors of perception.

D.B. Jain College
31
OBJECTIVE OF THE STUDY
The Main objective of their research article is to identify the perception of investors towards risk in their investment.
The following objectives are framed for the presence study.
To study the factors directly related to risk in the investment in stock market.
To classify the risk perceptual difference among the stock market investors.
To fi nd the infl uence of demographical variable on the risk perception of stock market investors.
HYPOTHESIS
The stock market investors do not differ in their perception.
There is no signifi cance infl uence of demographic variables on the risk perception of stock market investors.
RESEARCH METHODLOGY
A study is based on both Primary and Secondary data. The researcher collected primary data through a structured questionnaire. The questionnaire consists of two parts. In that, the fi rst part completely deals with demographic variables and the second part comprises of statements in likerts 5.scale. The secondary data is collected from websites, articles, news papers and magazine.
The primary data is collected from 500 respondents through convenient sampling method. The collected sample in subject to reliability test through Cronbach Alfa Method. It is found that the reliability co-effi cient is above 0.75. It shows the questionnaire is reliable, and 200 responses can be taken as a probability sampling. This paves the way to use Univariate and Multivariate statistical technique. Therefore the researcher used factor analysis, cluster analysis and analysis of variants to analyze the primary data.
ANALYSIS AND INTERPRETATION
THE INVESTEMENT PORTFOLIO PROFILE OF INVESTORS:
The variables of risk employ percentage analysis to determine the various options available to investors. The results are enumerated as follows. Investment Leverage of Investors:
An effort was made to identify if the investors were prepared to invest in a way where they could possibly lose more than the amount they initially invested. This was done basically to identify the extent of leverage exerted by the investors.
TABLE 1Investment Leverage
Variables Frequency Valid PercentYes 294 58.8No 206 41.2 Total 500 100.0
Source: Primary Data

D.B. Jain College
32
Majority of the investors i.e. 58.8% confi rmed that they were willing to take risk by making investment where they could possibly lose more than they invested.
Investment Return Scenarios’ preference:
High risk investments sometimes come with higher returns or substantial losses. The return on investment of products is unpredictable most of times. Nevertheless the extent of willingness of investor to make profi t/withstand losses can help investors’ identify suitable products. The question was designed to introspect the risk taking ability of investor, than to quantify the percentage of profi t/loss that an investor is willing to accept.
TABLE .2Investment Return Scenarios
Variables Frequency Valid PercentBetween a loss of 2% and a gain of 13% 162 32.4Between a loss of 26% and a gain of 46% 91 18.2Between a loss of 12% and a gain of 28% 87 17.4Between a loss of 50% and a gain of 100% 160 32.0
Source: Primary DataSignifi cantly, there were a near-equal number of investors falling under two opposite ends of the investment spectrum. An investor willing to accept a “Loss of 2% and a gain of 13%” is more seen as a conservative investor, as he is concerned more about keeping the losses to the minimum. In the study, 32.4% of the investors were under this category. On the other hand, an investor willing to accept a “Loss of 50% and a gain of 100%” is an aggressive investor as he risks losing even 50% of his investment. In the study, 32% of the investors fell under this category.
Risk reward perspective of Investors:
Risk and reward are often directly proportional, and they are the major driving factor with any investment decisions. It is not uncommon to fi nd an investor with a greater risk appetite and thereby greater reward expectations, as to fi nd an investor with lower risk and lower reward expectation. Both ends exist and this market dynamics determine the success of investment products, to some extent.
TABLE .3Risk Reward Perspective
Variables Frequency Valid PercentHigh Risk and greater reward 237 47.4Low Risk and Moderate Reward 222 44.4Moderate Risk and Low performance level
226 45.2
No Risk and Low return 255 51.0 Source: Primary DataInstead of investors identifying and fi tting themselves into any of the available Risk-reward combination, it appeared better to allow the investors to rank the risk-reward combination in their order of preference. Nearly 51% of the respondents were towards a portfolio which offered “No Risk and Low return”, not to

D.B. Jain College
33
forget the fact that 47.4% of respondents preferred a portfolio with “High Risk and Greater reward”.
Investment Portfolio Assets of Investors:
Any portfolio would be a combination of different class of assets each of which could be risky or risk-free. The Risk nature of the assets that constitute the portfolio, could defi ne the nature of investors. The High risk investments could include investments in shares, stocks, equity. The Low risk investments could include Fixed deposits, Postal investment products etc, as the returns are promised and are not market-driven.
The same approach of allowing the investors to rank the risk nature of assets in their order of preference rather than fi tting themselves to any of the class was followed here. A signifi cant chunk (54%) of the investors admitted that they prefer an investment portfolio with ‘Most High Risk Investments’.
TABLE 4
Investment Portfolio Assets
Variables Frequency Valid PercentSome High Risk Investment 207 41.4Most Low Risk Investment 258 51.6Most High Risk Investment 270 54.0Some Medium Risk Investment 223 44.4
Source: Primary Data
An almost equal proportion (51.6%) admitted their preference to portfolio consisting of ‘Most Low Risk Investments’. This fact confi rms that respondents with different set of Risk preferences were participants of this study.
FINDINGS AND CONCLUSIONS
[A] The profi le of the overallinvestment portfolio of investors with regard to risk tolerance is summarised as follows:
Investors leverage was found to be higher. This reveals that investors are more willing to invest in risky assets.
Investors were found to be positive in their risk taking abilities.
Risk and reward are often inversely proportional, and they are the major driving factor with any investment decisions. Investors choose high risk for greater rewards.
Investors ranked the High risk investments as the oft preferred avenue for investing in fi nancial assets. In anticipation of the greater rewards that these assets would fetch, investors tolerate the risk that is inherent in risky assets. This reveals that investors are more willing to invest in risky assets.
[B] Investor’sperception on Risk tolerance presents the following results.
The considerations of risk aid investors in making the right decision. The ability to stay in the market even in risky situations develops the risk tolerance capability of investors.

D.B. Jain College
34
In the select investment portfolio, stock market investors are identifi ed to possess high tolerant capability.
Risk tolerance capability, for the other investors are considerably found to be in low profi le. The reason can be attributed to the fact that these assets are non-speculative in nature. Thereby the risk profi le for these assets also remains low.
REFERENCE
AL-Ajmi, Jasim Y. (2008). Risk Tolerance of Individual Investors in an Emerging Market. International Research Journal of Finance and Economics, 17, 1-26
Ajmi Jy. A. (2008), “Risk Tolerance of Individual Investors in an Emerging Markets”,
International Research Journal of Finance and Economics, Issue 17, pp 15-26
Bandivadekar, S. & Ghosh, S. (2003), Bose, Suchistma (2006),“Derivatives and Volatility on Indian Stock Markets”, RBI Occasional Papers, Vol. 24 (3), pp. 12-28.
Kabra, G., Mishra, Prashant K. & Dash, Manoj K. (2010), Factors Infl uencing Investment Decisions of Generations in India: An Econometric Study. Asian Journal of Management Research, 1(1), 308-328
Rajarajan,V. (2002). Investor’s Demographic and Risk Bearing Capacity. Finance India, 17(2), 565-576.
Rajarajan, V. (2003). Determinants of Portfolio Choice of Individual Investors. The Indian Economic Journal, 50(1).
Shanmngasundaram V, The impact of behavioral bias of investors in Capital market, South Asia Journal of Socio Political Studies, SAJOSPS, Vol.10, No1, pp.99-102

D.B. Jain College
35
REASONS FOR BRAND SHIFT OF SMARTPHONE CUSTOMERS-A STUDY WITH REFERENCE TO CHENNAI CITY
MAYA.ELIZABETH.AUGUSTINE DR.B.SUDHA Research Scholar, Research Supervisor & Associate Professor,Dept of Commerce, Professor ,Dept. of Commerce, Anna Adarsh College for Women, Anna Adarsh College for Women, Anna Nagar, Chennai-40. Anna Nagar, Chennai-40.
Indian smart market has grown tremendously for the past ten years .India has reached coveted position of the second largest smart handset market in the world after China and it is expected to become even bigger with 208.4 million phones being shipped by 2016.The Indian smart handset market is fi nally getting competitive with a multitude of player coming up with their product which infl uences the replacement of the previous handsets. The smart market is with full of offers and packages and the customers are overwhelmed with competing choices. Consumers switching behavior or the replacement attitude have created a competitive market share for the manufacturers of the smart handset. Now- a- days especially for the college students the smart handsets has become the semi durables that are used over short periods and are periodically replaced .The researcher has found useful to study and examine the role of relationship between individuals and their switching behavior towards smart handsets which gains corporate race.
1.1 REVIEW OF LITERATURE
Loyal customers spread positive word of mouth across and add to the company’s brand building exercise. Moreover, acquiring a new customer is fi ve times costlier than retaining an old customer (Peters, 1980).It is found that continuing customers increase their spending at an increasing rate and help the company achieve increasing operating effi ciencies ( Reichheld and Sasser 1990).Marketers should know that retaining existing customers is crucial than acquiring new customers (Berry, 190)Brand name (Aaker, 1996), price (Cadogan & Foster, 2000), promotion ( Czerniawski & Maloney 1999), and service quality are the factors stimulate brand loyalty. Brand switching in clothing purchases is likely to be driven by factors other than ‘the need for variety (Michaelidou,et.al.2005).Customer switching in banking industry is found to be related to perception of service quality (Rust and Zahorik, 1993).In insurance industry, overall dissatisfaction of the insured (Crossby and Stephen 1987) is found to be the reason for switching. Retail stores loose their customers due to service encounter failures (Kelly, Hoffman and Davis,1993). A weaker brand image usually correlates with low degree of brand loyalty and that brand choice is affected by past experience (Chinho lan, et.al.). Customers reason for switching services were classifi ed into eight general categoring pricing, inconvenience, core service failure , service encounter failure, response to service failure competition, ethical problem and involuntary switching (Susan M.Keaveney, 1995). Customer switching is industry specifi c, limits the generalization and need to adopt broader perspective (Berry and Parasuraman 1993).Change in price ,customer needs , service failure , inconvenience and voluntary reasons are the factors infl uencing the smart customers to switch (Mallikarjua, KrishnaMohan 2010). The difference between the genders and their perception appear to refl ect something of a decreasing trend amidst this new generation of technology adopters (Mayak Vinodbhai Bhatt 2008)Consumers of less popular brands are more loyal than others in most of the products. Market players has to ensure the attributes for their product to increase the loyalty among consumers (S.K Sinha, Ajay Wagh 2008).
1.2 RESEARCH GAPS
After reviewing the literature pertaining to brand switching and loyalty, researcher identifi ed the predominant lacunae regarding the relation between brand switching and customer loyalty towards smart
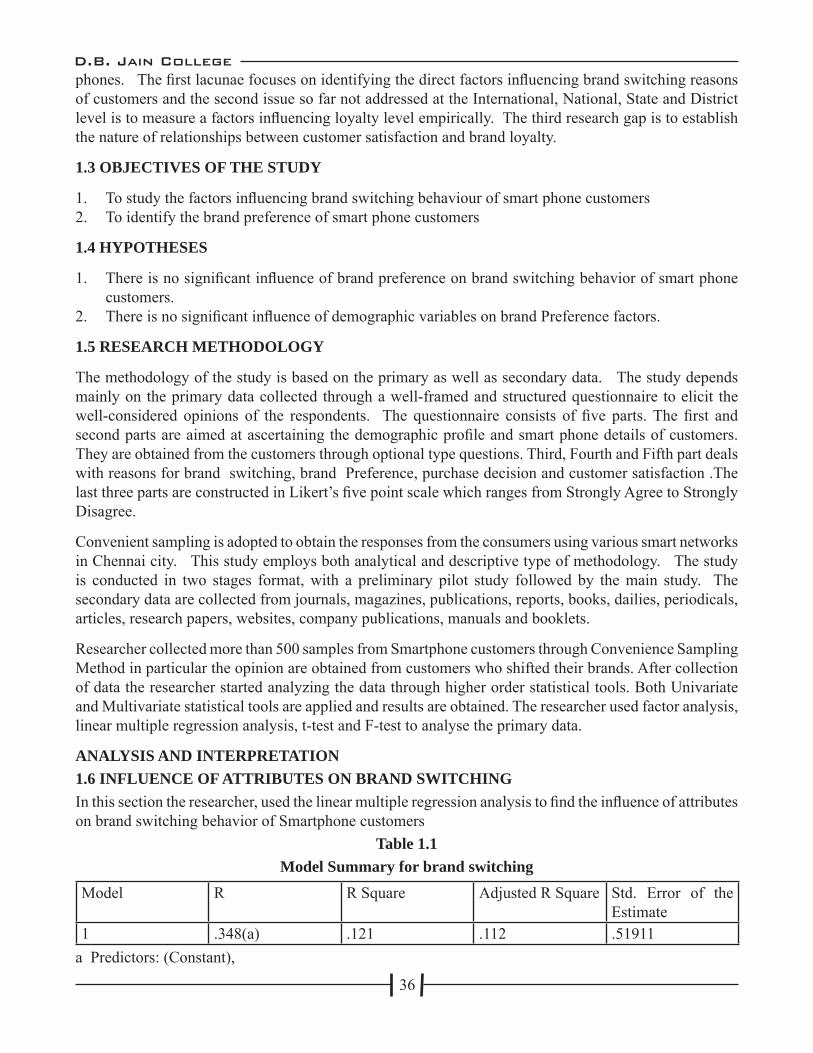
D.B. Jain College
36
phones. The fi rst lacunae focuses on identifying the direct factors infl uencing brand switching reasons of customers and the second issue so far not addressed at the International, National, State and District level is to measure a factors infl uencing loyalty level empirically. The third research gap is to establish the nature of relationships between customer satisfaction and brand loyalty.
1.3 OBJECTIVES OF THE STUDY
1. To study the factors infl uencing brand switching behaviour of smart phone customers2. To identify the brand preference of smart phone customers
1.4 HYPOTHESES
1. There is no signifi cant infl uence of brand preference on brand switching behavior of smart phone customers.
2. There is no signifi cant infl uence of demographic variables on brand Preference factors.
1.5 RESEARCH METHODOLOGY
The methodology of the study is based on the primary as well as secondary data. The study depends mainly on the primary data collected through a well-framed and structured questionnaire to elicit the well-considered opinions of the respondents. The questionnaire consists of fi ve parts. The fi rst and second parts are aimed at ascertaining the demographic profi le and smart phone details of customers. They are obtained from the customers through optional type questions. Third, Fourth and Fifth part deals with reasons for brand switching, brand Preference, purchase decision and customer satisfaction .The last three parts are constructed in Likert’s fi ve point scale which ranges from Strongly Agree to Strongly Disagree.
Convenient sampling is adopted to obtain the responses from the consumers using various smart networks in Chennai city. This study employs both analytical and descriptive type of methodology. The study is conducted in two stages format, with a preliminary pilot study followed by the main study. The secondary data are collected from journals, magazines, publications, reports, books, dailies, periodicals, articles, research papers, websites, company publications, manuals and booklets.
Researcher collected more than 500 samples from Smartphone customers through Convenience Sampling Method in particular the opinion are obtained from customers who shifted their brands. After collection of data the researcher started analyzing the data through higher order statistical tools. Both Univariate and Multivariate statistical tools are applied and results are obtained. The researcher used factor analysis, linear multiple regression analysis, t-test and F-test to analyse the primary data.
ANALYSIS AND INTERPRETATION1.6 INFLUENCE OF ATTRIBUTES ON BRAND SWITCHING In this section the researcher, used the linear multiple regression analysis to fi nd the infl uence of attributes on brand switching behavior of Smartphone customers
Table 1.1Model Summary for brand switching
Model R R Square Adjusted R Square Std. Error of the Estimate
1 .348(a) .121 .112 .51911a Predictors: (Constant),

D.B. Jain College
37
From the above table it is found that R=0.348, R square =0.121. This implies that product attributes of Smart Phones create 12.1% variance over the Brand Switching of Smart Phones. The regression fi t is noticed in the following ANOVA table.
Table 1.2
ANOVA(b) for brand switching
Model Sum of Squares
df Mean Square F Sig.
1 Regression 21.858 6 3.643 13.519 .000(a)Residual 158.183 587 .269Total 180.042 593
a Predictors: (Constant), b Dependent Variable: Brand switching
From the above table it is found that F=13.519, P=0.000 are statistically signifi cant at 5% level. This implies that there is a deep relation between product attributes and Brand switching of smart Phones. The individual infl uences of these attributes are presented in the following Coeffi cient table.
Table 1.3
Coeffi cients (a) for brand switching
Model Unstandardized Coeffi cients
Standardized Coeffi cients
T Sig.
B Std. Error Beta B Std. Error1 (Constant) 2.037 .120 17.000 .000
It is very stylish and attractive
.110 .027 .198 4.021 .000
The operating systems and other applications are very convenient
.066 .030 .115 2.175 .030
The display clarity and battery backup are nice
.008 .031 .014 .272 .785
It supports all the applications available in the market
.018 .041 .035 .451 .652
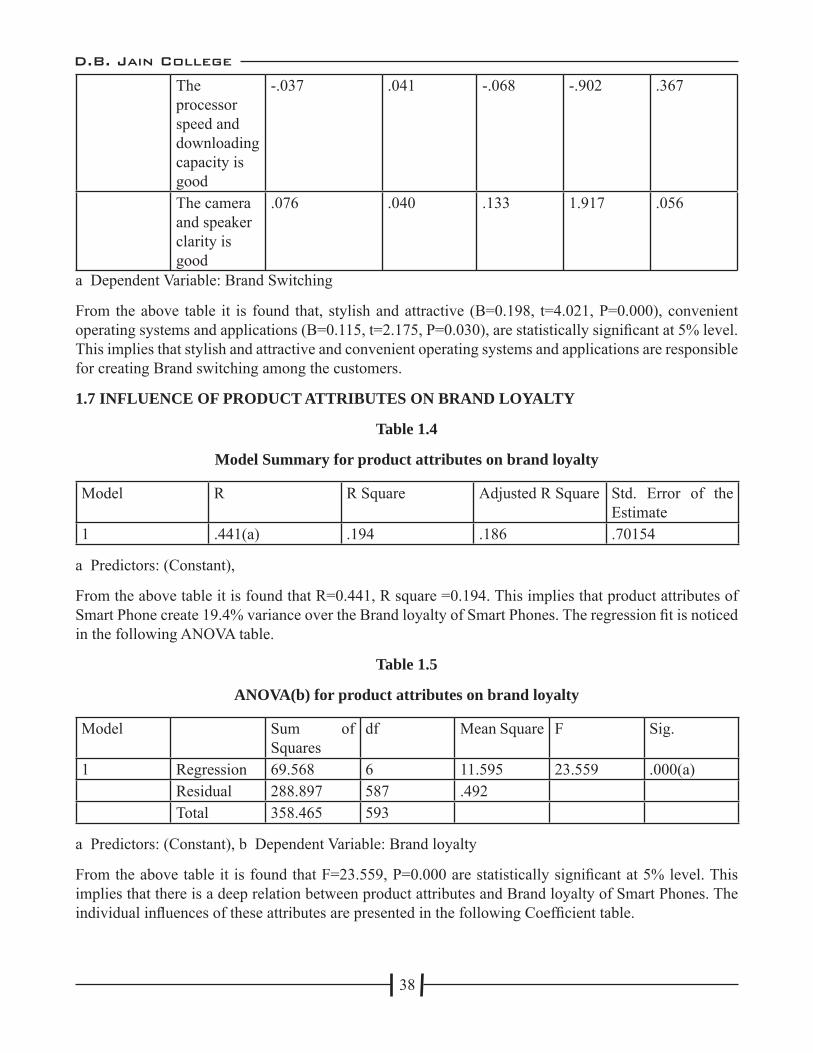
D.B. Jain College
38
The processor speed and downloading capacity is good
-.037 .041 -.068 -.902 .367
The camera and speaker clarity is good
.076 .040 .133 1.917 .056
a Dependent Variable: Brand Switching
From the above table it is found that, stylish and attractive (B=0.198, t=4.021, P=0.000), convenient operating systems and applications (B=0.115, t=2.175, P=0.030), are statistically signifi cant at 5% level. This implies that stylish and attractive and convenient operating systems and applications are responsible for creating Brand switching among the customers.
1.7 INFLUENCE OF PRODUCT ATTRIBUTES ON BRAND LOYALTY
Table 1.4
Model Summary for product attributes on brand loyalty
Model R R Square Adjusted R Square Std. Error of the Estimate
1 .441(a) .194 .186 .70154
a Predictors: (Constant),
From the above table it is found that R=0.441, R square =0.194. This implies that product attributes of Smart Phone create 19.4% variance over the Brand loyalty of Smart Phones. The regression fi t is noticed in the following ANOVA table.
Table 1.5
ANOVA(b) for product attributes on brand loyalty
Model Sum of Squares
df Mean Square F Sig.
1 Regression 69.568 6 11.595 23.559 .000(a)Residual 288.897 587 .492Total 358.465 593
a Predictors: (Constant), b Dependent Variable: Brand loyalty
From the above table it is found that F=23.559, P=0.000 are statistically signifi cant at 5% level. This implies that there is a deep relation between product attributes and Brand loyalty of Smart Phones. The individual infl uences of these attributes are presented in the following Coeffi cient table.
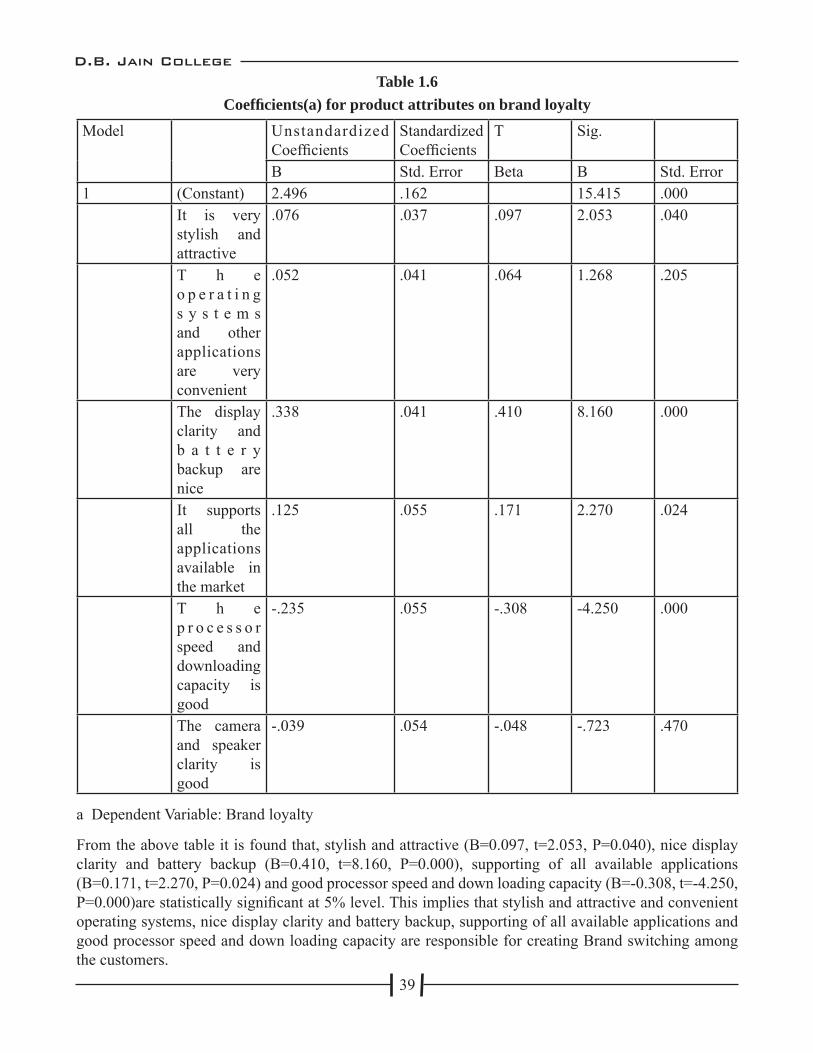
D.B. Jain College
39
Table 1.6Coeffi cients(a) for product attributes on brand loyalty
Model Unstandardized Coeffi cients
Standardized Coeffi cients
T Sig.
B Std. Error Beta B Std. Error1 (Constant) 2.496 .162 15.415 .000
It is very stylish and attractive
.076 .037 .097 2.053 .040
T h e o p e r a t i n g s y s t e m s and other applications are very convenient
.052 .041 .064 1.268 .205
The display clarity and b a t t e r y backup are nice
.338 .041 .410 8.160 .000
It supports all the applications available in the market
.125 .055 .171 2.270 .024
T h e p r o c e s s o r speed and downloading capacity is good
-.235 .055 -.308 -4.250 .000
The camera and speaker clarity is good
-.039 .054 -.048 -.723 .470
a Dependent Variable: Brand loyalty
From the above table it is found that, stylish and attractive (B=0.097, t=2.053, P=0.040), nice display clarity and battery backup (B=0.410, t=8.160, P=0.000), supporting of all available applications (B=0.171, t=2.270, P=0.024) and good processor speed and down loading capacity (B=-0.308, t=-4.250, P=0.000)are statistically signifi cant at 5% level. This implies that stylish and attractive and convenient operating systems, nice display clarity and battery backup, supporting of all available applications and good processor speed and down loading capacity are responsible for creating Brand switching among the customers.

D.B. Jain College
40
1.8 FINDINGS AND CONCLUSION
There is a relationship between the stylish and attractive and convenient operating systems and applications are responsible for creating Brand switching among the customers. There is a relationship between the stylish and attractive and convenient operating systems, nice display clarity and battery backup, supporting of all available applications and good processor speed and down loading capacity are responsible for creating Brand loyalty among the customers.
REFERENCES
1. Aaker David (1996), Building strong brands, Free Press, New York.
2. Berry Leonard L., ad Parasuraman, (1993), Building a new academic fi eld the case of services marketing, Journal of retailing 69 (sping),13-60.
3. Cadogan J.W and Foster B.D (2000). Relationship selling and customer loyalty: an empirical investigation, Marketing Intelligence and Planning, 18(4),pp.185-199.
4. Crosby, Lawrence A., Kenneth R. Evans and Deborah Cowles., (1990), Relationship quality in service selling: an interpersonal infl uence perspective, Journal of Marketing Research 24 (November), 404-411.
5. Kelly Scott W.,Douglas Hoffman and Mark A.Davis, 1993, A typology of retail failures and recoveries, Journal of Retailing 69 (Winter) 4429-452.
6. Mayan Vinodbhai Bhatt, A study of Smart Phone Usage among the post graduate students, Indian Journal of Marketing, April, 2008 13-21.
7. Mallikarjuna, Krishna Mohan, Consumer Switching Behavior an evaluation of factors affecting smart users, Indian Journal of marketing March 2010, volume 40, number 3 pg 42-49.
8. Michaelidou, Nina, Dibb,Sally & Arnott, David, 2005 Brand Switching in clothing as a manifestation of variety seeking behavior, Advances in consumer res: Asia pacifi c region 6pp 79-85, retrieved from http:// www.acrwebsite.org/volumes/display.aspid=11846,accessed 22/01/2009
9. Peters, Tom.,(1998), Thriving on Chaos, New York: Alfred A. Knopf.
10. Rust, Roland T, and Anthony J. Zahorik (1993), Customer satisfaction, customer retention, and market share, Journal of retailing 69(summer), 191-215.
D.B. Jain College
41
FINANCIAL PERFORMANCE OF PHARMACEUTICAL INDUSTRY IN INDIA: WITH REFERENCE TO SELECT INDIAN BULK DRUGS AND
FORMULATIONS COMPANIESR. SELVI Dr. V. DHEENADHAYALANDepartment Of Commerce, Assistant Professor In Commerce, Annamalai University Department Of Commerce, Annamalai University
Indian pharmaceutical industry has played a key role in promoting and sustaining development in the vital fi eld of medicines. International companies associated with this sector have stimulated, assisted and spearheaded this dynamic development in the past 58 years and helped to put India on the pharmaceutical map of the world. The private sector has been the backbone of the Indian economy, as it has acted as a strategic partner in the nation’s economic growth and development. Private sector enterprises possess strong prospects for growth because they harness new business opportunities, and at the same time expanding the scope of their current business.
STATEMENT OF PROBLEM
Financial performance means fi rm's overall fi nancial health over a given period of time. Financial performance analysis is the process of determining the operating and fi nancial characteristics of a fi rm from accounting and fi nancial statements. The goal of such analysis is to determine the effi ciency and performance of fi rm’s management, as refl ected in the fi nancial records and reports.
Through a careful analysis of its fi nancial performance, the organization can identify opportunities to improve performance of the department, unit or organizational level. In this context researcher has undertaken an analysis of fi nancial performance of pharmaceutical companies to understand how management of fi nance plays a crucial role in the growth.
OBJECTIVES OF THE STUDY
The main objective of the study is to compare the fi nancial performance of pharmaceutical companies in India. The following are the specifi c objectives of the study.
1. To study the turnover of select Indian Bulk Drugs and Formulations Pharmaceutical Companies in India
2. To analyze the profi tability of select Indian Bulk Drugs and Formulations Pharmaceutical Companies in India.
3. To examine the solvency position of select Indian Bulk Drugs and Formulations Pharmaceutical Companies in India.
4. To draw fi ndings, suggestions and conclusion.
HYPOTHESES
Keeping in view of the objectives the following hypotheses have been framed.
1. There is no signifi cance difference in the fi nancial performance of select Indian bulk drugs and formulations pharmaceuticals companies in India.
2. All the sample units of the pharmaceutical industry are equally sound with respect to fi nancial health
D.B. Jain College
42
METHODOLOGY
DATA SOURCES FOR THE PRESENT STUDY
This study is based on the secondary data from published annual reports of companies. The information related to pharmaceutical companies have been collected from various websites, magazines and from the government of India publication.
PERIOD OF THE STUDY
The present research work was carried out for the period of 12 (twelve) years from 2000-2001 to 2011-2012. The duration of the period was good enough to cover the long term fl uctuations and was enough to provide insights into the performance of the different selected companies.
SAMPLE DESIGN
As on 2009, there are 71 pharmaceutical companies in India. These comprises 14 Indian Bulk Drugs Companies, 21 Indian Formulations Companies, 10 MNCs and 26 Indian Bulk Drugs and Formulations companies. On the basis of turnover, the researcher has selected top 10 companies and found that 7 companies are coming under domestic companies belong to Bulk Drugs and Formulation companies. Since they refl ect the characteristics of both Formulation and Bulk Drugs performance, the researcher has purposefully chosen the companies by adopting purposive sampling method.
Table No: 2 Distribution of pharmaceutical companies in India
S. No Type of Company Top Ten Companies No. of Total Companies1 Pharmaceuticals –
Indian Bulk Drugs & Formulations
7 26
2 Pharmaceuticals – Indian Bulk Drugs
1 14
3 Pharmaceuticals – Indian Formulations
- 21
4 Pharmaceuticals – MNCs
2 10
Source: Corporate India, Corporate Scoreboard December 15, 2009. The fi nal sample units for the study are as under:
(1) Aurobindo Pharma (2) Cadila Health Care (3) Cipla (4) Dr.Reddys Laboratories (5) Ipca (6) Ranbaxy and (7) Sunpharma
I. FINDINGS RELATED TO TURNOVER
1. The stock turnover ratio of Ranbaxy was found high among Indian Bulk Drugs and Formulations Pharmaceutical Companies in India and the average of Ranbaxy was found high about 18.32 times with a maximum of 37.11 times in the year 2003 to a minimum of 7.41 times in the year 2010 this is due to maintaining average stock to meet the requirements of the business. This is due to maintaining average stock to meet the requirements of the business. Inventory turnover ratio is an effective tool to measure the liquidity of Inventory and thereby to avoid any danger of overstocking as a prelude to the effi cient utilization of a fi rms resources and high inventory turnover ratio indicates brisk sales.

D.B. Jain College
43
2. The debtors turnover ratio of Cadila Healthcare shows high among Indian Bulk Drugs and Formulations Pharmaceutical Companies in India and the average of Cadila Healthcare was found high about 6.73 times with a maximum of 9.18 times in the year 2003 to a minimum of 4.82 times in the year 2010. This ratio indicates the effi ciency of the staff entrusted with collection of book debts. The higher the ratio, the better it is, since it would indicate that debts are being collected more promptly.
3. It is evident from the creditors turnover ratio of Aurobindo Pharma was low among Indian Bulk Drugs and Formulations Pharmaceutical Companies in India and the average of Aurobindo pharma was found to be low about 5.8 times with a maximum of 20.16 times in the year 2002 and a minimum of 4.63 times in the year 2008. A higher ratio shows suppliers and creditors of the company pays its bills frequently and regularly. It also implies that new vendors will get paid back quickly. A high creditors turnover ratio can be used to negotiate favorable credit terms in the future.
4. The working capital turnover ratio of Cadila Healthcare was found satisfactory throughout the study period among Indian Bulk Drugs and Formulations Pharmaceutical Companies in India and the average of Cadila Healthcare was found to be high about 4.75 times with a maximum of 13.4 times in the year 2012 to a minimum of 2.17 times in the year 2011. A high working capital turnover ratio indicates that management is being extremely effi cient in using a fi rm's short-term assets and liabilities to support sales.
5. The result of total assets turnover ratio of IPCA was high among Indian Bulk Drugs and Formulations Pharmaceutical Companies in India and the average of IPCA was high about 1.36 times with a maximum of 1.53 times in the year 2004 to a minimum of 1.14 times in the year 2001. This ratio measures how effi ciently a fi rm uses its assets to generate sales, so a higher ratio is always more favorable. Higher total asset turnover ratio mean the company is using its assets more effi ciently. Lower ratio mean that the company isn't using its assets effi ciently and most likely have management or production problems.
6. The fi xed assets turnover ratio of Dr.Reddy’s was found high among Indian Bulk Drugs and Formulations Pharmaceutical Companies in India and the average of Dr.Reddy’s fi xed assets turnover ratio was found to be high about 3.62 times with a maximum of 5.55 times in the year 2007 to a minimum of 2.75 times in the year 2005. This ratio tells us how effectively and effi ciently a company is using its fi xed assets to generate revenues. This ratio indicates the productivity of fi xed assets in generating revenues. If a company has a high fi xed asset turnover ratio, it shows that the company is effi cient at managing its fi xed assets. Fixed assets are important because they usually represent the largest component of total assets.
7. The capital turnover ratio of IPCA was found high among Indian Bulk Drugs and Formulations Pharmaceutical Companies in India and the average of IPCA was found to be high about 1.4 times with maximum of 1.59 times in the year 2004 and a minimum of 1.14 times in the year 2001. Capital Turnover Ratio indicates the effi ciency of the organization with which the capital employed is being utilized. A high capital turnover ratio indicates the capability of the organization to achieve maximum sales with minimum amount of capital employed. Higher the capital turnover ratio better will be the situation.
FINDINGS RELATED TO PROFITABILITY
1. It is observed from the study that the return on investment ratio of Cipla was high among Indian Bulk Drugs and Formulations Pharmaceutical Companies in India and the average of return on investment in Cipla was high about 28.74 per cent with a maximum of 44.69 per cent in the year 2001 to a minimum of 20.24 per cent in the year 2011. This is due to increase in profi t before tax and interest and total assets.
D.B. Jain College
44
It indicates more wealth for the shareholders or investors of the company.
2. It was found that the gross profi t ratio of the Sunpharma was high among Indian Bulk Drugs and Formulations Pharmaceutical Companies in India and the average of gross profi t ratio was high about 54.98 per cent with a maximum of 261.56 per cent in the year 2012 to a minimum of 100.78 per cent in the year 2002. This ratio indicates the degree to which the selling price of goods per unit may decline without resulting in losses from operations to the fi rm. It also helps in ascertaining whether the average percentage of mark-up on the goods is maintained.
3. It is observed from the study that, the operating ratio of the Cipla was lower among Indian Bulk Drugs and Formulations Pharmaceutical Companies in India and the average of operating ratio was high about 31.61 per cent with a maximum of 4.38 per cent in the year 2002 to a minimum of 1.24 per cent in the year 2007. It is a measure of managements ability to keep operating expenses properly controlled for level of sales achieved.
4. The performance of operating profi t ratio of Dr.Reddy’s found to high among Indian Bulk Drugs and Formulations Pharmaceutical Companies in India and the average of operating profi t ratio of Dr.Reddy’s was high about 24.30 per cent with a maximum of 38.32 per cent in the year 2002 to a minimum of 10.54 per cent in the year 2005. This ratio is the test of the operational effi ciency with which the business is being carried. The operating ratio should be low enough to leave a portion of sales to give a fair return to the investors.
5. It is evident from the study that the expenses ratio of Cipla was low among Indian Bulk Drugs and Formulations Pharmaceutical Companies in India and the average of expenses ratio was high about 104.65 per cent with a maximum of 86.34 per cent in the year 2001 and 2002 to a minimum of 76.86 per cent in the year 2010. This ratio indicates the operational effi ciency with which the business is being carried on. It shows the percentage of net sales that is absorbed by the cost of goods sold and operating expenses.
6. The result of net profi t ratio of the Sunpharma was high among Indian Bulk Drugs and Formulations Pharmaceutical Companies in India and the average of net profi t ratio was high about 38.92 per cent in Aurobindo pharma with a maximum of 71.6 per cent in the year 2011 to a minimum of 24.10 per cent in the year 2001. This is used as a measure of overall profi tability and is useful to the owners.
7. It was found that the earnings per share of Aurobindo pharma was high among Indian Bulk Drugs and Formulations Pharmaceutical Companies in India and the average of earning per share maximum of 9.43 per cent in the year 2010 to a minimum of -0.14 per cent in the year 2012. It highlights the overall success of the concern from owner’s point of view and it is helpful in determining market price of equity share. It refl ects upon the capacity of the concern to pay dividend to its equity shareholders.
8. It is evident from the study that the selling and distribution of expenses ratio of Aurobindo Pharma was very low among Indian Bulk Drugs and Formulations Pharmaceutical Companies in India and the average of selling and distribution of expenses ratio was low about 5.32 per cent the study period with a maximum ratio was found 7.34 per cent in the year 2005 to a minimum as 3.73 per cent in the year 2003. This is due to the decrease in selling and distribution expenses.
9. The Price earnings ratio of Dr.Reddy’s was found high overall the study period among Indian Bulk Drugs and Formulations Pharmaceutical Companies in India and the average of Sunpharma was high about 29.71 per cent with a maximum ratio was found as 86.72 per cent in the year 2005 to a minimum as 9.52 per cent in the year 2007. This ratio used to measure for determining the value of a

D.B. Jain College
45
share may also be used to measure the rate of return expected by investors.
10. The result of dividend payout ratio of Ranbaxy was found good among Indian Bulk Drugs and Formulations Pharmaceutical Companies in India and the average of dividend payout ratio was high about 36.98 per cent with maximum as 149.4 per cent in the year 2005 to a minimum as -2.21 per cent in the year 2011. The payout ratio is an indications of the amount of earnings that have been ploughed back in the business. The lower the pay-out ratio, the higher will be the amount of earnings ploughed back in the business.
11. It was found that interest cover ratio of the Sunpharma was found good among Indian Bulk Drugs and Formulations Pharmaceutical Companies in India and the average of interest cover ratio was high about 885.8 per cent with a maximum of 4711 per cent in the year 2012 to a minimum of 19.77 per cent in the year 2001. Higher the ratio better is the position of long term creditors and the company’s risk is lesser.
12. It is evident from the study that the dividend yield ratio of Sunpharma was good during the study period among Indian Bulk Drugs and Formulations Pharmaceutical Companies in India and the average of dividend yield ratio was high about 4.16 per cent with a maximum ratio was found in 9.51 per cent in the year 2001 and a minimum as 0.01 per cent in the year 2009. This ratio is very signifi cant from the view point of those investors who are interested in dividend income.
II. FINDINGS RELATED TO SOLVENCY
1. Current ratio of Aurobindo Pharma was found satisfactory among Indian Bulk Drugs and Formulations Pharmaceutical Companies in India through the study period and the average of current ratio was high about 6.69 times in case of Aurobindo Pharma, it was found as maximum of 6.41 times in the year 2007 to a minimum of 1.14 times in the year 2012. Current ratio of 2:1 is considered satisfactory. The current ratio is an index of the concern’s fi nancial stability since it shows the extent of the working capital which is the amount by which the current assets exceed the current liabilities.
2. The Liquid ratio of Aurobindo Pharma was high among Indian Bulk Drugs and Formulations Pharmaceutical Companies in India and the average of liquid ratio was high about 2.98 times and with a maximum of 4.83 times in the year 2007 to a minimum of 0.68 times in the year 2012. It is the true test of business solvency. Higher ratio more than 1:1 indicates sound fi nancial position.
3. The debt equity ratio of Aurobindo Pharma was found high among Indian Bulk Drugs and Formulations Pharmaceutical Companies in India and the average of debt equity ratio of Aurobindo Pharma was high about 93.7 times and with a maximum of 170 times in the year 2012 to a minimum of 25.1 times in the year 2001 due to the long term loan fund was less than the share holders fund during the study period, infer that the company is repaying loans regularly. From the creditors point of view it represents a satisfactory capital structure of the business since a high proportion of equity provides a larger margin of safety for them.
4. The fi xed assets ratio of Cadila Healthcare was found satisfactory during the study period among Indian Bulk Drugs and Formulations Pharmaceutical Companies in India and the average of fi xed assets ratio of Cadila Healthcare was high about 0.51 times and with a maximum of 0.72 times in the year 2003 to a minimum of 0.34 times in the year 2012. The ratio was nearest to standard norm in most of the years of study period. It infer that the company has invested most of the long term funds in fi xed assets. The ratio should not generally be more than ‘1’. If the ratio is less than one it indicates that a portion of working capital has been fi nanced by long-term funds.
D.B. Jain College
46
5. The proprietary ratio of Sunpharma was found good among Indian Bulk Drugs and Formulations Pharmaceutical Companies in India and the average of proprietary ratio of Sunpharma was high about 1.01 times with a maximum of 2.73 times in the year 2010 to a minimum of 0.38 times in the year 2005. It measure conservatism of capital structure and shows the extent of shareholder’s funds in the total assets employed in the business.
6. It is observed from the study among Indian Bulk Drugs and Formulations Pharmaceutical Companies in India the capital gearing ratio of Cipla was found to be good and the average capital gearing ratio of Cipla was found low about 0.1 times and with a maximum of 0.24 times in the year 2006 to a minimum of 0.03 times in the year 2001 indicates over capitalization of the company.
7. The analysis performance of net worth was found that among Indian Bulk Drugs and Formulations Pharmaceutical Companies in India the return on net worth position for Sunpharma was found to be good and the average return on net worth of Sunpharma was found high about 26.333 times and with a maximum of 33.24 times in the year 2003 and a minimum of 15.71 times in the year 2010. The overall return on net worth was satisfactory due to increases in the other source of income. This also reveals that the how profi tably the proprietors funds have been utilized in the fi rm.
SUGGESTIONS
1. Infrastructure has always been mentioned as a barrier to growth of the Pharma industry in India. Poor energy and transport infrastructure has traditionally posed a problem for companies. Some areas lack basic hotel facilities, preventing reach and penetration. Should the government gradually increase the investment in infrastructure, then the situation will improve, an investment opportunity in India.
2. There is an increasing concern in the domestic industry regarding a shortage of skilled labor in critical areas. This causes a demand-supply imbalance, and has led to an increased rate of wage infl ation.
3. Indian generics market is witnessing a margin pressure in most of the product categories due to two main reasons: the proposed price control likely to be imposed by the Government and the stiff competition among domestic players. In fact, India has witnessed a fast rise in the number of players over a period of time. Moreover, the expansion of capacities by certain leading players has also fuelled competition in certain product categories, which restricts margins of the smaller players.
4. Despite the increasing expenditure on R&D, the introduction of new molecules by Indian players has been limited. It is, in fact, a hit-and-miss situation in the fi eld of discovery and developments of New Chemical Entity (NCEs), where misses are more than hits. Very few discoveries reach the fi nal stages of approvals, and in most of the cases, the claim for patent gets stuck in legal battles.
5. The government has been taking several cost effective measures in order to bring down healthcare expenses. Thus, governments are focusing on speedy introduction of generic drugs into the market. This too will benefi t Indian pharma companies. However, despite this huge promise, intense competition and consequent price erosion would continue to remain a cause for concern. Over and above this, following GMP will be an important criteria for companies in order to grow in the global markets.
6. With respect to Turnover position of select Indian Bulk Drugs and Formulations Pharmaceutical companies in India. The following companies namely Sunpharma and Cipla has to improve their performance.

D.B. Jain College
47
7. With respect to Profi tability position of select Indian Bulk Drugs and Formulations Pharmaceutical companies in India. The following companies namely Aurobindo pharma, Cipla and IPCA has to improve their performance.
CONCLUSION
The Indian market provides signifi cant growth opportunities for the pharma industry. However, for the industry to sustain a robust growth rate of 15-20% till 2020. Companies will have to rethink the way they have been doing business. Pharma companies will continue to grow inorganically through alliances and partnerships. They will continue to focus on improving operational effi ciency and productivity. However, to meet the requirements of changing business environment, they will have to adopt new business models and think of innovative ideas to service their evolving customers faster and better.
Developments in the health insurance sector, medical technology sector and mobile telephony can help the growth of the pharma industry by removing fi nancial and physical barriers to healthcare access in India. As emerging markets become increasingly important and as India’s role among these markets becomes progressively signifi cant, the domestic pharmaceutical companies will need to adapt their business models, organizations and processes and create customized strategies.
REFERRENCE:
1. Amalendu Bhunia, Srii Gautam Roy 2011. Financial performance Analysis-A Case Study. Current Research Journal of Social Sciences. Pp 269-270.
2. Annual Report of Respective Companies
3. Business India, September 23, 2007, P 51.
4. Dheenadhayalan V, (2008) “Liquidity Management of SAIL: An Empirical Study”, Southern Economist, Vol.14. No.11, October, pp 26-28.
5. Dheenadhayalan V. 2008, “Liquidity Management of SAIL: An Empirical Study”, Southern Economist, Vol-14, No-11, P 26-28
6. Dheenadhayalan. V and Kandasamy.S, 2009, “Financial Performance of Steel Authority of India Limited: An Empirical Study”, The Accounting world, Vol-IX issue – II.
7. http://www.maheshsundar.com/Home/top-india-pharma-companies-by-revenue
8. Indrasena Reddy P. and Someshwar Rao K. Working Capital Management in Public Sector Undertakings-A Case Study, The Management Accountant, Vol. 31(9), September 1996, P. 643-645.
9. Mohamed Ibrahim M., 1991. Financial Performance of Kaleeswarar Mills. Unpublished M.Phil. Dissertation, Department of Commerce, Annamalai University.
10. Pillai R.S.N. and Bagavathi, Management Accounting, S.Chand P.59.
11. Reddy T.S. Hari Prasad Reddy, Management Accounting Margham Publication P.3.19
12. Reddy T.S. Hari Prasad Reddy, Management Accounting Margham Publication P. 3.20
13. Sudesh Kumar, Bimal Anjum and Suman Nayyar. 2012,”Financing Decisions: A Study of Pharmaceutical Companies in India. International Journal of Marketing. Vol.1.
14. Vijaakumar A. Assessment of Corporate Liquidity- A Discriminant Analysis Approach, The Management Accountant Vol. 31 No.8, P.589-593.
D.B. Jain College
48
STUDY ON FINANCIAL PERFORMANCE OF NEW GENERATION PRIVATE SECTOR BANKS IN INDIA
D. RAJAPRABU Dr. V. DHEENADHAYALAN
Assistant Professor In Commerce, Assistant Professor In Commerce, Department Of Commerce, Department Of Commerce, Immaculate College for Women. Annamalai University.
INTRODUCTION
In recent years, there have been considerable pressures on the profi tability of the banks and it is a key parameter in assessing the performance of a business; that directly and virtually affect the survival of an organization. There is a great deal of debate in the country about the profi ts and profi tability of Indian commercial banks.
After the banking sector reforms the priorities in banking operations underwent far reaching changes. There had been a shift in the emphasis from development or social banking to commercially viable banking.
Profi tability became the prime mover of the fi nancial strength and performance of banks; hence in this changed scenario, profi tability is the most important indicator of the competitive edge of the banking industry .
Public Sector Bank has enjoyed a certain amount of monopoly in the past. But today, all these privileges, special treatment and monopoly powers are lost by these Banks, because of changed economic policies of the government.
The fi nancial health of any Bank depends on its profi tability, liquidity and solvency position. To understand the fi nancial health, it is essential to assess the profi tability, liquidity and solvency position of the Banks.
The Non-performing assets are another criterion which measures the performance of the Banks. It is the necessary for the Banks to cope up with this changing climate for its survival and growth as well as to play a signifi cant role in the economic development. This calls for a thorough appraisal of the Bank business performance to assess the present status and future prospects.
The entry of New Generation Private Sector has changed the entire Banking scenario. Earlier the household savings went into Banks and the Banks lend out the money to corporate, now they need to sell Banking.
Hence, the present study is to addressing these important issues on New Generation Private Sectors Banks in India.
OBJECTIVES OF THE STUDY
The specifi c objectives of the study are as follows:
1. To analyse the liquidity position of NGPS Banks in India
2. To analyse the profi tability position of NGPS Banks in India
3. To evaluate the asset quality of NGPS Banks in India
D.B. Jain College
49
4. To offer valid suggestions on the basis of the fi ndings and result of the study
HYPOTHESIS
H0: There is no signifi cant difference in fi nancial performance among the NGPS banks in India during the study period.
METHODOLOGY
Data sources for the present study
The data has been collected from the secondary sources like Report on Trend and Progress of Banking in India, RBI statistical information relating to Banks in India, Annual Reports of Banks, various journals, magazines, PROWESS Database, Capital Line Database, Indiastat Database and information from the related websites.
Period of the study
The study covers the period of consecutive twelve years starting from 2000-2001 to 2011-2012.
Tools and techniques used for data analysis
Trend Analysis, Ratio Analysis, Graphs, Charts and Diagrams, Mean (Also known as Average), Standard Deviation, Co-effi cient of Variance, Single Factor Analysis of Variance (ANOVA), Dungun analysis, Compound Annual Growth Rate (CAGR) and Index.
POPULATION OF THE STUDY
There are seven NGPS Banks in India as on 31st March 2012.
Axis Bank Ltd (AXIS), Development Credit Bank Ltd (DCB), HDFC Bank Ltd (HDFC), ICICI Bank Ltd (ICICI), Indusind Bank Ltd (IndusInd), Kotak Mahindra Bank Ltd (Kotak) and Yes Bank Ltd, (Yes)
As for as the present study is concerned the entire seven banks mentions above are considered.
RESULTS AND FINDINGS
Findings Related to Liquidity
1. During the study period the Liquid Asset to Total Asset ratio of Kotak Mahindra Bank was high among New Generation Private Sector Banks in India and the high proposition of ratio reveals high liquidity to the bank. Therefore with respect to Liquid Asset to Total Asset ratio Kotak Mahindra bank was good among NGPS Banks. The reason for the higher ratio was due to holding of high cash in hand and balance with RBI from the year 2003-04 to 2011-12 in Kotak Mahindra Bank.
2. During the study period the Liquid Assets to Demand Deposits ratio of HDFC Bank was high among New Generation Private Sector Banks in India and High ratio reveals high safety for the deposit holders and high liquidity for the bank. Therefore with respect to Liquid Assets to Demand Deposits ratio HDFC Bank was good among NGPS Banks. The reason for the higher ratio was due to decreases in deposit from the year 2003-04 to 2011- 2012 in HDFC bank.
3. During the study period Liquid Assets to total Deposits ratio of HDFC Bank was high among New Generation Private Sector Banks in India and High ratio refl ects the high liquidity for the bank and
D.B. Jain College
50
also the deposits are in safe position. Therefore with respect to Liquid Assets to total Deposits ratio HDFC Bank was good among NGPS Banks. The reason for the higher ratio was due to total deposit increasing from the year 2007-08 to 2011-12 in HDFC bank.
4. During the study period Liquid Asset to Short Term Liabilities ratio of Axis Bank was high among New Generation Private Sector Banks in India and the Liquid Asset to Short Term Liabilities ratio expresses the ability to repay short Term creditor out of its total cash. Therefore with respect to Liquid Asset to Short Term Liabilities ratio Axis Bank was good among NGPS Banks.
5. During the study period Net Loan to Total Asset ratio of Development Credit Bank was low among New Generation Private Sector Bank in India and High ratio refl ects the low liquidity for the bank. Therefore with respect to Net Loan to Total Asset ratio Development Credit Bank is good among NGPS Banks. The reason for the lower ratio was due to decreased advance during the year 2003-04 to 2004-05 in Development Credit Bank.
Findings Related to Profi tability
1. During the study period Proprietary ratio of Kotak Mahindra Bank was high among New Generation Private Sector Banks in India and this ratio indicates the safety of a bank against capital losses and insolvency. The higher ratio indicates the solvency of the bank. Therefore with respect to Proprietary ratio Kotak Mahindra Bank was good among NGPS Banks. The reason for the higher ratio in Kotak Mahindra Bank was due to increased working fund from the year 2006-07 to 2011-12
2. During the study period Return on Asset ratio of Kotak Mahindra Bank was high among New Generation Private Sector Bank in India and the increase in the return on asset ratio indicates effi ciency of management in employing its fund effi ciently and economically. Therefore with respect to Return on Asset ratio Kotak Mahindra Bank is good among NGPS Banks. The reason for the higher ratio in Kotak Mahindra Bank was due to increase in profi t from the year 2010-11 to 2011-2012.
3. During the study period Net Profi t to Total Income ratio of HDFC Bank was high among New Generation Private Sector Banks in India and the higher ratio indicates the ability to withstand competition. Therefore with respect to Net Profi t to Total Income ratio of HDFC Bank was good among NGPS Banks. The reason for the higher ratio in HDFC Bank was due to increase in non-interest income from the year 2006-07 to 2011-2012.
4. During the study period Net Profi t to Deposit ratio of Kotak Mahindra Bank was high among New Generation Private Sector Banks in India and the higher ratio indicates the better performance of the bank. Therefore with respect to Net Profi t to Deposit ratio of Kotak Mahindra Bank is good among NGPS Banks. The reason for the higher ratio in Kotak Mahindra Bank was due to increase in Net Profi t from the year 2006-07 to 2011-2012.
5. During the study period Net Profi t to Working Fund ratio of Axis Banks was high among New Generation Private Sector Bank in India and the higher ratio indicates the effectiveness of the better management. Therefore with respect to Net Profi t to Working Fund ratio of Axis Bank is good among NGPS Banks. The reason for the higher ratio in Axis Bank was due to increase in reserve and surplus from the year 2007-08 to 2011-2012.
6. During the study period Spread to working fund ratio of Axis Bank was high among New Generation

D.B. Jain College
51
Private Sector Banks in India and the higher ratio indicates the higher profi t and better management. Therefore with respect to Spread to working fund ratio of Axis Bank was good among NGPS Banks. The reason for the higher ratio in Axis Bank was due to increase in interest income from the year 2005-06 to 2011-2012.
7. During the study period Spread to Total Deposit Ratio of Kotak Mahindra Bank was high among New Generation Private Sector Banks in India and the higher ratio indicates the effective utilization of deposits resulting in making profi t. Therefore with respect to Spread to Total Deposit Ratio of Kotak Mahindra Bank was good among NGPS Banks. The reason for the higher ratio in Kotak Mahindra Bank was due to increase in interest income from the year 2005-06 to 2011-2012.
8. During the study period Spread to Total Income ratio of Kotak Mahindra Bank was high among New Generation Private Sector Banks in India and the higher ratio indicates the higher profi tability of the bank. Therefore with respect to Spread to Total Income ratio of Kotak Mahindra Bank was good among NGPS Banks. The reason for the higher ratio in Kotak Mahindra Bank was due to increase in interest income from the year 2005-06 to 2011-2012.
9. During the study period Interest Earned to Working Fund ratio of Axis Bank was high among New Generation Private Sector Bank in India and the higher ratio indicates the deployment or utilization of working funds for earning profi t. Therefore with respect to Interest Earned to Working Fund ratio of Axis Bank was good among NGPS Banks. The reason for the higher ratio in Axis Bank was due to increase in Interest income from the year 2004-05 to 2011-2012.
10. During the study period Interest Paid to Working Fund Ratio of Kotak Mahindra Bank was low among New Generation Private Sector Banks in India and this ratio is an indication of the rate at which a bank incurs expenditure towards the usage of outside funds. Therefore with respect to Interest Paid to Working Fund Ratio of Kotak Mahindra Bank was good among NGPS Banks. The reason for the lower ratio in Kotak Mahindra Bank was due to decreased in Interest expended from the year 2002-03 to 2006-07.
11. During the study period Interest Income to Total Income ratio of Yes Bank was high among New Generation Private Sector Banks in India and the higher ratio indicates the effi ciency of bank in generation of interest income on lending’s in the form of loans and advances to the borrowers and receiving interest on it. Therefore with respect to Interest Income to Total Income ratio Yes Bank was good among NGPS Banks. The reason for the higher ratio in Yes Bank was due to increase in Interest income from the year 2007-08 to 2011-2012.
12. During the study period Interest Expenditure to Total Expenditure ratio of Kotak Mahindra Bank was low among New Generation Private Sector Banks in India and the increasing trend in this ratio showed a poor performance of the bank. Therefore with respect to Interest Expenditure to Total Expenditure ratio of Kotak Mahindra Bank was good among NGPS Banks. The reason for the lower ratio in Kotak Mahindra Bank was due to Interest Expenditure decreasing from the year 2002-03 to 2006-07.
13. During the study period study that the Interest Income to Advance ratio of IndusInd Bank was high among New Generation Private Sector Banks in India and the higher ratio represents the better performance of the bank. Therefore with respect to Interest Income to Advance ratio IndusInd Bank was good among NGPS Banks. The reason for the higher ratio in IndusInd Bank was due to increase in Interest income from the year 2007-08 to 2011-2012.
D.B. Jain College
52
14. During the study period Non Fund Income to Total Income Ratio of Yes Bank was high among New Generation Private Sector Banks in India and the increasing trend in this ratio expressed the banks management ability to generate non-interest income which contributes towards total income. Therefore with respect to Non Fund income to Total Income Ratio of Yes Bank was good among NGPS Banks. The reason for the higher ratio in Yes Bank was due to increase in commission, exchange and brokerage from the year 2006-07 to 2011-2012.
15. During the study period Operating Cost to Total Income Ratio of IndusInd Bank was low among New Generation Private Sector Banks in India and the ratio explains the effi ciency of the management to save on operating cost in relation to the earning capacity of the bank. The criterion for assessment in a decreased ratio expresses better performance. Therefore with respect to Operating Cost to Total Income Ratio of IndusInd Bank was good among NGPS Banks. The reason for the lower ratio in IndusInd Bank was due to decrease in operating expenses from the year 2000-01 to 2008-2009.
16. During the study period Burden to Total Income Ratio of Development Credit Bank was low among New Generation Private Sector Banks in India and the increasing trend in this ratio showed ineffi ciency in management and poor performance of the bank. Therefore with respect to Burden to Total Income Ratio of Development Credit Bank was good among NGPS Banks. The reason for the lower ratio in Development Credit Bank was due to decrease in non-interest income from the year 2001-02 to 2006-07.
17. During the study period Burden to Total Asset Ratio of Kotak Mahindra Bank was low among New Generation Private Sector Banks in India and this ratio indicates the improvement in profi tability of the banks with respect to total asset. Therefore with respect to Burden to Total Asset Ratio Kotak Mahindra Bank was good among NGPS Banks. The reason for the lower ratio in Kotak Mahindra Bank was due to decrease in burden from the year 2002-03 to 2006-07.
18. During the study period Interest Expanded to Total Asset Ratio of Kotak Mahindra Bank was low among New Generation Private Sector Banks in India and the this ratio indicates cost of the deposits. If this ratio increases, it may become harmful for the operational profi tability of the banks. Therefore with respect to Interest Expanded to Total Asset Ratio Kotak Mahindra Bank was good among NGPS Banks. The reason for the lower ratio in Kotak Mahindra Bank was due to decreased cost borrowing from the year 2002-04 to 2006-07.
19. During the study period study Non-Interest Income to Total Asset Ratio of Axis Bank was high among New Generation Private Sector Banks in India and it is an indicator of the increasing operational effi ciency of the bank. This ratio must increase to make the banks competitive. Therefore with respect to Non-Interest Income to Total Asset Ratio Axis Bank was good among NGPS Banks. The reason for the higher ratio in Axis Bank was due to increase in Non-Interest Income such as commission, exchange fee and brokerage from the year 2006-07 to 2011-2012.
20. During the study period Non-Interest Expanded to Total Asset Ratio of InduInd Bank was low among New Generation Private Sector Banks in India and it is an indicator of the increasing operational effi ciency of the bank. This ratio must decrease to make the banks more competitive. Therefore with respect to Non-Interest Expanded to Total Asset ratio InduInd Bank was good among NGPS Banks. The reason for the lower ratio in InduInd Bank was due to decreased operating expenses from the year 2000-01 to 2008-2009.
21. During the study period the Business Per Employee ratio of IndusInd Bank was high among New
D.B. Jain College
53
Generation Private Sector Banks in India The average of Business Per Employee ratio was high in case of IndusInd Bank during the study period and the higher the ratio, the better it is for the bank. Therefore with respect to Business Per Employee ratio IndusInd Bank was good among NGPS Banks. The reason for the higher ratio in IndusInd Bank was due to increased in deposits and advance from the year 2000-01 to 2003-2004 and 2006-07 to 2007-08.
22. It was revealed from the study during the study period the Profi t Per Employee ratio of ICICI Bank was high among New Generation Private Sector Banks in India and the higher the ratio showed higher the effi ciency of the management. Therefore with respect to Profi t Per Employee ratio ICICI Bank was good among NGPS Banks. The reason for the higher ratio in ICICI Bank was due to increase in Profi t from the year 2002-03 to 2011-2012.
23. During the study period Capital Adequacy Ratio of Yes Bank was high among New Generation Private Sector Banks in India and the higher the ratio, the more will be the protection of investor It also indicates whether the bank has enough capital to absorb unexpected losses. Therefore with respect to Capital Adequacy ratio Yes Bank was good among NGPS Banks. The reason for the higher ratio in Yes Bank was due to increase in capital, free reserves, revaluation reserves and general provisions from the year 2008-09 to 2011-2012.
24. During the study period Credit Deposit Ratio of Kotak Mahindra Bank was high among New Generation Private Sector Banks in India and the higher ratio indicates the better mobilization of the funds. Therefore with respect to Credit Deposit Ratio Kotak Mahindra Bank was good among NGPS Banks. The reason for the higher ratio in Kotak Mahindra Bank was due to increase in total deposit from the year 2002-03 and 2008-09 to 2011-2012 respectively.
Findings Related to Asset Quality
1. It was found from the Duncan analysis that the doubtful assets are the major contributing item in the GNPA followed by substandard assets and loss assets in the New Generation Private Sector Banks in India during the study period.
2. With respect to GNPA among the New Generation Private Sector Banks in India it was found that the GNPA position was very high in case of ICICI bank and low in case of Yes Bank during the study period.
3. With respect to NNPA among New Generation Private Sector Banks in India it was found that NNPA position was very high in case of ICICI Bank and low in case of Yes Bank during the study period.
4. It was found that Yes Bank and Development Credit Bank has got fi rst and second rank followed by IndusInd Bank and Kotak Mahindra Bank at third rank and Axis Bank at fi fth rank in the management of Non-performing assets. Some banks have got the same rank two banks (IndusInd Bank and Kotak Mahindra Bank) have got third rank. These banks are at the same performance level in the management of Non-performing assets.
5. Among New Generation Private Sector Banks in India during the study period the Gross NPAs as Percentage of Gross Advances ratio was low in case of Yes Bank (.30 per cent) followed by HDFC Bank (1.78 per cent) and Kotak Mahindra Bank (2.02 per cent). With respect to trend IndusInd Bank was good in managing the Gross NPAs as Percentage of Gross Advances ratio.
6. Almost all New Generation Private Sector Banks in India are maintained their NNPA to Net
D.B. Jain College
54
Advances at below 2 per cent for the last three study period except DCB and ICICI Bank. Among new Generation Private sector banks in India during the study period the Net NPAs as Percentage of Net Advances ratio is low in case of Yes Bank (0.11 per cent) followed by HDFC Bank (0.36 per cent) and Kotak Mahindra Bank (1.02 per cent)
7. Among New Generation Private Sector Banks in India during the study period the GNPA to Total Asset ratio was low in case of Yes Bank (0.18 per cent) followed by HDFC Bank (0.798 per cent) and Axis Bank (0.97 per cent) . With respect to trend IndusInd Bank and Yes Bank were good in managing the GNPA to Total Asset ratio.
8. Among New Generation Private Sector Banks in India during the study period the NNPA to Total Asset ratio is low in case of Yes Bank (0.15 per cent) followed by HDFC Bank (0.158 per cent) and Kotak Mahindra Bank (0.574 per cent). With respect to trend IndusInd Bank and Yes Bank were good in managing the NNPA to Total Asset ratio.
9. It can be inferred that during the entire study period Non-priority sector share in the amount of NPAs of New Generation Private Sector Banks was more as compared to priority and public sector.
10. Among New Generation Private Sector Banks in India during the study period the NPA Reduction due to compromise, up-gradation and actual recovery were high in case of ICICI Bank (Rs.17.19 Billion) followed by HDFC Bank (Rs.4.92 Billion) and Axis Bank (Rs.2.87 Billion).
SUGGESTIONS
New Generation Private Sector Banks added value to their client by providing newer products and services. To improve the profi tability, the banks need to focus attention on the management of establishment expenses, deposit composition and non-performing assets, so the study appends the following suggestions on these issues:
1. Banks should optimize investment income and Banks should have strong treasury functions so that funds are not kept idle.
2. Banks should concentrate more on improving total income i.e. interest and non-interest income. For increasing non-interest income, it is important for the banks to target on providing value added services.
3. Deposits, which constitute a major chunk of bank liabilities, needs to be explored to the maximum potential. Banks must put maximum efforts to attract fi xed deposits which contribute signifi cantly towards the enrichment of bank profi tability.
4. The causes of non-performing assets should be investigated, and responsible personnel should be prosecuted or handled according to law. If the problem lies with the system, appropriate changes should be made and if necessary, experts should be consulted to improve the system and prevent further occurrence.
5. Each bank should have its own independence credit rating agency which should evaluate the fi nancial capacity of the borrower before providing credit facility. Also credit rating agencies should regularly evaluate the fi nancial condition of the clients.
6. With respect to liquid position of NGPS banks in India. The following banks namely ICICI Bank, Indusind Bank and Yes bank has to improve their performance.

D.B. Jain College
55
7. With respect to Profi tability position of NGPS Bank in India. The following banks namely Development Credit Bank, HDFC Bank, ICICI Bank, Indusind Bank and Yes bank has to improve their performance.
8. With respect to Asset Quality of NGPS Bank in India ICICI bank has to improve its asset quality. Hence its GNPA position was very high compare to other NGPS Bank in India therefore the bank should conduct the recover camp and adopt compromise mechanism to reduce its Bad Asset.
CONCLUSION
The advent of Liberalization, globalization and privatization has paved the way for the entry of more number of private and global players in almost all the economic activities of the country and banking sector is not an exception to this. So for we used brick banking, now we are using click banking and in future we are going to access virtual banking because of techno based services of NGPS banks.
To sum up, it can be said that with increased competition, Indian banks face the challenge of sustenance and for these they need to develop proactive strategies with focus on product innovation, off-balance sheet activities to increase their income from non-core activity, effi ciency in service delivery process, effective risk management and more importantly on customer satisfaction through tailor made product packages.
REFERENCES
1. Dheenadhayalan.V and Rajaprabu. D (2013). A Study on Liquidity in New Generation Private Sector Banks in India. Indian Journal of Research and Business Innovation.vol.1.no 4, Pp. 114-125.
2. Dheenadhayalan.V and Rajaprabu. D (2014). A study on Non performing Assets in New Generation Private Sector Banks in India. Research Explorer. Vol. 1 Issue 1, February. Pp. 131-135
3. Dheenadhayalan.V. (2013). Management Strategies of Non Performing Assets in Emerging Countries and in India. DBJC Journal of Business Research, Vol 1 No 1. Issue No.11.October- December. Pp. 37-40
4. Dheenadhayalan.V. (2013). Non Performing Asset – An Alarm for Financial Turmoil, International Journal of Research and Business Innovation vol 1. No 4 Pp. 188-194.
5. Dheenadhayalan.V. (2013).Non Performing Asset in India Banking- A Glance, International Journal of Functional Management, vol.1. No 2, Pp. 40-43
6. Dheenadhayalan.V. (2014). “Analysis of the loan portfolio in Scheduled Commercial Bank in India”. In modern trend and development strategies in business. (Ed) Sakethevelmurugan M and Chanderaseger.V. D.B. Jain collage Chennai Pp. 30-34.
7. Dheenadhayalan.V. (2014). The Components of Non Performing Assets in Public Sector Banks in India. International Journal of Functional Management, Vol No.2, Issue No. 1, April. Pp. 45-49.
8. Dheenadhayalan.V. (2014)Non Performing Assets in Old Private Sector Banks in India Indian Economic Panorama, New Delhi, Vol. 24 No.3 October pp23-27
9. Harpreet kaur(2011), a comparative study of non-performing assets of public and private sector banks, International Journal of Research In Commerce & Management, volume no. 2 ,issue no. 9 (September) ISSN 0976-2183,p4
D.B. Jain College
56
10. Kamlesh M, Jani, Maniesh B. Raval, (2013). Impact of Non performing assets on profi tability in Nationalised Banks of India, Research Expo International Multidisciplinary Research Journal. Vol. III, Issue – IV. December. Pp.1
11. Kavitha N (2012), The Impact Of Non-Performing Assets On The Profi tability Of Indian Scheduled Commercial Banks: An Empirical Evidence International Journal of Research In Commerce & Management Volume No. 3, Issue No. 1 (January) ISSN 0976-2183
12. Mithani D.M., (1991). Theory of Income. Himalaya Publication House Mumbai.
13. Rajireddy K, Kiran Kumar.R (2011), “Performance Analysis of Indian Banks – A Comparative Study of Select Banking Groups”, RJCBS volume: 01, Number 02, Dec-2011: p46.
14. Rajni saluja, Roshan lal(2010), comparative analysis on non-performing assets (NPAs) of public sector, private Sector and foreign banks in India, International Journal of Research In Commerce & Management, volume no: 1 (2010), issue no. 7 (November) ISSN 0976-2183,p 80
15. Ramachandra Reddy B. (2007). “Management of Non- Performing Assets in Banks and Financial Institutions”. Serial Publications. New Delhi. P.323
16. Srinivas K T. (2013). A Study on Composition of NPAs of Public Sector Banks in India. International Journal of Engineering and Management Research. Vol. 3. Issue -6. December. Pp.116-121.
17. Vashist, Avtar and Krishnan. (1991). “Public Sector Banks in India”, H.K. Publications, New Delhi, p.3.
18. Zahoor Ahmad, M.Jegadeeshwaran, (2013). Comparative Study on NPA Management of Nationalised Banks, International Journal of Marketing, Financial Services & Management Research, Vol.2, No. 8, August. Pp. 66-78.
D.B. Jain College
57
IMPORTANCE OF CORPORATE GOVERNANCE UNDER COMPANIES ACT, 2013
V R Sridhar Dr. M.Sakthivel MuruganPh.D. Part-time Research Scholar, Principal (Retd.),Bharathiyar University, D.B.Jain College (Autonomous),Coimbatore-641046. Thoraipakkam, Chennai.
I. INTRODUCTION :
The world has changed due to globalization and resulting interdependence in economies and supply chains, advances in technology, rapid population growth and increasing in global consumption. It also puts increasing pressure on ecosystems that are essential to the economy and society. This has political, social and commercial implications. Business are being forced to react to these changes resulting in addressing social and environmental aspects in addition to profi tability that is essential for overall well-being of stakeholders.
India has seen some very infl uential families in business. These families have existed for over 100 years and made a lot of difference in the business and industrial culture of the country. These companies have made the transition from family company to a corporate family. They have professionalized their management boards, diversifi ed their ownership and issued shares on the stock market. In such cases, the challenge is on establishing governance process and between the Board and other stakeholders.
Besides there are several governance issues that has been identifi ed over a period of time that includes related party transaction, remuneration to directors, board evaluation, communication mechanism, Whistle blowing mechanism, Board disclosures, mandatory women director, rotation of auditors and so on. The MCA (Ministry of Corporate Affairs ) and Capital market watchdog SEBI ( Securities and Exchange Board of India) together taking initiatives in revamping corporate governance norms since the last two decades.
The Companies Act, 2013 was passed by the Indian Parliament on 8th Aug, 2013 and assented by President of India on 29Aug, 2013 to replace the fi ve decade year old Companies Act, 1956. The new Act aims to overhaul the country’s corporate law to strengthen corporate governance and increase transparency in disclosures. The objective behind the Act is lesser Government control and enhanced self-regulations coupled with emphasis on corporate democracy. The Act delinks the procedural aspects from the substantive law and provides greater fl exibility in rulemaking to enable adaption to the changing economic and business environment.
II. WHY CORPORATE GOVERNANCE?
a) The liberalization and de-regulation world over gave greater freedom in management. This would imply greater responsibilities.
b) The players in the fi eld are many. Competition brings in its wake weakness in standards of reporting and accountability.
c) Market conditions are increasingly becoming complex in the light of global developments like WTO, removal of barriers/reduction in duties.
The failure of corporation due to lack of transparency and disclosures and instances of falsifi cation of accounts/embezzlement and the effect of such undesirable practices in other companies.
D.B. Jain College
58
III. THE CONCEPT OF CORPORATE GOVERNANCE
The meaning of the term corporate governance is a subject of considerable debate. The concept has been defi ned in many ways. Organization for Economic Co-operation and Development (OECD) has defi ned corporate governance as, “procedures and processes according to which an organization is directed and controlled. The corporate governance structure specifi es the distribution of rights and responsibilities among the different participants in the organization –such as the board, managers, shareholders and other stakeholders – and lays down the rules and procedures for decision-making”.
Corporate Governance describes how companies ought to be run, directed and controlled. It is about supervising and holding to account those who direct and control the management (Cadbury 1992). The purpose of governance structure is to assure a signifi cant fl ow of capital to the fi nancing of fi rms, corporate governance includes the structures, processes, cultures and systems that engender the successful operation of the organizations
Corporate governance aims at protecting the individual and collective interest of all the stakeholders. Good corporate governance practices may have signifi cant infl uence on the strategic decisions of a company such as external fi nancing that are taken at board level. Sound corporate governance principles are the foundation upon which the trust of investors and lenders is built. In a nutshell, the corporate governance is all about governing corporations in such a transparent manner and ensure all stakeholders’ interest are protected, and with due compliance and applicable laws.
IV. HISTORY OF CORPORATE GOVERNANCE
If we look at the corporate history which includes several fraud and scams, we may arrive at the conclusion that the system of existing regulations was not satisfactory and there was strong need for external regulations which could penalize the wrong doers and reward those who abide by the rules and regulations. On the basis of investigation results of various scandals and fraud that had taken place around the world, the regulatory bodies were able to highlight control failures that had allowed several major corporations to make illegal payments and syphon the money which should have been used for the purpose of business. Various results of corporate failures and lack of regulatory measures from authorities as an adequate response to check them in future gave birth to Committee of Sponsoring Organization (COSO). The corporate governance committees of last decade have analyzed the problems and crisis besetting the corporate sector and markets and have sought to provide guidelines for corporate management.
V. CORPORATE GOVERNANCE IN INDIA
The fi nancial crisis in 1991 and reforms by government towards liberalization created which forces to form a regulatory body called Securities Exchange Board of India formed during the year 1992.
• Desirable code of conduct (1998) issued by Confederation of Indian Industry (CII),
• SEBI had set up a committee under the chairmanship of Kumar Mangalam Birla in 2000 led to inclusion of Clause 49 in the listing agreement as well.
• Nareshchandra committee in 2002 – law involving the auditor-client relationships and the role of independent directors.
• NR Narayana Murthy Committee – revised clause 49 was implemented based on its recommendations
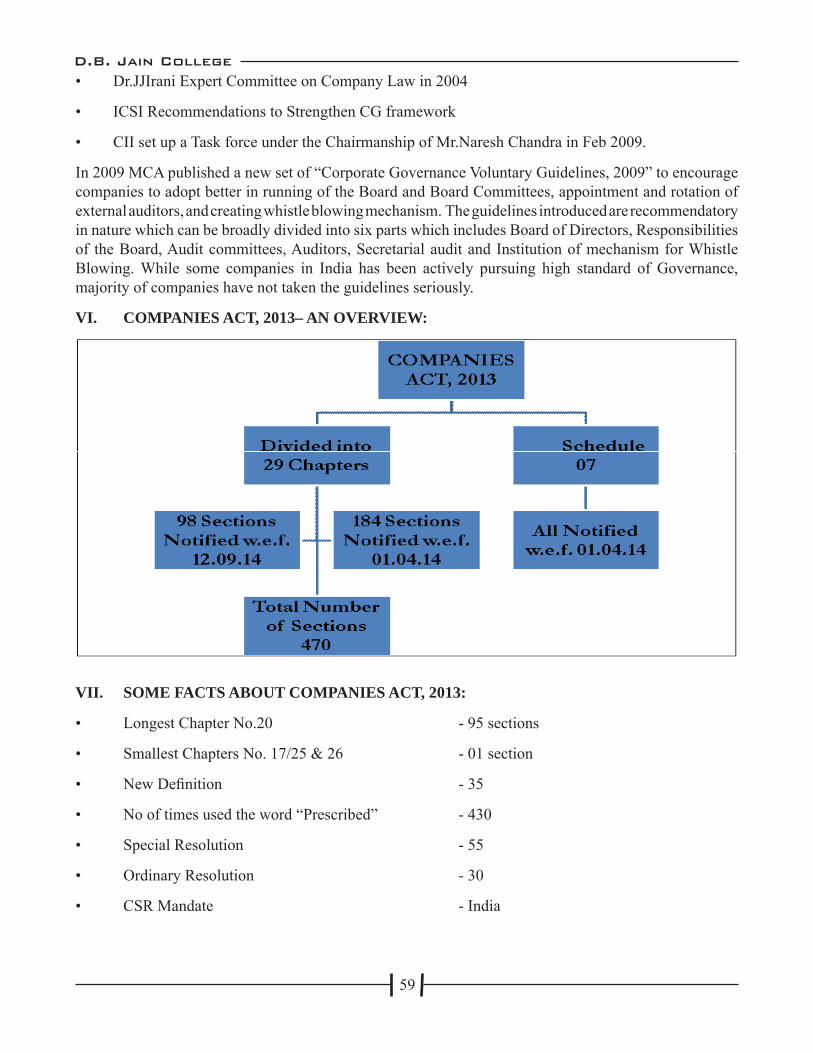
D.B. Jain College
59
• Dr.JJIrani Expert Committee on Company Law in 2004
• ICSI Recommendations to Strengthen CG framework
• CII set up a Task force under the Chairmanship of Mr.Naresh Chandra in Feb 2009.
In 2009 MCA published a new set of “Corporate Governance Voluntary Guidelines, 2009” to encourage companies to adopt better in running of the Board and Board Committees, appointment and rotation of external auditors, and creating whistle blowing mechanism. The guidelines introduced are recommendatory in nature which can be broadly divided into six parts which includes Board of Directors, Responsibilities of the Board, Audit committees, Auditors, Secretarial audit and Institution of mechanism for Whistle Blowing. While some companies in India has been actively pursuing high standard of Governance, majority of companies have not taken the guidelines seriously.
VI. COMPANIES ACT, 2013– AN OVERVIEW:
VII. SOME FACTS ABOUT COMPANIES ACT, 2013:
• Longest Chapter No.20 - 95 sections
• Smallest Chapters No. 17/25 & 26 - 01 section
• New Defi nition - 35
• No of times used the word “Prescribed” - 430
• Special Resolution - 55
• Ordinary Resolution - 30
• CSR Mandate - India
D.B. Jain College
60
VIII. CORPORATE GOVERNANCE IN COMPANIES ACT, 2013
Some of the salient features of the Act which Corporate Governance practices more effi cient are:
1. Democracy of Shareholders: The new Act has introduced new concept of class action suit with a view of making shareholders and other stakeholders more informed and knowledgeable about their rights.
2. Supremacy of Shareholders: The Companies Act 2013 focus and provide major aspect on approvals from shareholders on various signifi cant transactions. The Government has rightly reduced the need for the companies to seek approvals to managerial remuneration and the shareholders have been vested with the power to sanction the limit.
3. Women Director: The new Act states appointment of at least one woman Director on the Board of the prescribed class of Companies.
4. Audit Committees: The new Act has increased the ambit of companies to constitute audit committees. The constitution of audit committee has also seen change as compared to Clause 49 of SEBI listing agreement with minimum three independent directors. The chairperson should be able to read and understand the fi nancial statement. It shall be applicable to all the listed companies or non-listed public companies having paid up share capital of Rs.10 crores or more, Turnover of Rs.100 crores or more, aggregate outstanding loan of Rs.50 crores or more.
5. Internal Audit: The Companies Act, 2013 has mandated the internal audit for certain class of companies under section 138. These companies includes all the listed companies, All listed companies having paid up capital of Rs.50 crores or molre, all the non-listed companies having paid up share capital of Rs.50 crores or more, turnover of Rs.200 crores or more in the preceeding fi nancial year, outstanding loans or borrowings from the banks or public fi nancial institutions of Rs.100 crores or more.
6. Corporate Social Responsibility:The new Act stipulates certain class of companies to spend a certain amount of money every year on Corporate Social Responsibility.
7. Independent Directors: First time in history, the duties of Independent Director has been defi ned. The new Act 2013 provides that all listed entities should have at least one-third of the Board as Independent Directors. No independent director shall hold offi ce for more than two consecutive terms of fi ve years. The new Act also excludes nominee director from the defi nition of Independent Director. It also introduced the performance of Independent Directors and the Board of Directors. The maximum number of Boards an independent director can serve on listed companies be restricted to 7 and 3 in case the person is serving as a whole time director in a listed company. It also stipulates separate meeting of Independent Directors.
8. Rotation of Auditors: The new Act provides for rotation of auditors and audit fi rms in case of publicly traded companies.
9. Prohibition on forward dealings and insider trading: The Act prohibits directors and key managerial personnel from purchasing call and put options of shares of the company, its holding company and its subsidiary and associate companies as if such person is reasonably expected to have access to price-sensitive information.
10. Auditors performing Non-audit services: The new Act prohibits Auditors from performing non-

D.B. Jain College
61
audit services to the company where they are auditor to ensure independence and accountability of auditor.
11. Composition of Nomination & Remuneration Committee and Statekholder relationship Committee: Section 178(1) of the Companies Act, 2013 prescribes appointment of Nomination and Remuneration committee. The duty of the Committee shall be to identify the persons who are qualifi ed to become directors and who can be appointed in the senior management and carry out the evaluation of directors. Sec. 178(5) prescribed appointment of stakeholder relationship committee to resolve grievances of security holders of company.
12. Internal Audit: The new Act mandated the internal audit for certain classes of companies under section 138. These companies includes all the listed companies, All listed companies having paid up share capital of Rs.50 crores or more, all the non-listed companies having paid up share capital of Rs.50 crores or more, turnover of rs.200 crores or more in the preceding fi nancial year, outstanding loans or borrowings from the banks or public fi nancial institutions of Rs.100 crores or more.
13. Serious Fraud Investigation Offi ce (SFIO): The new Act shall establish an offi ce called the Serious Fraud Investigation offi ce to investigate fraud relating to company. SFIO can investigate into the affairs of the company or no receipt of report of Registrar or inspector or in the public interest or request from any Department of central Government of State Government.
IX. ANNUAL OPERATING PLANS AND BUDGETS AND ANY UPDATES TO BE PLACED BEFORE BOARD:
The plans & budgets for the fi nancial years do get prepared by many companies and placed before the board on a regular basis. However, where subsequent implementation of such planned documents is concerned, there may be numerous positive or negative variations which, especially the negative factors may not come accurately before the Board, for ostensible reasons. Hence the updates or the follow up actions generally get camoufl aged and thus reported to the Board.
X. QUARTERLY RESULTS FOR THE COMPANY AND ITS OPERATING DIVISIONS OR BUSINESS SEGMENTS TO BE PLACED BEFORE BOARD:
The preparation of these results and getting them audited or subject them to limited review by the statutory auditors in terms of Clause 41of the listing agreement may appear in compliance of the provisions of the Listing agreement, Companies Act 2013, however, the inherent window dressings of accounts and other manipulations of the entries and accounting standards cannot be ruled out.
Non-compliance of any regulatory, statutory or listing requirements and shareholders service such as non-payment of dividend, delay in share transfer etc; to be placed before Board – Only when these non-compliances are so signifi cant that they are in the public domain that they are compelled to be brought before the Board, otherwise these may be avoided to be disclosed.
From the foregoing it is clear that the management may generally try to avoid bringing signifi cant information before the Board. Only when the requirements are statutory that they are forced to be brought before the Board, that too, with as less information as possible. On numerous occasions the company deliberately gives substantial number of pages, at the last minute, just at the time of the Board meeting to ensure that the director does not get suffi cient time to read and understand and contribute on the matters written in these papers. Many a time, some director may like to object to such procedure but he may be overruled by the general consensus that everything is fi ne. On many occasions, the nominee director of
D.B. Jain College
62
institutions, wherever present, would like to inculcate a sense of propriety in the process but again he may be in the minority and not getting support of his fellow directors. Even institution’s insistence may not amount to much. In the end he may just fall in line and go along with the general trend.
One should, consequently not forget that what documents show and what actually happens in corporate may not be the same. There could be compliance of all aspects of Corporate Governance, but in reality things could be quite different. Nobody would like to really speak out about these things as it is best known and well kept open secret.
XI. CONCLUSION:
The above undesirable situation is defi nitely not all persuasive. There are good number of companies in India which follow the Corporate Governance in letter and spirit. However, those which do not so follow seem to be changing in tune with the general awareness of Corporate Governance and Laws, but that looks to be slow. To change the matters, the mindset of the corporate should change. Professionals in the corporate level, who are intricately involved in the process, should discourage this practice to the best of their abilities. It would be better if the Law gives them some protection to give suffi cient coverage to speak out. But at the end of the day, it should be hammered in the senses that a better Corporate Governance is not only a matter of good, systematic and ethical process but a matter of better business and higher profi ts.
REFERENCES:
1. Sathe M and Gawade SU, Corporate governance and Capital Structure: Evident from select Indian Pharmaceutical companies, The Management Accountant Journal, July 2014, Vol 49, pp100-109.
2. Sinha SN (2014), Composition of Board of Indian Companies and its effect on Corporate Governance, Chartered Secretary,April 2014, Vol XLIV, pp432-437
3. AmitavGanguly, published in Corporate Law/caclubindia.com accessed on 18th July, 2015 @ 11.00am
4. Amrita Chattopadhyay, Corporate Governance and Companies Act, 2013, accessed on 03rd Sep, 2015 @ 8.00pm
5. Pande, S. (2011). Does Good Governance Pay? Evidence from Around the Globe. Retrieved from http://dx.doi.org/10.2139/ssrn.1976772
6. The ICSI, (Oct 2014) “Corporate Governance Clause 49 of Listing Agreement vis-à-vis Companies Act, 2013 published by The Institute of Company Secretaries of India, New Delhi.
List of websites:
1. http://www.ssrn.com
2. http://www.icsi.edu
3. http://www.icmai.in
4. http://www.pwc.in
5. http://www,caclubindia.com
D.B. Jain College
63
EMPLOYMENT AND EMPLOYABILITY FOR COMMERCE GRADUATES IN VILLUPURAM DISTRICT OF TAMIL NADU
Dr. R. USHARANIAssistant Professor,Department of Commerce,Thiruvalluvar University College of Arts and Science,Thiruvennainallur.INTRODUCTION
“No matter reigns, the merchant reign”
- Henry Ward Beachar
The concept of employability has been discussed for a number of years, but there has been a growing interest in graduate employability over the last decade. As the interest in promoting graduate employability has increased numerous studies have produced detailed breakdowns of particular skills and attributes requires to promote graduates employability such as core skills, key skills, common skills, essential skills, skills for life, generic skills, and enterprise skills etc., More recently, authors have moved towards in more complex understanding of graduate employability and proposed a number of inter-related attributes, skills and competencies that help individuals to both secure and perform well in employability that is the student’s academic performance and the student’s confi dence and the student’ ambition etc.,
Education is a major criterion of measuring the development of a country. It is also a key
determinant of the wealth and prosperity of a nation. One of the main objectives of the education, particularly of higher education, is to prepare students to pursue different careers in a country. Employability derives from complex learning, and is a concept of wider range than those of core and key skills and states the employability is as a collection of capacities or achievements.
OBJECTIVES OF THE STUDY
Employment depends upon a set of achievements, skills, understandings and personal attributes that make educated more likely to gain employment and be successful in their chosen occupations, which benefi ts themselves, the workforce, the community and the economy. Higher education is much more than a production line for work ready graduates. Currently, everyone seems to agree that work placements and internships make a huge difference to employability skills.
Some graduates and their employers say more could be done to develop student’s wider skills and attributes, including team-working, communication, leadership critical thinking and problem solving. These are known collectively as employability skills. The graduates possess a positive attitude as a key factor understanding their employability, whether the individual has a ‘can do’ approach a readiness to take part and contribute openness to new ideas and a drive to make these happen. They note that employers value graduates who can demonstrate an entrepreneurial and innovative approach, a creative thinking which brings fresh perspectives and challenges assumptions.
SIGNIFICANCE OF THE STUDY
Employability derives from complex learning, and is a concept of wider range than those of ‘core’ and ‘key skills’ and states that employability is as a collection of capacities or achievements. Different employers need commerce graduates who have different capabilities like accounting. All value the analytical and

D.B. Jain College
64
refl ective qualities that lie at the heart of a quality learning experience. But there is a growing emphasis by employers on the need for commerce graduates to demonstrate a range of competences which will equip them to work in a global environment, in different countries, in multi-cultural teams, be innovative and enterprising and have strong language skills. We take employability skills to be the skills almost everyone needs to do almost any job. They are the skills that must be present to enable an individual to use the more specifi c knowledge and technical skills that their particular workplaces will require. They are:
(a) A foundation of positive approach:-
Being ready to participate, make suggestions, accept new ideas and constructive criticism, and take responsibility for outcomes.
(b) Using Language effectively:-
Writing clearly and in a way appropriate to the context, ordering facts and concepts logically.
(c) Self- management:-
Punctuality and time management, fi tting dress and behavior to context, overcoming challenges and asking for help when necessary.
(d) Thinking and solving problems:-
Creativity, refl ecting on and learning from own actions, prioritizing, analyzing situations, and developing solutions.
(e) Working together and communication:-
Co-operating, being assertive, persuading, and being responsible to others.
The characteristics and skills for commerce graduate employability emerged:-
1. Strong communication
2. Able to work using their own initiative
3. Capable of independent work
4. Creative and able to solve problems
5. Time management
6. Presentation skills
7. Commercial awareness
8. Motivated and enthusiastic
9. Self confi dence.
EMPLOYERS’ REQUIREMENTS FROM A GRADUATE
This is mainly pointed out that the communication and teamwork skills as some of the
employers’ expected characteristics of graduates. The mentioned broad skills such as analytical,
D.B. Jain College
65
creativity, mathematical knowledge, literacy, motivation and leadership qualities of commerce graduates are considerable factors in job market. For the private sector employments manual/social/intellectual skills, knowledge, understanding and attitudes are some requirements.
Higher Education study has identifi ed some other important characteristics such as subject knowledge, research and analytical ability, inter personal relations, problem solving, self-confi dence, self management, decision making and judgement skills etc. The other virtues and skills that are expected from graduates are, genuineness, humbleness, obedience, credibility, tactfulness, sensitiveness, cooperation, devotion, active, straightness, unchangeable, altruistic, new thinking, leadership, strength, organizational skills, time management, skills of discussion, commercial knowledge and personality etc.
AREA AND SCOPE OF THE STUDY
This study is undertaken in central part of Tamil Nadu where the study area Villupuram is located in the four numbers of Government and Constituent colleges are offering commerce graduates.
Gone are the days when computer science and mathematics courses were the only options that students considered a ticket to employment and a career. If recent trends in Tamil Nadu are to be believed, students are reposing tremendous faith in commerce courses as an option, right from the pre-university level to undergraduate courses.
Increasing job prospects in fi nance and banking-related sectors, student-oriented and employer-friendly syllabus and the course being less expensive compared to other courses has made commerce a front-runner among all degree courses, say experts. Career opportunities start knocking on the doors even when the students are in their fi nal year. Consequently, not only the number of applications for commerce courses multiplies by the year, but there is also a distinct improvement in the quality of students taking the route, with several meritorious candidates actively choosing commerce over past favourites.
HYPOTHESIS
i. There is no signifi cant relationship in fi nding employment and commerce education.
ii. No two same level of institutions offering the same quality of education in teaching commerce.
iii. There is a no relationship between privatization and fi nding employment by commerce graduates.
iv. The advantage for commerce education leads to opening up of more Arts and Science colleges.
v. It is easier for an English speaking student to fi nd a job than a vernacular speaking student.
vi. More and more of the women candidates opting for commerce education than male students.
LIMITATIONS
This study is confi ned only to Tamil Nadu and the samples are selected the Four colleges like Two Government and Two University constituent colleges etc., so, the results obtained are universally applicable. The syllabuses taught in the sample colleges are uniform. Autonomous colleges are having their own syllabus. But here the colleges are following the Thiruvalluvar University syllabus. Exposure in outside is very much limited in rural colleges. Practical orientation in subject like auditing is negligible. Internship is not counted in fi nding employment corporate. The starting of job oriented courses creates career expectations among students. However, to provide training and relevant education for particular jobs etc. is a meaningful attempt only if the expected employment opportunities are created in many fi elds.
D.B. Jain College
66
SUGGESTIONS
Even though graduates are highly valuable human resource of a country, most of them have to wait for a long time for suitable jobs. The mismatch between the degree and the demands of the job market as the main reason of this issue seems to be a conventional belief and seems as an invalid measure. Issues in the development of macro-economy of the country appear as a greater drawback in case of graduates’ employability. The unemployment problem is especially critical among some areas in humanities and some management graduates as a large number of students are graduated annually. It can be noticed that there are booming job opportunities for graduates in the private sector mainly for Management and Commerce graduates but lesser opportunities for Social Sciences and Humanities graduates.
Training/experience is a highly demanded factor in the job market especially, in the private sector. Profi ciency of English language is a decisive factor. Further, there is a high demand for additional competencies such as IT skills, leadership qualities, analytical ability, team work and interpersonal relations along with a degree. Development of basic IT skills and English profi ciency should not be the responsibility of Colleges. Such skills should be developed before entering the college. Since colleges have adopted some strategies to improve these skills within the students. Hence, Commerce Graduates should be improving their skills in various ways, which is very necessary to get the employment opportunities.
CONCLUSION
The study of commerce opens up the doors of a wide variety of the most sought-after career options. Numerous job opportunities are available for students once they have completed their graduation in the fi eld of commerce. Employers expect graduates to demonstrate a range of skills and attributes that include team-working, communication, leadership, critical thinking, problem solving, and managerial abilities or potential. Commerce Graduate recruiters want a variety of other skills, personal and intellectual attributes, rather than specialist subject knowledge. Moreover, such as New Economic Policy has given a vast scope for commerce courses have taken the shape as integrated courses by adopting innovative ideas. They are not limited only to learning commerce theory and accounting. Instead, subjects such as marketing, company affairs, and computer accounting have been incorporated. Making computer accounting tally is a compulsory subject will help the students to avoid pursuing computer accounting privately. These aspects help them to face any kind of competition once they pass out.
REFERENCE
1. Association of Graduate Recruiters (2012) Graduate Recruitment Survey - 2012 Summer Review.
2. Quality Assurance Agency for Higher Education (2010). Code of practice for the assurance of academic quality and standards in higher education.
3. Personnel Management _ Dr. V.Balu, Sri Venkateswara Publication.
4. Issues of THE HINDU – Dailies.
5. www.Googlee.co.in
6. www. Wikipedia.com
D.B. Jain College
67
A CASE STUDY APPROACH FOR EVALUATION OF EMPLOYEE TRAINING EFFECTIVENESS AND DEVELOPMENT OF EMPLOYEES OF SELECTED
INFORMATION TECHNOLOGY (IT) COMPANIES IN CHENNAI CITYMr. M. SHANMUGAM, Dr. V. SELVANATHAN,Ph.D Research Scholar (Part Time), Bharathiar University, Associate Professor & HOD,Department of Commerce, Department of Commerce,D. B. Jain College, Dr. Ambedkar Government Arts College,Thoraipakkam, Chennai -97. Vyasar padi, Chennai.
ABSTRACT
The study was conducted to evaluate the effectiveness of training program in quality department at multinational company. This case study approach explores the effectiveness of a training programme of an organisation by using Kirkpatrick model .The research method in the study was survey data collection method. The Data survey questionnaire based on Kirkpatrick model. Kirkpatrick model (1976) is used for evaluating effectiveness of continuous quality improvement training program.. The questionnaire includes indicators of attitude (Reaction), Learning, behavior and results this survey belongs 330 employees of Quality department itself. The IT workforce of a company is an important strategic asset, an asset that needs to be managed. It also gathers data on the effects of training initiatives, the types of training in use, and the infl uence of training on knowledge retention. IT staff were chosen for this study as they embody the new “knowledge worker” operating in the information economy.
Keywords: training, effectiveness, evaluation, development, Information Technology.
Introduction
Training may be defi ned as the systematic gaining learning and adapting of skills, concepts, attitudes, etc that should result in improved performance of the trainee. Training is vital for some reasons. Selected employees for a particular job often need to get appropriate skills and knowledge about the work to be done. It always helps an employee to know about the organization process, work content, importance and awareness about the work assign. And their liking toward the job helps organisation to grow. As well as, when job changes, employee should adapt to new environment. Training is always necessary to search a new job or to be successful in your career in an organisation. And even for good employees, it will often be possible to fi nd a place for improvement. So, training may be profi table not only to employees but also the organizations in which they work. Training results in mutual growth of employees and organisation.
Offi cially, most of the time trainer and training programs are evaluated. But, there is a drawback. The most commonly used evaluation consists of measuring employee reactions and feedback towards the training, often on the last day of the training. Mainer times employees are asked if they enjoyed the training, and if they have learned from it, if suffi cient training material is provided. So, negative employee reactions may be seen as immediate necessary step for improving the training pattern. However, these reactions are certainly not suffi cient to set up a solid bridge between the training, growth of knowledge, and better performance. To improve training, one needs to have more information about the training effectiveness and the Quality of training provided.
Information Technology (IT), a knowledge-based industry, has the tremendous potential of becoming an engine of accelerated economic growth, productivity improvement for all sectors of the economy and means of effi cient governance. It enhances access to information, protects consumers, provides
D.B. Jain College
68
access to government services, makes skill formation and training more effective, improves delivery health services, and promotes transparency. It provides tremendous employment potential and linkages between government and the people both at the rural and urban level. Investment in knowledge based industries will determine the level of the country’s dominant position in the world economy in the next two decades.
Concept of Training
It is about developing employees as an individual to make them capable and confi dent in their jobs, and consequently in their life. Thus it is an organized process for increasing the knowledge and skill of the employees. Consequently it is a process aimed at changing the behavior in such a way that the consequence would be useful for the upliftment of the organization.
According to Wayne F Cascio17, ―Training consists of planned programme designed to improve performance at the individual, group, and /or organizational levels. Improved performance, in turn, implies that there have been measurable changes in knowledge, skills attitude, and/or social behavior.
Training is considered as a tool for HRD. Training has immense potential in transfer and utilization of latest technical know-how, leadership development, organization of people, formation of self-help-groups, mobilization of people as well as resources, empowerment of resource-poor rural mass, entrepreneurship development, etc., which are considered essential components of HRD.
According to C B Memoria, ―Training is a process of learning a sequence of programmed behavior. It is application of knowledge and it attempts to improve the performance of employee on the current job and prepares them for the intended job. Training is a short term process utilizing a systematic and organized procedure by which non managerial personnel acquire technical knowledge and skills for a defi nite purpose.
Concept of Development
Development is related to enhancing the conceptual skills of the employee, which helps individual towards achieving maturity and self actualization. In the words of Michael Armstrong Employee development, often referred to as human resource development (HRD) is about the provision of learning, development and training opportunities in order to improve individual, team and organizational performance.
Development is defi ned by Alan Mumford 20 as an attempt to improve managerial effectiveness through a planned and deliberate learning process. According to Bernard M Bass & James A. Vaughan21 Development implies the nature and change induced among employees through process of education and training. In the words of Harold Koontz and Cyril O. Donnel Managerial development concerns the means by which a person cultivates those skills whose application will improve the effi ciency and effectiveness with which the anticipated results of a particular organizational segment are achieved.
In the fi eld of human resource management, training and development is the fi eld concerned with organizational activity aimed at bettering the performance of individuals and groups in organizational settings. It has been known by several names, including employee development, human resource development and learning and development.
Concept of Evaluation
Systematic way of valuation can provide the necessary information required for continuous improvement and growth. Although, today managers are no likely to be satisfi ed with knowing how many new
D.B. Jain College
69
employees had undergone training, how much they liked it, and what they learned through the training. But in more numbers of managers want to know if the fellows are implementing what they learned during the training, and –most importantly – what if any institutional results were improved. In any review of evaluation it is fi rst essential to defi ne the term itself, and also its stakeholders and its goals.
In the modern workplace, these efforts have taken on a broad range of applications—from instruction in highly specifi c job skills to long-term professional development. In recent years, training and development has emerged as a formal business function, an integral element of strategy, and a recognized profession with distinct theories and methodologies. More and more companies of all sizes have embraced "continual learning" and other aspects of training and development as a means of promoting employee growth and acquiring a highly skilled work force. In fact, the quality of employees and the continual improvement of their skills and productivity through training are now widely recognized as vital factors in ensuring the long-term success and profi tability of small businesses.
Information Technology (IT)
Information Technology (IT) is the acquisition, processing, storage and dissemination of vocal, pictorial, textual and numerical information by a micro-electronics-based combination of computing and telecommunications. Information Technology (IT) is the industry, which through the use of computers and other supporting, equipment helps in the spread of knowledge. Information Technology for some time was synonyms to computers. But with the rapid and advancement in various information delivery system such as Radio, TV, Telephone, Newspapers, Fax and of course computers and computer Networks, information technology refers to the entire gamut of Media and devices used to transmit and process information for use by various target groups in the society. IT has, therefore been rights termed at information and communication Revolution.
Philosophy of Training
According to S Chandra16, management of the organization fi rmly believes that human assets unlike other asset cannot be depreciated and must necessarily be appreciated over entire tenure. Therefore training is regarded as investment and not a cost. Even long-term intangible gains such as attitude change, are to be considered as valuable returns. Training is considered as vehicle for effective communication and coordination. Training is catalytic in any man management matrix for cohesiveness, compatibility, and cooperation in every organizational endeavour. 35 Management proclaims Training & Development direction as permanent part & parcel of operational process and not some experiment in isolation.
Importance of the study
Training offers innumerable benefi ts to both employees and employers. It makes the employee more productive and more useful to an organization. Trained workers can work more effi ciently. Training improves the knowledge of employees regarding the use of organizational resources. Hence, trained workers need not be put under close supervision, as they know how to handle operations properly. Trained workers can show superior performance. Training makes employees more loyal to an organization. They will be less inclined to leave the unit where there are growth opportunities. Training makes an employee more useful to a fi rm. Hence, he will fi nd employment more easily. Training makes employees more effi cient and effective.
Objectives of the study
1. To study the training details and commitment of organization towards training in IT Companies.
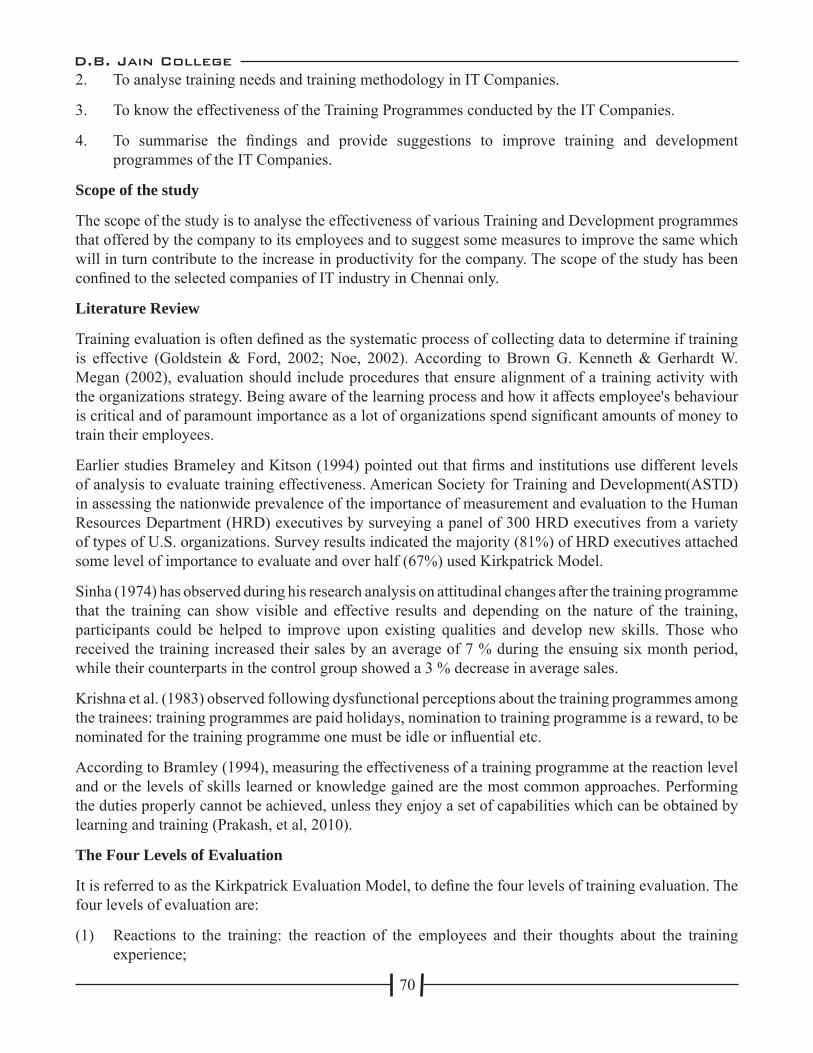
D.B. Jain College
70
2. To analyse training needs and training methodology in IT Companies.
3. To know the effectiveness of the Training Programmes conducted by the IT Companies.
4. To summarise the fi ndings and provide suggestions to improve training and development programmes of the IT Companies.
Scope of the study
The scope of the study is to analyse the effectiveness of various Training and Development programmes that offered by the company to its employees and to suggest some measures to improve the same which will in turn contribute to the increase in productivity for the company. The scope of the study has been confi ned to the selected companies of IT industry in Chennai only.
Literature Review
Training evaluation is often defi ned as the systematic process of collecting data to determine if training is effective (Goldstein & Ford, 2002; Noe, 2002). According to Brown G. Kenneth & Gerhardt W. Megan (2002), evaluation should include procedures that ensure alignment of a training activity with the organizations strategy. Being aware of the learning process and how it affects employee's behaviour is critical and of paramount importance as a lot of organizations spend signifi cant amounts of money to train their employees.
Earlier studies Brameley and Kitson (1994) pointed out that fi rms and institutions use different levels of analysis to evaluate training effectiveness. American Society for Training and Development(ASTD) in assessing the nationwide prevalence of the importance of measurement and evaluation to the Human Resources Department (HRD) executives by surveying a panel of 300 HRD executives from a variety of types of U.S. organizations. Survey results indicated the majority (81%) of HRD executives attached some level of importance to evaluate and over half (67%) used Kirkpatrick Model.
Sinha (1974) has observed during his research analysis on attitudinal changes after the training programme that the training can show visible and effective results and depending on the nature of the training, participants could be helped to improve upon existing qualities and develop new skills. Those who received the training increased their sales by an average of 7 % during the ensuing six month period, while their counterparts in the control group showed a 3 % decrease in average sales.
Krishna et al. (1983) observed following dysfunctional perceptions about the training programmes among the trainees: training programmes are paid holidays, nomination to training programme is a reward, to be nominated for the training programme one must be idle or infl uential etc.
According to Bramley (1994), measuring the effectiveness of a training programme at the reaction level and or the levels of skills learned or knowledge gained are the most common approaches. Performing the duties properly cannot be achieved, unless they enjoy a set of capabilities which can be obtained by learning and training (Prakash, et al, 2010).
The Four Levels of Evaluation
It is referred to as the Kirkpatrick Evaluation Model, to defi ne the four levels of training evaluation. The four levels of evaluation are:
(1) Reactions to the training: the reaction of the employees and their thoughts about the training experience;
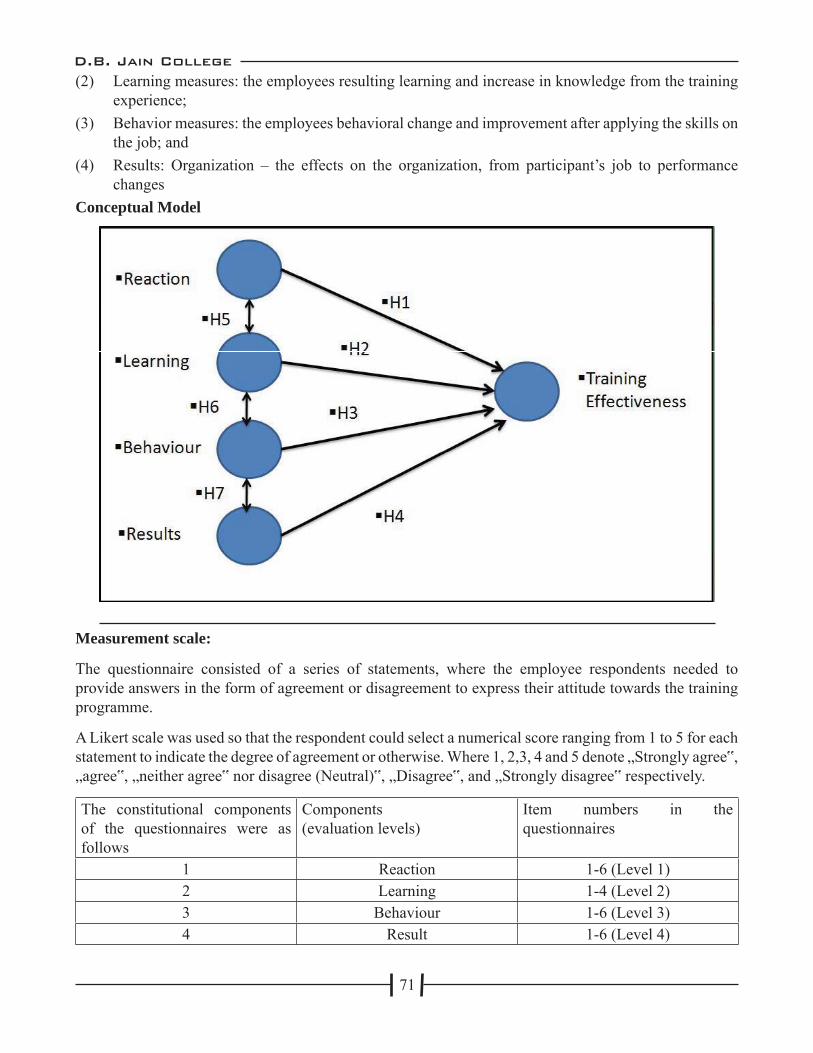
D.B. Jain College
71
(2) Learning measures: the employees resulting learning and increase in knowledge from the training experience;
(3) Behavior measures: the employees behavioral change and improvement after applying the skills on the job; and
(4) Results: Organization – the effects on the organization, from participant’s job to performance changes
Conceptual Model
Measurement scale:
The questionnaire consisted of a series of statements, where the employee respondents needed to provide answers in the form of agreement or disagreement to express their attitude towards the training programme.
A Likert scale was used so that the respondent could select a numerical score ranging from 1 to 5 for each statement to indicate the degree of agreement or otherwise. Where 1, 2,3, 4 and 5 denote „Strongly agree‟, „agree‟, „neither agree‟ nor disagree (Neutral)‟, „Disagree‟, and „Strongly disagree‟ respectively.
The constitutional components of the questionnaires were as follows
Components(evaluation levels)
Item numbers in the questionnaires
1 Reaction 1-6 (Level 1)2 Learning 1-4 (Level 2)3 Behaviour 1-6 (Level 3)4 Result 1-6 (Level 4)
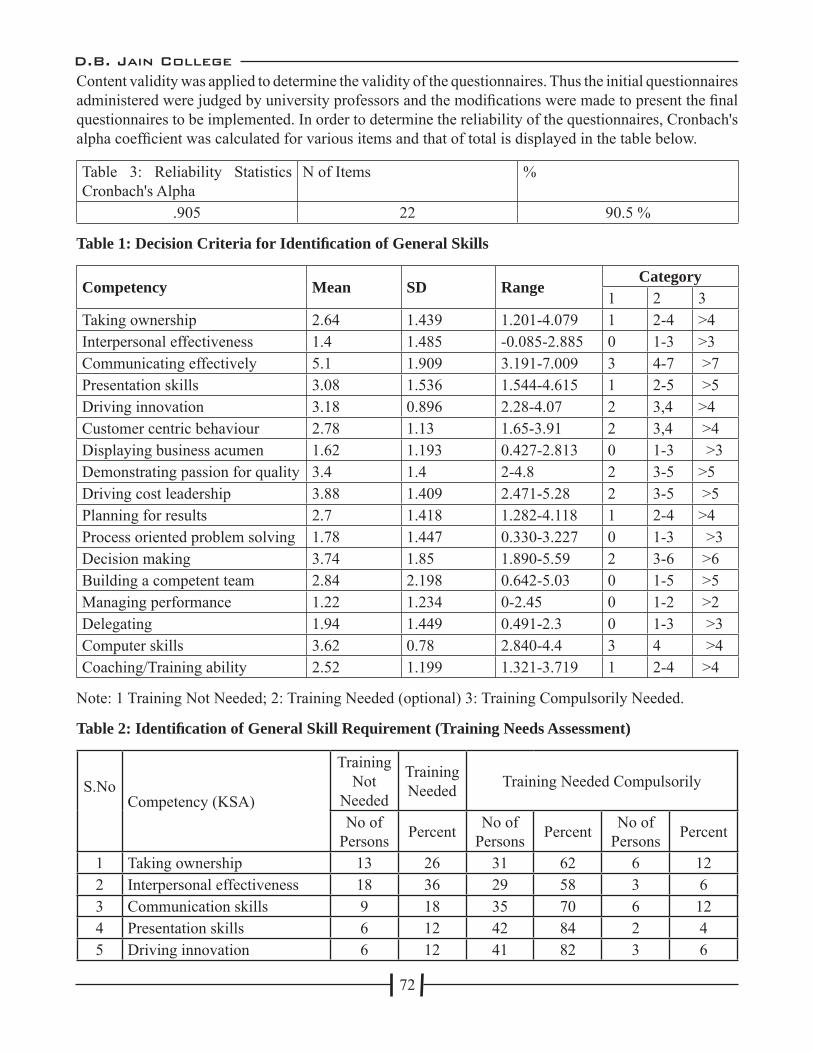
D.B. Jain College
72
Content validity was applied to determine the validity of the questionnaires. Thus the initial questionnaires administered were judged by university professors and the modifi cations were made to present the fi nal questionnaires to be implemented. In order to determine the reliability of the questionnaires, Cronbach's alpha coeffi cient was calculated for various items and that of total is displayed in the table below.
Table 3: Reliability Statistics Cronbach's Alpha
N of Items %
.905 22 90.5 %
Table 1: Decision Criteria for Identifi cation of General Skills
Competency Mean SD RangeCategory
1 2 3Taking ownership 2.64 1.439 1.201-4.079 1 2-4 >4Interpersonal effectiveness 1.4 1.485 -0.085-2.885 0 1-3 >3Communicating effectively 5.1 1.909 3.191-7.009 3 4-7 >7Presentation skills 3.08 1.536 1.544-4.615 1 2-5 >5Driving innovation 3.18 0.896 2.28-4.07 2 3,4 >4Customer centric behaviour 2.78 1.13 1.65-3.91 2 3,4 >4Displaying business acumen 1.62 1.193 0.427-2.813 0 1-3 >3Demonstrating passion for quality 3.4 1.4 2-4.8 2 3-5 >5Driving cost leadership 3.88 1.409 2.471-5.28 2 3-5 >5Planning for results 2.7 1.418 1.282-4.118 1 2-4 >4Process oriented problem solving 1.78 1.447 0.330-3.227 0 1-3 >3Decision making 3.74 1.85 1.890-5.59 2 3-6 >6Building a competent team 2.84 2.198 0.642-5.03 0 1-5 >5Managing performance 1.22 1.234 0-2.45 0 1-2 >2Delegating 1.94 1.449 0.491-2.3 0 1-3 >3Computer skills 3.62 0.78 2.840-4.4 3 4 >4Coaching/Training ability 2.52 1.199 1.321-3.719 1 2-4 >4
Note: 1 Training Not Needed; 2: Training Needed (optional) 3: Training Compulsorily Needed.
Table 2: Identifi cation of General Skill Requirement (Training Needs Assessment)
S.No
Competency (KSA)
Training Not
Needed
Training Needed Training Needed Compulsorily
No of Persons Percent No of
Persons Percent No of Persons Percent
1 Taking ownership 13 26 31 62 6 122 Interpersonal effectiveness 18 36 29 58 3 63 Communication skills 9 18 35 70 6 124 Presentation skills 6 12 42 84 2 45 Driving innovation 6 12 41 82 3 6

D.B. Jain College
73
6 Customer centric behaviour 22 44 25 50 3 67 Business acumen 3 6 42 84 5 108 Passion for quality 17 34 29 58 4 89 Cost leadership 4 8 40 80 6 1210 Planning skills 9 18 35 70 6 1211 Problem solving 11 22 34 68 5 1012 Decision making 15 30 31 62 4 813 Building a competent 3 6 37 74 10 2014 Managing performance 17 34 26 52 7 1415 Delegating 3 6 38 76 9 1816 Computer skills 21 42 23 46 6 1217 Coaching/training ability 8 32 41 46 1 22
Analysis and Results
In this study identifi cation of training needs for both general and technical skills categories are prioritized into three different phases. Number of preferences for specifi c training needed was taken as a basis for prioritizing training programmes. Competency based training needs of respondents were analyzed based on estimation of mean and standard deviation given in the decision table (Table 1).Break-up of number of responses received for each competency (general skill) falling under three categories i.e., ‘training not needed’, ‘training needed but optional’ and ‘training compulsorily needed’ are given in Table 2. Break-up of the number of respondents who have opted for ‘training needed’ and ‘training not needed’ for each competency (technical skill) is summarized in Table 3. Training needs identifi ed from the above analysis were then ranked to determine which training needs were more important and to be addressed immediately for imparting. Programmes for general skills were included in Phase I if responses received for training on ‘compulsory basis’ and ‘optional basis’ exceeded 30. Programmes were included in Phase II when responses received for training on ‘essential basis’ and ‘optional basis’ were less than 30; or when there were no Responses for training on ‘optional basis’ and responses received for training on ‘compulsory basis’were less than 5. All such programmes which did not form part of Phase I and II were included in Phase III.
For technical skills if number of responses for specifi c training programmes were more than 40 then such programmes were included in Phase I. On the other hand, if responses for different programmes (technical skills) were more than 20 but less than 40 then these were included in Phase II (Table 4 and 5).
Conclusion
A business' most important asset is often its people. Training and developing them can be one of the most important investments a business can make. The right training can ensure that your business has the right skills to tackle the future. It can also help attract and retain good quality staff, as well as increasing the job satisfaction of the employees and increasing the chances that they will satisfy the customers. A company’s training and development pays dividends to the employee and the organization. Based on the data collected and analyzing the same, it is concluded that the Training and Development Programmes conducted in the IT Companies is good. Training and development programmes have positive impact on the performance of the employees in these companies. The companies should try to make the training programmes more effectively by using the latest technology and also provide more benefi ts to the employees those who have well trained and contribute more to the organization.

D.B. Jain College
74
In this study competency based training analysis was carried out in respect of middle management personnel of deputy manager / manager levels in IT companies. Training needs identifi ed was shortlisted and prioritized in three phases depending on number of responses received for each category. Based on this prioritization training calendar was developed for fulfi lling the competency development objectives. This calendar was developed in a manner that it did not affect normal work schedule of the concerned employees. As in many similar studies sample size was more representative rather than comprehensive due to practical constraints. While the study was limited to middle level executives only, but in the same way it can be extended to other grades of employees as well besides deputy managers and managers.
References
1. DHHS (1986) Developing A Head Start Training Plan, U.S. Department of Health and Human Services,Washington D.C. www.bmcc. eduheadstart/trngds/trainplan.
2. Menon, J. (2004) “Competency Based Approach”, Human Asset, 1 (4).
3. Pattanayak, B. (2003) Human Resource Training, New Delhi: S. Chand & Company Ltd.
4. Ray, L. (2003) How to Plan and Design Training Programmes. New Delhi: Infi nity Books.
5. Sah, A.K. (1991) Systems Approach to Training and Development. New Delhi: Sterling Publishers Pvt. Ltd.
6. Sanghi, Seema (2004) The Handbook of Competency Mapping: Understanding, Designing and Implementing Competency Models in Organizations. New Delhi: Response Books (A division of Sage Publications).
7. Phillip Lewis and Adrian Thorhill (1994), ‘The evaluation of Training: an organisational culture Approach’, Journal of European Industrial Training, Vol.18, No.8, pp 25-32.
8. Yadapadithaya, P.S. (2001). Evaluating corporate training and development: An Indian experience. International Journal of Training and Development, 5(4), 261-274.

D.B. Jain College
75
ENTREPRENEURIAL TRAINING PERCEPTION ON MSME-DI (MICRO, SMALL AND MEDIUM ENTERPRISE -DEVELOPMENT INSTITUTE)
(A Study with reference to Chennai City)Mrs.T.S.Bhuvaneswari, Dr.V.SelvanathanResearch Scholar, Research Supervisor and Guide,Bharathiar University, Associate Professor,Coimbatore. HOD, Department of Commerce, Ambedkar Govt. Arts College, Chennai.ABSTRACT
Training is essential in every organization in order to acquire knowledge and skill. It is a systematic process through which an organization’s human resources gain knowledge and develop skills by instruction and practical activities that result in improved corporate performance. Training is given by the ministry of Micro, Small, and Medium enterprises in various fi elds enhance the potentials of the prospect entrepreneurs. The purpose of the paper is to assess the trainees’ expectations and their perceptions. It examines the trainees’ expectations before the training and their perceptions after the transfer of knowledge. The fi ndings reveal that that 83.7% entrepreneurs always prefer new product training. It shows that all the entrepreneurs intended to venture on an innovative business to obtain maximum profi t. The most popular trainings are given to the entrepreneurs in the form of module wise short sessions. The research concludes that full day class training programs, and on the job training programme includes skills in the entrepreneurial development process. Further, it is identifi ed that, selling skill training and marketing strategies for entrepreneurs are very essential for them to sustain their business.
INTRODUCTION
The role and importance of Micro, Small and Medium enterprise sector to the economies of countries has been recognized and documented all over the world. According to International Labor Organization (Nov 2014), Micro, Small and Medium enterprises are the biggest employment creators in both industrialized and emerging economies. In cases where formal labor markets do not offer enough jobs, out of necessity, people often turn to entrepreneurial activities for economic survival. Equally, Small and Medium enterprise sector is one of the most prolifi c sources of employment as well as the breeding ground for micro, small and medium industries which are critical.
In India, MSMEs account for nation development through high contribution to domestic production, signifi cant export earnings, low investment requirements, operational fl exibility, location wise mobility, low intensive imports, capacities to develop appropriate indigenous technology, import substitution, contribution towards defense production, Technology oriented industries, competitiveness in Domestic and Export Markets and Generate new entrepreneurs by providing knowledge and training.
In India, the MSMEs play a pivotal role in the overall industrial economy of the country. It contributes 8 percent of the country’s Gross Domestic product, 45 percent of the manufactured output and 40 percent of its exports. The MSMEs provide employment to about 60 million persons through 26 million enterprises.
Chennai city occupies the second position compared to all the districts in Tamilnadu which shows a considerable increase in the total number of entrepreneurs in the MSME sector, the total number of entrepreneurs in the Tamilnadu district during the year 2007 -2013 has increased from 27,209 to 70639 respectively (msme.gov.in).
D.B. Jain College
76
PERCEPTION OF ENTREPRENEURS IN TRAINING AND DEVELOPMENT PROGRAMME:
‘Entrepreneurs are not only born, but can also be trained and developed’. Entrepreneurial development programmes help the potential entrepreneur to set-up his business enterprise appropriate to his abilities and liking. Entrepreneurial development is an organized and continuous process which enhances the skill and knowledge of entrepreneur. It has become necessary for organizations to provide long and systematic training and development programs for its employees This is because every aspect and activity of an organization involve people. Training was accepted as one of the common factors of most entrepreneurship development strategies.
A well trained entrepreneur will portray most of entrepreneurial traits. The traits will be translated into business growth with the following results such as satisfi ed customers, customer loyalty and increase in sales volume, satisfi ed workers, reduced labour turnover and increase in capital investment and employment creation (Peter Paul Kithae, 2013).
The purpose of the paper is to assess the trainees’ expectations and their perceptions. It examines the trainees’ expectations before the training and their perceptions after the transfer of knowledge. Transfer of knowledge means the interactions among the trainer and the trainees and the content and method, during the training process. Perception means what the trainees basically feel/perceive about the training contents, methodology and trainer competencies. The responses from the trainees related to the various factors of motivational factors, training objectives and effectiveness of training. The main goal of this work is to measure the trainees’ expectations and their perceptions towards dimensions of the training.
REVIEW OF LITERATURE:
Driskell (2011), concluded that type of training implemented, training content and trainee expertise also affect the training outcomes. The success of a training programme always depends on how the training was given, what was the content and who was the trainer.
Ficher and Ronald (2011), stated that open mindedness is also a signifi cant moderator of training effectiveness. It has been found that training becomes more successful if the participants and trainer work with open-mindedness.
Abduh (2012), found that most of the knowledge provided in the entrepreneurship education is important is for students, especially business plan, fi nancial planning and fi nancial report. Students are more satisfi ed with the innovative teaching method and not satisfi ed with the traditional method. Hence the improved and developed teaching methods and updated materials should be supplied to students to understand the entrepreneurship.
Tabassi, et al. (2012) studied about the relationship between training and motivation that training and motivation can sustain or increase employees’ current productivity. Motivation can infl uence the willingness of an employee to follow the training programme, to exert more energy toward the programme and to transfer what they learn onto the job.
D. Ayub Khan Dawood et.al (2013), it found that the MSME sector has contributed to the overall growth of GDP as well as the employment generation with low capital investment and it is an engine for economic growth and development.
Mehedi Hasan Md. Et.al (2013), it is found that banks arrange an adequate number of training programs to update knowledge, Skills and Attitudes(KSA), the study concluded that training objectives are not
D.B. Jain College
77
well communicated, training methods that are used are ineffective, obsolete materials are supplied and participants perceive that programs are not well organized.
Prashant Khullar (2013), stated it is not just about providing training, but the overall development of the person to be able to handle more and more responsibilities.
Sam B.A.Tende(2014), the result shows that government credit policies and programs have no signifi cant effect on the development of entrepreneurial benefi ciaries of the EDP program and it is recommended that governments enforce laws and regulations that link institutional development and the entrepreneurial endeavor and to create an environment that will encourage entrepreneurs to develop business and new ventures.
Shah Rollah Abdul Wahab et.al (2014), It is observed that employees neither motivated nor they perceive training very important in the current situations as they see no benefi ts.It is found that the training and development programmes are not that much effective as the employees are not productive enough according to organizational expectation.
P.S.Vijayalakshmi (2014), the result revealed that participants are satisfi ed about institute’s teaching methodology, facilities and equipment provided in the training institute and information about the training is mostly known through advertisement and friends.
STATEMENT OF THE PROBLEM
Entrepreneurship training program is one of the most complicated challenges of MSME in India. Some of the authors argued about the relationship between the effectiveness of training and development of MSME. None of the authors argued direct relationship between Perception of Entrepreneurial Training of MSME in Chennai city and they have not explored and neither do we have empirical evidence to explain the research. Hence this study helps to identify the factors for training and development in MSME and entrepreneurial perception towards training.
OBJECTIVES OF THE STUDY:
To study the training programme in MSME providing Entrepreneurial skill development to the unemployed youth.
To study the perception of the trainees to take the training programme. To study the relationship between the factors and also to measure the satisfaction level of the
trainees of MSME.METHODOLOGY
This study is based on both primary and secondary data. The primary data is collected from trainees attended the training programme in MSME- DI. The structured Questionnaire consists of entrepreneur’s perception of nature, of training, methods of training and effectiveness of training. These Perceptions are identifi ed through Likert’s 5 Point scale as well as optional type questions
The researcher circulated around 500 questionnaires and obtained 404 responses in a completed form. Since the population of entrepreneur attending the training programme is fi nite. Therefore, the researcher used simple random sampling method to attain the samples.
After the collection of data, the researcher used simple percentage analysis, t-test, F-test and linear multiple regression analysis to analyze the data.

D.B. Jain College
78
ANALYSIS AND DISCUSSION
The following frequency distribution reveals training methods preferred in MSME-DI for the entrepreneurs.
Table-1
TRAINING METHODS
S.No. Training Methods Prefer Not Prefer Total1. Full day classroom training 262(64.9%) 142(35.1%) 404(100%)2. On the job (observation &
Demonstration)318(78.7%) 86(21.3%) 404(100%)
3. New product training 338(83.7%) 66(16.3%) 404(100%)4. Product Refresher training 322(79.7%) 82(20.3%) 404(100%)5. Selling Skills training 302(74.8%) 102(25.2%) 404(100%)6. Workshop, Role plays, Case studies 314(77.7%) 90(22.3%) 404(100%)7. One to one coaching sessions 336(83.2%) 68(16.8%) 404(100%)8. Module wise short sessions 336(83.2%) 68(16.8%) 404(100%)9. Online Training 274(67.8%) 130(32.2%) 404(100%)10. Need based training 308(76.2%) 96(23.8%) 404(100%)
Source: Primary Data
From the above table it is found that full day classroom training method is preferred by 64.9% entrepreneurs and on the job training method is preferred by 78.7% and new product training method is conveniently accepted by 83.7% entrepreneurs.
The Product Refresher training method is preferred by 79.7% entrepreneurs and selling skills training method is preferred by 74.8% entrepreneurs and Workshop, Role plays, Case studies training methods is conveniently accepted by 77.7% entrepreneurs.
The one to one coaching sessions method is preferred by 83.2% entrepreneurs and module wise short session training method is preferred by 83.2% entrepreneurs and online training method is preferred by 67.8% entrepreneurs and Need based training method is conveniently accepted by 76.2% entrepreneurs.
Infl uence of Training methods on Effectiveness of training
In this section, the researcher intended to identify the infl uence of different training methods available in the MSME-DI and their effectiveness in improving the entrepreneurial skills. Therefore the researcher considered training methods as independent variables and total average scores of training effectiveness as the dependent factors.
The application of Linear Regression analysis brought the following results:
Table-2
Model R R Square Adjusted R Square Std. Error of the Estimate
1 .404(a) .163 .142 1.07619

D.B. Jain College
79
a Predictors: (Constant), TM10, TM1, TM2 , TM9, TM5, TM7, TM8, TM3, TM4, TM6
Source: Primary Data
From the above table it is found that R=.404, R2=.163, adjusted R2=.142 and standard error of the estimated 1.076. This shows that the training methods create 16.3% variance over the effectiveness of training programmes. The following ANOVA table describes the fi t of Regression relating training methods and effectiveness of training:
Table-3
ANOVA(b)
Model Sum of Squares
Df Mean Square
F Sig.
1 Regression 88.604 10 8.860 7.650 .000(a)Residual 455.168 393 1.158Total 543.772 403
a Predictors: (Constant), TM10, TM1, TM2 , TM9, TM5, TM7, TM8, TM3, TM4, TM6
sb Dependent Variable: EOF1
Source : Primary data
From the above table it is found that F=7.650, P=.20, are statistically signifi cant at the 5% level. Therefore, it can be concluded that the Regression fi t is good enough to predict effectiveness of training through training methods.
The individual infl uence of training method is determined through the following coeffi cient Table-4
Model Unstandardized Coeffi cients
Standardized Coeffi cients
t Sig.
B Std. Error Beta B Std. Error1 (Constant) 4.648 .261 17.797 .000
TM1 -.681 .135 -.280 -5.050 .000 TM2 -.286 .109 -.150 -2.625 .009 TM3 .016 .163 .006 .100 .920 TM4 -.085 .193 -.030 -.442 .658 TM5 .867 .176 .324 4.937 .000 TM6 .593 .207 .213 2.870 .004 TM7 -.079 .186 -.025 -.424 .672 TM8 -.627 .196 -.202 -3.198 .001 TM9 -.199 .167 -.080 -1.190 .235 TM10 -.064 .144 -.028 -.443 .658
a Dependent Variable: EOF1

D.B. Jain College
80
Source : Primary data
From the above table, it is found that classroom training (Beta=-.280, t=-5.050, p=.000), on the job training (Beta=-.150, t=-2.625, p=.009), Selling skills training (Beta=.324,t=4.937, p=.000), workshop case studies (Beta=.213, t=2.780, p=.004), and module wise short sessions (Beta=.202, t=-3.198, p=.001) are statistically signifi cant at the 5% level. Therefore, it can be concluded that training methods followed in MSME-DI is highly signifi cant in creating entrepreneurial skills among the entrepreneurs.
FINDINGS AND CONCLUSIONS
The research concludes that 83.7% entrepreneurs always prefer new product training. It shows that all the entrepreneurs intended to venture on an innovative business to obtain maximum profi t. The most popular trainings are given to the entrepreneurs in the form of module wise short sessions. The research concludes that full day class training programs, and on the job training programme includes skills in the entrepreneurial development process. Further, it is identifi ed that, selling skill training and marketing strategies for entrepreneurs are very essential for them to sustain their business.
The workshop case studies are found useful to entrepreneurs for day to day skill requirements and make them to remember and apply the solutions use to the case studies to solve the problems in the workshop. It is profoundly concluded that training methods adopted in the MSME-DI is the need hour to develop the entrepreneurial skill.
REFERENCES
Indian Labor organization, Entrepreneurship and SME training(Nov 2014), pg.1-4.
msme.gov.in
Driskell, James E.(2011).”Effectiveness of Deception Detection Training: A Meta-Analysis”, Psychology, Crime & Law,10(2011) pp.1-19.
Fischer, R. (2011). “Cross-Cultural Training Effects on Cultural Essentialism Beliefs and Cultural Intelligence”, International journal of Intercultural Relations, 35(6), pp.767-775.
Abduh, M.(2012). A case study of Bengukulu university. An evaluation of the Entrepreneurship education in Indonesia, 871-882. Retrived from http://www.ijoi-online.org/attachments/article/30.
Tabassi, Amin A., Mahyuddin, R. and Abu, Hassan A.B.(2012). “Effects of training and motivation practices on teamwork improvement and task effi ciency: The case of construction fi rms”, International journal of project management, 30(2),pp.213-224.
Ayub Khan Dawood & Ishtiyaq Hussain (Dec2013).Entrepreneurship Development in MSME sector – A Focus, KPCJMR, pp.20-25.
Mehedi Hasan et al.(2013). Employee perception towards effective training program: A study on some selective private commercial banks, European Journal of Business Management, ISSN 2222-1905 (paper) ISSN 2222-2839(online), Vol-5, No.12,2013.
Prashant Khullar, Director-Human Resources, Luxury Hotels, Taj Hotels Resorts & Palaces. 14 June, 2013, Published on express hospitality.com
Sam B.A. Tende et al. (2014). Government initiatives towards entrepreneurship development in Nigeria, Global Journal of Business Research, vol-8, no-1,pp.109-120.

D.B. Jain College
81
Shah Rollah Abdul Wahab et.al., (2014) Employees’ perception and Motivation towards Training and Development programmes in Health sector of Pakisthan: A case study of Khyber Pakhtunkhwa, Research journal of recent sciences, vol.3(2),Feb.2014,Pp 1-7.
P.S.Vijayalakshmi(2014), Benefi ciaries perception towards entrepreneurship development programme, Indian journal of Applied research,vol-4, 10 Oct 2014,ISSN-2249-555X,pp.105-108.

D.B. Jain College
82
A CASE STUDY OF INDIAN OVERSEAS BANK: THE POST BACKDROP FINANCIAL PERFORMANCE AND STRATEGIES FOR RECOVERY
MECHANISMS. GANAPATHY Dr. M. SAKTHIVEL MURUGANResearch Scholar, Principal (Retd.),Department of Corporate Secretaryship, Dhanraj Baid Jain College,Dhanraj Baid Jain College, Thoraipakkam, Chennai – 600 097. Thoraipakkam, Chennai – 600 097. 1. ABSTRACT
Indian economy has been hailed as the ‘bright spot in the global landscape’, and a new era of optimism and confi dence has dawned for speedy revival in 2014-15. An escalation in growth fi gures and a reduction in the global oil prices have helped our economy. India has done well in few parameters like infl ation-targeting, containing CPI (5.17%) & WPI (-2.33%) based infl ation in March 2015, shoring up reserves, controlling the fi scal defi cit at 4% of GDP in FY15. With the slew of measures, Indian economy has the prospects of witnessing a high and rising growth in the years to come, while simultaneously maintaining macroeconomic stability. Public Sector Banks oversee continued pressure on capital adequacy norms and stressed assets leading to higher provisions. The rise in NPAs in 2014-15 has been attributed to the effect of global recession coupled with internal factors such as slowdown in the domestic economy. This has adversely affected the corporate performance leading to a negative impact on credit quality despite good fundamentals maintained by the RBI and the Government for which the Bank was also a victim. As the investment cycle gathers momentum, the credit demand is expected to pick up with due thrust on MSME/Retail sector and early clearance of stalled projects. The Indian Overseas Bank expect the system to grow moderately at 13% under deposits and 14% in advances for 2015-16. The reforms oriented by Government are raising hopes for a faster pick up of the economy which will help to curb the bad loans and improve credit demand. The Indian Overseas Bank also expects to grow in tune with the banking system, with a major thrust in SME and Retail sector. Thus, an attempt has taken to study the performance of Indian Overseas Bank and the strategies adopted to overcome the post backdrop.
Key Words: Strategies, Advances, NPA, Deposits, Recovery Management, etc.
2. INTRODUCTION
The fi scal year 2014-15 presents a picture of contrasting economic trends. Among the developed economies, on the positive side, the United States has succeeded in consolidating its recovery and thereby increasing momentum to other economies. Likewise, United Kingdom and Australia, are expected to sustain their growth. Many European countries on stagnation showed little visibility of recovery despite the European Central Bank’s positive measures. Similarly, Japan does not seem to be responding well to the stimulus mode. The present slowdown in Chinese economy may carry signifi cant spillover risks to certain other countries. Indian economy has been hailed as the ‘bright spot in the global landscape’, and a new era of optimism and confi dence has dawned for speedy revival. Among emerging economies, Indian economy is on a trajectory path with 7.4% growth in April to Dec 2014 compared to 7.0% in the same period of its preceding year on the back of controlled infl ation, rise in domestic demand, increase in investments, decline in oil prices and reforms among others. Medium term growth prospects have improved following effective policy measures towards unlocking coal and other mining activities, liberalisation of FDI limits and a renewed thrust on public investment in infrastructure which would help to improve the investment climate. The Consumer Price Index (CPI) and Wholesale Price Index (WPI) for March 2015, indicate that infl ation pressures remain subdued. Headline infl ation at 5.17% during March, 2015 is in line with

D.B. Jain College
83
the readings over the past few months. Wholesale price infl ation was negative at 2.33% during March, 2015, compared with 6% a year ago.The combination of tight monetary policy, softer commodity prices and price stabilization measures have helped to contain infl ationary measures at the macro level in the midst of monsoon at below normal.
Despite India’s brighter economic prospects, Public Sector Banks oversee continued pressure on capital adequacy norms and stressed assets leading to higher provisions. The Government has made capital infusion for a fewer Banks on the strength of performance levels, the recent developments indicate that it will support capital infusion for the needy Banks in support of providing good balance sheet management. As the investment cycle gathers momentum, the credit demand will pick up due to thrust given to MSME/Retail sector and early clearance of stalled projects. With this the bank expects the system to grow moderately at 13% under deposits and 14% in advances for 2015-16.
3. PROFILE OF INDIAN OVERSEAS BANK
Indian Overseas Bank (IOB), is unique in many respects. Its birth was simultaneously at two places. In 1937 it was established at Madras (Chennai) and at birth itself like the mythical 'Hanuman', it jumped across the Indian borders and started functioning in Kuala Lumpur (Malaysia). Its founding father, M. Ct. M. Chidambaram Chettyar was the youngest banking genius barely under the thirties. Banking was in his genes. Normally banks in India at initial stages had the modest objective of serving the locals; but, IOB spread its wings in international markets. Again, usually, Indian banks, as and when they ventured abroad, they turned to the West but IOB couriered to the East. Thus, from the beginning, IOB has unique attributes which it has preserved and polished during its long journey of 75 years, with an imaginative slogan, "Touching Hearts and Spreading Smiles."
Indian Overseas Bank (IOB) is a major public sector bank based in Chennai (Madras), with about 3700 domestic branches, including 1150 branches in Tamil Nadu, 3 extension counters, and eight branches and offi ces overseas as of 30 September 2014. Indian Overseas Bank has an ISO certifi ed in-house Information Technology department, which has developed the software that its branches use to provide online banking to customers; the bank has achieved 100% networking status as well as 100% CBS status for its branches. IOB also has a network of about 3300 ATMs all over India. IOB has branches in Singapore, Hong Kong, Colombo, Seoul, and Bangkok. It has representative offi ces in Guangzhou, Vietnam, and Dubai. IOB also is part-owner of a joint-venture bank in Malaysia.
4. REVIEW OF LITERATURE
Muniappan (2002) studied paradigm shift in banks from a regulator point of view in Indian Banking. He concluded the positive effect of banking sector reforms on the performance of banks. He suggested many effective measures to strengthen the Indian banking system. The reduction of NPAs, more provisions for standards of the banks, IT, sound capital bare are the positive measures for a paradigm shift. A regulatory change is required in the Indian banking system.
Qamar (2003) identifi ed the differences in terms of endowment factor, risk factor, revenue diversifi cation, profi tability, and effi ciency that might have existed among 100 scheduled commercial banks, divided into three groups for the year 2000-2001. His study revealed that the public sector banks were better endowed in terms of their assets base, share capital and shareholders equity than other banks, whereas foreign banks and old private sector banks operated at a very high capitalization ratio.
Singla HK (2008) has examined that how fi nancial management plays a crucial role in the growth of banking. It is concerned with examining the profi tability position of the selected sixteen banks of banker
D.B. Jain College
84
index for a period of six years (2001-06). The study reveals that the profi tability position was reasonable during the period of study when compared with the previous years. Strong capital position and balance sheet place, Banks in better position to deal with and absorb the economic constant over a period of time.
Dangwal and Kapoor (2010) evaluated the fi nancial performance of nationalized banks in India and assessed the growth index value of various parameters through overall profi tability indices. The data for 19 nationalized banks, for the post-reform period from 2002-03 to 2006-07, was used to calculate the index of spread ratios, burden ratios, and profi tability ratios. They found that while four banks had excellent performance, fi ve achieved good performance, four attained fair performance, and six had poor performance.
Sharma (2010) assessed the bank failure resolution mechanism to analyze the powers given by the countries to their regulators to carry out resolution of failed banks among 148 countries during 2003. The author has used 12 variables for correlation and regression analysis. The study revealed that the countries which had faced systemic crisis were more prone to providing liquidation powers to their regulators. These countries had a tendency to protect their regulators through immunity, rather than any legal action. Systemic crisis did not signifi cantly infl uenced the regulators’ powers for the restructuring of the banks.
Jha and Sarangi (2011) analyzed the performance of seven public sector and private sector banks for the year 2009-10. They used three sets of ratios, operating performance ratios, fi nancial ratios, and effi ciency ratios. In all eleven ratios were used. They found that Axis Bank took the fi rst position, followed ICICI Bank, BOI, PNB, SBI, IDBI, and HDFC, in that order.
5. OBJECTIVES OF THE STUDY
1. To study the journey of backdrop fi nancial performance of Indian Overseas Bank.
2. To examine the banks strategies for recovery mechanism.
6. METHODOLOGY
To accomplish the objectives of the study, secondary data were used. It has been collected from bank records, published and unpublished fi nancial reports, journals, magazines and websites. The study is and covers a period from 2010-11 to 2014-15. Financial performance of the Indian Overseas Bank was analyzed for the period of fi ve years. The study is more confi ned to the fi nancial year 2014-15 since the backdrop was occurred during the fi nancial year 2014-15. Therefore, the performance has divided into four quarters of the fi nancial year 2014-15. The study has also focused on the current fi nancial year 2015-16 i.e., quarter 1 results of Indian Overseas Bank have been studied.
7. FINANCIAL PERFORMANCE
7.1 QUARTER 1 RESULT 2014-15 – JUNE 30, 2014
• Indian Overseas Bank has more than doubled its net profi t for the quarter ended June 30, 2014, at 271.72 crore, from 124.79 crore reported for the comparable quarter in the previous year.
• Total income stood at 6,284.69 crore, up from 6,187.15 crore registered last year.
• Gross NPA (non-performing assets) at the end of the quarter stood at 5.84 per cent ( 10,350 crore) against 4.45 per cent ( 7,432 crore) last year. Net NPA was at 3.85 per cent ( 6,643.62 crore) as against 2.81 per cent ( 4,580 crore) in the corresponding quarter of 2013-14.
D.B. Jain College
85
• Announcing the results at a press conference here, M Narendra, Chairman and Managing Director of the bank, said the slippage during the quarter increased to 2,649 crore, from 1,800 crore in the previous-year quarter. He attributed the steep increase mainly to 380-crore slippage reported by its Singapore branch.
• The bank has funded many Indian subsidiary companies in Singapore. Though most of them have been servicing their loan regularly, the Singapore regulatory authority downgraded certain accounts on the basis of inherent weaknesses of their parent companies back in India.
• The CASA (current account savings account) ratio stood at 24.5 per cent (25.61 per cent). It plans to open 400 new branches during the current fi scal, which will take the total number of branches to over 3,700 by the end of the year.
7.2 QUARTER 2 RESULTS 2014-15 – SEPTEMBER 30, 2014
• Indian Overseas Bank today reported a net loss of Rs 245.51 crore for the second quarter ended September 30 due to higher tax expenses and provisions for bad assets. The bank had reported net profi t of Rs 132.55 crore during July-September quarter in the previous fi scal.
• Total income has increased from Rs 5,999.75 crore for the quarter ended September 30, 2013 to Rs 6,440.77 crore for the quarter ended September 30, 2014.
• The bank made provisioning for bad loans to the tune of Rs 892.38 crore in the second quarter of 2014-15, up from Rs 619.90 crore in the same period a year ago.
• Tax expenses during the quarter under review went up at Rs 82.57 crore, against Rs 38.55 crore a year ago.
• Also, the asset quality of the bank deteriorated signifi cantly as gross non-performing assets (NPAs) or bad loans rose to 7.35 per cent of total advances, while it was at 4.65 per cent a year ago.
• Net NPAs in Q2FY15 also increased to 5.17 per cent from 2.83 per cent a year ago.
• Indian Overseas Bank shares traded at Rs 57.15 per piece on the BSE, down 4.11 per cent from previous close.
7.3 QUARTER 3 RESULTS 2014-15 – DECEMBER 31, 2014
• IOB is the fi rst public sector lender to post a loss during the quarter among banks which have announced their results. Indian Overseas Bank (IOB) reported a net loss of Rs. 516.03 crore for the quarter ended December 2014 due to higher provisioning for bad loans. The Chennai-based lender had earned a net profi t of Rs. 75.07 crore in the October-December quarter of 2013-14.
• The net loss is due to increased provisioning for domestic and overseas advances and also due to the bank’s conscious decision to contain its credit growth, IOB said in a statement.
• The poor performance pulled the bank's share price down by nearly 10 per cent to Rs. 50.50 on the BSE after the numbers were announced.
• Gross NPAs as a percentage of total advances rose to 8.12 per cent from 5.27 per cent in the same quarter a year ago. Its net NPAs went up to 3.52 per cent from 3.24 per cent at the end of December 2013, IOB said in a statement. Gross NPAs in absolute terms rose to Rs. 14,500.51 crore as compared to Rs. 9,168.08 crore at the end of December 2013.

D.B. Jain College
86
• As a result of this, total provisions, excluding for income-tax, rose to Rs. 1,183.04 crore as against Rs. 811.24 crore in the year-ago period.
• The total income increased to Rs. 6,647.45 crore for the quarter ended December 31, 2014 from Rs. 6,190.26 crore in the same quarter last fi scal.
• Operating profi t also declined to Rs. 726.32 crore as against Rs. 960.73 crore in the year-ago period.
• The net interest income improved marginally to Rs. 1,356.85 crore as compared to Rs. 1,344.45 crore in the same quarter a year ago. The net interest margin stood at 2.05 per cent at the end of the third quarter.
• During the fi rst three quarters of 2013-14, IOB registered a net loss of Rs. 489.82 crore as against a profi t of Rs. 333.41 crore in the year-ago period.
• Total business, as on December 31, stood at Rs. 4,11,354 crore, as against Rs. 3,87,406 crore at the end of the third quarter of 2012-13, registering 6.18 per cent growth.
7.4 QUARTER 4 RESULTS 2014-15 – MARCH 31, 2015
• The bank reported a modest 35-crore net profi t for the quarter ended March 31, 2015, which is a steep 87 per cent drop from the 268 crore in the comparable quarter of the previous year. For fi scal 2014-15 (FY15), it reported a net loss of 454 crore as against a net profi t of 602 crore in the previous year (FY14).
• Operating profi t of the bank improved during the fourth quarter of 2014-15 to 1,180 crore from 726 crore in the corresponding period of the previous year. The net loss is due to higher provisioning and loss of interest on NPAs.
• The bank has speeded up its recovery mechanism, which resulted in a cash recovery of 780 crore in the fourth quarter ( 401 crore in the the year-ago period).
• As the bank was in consolidation mode, the credit growth was contained consciously in the backdrop of low credit offtake.
7.5 QUARTER 1 RESULT 2015-16 – JUNE 30, 2015
• Indian Overseas Bank has reported a 95 per cent drop in net profi t for the fi rst quarter of the current year as compared with the corresponding quarter previously.
• For the quarter ended June 30, 2015, the bank has reported a net profi t of 14.76 crore ( 271.72 crore).
• IOB's total income grew to Rs 6,672.11 crore in the quarter under review, up 6.16 per cent from Rs 6,284.69 crore during the same period of 2014-15 fi scal.
• Gross NPA was up nearly 60 per cent 16,451 crore ( 10,350 crore) and Net NPA too jumped 60 per cent to 10,640.43 crore ( 6,643.62 crore). Employee cost grew 38 per cent to 947.39 crore ( 684.34 crore). Provisions and contingencies in the June quarter stood at Rs 663.57 crore as against Rs 299.27 in the same quarter of the previous fi scal.
• Gross NPA of the bank as on June 30, 2015 stood at 9.40 per cent, as against 5.84 per cent during

D.B. Jain College
87
the same period last fi scal. Net NPA stood at 6.31 per cent in the reported quarter as against 3.85 per cent registered during the same period of the previous fi scal.
• Total business for the April-June 2015 quarter grew to Rs 4,07,026 crore, up 1.96 per cent, from Rs 3,99,188 crore during the year-ago period. The bank total deposits for the quarter grew to Rs 2,32,064 crore from Rs 2,21,879 crore in the year-ago period. Its gross advances were Rs 1,74,962 crore and the provision coverage ratio stood at 50.79 per cent as on June 30, 2015.
7.6 PERFORMANCE HIGHLIGHTS
7.6.1 Net Investments: The Net Investments of the Bank has increased to Rs.81,310 crores as on 31.03.2015 from Rs. 70,237 crore as on 31.03.2014. The return on investments for the year is 7.64% as against 7.60% in 2013-14.
7.6.2 Business Parameters
(Amount in Crores)
Parameters 31.03.2015 31.03.2014Global Business 4,25,090 4,09,057Global Deposits 2,46,049 2,27,976Global Advances 1,79,041 1,81,081Operating Profi t 3,322 3,997Net Profi t / Loss - 454.33 601.74
Source: Indian Overseas Bank, Annual Report 2014-15
2014-15 2013-14 2012-13 2011-12 2010-11
Global Deposits 246,049 227,976 202,135 178,434 145,229Domestic Deposits 239,819 219,731 195,457 172,219 140,381Domestic Gross Advances 162,838 161,992 144,894 125,064 101,270
Global Net Advances 171,756 175,888 160,364 140,724 111,833Priority Sector Advances 63,635 58,090 51,056 42,265 32,648Agricultural Credit 29,236 26,254 23,393 19,416 16,056Net Investments 81,310 70,237 61,417 55,566 48,610Gross Profi t 3,322 3,997 3,817 3,534 2,861Net Profi t / Loss - 454 602 567 1,050 1,073
Source: Indian Overseas Bank, Annual Report 2014-15
7.6.3 Advances: Gross Advances stood at Rs. 1,79,041 crore as on 31st March 2015 as against Rs.1,81,081 crore as on 31st March 2014. As the bank in consolidation mode, credit growth was contained consciously, in the backdrop of low credit take-off.
7.6.4 Net Profi t: The bank turned around its performance during Q4 of 2014-15 registering net profi t of Rs. 35.50 crore as against net loss of Rs. 516.03 crore in Q3 of 2014-15. Net loss for the year ended 31st

D.B. Jain College
88
March 2015 was Rs. 454.32 crore. Strategic initiatives taken in the fourth quarter towards reduction in the cost of deposits, improved recovery performance and stringent measures on cost control contributed to net profi t of Rs. 35.50 crore. Due to increased provisions of Rs. 3,777 crore against operating profi t of Rs. 3,322 crore on NPA, restructured accounts, taxes and fresh slippages of accounts of NPA under prime sector of the economy, which resulted the denial of income accrued thereon resulted in the net loss for the fi nancial year 2014-15.
7.6.5 Gross and Net NPA: Gross NPA as on 31st March 2015 was at Rs.14,922.45 crore with Gross NPA ratio of 8.33% and Net NPA stood at 5.68%. Gross NPA and Net NPA stood at 8.12% and 5.52% respectively. Focused efforts towards recovery and upgradation helped effi cient NPA management has brought down the slippages from Q3 of 2014-15.
7.6.6 Domestic Deposits: The Bank’s total domestic deposits increased from Rs. 2,19,731 crores in March 2014 to Rs. 2,39,819 crores as of March 2015 registering a growth of 9.14%. The Bank’s domestic CASA deposits increased to Rs. 60,786 crores with a growth of 6.86% with CASA at 25.35%. The Bank has opened more than 52 lacs CASA accounts during the year. However, there has been movement of savings deposits to term deposits due to lowering of card rate term deposit rates.
7.6.7 Domestic Advances: Though green shoots appear to be visible in economy, the system has observed lower credit growth during the year. The Domestic gross Advances of the Bank marginally improved to Rs. 1,62,838 crores as of March 2015 as against to Rs. 1,61,992 crores in March 2014.
7.6.8 Priority Sector Credit: The Bank’s Gross Credit under Priority Sector has increased to Rs. 63,635 crores as on 31st March 2015 which is 39 % of Adjusted Net Bank Credit (ANBC) as of March 2014. Further, RBI has revised the Priority Sector classifi cation effective from April 2015.
7.6.9 Agriculture: During the year, the Bank’s agricultural credit stood at Rs. 29,236 crores as on 31st March 2015, thereby registering an incremental growth of Rs. 2,246 crores. The Bank’s ratio of Agricultural Advances to ANBC is 17.92%. The Bank disbursed Rs. 36,033 crores under Special Agriculture Credit Plan (SACP) as against Rs. 35,492 crores last year.
8. KEY FINANCIAL RATIOS 2014-15 2013-14 2012-13 2011-12 2010-11
I. Profi tability RatiosEarnings Per Share -3.68 4.87 6.14 13.18 17.33 Interest Spread 6.91 6.12 6.05 6.34 6.03Adjusted Cash Margin (%) -1.17 2.98 3.06 5.93 8.83Net Profi t Margin -1.89 2.65 2.50 5.36 8.04Return on Net Worth (%) -3.26 4.19 4.21 9.73 13.13Return on Assets 126.61 130.90 145.63 149.66 150.71II. Management Effi ciency RatiosInterest Income / Total Funds 8.60 11.26 8.93 9.59 8.46Net Interest Income / Total Funds 1.93 2.77 2.27 3.08 3.32Non Interest Income / Total Funds 0.77 1.08 0.85 0.21 0.21Interest Expended / Total Funds 6.66 8.49 6.66 6.50 5.13Operating Expense / Total Funds 1.45 1.79 1.42 2.28 2.28Profi t Before Provisions / Total Funds 1.19 1.98 1.65 0.95 1.19
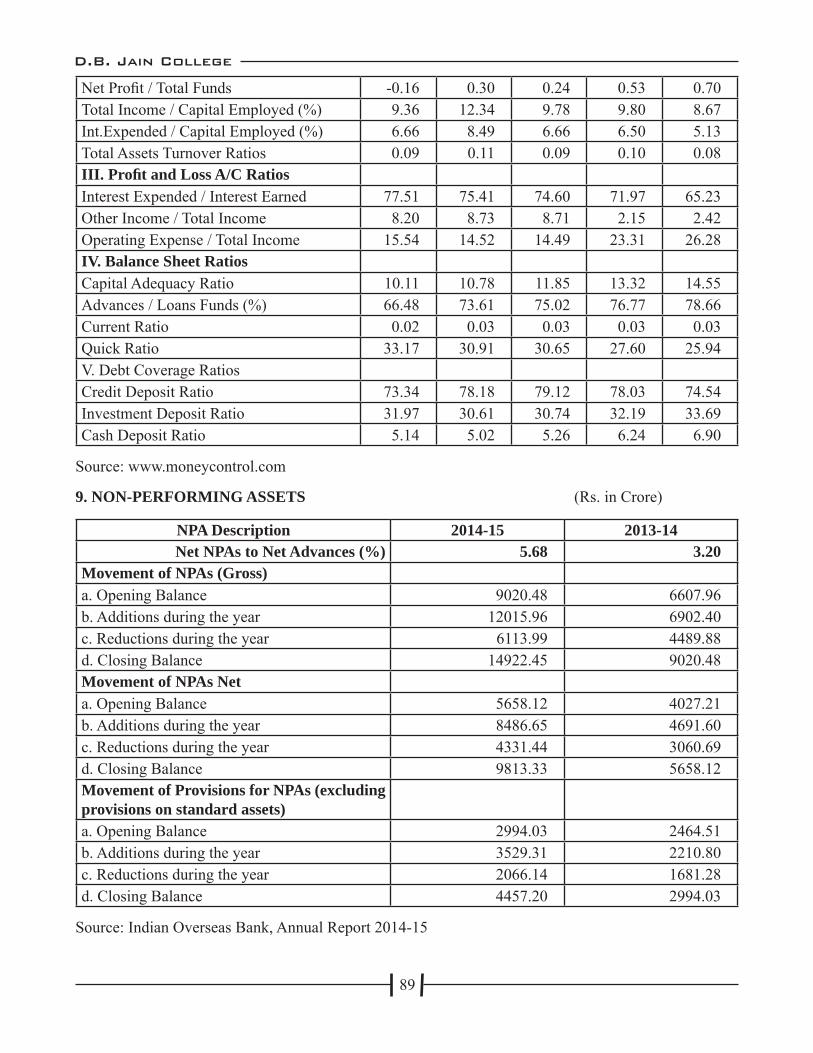
D.B. Jain College
89
Net Profi t / Total Funds -0.16 0.30 0.24 0.53 0.70Total Income / Capital Employed (%) 9.36 12.34 9.78 9.80 8.67Int.Expended / Capital Employed (%) 6.66 8.49 6.66 6.50 5.13Total Assets Turnover Ratios 0.09 0.11 0.09 0.10 0.08III. Profi t and Loss A/C RatiosInterest Expended / Interest Earned 77.51 75.41 74.60 71.97 65.23Other Income / Total Income 8.20 8.73 8.71 2.15 2.42Operating Expense / Total Income 15.54 14.52 14.49 23.31 26.28IV. Balance Sheet RatiosCapital Adequacy Ratio 10.11 10.78 11.85 13.32 14.55Advances / Loans Funds (%) 66.48 73.61 75.02 76.77 78.66Current Ratio 0.02 0.03 0.03 0.03 0.03Quick Ratio 33.17 30.91 30.65 27.60 25.94V. Debt Coverage RatiosCredit Deposit Ratio 73.34 78.18 79.12 78.03 74.54Investment Deposit Ratio 31.97 30.61 30.74 32.19 33.69Cash Deposit Ratio 5.14 5.02 5.26 6.24 6.90
Source: www.moneycontrol.com
9. NON-PERFORMING ASSETS (Rs. in Crore)
NPA Description 2014-15 2013-14Net NPAs to Net Advances (%) 5.68 3.20
Movement of NPAs (Gross)a. Opening Balance 9020.48 6607.96b. Additions during the year 12015.96 6902.40c. Reductions during the year 6113.99 4489.88d. Closing Balance 14922.45 9020.48Movement of NPAs Neta. Opening Balance 5658.12 4027.21b. Additions during the year 8486.65 4691.60c. Reductions during the year 4331.44 3060.69d. Closing Balance 9813.33 5658.12Movement of Provisions for NPAs (excluding provisions on standard assets)a. Opening Balance 2994.03 2464.51b. Additions during the year 3529.31 2210.80c. Reductions during the year 2066.14 1681.28d. Closing Balance 4457.20 2994.03
Source: Indian Overseas Bank, Annual Report 2014-15
D.B. Jain College
90
10. STRATEGIES FOR RECOVERY MANAGEMENT
Bank has 16 specialised Asset Recovery Management Branches (ARMB) to improve the recovery under NPA accounts. The services of Recovery Agents have been utilised to expedite recovery. High value Slippages of Rs. 5 crores and above are being reviewed by the Board and the specifi c directions given by the Board is duly carried out. Top NPA accounts of Rs. 1 Crore and above are monitored from the corporate offi ce on a regular basis and the borrowers are personally met by the General Manager (Law & Recovery) wherever necessary. Top Executives including the Managing Director & CEO, the Executive Director and the General Manager (Law & Recovery) review all high value NPA accounts on a regular basis with fi eld functionaries.
Special schemes empowering Branch Managers to accept One Time Settlements in small value NPA accounts for all NPAs of less than Rs. 1 lakh and above Rs. 1 lakh to Rs. 10 lakhs have been revalidated. An amount of Rs. 425 crores has been recovered in small value NPA accounts with outstanding less than Rs. 10 lakhs. Out of this, recovery in accounts with outstanding less than Rs. 1 lakh was Rs. 92 crores. The recovery in accounts with outstanding of more than Rs. 10 lakhs upto 1 crore is Rs. 307 crores.
Action under SARFAESI act has been initiated in all eligible accounts and properties brought for sale. Frequent Lok Adalats/ Recovery camps have been conducted especially in respect of small value NPA accounts. In the National Lok Adalat conducted on 14th and 22nd Feb 2015, Bank’s participation was signifi cant. 4,727 cases amounting to Rs. 39 crores were settled. An amount of Rs. 5 crores were recovered on the spot. The previous Lok Adalats were conducted on 6th and 23rd Dec 2014, wherein 40,228 cases amounting to Rs. 344 crores were referred. Out of which, 7,747 cases amounting to Rs. 58 crores were settled. Spot cash recoveries received in 5,723 accounts is amounting to Rs. 10 crores.
Ministry of Finance has advised the Banks to initiate recovery action in the matter of RC issued cases. The Bank has appointed Nodal Offi cers at various centres and they are directed to take up all RC issued cases and bring the securities for sale. Bank has been coordinating with Presiding Offi cers/Recovery Offi cers of various DRTs and these one-to-one discussions/deliberations have helped the Bank to identify the issues and speed up the recovery.
During this fi nancial year 524 number of DRT cases have been fi led amounting to Rs. 3,043crores (claim amount). 197 cases involving Rs. 166 crores have been decided. The recovery made in DRT cases is Rs. 119 cores. Cases pending are 2,507 cases amounting to Rs. 7,663 crores (cumulative). The Bank is following up with DRTs closely and trying to bring speedy conclusion to the cases. In these cases DRTs are resorting to e-auction, wherever there are auction proceedings. As against the corporate target of Rs. 2,150 crores for total cash recovery (including recovery from written off accounts and recovery of undebited interest) the achievement was Rs. 2,111 crores. The upgradation of NPAs alone during the year was Rs. 1,425 crores, as against target of Rs. 1,320 crores. In respect of SARFAESI action, the Bank has issued notices for 2,759 cases amounting to Rs. 3,685 crores. Amount Recovered through auction is Rs. 34 crores from 53 accounts whereas amount recovered through compromise is Rs. 168 crores from 653 accounts and partial recoveries were made in 3,295 accounts amounting to Rs. 315 crores.
The Bank focuses on minimizing slippages and endeavor to reduce slippages by rigorous monitoring for asset quality improvement. The Bank also tries to activate the recovery team at Regional Offi ces by extending overall support to branches. It has been providing more tech-based monitoring tools
D.B. Jain College
91
to monitor even small value assets.
The Bank has been putting forth rigorous efforts to ensure 100% review/renewal of accounts in time. The Bank evaluates the latest position of the accounts and formulates statistical projection as self imposed targets. It has introduced systematic supporting measures methods for proactive follow ups. Observations made in Loan Review Mechanism are well informed to credit verticals apart from following up with Zonal Offi ces/ Regional Offi ces/Branches for compliance.
11. CONCLUSION
Public sector lender Indian Overseas Bank (IOB) is expecting to hit profi t led by efforts to reduce bad loans, prevention of slippages, reduction of expenses, and the general recovery in the economy. The bank is concentrating all efforts to recover as much as possible, and also sell a considerable portion of bad loans to asset reconstruction fi rms. It is also in the process of improving services through new IT initiatives, which would result in an increased business. The bank is trying to control the expenses and looks at recovery, upgradation and prevention of slippages going forward. The bank would focus on retail and SME sectors during the current fi scal year 2015-16 for growth prospects. The bank is looking at selling around Rs 500 crore worth NPAs to asset reconstruction companies. Recently RBI has taken initiatives “Prompt Corrective Action” on the lender to improve internal controls and consolidate its business activities. The directions given by RBI are for improving the internal control of the Bank and for the purpose of consolidation of the activities of the Bank. Global ratings agency Standard & Poor's (S&P) had recently assigned Indian Overseas Bank (IOB) a rating of 'BB+', a notch below investment grade, with stable outlook. The rating agency expects the bank's credit costs to remain high because of the bank's weak asset quality, adding that it relies on large capital infusions on an ongoing basis to support its growth because its retained earnings are low. I believe that the Indian Overseas Bank will overcome with these hurdles by concentrating more on NPAs and boom in upcoming years to come.
12. REFERENCES
1. Muniappan (2002) studied paradigm shift in banks from a regulator point of view in Indian Banking : Paradigm Shift, IBA Bulletin, No 24-3.
2. Qamar, Furqan (2003), “Profi tability and Resource Use Effi ciency in Scheduled Commercial Banks in India: A Comparative Analysis of Foreign, New Private-sector, Old Private-sector, and Public-sector”, Synthesis, Vol. 1, No. 1, pp. 1-16
3. Singla HK (2008), ’ fi nancial performance of banks in India,’
4. Sharma, Meera (2010), “A Cross-country Study of Bank Failure Resolution”, Prajnan: Journal of Social and Management Sciences, Vol. 29, No. 1, pp. 7-27
5. Jha, D.K., and D.S. Sarangi (2011), “Performance of New Generation Banks in India: A Comparative Study”, International Journal of Research in Commerce and Management, Vol. 2, No. 1, pp. 85-89
6. Banking, law and practices by Gulshan S.S, Sulthan C hand and son‟s publisher.
7. Annual Reports of Indian Overseas Bank
8. RBI Annual Report 2014-15.
9. RBI statistical table relating to banks

D.B. Jain College
92
10. www.iob.in
11. www.rbi.org
12. www.moneycontrol.com

D.B. Jain College
93