a radial flow contactor for ambient air 2 capture
TRANSCRIPT
applied sciences
Article
A Radial Flow Contactor for Ambient AirCO2 Capture
Qian Yu and Wim Brilman *
Sustainable Process Technology, Fac. Science & Technology, University of Twente,7500 AE Enschede, The Netherlands; [email protected]* Correspondence: [email protected]
Received: 29 December 2019; Accepted: 22 January 2020; Published: 6 February 2020�����������������
Featured Application: Direct Air Capture for microalgae cultivation, horticulture, and solar fuels.
Abstract: Direct air capture (DAC) of CO2 can address CO2 emissions from distributed sourcesand produce CO2 from air virtually anywhere that it is needed. In this paper, the performanceof a new radial flow reactor (RFR) for CO2 adsorption from ambient air is reported. The reactoruses a supported amine sorbent and is operated in a batch mode of operation or semi-continuously,respectively without or with sorbent circulation. The radial flow reactor, containing 2 kg of theadsorbent, is successfully scaled up from the experimental results obtained with a fixed bed reactorusing only 1 g of the adsorbent. In the batch operation mode, the sorbent in the annular space ofthe RFR is regenerated in situ. With sorbent circulation, the RFR is loaded and unloaded batchwiseand only used as an adsorber. A sorbent batch loaded with CO2 is transported to and regeneratedin an external (fluid bed) regenerator. The RFR unit is characterized by a low contacting energy(0.7–1.5 GJ/ton-CO2) and a relatively short adsorption time (24–43 min) compared to other DACprocesses using the same types of sorbents. The contactor concept is ready for further scale-up andcontinuous application.
Keywords: CO2; air capture; adsorption; supported amine sorbents; radial flow reactor
1. Introduction
The capture of CO2 from ambient air, often called direct air capture (DAC), can addressanthropogenic CO2 emissions from distributed sources, which account for between one third and onehalf of the total CO2 emissions per year [1]. Unlike CO2 capture from point sources, DAC facilities canbe installed anywhere, providing more flexibility in the choice of location. The captured atmosphericCO2 can be stored underground or converted to produce fuels and value-added chemicals, such ascarbon monoxide, formic acid, and methanol [2–4]. Additionally, the CO2 can be utilized in biologicalconversion, e.g., in horticulture or for use in microalgae cultivation [5].
DAC was first suggested by [6] using an aqueous alkali hydroxide solution and was studied on aprocess level by Baciocchi et al. [7]. An important issue when using aqueous systems for direct aircapture is that the required massive air flow may cause significant water losses for the aqueous alkalisolution [8]. Essentially the same system was further developed by Keith et al. and was comprisedof absorption in an alkaline solution and was coupled to a calcium caustic recovery loop, requiringa temperature of 900 ◦C during regeneration [9]. Despite its complexity, this optimized and fullyengineered system can be regarded as state of the art; it claims to be able to produce CO2 from air atrelatively low costs of 94 USD/ton of CO2 [10].
Appl. Sci. 2020, 10, 1080; doi:10.3390/app10031080 www.mdpi.com/journal/applsci
Appl. Sci. 2020, 10, 1080 2 of 19
Supported amine solid sorbents are a promising alternative for DAC, also at lower productionscales, as they need lower regeneration temperatures and avoid evaporative solvent losses. Supportedamine sorbents were firstly studied for DAC by Belmabkhout et al. [11], and an increasing numberof papers have been published using these sorbents since then [11–23]. Most of the DAC studiestarget the development of new supported amine sorbents, thereby focusing on enhancing the CO2
equilibrium capacity, utilizing thermogravimetric analyzers or fixed bed reactors with a few gramsof sorbent [24–28]. Studies focusing on the subsequent process development issues, especially at ascale of several kilograms of sorbent, as well as studies reporting on the sorbent performance undernon-equilibrium conditions are rare.
Whereas the desorption step more closely resembles the situation encountered in CO2 capturefrom concentrated sources, the DAC adsorption step is especially challenging. During adsorption,at least 1400 m3 of air need to be supplied to capture 1 kg of CO2 (when the CO2 concentration inthe air at 25 ◦C is 0.04%). The counteracting requirements of a high gas throughput and, for processeconomics, low pressure drop lead to the need for the development, testing, characterization, andevaluation of new DAC air–sorbent contactors.
The objective of this paper is to communicate the rationale for selecting a radial flow reactor forthis application and to report on an experimental study investigating the suitability of this contactortype for the adsorption step in DAC. In this study, a polymer-based supported amine sorbent will beused for the reversible CO2 capture process.
Firstly, the general requirements for a sorbent-based DAC contactor are summarized, which ledto the selection of a radial flow reactor (RFR) as a potentially attractive contactor type. Consideringthe large gas volumes to be treated in the DAC adsorber, it is essential to have (i) a high volumetricadsorption rate (in mol CO2 m−3 s−1) to minimize equipment sizes and costs (CapEx) and (ii) a lowpressure drop to minimize operational costs (OpEx). Since the energy consumption (with associatedemissions) and the operational costs depend linearly on pressure drop and the volumetric flowrate,the efficiency of CO2 removal is also important.
With these requirements in mind, different contacting methods were evaluated, all based onforced convective flow. The results are presented in Appendix A, Figure A2. It was found that the CO2
sorbents were saturated much faster and with a much higher removal efficiency—in a classical (axial)fixed-bed contactor and in a fluidized bed—when compared with the use of a parallel-flow fixed bed,which (on its turn) displays a much lower pressure drop. The faster loading rate allows for more cyclesper day and hence increased productivity and lower CapEx. Moreover, a fixed-bed reactor seems bettersuited than a fluidized-bed reactor for capturing CO2 from air because of the possibility of operating ata lower pressure drop and allowing for a more compact design. A fluidized bed requires not onlya gas distributor (with an additional pressure drop) to ensure an even gas distribution, but also afreeboard zone for gas–solid separation. Additionally, fluid beds have a lower contacting efficiencydue to bubble formation.
In selecting the operating conditions, the selection of the gas over sorbent ratio (GSR) and theadsorption process time is important, but not straightforward. For the first one, there is a trade-off
between the CO2 supply (sufficient CO2 supply requires a high air flow rate) and the pressure drop(low pressure drop requires a low air flow rate). The selection of the adsorption time is finding the besttrade-off between the gas capture efficiency and the solid conversion (also called sorbent saturationefficiency). A high gas capture efficiency corresponds with high reaction rates, normally found at lowsorbent saturations at short adsorption times. A high sorbent saturation efficiency requires a longadsorption time, resulting in a lower system productivity, as the loading rate typically decreases withloading, but a lower energy penalty per kg of CO2 for sorbent heating during sorbent regeneration.
To represent the GSR, here, we use a parameter called the stoichiometric time. This parameterrepresents the general mass balance and is defined by the following expression:
tsto =mS·qmax
ϕv·ρCO2. (1)
Appl. Sci. 2020, 10, 1080 3 of 19
Here, ms (kg) represents the mass of the sorbent, qmax (in g CO2 per kg sorbent) represents the maximumCO2 amount adsorbed by the sorbent, ϕv (m3 s−1) represents the volumetric flow of gas introducedto the reactor, and ρCO2 (g m−3) represents the concentration of CO2 in the gas entering the reactor.Equation (1) shows that parameter tsto is inversely proportional to the GSR. Earlier work showedthat the optimal stoichiometric time for CO2 air capture using the sorbent used in this study is in therange of 15–45 min, with the optimal adsorption time being equal to 0.5–1.5 times the stochiometrictime tsto [29]. The experimental data supporting those findings were firstly obtained from a fixed-bedreactor with 1–3 g of sorbent. Then, those optimal operating conditions were derived based on a totalcost analysis considering the contacting energy, the regeneration energy, and the sorbent cost [29].
With the fixed-bed type as the optimal contacting method as well as the proper operatingconditions, the next step is to select an adsorber to scale up the process to a scale of several kilogramsof sorbent. A traditional scale-up of the axially-fixed-bed reactor used for the 1–3 g scale would resultin a ‘pancake-shaped’ flat-bed contactor due to the low pressure drop requirement, occupying a largefootprint area and giving rise to difficulties in proper feed gas distribution. In this respect, a radialflow reactor (RFR) was considered to be a good option.
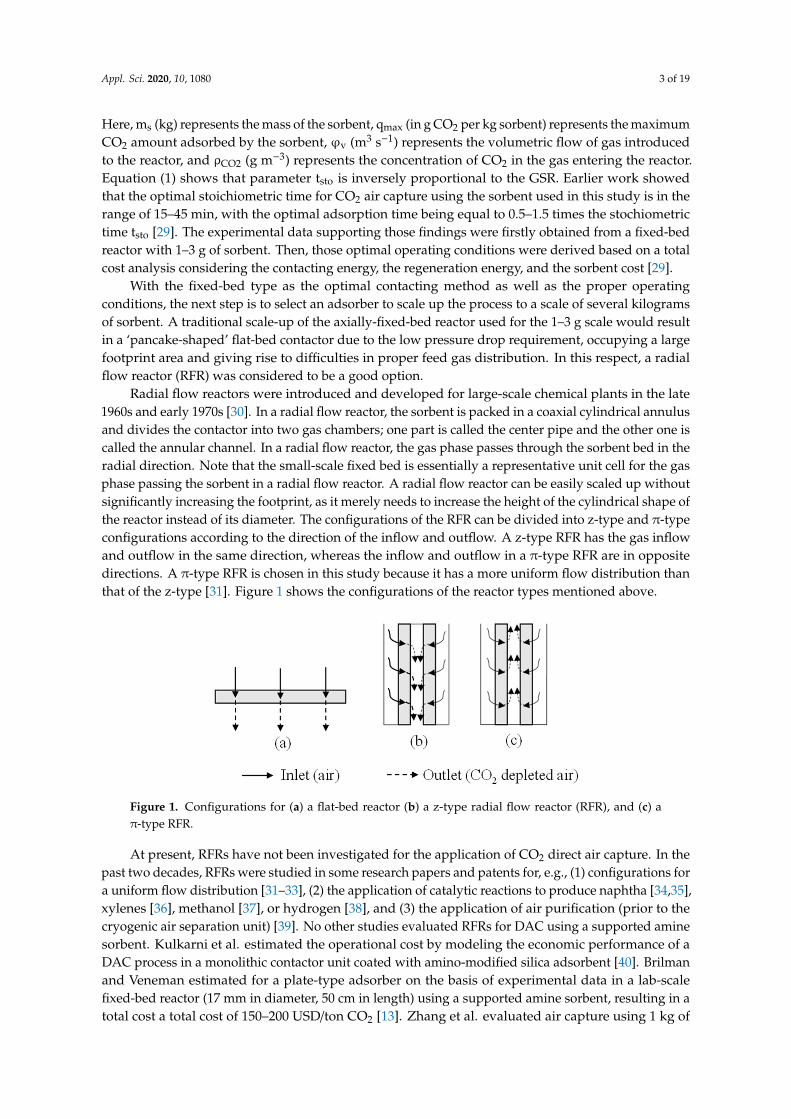
Radial flow reactors were introduced and developed for large-scale chemical plants in the late1960s and early 1970s [30]. In a radial flow reactor, the sorbent is packed in a coaxial cylindrical annulusand divides the contactor into two gas chambers; one part is called the center pipe and the other one iscalled the annular channel. In a radial flow reactor, the gas phase passes through the sorbent bed in theradial direction. Note that the small-scale fixed bed is essentially a representative unit cell for the gasphase passing the sorbent in a radial flow reactor. A radial flow reactor can be easily scaled up withoutsignificantly increasing the footprint, as it merely needs to increase the height of the cylindrical shape ofthe reactor instead of its diameter. The configurations of the RFR can be divided into z-type and π-typeconfigurations according to the direction of the inflow and outflow. A z-type RFR has the gas inflowand outflow in the same direction, whereas the inflow and outflow in a π-type RFR are in oppositedirections. A π-type RFR is chosen in this study because it has a more uniform flow distribution thanthat of the z-type [31]. Figure 1 shows the configurations of the reactor types mentioned above.
Appl. Sci. 2020, 10, 1080 3 of 20
showed that the optimal stoichiometric time for CO2 air capture using the sorbent used in this study is in the range of 15–45 min, with the optimal adsorption time being equal to 0.5–1.5 times the stochiometric time tsto [29]. The experimental data supporting those findings were firstly obtained from a fixed-bed reactor with 1–3 g of sorbent. Then, those optimal operating conditions were derived based on a total cost analysis considering the contacting energy, the regeneration energy, and the sorbent cost [29].
With the fixed-bed type as the optimal contacting method as well as the proper operating conditions, the next step is to select an adsorber to scale up the process to a scale of several kilograms of sorbent. A traditional scale-up of the axially-fixed-bed reactor used for the 1–3 g scale would result in a ‘pancake-shaped’ flat-bed contactor due to the low pressure drop requirement, occupying a large footprint area and giving rise to difficulties in proper feed gas distribution. In this respect, a radial flow reactor (RFR) was considered to be a good option.
Radial flow reactors were introduced and developed for large-scale chemical plants in the late 1960s and early 1970s [30]. In a radial flow reactor, the sorbent is packed in a coaxial cylindrical annulus and divides the contactor into two gas chambers; one part is called the center pipe and the other one is called the annular channel. In a radial flow reactor, the gas phase passes through the sorbent bed in the radial direction. Note that the small-scale fixed bed is essentially a representative unit cell for the gas phase passing the sorbent in a radial flow reactor. A radial flow reactor can be easily scaled up without significantly increasing the footprint, as it merely needs to increase the height of the cylindrical shape of the reactor instead of its diameter. The configurations of the RFR can be divided into z-type and π-type configurations according to the direction of the inflow and outflow. A z-type RFR has the gas inflow and outflow in the same direction, whereas the inflow and outflow in a π-type RFR are in opposite directions. A π-type RFR is chosen in this study because it has a more uniform flow distribution than that of the z-type [31]. Figure 1 shows the configurations of the reactor types mentioned above.
Figure 1. Configurations for (a) a flat-bed reactor (b) a z-type radial flow reactor (RFR), and (c) a π-type RFR.
At present, RFRs have not been investigated for the application of CO2 direct air capture. In the past two decades, RFRs were studied in some research papers and patents for, e.g., (1) configurations for a uniform flow distribution [31–33], (2) the application of catalytic reactions to produce naphtha [34,35], xylenes [36], methanol [37], or hydrogen [38], and (3) the application of air purification (prior to the cryogenic air separation unit) [39]. No other studies evaluated RFRs for DAC using a supported amine sorbent. Kulkarni et al. estimated the operational cost by modeling the economic performance of a DAC process in a monolithic contactor unit coated with amino-modified silica adsorbent [40]. Brilman and Veneman estimated for a plate-type adsorber on the basis of experimental data in a lab-scale fixed-bed reactor (17 mm in diameter, 50 cm in length) using a supported amine sorbent, resulting in a total cost a total cost of 150–200 USD/ton CO2 [13]. Zhang et al. evaluated air capture using 1 kg of polyethylenimine (PEI)-silica sorbent in a bubbling fluidized bed. On the basis of their experimental results, a conceptual design for CO2 air capture was proposed, for which the operating cost was estimated to be 152 USD/t-CO2 [41]. In addition to that, Sakwa-Novak et al. evaluated a
Figure 1. Configurations for (a) a flat-bed reactor (b) a z-type radial flow reactor (RFR), and (c) aπ-type RFR.
At present, RFRs have not been investigated for the application of CO2 direct air capture. In thepast two decades, RFRs were studied in some research papers and patents for, e.g., (1) configurations fora uniform flow distribution [31–33], (2) the application of catalytic reactions to produce naphtha [34,35],xylenes [36], methanol [37], or hydrogen [38], and (3) the application of air purification (prior to thecryogenic air separation unit) [39]. No other studies evaluated RFRs for DAC using a supported aminesorbent. Kulkarni et al. estimated the operational cost by modeling the economic performance of aDAC process in a monolithic contactor unit coated with amino-modified silica adsorbent [40]. Brilmanand Veneman estimated for a plate-type adsorber on the basis of experimental data in a lab-scalefixed-bed reactor (17 mm in diameter, 50 cm in length) using a supported amine sorbent, resulting in atotal cost a total cost of 150–200 USD/ton CO2 [13]. Zhang et al. evaluated air capture using 1 kg of

Appl. Sci. 2020, 10, 1080 4 of 19
polyethylenimine (PEI)-silica sorbent in a bubbling fluidized bed. On the basis of their experimentalresults, a conceptual design for CO2 air capture was proposed, for which the operating cost wasestimated to be 152 USD/t-CO2 [41]. In addition to that, Sakwa-Novak et al. evaluated a small-scalemonolithic cylinder (2.5 cm in diameter, 10.2 cm in length), impregnated with PEI and suggested anoperating cost of 100 USD/t-CO2 [23].
In this paper, we focus on the process development in the application of CO2 direct air capture in aradial flow reactor (RFR) using a commercial supported amine sorbent, Lewatit VP OC 1065 (Lewatit),in short: the RFL process (RFR reactor with Lewatit VPOC 1065 as adsorbent). The RFL process isoperated at a sorbent scale of 2 km; this is the first time that such a reactor type and such a scale of thesorbent are investigated for the application of CO2 air capture.
The aim of this paper is an experimental feasibility study of the RFL process. Next to designvalidation, the RFR is operated as fixed-bed and as (intermittently and continuously) operatingmoving-bed. The RFL process performance is compared with other sorbents and processes for DAC,indicating that the RFL process is an attractive technology for capturing CO2 directly from ambient air.
2. Materials and Methods
2.1. Material
The adsorbent used in this study is a supported amine sorbent called Lewatit® VP OC 1065(Lewatit), manufactured by Lanxess (Germany). This sorbent is a polymeric sorbent that containsprimary benzylamine groups as the functional unit [42]. The total nitrogen loading measured byelemental analysis is 6.8 mol/kg [43]. The sorbent is a bead-like material with a diameter between 0.3and 1 mm, which displays an internal porous structure with an averaged surface area, pore volume,and pore size of 25 m2/g, 0.20 cm3/g, and 38 nm, respectively [43]. Packing density for the dry, unloadedmaterial is around 530 kg/m3.
This sorbent was selected for this study because of its good working capacity and commercialavailability in large quantities. The capacity measured in dry air at 25 ◦C is 1.1 mol/kg. This capacitycorrelates to an amine efficiency of 16%, which is comparable to the other supported aminesorbents measured by other researchers [44,45] at comparable conditions. The sorbent capacitywas found to be stable over the duration of the experimental campaign (one month) as well as over350 adsorption/desorption cycles under the flue gas conditions [43,46]. The adsorption rate for Lewatitin comparison to other supported amine sorbents under CO2 air capture conditions is discussed inSection 4.
2.2. Radial Flow Reactor Design
The RFR was designed based on previous results obtained using a fixed-bed reactor (FB) with asorbent mass of 1–3 g [29]. From those experiments, we found out that the feed rate and external masstransfer do not affect the CO2 adsorption rate when tsto is 43 min. At this condition (tsto = 43 min), theresults showed an overlap of the adsorption rates for the experiments (at 25 ◦C, 400 ppm CO2) whenusing 1, 2, and 3 g of sorbent (the feed gas rate was adjusted according to the change in the sorbentmass) using the fixed-bed reactor. This experimental result was used as the design basis to scale up theprocess to the kilogram sorbent scale in a radial flow reactor. The results of the RFL process will becompared to these fixed-bed-Lewatit (FBL) data used for the design and are presented in Section 3.2.
The radial flow reactor is designed for the same stoichiometric time as the one used in the FB. Theoptimal adsorption time was found to be 0.5–1.5 times the stoichiometric time. For the design of theRFL process, this was adopted, aiming for the RFL design to have the same saturation efficiency, CO2
capacity, and gas residence time as in the FBL experiment.Specifically, the equivalent gas residence time used in this study is important. This contact time,
calculated using the total volume of the sorbent bed (m3) over the volumetric flow rate of the feedinggas (m3/s), is preferably small to minimize the contactor volume and to minimize the risk of supply
Appl. Sci. 2020, 10, 1080 5 of 19
limitation. Under supply limitations, the rate of sorbent loading is fully determined by the CO2
supply to the contactor. For the design, a gas residence time of 0.1 s was chosen on the basis of the FBexperiments. This contact time is, to the best of our knowledge, the shortest one reported in studies sofar [41,47]. More details on the procedures for the RFR design have been presented previously [29].
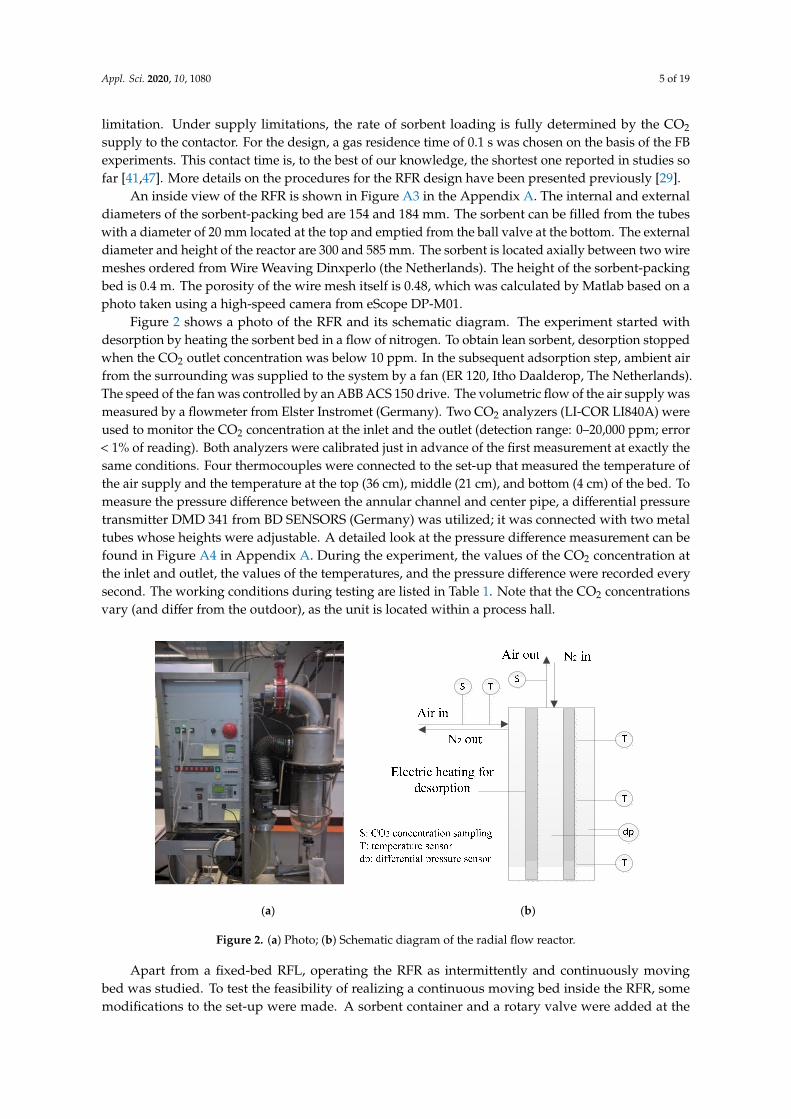
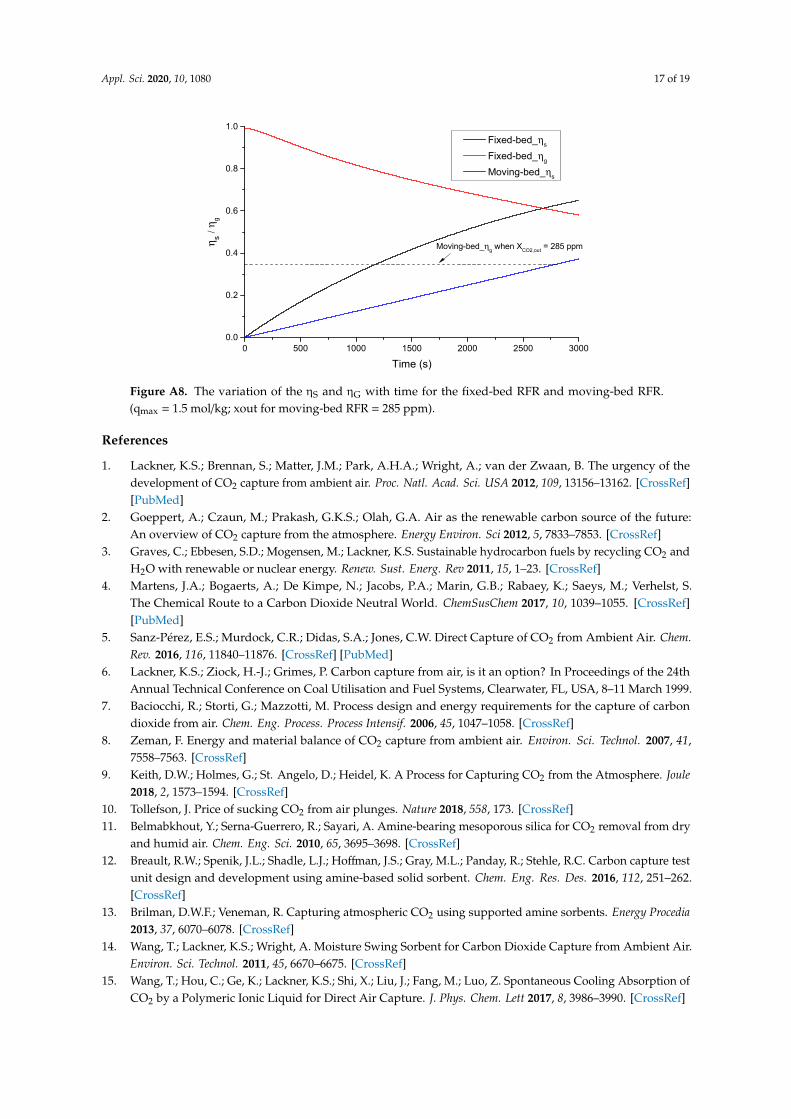
An inside view of the RFR is shown in Figure A3 in the Appendix A. The internal and externaldiameters of the sorbent-packing bed are 154 and 184 mm. The sorbent can be filled from the tubeswith a diameter of 20 mm located at the top and emptied from the ball valve at the bottom. The externaldiameter and height of the reactor are 300 and 585 mm. The sorbent is located axially between two wiremeshes ordered from Wire Weaving Dinxperlo (the Netherlands). The height of the sorbent-packingbed is 0.4 m. The porosity of the wire mesh itself is 0.48, which was calculated by Matlab based on aphoto taken using a high-speed camera from eScope DP-M01.
Figure 2 shows a photo of the RFR and its schematic diagram. The experiment started withdesorption by heating the sorbent bed in a flow of nitrogen. To obtain lean sorbent, desorption stoppedwhen the CO2 outlet concentration was below 10 ppm. In the subsequent adsorption step, ambient airfrom the surrounding was supplied to the system by a fan (ER 120, Itho Daalderop, The Netherlands).The speed of the fan was controlled by an ABB ACS 150 drive. The volumetric flow of the air supply wasmeasured by a flowmeter from Elster Instromet (Germany). Two CO2 analyzers (LI-COR LI840A) wereused to monitor the CO2 concentration at the inlet and the outlet (detection range: 0–20,000 ppm; error< 1% of reading). Both analyzers were calibrated just in advance of the first measurement at exactly thesame conditions. Four thermocouples were connected to the set-up that measured the temperature ofthe air supply and the temperature at the top (36 cm), middle (21 cm), and bottom (4 cm) of the bed. Tomeasure the pressure difference between the annular channel and center pipe, a differential pressuretransmitter DMD 341 from BD SENSORS (Germany) was utilized; it was connected with two metaltubes whose heights were adjustable. A detailed look at the pressure difference measurement can befound in Figure A4 in Appendix A. During the experiment, the values of the CO2 concentration atthe inlet and outlet, the values of the temperatures, and the pressure difference were recorded everysecond. The working conditions during testing are listed in Table 1. Note that the CO2 concentrationsvary (and differ from the outdoor), as the unit is located within a process hall.Appl. Sci. 2020, 10, 1080 6 of 20
(a) (b)
Figure 2. (a) Photo; (b) Schematic diagram of the radial flow reactor.
Apart from a fixed-bed RFL, operating the RFR as intermittently and continuously moving bed was studied. To test the feasibility of realizing a continuous moving bed inside the RFR, some modifications to the set-up were made. A sorbent container and a rotary valve were added at the top and at the bottom of the adsorber, respectively. The sorbent container (max. capacity of 2.5 kg of sorbent) was used to feed the RFR with a sufficient and continuous sorbent feed flow. The calibrated rotary valve at the bottom outlet of the reactor was operated at various solid rates (g/s) to realize different sorbent residence times. By operating the rotary valve at various rates (g/s), different sorbent residence times can be realized. A specific view of the moving-bed RFR can be found in Figure A5 in Appendix A. The experimental conditions for the moving-bed RFR are listed in Table 2. During the experiment, initially, the RFR was filled with 1.7 kg of lean sorbent, and an additional 2.4 kg of the lean sorbent was preloaded into the top buffer tank.
Table 2. Experimental conditions for the moving-bed RFR tests.
Parameter Value Sorbent mass in buffer (kg) 2.4
Air flow rate (m3/h) 188 CO2 concentration (ppm) 436
3. Results and Discussion
3.1. Pressure Drop
When air flow passes through the RFR, there is a pressure drop between the inflow and the outflow that determines the contacting energy required. This pressure drop is caused by friction with both the sorbent bed and the supporting wire mesh. The pressure differences between the annular gas channel and the center pipe were measured at varying flow rates for both the situations in which the mesh was fully loaded with sorbent and without any sorbent. The pressure drop for a fully loaded bed is between 70 to 700 Pa when the air flow is in the range of 41–313 m3/h (0.05–0.38 m/s). The maximum pressure drop over the empty RFR (without sorbent) is measured to be (only) 10 Pa, showing that the pressure drop is predominantly caused by the sorbent bed. The results of the aforementioned measurements are shown in Figure A6 in Appendix A.
Figure 2. (a) Photo; (b) Schematic diagram of the radial flow reactor.
Apart from a fixed-bed RFL, operating the RFR as intermittently and continuously movingbed was studied. To test the feasibility of realizing a continuous moving bed inside the RFR, somemodifications to the set-up were made. A sorbent container and a rotary valve were added at the

Appl. Sci. 2020, 10, 1080 6 of 19
top and at the bottom of the adsorber, respectively. The sorbent container (max. capacity of 2.5 kg ofsorbent) was used to feed the RFR with a sufficient and continuous sorbent feed flow. The calibratedrotary valve at the bottom outlet of the reactor was operated at various solid rates (g/s) to realizedifferent sorbent residence times. By operating the rotary valve at various rates (g/s), different sorbentresidence times can be realized. A specific view of the moving-bed RFR can be found in Figure A5 inAppendix A. The experimental conditions for the moving-bed RFR are listed in Table 2. During theexperiment, initially, the RFR was filled with 1.7 kg of lean sorbent, and an additional 2.4 kg of the leansorbent was preloaded into the top buffer tank.
Table 1. Working conditions for experimental work for testing RFR in fixed-bed mode.
Adsorption
Sorbent mass (kg) 1.7Flow rate (m3/h) 41–313
CO2 concentration (ppm) 429–464Relative humidity (%) 40–65
Temperature (◦C) 19–22
Desorption
Nitrogen purge (m3/h) 3Temperature (◦C) 120
Duration (h) 16
Table 2. Experimental conditions for the moving-bed RFR tests.
Parameter Value
Sorbent mass in buffer (kg) 2.4Air flow rate (m3/h) 188
CO2 concentration (ppm) 436
3. Results and Discussion
3.1. Pressure Drop
When air flow passes through the RFR, there is a pressure drop between the inflow and theoutflow that determines the contacting energy required. This pressure drop is caused by friction withboth the sorbent bed and the supporting wire mesh. The pressure differences between the annular gaschannel and the center pipe were measured at varying flow rates for both the situations in which themesh was fully loaded with sorbent and without any sorbent. The pressure drop for a fully loaded bedis between 70 to 700 Pa when the air flow is in the range of 41–313 m3/h (0.05–0.38 m/s). The maximumpressure drop over the empty RFR (without sorbent) is measured to be (only) 10 Pa, showing thatthe pressure drop is predominantly caused by the sorbent bed. The results of the aforementionedmeasurements are shown in Figure A6 in Appendix A.
3.2. Performance of the Fixed-Bed RFL
In this section, experimental work was carried out using a fixed-bed mode of operation for theRFL process, aiming to study the RFR:
1. CO2 adsorption performance at a larger scale (2 kg) in the RFR in comparison with the resultsobtained on small scale (1 g) in the FB on which the RFR design is based;
2. CO2 breakthrough and temperature profiles during a typical CO2 adsorption test;3. the rates of CO2 and water adsorption.
For a fair comparison, the RFR reactor was operated at the same stoichiometric time (tsto) of43 min as the original FB tests with only 1 g of sorbent. The experimental conditions are listed in
Appl. Sci. 2020, 10, 1080 7 of 19
Table 3. Note that although the two reactors were operated at the same tsto, there is a difference of morethan 1000 times in parameters such as air flow and sorbent hold up and a difference of 500 times in thegeometric aspect ratio of the bed thickness over the contacting area ratio. Furthermore, it is importantto note that the experimental determined maximum capacities are different, due to the fact that the FBexperiments were carried out with dry, ‘synthetic’ air of exactly 400 ppm CO2, whereas the RFR wasoperated inside the high-pressure laboratory of the University of Twente using the real lab air with60% relative humidity (RH) and a slightly elevated CO2 content (here: 452 ppm).
Table 3. Comparison of the experimental conditions in the fixed bed reactor and in the radial flow reactor.
Parameter Units Fixed Bed Radial Flow
Air flow rate m3/h 0.072 188Contacting area m2 2.0·× 10−4 0.23
Aspect ratio (thickness/area) m/m2 49.7 0.065Temperature ◦C 25 20
Mass of the sorbent g 1 1720CO2 inlet concentration ppm 400 452Stoichiometric time, tsto min 43 43Relative humidity, RH % 0 60
Superficial velocity m/s 0.1 0.23Max. working capacity mol/kg 0.9 1.5
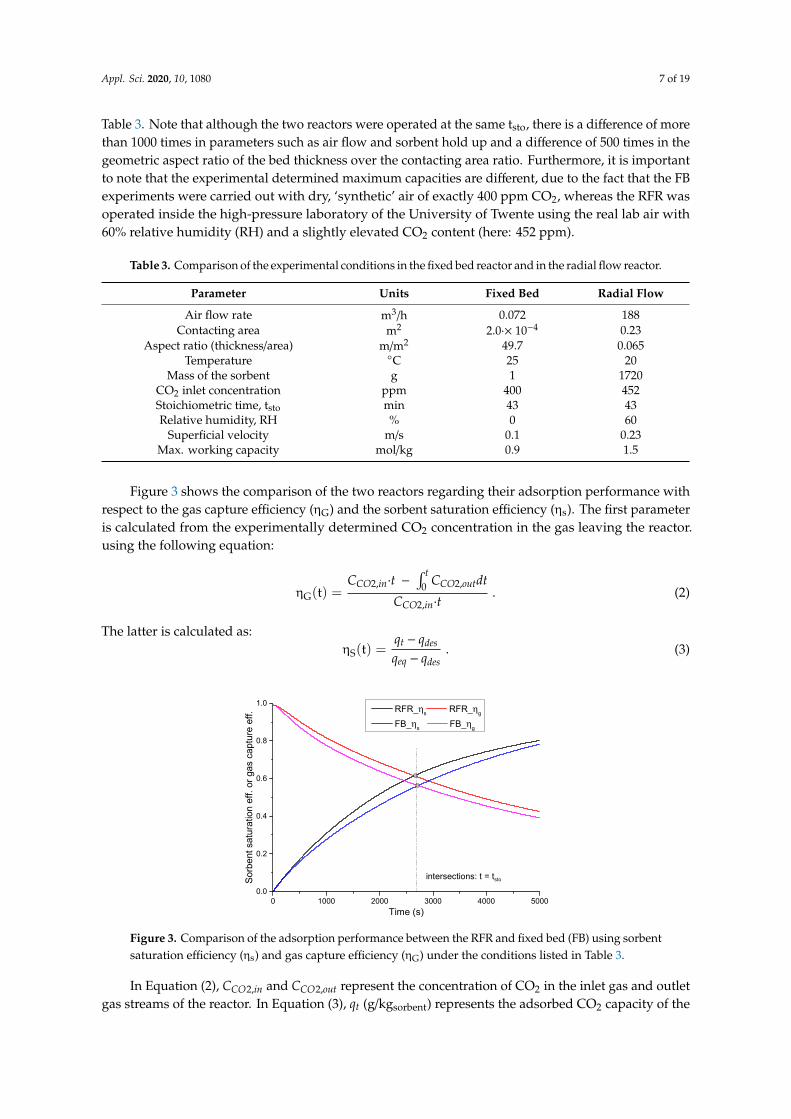
Figure 3 shows the comparison of the two reactors regarding their adsorption performance withrespect to the gas capture efficiency (ηG) and the sorbent saturation efficiency (ηs). The first parameteris calculated from the experimentally determined CO2 concentration in the gas leaving the reactor.using the following equation:
ηG(t) =CCO2,in·t −
∫ t0 CCO2,outdt
CCO2,in·t. (2)
The latter is calculated as:ηS(t) =
qt − qdes
qeq − qdes. (3)
Appl. Sci. 2020, 10, 1080 8 of 20
Figure 3. Comparison of the adsorption performance between the RFR and fixed bed (FB) using sorbent saturation efficiency (ηs) and gas capture efficiency (ηG) under the conditions listed in Table 3.
It can be noticed from Figure 3 that the point where the ηs and ηG curves cross is at a marginally larger value for the RFR due to the variations in temperature, CO2 concentration, and humidity. The ηs and ηG at t = tsto are 61% for the RFR and 56% for the FB contactor. This limited difference between the RFR and the FB results indicates a successful scale-up, especially considering all of the differences listed in Table 3 and, most importantly, the completely different geometric designs of the two contactors.
The results show once more that the proportional increases of the sorbent amount and the air flow lead to similar efficiencies, despite the large variation of the superficial velocity (0.1 m/s for the FB and 0.23 m/s for the RFR). It also confirms that external mass transfer does not govern the rate of the adsorption process under the studied conditions shown in Figure 3. Hence, the stoichiometric time is found to be a good scale-up criterion for the DAC application, suggesting a predictable ηs curve variation with time. This curve can be used to calculate the working capacity (when qeq is known from the adsorption isotherm) in relation to the choice of the adsorption time. With this, the required sorbent amount can be estimated.
In the design and scale-up of fixed bed processes, three major aspects are typically considered, namely pressure drop, sorbent deactivation, and temperature control (heat effects) [48]. The RFL process shows a relatively low pressure drop (see Section 3.1) which will be compared to other CO2 air capture processes in Section 4. In addition to that, the adsorbent is stable over at least one month of operation under air capture conditions [43] as well as during 300 h of testing under the flue gas capture [46]. Additionally, in these RFL process tests, we did not find any reduction in the CO2 working capacity of the adsorbent (see Figure A7). Temperature control and heat effects for the studied RFL process are discussed below.
Figure 4a shows the breakthrough curve and the CO2 concentration at the inlet for a typical adsorption experiment in RFR. This experiment was operated with the air flow rate of 206 m3/h, in which the CO2 concentration varied from 430 to 440 ppm and the RH content is around 40%. In the breakthrough curve, the CO2 concentration increased immediately after adsorption start-up. The entire breakthrough curve shows a fast adsorption rate in the initial phase and slows down in the subsequent phase. The CO2 concentration at the outlet reaches 97% of the inflow concentration in the first 2 h at a sorbent capacity of 1.26 mol/kg, but it takes another hour to achieve the maximum capacity (1.33 mol/kg). The studied sorbent was also tested in the gram-scale fixed-bed reactor under the comparable conditions (20 °C, RH 40%, 426 ppm), which demonstrated a similar maximum capacity (1.30 mol/kg).
0 1000 2000 3000 4000 50000.0
0.2
0.4
0.6
0.8
1.0
Sorb
ent s
atur
atio
n ef
f. or
gas
cap
ture
eff.
Time (s)
RFR_ηs RFR_ηg
FB_ηs FB_ηg
intersections: t = tsto
Figure 3. Comparison of the adsorption performance between the RFR and fixed bed (FB) using sorbentsaturation efficiency (ηs) and gas capture efficiency (ηG) under the conditions listed in Table 3.
In Equation (2), CCO2,in and CCO2,out represent the concentration of CO2 in the inlet gas and outletgas streams of the reactor. In Equation (3), qt (g/kgsorbent) represents the adsorbed CO2 capacity of the

Appl. Sci. 2020, 10, 1080 8 of 19
sorbent at the adsorption time t, qeq is the equilibrium capacity at inlet conditions, and qdes representsthe residual capacity after desorption.
Figure 3 shows that the variation of the ηs curve and the ηG curve with time are opposite. Theintersection points of both curves are found at exactly the stoichiometric time. This finding that ηG
equals ηs at the stoichiometric time was presented previously [29].It can be noticed from Figure 3 that the point where the ηs and ηG curves cross is at a marginally
larger value for the RFR due to the variations in temperature, CO2 concentration, and humidity. The ηs
and ηG at t = tsto are 61% for the RFR and 56% for the FB contactor. This limited difference between theRFR and the FB results indicates a successful scale-up, especially considering all of the differences listedin Table 3 and, most importantly, the completely different geometric designs of the two contactors.
The results show once more that the proportional increases of the sorbent amount and the air flowlead to similar efficiencies, despite the large variation of the superficial velocity (0.1 m/s for the FBand 0.23 m/s for the RFR). It also confirms that external mass transfer does not govern the rate of theadsorption process under the studied conditions shown in Figure 3. Hence, the stoichiometric timeis found to be a good scale-up criterion for the DAC application, suggesting a predictable ηs curvevariation with time. This curve can be used to calculate the working capacity (when qeq is knownfrom the adsorption isotherm) in relation to the choice of the adsorption time. With this, the requiredsorbent amount can be estimated.
In the design and scale-up of fixed bed processes, three major aspects are typically considered,namely pressure drop, sorbent deactivation, and temperature control (heat effects) [48]. The RFLprocess shows a relatively low pressure drop (see Section 3.1) which will be compared to other CO2
air capture processes in Section 4. In addition to that, the adsorbent is stable over at least one monthof operation under air capture conditions [43] as well as during 300 h of testing under the flue gascapture [46]. Additionally, in these RFL process tests, we did not find any reduction in the CO2 workingcapacity of the adsorbent (see Figure A7). Temperature control and heat effects for the studied RFLprocess are discussed below.
Figure 4a shows the breakthrough curve and the CO2 concentration at the inlet for a typicaladsorption experiment in RFR. This experiment was operated with the air flow rate of 206 m3/h, inwhich the CO2 concentration varied from 430 to 440 ppm and the RH content is around 40%. In thebreakthrough curve, the CO2 concentration increased immediately after adsorption start-up. Theentire breakthrough curve shows a fast adsorption rate in the initial phase and slows down in thesubsequent phase. The CO2 concentration at the outlet reaches 97% of the inflow concentration in thefirst 2 h at a sorbent capacity of 1.26 mol/kg, but it takes another hour to achieve the maximum capacity(1.33 mol/kg). The studied sorbent was also tested in the gram-scale fixed-bed reactor under thecomparable conditions (20 ◦C, RH 40%, 426 ppm), which demonstrated a similar maximum capacity(1.30 mol/kg).
For the same experiment, the temperature ranged from 19 to 21◦C, as illustrated in Figure 4b.Some fluctuations in the temperature of the inflow are observed, which are presumably caused by thevarying number of people working in the lab, affecting ventilation rate, inlet temperature, and inletCO2 concentration. As a consequence, the temperatures of the sorbent bed change accordingly andthose lead to a corresponding change of the CO2 concentration at the outlet, as shown in Figure 4a.Since the adsorption is an exothermic process, temperature increases lead to less adsorption and thusconcentration at the exit increases, whereas temperature decreases lead to the opposite behavior.
In Figure 4b, it is also observed that the three temperatures along the bed are 3–7 ◦C higher thanthe inflow temperature in the initial 200 s. This phenomenon is presumably caused by fast wateradsorption in the initial phase, as also illustrated in Figure 5. It is observed that the water adsorptionis much faster than the CO2 adsorption, related to its (much) higher concentration in the feed. TheH2O capacity reaches 50% (1.5 mol/kg) of the maximum working capacity (3.0 mol/kg) in the initial200 s, corresponding to a heat released of 110 kJ, calculated by assuming ∆HH2O = 43 kJ mol−1 [49].Considering that the heat capacity of the sorbent is around 1.5 kJ kg−1 K−1, this heat release that

Appl. Sci. 2020, 10, 1080 9 of 19
is due to water adsorption is large enough to heat up the sorbent for 7 ◦C; so, it can well explainthe initial temperature rise. Subsequently, the temperatures along the bed stabilize due to slowerwater adsorption (capacity increases from 1.5 to 2.3 mol/kg between 200 to 400 s). Among the initialtemperature rises at the top, middle, and bottom of the bed, the temperature at the top of the bedshows a lower temperature rise because here the bed is more cooled by contact with the large gasinflow to the RFR.
Appl. Sci. 2020, 10, 1080 9 of 20
For the same experiment, the temperature ranged from 19 to 21°C, as illustrated in Figure 4b. Some fluctuations in the temperature of the inflow are observed, which are presumably caused by the varying number of people working in the lab, affecting ventilation rate, inlet temperature, and inlet CO2 concentration. As a consequence, the temperatures of the sorbent bed change accordingly and those lead to a corresponding change of the CO2 concentration at the outlet, as shown in Figure 4a. Since the adsorption is an exothermic process, temperature increases lead to less adsorption and thus concentration at the exit increases, whereas temperature decreases lead to the opposite behavior.
In Figure 4b, it is also observed that the three temperatures along the bed are 3–7 °C higher than the inflow temperature in the initial 200 s. This phenomenon is presumably caused by fast water adsorption in the initial phase, as also illustrated in Figure 5. It is observed that the water adsorption is much faster than the CO2 adsorption, related to its (much) higher concentration in the feed. The H2O capacity reaches 50% (1.5 mol/kg) of the maximum working capacity (3.0 mol/kg) in the initial 200 s, corresponding to a heat released of 110 kJ, calculated by assuming ΔHH2O = 43 kJ mol−1 [49]. Considering that the heat capacity of the sorbent is around 1.5 kJ kg−1 K−1, this heat release that is due to water adsorption is large enough to heat up the sorbent for 7 °C; so, it can well explain the initial temperature rise. Subsequently, the temperatures along the bed stabilize due to slower water adsorption (capacity increases from 1.5 to 2.3 mol/kg between 200 to 400 s). Among the initial temperature rises at the top, middle, and bottom of the bed, the temperature at the top of the bed shows a lower temperature rise because here the bed is more cooled by contact with the large gas inflow to the RFR.
(a) (b)
Figure 4. (a) CO2 concentration at the inflow (430–440 ppm, 40% RH) and the outflow. (b) Temperature profiles during the entire adsorption phase and the initial 200 s (inset).
Figure 5. Variation of sorbent saturation efficiency for CO2 and H2O with time. Data correspond to the experiment presented in Figure 4.
Figure 4. (a) CO2 concentration at the inflow (430–440 ppm, 40% RH) and the outflow. (b) Temperatureprofiles during the entire adsorption phase and the initial 200 s (inset).
Appl. Sci. 2020, 10, 1080 9 of 20
For the same experiment, the temperature ranged from 19 to 21°C, as illustrated in Figure 4b. Some fluctuations in the temperature of the inflow are observed, which are presumably caused by the varying number of people working in the lab, affecting ventilation rate, inlet temperature, and inlet CO2 concentration. As a consequence, the temperatures of the sorbent bed change accordingly and those lead to a corresponding change of the CO2 concentration at the outlet, as shown in Figure 4a. Since the adsorption is an exothermic process, temperature increases lead to less adsorption and thus concentration at the exit increases, whereas temperature decreases lead to the opposite behavior.
In Figure 4b, it is also observed that the three temperatures along the bed are 3–7 °C higher than the inflow temperature in the initial 200 s. This phenomenon is presumably caused by fast water adsorption in the initial phase, as also illustrated in Figure 5. It is observed that the water adsorption is much faster than the CO2 adsorption, related to its (much) higher concentration in the feed. The H2O capacity reaches 50% (1.5 mol/kg) of the maximum working capacity (3.0 mol/kg) in the initial 200 s, corresponding to a heat released of 110 kJ, calculated by assuming ΔHH2O = 43 kJ mol−1 [49]. Considering that the heat capacity of the sorbent is around 1.5 kJ kg−1 K−1, this heat release that is due to water adsorption is large enough to heat up the sorbent for 7 °C; so, it can well explain the initial temperature rise. Subsequently, the temperatures along the bed stabilize due to slower water adsorption (capacity increases from 1.5 to 2.3 mol/kg between 200 to 400 s). Among the initial temperature rises at the top, middle, and bottom of the bed, the temperature at the top of the bed shows a lower temperature rise because here the bed is more cooled by contact with the large gas inflow to the RFR.
(a) (b)
Figure 4. (a) CO2 concentration at the inflow (430–440 ppm, 40% RH) and the outflow. (b) Temperature profiles during the entire adsorption phase and the initial 200 s (inset).
Figure 5. Variation of sorbent saturation efficiency for CO2 and H2O with time. Data correspond to the experiment presented in Figure 4.
Figure 5. Variation of sorbent saturation efficiency for CO2 and H2O with time. Data correspond to theexperiment presented in Figure 4.
The air flow rate is an important parameter that determines the adsorption efficiency andeconomics. We studied the use of different flow rates in the RFR. For each of these runs, the maximumsorbent capacity was determined to check on possible degradation and to check on the mass balance.The results show no effect on the maximum CO2 capacity with varying flowrate nor with time, implyingthat the measurement technique with the integration of the analyzer signal is consistent. The dataalso give an indication of the measurement accuracy and reproducibility. Moreover, the observedpatterns between the CO2 capacity and the inflow CO2 concentration are very similar. This observationindicates that the minor variation of the CO2 capacity (as presented in Figure A7 in Appendix A) is aresult of the minor variation in the CO2 inlet concentration (in line with the isotherm) and humidity.
3.3. Checking the Feasibility of a Moving-Bed RFR
A continuous process with sorbent circulation could be advantageous for increasing processproductivity and energy consumption, as the process equipment does not need to be heated up or

Appl. Sci. 2020, 10, 1080 10 of 19
cooled down every cycle. The objective of the work in this section is to check the feasibility of using amoving-bed RFR with a continuous sorbent flow and to compare its performance (in terms of gas–solidcontacting efficiency) with that of using a fixed-bed RFR.
The moving bed was operated under the conditions listed in Table 2. Figure 6 shows the variationof outlet CO2 concentration with time for both operating modes. The curve for the moving-bed RFR canbe separated into three parts. First, there is a ‘startup’ period in the first 2000 s, where the concentrationin the outlet gas flow gradually increases. From around 2000 s to around 4000 s, a steady-state situationwith respect to CO2 adsorption was achieved, with a developed sorbent loading gradient inside theRFR. After 4000 s, there was no available lean sorbent anymore in the top buffer tank, and sincethe bottom rotary valve kept removing sorbents from the system, the RFR was gradually emptied.At approximately 4500 s, the empty space at the top of the wire mesh in RFR is big enough to let allof the inflow air pass through; therefore, the outflow CO2 concentration reaches the concentration atthe inlet.
Appl. Sci. 2020, 10, 1080 10 of 20
The air flow rate is an important parameter that determines the adsorption efficiency and economics. We studied the use of different flow rates in the RFR. For each of these runs, the maximum sorbent capacity was determined to check on possible degradation and to check on the mass balance. The results show no effect on the maximum CO2 capacity with varying flowrate nor with time, implying that the measurement technique with the integration of the analyzer signal is consistent. The data also give an indication of the measurement accuracy and reproducibility. Moreover, the observed patterns between the CO2 capacity and the inflow CO2 concentration are very similar. This observation indicates that the minor variation of the CO2 capacity (as presented in Figure A7 in Appendix A) is a result of the minor variation in the CO2 inlet concentration (in line with the isotherm) and humidity.
3.3. Checking the Feasibility of a Moving-Bed RFR
A continuous process with sorbent circulation could be advantageous for increasing process productivity and energy consumption, as the process equipment does not need to be heated up or cooled down every cycle. The objective of the work in this section is to check the feasibility of using a moving-bed RFR with a continuous sorbent flow and to compare its performance (in terms of gas–solid contacting efficiency) with that of using a fixed-bed RFR.
The moving bed was operated under the conditions listed in Table 2. Figure 6 shows the variation of outlet CO2 concentration with time for both operating modes. The curve for the moving-bed RFR can be separated into three parts. First, there is a ‘startup’ period in the first 2000 s, where the concentration in the outlet gas flow gradually increases. From around 2000 s to around 4000 s, a steady-state situation with respect to CO2 adsorption was achieved, with a developed sorbent loading gradient inside the RFR. After 4000 s, there was no available lean sorbent anymore in the top buffer tank, and since the bottom rotary valve kept removing sorbents from the system, the RFR was gradually emptied. At approximately 4500 s, the empty space at the top of the wire mesh in RFR is big enough to let all of the inflow air pass through; therefore, the outflow CO2 concentration reaches the concentration at the inlet.
Figure 6. Variation of CO2 outlet concentration (xCO2), bed temperature (Tbed), and inflow temperature (Tinflow) with time in the fixed-bed and the moving-bed modes, both operated at the same stoichiometric time (43 min). Conditions are presented in Table 2.
Apart from the outlet CO2 concentration profile, Figure 6 shows the temperature profiles of both the bed and the inflow. It is observed that the bed temperature of the moving bed is some 3 °C higher than that of the fixed-bed, which can be explained by the variation of the room temperature (referring to Tinflow shown in Figure 6). The bed temperature profile shown here refers to the temperature at the middle of the bed. For the moving-bed run, there was a slight step down of the temperature when
‘steady state’in moving-bed RFR
0 1000 2000 3000 4000 5000 60000
100
200
300
400
500
600
xCO2 moving bed Tbed moving bed Tinflow moving bed xCO2 fixed bed Tbed fixed bed Tinflow fixed bed
Time (s)
Out
let C
O2 c
once
ntra
tion
(ppm
)
16
20
24
28
32
36
40
Tem
pera
ture
(°C
)
Figure 6. Variation of CO2 outlet concentration (xCO2), bed temperature (Tbed), and inflow temperature(Tinflow) with time in the fixed-bed and the moving-bed modes, both operated at the same stoichiometrictime (43 min). Conditions are presented in Table 2.
Apart from the outlet CO2 concentration profile, Figure 6 shows the temperature profiles of boththe bed and the inflow. It is observed that the bed temperature of the moving bed is some 3 ◦C higherthan that of the fixed-bed, which can be explained by the variation of the room temperature (referring toTinflow shown in Figure 6). The bed temperature profile shown here refers to the temperature atthe middle of the bed. For the moving-bed run, there was a slight step down of the temperaturewhen the top bed became empty at 3600 s. There are initial temperature rises (at t < 200 s) for bothoperating modes, similar to those in Section 3.1, which are attributed to water adsorption. Assumingcomplete adsorption of incoming water vapor on the sorbent up to the saturation point, the adiabatictemperature rise is calculated to be around 7 ◦C, matching the experimentally observed temperatureexcursion. The initial temperature rise in the moving bed displays a similar pattern to the one in thefixed bed, which indicates that the rate of heat generation due to water co-adsorption dominates overany possible improvement in heat transfer in the moving-bed configuration.
The steady-state situation between around 2000 s to around 4000 s indicates the mechanicalfeasibility of the concept. However, the CO2 adsorption efficiency found was less promising. Fromthe averaged CO2 concentration (285 ppm) in this period of steady state, the average loading wascalculated and compared to the sorbent loading at the same (average) sorbent adsorption time of43 min (equal to the operating stoichiometric time). The results show a 46% reduction in working
Appl. Sci. 2020, 10, 1080 11 of 19
capacity (from 0.91 to 0.49 mol/kg) as well as a reduction in gas efficiency from 62% to 35% for themoving-bed RFR. The variation of the ηs and the ηG with time for both operating modes can be foundin Figure A8 in Appendix A.
Moreover, the phenomena of “cavity” and “pinning” may occur in a moving-bed RFR when thegas flowrate exceeds a certain value. These phenomena may lead to a reduced capture efficiency [50,51].A “cavity” can be formed between the inflow wall and sorbent, as the drag force between the gas flowand sorbent increases when the gas flow increases. Due to the formation of a cavity, the effective bedlength (in the direction of the gas flow) decreases and gas can bypass part of the sorbent bed; furthermaldistribution of the gas flow may occur. Indeed, we observed some cavities adjacent to the inflowwall. In addition, the sorbent’s downward movement was non-uniform. Decreasing the gas flow ratevisually avoided the appearance of cavities, but this leads to a lower CO2 supply rate and a longereffective tsto.
When the gas flow increases further, the gas flow exerts stronger normal stress to the particle,corresponding with an increment in the frictional force between the particle and the outflow wall. Theparticle will be “pinned” to the wall if the friction force is sufficient to hold the particle weights, andthe downward movement of the particle stops. We observed that the “pinning” appeared when thefeeding gas flow was further increased beyond 200 m3/h. The phenomena discussed above make themoving-bed operation practically challenging. More work is needed to investigate whether this can beresolved by modifying the geometry or operating conditions.
The time required to fill and empty the RFR is less than two minutes. In comparison with theadsorption time, this operating time loss (less than 5%) is significantly lower than the loss in workingcapacity when switching to continuous operation. Considering the above issues, the RFL process willused a fixed-bed RFR intermittently filled with freshly regenerated sorbent and emptied towards thedesorber (after sorbent saturation) as the preferred operating method for further study.
4. Discussion
In this section, the RFL process is evaluated using two criteria. The first criterion is the CO2
adsorption rate per unit volume of the contactor (as an indicator for contactor investment costs) and,secondly, the air–sorbent contacting energy per amount of CO2 captured (as an indicator for operatingenergy costs). As the CO2 adsorption rate is determined by both sorbent properties (such as pore sizeand volume, particle size, and working capacity) and operating conditions (flow rate and temperature)rather than the reactor type, the adsorption rate of the RFL process is evaluated by comparing withother DAC sorbents published in papers focused on sorbent development. In contrast, the factors fordetermining the contacting energy are multifaceted, including not only the sorbent property and theoperating conditions, but also the reactor type. In this way, the RFL process will be compared withthose papers for DAC studying both the sorbent and the reactor.
For the studies on the adsorption rate of the adsorbent, normally the comparison among differentsorbents is made by comparing the values of “adsorption half-time” (t50): The time required to reach50% of the final equilibrium CO2 capacity [17,52]. However, t50 is also dependent on the CO2 supplyrate. The effect of the supply rate on the (observed) adsorption half-time is often not addressed forDAC sorbent screening.
Here, we evaluate the adsorption rate of the sorbent used with those reported in literature atcomparable supply rate conditions. For this, the stoichiometric time (tsto) concept is used, introducedin Equation (1), which considers the differences both in the CO2 supply rate and in the sorbent CO2
capacity among various sorbents. In this way, a fair comparison of the adsorption rates among differentsorbents and processes can be made. In line with most literature studies, adsorption half-time (t50) isused to represent the adsorption rate here. The corresponding minimum time to reach that 50% ofqmax is 50% of the stoichiometric time for complete sorbent saturation (tsto). Figure 7 shows the t50
of the Lewatit sorbent used in this study in comparison to other solid functionalized sorbents testedat air capture conditions from the literature [17,25,47,52]. The operating flows of 188, 206, 273, and

Appl. Sci. 2020, 10, 1080 12 of 19
313 m3/h studied for Lewatit correspond to the 50% tsto values of 22, 18, 16, and 12 min, respectively.Note that other data from the literature listed in Figure 7 were all obtained from experiments at25 ◦C. Considering that there is only a 5 ◦C difference in the adsorption temperature (in this study,measurements are done around 20 ◦C), the effect of temperature on the adsorption rate among differentsorbents is negligible.
Appl. Sci. 2020, 10, 1080 12 of 20
supply rate. The effect of the supply rate on the (observed) adsorption half-time is often not addressed for DAC sorbent screening.
Here, we evaluate the adsorption rate of the sorbent used with those reported in literature at comparable supply rate conditions. For this, the stoichiometric time (tsto) concept is used, introduced in Equation (1), which considers the differences both in the CO2 supply rate and in the sorbent CO2 capacity among various sorbents. In this way, a fair comparison of the adsorption rates among different sorbents and processes can be made. In line with most literature studies, adsorption half-time (t50) is used to represent the adsorption rate here. The corresponding minimum time to reach that 50% of qmax is 50% of the stoichiometric time for complete sorbent saturation (tsto). Figure 7 shows the t50 of the Lewatit sorbent used in this study in comparison to other solid functionalized sorbents tested at air capture conditions from the literature [17,25,47,52]. The operating flows of 188, 206, 273, and 313 m3/h studied for Lewatit correspond to the 50% tsto values of 22, 18, 16, and 12 min, respectively. Note that other data from the literature listed in Figure 7 were all obtained from experiments at 25 °C. Considering that there is only a 5 °C difference in the adsorption temperature (in this study, measurements are done around 20 °C), the effect of temperature on the adsorption rate among different sorbents is negligible.
Figure 7. The relationship between the CO2 and water sorbent saturation half-time (t50) and the stoichiometric time (50% tsto) for Lewatit VP OC 1065 (data: See Figure A7 in Appendix A) compared with those of other air capture sorbents studied by [17,25,47,52].
The 50% tsto values (20–22 min) of various PEI/silica are similar to the one for the studied Lewatit sorbent, tested at φv = 188 m3/h. However, their t50 values are much longer than the sorbent used in this study. The reported minimum t50 of PEI/silica is 196 min and it is around five times longer than the t50 for Lewatit (33 min). Note that the PEI/silica data were measured using a thermogravimetric analyzer (TGA), while other referred adsorbents were tested in fixed beds.
Unlike the comparison with PEI-silica, the comparison of the studied sorbent with AEAPDMS-NFC, HAS6, and FS-PEI-50 is not straightforward due to the large differences in 50% tsto. Because the qmax for those sorbents do not differ largely (1.3–1.7 mol/kg), the difference in 50% tsto is due to the large difference in their CO2 supply rate. Figure 7 shows a dashed parity line, representing t50 = 50% tsto. For results that lie on the parity line, their adsorption rates are equal to the supply rates, implying marginal mass transfer and reaction kinetics limitations (in other words: Supply rate limitation). This is the case for HAS6 and FS-PEI-50, which are tested at very slow supply rates. Those supply rates are considered less attractive for practical application because they lead to much longer adsorption times as well as fewer cycle numbers. The adsorption half-time of HAS6 was constrained by mass transfer through the pores due to its morphology characters according to [17]. In comparison, the Lewatit sorbent has larger pores (38 vs. 4.9 nm) and larger pore volume (0.2 vs. 0.11 mL/g) than those for HAS6. From this comparison, we may expect that the adsorption rate for Lewatit will be faster than that for HAS6 in the applied tsto range for Lewatit.
1 10 100 10001
10
100
1000
Lewatit (this work) AEAPDMS-NFC (Gebald et al. 2011) PEI-silica (Choi et al. 2011b) HAS6 (Choi et al. 2011a) FS-PEI-50 (Goeppert et al. 2011) Water adsorption on Lewatit (this work)
t 50 (m
in)
50% * tsto (min)
Figure 7. The relationship between the CO2 and water sorbent saturation half-time (t50) and thestoichiometric time (50% tsto) for Lewatit VP OC 1065 (data: See Figure A7 in Appendix A) comparedwith those of other air capture sorbents studied by [17,25,47,52].
The 50% tsto values (20–22 min) of various PEI/silica are similar to the one for the studied Lewatitsorbent, tested at ϕv = 188 m3/h. However, their t50 values are much longer than the sorbent used inthis study. The reported minimum t50 of PEI/silica is 196 min and it is around five times longer thanthe t50 for Lewatit (33 min). Note that the PEI/silica data were measured using a thermogravimetricanalyzer (TGA), while other referred adsorbents were tested in fixed beds.
Unlike the comparison with PEI-silica, the comparison of the studied sorbent with AEAPDMS-NFC,HAS6, and FS-PEI-50 is not straightforward due to the large differences in 50% tsto. Because the qmax
for those sorbents do not differ largely (1.3–1.7 mol/kg), the difference in 50% tsto is due to the largedifference in their CO2 supply rate. Figure 7 shows a dashed parity line, representing t50 = 50% tsto.For results that lie on the parity line, their adsorption rates are equal to the supply rates, implyingmarginal mass transfer and reaction kinetics limitations (in other words: Supply rate limitation). Thisis the case for HAS6 and FS-PEI-50, which are tested at very slow supply rates. Those supply rates areconsidered less attractive for practical application because they lead to much longer adsorption timesas well as fewer cycle numbers. The adsorption half-time of HAS6 was constrained by mass transferthrough the pores due to its morphology characters according to [17]. In comparison, the Lewatitsorbent has larger pores (38 vs. 4.9 nm) and larger pore volume (0.2 vs. 0.11 mL/g) than those for HAS6.From this comparison, we may expect that the adsorption rate for Lewatit will be faster than that forHAS6 in the applied tsto range for Lewatit.
For a relative fast supply rate, like that for both AEAPDMS-NFC and Lewatit, the t50 lies abovethe dashed line, indicating some extents of rate limitation in the mass transfer, the intrinsic reaction, orboth. These limitations increase when the supply rate increases. The AEAPDMS-NFC sorbent, testedat a smaller supply rate, already deviates more (in the vertical direction) from the parity line in Figure 7than the sorbent used in this work. It therefore seems plausible that at comparable supply conditions,in the range of 15–30 minutes for 50% of tsto, this difference will be significantly larger, underlining thefast adsorption rate of the Lewatit sorbent.
Appl. Sci. 2020, 10, 1080 13 of 19
Note that the t50 values for water adsorption using the studied sorbent and its relation to 50%tsto are also shown in Figure 7. The short tsto values are due to the much higher water content in aircompared to CO2. Those two results for water are in line with the results of CO2 adsorption using thestudied sorbent. This indicates that the water adsorption, shown in Figure 5, is also fast. Overall, it canbe summarized that the sorbent used shows a good performance with respect to the adsorption ratefor DAC in comparison with other sorbents reported in the literature.
Moving forward to the evaluation of the RFL process regarding the contacting energy, Table 4shows the comparison of the adsorption characteristics among various DAC systems, all usingsupported amine sorbents. The results listed for this work are calculated using the data shown inFigure 7. The operating conditions in the present study were selected based on an optimizationstrategy presented in an earlier study [29]. The conditions for other studies [40,41,53] were taken fromthe respective studies at conditions selected by the respective authors for their technical/economicassessment. We recalculated the tsto values for these studies, and the results (included in Table 4)show that the conditions in this work (24–43 min) are within the range covered by the references(14–101 min).
Table 4. Comparison of contacting energies for air capture using supported amines—present studycompared with selected literature.
Reference [41] [40] [53] (This Work)
Sorbent PEI-silica TRI-PE-MCM-41 MIL-101(Cr)-PEI800/mmen-Mg2(dobpdc)
Lewatit VP OC1065
Sorbent type impregnated grafted MOF PolymericCapture system Circ. Fluid Bed monolith monolith RFR
∆P adsorber (Pa) 1592 100 n.m. 348-681 (a)
tsto (min) 14 101 31/88 24–43Selected tads (min) 15 101 19/60 24–43
Contact energy(GJ/tCO2) 3.4 (b) 0.3 (c) 2.3/2.1 0.7–1.5
(a) The pressure drop was measured using the applied flow rates for results shown in Figure 7. (b) Including0.4 GJ/tCO2 for CO2 compression (efficiency is assumed to be 80%). (c) Fan efficiency is assumed to be 80%.
For the selected cases, it is observed that the pressure drop and the electricity consumption for theRFL process are significantly lower than the sorbent circulation process using PEI-silica and a circulatingfluidized bed reactor [41]. The process using TRI-PE-MCM-41 in a monolithic contactor possessed thelowest pressure drop in this comparison, but required a longer adsorption time, presumably causedby a long tsto [40]. A longer adsorption time decreases the number of cycles per day and the reactorproductivity, and eventually increases the sorbent and the reactor costs. Furthermore, monolithiccontactors require time (and energy) for heating/cooling taking place in the same contactor.
The importance of the stoichiometric time in Equation (1) implies at the same time that forchanging (weather) conditions affecting the sorbent loading qmax, the actual gas velocity should alsobe adapted by process control. For completeness’ sake, it should be mentioned that this work focuseson the DAC adsorption step and not the desorption step, which needs further investigation. Thesorbent desorption using hot nitrogen gas, as used in this study, was done solely for the purpose ofobtaining lean sorbent. Based on the comparison of sorbent loading kinetics and contactor performance,the studied “RFL DAC” system seems to be a promising option for adsorbing CO2 from ambient air.
5. Conclusions
In this study, CO2 capture from ambient air is evaluated for the combination of a novel radialflow reactor and a polymeric supported amine sorbent. The radial flow reactor, containing 2000 gof sorbent, showed a performance in accordance with the design basis. The design was based onfixed-bed experiments using only 1 g of sorbent. This study shows that this radial flow reactor can be
Appl. Sci. 2020, 10, 1080 14 of 19
designed and scaled up with confidence based on fixed-bed adsorption data. The studied sorbent isfound to have a fair CO2 capacity and fast adsorption rate. The total RFL system is characterized bya low pressure drop and low contacting energy, uniform flow distribution, short gas residence time,and short adsorption time (24–43 min), making it a good candidate for direct air capture applicationsand further scale-up.
Author Contributions: Conceptualization and methodology: Q.Y. and W.B.; validation: Q.Y.; writing: Q.Y. andW.B. Supervision. All authors have read and agreed to the published version of the manuscript.
Funding: This research was carried out within the EU MIRACLES project (www.miraclesproject.eu) and hasreceived funding from the European Union’s Seventh Framework Program for research, technological development,and demonstration under grant agreement No 613588.
Acknowledgments: Benno Knaken, Johan Agterhorst, and Karst van Bree are acknowledged for their great workin the construction of the set-up.
Conflicts of Interest: The authors declare no conflict of interest.
Appendix A
Selection of the Contacting Method
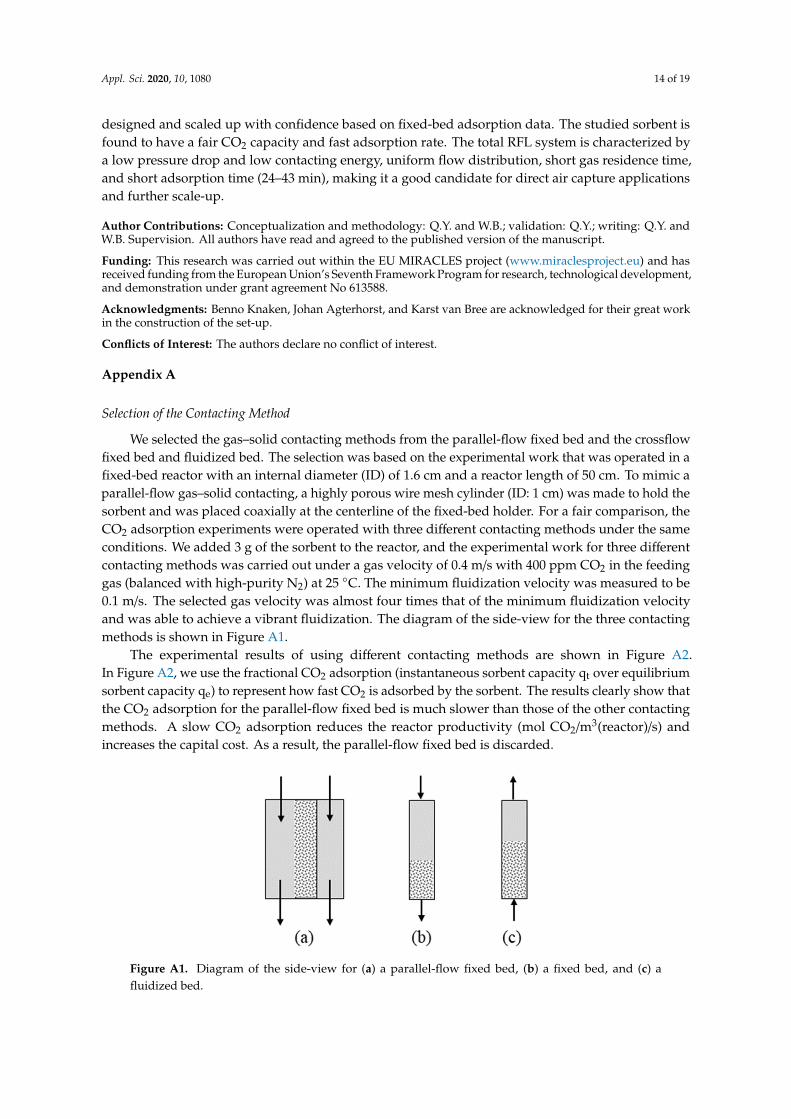
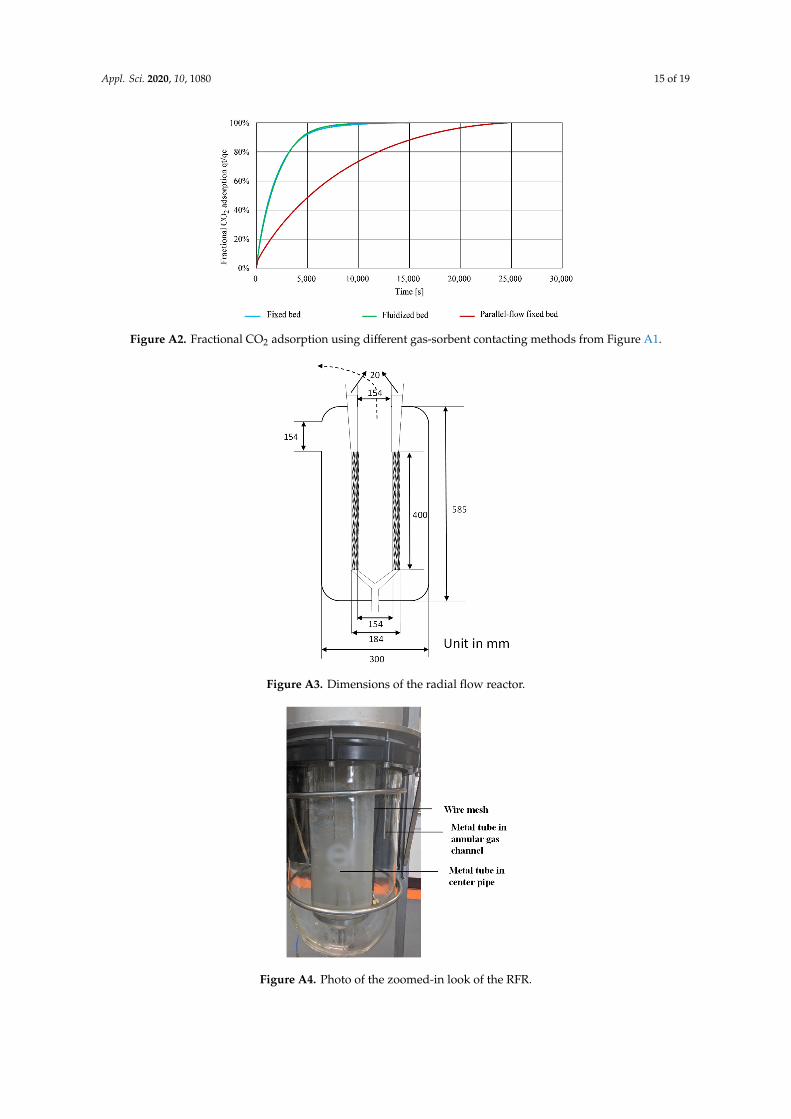
We selected the gas–solid contacting methods from the parallel-flow fixed bed and the crossflowfixed bed and fluidized bed. The selection was based on the experimental work that was operated in afixed-bed reactor with an internal diameter (ID) of 1.6 cm and a reactor length of 50 cm. To mimic aparallel-flow gas–solid contacting, a highly porous wire mesh cylinder (ID: 1 cm) was made to hold thesorbent and was placed coaxially at the centerline of the fixed-bed holder. For a fair comparison, theCO2 adsorption experiments were operated with three different contacting methods under the sameconditions. We added 3 g of the sorbent to the reactor, and the experimental work for three differentcontacting methods was carried out under a gas velocity of 0.4 m/s with 400 ppm CO2 in the feedinggas (balanced with high-purity N2) at 25 ◦C. The minimum fluidization velocity was measured to be0.1 m/s. The selected gas velocity was almost four times that of the minimum fluidization velocityand was able to achieve a vibrant fluidization. The diagram of the side-view for the three contactingmethods is shown in Figure A1.
The experimental results of using different contacting methods are shown in Figure A2.In Figure A2, we use the fractional CO2 adsorption (instantaneous sorbent capacity qt over equilibriumsorbent capacity qe) to represent how fast CO2 is adsorbed by the sorbent. The results clearly show thatthe CO2 adsorption for the parallel-flow fixed bed is much slower than those of the other contactingmethods. A slow CO2 adsorption reduces the reactor productivity (mol CO2/m3(reactor)/s) andincreases the capital cost. As a result, the parallel-flow fixed bed is discarded.Appl. Sci. 2020, 10, 1080 15 of 20
Figure A1. Diagram of the side-view for (a) a parallel-flow fixed bed, (b) a fixed bed, and (c) a fluidized bed.
Figure A2. Fractional CO2 adsorption using different gas-sorbent contacting methods from Figure A1.
Figure A3. Dimensions of the radial flow reactor.
Figure A1. Diagram of the side-view for (a) a parallel-flow fixed bed, (b) a fixed bed, and (c) afluidized bed.
Appl. Sci. 2020, 10, 1080 15 of 19
Appl. Sci. 2020, 10, 1080 15 of 20
Figure A1. Diagram of the side-view for (a) a parallel-flow fixed bed, (b) a fixed bed, and (c) a fluidized bed.
Figure A2. Fractional CO2 adsorption using different gas-sorbent contacting methods from Figure A1.
Figure A3. Dimensions of the radial flow reactor.
Figure A2. Fractional CO2 adsorption using different gas-sorbent contacting methods from Figure A1.
Appl. Sci. 2020, 10, 1080 15 of 20
Figure A1. Diagram of the side-view for (a) a parallel-flow fixed bed, (b) a fixed bed, and (c) a fluidized bed.
Figure A2. Fractional CO2 adsorption using different gas-sorbent contacting methods from Figure A1.
Figure A3. Dimensions of the radial flow reactor. Figure A3. Dimensions of the radial flow reactor.
Appl. Sci. 2020, 10, 1080 16 of 20
Figure A4. Photo of the zoomed-in look of the RFR.
(a) (b)
Figure A5. (a) Photo; (b)Schematic diagram of the modified set-up for testing the moving-bed RFR.
Figure A4. Photo of the zoomed-in look of the RFR.

Appl. Sci. 2020, 10, 1080 16 of 19
Appl. Sci. 2020, 10, 1080 16 of 20
Figure A4. Photo of the zoomed-in look of the RFR.
(a) (b)
Figure A5. (a) Photo; (b)Schematic diagram of the modified set-up for testing the moving-bed RFR. Figure A5. (a) Photo; (b) Schematic diagram of the modified set-up for testing the moving-bed RFR.Appl. Sci. 2020, 10, 1080 17 of 20
Figure A6. Pressure drop over the RFR unit with a fully sorbent-loaded bed and an empty bed (wire mesh only) at varying flow rates and corresponding superficial velocities.
Figure A7. Maximum CO2 adsorption capacity and average inlet concentration at varying flow rates (T = 20–21 °C, RH = 40%–65%).
Figure A8. The variation of the ηS and ηG with time for the fixed-bed RFR and moving-bed RFR. (qmax = 1.5 mol/kg; xout for moving-bed RFR = 285 ppm).
0 50 100 150 200 250 300 3500
100
200
300
400
500
600
700
Fully loaded with sorbent Empty
Pres
sure
dro
p dP
(Pa)
Air flow (m3/h)
0.0 0.1 0.2 0.3 0.4Superficial velocity (m/s)
160 180 200 220 240 260 280 300 320 3400.0
0.5
1.0
1.5
2.0
qmax
Cin
ϕv (m3 h-1)
Cap
acity
(mol
kg-1
)
200
300
400
500
Aver
aged
CO
2 inl
et c
once
ntra
tion
(ppm
)
0 500 1000 1500 2000 2500 30000.0
0.2
0.4
0.6
0.8
1.0
η s / η g
Time (s)
Fixed-bed_ηs
Fixed-bed_ηg
Moving-bed_ηs
Moving-bed_ηg when XCO2,out = 285 ppm
Figure A6. Pressure drop over the RFR unit with a fully sorbent-loaded bed and an empty bed(wire mesh only) at varying flow rates and corresponding superficial velocities.
Appl. Sci. 2020, 10, 1080 17 of 20
Figure A6. Pressure drop over the RFR unit with a fully sorbent-loaded bed and an empty bed (wire mesh only) at varying flow rates and corresponding superficial velocities.
Figure A7. Maximum CO2 adsorption capacity and average inlet concentration at varying flow rates (T = 20–21 °C, RH = 40%–65%).
Figure A8. The variation of the ηS and ηG with time for the fixed-bed RFR and moving-bed RFR. (qmax = 1.5 mol/kg; xout for moving-bed RFR = 285 ppm).
0 50 100 150 200 250 300 3500
100
200
300
400
500
600
700
Fully loaded with sorbent Empty
Pres
sure
dro
p dP
(Pa)
Air flow (m3/h)
0.0 0.1 0.2 0.3 0.4Superficial velocity (m/s)
160 180 200 220 240 260 280 300 320 3400.0
0.5
1.0
1.5
2.0
qmax
Cin
ϕv (m3 h-1)
Cap
acity
(mol
kg-1
)
200
300
400
500
Aver
aged
CO
2 inl
et c
once
ntra
tion
(ppm
)
0 500 1000 1500 2000 2500 30000.0
0.2
0.4
0.6
0.8
1.0
η s / η g
Time (s)
Fixed-bed_ηs
Fixed-bed_ηg
Moving-bed_ηs
Moving-bed_ηg when XCO2,out = 285 ppm
Figure A7. Maximum CO2 adsorption capacity and average inlet concentration at varying flow rates(T = 20–21 ◦C, RH = 40%–65%).
Appl. Sci. 2020, 10, 1080 17 of 19
Appl. Sci. 2020, 10, 1080 17 of 20
Figure A6. Pressure drop over the RFR unit with a fully sorbent-loaded bed and an empty bed (wire mesh only) at varying flow rates and corresponding superficial velocities.
Figure A7. Maximum CO2 adsorption capacity and average inlet concentration at varying flow rates (T = 20–21 °C, RH = 40%–65%).
Figure A8. The variation of the ηS and ηG with time for the fixed-bed RFR and moving-bed RFR. (qmax = 1.5 mol/kg; xout for moving-bed RFR = 285 ppm).
0 50 100 150 200 250 300 3500
100
200
300
400
500
600
700
Fully loaded with sorbent Empty
Pres
sure
dro
p dP
(Pa)
Air flow (m3/h)
0.0 0.1 0.2 0.3 0.4Superficial velocity (m/s)
160 180 200 220 240 260 280 300 320 3400.0
0.5
1.0
1.5
2.0
qmax
Cin
ϕv (m3 h-1)
Cap
acity
(mol
kg-1
)
200
300
400
500
Aver
aged
CO
2 inl
et c
once
ntra
tion
(ppm
)
0 500 1000 1500 2000 2500 30000.0
0.2
0.4
0.6
0.8
1.0
η s / η g
Time (s)
Fixed-bed_ηs
Fixed-bed_ηg
Moving-bed_ηs
Moving-bed_ηg when XCO2,out = 285 ppm
Figure A8. The variation of the ηS and ηG with time for the fixed-bed RFR and moving-bed RFR.(qmax = 1.5 mol/kg; xout for moving-bed RFR = 285 ppm).
References
1. Lackner, K.S.; Brennan, S.; Matter, J.M.; Park, A.H.A.; Wright, A.; van der Zwaan, B. The urgency of thedevelopment of CO2 capture from ambient air. Proc. Natl. Acad. Sci. USA 2012, 109, 13156–13162. [CrossRef][PubMed]
2. Goeppert, A.; Czaun, M.; Prakash, G.K.S.; Olah, G.A. Air as the renewable carbon source of the future:An overview of CO2 capture from the atmosphere. Energy Environ. Sci 2012, 5, 7833–7853. [CrossRef]
3. Graves, C.; Ebbesen, S.D.; Mogensen, M.; Lackner, K.S. Sustainable hydrocarbon fuels by recycling CO2 andH2O with renewable or nuclear energy. Renew. Sust. Energ. Rev 2011, 15, 1–23. [CrossRef]
4. Martens, J.A.; Bogaerts, A.; De Kimpe, N.; Jacobs, P.A.; Marin, G.B.; Rabaey, K.; Saeys, M.; Verhelst, S.The Chemical Route to a Carbon Dioxide Neutral World. ChemSusChem 2017, 10, 1039–1055. [CrossRef][PubMed]
5. Sanz-Pérez, E.S.; Murdock, C.R.; Didas, S.A.; Jones, C.W. Direct Capture of CO2 from Ambient Air. Chem.Rev. 2016, 116, 11840–11876. [CrossRef] [PubMed]
6. Lackner, K.S.; Ziock, H.-J.; Grimes, P. Carbon capture from air, is it an option? In Proceedings of the 24thAnnual Technical Conference on Coal Utilisation and Fuel Systems, Clearwater, FL, USA, 8–11 March 1999.
7. Baciocchi, R.; Storti, G.; Mazzotti, M. Process design and energy requirements for the capture of carbondioxide from air. Chem. Eng. Process. Process Intensif. 2006, 45, 1047–1058. [CrossRef]
8. Zeman, F. Energy and material balance of CO2 capture from ambient air. Environ. Sci. Technol. 2007, 41,7558–7563. [CrossRef]
9. Keith, D.W.; Holmes, G.; St. Angelo, D.; Heidel, K. A Process for Capturing CO2 from the Atmosphere. Joule2018, 2, 1573–1594. [CrossRef]
10. Tollefson, J. Price of sucking CO2 from air plunges. Nature 2018, 558, 173. [CrossRef]11. Belmabkhout, Y.; Serna-Guerrero, R.; Sayari, A. Amine-bearing mesoporous silica for CO2 removal from dry
and humid air. Chem. Eng. Sci. 2010, 65, 3695–3698. [CrossRef]12. Breault, R.W.; Spenik, J.L.; Shadle, L.J.; Hoffman, J.S.; Gray, M.L.; Panday, R.; Stehle, R.C. Carbon capture test
unit design and development using amine-based solid sorbent. Chem. Eng. Res. Des. 2016, 112, 251–262.[CrossRef]
13. Brilman, D.W.F.; Veneman, R. Capturing atmospheric CO2 using supported amine sorbents. Energy Procedia2013, 37, 6070–6078. [CrossRef]
14. Wang, T.; Lackner, K.S.; Wright, A. Moisture Swing Sorbent for Carbon Dioxide Capture from Ambient Air.Environ. Sci. Technol. 2011, 45, 6670–6675. [CrossRef]
15. Wang, T.; Hou, C.; Ge, K.; Lackner, K.S.; Shi, X.; Liu, J.; Fang, M.; Luo, Z. Spontaneous Cooling Absorption ofCO2 by a Polymeric Ionic Liquid for Direct Air Capture. J. Phys. Chem. Lett 2017, 8, 3986–3990. [CrossRef]

Appl. Sci. 2020, 10, 1080 18 of 19
16. Wurzbacher, J.A.; Gebald, C.; Brunner, S.; Steinfeld, A. Heat and mass transfer of temperature–vacuumswing desorption for CO2 capture from air. Chem. Eng. J. 2016, 283, 1329–1338. [CrossRef]
17. Choi, S.; Drese, J.H.; Eisenberger, P.M.; Jones, C.W. Application of amine-tethered solid sorbents for directCO2 capture from the ambient air. Environ. Sci. Technol. 2011, 45, 2420–2427. [CrossRef]
18. Darunte, L.A.; Oetomo, A.D.; Walton, K.S.; Sholl, D.S.; Jones, C.W. Direct Air Capture of CO2 Using AmineFunctionalized MIL-101(Cr). ACS Sustain. Chem. Eng. 2016, 4, 5761–5768. [CrossRef]
19. Elfving, J.; Bajamundi, C.; Kauppinen, J.; Sainio, T. Modelling of equilibrium working capacity of PSA, TSAand TVSA processes for CO2 adsorption under direct air capture conditions. J CO2 Util. 2017, 22, 270–277.[CrossRef]
20. Gebald, C.; A. Wurzbacher, J.; Borgschulte, A.; Zimmermann, T.; Steinfeld, A. Single-Component and BinaryCO2 and H2O Adsorption of Amine-Functionalized Cellulose. Environ. Sci. Technol. 2014, 48, 2497–2504.[CrossRef]
21. Lackner, K.S.; Grimes, P.; Ziock, H.J. Capturing carbon dioxide from air. Carbon Capture Storage CO2 Manag.Technol. 2014, 364–376.
22. Mutyala, S.; Jonnalagadda, M.; Mitta, H.; Gundeboyina, R. CO2 capture and adsorption kinetic study ofamine-modified MIL-101 (Cr). Chem. Eng. Res. Des. 2019, 143, 241–248. [CrossRef]
23. Sakwa-Novak, M.A.; Jones, C.W. Steam Induced Structural Changes of a Poly(ethylenimine) Impregnatedgamma-Alumina Sorbent for CO2 Extraction from Ambient Air. ACS Appl. Mater. Interfaces 2014, 6,9245–9255. [CrossRef]
24. Sehaqui, H.; Gálvez, M.E.; Becatinni, V.; Cheng Ng, Y.; Steinfeld, A.; Zimmermann, T.; Tingaut, P. Fast andreversible direct CO2 capture from air onto all-polymer nanofibrillated cellulose-polyethylenimine foams.Environ. Sci. Technol. 2015, 49. [CrossRef]
25. Goeppert, A.; Czaun, M.; May, R.B.; Prakash, G.K.S.; Olah, G.A.; Narayanan, S.R. Carbon dioxide capturefrom the air using a polyamine based regenerable solid adsorbent. J. Am. Chem. Soc. 2011, 133, 20164–20167.[CrossRef]
26. Lu, W.; Sculley, J.P.; Yuan, D.; Krishna, R.; Zhou, H.-C. Carbon Dioxide Capture from Air Using Amine-GraftedPorous Polymer Networks. J. Phys. Chem. C 2013, 117, 4057–4061. [CrossRef]
27. McDonald, T.M.; Lee, W.R.; Mason, J.A.; Wiers, B.M.; Hong, C.S.; Long, J.R. Capture of Carbon Dioxide fromAir and Flue Gas in the Alkylamine-Appended Metal–Organic Framework mmen-Mg2(dobpdc). J. Am.Chem. Soc. 2012, 134, 7056–7065. [CrossRef]
28. Sculley, J.P.; Zhou, H.-C. Enhancing Amine-Supported Materials for Ambient Air Capture. Angew. Chem. Int.Ed. 2012, 51, 12660–12661. [CrossRef]
29. Yu, Q.; Brilman, D.W.F. Design Strategy for CO2 Adsorption from Ambient Air Using a Supported AmineBased Sorbent in a Fixed Bed Reactor. Energy Procedia 2017, 114, 6102–6114. [CrossRef]
30. Li, J.C.H. Radial-Flow Packed-Bed Reactors. In Ullmann’s Encyclopedia of Industrial Chemistry; Wiley: Hoboken,NJ, USA, 2007.
31. Kareeri, A.A.; Zughbi, H.D.; Al-Ali, H.H. Simulation of Flow Distribution in Radial Flow Reactors. Ind. Eng.Chem. Res. 2006, 45, 2862–2874. [CrossRef]
32. Mu, Z.; Wang, J.; Wang, T.; Jin, Y. Optimum design of radial flow moving-bed reactors based on a mathematicalhydrodynamic model. Chem. Eng. Process. Process Intensif. 2003, 42, 409–417. [CrossRef]
33. Wang, J.; Wang, H. Discrete method for design of flow distribution in manifolds. Appl. Therm. Eng. 2015, 89,927–945. [CrossRef]
34. Iranshahi, D.; Rahimpour, M.R.; Asgari, A. A novel dynamic radial-flow, spherical-bed reactor concept fornaphtha reforming in the presence of catalyst deactivation. Int. J. Hydrogen Energy 2010, 35, 6261–6275.[CrossRef]
35. Rahimpour, M.R.; Iranshahi, D.; Pourazadi, E.; Paymooni, K. Evaluation of Optimum Design Parameters andOperating Conditions of Axial- and Radial-Flow Tubular Naphtha Reforming Reactors, Using the DifferentialEvolution Method, Considering Catalyst Deactivation. Energy Fuels 2011, 25, 762–772. [CrossRef]
36. Hamedi, N.; Tohidian, T.; Rahimpour, M.R.; Iranshahi, D.; Raeissi, S. Conversion enhancement of heavyreformates into xylenes by optimal design of a novel radial flow packed bed reactor, applying a detailedkinetic model. Chem. Eng. Res. Des. 2015, 95, 317–336. [CrossRef]
37. Parvasi, P.; Jokar, S.M. A novel reactor configuration for industrial methanol production from the synthesisgas. J. Energy Resour. Technol. Trans. ASME 2019, 141. [CrossRef]
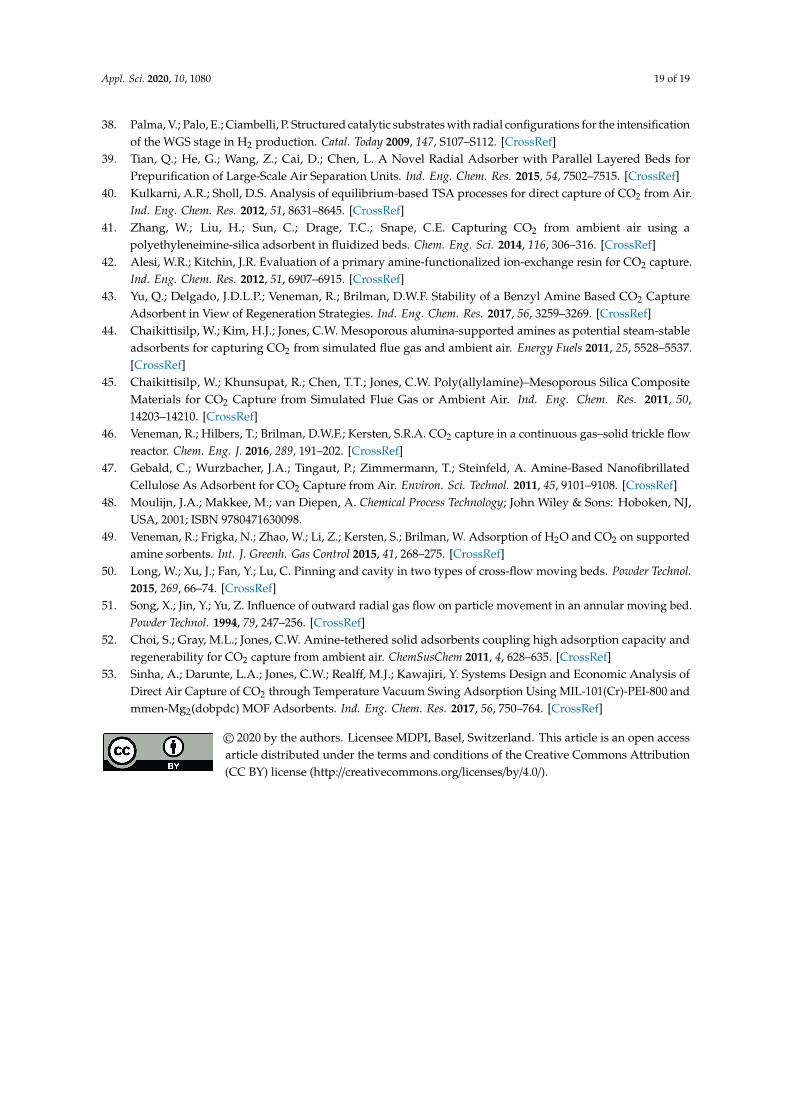
Appl. Sci. 2020, 10, 1080 19 of 19
38. Palma, V.; Palo, E.; Ciambelli, P. Structured catalytic substrates with radial configurations for the intensificationof the WGS stage in H2 production. Catal. Today 2009, 147, S107–S112. [CrossRef]
39. Tian, Q.; He, G.; Wang, Z.; Cai, D.; Chen, L. A Novel Radial Adsorber with Parallel Layered Beds forPrepurification of Large-Scale Air Separation Units. Ind. Eng. Chem. Res. 2015, 54, 7502–7515. [CrossRef]
40. Kulkarni, A.R.; Sholl, D.S. Analysis of equilibrium-based TSA processes for direct capture of CO2 from Air.Ind. Eng. Chem. Res. 2012, 51, 8631–8645. [CrossRef]
41. Zhang, W.; Liu, H.; Sun, C.; Drage, T.C.; Snape, C.E. Capturing CO2 from ambient air using apolyethyleneimine-silica adsorbent in fluidized beds. Chem. Eng. Sci. 2014, 116, 306–316. [CrossRef]
42. Alesi, W.R.; Kitchin, J.R. Evaluation of a primary amine-functionalized ion-exchange resin for CO2 capture.Ind. Eng. Chem. Res. 2012, 51, 6907–6915. [CrossRef]
43. Yu, Q.; Delgado, J.D.L.P.; Veneman, R.; Brilman, D.W.F. Stability of a Benzyl Amine Based CO2 CaptureAdsorbent in View of Regeneration Strategies. Ind. Eng. Chem. Res. 2017, 56, 3259–3269. [CrossRef]
44. Chaikittisilp, W.; Kim, H.J.; Jones, C.W. Mesoporous alumina-supported amines as potential steam-stableadsorbents for capturing CO2 from simulated flue gas and ambient air. Energy Fuels 2011, 25, 5528–5537.[CrossRef]
45. Chaikittisilp, W.; Khunsupat, R.; Chen, T.T.; Jones, C.W. Poly(allylamine)–Mesoporous Silica CompositeMaterials for CO2 Capture from Simulated Flue Gas or Ambient Air. Ind. Eng. Chem. Res. 2011, 50,14203–14210. [CrossRef]
46. Veneman, R.; Hilbers, T.; Brilman, D.W.F.; Kersten, S.R.A. CO2 capture in a continuous gas–solid trickle flowreactor. Chem. Eng. J. 2016, 289, 191–202. [CrossRef]
47. Gebald, C.; Wurzbacher, J.A.; Tingaut, P.; Zimmermann, T.; Steinfeld, A. Amine-Based NanofibrillatedCellulose As Adsorbent for CO2 Capture from Air. Environ. Sci. Technol. 2011, 45, 9101–9108. [CrossRef]
48. Moulijn, J.A.; Makkee, M.; van Diepen, A. Chemical Process Technology; John Wiley & Sons: Hoboken, NJ,USA, 2001; ISBN 9780471630098.
49. Veneman, R.; Frigka, N.; Zhao, W.; Li, Z.; Kersten, S.; Brilman, W. Adsorption of H2O and CO2 on supportedamine sorbents. Int. J. Greenh. Gas Control 2015, 41, 268–275. [CrossRef]
50. Long, W.; Xu, J.; Fan, Y.; Lu, C. Pinning and cavity in two types of cross-flow moving beds. Powder Technol.2015, 269, 66–74. [CrossRef]
51. Song, X.; Jin, Y.; Yu, Z. Influence of outward radial gas flow on particle movement in an annular moving bed.Powder Technol. 1994, 79, 247–256. [CrossRef]
52. Choi, S.; Gray, M.L.; Jones, C.W. Amine-tethered solid adsorbents coupling high adsorption capacity andregenerability for CO2 capture from ambient air. ChemSusChem 2011, 4, 628–635. [CrossRef]
53. Sinha, A.; Darunte, L.A.; Jones, C.W.; Realff, M.J.; Kawajiri, Y. Systems Design and Economic Analysis ofDirect Air Capture of CO2 through Temperature Vacuum Swing Adsorption Using MIL-101(Cr)-PEI-800 andmmen-Mg2(dobpdc) MOF Adsorbents. Ind. Eng. Chem. Res. 2017, 56, 750–764. [CrossRef]
© 2020 by the authors. Licensee MDPI, Basel, Switzerland. This article is an open accessarticle distributed under the terms and conditions of the Creative Commons Attribution(CC BY) license (http://creativecommons.org/licenses/by/4.0/).