a random assignment evaluation of learning communities at kingsborough community ... · ·...
TRANSCRIPT
A Random Assignment Evaluation of Learning Communities at Kingsborough Community College:
Seven Years Later
Michael J. Weiss Alexander Mayer
Dan Cullinan Alyssa Ratledge Colleen Sommo John Diamond
March 2014


iii
Acknowledgments
The long-term follow-up study at Kingsborough Community College’s Opening Doors Learn-ing Communities program, presented in this paper, was supported by the Institute of Education Sciences, U.S. Department of Education, through Grant No. R305A100066-11 to MDRC. The opinions expressed are those of the authors and do not represent the views of the Institute or the U.S. Department of Education. We are very appreciative of the Institute’s generous support.
The original work on the Opening Doors demonstration received support from a number of foundations and government agencies. We are grateful for their generous backing and ongoing commitment. We particularly thank the Robin Hood Foundation, which provided special fund-ing to support the Opening Doors program at Kingsborough Community College. We also owe special thanks to the members of the MacArthur Foundation-funded Network on Transitions to Adulthood and to our research partners on Opening Doors, who helped us conceptualize the study and who participated in the design of the 12-month survey.
We are also grateful to the many administrators, faculty, and staff at Kingsborough who have made Opening Doors a success. There is not enough space to mention everyone who has played a role in the program and the study, but we particularly want to acknowledge some individuals. The leadership of Byron McClenney, the president of Kingsborough through 2003, was crucial in successfully launching the program. Interim President Fred Malamet continued to support the project during his tenure. Past President Regina Peruggi, whose tenure began in the fall of 2004, enthusiastically championed Opening Doors and worked to expand the program to serve most of the college’s freshmen. The current Interim President Stuart Suss and former Dean of Student Services Norman Toback provided valuable support and assistance throughout the project.
Rachel Singer, former Director of Academic Affairs, and Peter Cohen, Associate Dean for Stu-dent Affairs, were terrific partners from the inception of the project. Their dedication and pas-sion were inspirational and invaluable. Additionally, current Director of Academic Affairs Marissa Schlesinger was an insightful and informative partner as this analysis neared comple-tion. The Opening Doors faculty, coordinators, and case managers brought the program model to life. We cannot mention them all by name, but faculty members Marcia Babbitt, Rebecca Arliss, Kate Garretson, and Barbara Walters deserve special recognition for their contribution. The Opening Doors coordinators, Barbara Fairweather and Susan Richards, and the case man-agers, Nora Bita and Zuleika Rodriguez, operated the program day to day. All these individuals contributed to the research in valuable ways.
Dissemination of MDRC publications is supported by the following funders that help finance MDRC’s public policy outreach and expanding efforts to communicate the results and implica-tions of our work to policymakers, practitioners, and others: The Annie E. Casey Foundation,

iv
The George Gund Foundation, The Harry and Jeanette Weinberg Foundation, Inc., The Kresge Foundation, Laura and John Arnold Foundation, Sandler Foundation, and The Starr Foundation.
In addition, earnings from the MDRC Endowment help sustain our dissemination efforts. Contributors to the MDRC Endowment include Alcoa Foundation, The Ambrose Monell Foundation, Anheuser-Busch Foundation, Bristol-Myers Squibb Foundation, Charles Stewart Mott Foundation, Ford Foundation, The George Gund Foundation, The Grable Foundation, The Lizabeth and Frank Newman Charitable Foundation, The New York Times Company Foundation, Jan Nicholson, Paul H. O’Neill Charitable Foundation, John S. Reed, Sandler Foundation, and The Stupski Family Fund, as well as other individual contributors.
The findings and conclusions in this paper do not necessarily represent the official positions and policies of the funders.
For information about MDRC and copies of our publications, see our Web site: www.mdrc.org.
Copyright © 2014 by MDRC®. All rights reserved.

v
Abstract
Community colleges play a vital role in higher education, enrolling more than one in every three postsecondary students. While the market share of these institutions has grown over the past 50 years, students’ success rates remain low. Consequently, community college stakeholders are searching with mounting urgency for strategies that increase rates of success. We evaluate the effects of one such strategy, learning communities, from a randomized trial of over 1,500 students at a large urban college in the City University of New York (CUNY) system. Findings indicate that the program’s positive effects on short-term academic progress (credit accumula-tion) are maintained seven years after random assignment. In addition, the analysis provides some limited evidence that the program positively affected graduation rates, particularly for those students without remedial English needs, over this period. At the same time, however, there is no discernible evidence that the program improved economic outcomes. This paper concludes by offering sobering reflections on trying to detect the effects of higher education interventions on future earnings.


vii
Contents
Acknowledgments iii Abstract v List of Exhibits ix Introduction 1 Learning Communities 3 The Kingsborough Learning Communities Evaluation 7 Estimation and Results 13 Discussion 31 References 35


ix
Exhibits
Table
1 Selected Characteristics of Sample Members at Baseline 10
2 Key Outcomes, Seven Years After Random Assignment 16
3 Academic Outcomes, Years 1-7 21
4 Economic Outcomes, Years 1-7 23
5 Cumulative Credits Earned at Any CUNY College, by English Skills Assessment at Baseline, Years 1-7 25
6 Degree Earned at Any College, by English Skills Assessment at Baseline, Years 1-7 27
7 Necessary Returns to Degree in Year 7, Assuming Earnings Effects Only Through Degree Receipt 33
Figure
1 CUNY Enrollment in Main Sessions and Intersessions 18


1
Introduction
Over the last five decades, community colleges have played an increasingly prominent role in American postsecondary education and workforce development. In 1963, community colleges enrolled 740,000 students, representing 15 percent of all fall enrollments in postsecondary institutions. By 2010, enrollment had increased by over 875 percent, to 7.2 million students, representing 34 percent of all fall postsecondary enrollments (National Center for Education Statistics, 2011). Community colleges are generally open-access institutions with minimal academic admission requirements, if any, and a significantly lower cost of attendance than four-year colleges and universities. Tuition and fees for community college are around one-third the cost of those for public four-year colleges and universities, and around one-tenth the cost of those for private four-year colleges and universities (College Board Advocacy and Policy Center, 2012). Unlike most four-year institutions, community colleges frequently offer certifi-cate and degree programs aimed at training workers in disciplines where they can immediately transition from a short college program to a full-time job or career. All of these characteristics contribute to the appeal of community colleges to low-income, at-risk populations.
Empirical evidence confirms that increased education is positively associated with higher earnings across a wide spectrum of fields and student demographics (Barrow and Rouse, 2005; Card, 2001; Carneiro, Heckman, and Vytlacil, 2011; Dadgar and Weiss, 2012; Dynarski, 2008; Jacobson and Mokher, 2009; Jepsen, Troske, and Coomes, 2009; Kane and Rouse, 1995). Both college and community college graduates earn higher salaries and have lower unemploy-ment rates than those who do not have college degrees (Dadgar and Weiss, 2012). Moreover, those who attend college, regardless of degree receipt, report higher rates of job satisfaction, greater promotion opportunities, increased work responsibilities, and improved work perfor-mance (Hoachlander, Sikora, and Horn, 2003). Studies seeking to quantify the economic returns to postsecondary education have found mixed results regarding whether it is the degree itself that makes a difference or if credits alone can improve earnings. Some research has found that students who enroll in college but who do not receive a degree realize a significant bump in earnings. One study found as much as a 5 percent increase in salary for each year of credits earned (30 credits) and no statistically significant difference between outcomes for students who obtain a credential and students who complete the same number of credits without receiving a degree (Kane and Rouse, 1995). Other research has found that acquiring a degree produces significantly higher wage outcomes than earning credits alone: while each additional semester or year of credits earned leads to a statistically significant increase in wages, acquiring a degree makes a much larger impact (Dadgar and Weiss, 2012; Jepsen, Troske, and Coomes, 2009).
While increased education appears to lead to better economic outcomes — and en-rollment in community colleges has increased over the last half century — persistence and

2
completion rates leave much room for improvement. Among students entering public two-year colleges, fewer than half earn a credential or transfer to a four-year institution within six years of their initial enrollment (Radford, Berkner, Wheeless, and Shepherd, 2010). Moreover, many community college students interrupt their studies or drop out long before graduation day, losing out on the full complement of higher earnings and employment outcomes associated with higher education.
One factor contributing to these low success rates is the fact that many students arrive on campus only to find that they are required to take noncredit courses, called “developmental” or “remedial” education courses, before enrolling in college-level courses (Duke and Strawn, 2008). One estimate of the prevalence of students who are required to complete developmental coursework suggests that among those whose first institution attended was a community college, around 60 percent took a remedial course at a postsecondary institution (Adelman, 2004; Bailey, Jeong, and Cho, 2009). Unsurprisingly, rates of degree or certificate attainment among students who need developmental education are even lower than those of the general student population (Attewell, Lavin, Domina, and Levey, 2006). Students in need of develop-mental education are not just failing to earn a credential — the majority never complete the developmental course sequence to which they are referred (Bailey, Jeong, and Cho, 2009). One popular strategy aimed at addressing the high dropout rate — among both those referred to developmental courses and those enrolled in standard college-level courses — is called “learn-ing communities.”
3
Learning Communities
Although definitions of learning communities vary, there is widespread agreement about their core elements. Learning communities involve the co-enrollment of a cohort of students into two or more courses. Typically, the curricula of these courses are linked or integrated, sometimes around a theme. For example, a learning community centered around and titled “Poverty and Inequality” might link a developmental English course to a college-level sociology course. The integrated curriculum of learning communities might require that students learn various ele-ments of essay writing and argumentative rhetoric in their English course, and then use those techniques to write a paper in their sociology course exploring the relationship between income status and race. Learning communities tend to involve faculty collaboration, which enables teachers to communicate about their shared students and to integrate the curriculum across courses. Some learning communities also include a pedagogical component, which usually focuses on “active engagement,” “active pedagogy,” and/or “collaborative learning.” Finally, some learning communities include additional student support services, like enhanced counsel-ing or tutoring (Richburg-Hayes, Visher, and Bloom, 2008; Smith, MacGregor, Matthews, and Gabelnick, 2004).
In practice, learning communities vary from extremely basic (for example, co-enrollment of students in two or more classes) to multifaceted (for instance, co-enrollment, use of a tightly integrated curriculum with joint assignments and assessments, extensive faculty collaboration, and group tutoring). Some form of learning communities can be found at an estimated 400 to 500 colleges and universities throughout the United States (Smith, 2001; Smith, MacGregor, Matthews, and Gabelnick, 2004). A national study reported that, in com-munity colleges in particular, around half of 288 surveyed institutions operated at least one learning community (Center for Community College Student Engagement, 2012).
Why Learning Communities Are Expected to Work Learning communities at community colleges have the potential to improve student outcomes through several mechanisms. Tinto’s classic theoretical framework, which was created to examine dropout from higher education, posits:
[I]t is the person’s normative and structural integration into the academic and social systems that lead to new levels of commitment. Other things being equal, the higher the degree of integration of the individual into the college systems, the greater will be his commitment to the specific institution and to the goal of college completion. (Tinto, 1975, p. 96)

4
This is especially true at community colleges, which are attended largely by commuter students who often must contend with the competing demands of work, family obligations, and school (Brock, LeBlanc, and MacGregor, 2005; Minkler, 2002). Consequently, the only time many students are on campus is when they attend class, limiting opportunities for integration to those that can take place in the classroom.
In learning communities, students are co-enrolled in two or more courses in order to foster stronger connections with their fellow students (Smith, MacGregor, Matthews, and Gabelnick, 2004). Sustained academic relationships between students and faculty help to encourage integration with a community of peers and college life, leading to a greater level of commitment. In addition, integrating course materials may help students understand associa-tions among disciplines and between what they are learning in school and their personal lives, thereby engaging them more deeply in learning. Curricular integration may be particularly effective when developmental and college-level courses are paired in a learning community, as this allows students to use the basic skills they are acquiring in their developmental classes in their college-level coursework. Broadly speaking, learning communities are hypothesized to increase students’ likelihood of persisting in school and to improve their academic attainment.
Evidence of the Effectiveness of Learning Communities Over the last two decades, a number of researchers have argued that learning communities positively affect students. Among the first of the studies published in a peer-reviewed journal was a paper by Tinto and Russo (1994), which found that students who participated in a learning community reported increased involvement in academic and social activities, had more positive views of college, and were more likely to continue on to the following semester.
Subsequent to Tinto and Russo’s findings, multiple researchers who were studying a va-riety of learning communities supported the finding that these communities positively affect student engagement, retention, and academic progress (Engstrom and Tinto, 2008; Goldberg and Finkelstein, 2002; Gordon, Young, and Kalianov, 2001; Stassen, 2003; Taylor, Moore, MacGregor, and Lindblad, 2003; Tinto, 1997, 1998; Zhao and Kuh, 2004). These results appeared quite promising; however, the studies all had major limitations with respect to their designs’ ability to make causal claims about the effectiveness of learning communities. A key limitation in all but one of these studies is the use of observational designs. Comparisons were made between students enrolled in learning communities and those who were not, sometimes attempting to statistically control for a limited set of background characteristics. With respect to establishing the causal effect of learning communities, the designs of the past studies were limited, and none reported conducting sensitivity checks to establish the robustness of their findings in regard to selection bias or other assumptions. This paper is not the first to note the
5
limitations of this research; many of the studies’ authors have acknowledged these boundaries. For example, Stassen (2003, p. 587) notes:
[I]t is possible that students who are most motivated to succeed take ad-vantage of the [learning communities’] opportunities and, as a result, reten-tion and academic performance rates for [learning communities] are better because of individual student selection — not the program components themselves.
To the authors’ knowledge, the first study that was not subject to selection bias was a random assignment evaluation of learning communities conducted by Goldberg and Finkelstein (2002). This study, however, had other limitations. Sixteen full-time Electronic Technician Certificate students were randomly assigned to a team-taught learning community and nine to individually taught, unlinked classes. The study found positive effects on students’ perceptions of academic and social integration, but it did not find significant effects on academic outcomes such as grade point averages and persistence to the second semester. This could be a result of lack of program effects, but it could also easily stem from the lack of statistical power to detect meaningful effects with such a small sample size.
To fill this gap in the research, in 2003 MDRC launched a random assignment study to evaluate the effectiveness of the Opening Doors Learning Communities program at Kings-borough Community College (KCC), which is part of the City University of New York. A sample of more than 1,500 students were randomly assigned to either a program group, which had the opportunity to participate in the Opening Doors program, or to a control group, which could enroll in the college’s usual unlinked courses. During their first semester, freshmen in KCC’s Learning Communities program were placed into groups of up to 25 students that took 3 classes together: an English course (either college-level or developmental), an academic course required for the student’s major, and a 1-credit freshman orientation course. KCC also provided learning community students with enhanced counseling and tutoring services, as well as textbook vouchers, leading to a robust learning community model.
An MDRC evaluation of KCC’s Opening Doors Learning Communities program yielded promising early results on full-time enrollment, credits attempted, and credits earned (Richburg-Hayes, Visher, and Bloom, 2008). Through the National Center for Postsecondary Research, MDRC launched another demonstration to evaluate the effects of these communities on students (primarily those in need of developmental education) at six community colleges. In randomized controlled trials of these programs, MDRC found that on average the learning communities that were studied — which varied in focus, curricular integration, and student support — had a small positive effect on students’ progress in the targeted subject and a small positive effect on total credit accumulation (Visher and Teres, 2011; Visher et al., 2012).

6
The KCC Opening Doors Learning Communities evaluation represents one of the first large-scale, random assignment studies in higher education. The experiment tracks students for a long period — seven years at the time of writing — and analyzes program effects on academ-ic outcomes such as graduation. In addition to these effects, this paper provides a look at experimental estimates of the effects of a community college intervention on employment and earnings outcomes. Consequently, we are able to offer some lessons to the field on trying to detect the effects of higher education interventions on economic outcomes.

7
The Kingsborough Learning Communities Evaluation
This evaluation uses a random assignment research design to estimate the effects of Kings-borough Community College’s (KCC) Opening Doors Learning Communities program compared with the college’s regular classes and services. This section describes how students became part of the research sample and how the program was implemented at KCC, a large urban university in Brooklyn, New York. It also presents some characteristics of the sample members and discusses the data sources used in this article. More detailed information can be found in Scrivener et al. (2008).1
Eligibility Criteria In order for students to be eligible to participate in the Opening Doors Learning Communities program, they had to meet the following eligibility criteria: (1) they were first-time incoming freshmen who planned to attend college full time during the day, (2) they did not test into English as a Second-Language (ESL) — that is, they tested into either developmental English or college-level English,2 and (3) they were between the ages of 17 and 34.3
Recruitment and Random Assignment Potential study participants were identified during the weeks before the start of each semester. Scores on the reading and writing tests determined most students’ English placements. Appli-cants whose scores placed them in a developmental English course or in freshman English were invited to come to campus to register early for classes.4
Students who came in to register received a brief, general description of the Opening Doors Learning Communities program at KCC, and were told that a random process would be
1The majority of information presented in this section is adapted from Scrivener et al. (2008). 2Students whose scores placed them in ESL were not included in KCC’s Opening Doors study, as they
were eligible for the college’s ESL learning communities program. 3During the first semester of program operations, KCC’s Opening Doors Learning Communities pro-
gram was open only to students between ages 18 and 34 who reported household income below 250 percent of the federal poverty level. In subsequent semesters, the income criterion was removed, having been deemed unnecessary because such a large proportion of KCC students are from low- or moderate-income families and 17-year-olds were admitted to the program with parental consent. Age limits were implemented by funder request.
4Most KCC freshmen applied and took the CUNY skills assessment tests so close to the start of the se-mester that they were unable to attend an early-registration appointment. Consequently, the majority of the sample entered the study during four or five large registration sessions held during the few weeks before each semester began.

8
used to determine which study participants would be placed in the program. Students who agreed to participate in the study signed an informed consent form, completed the Baseline Information Form (BIF) to provide some baseline demographic information, and were random-ly assigned by MDRC to either the program group or the control group. Participants also received appropriate assistance registering for classes.5
Students were brought into the research sample in four different groups, or cohorts, be-fore the beginning of four semesters: fall 2003, spring 2004, fall 2004, and spring 2005. A total of 1,534 students were randomly assigned at KCC (769 program students, 765 controls) took part in the study.
Data Sources The analyses of the learning communities program presented in this paper rely on several data sources, described below. All data were provided for both program group and control group members.
Baseline Data
As mentioned above, just before students were randomly assigned to the study groups, they completed the BIF to obtain demographic and other background information. Baseline data are used in this paper to describe the sample, for subgroup analyses, and as covariates in sensitivity analyses.
CUNY Transcript Data
KCC provided MDRC with transcript data from the City University of New York (CUNY) Institutional Research Database. These data include information on courses taken, such as course name, credits, and grades, as well as degrees earned from all CUNY institutions. The analyses for this report include data collected through the fall 2011 semester, which represents seven years of follow up for the full sample. The transcript data are used to estimate the program’s effect on academic outcomes.
5Students who came to a random assignment appointment and who were placed in the control group were
— like the program group students — allowed to register for classes earlier than most KCC freshmen, as it was deemed unethical and impractical to bring students to campus and then not allow them to register for classes. In addition, it was not the intent of the study to determine the effects of early registration, so this gave both groups a similar experience with respect to early registration.

9
National Student Clearinghouse Data
The National Student Clearinghouse (NSC), a nonprofit organization, collects and dis-tributes enrollment, degree, and certificate data from over 3,500 colleges that enroll more than 98 percent of the nation’s college students.6 These data are used to provide enrollment and graduation information for students in the study who attended a postsecondary institution outside the CUNY system. The NSC data are available for the seven-year follow-up period and are used to estimate the program’s effects on enrollment and degree attainment.
New York State Department of Labor Unemployment Insurance Data
The New York State Department of Labor (DOL) provided MDRC with individual-level employment records and aggregate earnings data by research group and subgroup for our sample for the period 2001 to 2012. These data are used to explore the program’s effects on economic outcomes.
CUNY Skills Assessment Test Score Data
Students are required to take the CUNY reading, writing, and math skills assessment tests before they begin classes at KCC. MDRC collected test score data for all sample members who took the tests at KCC or at any other institution in the CUNY system. In this paper, baseline placement test score data are used to make statistical adjustments in the sensitivity analysis and to define subgroups of sample members for moderator analysis.
Characteristics of the Sample Table 1 shows a selection of characteristics of the study sample members at KCC obtained from the baseline questionnaire, the CUNY placement test, and DOL data. The table shows the characteristics for the full sample by research group — that is, the program group and control group. Just over half of the full sample comprises women. The full sample is racially and ethnically diverse: 38 percent identified themselves as black (non-Hispanic); 27 percent, as white (non-Hispanic); and 20 percent, as Hispanic. A total of 45 percent were either 17 or 18 years of age, and only 21 percent were age 21 or older. Over two-thirds of these students had a high school diploma, making this sample more “traditional” than the national average for community college students (Adelman, 2005). Almost half reported speaking a language other than English at home. Finally, on average, study participants were employed in just over half of the quarters during the year prior to the evaluation study.
6National Student Clearinghouse (2013).

10
Program ControlCharacteristic Group Group Difference P-value
Gender (%)Female 57.7 51.4 6.4 0.012
Race/ethnicity (%)a 0.307Hispanic/Latino 21.2 19.6 1.5Black, non-Hispanic 38.1 37.2 0.9White, non-Hispanic 24.6 29.3 -4.7Asian or Pacific Islander 9.4 7.8 1.5Other 6.8 6.0 0.7
Age (%) 0.12717-18 years old 44.9 44.1 0.819-20 years old 35.8 32.6 3.221-34 years old 19.3 23.3 -4.0
Diplomas/degrees earned (%)b
High school diploma 72.9 68.9 4.1 0.079General Educational Development certificate 25.8 31.4 -5.7 0.014Occupational/technical certificate 2.1 2.0 0.1 0.868
First person in family to attend college (%) 34.9 31.9 3.1 0.208
Language other than English spoken regularly in home (%) 48.6 45.2 3.4 0.179
English skills assessment (%) 0.819Passed both English tests at baseline 29.3 28.8 0.5Failed one English test at baseline 45.1 46.7 -1.5Failed both English tests at baseline 25.6 24.6 1.0
Employment in year prior to random assignmentc
Ever employed (%) 52.4 55.6 -3.2 0.214Number of quarters employed 1.35 1.49 -0.14 0.080
Quarterly earnings prior to RA ($)Two quarters prior to RA 740 881 -141 0.083One quarter prior to RA 850 1031 -181 0.048
Sample size (total = 1,534) 769 765
Selected Characteristics of Sample Members at Baseline
The Opening Doors Demonstration
Table 1
SOURCE: MDRC calculations using Baseline Information Form data, New York State Department of Labor data, and CUNY skills assessment test data.
NOTES: Distributions may not add to 100 percent because of rounding. Missing values are not included in individual variable distributions.
Either a chi-square test or a two-tailed t-test was applied to differences between research groups.aRespondents who indicated that they are Hispanic and who also chose a race are included only in the
Hispanic/Latino category. bDistributions do not add to 100 percent because categories are not mutually exclusive.cThese values include data from the 4 quarters prior to the quarter in which students were randomly assigned.

11
Before enrolling at KCC, students took two of the CUNY assessment tests (one Eng-lish, one reading) that were used to determine their placement into either college-level English or one of several developmental English courses. Students who passed both tests were placed in college-level English, students who passed only one test were placed into the highest level of developmental English, and students who failed both tests were placed into a lower level of developmental English. A plurality of students passed one of the tests, placing into the highest level of developmental English (46 percent). The rest of the sample is about evenly split between students who passed neither test and students who passed both tests.
Some statistically significant differences between research groups were found at base-line. There were more females and slightly lower rates of employment before random assign-ment to the program group.7 While some of these baseline differences relate to factors that may correlate with the outcomes, there is no reason to believe that random assignment was compro-mised or that our effect estimator is biased. (MDRC controlled the random assignment process.) At the same time, sensitivity analyses were conducted to explore the effect on impacts and standard errors when regression adjustment was made based on several covariates that prior research has found to be correlated with academic success.8
Program Implementation As discussed above, the Opening Doors Learning Communities staff recruited and randomly assigned 1,534 students to either the program or control group over four semesters (fall 2003 through spring 2005). During this period, KCC ran 40 learning communities for the study: 31 with developmental English and 9 with college-level English.
The key structural feature of the program (co-enrollment in three courses) operated as intended, with only minor problems, throughout the study period. The overwhelming majority of students in the program group enrolled in linked classes (85.3 percent). Tutors and case managers with relatively small caseloads were assigned to each learning community, and
7The research sample, which consists of students who met program eligibility criteria and agreed to partic-ipate, may not be representative of the broader KCC student body or the eligible population at KCC. For example, according to 2003 fall cohort data collected by the Integrated Postsecondary Education Data System, or IPEDS, males are slightly overrepresented in the research sample (45.4 percent of the sample versus 40.7 percent of the student body); see http://nces.ed.gov/ipeds. There is a smaller range of ages in the research sample than in the student body because of the eligibility criteria. The research sample also has a higher proportion of black and Hispanic students than the student body (58.1 percent of the sample versus 48.7 percent of the student body). In addition, the research sample may look different from the student body on unobservable characteristics.
8These were “risk characteristics associated with students’ likelihood of leaving postsecondary education without attaining a credential,” as described by Horn, Berger, and Carroll (2004). Further information on our proxies of these variables can be found in the sensitivity analysis section.

12
textbook vouchers were distributed as planned.9 Although all of the learning communities had the same basic structure, there was variation in content, class size,10 and the degree to which faculty worked together and integrated their courses. Thus, the study provides a strong test of the structural features of the learning community, but it may not fully detect the effects of tightly integrating course curricula.
In addition to the question of implementation, it is important to understand how the program differed from the college’s usual services. The contrast is clearest with respect to course assignments and scheduling. Opening Doors Learning Communities students took three linked courses that were scheduled in a block, and all of them took an English course and the freshman orientation class. Control group students took whatever courses were available and were not required to take English or the freshman orientation.
A typical full-time course load at KCC is based on 12 credits (12 hours of class per week). Because the lower-level developmental English courses meet for eight hours each week, the content courses are typically three credits, and the freshman orientation class is one credit, students in the lower-level English courses usually took no additional unlinked courses. In contrast, students in higher-level English courses, which meet for fewer hours per week, usually took at least one course not offered by the Opening Doors program.11
9For a detailed discussion of the implementation research conducted for this program, see Scrivener et al.
(2008). 10Because there were challenges in managing registration and predicting how many students would test
into each level of English, class size varied from 6 to 25 students, with an average of around 17. 11This is an important context for the placement-level subgroup analysis presented in the next section.

13
Estimation and Results
The main analyses presented here are intent-to-treat (ITT): they compare the outcomes of all program group students with all control group students, regardless of compliance with treatment assignment. The estimand — the parameter being estimated — is the effect of being offered the opportunity to participate in learning communities. This is not necessarily the same as the effect of experiencing a learning community, since 15 percent of program group members did not fully participate in a learning community.12 The ITT estimand reflects the effect of offering learning communities in a real-world school-based setting, where compliance is imperfect.13
The Impact Model Equation 1 describes the model used to estimate the average effect of this offer on student outcomes:
𝑌𝑖 = 𝛼 + 𝛽𝑇𝑖 + 𝑪𝒐𝒉𝒊𝜹 + 𝑿𝒊𝜸 + 𝜀𝑖 (1)
Here, 𝑌𝑖 is the outcome of interest (for example, credits earned) for student i; 𝑇𝑖 is a treatment indicator for student i; 𝑪𝒐𝒉𝒊 is a vector of dummy indicators representing a student’s random assignment cohort; and 𝑿𝒊 is a vector of baseline characteristics for student i.14
12Seven percent of program group members did not enroll at all during the program semester. An addi-
tional 8 percent enrolled, but were not co-enrolled in learning communities courses as of the college’s add/drop deadline. Nine percent of control group members did not enroll at all during the program semester. Less than 1 percent of controls “crossed over,” meaning they enrolled in a learning community. In previous analyses of the two-year effects of KCC’s Learning Communities program on the same sample presented here, Richburg-Hayes, Visher, and Bloom (2008) used instrumental variables (IVs) to estimate the local average treatment effect (LATE) and observed that “the IV estimates were similar in magnitude and direction to the [ITT] estimates.”
13One alternative would be to use IV to estimate LATE, as in Richburg-Hayes, Visher, and Bloom (2008). Such analyses are based on the assumption that the treatment has no effect on students who were assigned to the program but did not experience it, referred to as “no shows” or “never takers” (Angrist, Imbens, and Rubin, 1996; Bloom, 1984). In this study, this assumption may not hold because program participation is defined several weeks into the semester at a point when the program may already have affected students’ outcomes. Moreover, our best measure of program participation is defined as co-enrolling in learning community classes; however, the intervention includes services that may have been received by students who did not co-enroll (for example, textbook voucher, counseling). In other words, the “exclusion restriction” may not hold, so the analyses rely on assumptions that may be violated.
14In cases where the value of one or more baseline characteristics could not be conclusively determined due to missing student data, values were imputed to the pooled sample mean. A separate set of “missing” dummy indicators was created when a baseline variable was missing. In addition to the baseline characteristics themselves, these missing dummy indicators were also included as covariates in the sensitivity analyses.

14
The coefficient of interest is 𝛽, which represents the causal effect of the offer to partici-pate in the program. The study sample comprises four subsequent cohorts of students (fall 2003, spring 2004, fall 2004, and spring 2005); cohort dummies are included in the impact model to reflect the different points in time during which students entered the study. The vector of client characteristics (𝑿𝒊) is not included in the main impact analyses but is included in sensitivity analyses.15 Large-scale randomization greatly increases the likelihood that the characteristics (both observable and unobservable) of treatment and control group members are similar at the outset of the study, and ensures that there are not systematic differences between research groups. Thus, student-level covariates are not necessary to obtain an unbiased impact estimate.
Sensitivity analyses were conducted using selected baseline characteristics of the im-pact model that prior research has found to correlate with academic outcomes (Horn, Berger, and Carroll , 2004). The indicators used as covariates in the sensitivity analysis were (1) delayed postsecondary enrollment,16 (2) financial independence,17 (3) employment in any of four quarters before the quarter of random assignment, (4) parental responsibility for one or more children, (5) parental/unmarried status, and (6) failure to complete twelfth grade or to receive a high school diploma. English and math placement test scores were also used as covariates in the sensitivity analysis. Researchers often include in their impact model covariates that are correlat-ed with the outcome of interest in order to improve the precision of the effect estimate (Bloom, Richburg-Hayes, and Black, 2007). The greater the correlation between such covariates and the outcomes of interest, the greater the precision gains. Researchers also sometimes include covariates in their impact model to account for observed baseline imbalances; however, there is disagreement about how to do this and even whether it is appropriate in a randomized experi-ment (Schelchter and Forsythe, 1985).
Sensitivity analyses were conducted for two reasons. First, they were done to help ex-plain the gains in precision that result from including covariates in higher education research, where there is less historical guidance (relative to kindergarten through twelfth grade) on their realized benefits. Second, as noted earlier, there is evidence of baseline differences in the characteristics of program and control group members despite randomization. Selecting covari-ates strictly on the basis of observed pretreatment assignment differences can yield incorrect
15The decision of whether the main analyses would include 𝑿𝒊 was made before examining the results of
the impact model to reduce any potential researcher bias. 16Following Horn, Berger, and Carroll (2004), students were considered to have delayed postsecondary
enrollment if they graduated from high school and enrolled at college in different calendar years. An exception was made for 27 students who graduated from high school between August and November and who enrolled in college in January through March of the following year. These students were not treated as having delayed postsecondary enrollment.
17Financial independence was defined as being age 24 or older as of random assignment, being married, and/or having children.

15
confidence levels (Schelchter and Forsythe, 1985). Nonetheless, we are interested in the robustness of our results in relation to a model that includes covariates that, based on prior evidence, are related to higher education outcomes. Some of these outcomes were observed to differ across research groups at the outset of the study, while others were not.
In the main analyses, the error term, 𝜀𝑖, is modeled using cluster-robust standard errors to account for the potential lack of independence caused by shared experiences (for example, teacher effects) in clusters of learning communities. (For more details and an explanation of the model, see Weiss, Visher, and Weissman 2012.)18 Additional analyses were conducted using ordinary least squares (OLS) as a sensitivity check.19
Program Effects The program’s effects on two outcome types — academic and employment — are examined. With respect to academic outcomes, confirmatory (or primary) outcomes include students’ (1) progress toward a degree as measured by total credits earned at any CUNY college, and (2) completion of a degree as determined by whether students earned any type of degree at any institution included in the NSC (2013) database. With respect to employment and earnings, confirmatory outcomes are (1) employment, and (2) earnings in New York State.20
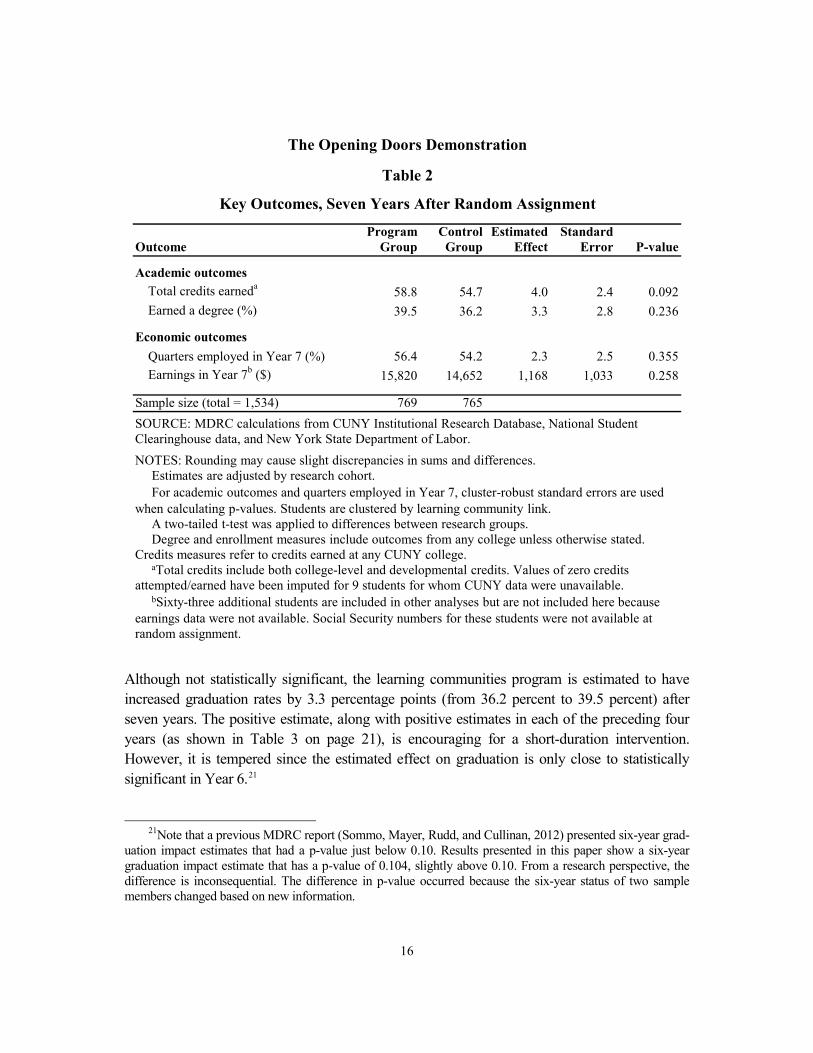
Table 2 summarizes the main findings seven years after students entered the study (de-tailed results are presented in the following sections). With respect to academic progress, KCC’s single-semester learning communities program increased credit accumulation by an estimated 4.0 credits (7.5 percent) over seven years (p = 0.09).
18Recent research on this topic suggests that cluster-robust standard errors can be upward biased in indi-vidually randomized group treatment trials such as this one. This occurs because students were nonrandomly sorted into learning communities after random assignment, resulting in the appearance of dependency of observations within clusters, which need not be accounted for in the analyses since it is artificial (Weiss, McCaffrey, and Lockwood, 2013).
19It is reasonable to use OLS with this study design if the desired inference is with respect to the effect of the specific learning communities observed in this study (taught by the specific instructors observed in the study), rather than to a hypothetical “superpopulation” of learning communities from which these particular learning communities could have been randomly drawn (Siemer and Joorman, 2003b). Technically, Siemer and Joorman (2003b) recommend a constrained fixed-effect model that will often produce standard errors that are smaller in magnitude than those yielded by OLS. However, recent work on this topic by Weiss, McCaffrey, and Lockwood (2013) suggests that the constrained fixed-effects approach can produce standard errors that are downward biased (owing to the nonrandom sorting of students into clusters). Thus, OLS may be a reasonable alternative for those interested in the fixed-effects inference.
20In addition to the four outcomes described here, many other outcomes of interest were explored, some of which are described below. In order to reduce the multiple-hypothesis testing problem (Schochet, 2008), two outcomes were prespecified in each outcome domain (academics and employment).
16
Although not statistically significant, the learning communities program is estimated to have increased graduation rates by 3.3 percentage points (from 36.2 percent to 39.5 percent) after seven years. The positive estimate, along with positive estimates in each of the preceding four years (as shown in Table 3 on page 21), is encouraging for a short-duration intervention. However, it is tempered since the estimated effect on graduation is only close to statistically significant in Year 6.21
21Note that a previous MDRC report (Sommo, Mayer, Rudd, and Cullinan, 2012) presented six-year grad-
uation impact estimates that had a p-value just below 0.10. Results presented in this paper show a six-year graduation impact estimate that has a p-value of 0.104, slightly above 0.10. From a research perspective, the difference is inconsequential. The difference in p-value occurred because the six-year status of two sample members changed based on new information.
Program Control Estimated StandardOutcome Group Group Effect Error P-value
Academic outcomesTotal credits earneda 58.8 54.7 4.0 2.4 0.092Earned a degree (%) 39.5 36.2 3.3 2.8 0.236
Economic outcomesQuarters employed in Year 7 (%) 56.4 54.2 2.3 2.5 0.355Earnings in Year 7b ($) 15,820 14,652 1,168 1,033 0.258
Sample size (total = 1,534) 769 765
Key Outcomes, Seven Years After Random Assignment
The Opening Doors Demonstration
Table 2
SOURCE: MDRC calculations from CUNY Institutional Research Database, National Student Clearinghouse data, and New York State Department of Labor.NOTES: Rounding may cause slight discrepancies in sums and differences.
Estimates are adjusted by research cohort. For academic outcomes and quarters employed in Year 7, cluster-robust standard errors are used
when calculating p-values. Students are clustered by learning community link.A two-tailed t-test was applied to differences between research groups. Degree and enrollment measures include outcomes from any college unless otherwise stated.
Credits measures refer to credits earned at any CUNY college.aTotal credits include both college-level and developmental credits. Values of zero credits
attempted/earned have been imputed for 9 students for whom CUNY data were unavailable.bSixty-three additional students are included in other analyses but are not included here because
earnings data were not available. Social Security numbers for these students were not available at random assignment.

17
With respect to employment and earnings, during the seventh year after students were randomly assigned to either the program group or the control group, there was no discernible effect on economic outcomes. It is important to note that this study was not designed to be adequately powered to detect effects on employment and earnings. At the same time, as one of the largest-scale experiments in higher education history, it provides a unique opportunity to reflect on the possibility of connecting higher education interventions to effects on employment and earnings. In the concluding section of this paper, insights into the possibility of making such connections are offered, grounded in what has been learned from this real-world experiment. We now turn to details regarding the impact findings.
Academic Outcomes
Persistence
Although the confirmatory academic outcomes are credit accumulation and degree re-ceipt, we first examine the program’s estimated effect on persistence (as measured by enroll-ment rates), a key hypothesized mediator of the program’s effect on academic success. One aspect of the theory of change in learning communities is that co-enrollment fosters stronger connections among students, as well as between students and faculty members. These connec-tions increase the likelihood of students persisting, thereby improving future academic out-comes like credit accumulation. Figure 1 plots enrollment rates at any CUNY college over seven years.22 Each year comprises two semesters (fall and spring). Each semester is composed of two sessions that we refer to as the main session (12 weeks) and the intersession (6 weeks).23 Notably, the bulk of the learning communities experience took place during the main session of the first semester, which we refer to as the program semester.
The first striking feature of Figure 1 is that during 8 of 28 sessions the program’s esti-mated effects on enrollment rates are statistically significant, as indicated by asterisk(s) above the program and control group bars. For example, during the main session of the fourth semes-ter, 57.1 percent of program group members enrolled compared with 51.2 percent of control group members. The difference, 5.9 percentage points, represents the estimated effect on enrollment rates and is statistically significant (p = 0.02).
22NSC data enable us to examine colleges beyond CUNY. However, in this section, the focus is on CUNY
colleges because it allows us to break apart enrollment during the main sessions (fall and spring) and the intersessions (winter and summer).
23KCC calls the main sessions Session A and the intersessions Session B. Many colleges refer to the main sessions as fall and spring and the intersessions as winter and summer.

18
The Opening Doors Demonstration
Figure 1
CUNY Enrollment in Main Sessions and Intersessions
SOURCE: MDRC calculations from CUNY Institutional Research Database (IRDB).
NOTES: Estimates are adjusted by research cohort. Cluster-robust standard errors are used when calculating p-values – students are clustered by learning community link.
A two-tailed t-test was applied to impact estimates. Statistical significance levels are indicated as: *** = 1 percent; ** = 5 percent; * = 10 percent.
**
*
***
**
**
** ***
0
10
20
30
40
50
60
70
80
90
100M
ain
Inte
r
Mai
n
Inte
r
Mai
n
Inte
r
Mai
n
Inte
r
Mai
n
Inte
r
Mai
n
Inte
r
Mai
n
Inte
r
Mai
n
Inte
r
Mai
n
Inte
r
Mai
n
Inte
r
Mai
n
Inte
r
Mai
n
Inte
r
Mai
n
Inte
r
Mai
n
Inte
r
Sem1 Sem2 Sem3 Sem4 Sem5 Sem6 Sem7 Sem8 Sem9 Sem10 Sem11 Sem12 Sem13 Sem14
Year 1 Year 2 Year 3 Year 4 Year 5 Year 6 Year 7
Perc
enta
ge e
nrol
led
Program group Control group

19
Equally noteworthy is the program’s effects on enrollment rates during intersessions — the 6-week winter and summer sessions that are included in students’ tuition at KCC but that are attended by a lower proportion of students than the 12-week fall and spring main sessions. During six of the first nine semesters, the program’s estimated effect on intersession enrollment is statistically significant. Importantly, some components of the learning communities program, such as enhanced counseling and the use of textbook vouchers, were available for the first full semester, including the intersession. Coupled with advice and encouragement from the program case managers to attend intersessions, it is possible that these services enticed more program group students to enroll in intersessions and to continue to make use of them in subsequent postprogram semesters.
When considering Figure 1, it is important to note that in later semesters the examina-tion of program effects on enrollment rates alone can be misleading. Many students are ex-pected to graduate and thus no longer be enrolled. (Graduation effects are examined separately in an upcoming section.) In addition, in order to highlight the intersession findings, Figure 1 considers enrollment at CUNY colleges only, using CUNY’s database. Enrollment at any college included in the NSC (2013) database was also examined by semester (these data do not allow a clean breakdown by sessions). During the first two years after random assignment, enrollment rates outside of CUNY were low (under 5 percent), making enrollment in CUNY colleges (that is, what is shown in Figure 1) similar to enrollment at any college. However, during the third through seventh years, enrollment rates at any college were between 5 and 11 percentage points higher than enrollment at CUNY colleges alone. This increase is important to consider when examining the magnitude of enrollment rates over time, since Figure 1 un-derrepresents enrollment at any college. Importantly, program and control group differences in enrollment rates generally were not affected by enrollment outside of CUNY (where they could be estimated). Therefore, the estimated program effects shown in Figure 1 are likely about the same as they would be if the same results were examined at any college.
Since enrollment rates at the end of the seven-year follow-up provide some indication of what is to come, it is noteworthy that during the final study semester, 22 percent of program group students were enrolled at any college compared with 24 percent of control group students — or under one-fourth of the study sample (not shown in Figure 1). We will return to this finding later when considering the long-term effects of learning communities on degree completion.

20
Credit Accumulation
Table 3 provides information on cumulative total credits attempted and earned at CUNY colleges from Year 1 to Year 7.24 The learning communities program operated during the first semester of Year 1. During that year, students randomly assigned to the program attempted 1.4 more credits (p = 0.024)) and earned 2.1 more credits (p = 0.002) than their control group counterparts. The estimated effect on credits earned in Year 1 represents an 11 percent increase over the control group average of 18.2 credits. The effect on credits earned was evenly split between developmental credits and college-level credits (not shown in Table 3).
The estimated effect on credits earned (2.1 credits) in Year 1 is attributable to two fac-tors. First, on average, program group members attempted more credits than their control group counterparts. Second, program group members earned a greater proportion of the credits they attempted than did control group members (71.6 percent compared with 67.7 percent).25
After the first year, the magnitude of the estimated effect on total credits earned in-creased, leveling out at 4.0 credits seven years after random assignment (p = 0.092).26 At this time, program group members earned an average of 58.8 credits; control group members, 54.7 credits. This difference represents a 7 percent increase in credits earned. To put the magnitude of this effect in perspective, most college classes are worth three or four credits, and most associate’s degrees require a minimum of 60 college-level credits to graduate. Therefore, on average, the estimated effect represents completion of an additional one to one and one-third more courses, or about one-fifteenth of the credits required to earn an associate’s degree.
After seven years, college-level credits account for a little more than three-fourths of the effect on total credits earned (not shown in Table 3).27 Tying the intersession effects on enroll-ment rates to the credit accumulation effects, one-fourth of the effect on total credits earned (that is, one credit) occurred during the winter and summer intersessions.
Degree Completion
The third panel in Table 3 provides information on degree attainment at any college at the end of Year 1 through Year 7. Given the program’s positive effect on credit accumulation through Year 7, it is plausible that the learning communities program could affect degree
24Total credits include both college-level credits (which are generally degree-applicable) and developmen-
tal credits (which do not count toward a degree). 25This percentage was calculated as 20.3/28.3 = 71.6 percent for program group members and 18.2/26.9 =
67.7 for control group members. 26The p-value increases due to increased variance in the outcome over time. 27The impact on developmental credits all occurred during the first year of the study and was maintained
(but did not grow) during subsequent years. Breakdowns are available from the authors upon request.

21
Program Control Estimated StandardOutcome Group Group Effect Error P-value
Cumulative credits attempted (at CUNY)Year 1 28.3 26.9 1.4 0.6 0.024Year 2 47.4 44.6 2.7 1.2 0.024Year 3 58.8 55.8 3.0 1.7 0.071Year 4 67.1 63.1 4.1 2.0 0.045Year 5 73.4 68.7 4.7 2.3 0.041Year 6 77.9 73.0 4.8 2.5 0.054Year 7 80.9 76.4 4.6 2.7 0.087
Cumulative credits earned (at CUNY)Year 1 20.3 18.2 2.1 0.6 0.002Year 2 33.9 31.1 2.8 1.2 0.020Year 3 42.0 39.4 2.6 1.6 0.098Year 4 48.1 44.8 3.4 1.9 0.076Year 5 52.8 49.0 3.7 2.1 0.074Year 6 56.3 52.3 4.0 2.3 0.078Year 7 58.8 54.7 4.0 2.4 0.092
Earned a degree (at any college) (%)Year 1 0.0 0.0 0.0Year 2 6.1 5.4 0.8 1.5 0.615Year 3 20.2 17.0 3.2 2.5 0.202Year 4 26.5 23.8 2.7 2.6 0.302Year 5 31.9 28.4 3.5 2.8 0.210Year 6 35.9 31.5 4.4 2.7 0.104Year 7 39.5 36.2 3.3 2.8 0.236
Highest degree earned by Year 7 (%)a
Bachelor's degree or higher 16.5 14.8 1.7 2.1 0.404Associate's degree 22.2 20.5 1.7 2.2 0.434
Sample size (total = 1,534) 769 765
The Opening Doors Demonstration
Table 3
Academic Outcomes, Years 1-7
SOURCE: MDRC calculations from CUNY Institutional Research Database and National Student Clearinghouse data.NOTES: Rounding may cause slight discrepancies in sums and differences.
Estimates are adjusted by research cohort.Cluster-robust standard errors are used when calculating p-values. Students are clustered by learning
community link.A two-tailed t-test was applied to differences between research groups. Cumulative credits include both college-level and developmental credits. Values of zero credits
attempted/earned have been imputed for 9 students for whom CUNY data were unavailable.aPercentage who earned bachelor's degree or higher and percentage who earned associate's degree do not add
up to total because the degree type of some degree earners was unknown.
22
attainment. Before delving into the program’s effects, we first consider overall patterns of degree attainment.
Following national trends, graduation rates are low for both program and control group members. Two years after entering the study, around 6 percent of all sample members earned a degree at any college. After Year 7, degree attainment rose to nearly 40 percent, implying that more than 60 percent of sample members had not yet earned a degree. Notably, in the final term of study, only 10 percent of the full sample was enrolled and had not yet earned any degree.28 This suggests that in follow-up beyond seven years, large increases in degree completion are not expected.
Although not statistically significant, the program’s estimated effect on degree attain-ment is positive from Year 2 to Year 7 after random assignment. This positive trend is encour-aging, but only in Year 6 is the estimated effect on the borderline of what many researchers treat as a threshold of statistical significance (at the end of Year 6, p = 0.104). From Year 3 to Year 7, the estimated effect hovered around the three and one-half percentage point range — an effect that, if real, some might consider a practically significant effect for a single-semester intervention. However, despite being a large, randomized experiment, this study was not powered to detect effects of this magnitude.
Economic Outcomes The previous section established the positive effect of the KCC Learning Communities program on credit accumulation. Some evidence suggests that the program may have affected graduation rates as well. We now explore whether there were also effects on labor market outcomes, since past research has connected both credit accumulation and degree attainment to economic returns. The focus is on two main labor market outcomes: employment and earnings.
Employment
Table 4 provides yearly data on the percentage of quarters in which students were em-ployed in New York State during the two years before random assignment and in the seven years after random assignment. Before random assignment, there were small differences in employment rates: the control group was slightly more likely to be employed during that time.29
28As noted earlier, over 20 percent of the full sample were still enrolled, but nearly half of those enrolled
had already earned a first degree. 29In these data, a positive correlation was found between pre-random assignment employment and future
employment. Thus, this difference appears to favor the control group. Sensitivity analyses were conducted, controlling for pre-random assignment employment status; the results were substantively the same.

23
During the seven years following random assignment, employment rates of program and control group members remained similar. During the final year of study, around 55 percent of the full sample were employed in New York State. Overall, there is no evidence that the learning communities program had a discernible effect on employment rates during the study follow-up period.
Program Control Estimated StandardOutcome Group Group Effect Error P-value
Percentage of quarters employed (%)Pre-RA Year 2 21.4 24.7 -3.3 1.8 0.062Pre-RA Year 1 33.7 37.4 -3.7 1.9 0.058Post-RA Year 1 43.5 44.5 -1.0 2.1 0.621Post-RA Year 2 51.6 51.2 0.4 2.3 0.852Post-RA Year 3 54.7 55.8 -1.1 2.3 0.640Post-RA Year 4 56.3 56.2 0.1 2.3 0.975Post-RA Year 5 56.3 53.8 2.5 2.4 0.301Post-RA Year 6 56.2 54.2 2.1 2.5 0.407Post-RA Year 7 56.4 54.2 2.3 2.5 0.355
Average earnings following RA ($)Year 1 4,060 4,611 -551 346 0.112Year 2 6,006 6,166 -160 436 0.713Year 3 8,417 8,126 291 556 0.601Year 4 10,295 10,204 91 666 0.892Year 5 12,103 11,970 134 789 0.866Year 6 13,656 12,655 1,002 893 0.262Year 7 15,820 14,652 1,168 1,037 0.260
Sample size (total = 1,471) 739 732
Economic Outcomes, Years 1-7
The Opening Doors Demonstration
Table 4
SOURCE: MDRC calculations from New York State Department of Labor data. NOTES: Rounding may cause slight discrepancies in sums and differences.
For percentage of quarters employed, estimates are adjusted by research cohort, and cluster-robust standard errors are used when calculating p-values. Students are clustered by learning community link.
For average earnings, outcomes were not adjusted for covariates, and cluster-robust standard errors were not used owing to data restrictions.
A two-tailed t-test was applied to differences between research groups. Sixty-three additional students are included in analyses of academic outcomes but are not included here because
earnings and employment data were not available. Social Security numbers for these students were not available at random assignment.
For the percentage of quarters employed, Post-RA Year 1 and Pre-RA Year 1 do not include the quarter during which students were randomly assigned. Employment data from this quarter are not shown above.
Yearly pre-RA earnings data are not available.

24
Earnings
The second panel in Table 4 provides information on average yearly earnings in New York State during the seven years after random assignment. Although not statistically signifi-cant, the program’s estimated effect on average earnings is over $1,000 during Year 6 and Year 7. The estimated effect represents an increase of around 8 percent over the control group’s base of $12,700 in Year 6 and $14,700 in Year 7. These effects are not statistically significant, meaning that if the true effect of the program was zero, there is a fairly high probability (over 0.26) that effect estimates as large as or larger than these could occur by chance. Despite its large sample size, this experiment is not sufficiently powered to detect an effect of $1,000. More details on issues of statistical power are provided in the Discussion.
Subgroup Analyses In addition to estimating the overall average effect of the opportunity to participate in KCC’s Learning Communities program, it is also of interest to know whether the program helps all eligible participants or only particular types of individuals. To limit multiple hypothesis testing, the choice of subgroups focuses on three characteristics identified by previous researchers who examined this same sample at an earlier time (Scrivener et al., 2008; Sommo, Mayer, Rudd, and Cullinan, 2012). Specifically, we examine whether program effects varied based on baseline English placement level, gender, and race.30
English placement level is examined because there is generally a relationship between students’ placement level and their likelihood of succeeding academically. (That is, it is an indicator of “risk.”) Moreover, students’ placement level indicated which learning communities were available to them, such that students at different levels experienced different implementa-tions of the program. Gender and race are explored because they are often viewed as policy-relevant subgroups, since men tend to underperform in community college and certain racial subgroups have been historically disadvantaged. As recommended by Bloom and Michalopoulos (2011), an explicit test was conducted of whether the estimated impacts varied significantly among groups. For example, was the estimated effect for men statistically distin-guishable from the estimated effect for women?
Table 5 shows the program’s estimated effects on credit accumulation, based on stu-dents’ initial English placement test level. The first panel shows the program’s effects on the least at-risk group — those who began the study “college ready” in English, having passed both
30The information presented in this section is adapted from Sommo, Mayer, Rudd, and Cullinan (2012).

25
SubgroupProgram Control Estimated Standard Difference
Outcome Group Group Effect Error P-value P-valuea
Passed both English tests at baselineCumulative credits earned
Year 1 22.6 20.1 2.5 1.0 0.018 0.399Year 2 37.7 33.8 4.0 2.0 0.049 0.427Year 3 47.1 42.4 4.7 2.5 0.062 0.352Year 4 55.0 48.5 6.6 3.0 0.031 0.190Year 5 60.6 53.5 7.1 3.4 0.040 0.171Year 6 64.2 56.9 7.3 3.7 0.051 0.160Year 7 67.0 59.7 7.2 3.9 0.066 0.202
Sample size (total = 445) 225 220
Failed one English test at baselineCumulative credits earned
Year 1 19.5 18.3 1.2 0.9 0.180Year 2 32.7 31.4 1.3 1.7 0.450Year 3 40.0 39.7 0.4 2.2 0.859Year 4 45.3 45.3 0.0 2.5 0.991Year 5 49.7 49.8 -0.1 2.8 0.961Year 6 53.1 53.4 -0.4 3.1 0.908Year 7 55.5 55.8 -0.3 3.3 0.932
Sample size (total = 704) 347 357
Failed both English tests at baselineCumulative credits earned
Year 1 19.1 15.8 3.3 1.3 0.015Year 2 31.7 27.1 4.6 2.4 0.057Year 3 39.6 35.2 4.5 3.2 0.167Year 4 45.2 39.5 5.8 3.8 0.126Year 5 49.3 42.3 7.0 4.1 0.091Year 6 52.7 44.7 8.0 4.3 0.065Year 7 55.0 46.9 8.1 4.5 0.075
Sample size (total = 385) 197 188
Cumulative Credits Earned at Any CUNY College,by English Skills Assessment at Baseline, Years 1-7
The Opening Doors Demonstration
Table 5
SOURCE: MDRC calculations from CUNY Institutional Research Database data.NOTES: Rounding may cause slight discrepancies in sums and differences.
Estimates are adjusted by research cohort. Cluster-robust standard errors are used when calculating p-values. Students are clustered by learning community
link.A two-tailed t-test was applied to differences between research groups.The H-statistic was used to calculate the Subgroup Difference P-value, as described in Greenberg, Meyer, and
Wiseman (1994).Cumulative credits include both college-level and developmental credits. Values of zero credits
attempted/earned have been imputed for 9 students for whom CUNY data were unavailable.aThe Subgroup Difference P-value is the p-value for a test of variation in program impacts across
subgroups. The null hypothesis is that the program’s effects are homogeneous across groups.

26
placement tests. The second panel focuses on students who failed one baseline English test, and the third panel centers on student who failed both baseline English tests.31
Table 5 shows that the greatest estimated increases in credit accumulation occurred for students who passed both English tests at baseline, and for those who failed both English tests. Students who passed both English tests in the program earned an average of 7.2 credits more than their counterparts in the control group, while those who failed both tests earned an average of 8.1 credits more than their counterparts in the control group. Both of these effect estimates are statistically significant below the 0.10 level. In contrast, students who failed one test earned essentially the same number of credits as their counterparts in the control group. Moreover, the pattern of these results was evident as early as the first semester following the program semester and continued throughout the follow-up period.
Table 6 shows the program’s estimated effects on degree attainment, based on students’ initial English placement level. The program appears to have had a positive effect from Year 3 to Year 7 on the least “at-risk” students — those who passed both English tests — with effect estimates on graduation ranging from 9.4 percentage points to 12.2 percentage points (all of which have p-values less than 0.10). In contrast, the estimated effects for students who failed one or two English tests at baseline (the bottom two panels) are much smaller and never statistically significant.
Evidence that the program had a different impact on the three subgroups is mixed (as indicated in Table 5 and in Table 6 by the p-values in the last column). For the three groups, the estimated difference in impacts on degrees (Table 6) is statistically significant in three out of six years (p-values below the 0.10 level from Year 4 to Year 6). For credits earned (Table 5), however, the estimated difference in impacts is not statistically significant in any year (smallest p-value is 0.16).
Together, these analyses suggest positive academic impacts for students who either passed both tests or failed both tests, and weaker evidence that the program improved outcomes for students who passed only one test. This pattern is somewhat unexpected. One possible explanation is that the variation is being driven by differences in implementation of the Opening Doors Learning Communities model. A faculty survey conducted for one cohort in the study suggests that, compared with others, there was less collaboration among faculty members who taught learning communities links to students who failed one test during that semester. A small
31Similar tables for other outcome measures are available upon request from the authors. They are not
included here to save space.

27
SubgroupProgram Control Estimated Standard Difference
Outcome Group Group Effect Error P-value P-valuea
Passed both English tests at baselineEarned a degree (%)
Year 1 0.0 0.0 0.0Year 2 13.5 8.9 4.6 3.2 0.152 0.292Year 3 32.1 21.3 10.8 4.8 0.026 0.110Year 4 40.1 28.6 11.5 4.6 0.014 0.069Year 5 46.7 34.9 11.8 4.4 0.008 0.052Year 6 50.3 38.1 12.2 4.4 0.006 0.068Year 7 53.0 43.6 9.4 4.9 0.057 0.303
Sample size (total = 445) 225 220
Failed one English test at baselineEarned a degree (%)
Year 1 0.0 0.0 0.0Year 2 4.1 5.0 -1.0 1.5 0.534Year 3 16.1 17.1 -0.9 2.9 0.742Year 4 23.3 23.8 -0.5 3.1 0.879Year 5 27.4 28.9 -1.5 3.3 0.649Year 6 32.3 32.8 -0.5 3.2 0.882Year 7 37.2 37.0 0.2 3.3 0.944
Sample size (total = 704) 347 357
Failed both English tests at baselineEarned a degree (%)
Year 1 0.0 0.0 0.0Year 2 1.5 1.6 -0.1 1.1 0.900Year 3 13.9 11.5 2.4 3.6 0.505Year 4 17.0 17.9 -0.9 4.1 0.826Year 5 23.0 19.5 3.5 4.5 0.436Year 6 26.0 21.1 4.9 5.0 0.323Year 7 28.4 26.1 2.4 5.0 0.637
Sample size (total = 385) 197 188
by English Skills Assessment at Baseline, Years 1-7Degree Earned at Any College,
Table 6
The Opening Doors Demonstration
SOURCE: MDRC calculations from CUNY Institutional Research Database and National Student Clearinghouse data.
NOTES: Rounding may cause slight discrepancies in sums and differences.Estimates are adjusted by research cohort.Cluster-robust standard errors are used when calculating p-values. Students are clustered by learning
community link.A two-tailed t-test was applied to differences between research groups. The H-statistic was used to calculate the Subgroup Difference P-value, as described in Greenberg, Meyer, and
Wiseman (1994). aThe Subgroup Difference P-value is the p-value for a test of variation in program impacts across subgroups.
The null hypothesis is that the program’s effects are homogenous across groups.

28
student survey conducted for one cohort in the study also suggests potentially different experi-ences for these students, although a much larger student survey conducted one year after random assignment does not.32 Another possible explanation is that the students who failed only one test had different characteristics compared with the other groups of students, in addition to their baseline English skills.
Ultimately, the data are too limited to provide conclusive evidence. This evaluation cannot determine whether the pattern of results in Table 5 and in Table 6 stems from differences in program implementation for the three subgroups, differences in students’ characteristics or academic preparation, chance, or other factors. Consequently, these findings suggest that future evaluations of learning communities (or related programs) should examine variation in program effects by initial skill levels to determine whether these types of findings hold in other settings.
With respect to gender and race, we do not find any evidence that the learning commu-nities program is more effective for one gender than the other (not shown in tables). There is some evidence that the program was more effective for members of a catchall “other” race category. This group comprised students who, when asked about their race/ethnicity before being randomly assigned, responded “other” (n = 72), indicated more than one race (n = 20), or identified as American Indian (n = 2). However, uncertainty around the effect estimates for this group is very high owing to its small size.
Overall, this study finds some evidence that the effects of learning communities may vary across different types of individuals. However, the findings are not consistent enough within this study, nor confirmed across other studies (Visher et al., 2012), to draw definitive conclusions from these analyses.
Sensitivity Analyses Two sets of sensitivity analyses were conducted to assess the robustness of the main findings. In the first, as described in the section on the regression model, impact analyses were conducted with and without student characteristics as covariates. These analyses are intended to assess whether the substantive findings change if covariates are included in the impact model, given the greater-than-expected baseline imbalances. These analyses also may inform future research on the potential precision gains achieved by including available covariates in higher education experiments.
Occasionally, the inclusion of covariates shifted an impact estimate’s p-value across the 0.10 threshold. With respect to credit accumulation, after including covariates, the estimated
32See Scrivener et al. (2008) for more information on these data sources.

29
effect on cumulative credits earned in Year 7 dropped from 4.0 to 3.4 credits, resulting in an increase in p-value from 0.092 to 0.117. In the opposite direction, the estimated effect on six-year graduation rates became statistically significant after including covariates — the p-value dropped from 0.104 to 0.044 due to a 19 percent decrease in the standard error of the impact estimate. (The impact estimate remained about the same.)
Including the set of “risk factor” covariates yields important precision gains with re-spect to credit accumulation and even larger gains in regard to degree completion.33 In future large-scale studies, researchers are encouraged to consider prespecifying that their main impact analyses include this set (or a similar set) of covariates when estimating program effects.
In the second sensitivity analysis, the robustness of the findings on academic outcome inference was examined with respect to the approach used to estimate the standard error of the effect estimate. This was done by using cluster-robust standard errors or by treating observa-tions as independent. Although education researchers have paid limited attention to this issue in individually randomized experiments, the topic has been debated in the field of psychotherapy without consensus (Crits-Christoph, Tu, and Gallop, 2003; Pals et al., 2008; Roberts and Roberts, 2005; Serlin, Wampold, and Levin, 2003; Siemer and Joorman, 2003a, 2003b). This model choice only affects the standard error of the effect estimate (and p-values). Moreover, in this particular evaluation, the decision affects only the six-year graduation results, which moved from a p-value just above 0.10 to one that is below 0.10.34
Overall, the sensitivity analyses do not dramatically change the interpretation of the general findings on the effectiveness of the learning communities program.
Limitations Before summarizing the findings on the effects of KCC’s Learning Communities program, a few important limitations of this research are described.
External Validity
This paper focuses on one learning communities program implemented at one commu-nity college. The randomized design offers a major improvement over past studies with respect
33The standard error of the impact estimate decreased by an average of 10.3 percent for credit accumula-tion and 18.0 percent for degree completion.
34With respect to credit accumulation, the two approaches yield nearly identical standard errors and p-values, with differences in p-values all below 0.01. With respect to graduation, the p-values using OLS are, on average, 0.07 smaller than when using cluster-robust standard errors. Substantively, this does not change the story. With respect to employment, p-values are generally slightly smaller using OLS, with the largest decrease being 0.025.

30
to internal validity. (For a definition, see Campbell and Stanley, 1963.) The program served a diverse group of students and operated 40 learning community sections. Nonetheless, inference regarding the effects of learning communities programs operating at other colleges requires major speculation. In the final section of this paper, KCC’s findings are placed in the context of six other random assignment evaluations of learning communities, providing a broader look at the effectiveness of this type of intervention.
Teacher Effects
In this study, random assignment was conducted at the student level, creating two simi-lar groups of students for future comparisons. Instructors, however, were not randomly as-signed. Thus, the selection of instructors may have influenced the estimated effects of learning communities for better, for worse, or not at all. The presented effect estimates thus represent the combined effect of learning communities and the types of instructors delivering those services, or teacher effects, whereas we are most interested in the effects of the learning communities programs alone (Weiss, 2010). To some extent, this concern is mitigated since many learning community instructors also taught stand-alone versions of these classes, sometimes to control group students. However, it is unclear how frequently control group students took classes with instructors who also taught the program group. This limitation is real and noteworthy. It is also noteworthy that this concern exists in all past evaluations of learning communities, making the elimination of student selection bias through the randomized design a major improvement over past attempts to estimate the effects of these programs.
Summary KCC’s Learning Communities program boosted students’ academic progress: those offered this one-semester program earned significantly more credits than their control group counterparts — a result that was maintained seven years after random assignment. There is some limited evidence that the program increased students’ chances of earning a degree, especially for those who began the study prepared for college-level English. There is no evidence of a discernible effect on employment or earnings. These results may not be surprising given the magnitude of the effects on academic outcomes and the limited statistical power to detect effects on employ-ment and earnings. This idea is explored in more detail in the concluding section of the paper.

31
Discussion
Community colleges provide access to higher education for millions of students, yet a large proportion do not earn a college degree. Few strategies that have been tested using random assignment have been shown to substantially increase students’ academic progress or graduation rates, and fewer still have been rigorously tested. The evaluation of the Opening Doors Learning Communities program described in this paper marks the first large-scale, randomized trial of a learning communities program, and the first large-scale randomized trial of a learning communi-ties program conducted in a community college. It is unique not only for the long follow-up period and the ability to track both academic and employment outcomes, but also because the program itself appears to have produced a long-term effect on students’ academic progress.
Other Randomized Trials of Learning Communities Programs As noted above, however, these positive impacts may not be representative of the effects of learning communities more generally. The final report on the Learning Communities Demon-stration conducted by the National Center for Postsecondary Research, which describes results from randomized trials of six programs operated at six colleges,35 suggests modest short-term impacts, on average, with KCC’s estimated impacts standing out as the largest.
Several factors distinguish the Opening Doors Learning Communities program at KCC. As mentioned, the program was particularly comprehensive, with some of the services extending into the subsequent intersession period between the standard fall and spring semes-ters. In addition, the research sample had important distinguishing characteristics. For example, the evaluation explicitly recruited students who intended to enroll in college full time and included both developmental and college-ready English students. The Opening Doors program also had unusually strong support from the college leadership. Therefore, while the KCC results are encouraging, it is not clear how easily the positive impacts could be replicated at other institutions.
Reflections on Detecting the Effects of an Educational Intervention on Earnings The employment and earnings data raise further questions. Policymakers and academics alike believe in the importance of postsecondary education for success in the labor market. This study, however, suggests that identifying the causal effect of an educational intervention on
35The six programs include the subsample of developmental education students in the evaluation described in this paper.

32
earnings may be more difficult than generally acknowledged. This study, and other research in higher education, may be underpowered to identify anything but very large effects on earnings. To illustrate, consider the minimum detectable effect (MDE) — the smallest true effect that a study is likely to detect. The MDE can be calculated as in Bloom (1995) using equation 2:36
𝑀𝐷𝐸 = 2.80 ∗ � 𝜎2
𝑇(1−𝑇)𝑛 (2)
In equation 2, n represents the total size of the study sample, and 2.80 is a multiplier for 80 percent power and a 5 percent significance level with a two-tailed hypothesis test when n > 30. T is the proportion of the sample that is randomly assigned to the treatment group, and σ is the standard deviation for a continuous outcome.
In this study, n = 1,471 (for economic outcomes), T = 0.5, and σ = $19,880 in Year 7. Thus, the MDE is around $2,900, representing a 20 percent increase over the control group’s average earnings in Year 7 ($14,652). This means that if the true average effect on earnings was $2,900, then there was an 80 percent chance that the study would find a positive effect at the 0.05 significance level. To put the size of the MDE in context, consider that Dadgar and Weiss (2012) estimate the average economic returns of earning an associate’s degree at around 6 percent.
To offer insight into the designing of college program evaluations aimed at improving economic outcomes, Table 7 presents scenarios that pose the following question: “If a college reform program offers a path to improved earnings only through degree attainment, what would the average economic returns to a degree have to be for a study to be adequately powered?”
The first row of the first panel in Table 7 parallels our study, where n is around 1,500, the MDE is around $2,874, and the estimated degree effect is 3.3 percentage points. If effects on earnings derive solely from the effects of earning a degree, then the first row shows that the required returns to a degree would need to be $87,091 in the seventh year, which constitutes a 592 percent increase over the average earnings in the control group.
The remainder of Table 7 depicts scenarios for a program whose effects on degree re-ceipt are larger than those estimated in this study (5, 10, 15, and 20 percentage points, respec-tively), along with a scenario in which a study includes 10,000 sample members. With a sample size of 1,500, even a 20 percentage point effect on degree receipt would require the returns to a degree to be $14,370, or 98 percent, for the study to be adequately powered. In fact, even in an evaluation with 10,000 students where an intervention increases degree receipt by 20 percentage
36For simplicity of exposition, clustering is ignored here as it only exacerbates the issues described.

33
points, the return to a degree would have to be $5,565, or 38 percent, in order for the study to be adequately powered. This percentage is well above current estimates of the average returns to an associate’s degree.
The information provided in Table 7 suggests that if the effects of a college program on earnings arise through effects on degrees alone, then identifying the causal effect of an educa-tional intervention on earnings is probably more difficult than generally acknowledged. This sentiment can be extended to the possibility that an intervention affects earnings through any mechanism, not only degree attainment. For example, Table 7 shows that even with a sample of 10,000, the average impact on earnings for the whole sample would have to be $1,113, or 7.6 percent, in order to produce a detectable impact. This may imply that for a higher education intervention to yield detectable effects on earnings, it may need to provide services that are more directly linked to the labor market (for example, enhanced career and employment counseling), or that target degree completion in fields that offer higher-than-average returns on a degree (for instance, nursing). Evaluations of such interventions would probably require very large samples.
Notably, the MDE calculations in equation 2 rely on the observed 𝜎2 (the variance of earnings) from this evaluation. The preceding discussion is intended as a starting point for a dialogue on the effects of higher education interventions on earnings. Additional information on
Sample Size and Hypothetical Necessary NecessaryDegree Effect Returns to Returns to
Effect (percentage points) Degree ($) Degree (%)
N = 1,500 3.3 87,091 592MDE = $2,874 5.0 57,480 391
10.0 28,740 19615.0 19,160 13020.0 14,370 98
N = 10,000 3.3 33,727 229MDE = $1,113 5.0 22,260 151
10.0 11,130 7615.0 7,420 5020.0 5,565 38
Minimum Detectable
Assuming Earnings Effects Only Through Degree ReceiptNecessary Returns to Degree in Year 7,
Table 7
The Opening Doors Demonstration
NOTE: MDEs assume power is 80 percent, the significance level is 5 percent, and the standard deviation of the earnings outcome is $19,880.

34
this parameter using different samples and sites would be an appropriate first step toward moving this conversation forward.
Conclusion This study shows that a short-term intervention in community colleges can have long-term educational effects and can potentially affect degree completion. Although randomized trials of learning communities have produced varied results, some findings presented in this paper reinforce the results of other research. Notably, the positive program effects during intersessions are consistent with findings from several other evaluations. For example, random assignment evaluations of unrelated programs have also found significant impacts on intersession enroll-ment and intersession credit accumulation (Richburg-Hayes et al., 2009; Patel and Rudd, 2012; Scrivener, Weiss, and Sommo, 2012). Taken together, these findings suggest that intersessions may be particularly well-suited to educational interventions aimed at helping students complete degrees more quickly. Program developers may want to design new interventions with interses-sion enrollment in mind, as students seem responsive to interventions aimed at increasing enrollment during these periods.
Randomized trials are still relatively rare in community colleges. Moreover, few of the trials result in impacts that are still evident after one or two years — and even fewer have led to such a long period of follow up or to the analysis of employment-related outcomes. Identifying strong programs — or particular intervals in students’ academic careers — with the potential to affect long-term educational outcomes is a pressing need in community college research.

35
References
Adelman, C. (2004). “Principal Indicators of Student Academic Histories in Postsecondary Education. 1972-2000.” Washington, DC: U.S. Department of Education, Institute of Education Sciences. Web site: www.edpubs.gov.
Adelman, C. (2005). Moving Into Town — and Moving On: The Community College in the Lives of Traditional-age Students. Washington, DC: U.S. Department of Education.
Angrist, J., Imbens, G., and Rubin, D. (1996). “Identification of Causal Effects Using Instrumental Variables.” Journal of the American Statistical Association 91, 434: 444-455.
Attewell, P. A., Lavin, D. E., Domina, T., and Levey, T. (2006). “New Evidence on College Remediation.” Journal of Higher Education 77, 5: 886-924.
Bailey, T., Jeong, D. W., and Cho, S.-W. (2009). Referral, Enrollment, and Completion in Developmental Education Sequences in Community Colleges. New York: Community College Research Center, Teachers College, Columbia University.
Barrow, L., and Rouse, C. E. (2005). “Do Returns to Schooling Differ by Race and Ethnicity?” Working Paper 2005-02. Chicago: Federal Reserve Bank of Chicago.
Bloom, H. S. (1984). “Accounting for No-Shows in Experimental Evaluation Designs.” Evaluation Review 8, 2: 225-246.
Bloom, H. S. (1995). “Minimum Detectable Effects: A Simple Way to Report the Statistical Power of Experimental Designs.” Evaluation Review 19, 5: 547-556.
Bloom, H. S., and Michalopoulos, C. (2011). “When is the Story in the Subgroups? Strategies for Interpreting and Reporting Intervention Effects on Subgroups.” Prevention Science 14,2: 179-188.
Bloom, H. S., Richburg-Hayes, L., and Black, A. R. (2007). “Using Covariates to Improve Precision for Studies that Randomize Schools to Evaluate Educational Interventions.” Educational Evaluation and Policy Analysis 29, 1: 30-59.
Brock, T., LeBlanc, A., and MacGregor, C. (2005). “Promoting Student Success in Community College and Beyond. The Opening Doors Demonstration.” New York: MDRC. Web site: http://www.mdrc.org.
Campbell, D. T., and Stanley, J. C. (1963). “Experimental and Quasi-Experimental Designs for Research on Teaching.” In N. L. Gage (ed.), Handbook of Research on Teaching. Chicago: Rand McNally.
Card, D. (2001). “Estimating the Return to Schooling: Progress on Some Persistent Econometric Problems.” Econometrica 69, 5: 1127-1160.
Carneiro, P., Heckman, J. J., and Vytlacil, E. J. (2011). “Estimating Marginal Returns to Education.” American Economic Review 101, 6: 2754–2781.

36
Center for Community College Student Engagement. (2012). A Matter of Degrees: Promising Practices for Community College Student Success (A First Look). Austin: University of Texas, Community College Leadership Program.
College Board Advocacy and Policy Center. (2012). Trends in College Pricing 2012. New York: College Board.
Crits-Christoph, P., Tu, X., and Gallop, R. (2003). “Therapists as Fixed Versus Random Effects— Some Statistical and Conceptual Issues: A Comment on Siemer and Joormann.” Psychological Methods 8, 4: 518-523.
Dadgar, M., and Weiss, M. J. (2012). “Labor Market Returns to Sub-Baccalaureate Credentials: How Much Does a Community College Degree or Certificate Pay?” Community College Research Center Working Paper 45. New York: Columbia University, Teachers College.
Duke, A.-E., and Strawn, J. (2008). “Overcoming Obstacles, Optimizing Opportunities: State Policies to Increase Postsecondary Attainment for Low-Skilled Adults.” Boston: Jobs for the Future. Web site: http://www.jff.org.
Dynarski, S. (2008). “Building the Stock of College-Educated Labor.” Journal of Human Resources 43, 3: 576-610.
Engstrom, C. M., and Tinto, V. (2008). “Learning Better Together: The Impact of Learning Communities on the Persistence of Low-Income Students.” Opportunity Matters 1: 5-21.
Goldberg, B., and Finkelstein, M. (2002). “Effects of a First-Semester Learning Community on Nontraditional Technical Students.” Innovative Higher Education 26,4: 235-249.
Gordon, T. W., Young, J. C., and Kalianov, C. J. (2001). “Connecting the Freshman Year Experience Through Learning Communities: Practical Implications for Academic and Student Affairs Units.” College Student Affairs Journal 20, 2: 37-45.
Greenberg, D., Meyer, R., and Wiseman, M. (1994). “Multisite Employment and Training Program Evaluation: A Tale of Three Studies.” Industrial and Labor Relations Review 47: 679-691.
Hoachlander, G., Sikora, A. C., and Horn, L. (2003). Community College Students: Goals, Academic Preparation, and Outcomes. Postsecondary Education Descriptive Analysis Reports. Washington, DC: National Center for Education Statistics. Web site: http://nces.ed.gov.
Horn, L., Berger, R., and Carroll, C. D. (2004). College Persistence on the Rise? Changes in 5-Year Degree Completion and Postsecondary Persistence Rates between 1995 and 2000. Washington, DC: U.S. Department of Education, National Center for Education Statistics, Institute of Education Sciences.
Jacobson, L., and Mokher, C. (2009). Pathways to Boosting the Earnings of Low-Income Students by Increasing Their Educational Attainment. Washington, DC: Hudson Institute Center for Employment Policy.
37
Jepsen, C., Troske, K., and Coomes, P. (2009). “The Labor-Market Returns to Community College Degrees, Diplomas, and Certificates.” Discussion Paper 2009–08. Lexington: University of Kentucky, Center for Poverty Research.
Kane, T. J., and Rouse, C. E. (1995). “Labor-Market Returns to Two and Four-Year College.” American Economic Review 85, 3: 600-614.
Minkler, J. (2002). “ERIC Review: Learning Communities at the Community College.” Community College Review 30, 3: 46-63.
National Center for Education Statistics. (2011). “Total Fall Enrollment in Degree-Granting Institutions, by Control and Level of Institution: 1963 through 2010.” Web site:
http://nces.ed.gov/programs.
National Student Clearinghouse. (2013). Who We Are. National Student Clearinghouse: Herndon, VA.
Pals, S. L., Murray, D. M., Alfano, C. M., Shadish, W. R., Hannan, P. J., and Baker, W. L. (2008). “Individually Randomized Group Treatment Trials: A Critical Appraisal of Frequently Used Design and Analytic Approaches.” American Journal of Public Health, 98: 1418-1424.
Patel, R., and Rudd, T. (2012). “Can Scholarships Alone Help Students Succeed? Findings from the Performance-Based Scholarship Demonstration in New York.” New York: MDRC.
Radford, A. W., Berkner, L., Wheeless, S. C., and Shepherd, B. (2010). “Persistence and Attainment of 2003-04 Beginning Postsecondary Students: After 6 Years. First Look.” Working Paper 2011-151. Washington, DC: U.S. Department of Education, Institute of Education Sciences.
Richburg-Hayes, L., Bock, T., LeBlanc, A., Paxson, C., Rouse, C.E., and Barrow, L. (2009). “Rewarding Persistence: Effects of a Performance-Based Scholarship Program for Low-Income Parents.” New York: MDRC.
Richburg-Hayes, L., Visher, M. G., and Bloom, D. (2008). “Do Learning Communities Effect Aca-demic Outcomes? Evidence From an Experiment in a Community College.” Journal of Research on Educational Effectiveness 1, 1: 33-65.
Roberts, C., and Roberts, S. A. (2005). “Design and Analysis of Clinical Trials with Clustering Effects Due to Treatment.” Clinical Trials 2, 2:152-162.
Schelchter, M. D., and Forsythe, A. B. (1985). “Post-hoc Selection of Covariates in Randomized Experiments.” Communications in Statistics - Theory and Methods 14, 3: 679-699.
Schochet, P. Z. (2008). “Technical Methods Report: Guidelines for Multiple Testing in Impact Evaluations.” Paper NCEE 2008-4018. U.S. Department of Education: National Center for Education Evaluation and Regional Assistance.
Scrivener, S., Bloom, D., LeBlanc, A., Paxson, C., Rouse, C. E., and Sommo, C. (2008). “A Good Start: Two-Year Effects of a Freshmen Learning Community Program at Kingsborough Community College.” New York: MDRC.

38
Scrivener, S., Weiss, M. J., and Sommo, C. (2012). “What Can a Multifaceted Program Do for Community College Students?” New York: MDRC.
Serlin, R. C., Wampold, B. E., and Levin, J. R. (2003). “Should Providers of Treatment be Regarded as a Random Factor? If It Ain't Broke, Don't "Fix" It: A Comment on Siemer and Joormann.” (2003). Psychological Methods 8, 4: 524-534.
Siemer, M., and Joorman, J. (2003a). “Assumptions and Consequences of Treating Providers in Therapy Studies as Fixed Versus Random Effects: Reply to Crits-Christoph, Tu, and Gallop (2003) and Serlin, Wampold, and Levin (2003).” Psychological Methods 8, 4: 535-544.
Siemer, M., and Joorman, J. (2003b). “Power and Measures of Effect Size in Analysis of Variance with Fixed Versus Random Nested Factors.” Psychological Methods 8, 4: 497-517.
Smith, B. L. (2001). “The Challenge of Learning Communities as a Growing National Movement.” Peer Review 3, 4: 4-8.
Smith, B. L., MacGregor, J., Matthews, R., and Gabelnick, F. (2004). Learning Communities: Reforming Undergraduate Education. San Francisco: Jossey-Bass.
Sommo, C., Mayer, A. K., Rudd, T., and Cullinan, D. (2012). “Commencement Day: Six-Year Effects of a Freshman Learning Community Program at Kingsborough Community College.” New York: MDRC.
Stassen, M. L. A. (2003). “Student Outcomes: The Impact of Varying Living-Learning Community Models.” Research in Higher Education 44, 5: 581-613.
Taylor, K., Moore, W. S., MacGregor, J., and Lindblad, J. (2003) Learning Community Research and Assessment: What We Know Now. National Learning Communities Project Monograph Series. Olympia, WA: Washington Center.
Tinto, V. (1975). “Dropout From Higher Education: A Theoretical Synthesis of Recent Research.” Review of Education Research 45: 89-125.
Tinto, V. (1997). “Classrooms as Communities: Exploring the Educational Character of Student Persistence.” Journal of Higher Education 68, 6: 599-623.
Tinto, V. (1998). “Learning Communities and the Reconstruction of Remedial Education in Higher Education.” Washington, DC: Ford Foundation and U.S. Department of Education.
Tinto, V., and Russo, P. (1994). “Coordinated Studies Programs: Their Effect on Student Involve-ment at a Community College.” Community College Review 22, 2: 16-25.
Visher, M.G., and Teres, J. (2011). “Breaking New Ground: An Impact Study of Career-Focused Learning Communities at Kingsborough Community College.” New York: MDRC.
Visher, M. G., Weiss, M. J., Weissman, E., Rudd, T., and Wathington, H. D. (2012). “The Effects of Learning Communities for Students in Developmental Education: A Synthesis of Findings from Six Community Colleges.” New York: Columbia University, Teachers College, National Center for Postsecondary Research. Web site: http://www.postsecondaryresearch.org.

39
Weiss, M. J. (2010). “The Implications of Teacher Selection and the Teacher Effect in Individually Randomized Group Treatment Trials.” Journal of Research on Educational Effectiveness 3, 4: 381-405.
Weiss, M. J., McCaffrey, D. F., and Lockwood, J. R. (2013). “Clusterfudge: Estimating the Standard Error of the Impact Estimate in Individually Randomized Trials (with Clustering).” Washington, DC: Paper presented at the Association for Public Policy Analysis and Management.
Weiss, M. J., Visher, M., and Weissman, E. (2012). “Learning Communities for Developmental Education Students: A Synthesis of Findings from Randomized Experiments at Six Community Colleges.” Evanston, IL: Society for Research on Educational Effectiveness. Web site: http://www.sree.org.
Zhao, C.-M., and Kuh, G. D. (2004). “Adding Value: Learning Communities and Student Engage-ment.” Research in Higher Education 45, 2: 115-138.

About MDRC
MDRC is a nonprofit, nonpartisan social and education policy research organization dedicated to learning what works to improve the well-being of low-income people. Through its research and the active communication of its findings, MDRC seeks to enhance the effectiveness of so-cial and education policies and programs.
Founded in 1974 and located in New York City and Oakland, California, MDRC is best known for mounting rigorous, large-scale, real-world tests of new and existing policies and programs. Its projects are a mix of demonstrations (field tests of promising new program approaches) and evaluations of ongoing government and community initiatives. MDRC’s staff bring an unusual combination of research and organizational experience to their work, providing expertise on the latest in qualitative and quantitative methods and on program design, development, implementa-tion, and management. MDRC seeks to learn not just whether a program is effective but also how and why the program’s effects occur. In addition, it tries to place each project’s findings in the broader context of related research — in order to build knowledge about what works across the social and education policy fields. MDRC’s findings, lessons, and best practices are proac-tively shared with a broad audience in the policy and practitioner community as well as with the general public and the media.
Over the years, MDRC has brought its unique approach to an ever-growing range of policy are-as and target populations. Once known primarily for evaluations of state welfare-to-work pro-grams, today MDRC is also studying public school reforms, employment programs for ex-offenders and people with disabilities, and programs to help low-income students succeed in college. MDRC’s projects are organized into five areas:
• Promoting Family Well-Being and Children’s Development
• Improving Public Education
• Raising Academic Achievement and Persistence in College
• Supporting Low-Wage Workers and Communities
• Overcoming Barriers to Employment
Working in almost every state, all of the nation’s largest cities, and Canada and the United Kingdom, MDRC conducts its projects in partnership with national, state, and local govern-ments, public school systems, community organizations, and numerous private philanthropies.
