a real time gps/ins integrated system sampling … o n g li and; contex, hemispheregps, hp, kolida,...
TRANSCRIPT

RNI: DELENG/2005/15153 No: DL(E)-01/5079/08-10 Publication: 15th of every month Licensed to post without pre-payment U(E) 28/2008-10Posting: 19th/20th of every month at NDPSO Rs.100
ISSN
0973-2
136
Volume IV, Issue 3, March 2008 THE MONTHLY MAGAZINE ON POSITIONING, NAVIGATION AND BEYOND
A real time GPS/INS integrated system
Sampling the world
GPS antenna: from relative to absolute


colophon and contents
Mailing Address
cGIT, 28A Pocket D
SFS Mayur Vihar Phase III
Delhi 110 096, India.
Phones +91 11 22632607, 98102 33422, 98107 24567
[information] [email protected]
[editorial] [email protected]
[advertising] [email protected]
[subscriptions] [email protected]
Web www.mycoordinates.org
In this issueCoordinates Volume 4, issue 3, March 2008
Coordinates is an initiative of cGIT that aims to broaden the
scope of positioning, navigation and related technologies.
cGIT does not neccesarily subscribe to the views expressed
by the authors and advertisers in this magazine and may not
be held liable for any losses caused directly or indirectly due
to the information provided herein. © cGIT, 2008. Reprinting
with permission is encouraged; contact the editor for details.
Annual subscription (12 issues) [India] Rs.1,200
[Overseas] US$80
Printed and published by Sanjay Malaviya on behalf of
Centre for Geoinformation Technologies at A221 Mangal
Apartments, Vasundhara Enclave, Delhi 110096, India.
Editor Bal Krishna
Owner Centre for Geoinformation Technologies
Designer TSA Effects, www.tsa.in
Printer Sonu Printer, B 82, Okhla Phase I, New Delhi,
India.
This issue of Coordinates is of 40 pages, including
cover.
articles
Mapping errors Dr Beena Chintalapuri, V raghu Venkataraman 7 a real-time Gps/Ins integrated system Yong li,
peter mumforD, Chris rizos 12 science of Interoperability DaViD sChell, Dr D r f taYlor 18
Google exposed! 21 sampling the world rainer mautz 22 Gps antenna: from relative to absolute aristiDis fotiou, Christos pikriDas, miltiaDis Chatzinikos 28
columns
My coordinates eDitorial 4 news gps 31 inDustrY 32 galileo upDate 33 lBs 34 gis 36 remote sensing 36 Mark your calendar april to DeCemBer 38
this issue has been made possible by the support and good wishes of the following individuals and companies aristiDis fotiou, Beena Chintalapuri, Chris rizos, Christos pikriDas, D r f taYlor, DaViD sChell, miltiaDis Chatzinikos, peter mumforD, rainer mautz, V raghu Venkataraman, Yong li and; Contex, HemisphereGPS, HP, Kolida, Magellan, Navcom, Novatel, NRSA, South, Spirent; and many others

Coordinates March 2008 | 5
Our high-performance large format scanners not only help you
get more done every day, but also endure longer, require minimal
maintenance, and give you brilliant imaging results – every time.
An integral part of any complete scan-to-print, scan-to-�le or scan-to-net
solution, Contex scanners offer:
outstanding optics for capturing just the right level of detail
patented technology for high-de�nition image capture with advanced
line and color correction
intelligent software that lets you control and enhance images more easily
seamless integration with most large format printers
And those are just some of the advantages. Visit www.contex.com to learn
how our large format scanning solutions can help your business.
Some tools are simply built to achieve more.our complete large format scanning solutions do it all
scan-to-print
scan-to-file
scan-to-net
Please contact your local distributor:
Australia India Singapore Thailand Vietnam Malaysia UAEAnitech CADD Centre Brighter Image Ptd Ltd Bangkok Business Equipment Harmony Co. Ltd Jardine OneSolution CADD Emirateswww.anitech.com.au www.caddcentre.co.in www.biscan.com www.bbe-group.com www.harmony.com.vn www.jos.com.my www.caddemirates.com
An integral part of any complete scan-to-print, scan-to-�le or scan-to-net
patented technology for high-de�nition image capture with advanced
intelligent software that lets you control and enhance images more easily
to learn
scan-to-net

chief advisor Muneendra Kumar PhD, Chief Geodesist (Retired), US National Geospatial Intelligence Agency, USA advisors Naser El-Sheimy PEng, CRC Professor, Department of Geomatics Engineering, The University of Calgary Canada, George Cho Professor in GIS and the Law, University of Canberra, Australia, Dr Abbas Rajabifard Director, Centre for SDI and Land Administration, University of Melbourne, Australia, Luiz Paulo Souto Fortes PhD Associate Director of Geosciences, Brazilian Institute of Geography and Statistics - IBGE, Brazil, John Hannah Professor, School of Surveying, University of Otago, New Zealand
MycoordInates
Points to ponder
Many intelligent people into IT jobs in India are below their intellectual capabilities...
They are like coolies who are working for wages and not producing great intellectual material.
Thus remarked Dr CNR Rao, Chairman of the Scientific Advisory Council to the Prime Minister of India in Outlook magazine recently.
Is this true for geomatics too?
If it is, even to a limited extent, it calls for introspection.
And immediate attention.
Bal Krishna, editor [email protected]
6 | Coordinates March 2008

MappInG
human factors contributing to mapping errors made by operators working
on digital mapping systems were studied from Cognitive Psychology perspective to evolve suitable strategies to reduce errors.
Mapping errors
study area
Large scale topographic maps of better than 1:5000 scale with 1 to 2 m contours are currently prepared on digital photogrammetric workstations (DPWS) using block adjusted 3D models derived from aerial photographs. Errors made by operators during vector capture from 3-D models in a production environment require extensive rework. Obviously there is a lot to be gained in terms of cost and time if such errors can be eliminated or at least minimized.
current perception
It is generally perceived that the cause for such errors is carelessness and the only mechanisms to deal with it are stringent quality control and increase in expertise of both the operators as well as quality control staff.
new approach
In this study an attempt was made to study the factors which contribute to the
human errors made by operators from Cognitive Psychology perspective. The human side of man machine interaction comprising of perception, memory, cognitive styles, problem solving abilities, decision making, attitude towards work and stress play an important role in the quality of the final product and therefore the focus of the study was on the persons who carry out digital mapping.
classification of mapping errors
Webster’s New Encyclopedia Dictionary defines six different meanings of an error:a) A deviation from a code of behaviourb) An act involving unintentional
deviation from the truth or accuracyc) An act through ignorance,
deficiency or accident fails to achieve what should be done
d) A false belief or a set of false beliefse) Something produced by mistakef) The difference between an observed
or calculated value and the true value
Based on Generic Error Modeling System (GEMS) of Rasmussen (1986), mapping errors were classified into three types based on the performance level into Skill Based (SB), Rule Based (RB) and Knowledge Based (KB).
Skill based
Skill based performance takes place with automated and highly practiced patterns of behaviour. According to Rasmussen (1986) “ behaviour at SB level represents sensory motor performance during acts or activities that after a statement of an intention, takes place without conscious control as smooth, automated and highly integrated pattern of behavior.” Generally these are routine and non problematic activities in familiar situations. SB errors can also be called as slips and lapses and arise due to inattention or over attention to the task at hand or attention to the wrong points of the task.
Error Classes according to Cognitive Psychology Mapping Errors
I Skill Based Performance Level Errors
1. Missing Feature2. Closure of polygons3. Overshoots and Undershoots4. Duplicate objects
II Rule Based Performance Level Errors1. Layer Check2. Layer Code
III Knowledge Based Performance Level Errors1. Wrong Layerization2. Interpretation error3. Digitization error
Dr Beena Chintalapuri Prof and Head, Department of PsychologyOsmania UniversityHyderabad, Andhra Pradesh, India
V Raghu VenkataramanGeneral Manager (Aerial Services and Digital Mapping Area)National Remote Sensing Agency
(Department of Space, Governement of India)Hyderabad, Andhra Pradesh, India
Mapping errorsApplication of cognitive psychology for reduction of mapping errors
Coordinates March 2008 | 7

Rule based
Rule based performance is related to problem solving. Performance is goal oriented and is structured by feed forward control through a stored rule. It is assumed that rules are arranged in an order of priority and it becomes imperative for an individual to predict and apply these rules to the task for a successful outcome (Reason, 1991). RB errors take place due to the misapplication of good rules or failure to recognize a situation in which the rule does not apply or application of inappropriate rules. RB errors involve inappropriate matching of environmental signs to the situational component of well tried trouble shooting rules.
Knowledge based
Knowledge based performance is involved in problem solving and formulations at a more abstract level of representation. According to Rasmussen (1986) knowledge based level comes into play in novel situations in which actions must be planned on the job or on the task or on line using conscious analytical processes and stored knowledge. KB errors arise during the subsequent attempts to find a solution. KB errors arise when an individual has run out of applicable problem solving routines. They arise from a complex interaction between “bounded rationality” and “incomplete or inaccurate mental models”. Knowledge based performance errors can take a wide variety of forms, none of which are necessarily predictable on the basis of individual’s acquired knowledge. (Backstorm, 1997). Yet another piece of information according to him is that knowledge based performance mistakes are the hardest of all to detect as expertise is required. At best, it is possible to forecast the general cognitive and situational factors that will conspire to create knowledge based performance mistakes (Reason, 1991).
It is also claimed that knowledge based errors are complex & diverse and tend to arise due to limited capacity of working memory and due to misuse or overuse of heuristics and biases in information processing (Tversky & Kahnueman, 1974).
types of mapping errors
In the context of this study, mapping errors were analysed and divided into the three classes as given below:
research methodology, sample, tools and procedures
objectivesTo acquire data related to errors a) (E1) in digital mapping activity from Quality Control ExpertsTo assess some of the cognitive, b) personality and stress variables/ factors for the operators and prepare an error profile for each operatorTo classify mapping errors c) from cognitive psychology perspective and prepare an error profile for each operatorTo design and conduct suitable d) intervention programme which could address errors. The idea is to put forth cognitive engineering measures as suggestions which may regulate errors as part of the intervention programmeTo acquire data related to errors as e) a post intervention measure (E2) from Quality Control ExpertsTo compare pre (E1) and post f) intervention and (E2) error profilesTo study the implications of the g) intervention programmeTo suggest a model for effective h) performance in digital mapping
sample
The study was carried out using a total of 53 subjects in three categories. a) The Pilot Study sample of 10 digital
mapping operators to study errors and orient investigators about mapping activity
b) The Supporting Study sample comprising • 5 Psychology
teachers and 5 Psychology research scholars to identify
the psychological processes involved in mapping activity
• 3 Quality Control managers to identify mapping errors and evaluate the performance of each member of the main sample
• 2 Programme evaluators to evaluate the process and outcome of the investigation
c) The Main Sample consisting of 30 operators to study mapping performance and errors made by them before and after intervention.
Even though the main sample was 30, mapping activity for 3 shifts (A, B & C) of each individual were recorded for purposes of error identification. Mapping activity was tracked on 90 occasions (30 * 3 shifts) which amounts to approximately 540 hours and fulfills the reliability requirement.
tools
The errors made by operators were studied in digital environment (digital photogrammetry workstations and mapping workstations having relevant software packages) by quality control experts who had extensive documentation support on different types of errors. On the Main sample of 30 operators the following tools were utilized to assess their personality and to obtain feedback regarding error awareness, regulation, time frames, attitudes towards session and efficacy of the intervention programme.
procedures
For the sake of clarity, the elaborate procedure adopted in the study is summarized below.
Sl. List of Variables Processes involved
1 Personality factors Personality
2 Tolerance to Ambiguity Personality3 Stress factors Stress measures4 Automaticity Attention
Cognitive Psychology Variables
5 Geometrical illusion Perception6 Perceptual style Perception
7 Cognitive style Thinking
8 | Coordinates March 2008

Coordinates March 2008 | 9

Intervention
The data related to psychological variables were studied in the context of error production. The psychological factors assessed which are likely to have a negative effect on performance or bearing on error occurrence were considered as risk factors. Risk factors on all psychological tests for each individual member of the sample were identified. For each individual an error
Project Phase Stage Activity
Need analysis
Proposal to RESPOND-ISRO on Cognitive Psychology and mapping errors.Study of mapping errors in Indian context from behavioral point of view.
Pilot study
Undertaken to: • Understand mapping errors• Arrive at error classification
Identify the psychological process involved in effective and error free mapping activity
• Seven cognitive and personality processes Identified
• Based on psychological processes, suitable Tests were identified
Data collection from main
sample
Pre-intervention
Recording of mapping activity on 30 mapping operators across A, B and C shifts (540 hrs).Administration of psychological tests on main sample Preparation of individual profiles:
• Error profile (E1)• Psychological profile• Quality control experts evaluation
Intervention
• Step 1 Introduction and distribution of error profiles
• Step 2 Presentation on cognitive, personality and stress factors relevant to error production.
• Step 3 Providing opportunity for peer interaction and discussion on profiles.
• Step 4 Presentation on error classification• conventional and modern view on errors• implications of errors for personal
and organizational effectiveness• Step 5 Presentation on cognitive and
personality Engineering strategies• Step 6 – Feedback # 1 on intervention
Post Intervention
• Recording of mapping activity• Preparation of Error Profile (E2)• Evaluation by quality control experts• Presentation of pre and post test error
profile and performance evaluation to each mapping operation
• Feedback # 2 from mapping operators.
profile and a psychological profile was prepared. This was given to them as part of the intervention programme for their awareness, information and understanding. Risk factors for each individual were estimated and presented in the context of error occurrence. This may be seen as possible contributions of error production which, if addressed, could result in error regulation thereby resulting in error reduction.
Feed back taken from the sample after the intervention programme has shown readiness to make effort to regulate the performance so as to reduce the error occurrence. Members of the main sample claimed that they made a conscious effort to reduce errors and increase their quantum of work. This is attributed to the contract they made with themselves to self regulate errors, i.e., 46% of them from next day, 26% of them within two days and 26% of them within a week.
Mean error occurrence of the sample before and after intervention showed significant decrease. Results show a considerable increase in quantum of work done after intervention. Performance evaluation by quality control experts before and after intervention were encouraging and positive. The results Performance gain was derived on the basis of mean quanta of work and errors before and after intervention.
conclusion
The conclusions drawn from this investigation are as follows:
Classification of mapping errors as • per cognitive psychology perspective into (i) skill based, (ii) rule based, and (iii) knowledge based performance level errors is adequate for the meeting
Below AverageOr Average
Assessment of Perceptual,Cognitive & Personality factors
Identification ofPsychological Risk factors
Feedback to the Participants - 1
Intervention Program
Behavioral Self-Contract
BelowAverage
&Average
AboveAverage
Evaluation ofPerformance-II(Check errors &quanta of work
Status
Evaluation ofperformance – E1
(based onIdentification ofErrors & Quata
of work
Above Average
EffectiveMapping
Start Project
10 | Coordinates March 2008

the objectives of understanding human factors that cause errors and to evolve strategies to reduce them. Mean quanta of work is more in shift B • (2 pm to 10 pm) compared to shifts A (6 am to 2 pm) & C (10 pm to 6 am).Skill based performance level errors • were found to be 32%. This may be because mapping activities are predominantly skill based involving cognitive activities like attention, perception, automaticity, etc.Mean error occurrence of the • sample before and after intervention decreased to 13.22 from 18.09.Results show a considerable • increase in quantum of work done
after intervention.Performance •
evaluation by quality control experts before and after intervention shows that 18% of the sample moved from below average to above average level, 18% from below average to average and 4% from average to above average, 37% of them remained average. Actually the number of below average performers was completely eliminated after the intervention whereas the number of average and above average performers consequently increased.
Performance gain was 31%.• Based on the findings a •
working model for effective digital mapping performance improvement procedure from cognitive psychology perspective has been evolved. .
suggestions
The suggestions are the outcome of a maiden research in the mapping domain in this country. It is hoped that this would set us thinking in a new direction to face the new era that brings newer challenges.
Bringing error occurrence • to the operator’s attention periodically, would act as a
feed back on performance.Training programmes may be designed • exclusively for below average performers, average performers and above average performers. These programmes should be designed based on an analysis of errors, quanta of work done, personality and work related factors. Such programmes if conducted periodically would motivate poor and average performers to aim at higher level of performance. It is also important to see that above average performers would maintain their performance and be motivated to perform towards excellence.While selecting the candidate •
for the jobs relating to mapping, recruitment department may use psychological tests as another screening test. Test like cognitive styles, perceptual styles, personality and stress may be administered and then based on these results, suitable candidates may be selected.It is important to make an effort to • understand and identify the human risk factors in operators. This would help in addressing the issue rather than the person specifically. If unaddressed such factors would hamper healthy interpersonal and cultural climate of the organization. Individuals who are working with • computers on activities similar to that of mapping (i.e., not programming or text processing which are logical operations) for example air traffic control, thematic image interpretation, process control systems, animation and graphic arts, etc., may be studied.
referencesRasummens, J (1986). Cited by Reason, • J (1981). Human Error. Cambridge: Cambridge University Press. Reason,. J (1991) . Human • Error, Cambridge: Cambridge University Press. Backstorm, .T (1997) (june 29-July 4). • Theoritical Explanations for the non use of safe Gaurds. Paper presented at the “ From experience to innovation” Proceedings of the 13th Triennial congress of International Ergonomics Association, Tampere, Finland. Tversky , A., & Kahneuman, D. (1974), • Judgement under uncertainty:Heuristic and Biases Science.
ISRO RESPOND Project at NRSA - Pre-Intervention
Shifts
16.63
18.4
15.7
18.233
17.23
17.9
14
14.5
15
15.5
16
16.5
17
17.5
18
18.5
19
CBA
Mean Quantaof Work
Mean No. ofErrors
Findings:
Mean quanta of work is slightly more in shift B compared to shifts A & C
- Mean number of errors were less in shift B compared to shifts A & C
ISRO RESPOND Project at NRSA – Pre- Intervention
Type of Errors
31.63
10.87
3.27
0
5
10
15
20
25
30
35
SB RB KB
Erro
rs
Findings:Skill based performance level errors were found to be more (Mean-32) compared to rule based (Mean-11) and knowledge based performance errors (Mean-3)
ISRO RESPOND Project at NRSA - Intervention
•The percentage of above average and average improved after intervention.•There were no below average performers after Intervention
Before Intervention
Below Average37%
Average27%
Above Average36%
Above Average59%
Average 41%
AfterIntervention
ISRO RESPOND Project at NRSA Post Intervention
Gain in performance
17 18 19
13
02468
101214161820
Q1 E1 Q2 E2
quantaof work
errors quantaof work
errors
Pre-Intervention Post Intervention
Coordinates March 2008 | 11

although Global Navigation Satellite Systems (GNSS) technology is
developing rapidly, the major disadvantage of GNSS will still exist even when the European Galileo system is fully operational, that is, signal blockage due to obstructions and the low power of the signals. The combination of GNSS with a self-contained inertial navigation system (INS) provides an ideal solution, which can not only address the weakness of GNSS and but also bound the INS error that grows with the time when operating on its own. The integrated system can provide a continuous position, velocity and attitude solution at a high output rate even during a GNSS outage, albeit for a limited period. These advantages drive GNSS/INS integration in military and civil applications (Buck etal 2006, Kennedy etal 2006).
A multisensor integration platform based on a field programmable gate array (FPGA) has been developed at the
Satellite Navigation and Positioning Laboratory (SNAPlab), School of Surveying & Spatial Information Systems, University of New South Wales. The biggest advantage of the FPGA-based system is that all the hardware and software components of the system are field re-programmable
without any hardware changes, with even the processor of the system itself being “soft”. A “hardcopy” FPGA can be made after the system has been sufficiently tested.
An FPGA is an integrated circuit capable of implementing digital circuits by means of a configuration process. The designer can use it to implement the specified logic (Hidalgo 2003, Meyer-Baese 2001). Two major hardware description languages (HDLs) are popularly used for the FPGA design today, namely Verilog and VHDL, both of which are IEEE standards. The authors have used the Altera HDL “AHDL” for most of the design.
Figure 1 illustrates the system architecture of a typical setup of a real-time GPS/INS integrated system. As shown in Figure 1, the GPS and INS data are fed into the FPGA system where the real-time Kalman filter estimates the INS errors that are then used to correct the INS solution. The corrected solution is sent to a field computer on which a geographic information system (GIS) runs. The INS solution can then be plotted onto a map or visualised on the GIS platform. The solution and data collected in the field is sent to a command or monitoring centre via a wireless communication link, i.e. wireless internet, or the mobile phone network. High-level commands or decisions can be made by the centre on the basis of the real-time information that is received. In comparison with post-processing systems, real-time systems can respond to urgent events promptly, with minimum delay. This is vital in, for example, emergency service applications.
A real-time GPS/INS integrated systemA multisensor integration platform based on a field programmable gate array (FPGA)
has been developed at the Satellite Navigation and Positioning Laboratory (SNAPlab),
School of Surveying & Spatial Information Systems, University of New South Wales
Yong LiUniversity of New South Wales, Australia [email protected]
Peter MumfordUniversity of New South Wales, Australia
Chris RizosUniversity of New South Wales, Australia
Figure 1. Illustration of a real-time Gps/Ins integrated system
Gnss
12 | Coordinates March 2008

system design and implementation
hardware
The real-time system is built around the Nios II soft-core on a Stratix EP1s10 device. The GPS pulse-per-second (PPS) signal is required for the time synchronisation process and is connected to the prototype device via a BNC socket. The device is currently configured with four UARTs, two of them for INS and GPS input, and another two for integration result output. The device has an LCD screen for menu and status information display and four buttons for option selection and operation control.
Custom designed logic has been developed for the FPGA to provide count stamping on the incoming serial data streams. The processor logic residing in the FPGA chip hosts the application software that interfaces with the user and controls the custom logic and Compact Flash card operations (Altera 2005). The hardware design file and the firmware are downloaded to the flash memory (AMD AM29LV065D). When power is applied to the board, a configuration controller device
attempts to configure the FPGA with hardware configuration data stored in flash memory. Figure 2 shows the hardware box of the system.
The INS used is Boeing’s C-MIGITS II, a so-called tactical grade inertial measurement unit (IMU) that provides raw inertial data (Boeing 1997). An OmniStar-HP8200 GPS receiver is used to provide the PPS signal and the GPS navigation solution.
The main specifications of the real-time system are listed in Table 1.
time-synchronisation Uart
A specified UART has been designed for the time synchronisation of the GPS and INS data. This “time-sync UART” logic is attached to the processor as a memory-mapped peripheral with one interrupt line (Mumford etal 2006).
The UART must detect transmission, receive the data in serial format, strip off the start- and stop-bits, and store the data word in a parallel format, as well as access a free-running counter that is latched at the start bit of a serial transmission. This count is appended to the incoming byte and placed in a first-in-first-out (FIFO) buffer. The PPS signal along with GPS time data are used in an interpolation algorithm to calculate the time-of-arrival of serial data from the INS. As a result, the INS data is time-tagged with GPS time, and therefore the INS data is available for comparison with the GPS data in the GPS time frame.
software
The embedded software is developed using a special version of the Embedded Configurable Operating System (eCos) – ‘the eCos for Nios II’, which provides support of the FAT32 file I/O for the Compact Flash (CF) card, multi-task programming, LCD display, and interrupts from UARTs and buttons (Massa 2002, Nios Community Forum 2005).
The operations of the program are depicted in Figure 3. The software consists of four threads,
which are the user interface (UI), time synchronisation (TS), strapdown INS (SDINS), and Kalman filtering (KF). The system first allocates the memory for the circular buffers, and commands the GPS and INS devices to output the requested messages. The ISR of UART event notifies the UI or TS thread to drain the data from the UART FIFO buffer and performs the decoding procedure to covert the binary stream to the data messages. The TS procedure aligns the IMU data with the GPS time frame so that comparison of the IMU and GPS data is possible. The strapdown navigation solution is calculated from the time-synced IMU data. Using the GPS data, the Kalman filter further estimates the errors in the inertial solution (due to the inertial sensors). The error estimates are used to correct the inertial solution and improve the result. The corrected INS solution is sent to the external world via a UART port. Meanwhile the system stores the time-synced IMU data and GPS data together with the corrected inertial solution onto the CF card for replay or post-processing.
The corrected navigation solution is sent out in a pre-defined format to an external device, e.g. a handheld computer, where a program runs to receive the solution and send it to GoogleEarth via the internet. The “.kml” file describes the server address on the internet to which the client sends the data. By linking to the address, the position of the host platform can be monitored on any PC in the command/monitor center using the GoogleEarth viewer. Figure 4 depicts a screen copy of a test at the top of the building in which the SNAPlab is located. Using the real-time GPS/INS solution, GoogleEarth automatically zooms in to the area around the SNAPlab building.
algorithm
The strapdown inertial computation has been performed in the navigation coordinate system (n-frame). The psi-angle model is used in the 15-state GPS/INS integration Kalman filter as the INS error model (Bar-Itzhack and Berman 1988).
Three operation modes have been implemented in the embedded algorithm: (1) the coarse alignment; (2) the fine
FPGA Altera’s Stratix EP1S10Processor Nios IIOscillator 50MHzSRAM 512KB x 2SDRAM 16MBFlash 8MBEmbedded OS eCos for Nios II, ver5.1.
Interface one LCD; four Buttons; one CF card slot; four UARTs; one BNC.
GPS OmniStar-HP8200INS C-MIGITS II
table 1. characteristics of the real-time system
Figure 2. hardware of the real-time FpGa-based Gps/Ins system
Coordinates March 2008 | 13

alignment; and (3) the strapdown INS and integration Kalman filtering. During the coarse alignment, the platform remains static while the tilt angles are computed from the accelerometer data. In addition, the sensor noise levels can be estimated during the coarse alignment (Kennedy 2006). The heading angle can be roughly estimated from gyro-compassing the gyroscope data. However the C-MIGITS II has a gyro bias of 30deg/hr (Boeing 1997), a magnitude almost twice the earth rotation rate and hence the heading result derived from the C-MIGITS II is not very meaningful. A heading correction can
be obtained from the GPS velocity when the platform is moving. During the fine alignment, the Kalman filter estimates the tilt errors and the sensor biases. Due to the weak observability of the heading angle, the fine alignment cannot prevent the heading from gradually drifting.
tests
Long-term testing of the real-time performance of the system has been conducted in the laboratory. The focus of testing included stability of the multi-threaded firmware, real-time decoding of the GPS and INS data messages, real-time time synchronisation, multiple-stage circular buffering, float-pointing calculation, stability of the Kalman
filter, button interrupts and response, CF file I/O, data output through additional UARTs, and interfacing with GoogleEarth.
With the 50MHz system design, the timing resolution of the counter is 5.12µs. To compare the time derived by the FPGA device with the time of the INS output, the FPGA-based system has demonstrated time-sync accuracy of better than 0.3ms. The system has potentially higher accuracy because it can reveal the C-MIGITS II’s 10µs/sec clock drift, as analysed in Li et al (2006).
static test
An important requirement of the system is to estimate the attitude angles and the inertial sensor biases. Static data is used to evaluate this capability because the
tilt angles are invariant during the test. Without correction from the Kalman filter estimates, the strapdown attitude solution gradually drifts with time. In the test, a 160-second alignment period is pre-defined. The zero-velocity is used to update the attitude and sensor errors in the alignment. Once the alignment process has been completed, the system automatically changes to the navigation mode where the GPS position data is used to update the estimate. The tilt solution converges gradually during the alignment phase, and remains stable within a small range of ±0.05deg during the navigation phase.
Van test
Kinematic data was collected along roads in a variety of environments, including a race track with significant attitude manoeuvres, a highway, forested mountain areas with GPS signal blockage, and also through tunnels.
The device setup in a test is shown in Figure 5a.The ground trajectory depicted in Figure 5b shows the result from the test carried out around the Mount Panorama racing circuit, Bathurst, in the state of New South Wales. The velocity and attitude solution is depicted in Figure 6.
In comparison with the INS-only solution, the integrated velocity solution (Figures 6a – 6c) is stable and correctly reflects the movements of the vehicle – backward and forward when the vehicle is driven from the parking site, stops to wait for the traffic light, and speeding up. The integrated attitude solution is also stable, and properly reflects the angular movement of the vehicle – especially on pitch (6e)
Figure 3. operation diagram of the embedded software
Figure 4. real-time Gps/Ins solution displayed on the Googleearth viewer
-33.46
-33.455
-33.45
-33.445
-33.44
-33.435
-33.43
-33.425
149.545 149.55 149.555 149.565149.56 149.57
Lat
(deg
)
Figure 5. the device in the test and trajectory from the Gps/Ins solution(a) FpGa-based Gps/Ins systems (b) Gps/Ins trajectory
14 | Coordinates March 2008

Coordinates March 2008 | 15 www.navcomtech.com
Stellar performance doesn’t have to be complicated. Or expensive. OurSF-2110 offers the simplicity of a single-frequency receiver –– and NavComreliability –– at an affordable price. Using our StarFire™ service, theSF-2110 provides up to 50cm accuracy anywhere, anytime without a basestation making it ideal for multiple applications.
Learn more about the rugged productivity of the SF-2110 Series atwww.navcomtech.com. Or, call + 1 310-381-2000.

starts to move. In the last section of the heading curve in Figure 6f, the heading has a jump of about 126deg in comparison with the initial value. In comparison with the compass data collected in the test, the angle at the end reflects the correct heading direction. Because the vehicle starts and stops at the same site and heads in the same direction the correct heading angle at the end demonstrates that the integration Kalman filtering works
and heading (6f). The tilt angles (roll in 6d and pitch in 6e) converge when the vehicle is static, however the heading (6f) remains on the initial value with slight drift during the static period. The heading becomes observable when the vehicle moves and the GPS-derived velocity vector is then used to initialise the heading. From Figure 6f it is easy to see that the heading quickly changes from the initial value to the correct value when the vehicle
(a) entrance of the tunnel (b) Gps/Ins solution in the tunnelFigure 7. comparison of solutions in the tunnel
properly, at least in a qualitative sense.
performance in tunnels
One test was performed in the Jenolan Caves area near Bathurst. The road goes through a tunnel near the Jenolan Caves township. The tunnel has a length of 197.7m in east, and 32.8m in north. It took 45sec to drive through the tunnel, including the time waiting due to traffic. Figure 7a shows the entrance to the tunnel, and Figure 7b depicts the trajectory from GPS and GPS/INS solutions. During the 45-second GPS outage in the tunnel, the INS solution correctly outlines the shape of the tunnel. This result demonstrates that the integration system is working satisfactorily – once an accurate navigation solution and the inertial sensor biases have been estimated before the vehicle enters the tunnel.
The second test was performed in the Sydney Airport tunnel, as depicted in Figure 8. There are two successive GPS outages. The first 17-second GPS outage occurred under a bridge just 12 seconds before the car entered the tunnel, and then a 44-second GPS outage in the tunnel itself.
Figure 9 illustrates the integrated solution (in blue) and the GPS-only solution (in red). It can be seen that the two GPS outages are bridged smoothly.
(a) Ve - t
(c) Vu - t
(e) pitch - t
(b) Vn - t
(d) roll - t
(f) heading - tFigure 6. Velocity and attitude solution
16 | Coordinates March 2008

concluding remarks
An FPGA-based real-time GPS/INS integrated system has been developed. A time-sync UART is designed to connect with the Nios II processor system to enable communication between the Nios II and the GPS and INS devices, as well as time-synchronise the GPS and INS data streams.
The embedded software has been developed using eCos – an open source embedded operating system. The software is programmed to implement multiple tasks; decoding the GPS and INS data streams, time synchronisation, strapdown inertial computation, and the integration Kalman filtering. With eCos support, the software implements the FAT32 filing system for CF card I/O, operation status display on the LCD, and button controls. The real-time solution is sent out via two additional UARTs and can be displayed on a GoogleEarth viewer. Long-term tests have demonstrated the functionality and operational robustness of the embedded software.
The GPS/INS integrated algorithm has been developed and tested in the laboratory and in the field. The results have demonstrated that the integration Kalman filter estimates the inertial errors correctly, to compensate for the drift in the inertial solution. The results of the tests in several tunnels have shown that the corrected INS solution can bridge the GPS outages with reasonable accuracy.
acknowledgements
The project is funded under the Australian
Cooperative Research Centre for Spatial Information (CRC-SI). The authors would like to acknowledge the support from the CRC-SI.
referencesAltera (2003) • Nios development board – reference manual, Stratix edition, http://www.altera.com. Altera (2005) Nios II software • developer’s handbook, http://www.altera.com.Bar-Itzhack IY and Berman N • (1988) Control theoretical approach to inertial navigation systems, Journal of Guidance, Control and Dynamics, 11 (3): 237-245.Boeing North American Inc (1997) • User’s manual of C-MIGITS II.Buck TM, Wilmot J, and Cook MJ • (2006) A high G, MEMS based, deeply integrated, INS/GPS, guidance, navigation and control flight management unit, Proceedings of IEEE/ION PLANS 2006, San Diego, California, 25-27 April.Kennedy S, Hamilton J, Martell • H (2006) Architecture and system performance of SPAN – NovAtel’s GPS/INS solution, Proceedings of IEEE/ION PLANS 2006, San Diego, California, 25-27 April. Li Y, Mumford P, Wang J, and • Rizos C (2006) Development of a GPS/INS integrated system on the field programmable gate array
platform, Proceedings of ION GNSS 2006, Forth Worth, Texas, 26-30 September, 2222-2231.Hidalgo JI, Fernandez F, Lanchares J, • Sanchez JM, Hermida R, Tomassini M, Baraglia R, Perego R, and Garnica O (2003) Multi-FPGA systems synthesis by means of evolutionary computation, GECCO 2003, LNCS 2724, E. Cantu-Paz et al (Eds.), Springer-Verlag, Berlin, 2109-2120. Massa AJ (2002) Embedded • software development with eCos, Prentice Hall Professional Technical Reference, New Jersey.Meyer-Baese U (2001) Digital signal • processing with field programmable gate arrays, Springer-Verlag Berlin.Mumford P, Li Y, Wang J, Rizos C, and • Ding W (2006) A time-synchronisation device for tightly coupled GPS/INS integration, Proceedings of IGNSS Symposium 2006, Holiday Inn Surfers Paradise, Australia, 17-21July. Nios Community Forum • (2005), eCos for Nios II, http://www.niosforum.com/.
Figure 8. sydney airport bridge and tunnel
Figure 9. Gps/Ins solution bridges the outages under the bridge and in the tunnel
Coordinates March 2008 | 17

standards
over the past 100 years the world’s total population has quadrupled –
from 1.6 billion to 6.6 billion. (Footnote: Population Bulletin, “World Population Highlights: Key Findings From PRB’s 2007 World Population Data Sheet” http://www.prb.org/Articles/2007/623WorldPop.aspx.) In many parts of the world we see growing poverty. We now face increasingly worrisome resource constraints and environmental difficulties, and many informed observers question the planet’s ability to sustain its current human population, despite our technological achievements. (Footnote: “Human Carrying Capacity of Earth”, Gigi Richard, Institute for Lifecycle Environmental Assessment, ILEA Leaf, Winter, 2002 issue. http://www.ilea.org/leaf/richard2002.html)
Managing a “soft” leveling off of population growth and resource consumption will require, among other things, that we make the best possible use of information technologies, and particularly geospatial technologies. Viewed separately, these technologies are advancing rapidly and are being utilized in a growing number of ways. But harnessing them together to meet the challenges of the 21st Century will require a new kind of knowledge, new
policies, new institutional commitments, and imaginative reassessment of our ways of using them.
The Open Geospatial Consortium, Inc. (OGC), founded in 1994, has established a global, commercially driven consensus process for developing geoprocessing interoperability standards. The OGC Interoperability Institute (OGCii), founded in 2006 by OGC directors, promotes research in the area of “interoperability
science,” to address 1) the need for new knowledge related to the convergence of geospatial technology with related enabling technologies, a convergence enabled by geospatial interoperability and 2) the need for coordinated research community input into the OGC standards process.
surging need for interoperability
Individually, geospatial technologies and related supporting information technologies are advancing rapidly, as shown in figure 1.
The problem we face does not concern any inadequacy in the basic information technology infrastructure for geospatial interoperability. It is clear that we can expect adequate progress in all the relevant IT domains we identify as essential. The problem is rather that we still have difficulty using all the various kinds of data and online processing services available to support an integrated scientific methodology. Our wealth of data and the unifying power of interoperable information technologies actually serves to illuminate the traditional scientific and institutional barriers to the construction of the relevant complex models and analysis which are needed to represent and address many of today’s most complex scientific and societal challenges.
Interoperability enables resource sharing
Resolving humanity’s resource and environmental difficulties requires that we learn more about the often complex relationships among a wide range of Earth features and phenomena. To do this, one thing scientists must be able to do is find and use each other’s data and services (online processing services) and integrate these into complex models and
Science of interoperabilityTo address the complex connectedness of Earth phenomena, we need
to study interoperability as a discipline in its own right
David SchellChairman and CEO of the Open Geospatial Consortium, Inc. (OGC) and OGCii, Inc.
Dr D R F TaylorDistinguished Research ProfessorDepartment of Geography and Environmental Studies, Carleton
University, Ottawa, CanadaMember OGCii Board
Figure 1: Information and communication technologies relevant to the geosciences are all increasing in capability and performance. costs are going down.
18 | Coordinates March 2008

Coordinates March 2008 | 19

analyses. Such sharing matters not only for cross-disciplinary studies, but also for longitudinal studies, independent verification of results, and collaboration on collection of expensive shared data sets and development of shared Web services. Such sharing is enabled to a large degree by the OpenGIS® Implementation Specifications developed by the OGC in cooperation with other standards organizations. These specifications provide detailed engineering descriptions of open interfaces, encodings and online services that enable diverse systems to operate together in a “loosely coupled” client server environment.
To enable resource sharing, the first step is to simply make data and services available on the web through open interfaces. The next step is to carefully describe the data and services in machine-readable and human-readable metadata that conform to ISO standards. By means of this metadata, the data and services can be registered in online catalogs that make them easily discovered, evaluated and accessed. Fortunately, great progress has been made in the area of metadata and catalogue standards. Products are available that make it relatively easy to develop “application schemas” based on ISO standard metadata schemas, and catalog products are available that implement the OGC’s OpenGIS Catalog Services – Web Implementation Specification. In many cases, these are sufficient to make data, online services and encodings easily discovered, evaluated and used by humans and software using the Web.
addressing complexity
We simply cannot avoid complexity and the growth of complexity as we contemplate and attempt interoperability. We must accept the need for diverse conceptual abstractions, classification schemes, data models, processing approaches and recording methods. We must also accept the compounding of complexity when multiple datasets embodying this diversity are used together. Standards are necessary in managing data complexity, but they may not be sufficient.
Complexity is as dangerous as it is
unavoidable. Like physicists employing mathematical theories in their attempts to describe the cosmic and sub-atomic worlds, geoscientists building computer models of Earth phenomena depend precariously on the accuracy of their data and the validity of their assumptions. The artifacts of modeling can, sometimes, be mistaken for observations of reality. Other tools like finite element analysis and Fourier transformation that derive much of their utility from computers underwent rigorous community review as they became common tools in the science and engineering toolbox. We unavoidably delve deeper into abstractions as we explore complex relationships between environmental factors, and we need ways of determining whether our inferences and conclusions are valid. Consciousness about the need for validation and the hazards of abstraction compels us to study interoperability.
To address the complex connectedness of Earth phenomena, we need to study interoperability as a discipline in its own right. We need to look for basic principles and practices that can direct our efforts to converge different application domains and to converge geomatics with computer modeling, semantics, high performance computing and other technologies.
Consider, for example, climatology. Knowledge about climate change is of the utmost importance, and climatology is a multidisciplinary field. Geospatial data includes temporal and spatial information about atmospheric gas and particulate distributions and circulations, terrestrial radiation and absorption patterns, weather regimes, bolide impact studies, plant distributions, industrial plant distributions, and data developed by hydrologists, paleoclimatologists, sedimentologists, bathymetrists, oceanographers, demographers and others. Climatology is heavily dependent on computer models, and the computer models need to assimilate many of these diverse kinds of data. Each kind of data has peculiar characteristics and limitations. In many cases, the limitations need to be quantified in statistical parameters within the models. Understanding geomatics and geoprocessing interoperability in the contexts of modeling, semantics,
high performance computing and other technologies is clearly of great importance in this context.
Furthermore, getting and using Earth science data involves other considerations besides accuracy and validation. The semantic facilities for interdisciplinary sharing of diverse spatial resources, and the digital rights facilities for such sharing, for example, must smoothly transcent the technical boundaries of Web resources such as search tools, sensor webs, grid computing, location services, etc. And all of these must be harnessed in making huge volumes of data and services accessible to modeling and simulation tools. Together, these challenges demand that we embark on a concerted global effort to study the interoperability-enabled convergence of modeling, semantics, high performance computing and other technologies that together might support the fullest possible use of geospatial data and services in the rapidly evolving ICT environment.
oGcii
Commercially derived interoperability requirements have been the main drivers shaping the evolution in the OGC of the global standards that are used by both practitioners and researchers. Commercially derived interoperability requirements are a great boon to researchers, but they may produce standards that meet only a subset of the interoperability requirements of studies of complex Earth phenomena. Standards developers must, by definition, seek “common denominator” approaches, approaches that are “as simple as possible” for good practical reasons. However, this goal frequently runs counter to the need to have standards that are “as complex as necessary” to maintain rigor in scientific specialties.
The OGC Interoperability Institute seeks to coalesce interest groups who have a stake in these issues, with the intention of focusing the research community’s interoperability requirements for insertion into the commercially driven standards process and also focusing attention on the need to make geospatial interoperability the subject of concerted study.
20 | Coordinates March 2008

given us no indication that they would not be helpful to us if we asked.”
Street View is an addition to Google’s already popular maps service, which allows visitors to click on a location and see a 360-degree view of the spot. The feature has raised concerns about privacy after people have been pictured – their faces clearly visible – being arrested, sunbathing, and urinating in public.
So far streets and other locations in about 30 major American cities, including Chicago, Los Angeles, New York and San Francisco, have been photographed. Google has not said whether it intends to expand the feature to the UK.
The Pentagon’s letter comes just days after it was reported that protesters used satellite imagery from Google Earth to gain access to the roof of the Houses of Parliament in London.http://technology.timesonline.co.uk/tol/news/tech_and_web/article3503624.ece
Google exposed!
In FocUs
Does Google have
multiple standards?
the Pentagon has banned Google from taking photographs and video
footage of US military bases after images showing important security features of a base in Texas appeared on the company’s website. The Defence Department’s ultimatum came after images showing entry gates, barriers and buildings within the Fort Sam Houstan base, in Texas, were posted on a section of Google’s site which offers panoramic street views of different locations.
Google later said its decision to request access to the base – which had been approved – was a mistake.
In a letter to all Defence Department bases and installations in the US, the Pentagon said that providing 360-degree views of defence facilities could offer sensitive information to potential adversaries and in turn endanger staff.
Air Force Gen. Gene Renuart, chief of the US Northern Command, wrote that in this case the photographs – which were taken by a camera mounted on a vehicle dispatched by Google – showed “where all the guards are, how the barriers go up and down, and how to get in and out of
buildings. I think that poses a real security risk to our military installations,” he wrote.
It was not clear from the letter why Google had been given permission to get inside and photograph the base.
In a statement, a Google spokesperson said: “It is against our policy to request access to military installation for the purpose of capturing imagery in Street View.” Once contacted by the military, Google quickly took the images down, the spokesperson added.
General Renuart said that after it had been given access to the base, Google took “panoramic images of the area with roof-mounted recording equipment. These images were placed on the internet for public access.”
He said that the ban was not intended as an attack on the search firm, but indicated the military’s concern about the secondary effects of an otherwise useful technology.
“Google was very appreciative of us letting them know that we had a concern,” he said. “They understand the security implications, and they have
the street view of the entrance to Fort sam houston continues to be available on Google Maps, as it is taken from a public street. Images from within the base however, have been removed.
Coordinates March 2008 | 21

MappInG
how would the world look like if you were standing on an arbitrary
point on earth? It is not easy to imagine, how a randomly chosen location would look like since most pictures that come into our mind are somewhat special: our home, Piccadilly Square, a picture from National Geographic, or a photo that had been taken on top of a famous summit.
In order to get an unbiased view of the world the following attempt is being made: each of the latitude and longitude integer degree intersections in the world are visited, pictures are taken at each location, stories about the visits are collected and posted at a website. Altogether there are 64,442 intersections – let us call them “degree confluences” since these are the meeting places of latitude and longitude degree lines. 21,543 confluences – almost exactly one third (33.4%) are on land. Ignoring those confluences without view of land and after thinning out the poles
region which has an impropriate density of degree intersections, still 16,194 confluences are considered as worthwhile visiting – in the following denoted as “primary confluences”.
Standing on any point on Earth, there is always one confluence within 79 km radius. Typically, confluences are about 100 km apart. Using the WGS84 system that includes the mathematical GRS80 ellipsoidal model
of the Earth we find that the distance between degrees of latitude varies from 110.57 km at the equator to 111.69 km near the poles. The distances between longitude lines continuously decrease from 111.32 km at the equator towards the poles. However, the locations are reasonably well equidistributed for representing the earth, but also creating a huge task for reaching them. This is in particular the case, because the confluence locations go against all human infrastructures.
The pictures and stories are collected at the project website www.confluence.org. One of the project’s principles is to keep the confluence points as they are. Any changes made by visitors – e.g. leaving souvenirs, or even placing markers, sign posts, cairns is considered as polluting of the confluence and visitors are encouraged to follow the policy “take nothing but pictures, leave nothing but footprints”.
Visiting the confluences
It all began in February 1996 when the US-American citizen Alex Jarrett used his new hand-held GPS receiver in order to reach the nondescript location 43°00’00”N 72°00’00”W. After bicycling 16 km and a bit of a hike he was able to exactly locate and document the spot. An then he posted his pictures of the confluence to a website that showed some snow covered trees of New Hampshire’s winter. From there snowballing began. Alex visited another confluence in May of the same year, in the following year the number of visits doubled to 4. Other people joint the project quadrupling the number of visits each year,
Sampling the worldThis article describes an ongoing project that has the goal to visit the degree intersections of
each latitude and longitude on land, or within sight of land, around the world documenting the
visit with photographs at each location and publish them on the Degree Confluence website
Rainer MautzLecturer and researcher in Engineering Geodesy at the Swiss Federal Institute of Technology Zurich.
www.geometh.ethz.ch/people/rmautz
Figure 1: total number of degree confluence point visits for each month since 1996. the upper curve shows all visits, the lower curve only first successful visits to primary confluences.
22 | Coordinates March 2008

so that in 2001 the tremendous number of 1513 postings had been reached. Since then, progress continued at a constant rate between 1000 and 2000 postings each year. Figure 1 shows that the total number of confluence visits each month has been approximately at a constant
level for the last 6 years. Clearly, there is an obvious yearly cycle with a summer-peak and a winter low. Figure 2 verifies the tendency to visit confluences in summer is twice as high as in winter. Apparently the northern hemisphere with its Lion’s share
of confluences attracts more confluence hunters – causing a summer peak.
Even though the total number of visits hasn’t changed, progress towards the project goal has in fact slowed down. After taking revisits out of the statistic in
Figure 1, we find that the actual rate
of first conquers has halved within the last 5 years. Figure 3 shows that more and more postings tend to be revisits – bringing the fraction of first visits down to 30% from initially 100%.
The project progress differs largely in from country to country. As can be seen from Figure 4 and 5, initially all of the world’s first visits had been occurred in the USA. The passion for confluencing reached Europe in 2001 and Russia in summer 2004. From Figure 5 it is witnessed how quickly Germany (as a comparatively small country) was captured almost totally within one single year. The USA still remains 25% incomplete due to remote Alaska. Densely populated countries such as China and India find more and more enthusiasts –now being finalised by 40% they have overtaken the world average in terms of reaching completeness. However, huge remote unpopulated areas such as the Himalaya region in China and the
Figure 2: total number of confluence visits for each calendar month in red. Visits occurred on the northern hemisphere are in black.
Figure 3: Fraction of first visits to primary confluences.
Figure 4: number of first visits to confluence points each month in the world, Usa and russia.
Figure 5: Fraction of visited confluences in some selected countries.
Figure 6: total number of visits each day of the week.
Coordinates March 2008 | 23
Siberian tundra in Russia will prevent those countries completion for quite a while. Confluencing tends to be a hobby for the weekend when twice as many visits occur compared to weekdays, see Figure 6.
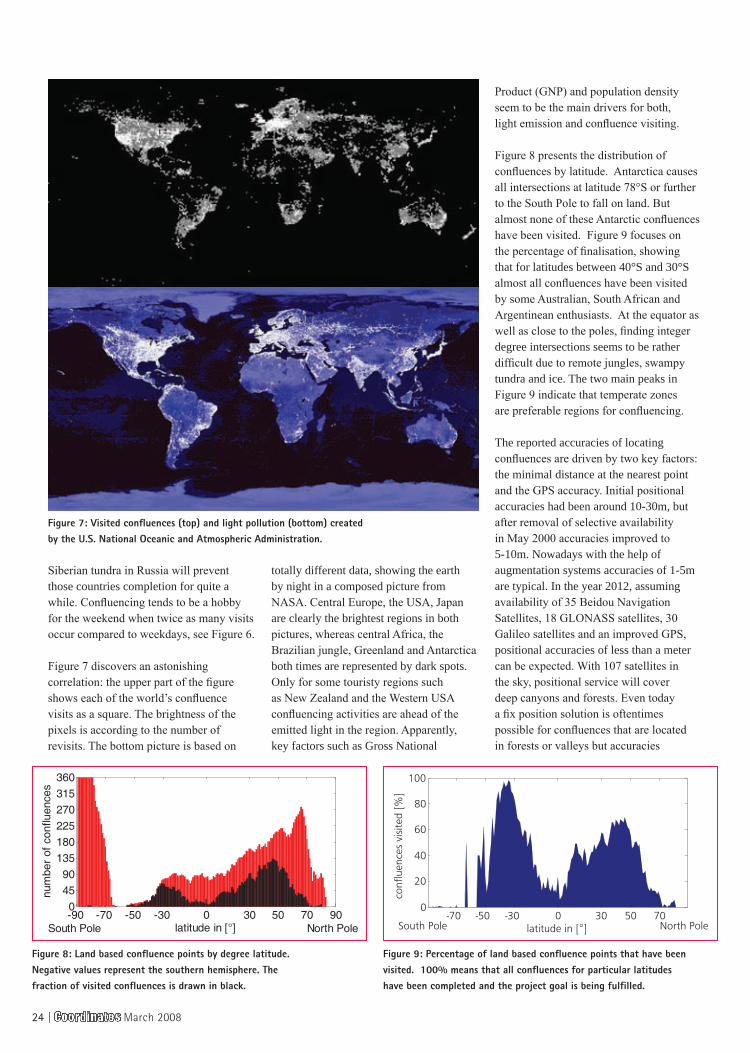
Figure 7 discovers an astonishing correlation: the upper part of the figure shows each of the world’s confluence visits as a square. The brightness of the pixels is according to the number of revisits. The bottom picture is based on
totally different data, showing the earth by night in a composed picture from NASA. Central Europe, the USA, Japan are clearly the brightest regions in both pictures, whereas central Africa, the Brazilian jungle, Greenland and Antarctica both times are represented by dark spots. Only for some touristy regions such as New Zealand and the Western USA confluencing activities are ahead of the emitted light in the region. Apparently, key factors such as Gross National
Product (GNP) and population density seem to be the main drivers for both, light emission and confluence visiting.
Figure 8 presents the distribution of confluences by latitude. Antarctica causes all intersections at latitude 78°S or further to the South Pole to fall on land. But almost none of these Antarctic confluences have been visited. Figure 9 focuses on the percentage of finalisation, showing that for latitudes between 40°S and 30°S almost all confluences have been visited by some Australian, South African and Argentinean enthusiasts. At the equator as well as close to the poles, finding integer degree intersections seems to be rather difficult due to remote jungles, swampy tundra and ice. The two main peaks in Figure 9 indicate that temperate zones are preferable regions for confluencing.
The reported accuracies of locating confluences are driven by two key factors: the minimal distance at the nearest point and the GPS accuracy. Initial positional accuracies had been around 10-30m, but after removal of selective availability in May 2000 accuracies improved to 5-10m. Nowadays with the help of augmentation systems accuracies of 1-5m are typical. In the year 2012, assuming availability of 35 Beidou Navigation Satellites, 18 GLONASS satellites, 30 Galileo satellites and an improved GPS, positional accuracies of less than a meter can be expected. With 107 satellites in the sky, positional service will cover deep canyons and forests. Even today a fix position solution is oftentimes possible for confluences that are located in forests or valleys but accuracies
Figure 7: Visited confluences (top) and light pollution (bottom) created by the U.s. national oceanic and atmospheric administration.
Figure 8: land based confluence points by degree latitude. negative values represent the southern hemisphere. the fraction of visited confluences is drawn in black.
Figure 9: percentage of land based confluence points that have been visited. 100% means that all confluences for particular latitudes have been completed and the project goal is being fulfilled.
24 | Coordinates March 2008

Coordinates March 2008 | 25
NRSA Data Centre National Remote Sensing AgencyDepartment of Space, Balanagar Hyderabad - 500 037Phone + 91-40-23884423/22/25 Fax + 91-40-23878158/23878664Email [email protected]
Our Thrust Areas
Applications• Agriculture&SoilResources• Water,irrigation• ForestryandEcology• Landuse• Oceanography• InfrastructurePlanning• UrbanResourceInformationSystem
Disaster support and environment • Supporttowardsdisastermitigation• Environmentimpactassessment
Technology• Deploymentofsatellite/groundbasedsystems
fordatareceptionandprocessingfromIndiansatellitesanywhereonglobe
• Satelliteandaerialdataservices
Capacity building• Training&education
reachingpeoplethroughremotesensing
One stop facility for…
• Dataproductsfrommulti-satellitesystemsfordiverse needs
• Aerialservices,photographyanddigitalmapping
• Nearrealtimedecisionsupportfordisastermanagement
• End-toendandcosteffectivesolutionformappingandmanagementofnaturalresources
• Timelyinformationondynamicthemes
• TraininginRemoteSensing,Geoinformaticsandalliedfields

are low due to shading of satellites.
Figure 10 shows how close confluence visitors were able to reach their target. The maximum at 5m correlates well with the positional accuracies for current hand held GPS receivers. The other peaks at 10m, 20m and 30m are caused by rounding and imprecise reporting.
What confluence has most unsuccessful attempts?
36°N 112°W, Arizona, USA has 7 unsuccessful attempts due to its location in the Grand Canyon. This point in the National Park is tempting for many visitors, who then fail 200m from the goal at almost vertical Coconino Sandstone. The second rank is taken by confluence 41°N 112°W near Salt Lake City in Utah with 5 attempts. The salt march of the Great Salt Lake forced five visitors to abandon their mission.
Which confluences had most visits?50°N 0°, England, 60 km north 1) of London: 21 visits. 37°N 122°W, California, 75 km 2) south of San Francisco: 19 visits.40°N 105°W, Colorado, 25 km 3) north of Denver: 16 visits.
Expectedly, these frequently visited confluences are located close to megacities and easily accessible.
Which confluence had most visitors?
48°N 9°W Southern Germany – 538 visitors within 13 visits. A teacher managed to bring 470 students of a school.
What are the highest confluences?1) 30°N 81°E, Nepal 5870m
(not yet visited)2) 33°N 80°E, Tibet, China 5836m
(visited on 29-May-2005)3) 34°N 82°E, Tibet, China
5805m (not yet visited)
Unfortunately, the most reliable and exact source for altitude data today, the SRTM 90m survey, does not provide information for this area. Therefore Google Earth – a less reliable elevation data source – was used, introducing an uncertainty about the ranking of these confluences. So the ranking will stay a mystery until these points have actually been reached.
What are the highest successful confluence visits?1) 33°N 80°E,
Tibet, China 5836m (visited on 29-May-2005, 11-day hitch & hike trip)
2) 30°N 90°E, Tibet, China 5587m (visited on 20-May-2004, 6-day exhausting hike)
3) 18°S 69°W, La Paz, Bolivia
5170m (visited on 21-May-2007 3-day drive & hike)
What is the lowest confluence?
30°N 27°E, Matrūh, Egypt -83m (visited on 04-Dec-2004)
Incomplete visits
Imagine that you need to explain to a landowner in Kiswahili what the meaning of visiting integer degree intersections is – in particular if your conversational partner has never seen a GPS receiver nor a map either.
In one out of three visits, the actual confluence location could not be reached due to obstacles like trees, houses, fences, dogs, rivers, cost lines, swamps, ice, cliffs, legal matters, heat, dehydration, exhaustion, laziness, time pressure, breakdowns, land mines, broken vehicles, miring, dead ends, confusion, spoilers, impatience, underestimation, missing daylight, empty batteries, broken GPS, altitude sickness, mosquitoes, radioactivity, military areas, cultural differences, language barriers, policemen, monetary claims, exorbitant prices, landowners, missing stamina or unbearable looks of bewilderment. According to the rules of the confluence project, visits with a minimal distance of more than 100m are regarded as incomplete. 9% of all submitted visits are stated incomplete, but the fraction of unreported attempts may well be over 20%, since the willingness of publishing own failures is usually low.
Figure 10: reported minimal distances. distances over 40m are not shown. the median is 7 m, the average is over 635 m due to some outliers.
Figure 11: reasons for incomplete visits. sample size is 300 out of 1106 incomplete attempts total.
26 | Coordinates March 2008

to the project goal are waiting to be reached. Currently, the rate of first visits to primary confluences is 1-2 a day, or 500 a year. Assuming a linear trend, the last confluence should be visited in 22 years, i.e. in the year 2030. However, when it comes to finish the last 1%, I predict a clear slowdown: as can be seen an asymptotic completion for individual countries from Figure 5 this may well be valid for the whole world. Imagine that the very last unvisited intersections may need special permission due to restricted areas or they are just extremely unattractive for a visit. This fact could postpone a completion beyond the year 2050.
All data was obtained from the website confluence.org using a short Matlab script. The html of all visits was downloaded by the command urlread(‘http://www.confluence.org/confluence.php?visitid=1’),
where the variable “visitid” was looped from 1 to 15,000. The relevant data such as latitude, longitude, date, accuracy etc was then extracted using regular expressions (regexp).
references
Mautz, R.(2006) Sampling the Earth Surface - What Does Our World Really Look Like? Coordinates - Positioning, Navigation and Beyond, No. 3, pp. 8-11, 2006
NASA Website, Figure 7: http://earthobservatory.nasa.gov/Newsroom/BlueMarble/
Confluence Website: http://www.confluence.org
Why do visitors give up? The reported motives for incomplete visits are given in Figure 11. This survey shows that difficult terrain is the main reason for capitulation (29%), in particular dense
picture 1: 47°s 168°e stewart Island, new Zealand: we advanced only 3km a day through dense primary forest and had to return 3km from the target.
picture 2: 47°n 9°e Glarus, switzerland: the confluence is located right on the top of a mountain rage at 2915m altitude. 90m from the point I considered further climbing as being too unsafe.
picture 4: 44°n 91°e Xinjiang, china: 11km from the objective the rear bicycle rack broke.
picture 3: 42°n 60°e da oguz, turkmenistan: 2.5 km from the point I realised that the target is not located in Uzbekistan but in turkmenistan. the trip ended at the border fence. Further advance was too risky without a proper visa.
vegetation, slopes and rocks prevent explorers to reach their goals. Another 18% fail to submit their visit correctly. 13% get into time trouble, 11% don’t get permission to access the confluence, 6% seem just not serious about their attempt and the rest is caused by weather conditions, technical problems and dangers. Consequently, disappointment can be avoided
observing the following rules:1.) Study land use and topography.
Determine distance from the nearest town, road, track and trail.
2.) Study the submission requirements at the confluence website. 3.) If your map shows your confluence being located in the water, organise your ship prior to arrival, successful swims (see 55°N 24°E) are rare exceptions. 4.) Be an early bird – you may run out of daylight as it always takes longer as expected.5.) Bring a printed letter informing landowners about the project – authorities prefer printed matters. 6.) Check the weather forecast. Flooding, ice and heat are the major reason for disappointment.7.) Bring a residual camera and GPS receiver including spare batteries. Heat, dust, salt, humidity and ice increase the chance of a technical problem.
Picture 1-4 show the author’s unsuccessful attempts of reaching confluence points in various countries.
When will the project get finished?
At the time of writing 10,970 unvisited primary confluences out of 16,194 that belong
Coordinates March 2008 | 27

Positioning by GPS can be derived today with a precision of a few
millimeters. A GPS receiver determines the distance between the electrical phase center of its antenna and the phase center of a GPS satellite’s transmitting antenna as a pseudo-range or a carrier phase observation. It is well known that the phase center of the antenna is not a stable point.
For each GPS receiver's antenna the phase center changes with respect to the elevation angle and azimuth of the incoming satellite signal (Rothacher et.al., 1995). Different antenna calibration models are given in general by a set of antenna offsets with respect to the mechanical reference point and a list of variation values that help a user to refer to the ground points under determination.
Knowing Phase Center Variations (PCVs) is especially important in case different antenna types are used at the end points of a baseline. Mixing antennas usually happens in GPS regional and permanent networks like national networks, IGS and EPN. An uncalibrated antenna will certainly introduce errors that combined with other error sources result in significant erroneous point estimations, growing on long baselines (Mader
1999, Fotiou and Pikridas 2006). Even if identical antenna types are used the effects of PCV values do not cancel out for long GPS baselines. This is due to the earth curvature that causes elevation differences and therefore common satellites are seen at different elevation angles by the end points of a baseline.
In order to overcome the above problems various calibration models have been generated and used by the IGS community, namely the relative and more recently the absolute antenna calibration models (Schmid et al., 2005).
relative calibration
The relative phase center variation models are based on the assumption that the Alan Osborne antenna type
Aristidis FotiouProfessor at the Department of Geodesy and Surveying. Aristotle University of Thessaloniki, [email protected]
Christos PikridasAssistant Professor at the Department of Geodesy and Surveying. Aristotle University of Thessaloniki, Greece.
Miltiadis ChatzinikosPhD Candidate, Msc. in GeoInformatics. Aristotle University of Thessaloniki, [email protected]
GPS antenna: from relative to absoluteApplication to a Greek regional network.
16˚
16˚
18˚
18˚
20˚
20˚
22˚
22˚
24˚
24˚
26˚
26˚
28˚
28˚
34˚ 34˚
36˚ 36˚
38˚ 38˚
40˚ 40˚
42˚ 42˚
16˚
16˚
18˚
18˚
20˚
20˚
22˚
22˚
24˚
24˚
26˚
26˚
28˚
28˚
34˚ 34˚
36˚ 36˚
38˚ 38˚
40˚ 40˚
42˚ 42˚
16˚
16˚
18˚
18˚
20˚
20˚
22˚
22˚
24˚
24˚
26˚
26˚
28˚
28˚
34˚ 34˚
36˚ 36˚
38˚ 38˚
40˚ 40˚
42˚ 42˚
AUT1
LEMN
MATE
RLS
PRKV
NOA1
TUC210mm
16˚
16˚
18˚
18˚
20˚
20˚
22˚
22˚
24˚
24˚
26˚
26˚
28˚
28˚
34˚ 34˚
36˚ 36˚
38˚ 38˚
40˚ 40˚
42˚ 42˚
SPAN
16˚
16˚
18˚
18˚
20˚
20˚
22˚
22˚
24˚
24˚
26˚
26˚
28˚
28˚
34˚ 34˚
36˚ 36˚
38˚ 38˚
40˚ 40˚
42˚ 42˚
VLSM
16˚
16˚
18˚
18˚
20˚
20˚
22˚
22˚
24˚
24˚
26˚
26˚
28˚
28˚
34˚ 34˚
36˚ 36˚
38˚ 38˚
40˚ 40˚
42˚ 42˚
16˚
16˚
18˚
18˚
20˚
20˚
22˚
22˚
24˚
24˚
26˚
26˚
28˚
28˚
34˚ 34˚
36˚ 36˚
38˚ 38˚
40˚ 40˚
42˚ 42˚
Fig 1: differences in the horizontal component caused by the transition from relative to absolute pcVs.
Gps
28 | Coordinates March 2008

AOAD/M_T has been approved of being the “Zero” antenna. This antenna type forms a standard with elevation dependent variations set to zero referring to a mean fixed offset. PCVs for a calibrating antenna can be determined using short-baseline field measurements (Rothacher et.al., 1995). Thus for each antenna type correction values were adopted relative to the external or mechanical antenna reference point (ARP, MRP). A database of relative calibrated antenna types has been generated with free access to everyone. The drawback is that the corrections are dependent on the zero/reference antenna and that PCVs at low elevations are not reliable due to the increment of noise and multipath in measurements below 10 degrees (Mader 1999).
Combining GPS with other space-geodetic techniques becomes difficult in case of unmodeled systematic errors due to improper GPS antenna calibration models. As a consequence scale differences have been seen in GPS reference frames. Due to the above mentioned disadvantages relative models can no longer satisfy the increasing accuracy requirements.
Until November 2006 relative elevation-dependent PCVs were applied within the IGS and EPN. After that date (GPS week 1400) the IGS has adopted the absolute PCVs for its routine generation of precise orbits and station coordinates. In IGS-Mail 5438 (2006) a new file with absolute antenna models, named igs05_1390.atx, was made available to the GPS community. Ever since several updates of this file were followed. The EPN started to use absolute antenna models at the same time with IGS.
absolute calibration
The absolute calibration antenna models have been developed by the Geo++ company located in Garsben - Germany and a group of researchers from the University of Hannover (Wübbena et al. 2000, Völksen and Menge 2002). Absolute antenna offsets and PCV values are determined by means of a robotic
system which include azimuthal values and elevations down to 0◦. The robot carries out fast rotations on different axes increasing the efficiency of the method. An advantage of this technique is the determination of a 3D offset and PCVs from 0◦ to 90◦ elevation angles with high precision and accuracy. Moreover the whole process takes place in an almost multipath - free environment. A complete set of absolute PCVs for the known tracking antennas is nowadays available.
studying the impact of absolute versus relative calibration models
In order to estimate the impact of switching from relative to absolute calibrated antennas, a regional network of nine GPS stations was processed and adjusted. Eight of the selected stations are located in Greece and one station in Italy: AUT1 in Thessaloniki, NOA1 in Athens, TUC2 in Crete island, LEMN in Limnos island, PRKV in Lesvos island, RLS in Achaia, VLSM in the island of Cephalonia, SPAN in Lefkada island and the IGS/EPN station MATE in Matera (Italy). Four of the above stations (AUT1, NOA1, TUC2, MATE) are part of the EUREF GPS Permanent Network (EPN), (Bruyninx, 2004) while the rest five stations belong to the National Observatory of Athens Permanent GPS Network. It
should be noted that the antennas types of the test network were LEIAT504 (AUT1, NOA1, TUC2), LEIAX1202 (RLS, VSLM), LEIAX1202GG (LEM, PRKV, SPAN) of Leica Geosystems and TRM29659.0 (MATE) of Trimble.
The Bernese GPS Software v5.0 (Dach et al., 2007) was used to process the data. The standard method was based on the script file RNX2SNX with slight modifications (Chatzinikos et al., 2007). Some basic options of the used processing strategy should be pointed out:
IGS orbits and pole information• 10o of elevation mask• Niel mapping function for the • tropospheric refractionOne tropospheric parameter • for each hour MATE station kept fixed• Strategy baseline selection: shortest• Fix all phase ambiguities•
The time period of GPS observations covers seven days: 190 GPS day to 196 GPS day, 2007. Daily solutions of the GPS network were processed first and the multi-session solution for the whole period was followed.
The impact on point positioning from relative to absolute calibration antenna models was studied by coordinate comparisons carried out by two different network solutions where MATE station kept fixed:
16˚
16˚
18˚
18˚
20˚
20˚
22˚
22˚
24˚
24˚
26˚
26˚
28˚
28˚
34˚ 34˚
36˚ 36˚
38˚ 38˚
40˚ 40˚
42˚ 42˚
16˚
16˚
18˚
18˚
20˚
20˚
22˚
22˚
24˚
24˚
26˚
26˚
28˚
28˚
34˚ 34˚
36˚ 36˚
38˚ 38˚
40˚ 40˚
42˚ 42˚
16˚
16˚
18˚
18˚
20˚
20˚
22˚
22˚
24˚
24˚
26˚
26˚
28˚
28˚
34˚ 34˚
36˚ 36˚
38˚ 38˚
40˚ 40˚
42˚ 42˚
AUT1
LEMN
MATE
RLS
PRKV
NOA1
TUC210mm
16˚
16˚
18˚
18˚
20˚
20˚
22˚
22˚
24˚
24˚
26˚
26˚
28˚
28˚
34˚ 34˚
36˚ 36˚
38˚ 38˚
40˚ 40˚
42˚ 42˚
SPAN
16˚
16˚
18˚
18˚
20˚
20˚
22˚
22˚
24˚
24˚
26˚
26˚
28˚
28˚
34˚ 34˚
36˚ 36˚
38˚ 38˚
40˚ 40˚
42˚ 42˚
VLSM
16˚
16˚
18˚
18˚
20˚
20˚
22˚
22˚
24˚
24˚
26˚
26˚
28˚
28˚
34˚ 34˚
36˚ 36˚
38˚ 38˚
40˚ 40˚
42˚ 42˚
16˚
16˚
18˚
18˚
20˚
20˚
22˚
22˚
24˚
24˚
26˚
26˚
28˚
28˚
34˚ 34˚
36˚ 36˚
38˚ 38˚
40˚ 40˚
42˚ 42˚
Fig 2: differences in the vertical component caused by the transition from relative to absolute pcVs.
Coordinates March 2008 | 29

In the first network solution the 1) IGS05 reference frame and the absolute phase centre variation values (file: IGS05_1455.atx) for the GPS antennas were used. In the second solution the IGS05 2) reference frame and the relative phase centre variation model (file: IGS_01.atx) for the GPS antennas were used.
In figures 1 and 2 differences caused by the transition from relative to absolute models in the horizontal and vertical component are shown accordingly. In figure 1 it is clear that latitude is more affected than longitude. For the horizontal component, the difference between the coordinates of the two solutions varied from 1 to 5.5 mm. Almost all GPS stations showed the same horizontal displacement, a strong indication of a systematic error between the two models.
By contrast with the horizontal component the vertical component showed larger displacements, in the range of 8 to 17mm. The largest vertical displacements were found in NOA1, LEMN and PRKV, being of the order of 16mm to 17mm. Although the antenna types of LEMN, PRKV and SPAN were the same (LEIAX1202GG) the respective displacements were not of the same magnitude. Another point that should be underlined is that moving away from the fixed point (in our case MATE) the difference on the vertical component is increasing.
A second comparison should examine the character of the coordinate differences between the two solutions. The similarity transformation model, known as the Helmert transformation, was proved a good choice. The estimations of the seven transformation parameters and the aposteriori rms are given below:
It is obvious that the two solutions reflect a systematic difference and define different coordinate frames with a significant translation.
The presented comparisons show that the use of the more accurate absolute antenna models induce systematic differences with respect to the previous relative models. Therefore the epoch - comparison of GPS campaigns in regional and or global scale must take into account similar systematic effects.
conclusions
The impact of the conversion from relative to absolute PCV antenna models is of great importance in regional and global GPS networks where high accuracy standards are required.
Solutions derived from relative and absolute models reflect a meaningful systematic difference which could be eliminated by proper transformation models like the 3-d Helmert model.
An application to a Greek regional GPS network with baselines up to about 500 km and specific antenna types showed that the difference is mainly a translation, the height component is greater than the horizontal and the displacement grows with the distance from the fixed point. Similar results have also been reported by other researches.
referencesBruyninx C. (2004): The EUREF • Permanent Network: a multi-disciplinary network serving surveyors as well as scientists. Geoinformatics, vol. 7, pp. 32-35.Chatzinikos M, Fotiou A and • C. Pikridas (2007): Estimation of site velocities in Greece and surrounding areas, using permanent GPS station data. Paper presented at 1st International Workshop on “Advances in understanding crustal deformation in Southern Europe using the Global Positioning System”. Sofia, Bulgaria, 3-5 December.Dach R., Hugentobler U., Fridez P., •
Meindl M (Eds). (2007): Bernese GPS software version 5.0. Astronomical Institute,
University of Bern, Switzerland.Dow J.M, Neilan R.E., Gent G. • (2005): “The International GPS Service (IGS): Celebrating the 10th Anniversary and Looking to the Next Decade,” Adv.Space Res. 36 vol.36, no.3, pp.320-326. doi:10.1016/j.asr.2005.05.125.Fotiou A. and Pikridas C. (2006): • GPS and Geodetic Applications, Aristotle University of Thessaloniki, Editions Ziti, Greece (in Greek).IGS-MAIL 5149 (2005): • http://igscb.jpl.nasa.gov/mail/igsmail/2005/msg00071.htmlIGS-MAIL 5189 (2005): • http://igscb.jpl.nasa.gov/mail/igsmail/2005/msg00111.htmlIGS-MAIL 5438 (2006): • http://igscb.jpl.nasa.gov/mail/igsmail/2006/msg00161.htmlMader, G. (1999): GPS Antenna • Calibration at the National Geodetic Survey. GPS Solutions, Vol.3, No.1, pp 50-58. Rothacher M., S. Schaer, L. Mervart, • G. Beutler (1995): Determination of Antenna Phase Center Variations using GPS Data. In: Gendt, G. Dick (Eds.): Special Topics and New Directions, Proceedings of the 1955 IGS Work-Shop, Potsdam, 15-17 May, pp. 205-220.Schmid R., M.Rotacher, D. Thaller • and P. Steingenberger (2005): Absolute phase center corrections of satellite and receiver antennas: Impact on global GPS solutions and estimation of azimuthal phase center variations of the satellite antenna, GPS Solutions, DOI: 10.1007/s10291-005-0134-x.Völksen Ch., Menge F. (2002): • The impact of different antenna calibration models on the EUREF Permanent Network. Euref publication No.12, Ponta Delganda, Azores, 5-8 June, pp. 103-108. Wübbena G., Schmitz M., Menge F., • Boder V., Seeber G. (2000): Automated Absolute Field Calibration of GPS Antennas in Real-Time. Proceedings of the 13th International Technical Meeting of the Satellite Division of the Institute of Navigation, ION GPS-2000, Salt Lake City, Utah, USA, 19-22 September, pp.2512-2522.
Tx = – 39.0 mm Rx = 0.0020 secTy = 116.5 mm Ry = 0.0014 sec Scale factor = – 1.6 ppbTz = 25.0 mm Rz = 0.0030 sec rms = 2.9 mm
30 | Coordinates March 2008

neWsBrIeFs – Gps
India orders over one hundred sIGMa 95 navigation systems
Hindustan Aeronautics Ltd. (HAL) of India has just ordered from Sagem Défense Sécurité (SAFRAN Group) more than 100 SIGMA 95N navigation systems. These systems will be used on the Indian Air Force Sukhoi fighters and the Tejas fighters from the Indian LCA (Light Combat Aircraft) program. SIGMA 95N is a standalone inertial laser gyro navigation system with integrated GPS/Glonass. It brings high-precision navigation and a high degree of operating flexibility to combat aircraft.
Ion 2008 appointments
Dr. Chris Hegarty has been elected as President of ION. He has served as a member of the ION Council for numerous years, was the technical program chair of ION GNSS 2004, general chair of ION GNSS 2005, has presented many papers during ION and other technical events. Dr. Mikel Miller has been elected Vice President.
decline in retreat of Gangotri glacier
Scientists have found a recession in the rate of retreat of Himalayan Gangotri glacier in last three decades. A GPS survey was carried out by G B Pant Institute of Himalayan Environment and Development, which found that the glacier has retreated at a lower rate between 2004 and 2005. The report is claimed to be the first accurate one on glacier retreat measurement. “Between 1935-71, the total recession of Gangotri glacier was 954.14 metres while between 1971-2004, the recession has declined to 564.99 metres,” scientist Kireet Kumar, who led the survey. It has been observed that maximum recession took place along the centreline, followed by the northern portion of the snout.
Gps handsets prices expected to fall
According to ABI Research, wholesale Average Selling Price of GPS-enabled handsets will fall to a price range of $250 from $500 presently by 2010. Chipset manufacturers have solutions to lower
integration costs, and provide significant improvements in accuracy, time-to-first-fix, and reception in indoor environments.
taiwan uses Gps to catch bike thieves
Taiwan police are using the GPS to catch bike and motorbike thieves. Police in Taichung, installed the GPS under the saddles of several bikes and motorbikes and parked them near the railway station to trap potential thieves. http://news.monstersandcritics.com/asiapacific/news/
Internet map of sea level increase
A visit to website http://flood.firetree.net shows the impact of sea level rises from one to 14 metres in one metre intervals. The site uses Google's mapping API and 50 Gbyte of raw data from NASA. One can view the extent of potential flooding for almost anywhere, in some cases to high resolution and detail. The inundation estimates are optimistic in most cases – correcting the inaccuracy would make the consequences of any rise look worse.
Coordinates March 2008 | 31

neWsBrIeFs – IndUstry
topcon and sokkia merge
The merger between Topcon Corporation and Sokkia Co, Ltd, both with corporate headquarters in Japan, was confirmed on 5 February. Both companies are the two largest Japanese manufacturers of survey equipment. Sokkia will become a wholly owned subsidiary of Topcon Corporation.
MobileMapper 6 and proMark 500 by Magellan
Magellan has recently introduced the MobileMapper 6 - a rugged, waterproof, handheld GPS/GIS receiver, fulfilling the requirements for low-cost, professional GIS field data collection. It is expected to particularly appeal to forestry and other natural resource organizations, oil and gas, agriculture, utilities,
government agencies, and businesses large and small that can collect GIS data with 2-5 meter accuracy in real-time with SBAS corrections. ProMark 500, a
dual-frequency GNSS receiver from Magellan processes GPS, GLONASS and SBAS signals to offer land surveyors fast, real-time centimeter-level accurate surveying. www.pro.magellangps.com.
Guidance system for army program
Integrated Guidance Systems LLC (IGS LLC), a Honeywell International and Rockwell Collins joint venture, has been awarded a subcontract to provide the deeply integrated navigator for the U.S. Army Non-Line of Sight-Launch System (NLOS-LS) program.
It calls for developing guidance systems for the NLOS-LS Precision Attack Missile (PAM) and Container Launch Unit (CLU). www.rockwellcollins.com
sprinter 50 from leica Geosystem
Leica Sprinter 50 is a multifunctional levelling tool which is compact and lightweight, yet easy to use, and error free, electronic level. The user can just aim, focus, and measure by pressing one button displaying the data instantly. Misreadings are eliminated, and error
reducing functions, such as the tilt sensor, prevent the system from measuring if the user operates outside the compensator range.
erdas IMaGIne 9.2 by leica Geospatial Imaging
Leica has released ERDAS IMAGINE® 9.2, industry’s leading
collection of software tools designed to manipulate, process and understand
imagery.www.leica-geosystems.com
Utilities solutions to small providers and electric co-ops
Intergraph Corp. shall be offering the benefits of its utility outage management, workforce management and GIS technology to rural and small utilities and electric cooperatives through packaged solutions for the smaller utility market. It is now able to provide utilities of all sizes - from the smallest to the largest - with end-to-end solutions for the design and operations of the utility distribution network. www.intergraph.com.
pcI Geomatics India launched
PCI Geomatics has launched of a new international office in India. It will be led by Dr. Ashok Kaushal, Director and Country Manager, and, under special license, will offer PCI Geomatics technology, services and solutions for both the private and government sectors. www.pcigeomatics.com
Infotech awarded new catalist framework agreement
Infotech Enterprises has been awarded by OGCbuying solutions, the Government's leading procurement services organisation for the UK to provide a broad remit of
Geospatial Information Services and Solutions for public sector customers under the new Catalist GISS framework agreement. www.infotech-enterprises.com
hemisphere Gps introduces outback s3
Hemisphere GPS has recently introduced Outback S3™ representing the next generation in Outback Guidance® products by Hemisphere GPS. It combines the most popular features of both the market proven Outback S2™ and the Outback 360™ with the latest developments in Crescent® GPS receiver technology.
nXp launches first Gps chipset following Glonav acquisition
After the acquisition of GPS technology provider GloNav Inc, NXP Semiconductors has announced its first single-chip, Assisted-GPS solution. It is designed for use in both mobile phones and standalone Personal Navigation Devices. NXP claims “the industry's smallest, lowest power, lowest system cost GPS solution”. www.gpsbusinessnews.com
pictometry and aaMhatch sign technology agreement
Pictometry International Corp has signed an agreement with AAMHatch of Australia to expand the coverage area for Pictometry’s patented image capture process into 12 countries. Under the agreement, has expanded its prior exclusive rights to utilize Pictometry’s image capture and processing technology and market image libraries and software in South Africa, Singapore, Malaysia, Thailand, Indonesia, Fiji, Papua New Guinea, East Timor, Brunei, Vietnam, Laos, and Cambodia. www.pictometry.com.
chronos releases trineX
Chronos Technology, the GNSS and RF Microwave components specialist has released TrineX CW27, a self-contained GPS receiver module based on the Nemerix NX3 A-GPS single chip receiver. It utilises a new base band processor and RF front end, the TrineX shall delivers
32 | Coordinates March 2008

superior GPS performance in a small surface mount package that minimizes power consumption, maximizing battery life. www.chronos.co.uk
trimble offers free geocaching application for nokia phones
Trimble has announced the availability of a free, ad-supported version of its Geocache Navigator(TM) application for select Series 60 Nokia devices with integrated GPS capabilities. It is an application that brings geocaching capabilities to the mobile phone and provides real-time access to Groundspeak's geocaching.com, the largest geocache database in the world. Using their GPS-enabled phone, geocachers can seek the caches using a uniquely constructed, radar-like interface that guides them toward their destination. http://www.geocachenavigator.com/video
autodesk enhances Geospatial software solutions
Autodesk, Inc. has announced the latest enhancements in several products; AutoCAD Map 3D 2009, Autodesk MapGuide Enterprise 2009 and AutoCAD Raster Design 2009 software applications build on the solutions' fundamental properties of open data access and interoperability with other design, GIS and IT systems.
optech IlrIs-3d now compatible with Maptek I-site™ studio
Toronto, Canada – Optech has announced that Maptek™ has enabled direct file import functionality of ILRIS-3D open format IXF point cloud data into their I-Site Studio product. ILRIS-3D is a fully portable, laser-based ranging and imaging system for the commercial survey, engineering, mining and industrial markets.
contex awarded Bertl 4-stars
Contex has received BERTL’s “Highly
Recommended” rating for the CRYSTAL
Javad Gnss announces new products and pricing
triumph chip
Is a 17x17 millimeter power-efficient 352-TFBGA chip. It can track GPS, GLONASS, Galileo, QZSS, WAAS, EGNOS, and Compass/Beidou signals.
triumph-4X
To improve the reliability of RTK, some users employ data from more than one base. Along with introducing TRIUMPH-4X, Cluster RTK, or 4x4 RTK has also been introduced, where sixteen baselines are processed in every single RTK measurement.
Victor
Victor is pre-loaded with Tracy field software, which automatically connects to TRIUMPH-1 or TRIUMPH-4X via its internal Bluetooth and guides through field operations.
tracy
A comprehensive field software for Windows Mobile OS to control receivers, automate GNSS post processing surveying tasks etc.
Justin
It is a GNSS data processing software integrated with elaborate spectrum of GIS features. It uses most rigorous and sophisticated techniques of classical surveying and geodetic formulations for baseline and trajectory calculations as well as network adjustments.
G600, CHROMA G600, CHAMELEON G600, and the CHROMA G600 wide format scanners. The rating indicates that the product has been tested and certified as providing exceptional performance and features that offer a lasting return on their investment.
sydney and Melbourne city councils lead the way
Sydney and Melbourne cities of Australia, have embraced Pictometry, Intelligent Images technology. AAMHatch have been commissioned to provide new "true" orthophotography and updated 3D models for the cities. These cities have also purchased Pictometry oblique aerial imagery which has been recently acquired.
honeywell sees acquisitions in 2008, says ceo
Honeywell International Inc will likely make a few acquisitions in 2008, after pulling back from that strategy a year earlier due to high prices, according to CEO of the company. Honeywell International Inc expects to see its strongest revenue growth this year in India, China and the Middle East, but takes a more conservative view on the United States and Europe, the diversified U.S. manufacturer's top executive told Reuters on Tuesday.
class action launched against sirF
Coughlin Stoia Geller Rudman & Robbins LLP, a law firm based in San Diego, has announced that a class action has been commenced in the US District Court for the Northern District of California on behalf of purchasers of SiRF stocks during the period between October 30, 2007 and February 4, 2008. The complaint charges SiRF, its CEO, CFO, Chairman and vice president of marketing with violations of the Securities Exchange Act of 1934.
navteq expands coverage in apac
NAVTEQ has released a 100% coverage map for New Zealand and Thailand.
Detailed coverage, NAVTEQ’s most highly attributed and verified standard is available to 50% of New Zealand’s population in Auckland, Wellington, and Christchurch. The New Zealand map contains a full set of features including points of interest (POI) across approximately 74 categories. Thailand also has a full set of features with 52 categories.
Coordinates March 2008 | 33

neWsBrIeFs – lBs
2.2 million cars in europe have a telematics device
According to Berg Insight, 2.2 million passenger cars in Europe
had an on-board telematics device at the end of 2007. It forecasts that the major breakthrough for telematics in Europe will come with the introduction of the eCall system proposed by the EC, which holds a high probability of becoming a reality in the early 2010s. berginsight.com
orange and nokia sign MoU
Orange and Nokia have signed a memorandum of understanding partnering on value added services such as LBS, maps, mobile advertising and gaming. Nokia will continue to support Orange's Signature device strategy including common applications.
Wayfinder broadens its partnership with MapmyIndia
Wayfinder has announced that its Navigator and the free Earth mapping software are now available with Indian local maps from MapmyIndia. This follows up with the launch of its first Indian off-board navigation service with local wireless operator Bharti Airtel and partnership with MapmyIndia last year.
alK partners with Microsoft to bring live search to its navigation software
CoPilot Live mobile phone navigation system by ALK Technologies will be able to benefit from Microsoft's Live Search™ API. It sends queries to the Live Search via the mobile Internet, providing navigation users with instant access to a vast quantity of location-specific information, which can be previewed and added to an itinerary for spoken and on-screen turn guidance.
Galileo updatestudy on Galileo services consolidation
The European GNSS Supervisory Authority has issued a call for tenders for a study on Galileo service consolidation. The general aim of the project is to conduct a critical review of the current Galileo integrity baseline concept, based on the evolution of integrity requirements for Galileo, and receive proposals for new global Galileo integrity concepts. For details visit: http://ted.europa.eu/udl?uri=TED:NOTICE:039425-2008:TEXT:EN:HTML
parliamentary committee proposal would abolish Gnss supervisory authority
A proposal before the European Parliament’s Industry Committee would abolish the European GNSS Supervisory Authority (GSA), turn responsibility for ensuring the Galileo system’s security requirements over to a new Committee on European GNSS Programs, and establish an Interinstitutional Monitoring Group (IMG) consisting of representatives of the parliament, the European Council’s Presidency, and the European Commission (EC). The proposed actions amending the EC’s draft regulation for deployment and commercial operation of Galileo were tentatively approved at a January 30 committee meeting. The Industry Committee opted for abolishing the European GNSS Supervisory Authority (GSA), which was originally set up
as the licensing authority for the private undertaking within the then-planned public private partnership or PPP. The EC’s regulation would continue the GSA under the direction of the EC’s Directorate-General on Transport and Energy (DG-TREN), with responsibility for security measures, market development, and general assistance to the commission in Galileo matters.
eU nears deal on financing for Galileo project
The European Union is likely to back a taxpayer-financed bailout of its troubled Galileo satellite navigation project after a group of skeptical countries agreed in principle that money could be diverted to salvage the plan. The member countries decided that unused funds originally allocated for farm subsidies and scientific and industrial projects should be earmarked to pay for Galileo and for a technology institute. http://piercing.org.uk/health/eu-nears-deal-on-financing-for-galileo-project-3/
second Galileo spacecraft prepares for launch
GIOVE-B has successfully completed its test campaign and will depart from ESTEC, the agency’s European Research and Technology Centre. The spacecraft will be flown to Baikonur, in Kazakhstan, from where it will be carried into orbit by a Starsem Soyuz/Fregat launch vehicle. The launch is scheduled for 04:16:02 local time on 27 April (00:16 CEST, 22:16 UTC [26 April]).
34 | Coordinates March 2008

FORM IVPlace of publication : New DelhiPeriodicity of its : MonthlypublicationPrinter’s Name : Sonu PrinterNationality : IndianAddress : B 82, Okhla Phase 1, New Delhi
Publisher’s Name : Sanjay MalaviyaNationality : IndianAddress : 499, Shipra Sun City, Indirapuram, GhaziabadEditor’s Name : Bal KrishnaNationality : IndianAddress : 28 A, Pocket D, SFS, Mayur Vihar Phase 3, Delhi - 110096
I, Sanjay Malaviya, hereby declare that the particulars given above are true to the best of my knowledge and belief.
March 1, 2008 Signature of Publisher
sony Gps-cs1Ksp updated camera Gps kit with Google Maps
Sony has announced an updated GPS kit with the GPS-CS1KSP helping display of photos automatically in context of Google Maps. It can also automatically animate trips and the software displays photos in a trajectory to review the trip visually. www.i4u.com/article15066.html
Broadway signs agreement to launch Gypsii into India
GyPSii, the world's leading geo-location and social networking service provider for mobile phones and Internet devices, has recently signed an agreement with Broadway Private Limited, to offer the complete suite of GyPSii services to India. Broadway's hosted server environment GyPSii access to the mobile market and key carriers. It also provides direct access to the content and advertising reach of India Online Netcom. www.broadway.in
satGuide for laptops and desktops launched
SatNav Technologies has recently launched SatGuide, India’s 1st GPS Navigation system for laptops and desktops. SatGuide offers widest range of GPS products to its customers.
Wellington business producing next generation of nZ maps
Having a map of the country usually means having a hand-held book with a street and road index. Terralink, a company from Wellington shall be producing next generation of maps by making a video of every street in the country. For the street camera car to video every street in the country, it will travel 144,000 kilometres and will take about two years to complete. The six roof top cameras record the images at driving speed, matching GPS locations of every street, every house and even every curb. The data shall be commercially available.
new president of the GsdI association
Associate Professor Dr Abbas Rajabifard (Department of Geomatics, University of Melbourne) has been elected as the next President of the
Global Spatial Data Infrastructure (GSDI) Association, a leading international association in the development of spatial information and management. Associate Prof Rajabifard was a member of the GSDI Board and Treasurer of the Association. Abbas teaches and research in SDI and related areas, and is part of Coordinates’ Advisory Team. He was elected Vice-President (President Elect) of the GSDI Association in 2008, becoming President in 2009 at the recent GSDI 10 International Conference and Board meeting in Trinidad in February 2008. This appointment, with his role in the UN sponsored Permanent Committee on GIS Infrastructure for Asia and the Pacific as Vice Chair of Working Group on Spatially Enabled Governments, will enable him to provide international leading in the discipline over the next four years.
Coordinates March 2008 | 35

Jharkhand state in India goes online at the grassroots level
Common service centres would be set up at each of the 4,562 panchayats in the state by soon where villagers can avail services like registration of certificates, filing commercial taxes among others. According to R. S. Sharma, Secretary of IT, 3000 of such centres has already been set up. Use of GIS for digital mapping of districts shall also be done to locate the villages and also to calculate the amount of rainfall an area receives in a year to facilitate irrigation. Water harvesting mapping using GIS shall also be emphasised. www.telegraphindia.com/
Free software powers this GIs
The Indian Institute of Information Technology and Management, Kerala, has launched the State’s first Active Web GIS service in public domain using free and open source software technology. KR Srivathsan, Director of the institute said, Active Web GIS, is to make dynamic geographical information available in a simplified, open Web nterface. www.hindu.com
GIs for Maharashtra and Gujarat
The Science and Technology Park at the University of Pune, India has completed an elaborate GIS mapping of Maharashtra and Gujarat to aid the National Informatics Centre’s pan data-based national mapping programme. The remote-sensing based GIS mapping of these states shall help future drafting of development plans, national level master plans and planning of infrastructure and road network, said the official of the Technology Park. http://timesofindia.indiatimes.com/
private companies gear up to give healthcare a booster dose
With private players foraying into the field, saving lives will be easier now. ‘Dial 100’ service in Mumbai in which Rolta is the major private player that has implemented GIS. This service is provided by the Mumbai police department for emergencies and distress situations. The
Mumbai police receive around 30,000 calls everyday. While these emergency call details are being registered, operators can also quickly locate the police patrol vehicle that is nearest to the reported incident site using data that is continuously transmitted to the control room from GPS units fitted to these vehicles. Now, Rolta is rolling out similar services in Jammu and Kashmir and Rajasthan. Rolta is expecting revenues worth Rs 1,000 crore by the end of March.
Isprs announces Winner of Brock Gold Medal
The International Society for Photogrammetry and Remote Sensing (ISPRS) has announced, Professor Dr Armin
Gruen, Chair of Photogrammetry at the Eidgenössische Technische Hochschule (ETH) Zürich, Switzerland the winner of the ISPRS Brock Gold Medal for 2008. The Medal is donated by the American Society for Photogrammetry and Remote Sensing, and is awarded for an outstanding landmark in the evolution of the photogrammetry, remote sensing and spatial information sciences.
prof roonwal awarded gold medal by Indian Geophysical Union
Prof. G S Roonwal Visiting faculty at the inter University Accelator Centre, New Delhi has been awarded “Dr. H. N. Siddique” Lecture and gold medal by the Indian Geophysical Union.
esrI received “strong positive” rating
ESRI received a Strong Positive rating, the highest possible, from Gartner, Inc., the leading provider of research and analysis on the global information technology industry. ESRI received this rating in the report entitled MarketScope for Public Safety Geographic Information Systems, 2H07 by Bradley Williams and Jeff Vining and published October 31, 2007.
neWsBrIeFs – GIs neWsBrIeFs – reMote sensInG
Iran's space ambitions ride on safir
Iran has successfully recently launched a sub-orbital rocket called Safir (Envoy). The payload that was launched by Safir sent real-time data back to earth from about 250 km. Next, a satellite called Omid (Hope) will be placed in a near-polar orbit satellite, at an altitude of 650 km and will pass over Iran six times every 24 hours.
Geoscience australia decides on resourcesat-1
Geoscience Australia has decided on a Landsat replacement by sourcing data from Resourcesat-1, which is owned and operated by the Indian Space Research Organisation. Officials of Ministry of Resources and Energy say “The US Landsat satellites are not in the best of health; this new source will ensure we can continue to do our business in the unfortunate event that they fail. Resourcesat-1 images shall be similar to Landsat, but with the advantage of more frequent coverage.”
satellite mapping of Vijaywada soon
The Municipal Corporation of Vijayawada shall carry out satellite mapping of the city through an agency in Hyderabad using the pictures provided by the National Remote Sensing Agency. It will help the civic officials to identify the illegal structures. www.newindpress.com/
Monitoring asia-pacific disasters from space
A space-based international Earth observation network to detect and monitor natural disasters in the Asia-Pacific region has been formed with a substantial contribution from Australian science. Called Sentinel Asia, the network of information-delivery websites has its roots in the Australian bushfire tracking system, Sentinel Hotspots, which was developed in 2002 by CSIRO, Geoscience Australia and the Australian Defence Imagery and Geospatial Organisation.
Send your news reports to [email protected]
36 | Coordinates March 2008

Coordinates March 2008 | 37

3rd Indonesian Geo-Information technology exhibition
August 6-9Jakarta Convention centergeospatial-exh.com
14th GIs conferenceAugust 12-13Hochiminh City, [email protected]
septemeber 2008Institute of navigation’s satellite division Ion Gnss 2008
September 16-19, 2008Savannah, Georgia, USAwww.ion.org
the perspectives, the role of surveyors inthe european economy and society17-19, SeptemberStrasbourg, Francewww.geometre-strasbourg2008.eu
carIs 2008September 22 - 26, Bath, United Kingdom www.caris.com/caris2008
november 2008
International symposium on Gps/Gnss 2008 11 - 14 November, Tokyo, Japan [email protected];//www.gnss2008.jp
december 2008
Geoexpo 2008 china 2 - 4 December 2008, Shanghai, [email protected]://www.chinaGeo-expo.com
april 2008Melaha 2008
13-15 April Hurghada, [email protected]
Geo-sIBerIa 2008 April 22 – 24, 2008, Novosibirsk , [email protected] http://geosiberia.sibfair.ru/eng/n
toulouse space show’0822-25 April Toulouse, [email protected]/toulouse_space_show.htm
May 2008Ieee/Ion plans 2007
Co-sponsored by IEEE and Institute of NavigationMay 5-8, 2007Monterey, California, USAwww.plansconference.org
June 2008International conference: “studying, Modelingand sense Making of planet earth”
1 – 6 June, 2008Department of Geography, University ofthe Aegean, Mytilene, Lesvos , Greecehttp://www.aegean.gr/geography/earthconference2008/ en/main_fr.htm
FIG Workshop e-learning11-13 June 2008ITC, Enschede, The [email protected]/fig_elearning2008
august 2008esrI’s 28th annual International User conference
August 4-8, 2008 in San Diego, Californiawww.esri.com
MarK yoUr calendar
YES! I want my
I would like to subscribe for (tick one)
¨ 1 year ¨ 2 years ¨ 3 years12 issues 24 issues 36 issues
Rs.1200/US$80 Rs.2100/US$145 Rs.2700/US$180
First name ...............................................................................................................
Last name.................................................................................................................
Designation .............................................................................................................
Organization ...........................................................................................................
Address......................................................................................................................
.....................................................................................................................................
City.......................................................Pincode ......................................................
State ................................................... Country ......................................................
Phone ........................................................................................................................
Fax..............................................................................................................................
Email ..........................................................................................................................
I enclose cheque no............................................................
drawn on ...............................................................................
dated ..................................... towards subscription
charges for Coordinates magazine
in favour of cGIT.
Sign........................................ Date........................................
Mail this form with payment to:
Coordinates – cGIT28A Pocket D, SFS
Mayur Vihar Phase III
Delhi 110 096, India
If you’d like an invoice before sending
your payment, you may either send us
this completed subscription form and
we’ll bill you, or send us a request for an
invoice at [email protected]
FORM IVPlace of publication : New Delhi
Periodicity of its : Monthly
publication
Printer’s Name : Sonu Printer
Nationality : Indian
Address : B 82, Okhla Phase I, New
Delhi
Publisher’s Name : Sanjay Malaviya
Nationality : Indian
Address : 499, Shipra Sun
City,Indirapuram,
Ghaziabad
Editor’s Name : Bal Krishna
Nationality : Indian
Address : 28 A, Pocket D, SFS,
Mayur Vihar Ph. 3,
Delhi 110096
I, Sanjay Malaviya, hereby declare that the particulars
given above are true to the best of my knowledge and
belief.
March 1, 2008 Signature of Publisher
Media Partners
38 | Coordinates March 2008

Coordinates March 2008 | 39

40 | Coordinates March 2008