a real-time mobile vehicle license plate detection and ...tkjse/13-4/09-ie9722.pdf · a real-time...
TRANSCRIPT

A Real-Time Mobile Vehicle License Plate
Detection and Recognition
Kuo-Ming Hung1,2* and Ching-Tang Hsieh2
1Department of Information Management, Kainan University,
Taoyuan, Taiwan 338, R.O.C.2Department of Electrical Engineering, Tamkang University,
Tamsui, Taiwan 251, R.O.C.
Abstract
In this paper we present a instant and real-time mobile vehicle license plate recognition system
in an open environment. Using a nonfixed video camera installed in the car, the system tries to capture
the image of the car in front and to process instant vehicle license plate detection and recognition. We
utilize the color characteristics of the barking lights to carry out license plate detection. We first detect
the location of the two barking lights in the captured image. Then set license plate detection region
using the probability distribution of the license plate between the two lights. This method can eliminate
any environmental interference during the license plate detection and improve the rate of accuracy of
license plate detection and recognition. Moreover, we use the morphology method Black Top-Hat to
enhance the level of separation of the license plate characters. Experiments show that the system can
effectively and quickly capture the vehicle image, detect and recognize the license plate whether it is in
daytime, nighttime, clear day, raining day or under complicated environment.
Key Words: Real-Time, Wavelet, License Plate, Black Top-Hat
1. Introduction
As the number of automobiles grows rapidly, the
traffic problems increase as well, for example, car theft,
speeding, and running the red light, etc. Due to the above
mentionable traffic control problem, vehicle tracking,
recognition and management has become major topics of
modern traffic control system.
The current vehicle recognition system includes tech-
nique of radio frequency identification (RFID), infrared,
microwave and image recognition. The first three tech-
niques require the installation of transponders on the ve-
hicle. But, in high speed driving, the accuracy rate of de-
tection and recognition is low with the system using tran-
sponder. Usually the system uses a monitoring system to
enhance the accuracy of the system. Meanwhile, there
are still many unsolved problems. For instance, the tran-
sponder could be pirated, and the user’s privacy could be
violated.
In recent years, the vehicle monitoring and manage-
ment system based on vehicle license plate recognition
has matured. Many big parking lots and major street are
using the Charge-coupled device (CCD) to carry on the
vehicle monitoring and management. This system adapts
the image recognition technique. In particular, it focuses
on the search of cars suspected of robbery, theft, etc.
Currently most of the vehicle license plate recogni-
tion (VLPR) system already developed or proposed in
academic field has been focused on motionless vehicles
[1�10]. There has also been some instant VLPR installed
on the road [11,12]. The above mentioned applications
of VLPR are still confined to gate control management.
Rarely has the problem of car theft arrest on the road
been discussed.
The problem rests on that the fixed roadside recogni-
tion system having problem with distance and car speed.*Corresponding author. E-mail: [email protected]
Tamkang Journal of Science and Engineering, Vol. 13, No. 4, pp. 433�442 (2010) 433
Hence it cannot effetely filter out the problematic cars on
the road. On the search of suspectable vehicles, the law
enforcement uses video camera installed on major roads
or patrol cars. This method requires the police officers to
visualize the license plate (LP) and then input the LP in-
formation into the system for inquiry. This is a very ineffi-
cient method. If the VLPR system can be installed on tax-
ies, buses or police cars, then it can quickly identify stolen
cars by instantly detecting and recognizing the car in
front, linking the data to the stolen car database, sounding
alarm and informing the authority. It will not only increase
the efficiency of search for suspectable vehicle but also in-
crease the safety of law enforce officers. But there have
been few systems capable of being installed on the car.
Thus this paper proposes a VLPR system capable of im-
plement on the car adaptable to various environments.
In order to install it on the onboard micro computers,
our system adapts the feature of simple computation. We
use the wavelet transformation [1,2] which requires very
little computation to lower the dimension of the image
and acquire the characteristics of high frequency. After
wavelet transformation, based on the relationship be-
tween frequency and location, we can locate the LP th-
rough statistics on wavelet high frequency coefficients.
After accurately positioning the LP as a subimage,
we filter out the noise and eliminate the shadow variation
from the subimage to get a character positioning with
higher separation. The multilayer neural network is used
to achieve character recognition. We realize instant cal-
culation through three procedures: automatic detection
and capturing of vehicle image; providing low-intensity
calculation; adaptation to complicated background and
noise. The first section of this paper is the description of
background, motivation and introduction. The second
section illustrates the realization method of each compo-
nent of the system. The third section is the system de-
sign. The forth section is experiment result. Finally the
fifth section is discussion.
2. Methodologies
We start by an introduction of the the background
filtering method, followed by LP detection method.
Success of background filtering that can increase the ef-
ficiency of the LP detection. Finally we introduce the
character segmentation and recognition system. To fa-
cilitate illustration, we use the passenger car as model
for our design, but it can be modified to other vehicles.
The resolution of the video camera used is set at 320 �
240 pixels.
2.1 Filtering of Background
On regular roads, various vehicle detection systems
are all subject to interference form other objects, thus
lose its accuracy and detection of the whole mage will be
relatively ineffective. The filtering of the background
with the focus of the detection on the vehicle body is the
key for improving the accuracy.
In the locking-in and following a targeted vehicle, the
picture captured with an on board camera is very compli-
cated. The picture may contain the sky, the buildings, road
signs, street lights and none targeted vehicle, and can’t
use the background filtering method. We use the braking
light with its particular color, which is common charac-
teristic of every car, to position targeted vehicle.
Braking light is an active red light source. Its bright-
ness and color is not venerable from the interference of
other lights. We change the LL image transformed from
wavelet into YUV color format. The Y component is
used to judge the brightness and should be greater than
150. The V component is used to decide if it reaches the
saturation level of light and should be greater than 60.
Those values are fine parameters through experimental
statistics. The search of lights uses the block of 8 � 8 pix-
els. Blocks overlap by 4 pixels. If there are at least 15
qualified Y-components and at least 12 qualified V-com-
ponents, it will be an effective region. A few effective
regions will be marked as a single object through con-
nected components method.
During detection, we may find other red lights be-
sides the target vehicles, e.g. motorcycle, other vehicles
or red lighted signboard. But they can be filtered out
through the following method. First, the distance be-
tween two objects with the same height must be greater
than 60 pixels. Next, the top edges of the two objects
must be close horizontally, no more than 8 pixels in error.
The same must be to the bottom edge.
Because the LP will be too small to be recognized
when the distance to the car in front is over 10 meters, the
width of a vehicle will be at least 60 pixels. And the 2
rear lights of the same vehicle must be of the same level
horizontally. Through matching of the objects, we select
434 Kuo-Ming Hung and Ching-Tang Hsieh
two appropriate ones. Then dissect the picture region be-
tween the two tail lights as the picture for LP detection.
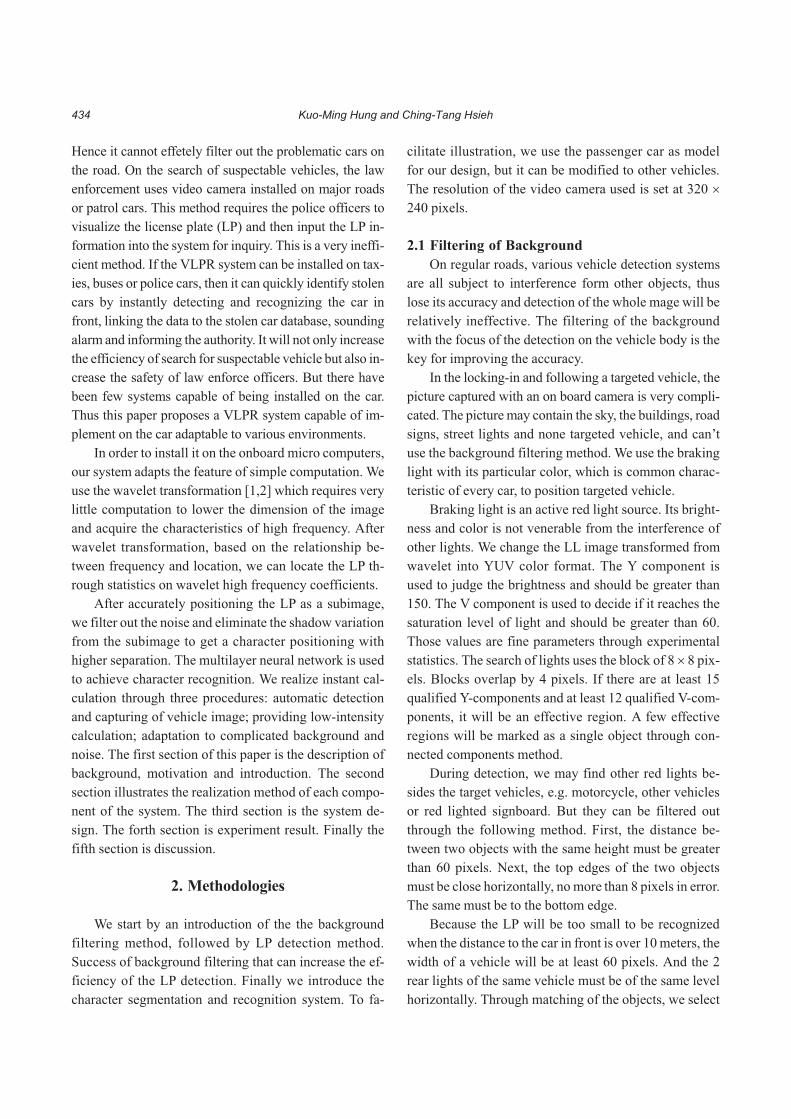
We consider the possible location of the LP between the
two lights (see Figure 1) LP may be located slightly
above the lights level or quite below. Through observa-
tion, the chosen region of dissected picture is set as:
left boundary: left edge of left red light region.
right boundary: right edge of right light region.
upper boundary: Top edge of left and right red lights
region –1/4 � distance of lights.
lower boundary: Top edge of left and right red lights
region +3/4 � distance of lights.
(distance of lights is the horizontal distance between
the center of left and right red lights).
2.2 Vehicle License Plate Detection
The proposed technique of vehicle license plate de-
tection as follow: We use wavelet transformation and
projection method. The wavelet transformation performs
multi-resolution of the signal to acquire the relationship
between the frequency and the location. There are two
functions in the transformation. They are used to acquire
the parameters of the high frequency H and the low fre-
quency L. It will produce four combinations in the two
dimensional image signals: LL, HL, LH and HH. These
four frequency bands represent low-frequency, horizon-
tal, vertical and diagonal frequency energy respectively.
We use one level discrete wavelet transformation to
extract the high frequency content form the LP image.
Considering six characters in the LP, there are at least 12
vertical boundary points in the horizontal projection of
the LP region. Because the edges in the vertical direction
of the license plate are very obvious, we will only use the
HL to locate license plate.
A horizontal projection of the frequency band i.e.
adding energy values at the same horizontal edge of the
frequency band will produce a horizontal frequency total
energy distribution graph with the same vertical direc-
tion. (see Figure 2a). We wish to find blocks with higher
values. The position of the blocks represents the upper
and lower edges of the LP as seen in Figure 2b.
A two-stage process is proposed in the approach, the
rough location, and the accurate location. The rough lo-
cation in which candidate regions of license plate are
found, and the accurate location where the exact plate
region is extracted from candidate regions.
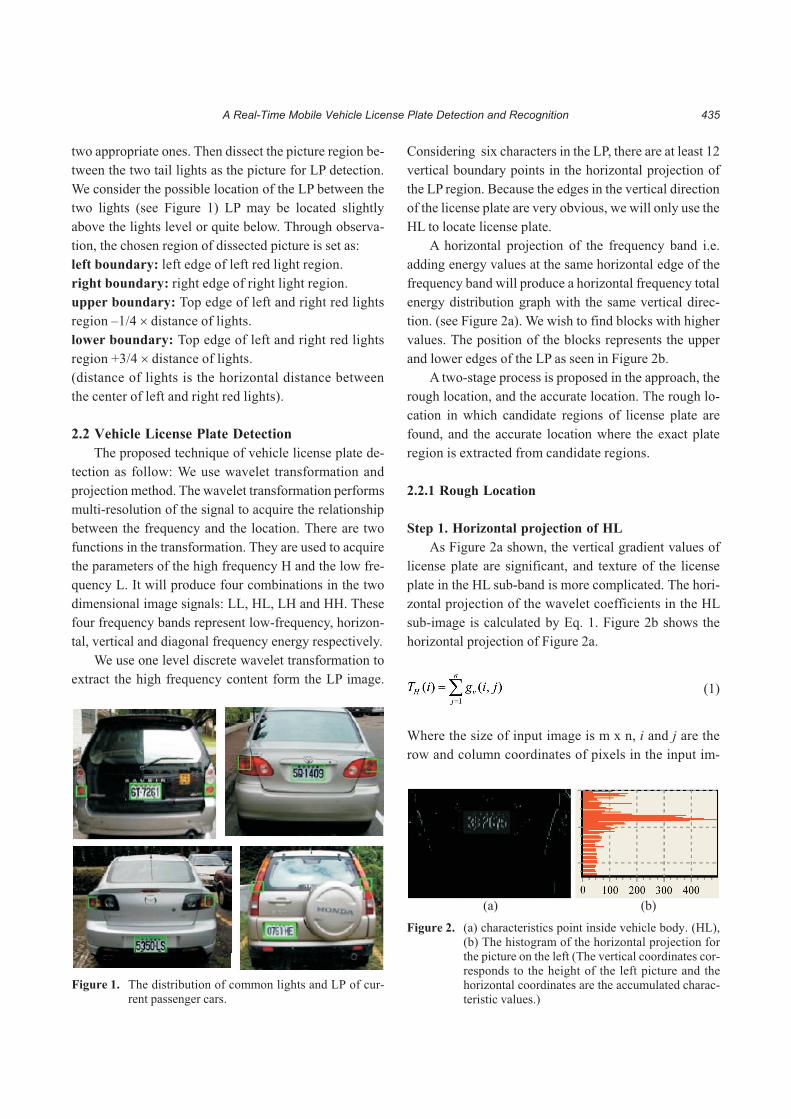
2.2.1 Rough Location
Step 1. Horizontal projection of HL
As Figure 2a shown, the vertical gradient values of
license plate are significant, and texture of the license
plate in the HL sub-band is more complicated. The hori-
zontal projection of the wavelet coefficients in the HL
sub-image is calculated by Eq. 1. Figure 2b shows the
horizontal projection of Figure 2a.
(1)
Where the size of input image is m x n, i and j are the
row and column coordinates of pixels in the input im-
A Real-Time Mobile Vehicle License Plate Detection and Recognition 435
Figure 1. The distribution of common lights and LP of cur-rent passenger cars.
Figure 2. (a) characteristics point inside vehicle body. (HL),(b) The histogram of the horizontal projection forthe picture on the left (The vertical coordinates cor-responds to the height of the left picture and thehorizontal coordinates are the accumulated charac-teristic values.)
(a) (b)

age gv (i, j), 1 <= i <= m and 1 <= j <= n. From Figure 2b,
the horizontal position of license plate must be a peak
of the projection. We should search the peak to get the
possible horizontal position of license plate. However,
there are many burrs in the horizontal projection in Fig-
ure 2b. In order to get rid of these burrs, we introduce
Gauss filter. The Gauss filter is shown in Eq. 2.
(2)
But in practice, because the curve is discrete, we often
use Eq. 3 to filter the image.
(3)
Where
In Eq. 3, TH (i) represents the original projection va-
lue, T�H (i) shows the filtered projection value, and i
changes from 1 to m. w is the width of the smoothness
region; h(j, �) is the Gauss filter and � represents the
parameter of Gauss filter. In our algorithm after many
experiments, we adopt w = 4 and � = 0.05. The result of
horizontal projection smoothing by Gauss Filter is shown
in Figure 3.
Step 2. Candidates extraction
In order to obtain the position of license plate, we
make use of two known features of license plate: firstly,
the license plate usually lies on the bottom of the image;
secondly, the several maximal sets of all peaks denote
the possible horizontal position of license plate. If there
are still several positions, some more strict inspections
will be applied to ensure the horizontal position of li-
cense plate. If there are not any candidates in this region,
we will adjust the parameters and repeat step 1 to step 2
orderly until we can get some candidates. The result of
above algorithm is shown in Figure 4. For extracting the
candidate region, we use the proper mask to search the
HL sub-image in the initial candidates. The proper size
of the searching mask according to the width of the max-
ima set of all peaks. In our experiment, the normal ratio
of length and width is 3.
We calculate the value of total pixels for each mask
and find the maximum. Then, the corresponding mask
with maxima value is the possible license plate region.
The result of above algorithm is shown in Figure 5.
2.2.2 Accurate Location
From rough detection, one or more candidates have
been taken from HL. We transfer the relative location to
HL sub-image and processed it one by one using mathe-
matical morphology.
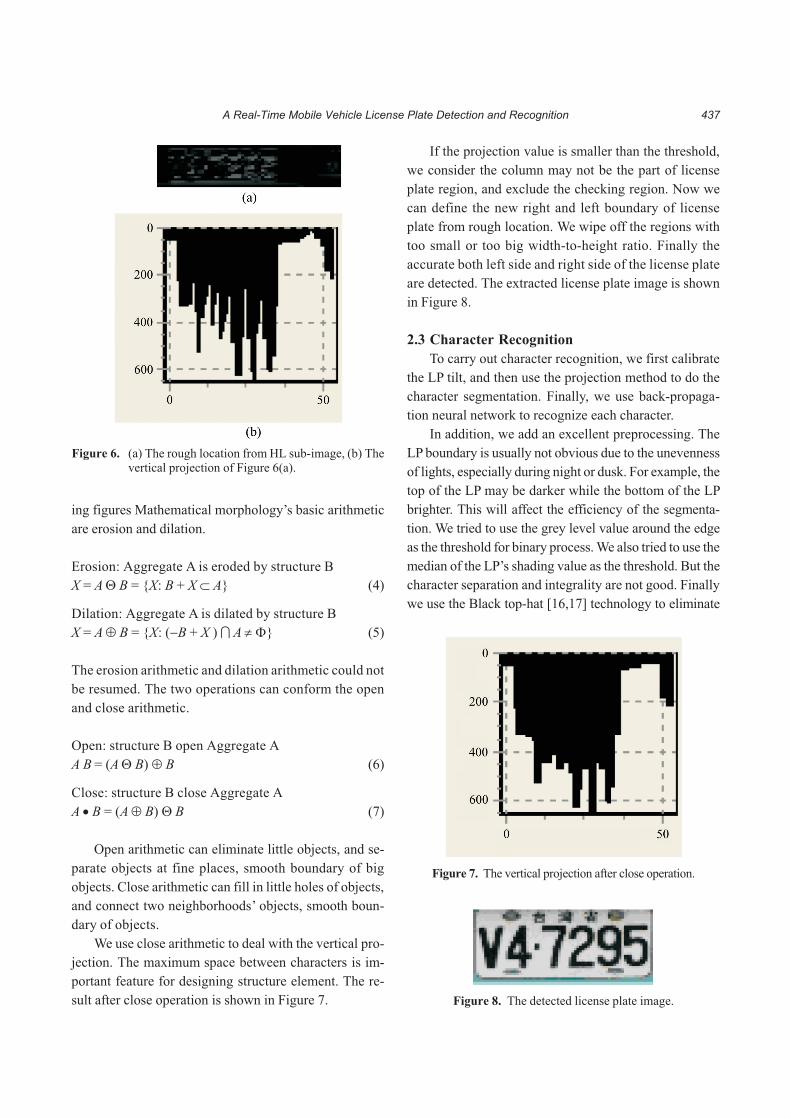
Step 1. Vertical projection of HL
Get Vertical projection of HL, the results are shown
in Figure 6b.
Step 2. Process with mathematical morphology
Mathematical morphology [13�15] is a non-linear
filter, with the function of restraining noises, to extract
features and segment images etc. Its characteristic is that
it can decompose complex figure and extract the mean-
436 Kuo-Ming Hung and Ching-Tang Hsieh
Figure 3. (a) The histogram of the horizontal projection forthe image, (b) The result of smoothing by GaussFilter from Figure 3(a).
(a) (b)
Figure 4. The initial candidates of the input image.
Figure 5. The rough location of the input image.
ing figures Mathematical morphology’s basic arithmetic
are erosion and dilation.
Erosion: Aggregate A is eroded by structure B
X = A � B = {X: B + X � A} (4)
Dilation: Aggregate A is dilated by structure B
X = A � B = {X: (�B + X ) � A � } (5)
The erosion arithmetic and dilation arithmetic could not
be resumed. The two operations can conform the open
and close arithmetic.
Open: structure B open Aggregate A
A B = (A � B) � B (6)
Close: structure B close Aggregate A
A B = (A � B) � B (7)
Open arithmetic can eliminate little objects, and se-
parate objects at fine places, smooth boundary of big
objects. Close arithmetic can fill in little holes of objects,
and connect two neighborhoods’ objects, smooth boun-
dary of objects.
We use close arithmetic to deal with the vertical pro-
jection. The maximum space between characters is im-
portant feature for designing structure element. The re-
sult after close operation is shown in Figure 7.
If the projection value is smaller than the threshold,
we consider the column may not be the part of license
plate region, and exclude the checking region. Now we
can define the new right and left boundary of license
plate from rough location. We wipe off the regions with
too small or too big width-to-height ratio. Finally the
accurate both left side and right side of the license plate
are detected. The extracted license plate image is shown
in Figure 8.
2.3 Character Recognition
To carry out character recognition, we first calibrate
the LP tilt, and then use the projection method to do the
character segmentation. Finally, we use back-propaga-
tion neural network to recognize each character.
In addition, we add an excellent preprocessing. The
LP boundary is usually not obvious due to the unevenness
of lights, especially during night or dusk. For example, the
top of the LP may be darker while the bottom of the LP
brighter. This will affect the efficiency of the segmenta-
tion. We tried to use the grey level value around the edge
as the threshold for binary process. We also tried to use the
median of the LP’s shading value as the threshold. But the
character separation and integrality are not good. Finally
we use the Black top-hat [16,17] technology to eliminate
A Real-Time Mobile Vehicle License Plate Detection and Recognition 437
Figure 6. (a) The rough location from HL sub-image, (b) Thevertical projection of Figure 6(a).
Figure 7. The vertical projection after close operation.
Figure 8. The detected license plate image.
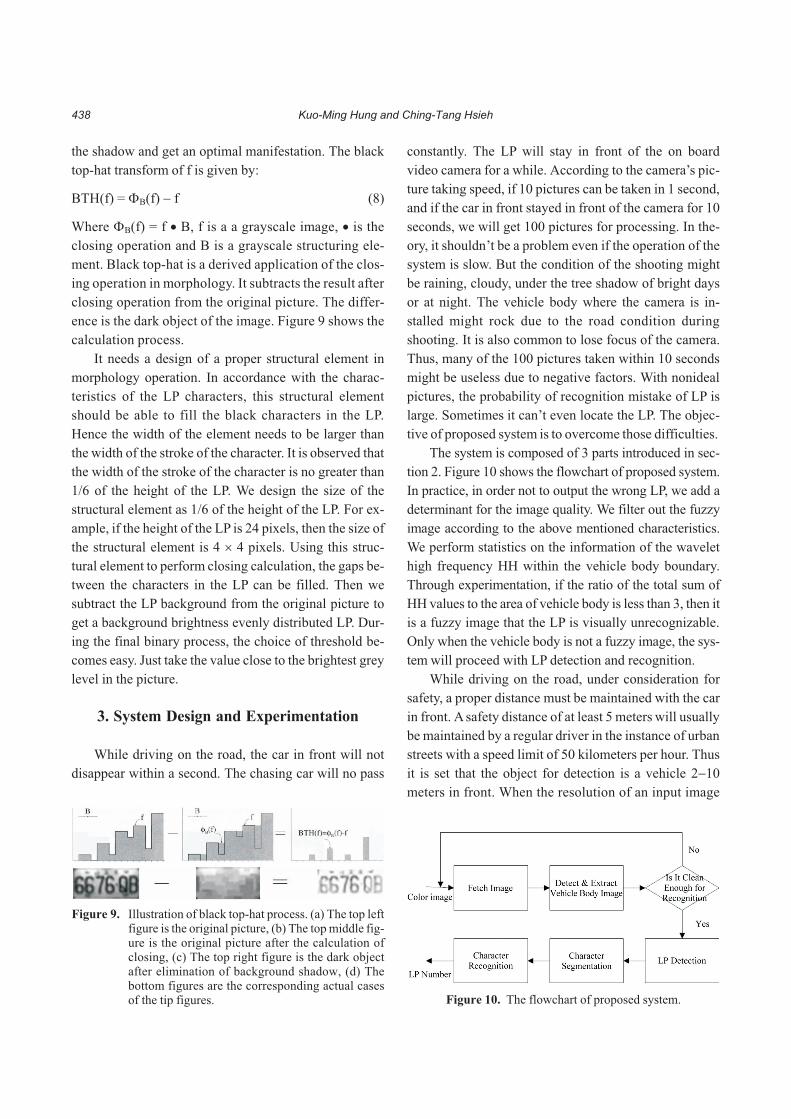
the shadow and get an optimal manifestation. The black
top-hat transform of f is given by:
BTH(f) = B(f) � f (8)
Where B(f) = f B, f is a a grayscale image, is the
closing operation and B is a grayscale structuring ele-
ment. Black top-hat is a derived application of the clos-
ing operation in morphology. It subtracts the result after
closing operation from the original picture. The differ-
ence is the dark object of the image. Figure 9 shows the
calculation process.
It needs a design of a proper structural element in
morphology operation. In accordance with the charac-
teristics of the LP characters, this structural element
should be able to fill the black characters in the LP.
Hence the width of the element needs to be larger than
the width of the stroke of the character. It is observed that
the width of the stroke of the character is no greater than
1/6 of the height of the LP. We design the size of the
structural element as 1/6 of the height of the LP. For ex-
ample, if the height of the LP is 24 pixels, then the size of
the structural element is 4 � 4 pixels. Using this struc-
tural element to perform closing calculation, the gaps be-
tween the characters in the LP can be filled. Then we
subtract the LP background from the original picture to
get a background brightness evenly distributed LP. Dur-
ing the final binary process, the choice of threshold be-
comes easy. Just take the value close to the brightest grey
level in the picture.
3. System Design and Experimentation
While driving on the road, the car in front will not
disappear within a second. The chasing car will no pass
constantly. The LP will stay in front of the on board
video camera for a while. According to the camera’s pic-
ture taking speed, if 10 pictures can be taken in 1 second,
and if the car in front stayed in front of the camera for 10
seconds, we will get 100 pictures for processing. In the-
ory, it shouldn’t be a problem even if the operation of the
system is slow. But the condition of the shooting might
be raining, cloudy, under the tree shadow of bright days
or at night. The vehicle body where the camera is in-
stalled might rock due to the road condition during
shooting. It is also common to lose focus of the camera.
Thus, many of the 100 pictures taken within 10 seconds
might be useless due to negative factors. With nonideal
pictures, the probability of recognition mistake of LP is
large. Sometimes it can’t even locate the LP. The objec-
tive of proposed system is to overcome those difficulties.
The system is composed of 3 parts introduced in sec-
tion 2. Figure 10 shows the flowchart of proposed system.
In practice, in order not to output the wrong LP, we add a
determinant for the image quality. We filter out the fuzzy
image according to the above mentioned characteristics.
We perform statistics on the information of the wavelet
high frequency HH within the vehicle body boundary.
Through experimentation, if the ratio of the total sum of
HH values to the area of vehicle body is less than 3, then it
is a fuzzy image that the LP is visually unrecognizable.
Only when the vehicle body is not a fuzzy image, the sys-
tem will proceed with LP detection and recognition.
While driving on the road, under consideration for
safety, a proper distance must be maintained with the car
in front. A safety distance of at least 5 meters will usually
be maintained by a regular driver in the instance of urban
streets with a speed limit of 50 kilometers per hour. Thus
it is set that the object for detection is a vehicle 2�10
meters in front. When the resolution of an input image
438 Kuo-Ming Hung and Ching-Tang Hsieh
Figure 9. Illustration of black top-hat process. (a) The top leftfigure is the original picture, (b) The top middle fig-ure is the original picture after the calculation ofclosing, (c) The top right figure is the dark objectafter elimination of background shadow, (d) Thebottom figures are the corresponding actual casesof the tip figures. Figure 10. The flowchart of proposed system.
is 320 � 240 pixels, and the detector needs the height of
the the character of the LP to be more than 10 pixels, the
focus of the camera lens should be 120 mm, about 2.5
times of the focus of regular camera.
3.1 Acquiring of Samples
The video camera in the system is installed under the
windshield of the vehicle. It constantly shoots pictures of
the vehicle in front on the road. The shooting location of
the system is chosen to be the urban streets with a speed
limit below 60. The environment includes clear day, rain-
ing day, daytime (8:00�18:00), evening (18:00�24:00).
The image is captured through the video capture card in
the computer. The size of the captured 24-bit color picture
is 320 � 240 pixels. The total number of samples is 257
vehicles within a searching range above 3 seconds.
3.2 The Test of the System Recognition Speed
The CPU of the testing platform has a clock speed of
3.0 GHz, a memory of 512 MB. The resolution of the in-
put image is 320 � 240 pixels. From reading of single
image, locating of LP, character segmentation to correct
output of the LP number, the average required time is
approximately 0.07 seconds.
4. Research Result
In this section, we introduce how the samples were
acquire, display the success rate of this system, and exam
the cause of failure of some sample.
4.1 Experiment Result
We define processing success as being able to output
two or more sets correctly. In the acquired 257 sample
images, the samples deemed success are 228, and 29 are
deemed failure. The rate of successful recognition is
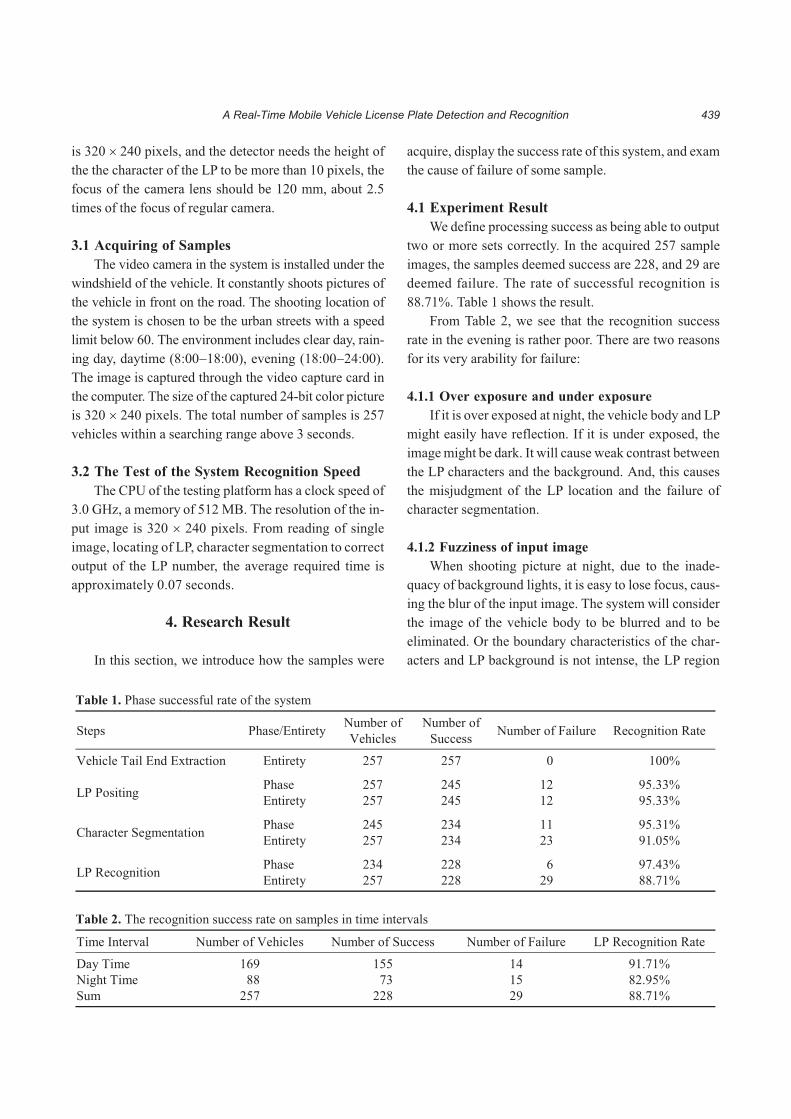
88.71%. Table 1 shows the result.
From Table 2, we see that the recognition success
rate in the evening is rather poor. There are two reasons
for its very arability for failure:
4.1.1 Over exposure and under exposure
If it is over exposed at night, the vehicle body and LP
might easily have reflection. If it is under exposed, the
image might be dark. It will cause weak contrast between
the LP characters and the background. And, this causes
the misjudgment of the LP location and the failure of
character segmentation.
4.1.2 Fuzziness of input image
When shooting picture at night, due to the inade-
quacy of background lights, it is easy to lose focus, caus-
ing the blur of the input image. The system will consider
the image of the vehicle body to be blurred and to be
eliminated. Or the boundary characteristics of the char-
acters and LP background is not intense, the LP region
A Real-Time Mobile Vehicle License Plate Detection and Recognition 439
Table 1. Phase successful rate of the system
Steps Phase/EntiretyNumber of
Vehicles
Number of
SuccessNumber of Failure Recognition Rate
Vehicle Tail End Extraction Entirety 257 257 00 .0100%
Phase 257 245 12 95.33%LP Positing
Entirety 257 245 12 95.33%
Phase 245 234 11 95.31%Character Segmentation
Entirety 257 234 23 91.05%
Phase 234 228 06 97.43%LP Recognition
Entirety 257 228 29 88.71%
Table 2. The recognition success rate on samples in time intervals
Time Interval Number of Vehicles Number of Success Number of Failure LP Recognition Rate
Day Time 169 155 14 91.71%
Night Time 088 073 15 82.95%
Sum 257 228 29 88.71%
will be treated as noise and be filtered out.
From Table 3, the recognition success rate is low for
the raining day. The reason is that the action of the wind-
shield wiper will leave water drop on the windshield.
The LP’s characters will be fuzzy and cause the failure of
character segmentation and recognition.
Table 4 is the experimental result under different car
speed. The result shows that the recognition success rate is
approximately between 89% and 91% when the car speed
is between 0 and 40. When the car speed reaches above
40, the recognition rate will be much lower. This is be-
cause the driving safety distance is longer when the car
speed is over 40. The target vehicle is harder to get into the
detection range of the system. Fathomer, the size of the LP
is much smaller in far distance. It might be treated as noise
and be filtered out. Or, because the characters in the LP are
rather small, the characters can not be clearly segmented
causing the failure of character recognition.
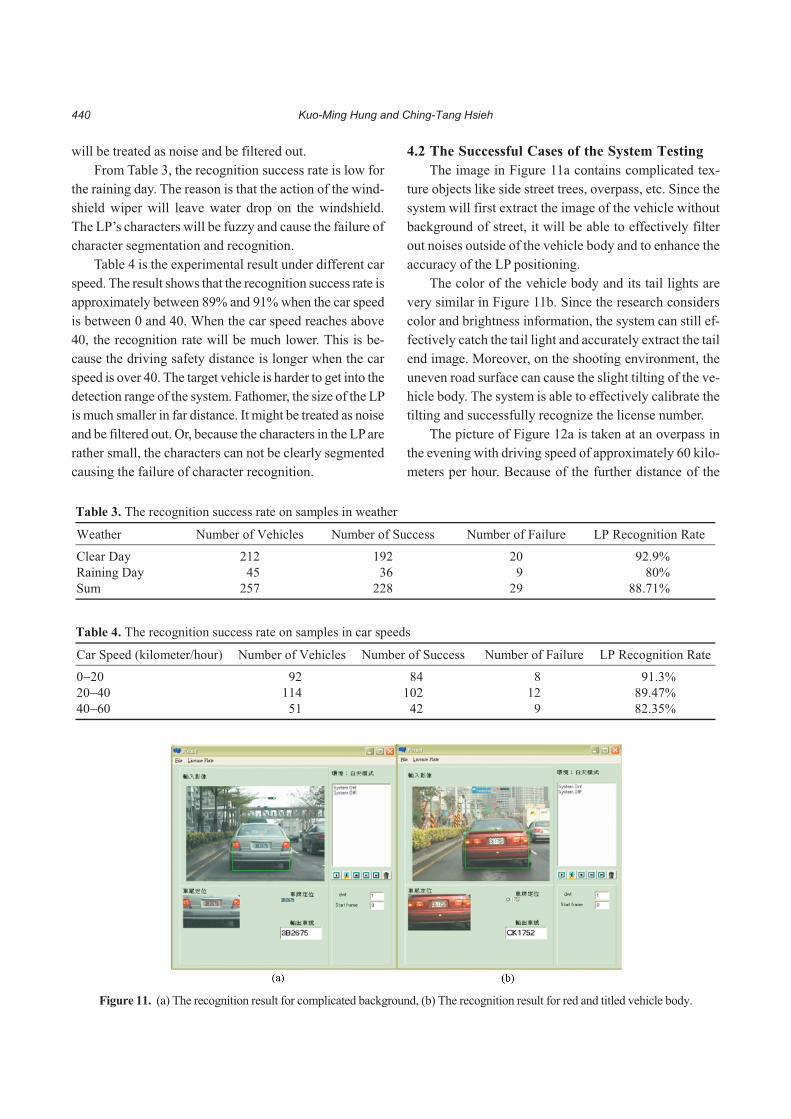
4.2 The Successful Cases of the System Testing
The image in Figure 11a contains complicated tex-
ture objects like side street trees, overpass, etc. Since the
system will first extract the image of the vehicle without
background of street, it will be able to effectively filter
out noises outside of the vehicle body and to enhance the
accuracy of the LP positioning.
The color of the vehicle body and its tail lights are
very similar in Figure 11b. Since the research considers
color and brightness information, the system can still ef-
fectively catch the tail light and accurately extract the tail
end image. Moreover, on the shooting environment, the
uneven road surface can cause the slight tilting of the ve-
hicle body. The system is able to effectively calibrate the
tilting and successfully recognize the license number.
The picture of Figure 12a is taken at an overpass in
the evening with driving speed of approximately 60 kilo-
meters per hour. Because of the further distance of the
440 Kuo-Ming Hung and Ching-Tang Hsieh
Table 4. The recognition success rate on samples in car speeds
Car Speed (kilometer/hour) Number of Vehicles Number of Success Number of Failure LP Recognition Rate
0�20 092 084 08 091.3%
20�40 114 102 12 89.47%
40�60 051 042 09 82.35%
Table 3. The recognition success rate on samples in weather
Weather Number of Vehicles Number of Success Number of Failure LP Recognition Rate
Clear Day 212 192 20 092.9%
Raining Day 045 036 09 .0080%
Sum 257 228 29 88.71%
Figure 11. (a) The recognition result for complicated background, (b) The recognition result for red and titled vehicle body.
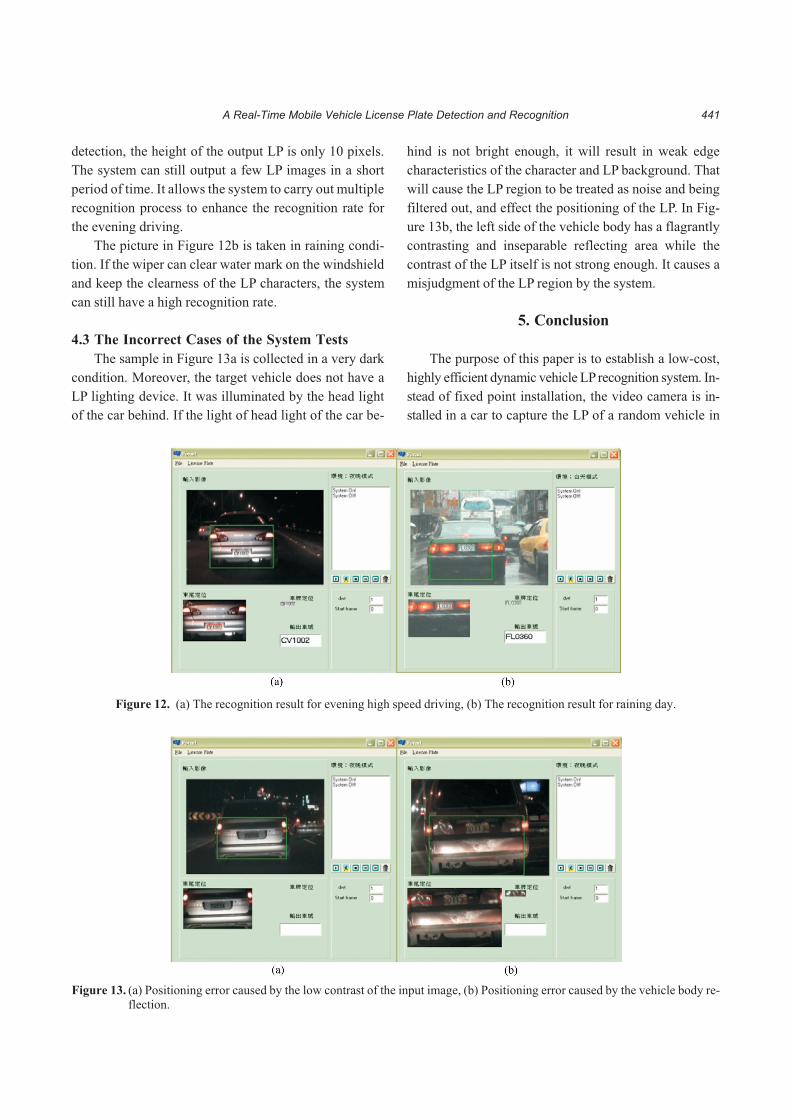
detection, the height of the output LP is only 10 pixels.
The system can still output a few LP images in a short
period of time. It allows the system to carry out multiple
recognition process to enhance the recognition rate for
the evening driving.
The picture in Figure 12b is taken in raining condi-
tion. If the wiper can clear water mark on the windshield
and keep the clearness of the LP characters, the system
can still have a high recognition rate.
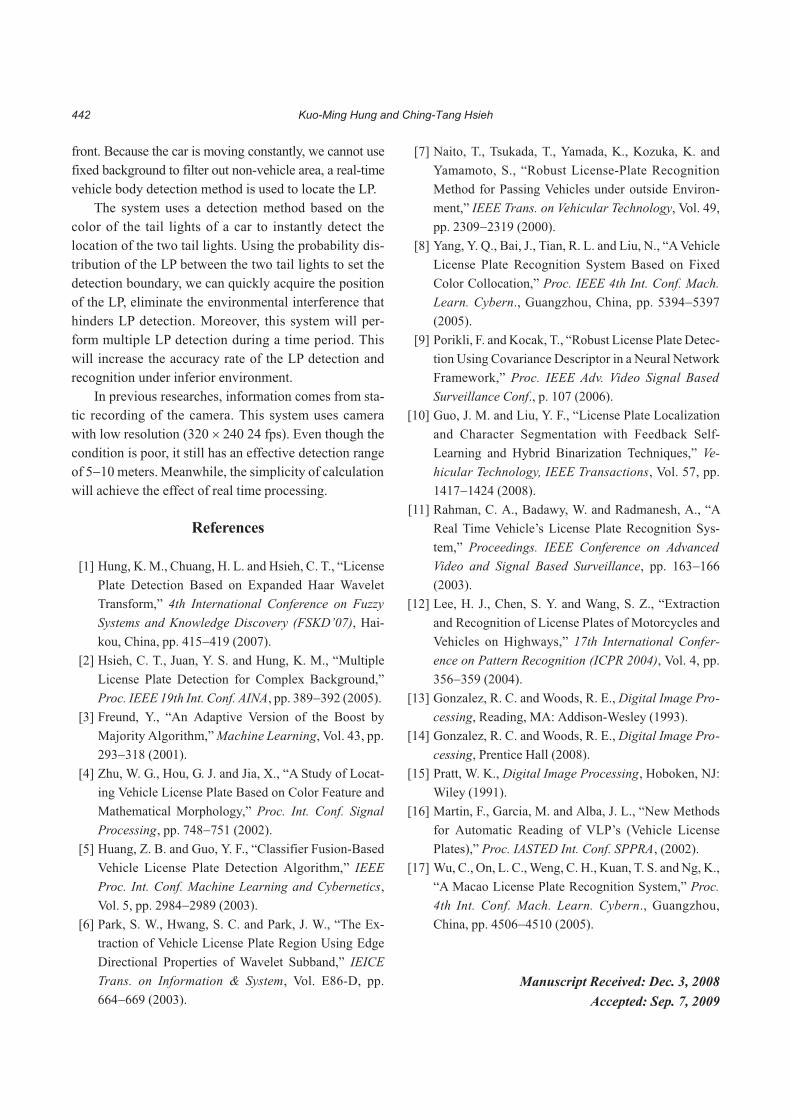
4.3 The Incorrect Cases of the System Tests
The sample in Figure 13a is collected in a very dark
condition. Moreover, the target vehicle does not have a
LP lighting device. It was illuminated by the head light
of the car behind. If the light of head light of the car be-
hind is not bright enough, it will result in weak edge
characteristics of the character and LP background. That
will cause the LP region to be treated as noise and being
filtered out, and effect the positioning of the LP. In Fig-
ure 13b, the left side of the vehicle body has a flagrantly
contrasting and inseparable reflecting area while the
contrast of the LP itself is not strong enough. It causes a
misjudgment of the LP region by the system.
5. Conclusion
The purpose of this paper is to establish a low-cost,
highly efficient dynamic vehicle LP recognition system. In-
stead of fixed point installation, the video camera is in-
stalled in a car to capture the LP of a random vehicle in
A Real-Time Mobile Vehicle License Plate Detection and Recognition 441
Figure 12. (a) The recognition result for evening high speed driving, (b) The recognition result for raining day.
Figure 13. (a) Positioning error caused by the low contrast of the input image, (b) Positioning error caused by the vehicle body re-flection.
front. Because the car is moving constantly, we cannot use
fixed background to filter out non-vehicle area, a real-time
vehicle body detection method is used to locate the LP.
The system uses a detection method based on the
color of the tail lights of a car to instantly detect the
location of the two tail lights. Using the probability dis-
tribution of the LP between the two tail lights to set the
detection boundary, we can quickly acquire the position
of the LP, eliminate the environmental interference that
hinders LP detection. Moreover, this system will per-
form multiple LP detection during a time period. This
will increase the accuracy rate of the LP detection and
recognition under inferior environment.
In previous researches, information comes from sta-
tic recording of the camera. This system uses camera
with low resolution (320 � 240 24 fps). Even though the
condition is poor, it still has an effective detection range
of 5�10 meters. Meanwhile, the simplicity of calculation
will achieve the effect of real time processing.
References
[1] Hung, K. M., Chuang, H. L. and Hsieh, C. T., “License
Plate Detection Based on Expanded Haar Wavelet
Transform,” 4th International Conference on Fuzzy
Systems and Knowledge Discovery (FSKD’07), Hai-
kou, China, pp. 415�419 (2007).
[2] Hsieh, C. T., Juan, Y. S. and Hung, K. M., “Multiple
License Plate Detection for Complex Background,”
Proc. IEEE 19th Int. Conf. AINA, pp. 389�392 (2005).
[3] Freund, Y., “An Adaptive Version of the Boost by
Majority Algorithm,” Machine Learning, Vol. 43, pp.
293�318 (2001).
[4] Zhu, W. G., Hou, G. J. and Jia, X., “A Study of Locat-
ing Vehicle License Plate Based on Color Feature and
Mathematical Morphology,” Proc. Int. Conf. Signal
Processing, pp. 748�751 (2002).
[5] Huang, Z. B. and Guo, Y. F., “Classifier Fusion-Based
Vehicle License Plate Detection Algorithm,” IEEE
Proc. Int. Conf. Machine Learning and Cybernetics,
Vol. 5, pp. 2984�2989 (2003).
[6] Park, S. W., Hwang, S. C. and Park, J. W., “The Ex-
traction of Vehicle License Plate Region Using Edge
Directional Properties of Wavelet Subband,” IEICE
Trans. on Information & System, Vol. E86-D, pp.
664�669 (2003).
[7] Naito, T., Tsukada, T., Yamada, K., Kozuka, K. and
Yamamoto, S., “Robust License-Plate Recognition
Method for Passing Vehicles under outside Environ-
ment,” IEEE Trans. on Vehicular Technology, Vol. 49,
pp. 2309�2319 (2000).
[8] Yang, Y. Q., Bai, J., Tian, R. L. and Liu, N., “A Vehicle
License Plate Recognition System Based on Fixed
Color Collocation,” Proc. IEEE 4th Int. Conf. Mach.
Learn. Cybern., Guangzhou, China, pp. 5394�5397
(2005).
[9] Porikli, F. and Kocak, T., “Robust License Plate Detec-
tion Using Covariance Descriptor in a Neural Network
Framework,” Proc. IEEE Adv. Video Signal Based
Surveillance Conf., p. 107 (2006).
[10] Guo, J. M. and Liu, Y. F., “License Plate Localization
and Character Segmentation with Feedback Self-
Learning and Hybrid Binarization Techniques,” Ve-
hicular Technology, IEEE Transactions, Vol. 57, pp.
1417�1424 (2008).
[11] Rahman, C. A., Badawy, W. and Radmanesh, A., “A
Real Time Vehicle’s License Plate Recognition Sys-
tem,” Proceedings. IEEE Conference on Advanced
Video and Signal Based Surveillance, pp. 163�166
(2003).
[12] Lee, H. J., Chen, S. Y. and Wang, S. Z., “Extraction
and Recognition of License Plates of Motorcycles and
Vehicles on Highways,” 17th International Confer-
ence on Pattern Recognition (ICPR 2004), Vol. 4, pp.
356�359 (2004).
[13] Gonzalez, R. C. and Woods, R. E., Digital Image Pro-
cessing, Reading, MA: Addison-Wesley (1993).
[14] Gonzalez, R. C. and Woods, R. E., Digital Image Pro-
cessing, Prentice Hall (2008).
[15] Pratt, W. K., Digital Image Processing, Hoboken, NJ:
Wiley (1991).
[16] Martin, F., Garcia, M. and Alba, J. L., “New Methods
for Automatic Reading of VLP’s (Vehicle License
Plates),” Proc. IASTED Int. Conf. SPPRA, (2002).
[17] Wu, C., On, L. C., Weng, C. H., Kuan, T. S. and Ng, K.,
“A Macao License Plate Recognition System,” Proc.
4th Int. Conf. Mach. Learn. Cybern., Guangzhou,
China, pp. 4506�4510 (2005).
Manuscript Received: Dec. 3, 2008
Accepted: Sep. 7, 2009
442 Kuo-Ming Hung and Ching-Tang Hsieh