a refraction seismic transect from greenland to ellesmere ... · canada, to greenland. however,...
TRANSCRIPT

steht, die sich unmittelbar südlich des Profils befinden. Aufgrund der nurgeringen Änderungen der Krustengeschwindigkeiten und der Mohotiefeentlang der Nares Strait erscheint der östliche archaische/proterozoische Teilvon Ellesmere Island als Teil der Grönländischen Platte mit dem Thule Basinals interkratonische Struktur. Es konnten keine Strukturen aufgelöst werden,die für eine Blattverschiebung in der südlichen Nares Strait sprechen würden.
INTRODUCTION
The Nares Strait controversy as discussed in DAWES & KERR
(1982a) concerns whether or not the strait is the plateboundary between Greenland and North America, and howmuch strike-slip movement occurred along this boundary.DAWES & KERR (1982b) argue that there is little or no strike-slip displacement along Nares Strait, on the basis of present-day continuity of geological features from Ellesmere Island,Canada, to Greenland. However, based on plate tectonic recon-structions, SRIVASTAVA (1985) suggests that Greenland moved150 km northwards relative to North America, most of whichshould have been taken up by sinistral strike-slip movement inNares Strait. Hence, there is an apparent incompatibilitybetween the onshore geology surrounding Nares Strait andplate tectonic models describing the opening of the NorthAtlantic and the resulting motions of Greenland.
It is clear that the controversy can only be resolved by detailedmapping of the strait itself to find evidence for one model orthe other. Therefore a multidisciplinary experiment wascarried out in August-September 2001, including geologicalfield work onshore and regional geophysical measurements toextend the interpretations offshore. The survey also comprisedthree refraction/wide-angle reflection seismic lines (FUNCK etal. 2002) with Line 3 in southern Nares Strait (Fig. 1) beingthe focus of this paper. The objective of the transect was todetermine the crustal velocity structure across Nares Strait andto interpret the structure in terms of the tectonic evolution ofNares Strait. Earlier refraction seismic data just to the south ofLine 3 (Fig. 1) give some indication for a plate boundary(JACKSON & REID 1994, REID & JACKSON 1997). However,these earlier lines are also affected by rift-related crustal thin-ning in northern Baffin Bay. Our Line 3 farther to the north isexpected to be less influenced by this additional complexity.
GEOLOGICAL SETTING
In northern Baffin Bay onshore of refraction Line 3, two rocktypes predominate (Fig. 1). The exposures are either Archeanand lower Proterozoic metamorphic to plutonic basementrocks or the slightly deformed and almost unmetamorphosed
97
Abstract: A refraction and wide-angle reflection seismic study was carriedout in southern Nares Strait (northernmost Baffin Bay) on a 378 km longprofile running from Pituffik/Thule Air Base on Greenland into MakinsonInlet on Ellesmere Island, Canada. Eight ocean bottom seismometers and eightland stations were deployed to record the airgun shots along the line. A crustalvelocity model was developed by forward and inverse modeling techniques.The Proterozoic Thule Basin can be correlated across Nares Strait as a conti-nuous structure with a total thickness of 4-5 km. The basin is divided intothree units. The upper unit has velocities of 4.5-5.0 km s-1 and a Poisson’s ratio(σ) of 0.30, indicating a high content of carbonates. The middle unit is charac-terized by high velocities (6.1 km s-1) and a Poisson’s ratio of 0.28. This unit isinterpreted to correlate with the basaltic sills found in the Cape Combermereformation. The lower unit is a low-velocity zone and, hence, its velocities areunconstrained. The underlying crust is divided into three layers, upper crust(6.0-6.2 km s-1, σ = 0.25), middle crust (6.1-6.3 km s-1, σ = 0.26) and lowercrust (6.7-6.9 km s-1, σ = 0.26). These properties are consistent with agranitic/gneissic composition in the upper/middle crust and with granulites inthe lower crust. Moho depth on either side of Nares Strait is 36 km, with someshallowing to 33 km in a 100 km wide zone. The Moho shallowing is relatedto local uplift at the Carey Islands just to the south of the line based on corre-lation with the gravity data. With only minor lateral changes of crustal veloci-ties and Moho depth across southern Nares Strait, the easternArchean/Proterozoic part of Ellesmere Island appears to be part of the sameplate as Greenland with Thule Basin as intracratonic feature. No structuresconsistent with a strike-slip boundary could be resolved in southern NaresStrait.
Zusammenfassung: In der südlichen Nares-Strait (nördlichste Baffin Bay)wurde eine refraktionsseismische und weitwinkel-reflexionsseismischeVermessung entlang eines 378 km langen Profils durchgeführt, das vonPituffik/ Thule Air Base in Grönland nach Makinson Inlet auf EllesmereIsland in Kanada verläuft. Entlang des Profils wurden acht Ozeanbodenseis-mometer und acht Landstationen ausgebracht, um die Airgun-Schüsse zu regi-strieren. Mithilfe von Vorwärtsmodellierung und Inversion wurde einGeschwindigkeitsmodel für die Kruste entwickelt. Das proterozoische ThuleBasin kann als kontinuierliche Struktur durch die Nares-Strait korreliertwerden und hat eine Gesamtmächtigkeit von 4-5 km. Das Becken ist in dreiEinheiten untergliedert. Die oberste Einheit hat Geschwindigkeiten zwischen4.5-5.0 km s-1 und eine Poissonzahl (σ) von 0.30, was auf einen hohen Karbo-natgehalt hindeutet. Die mittlere Einheit ist durch hohe Geschwindigkeiten(6.1 km s-1) und eine Poissonzahl von 0.28 gekennzeichnet. Die Interpretationdieser Einheit führt zu eeiner Korrelation mit den basaltischen Sills der CapeCombermere Formation. Die untere Einheit ist ein Zone erniedrigterGeschwindigkeiten, weswegen ihre genauerer Wert nicht ermittelt werdenkonnte. Die darunterliegende Kruste ist in drei Bereiche untergliedert: Obere(6.0-6.2 km s-1, σ = 0.25), mittlere (6.1-6.3 km s-1, σ = 0.26) und untere Kruste(6.7-6.9 km s-1, σ = 0.26). Diese Werte sind im Einklang mit einer granit-undgneisshaltigen Zusammensetzung der oberen und mittleren Kruste sowie mitGranulit in der Unterkruste. Zu beiden Seiten der Nares-Strait ist die Moho-tiefe 36 km. Nur in einer 100-kmweiten Zone nimmt sie eine geringere Tiefevon 33 km ein. Die Korrelation mit Schweredaten ergibt, dass die Verringe-rung der Mohotiefe in Zusammenhang mit lokaler Hebung der Carey Inseln
____________1 Danish Lithosphere Centre, Øster Voldgade 10 L, 1350 Copenhagen K, Denmark.* Now at: Geological Survey of Denmark and Greenland, Øster Voldgade 10, 1350 Co-
penhagen K, Denmark.2 Research Scientist, Geological Survey of Canada (Atlantic), Bedford Institute of Ocea-
nography, PO. Box 1006, Dartmouth, Nova Scotia, B2Y 4A2, Canada.3 Geological Institute, University of Copenhagen, Øster Voldgade 10, DK-1350 Copen-
hagen K, Denmark.
Manuscript received 07 October 2003, accepted 04 April 2005
Polarforschung 74 (1-3), 97 – 112, 2004 (erschienen 2006)
A Refraction Seismic Transect
from Greenland to Ellesmere Island, Canada:
The Crustal Structure in Southern Nares Strait
by Thomas Funck1*, H. Ruth Jackson2, Sonya A. Dehler2 and Ian D. Reid3

rocks of the Thule Supergroup (DAWES 1997).
The Carey Islands are located just to the south of Line 3, andtherefore, are particularly relevant to the geological discus-sion. On the islands gneiss, schists and granites are observedtypical of the basement terrain on Greenland from MelvilleBay north to Prudhoe Land (76°30’ N – 78°30’ N) (DAWES
1976). The Precambrian rocks are intruded by dolerite dykesand sills. No sedimentary rocks have been mapped (BENDIX-ALMGREEN et al. 1976).
The Thule Supergroup consists of continental to shallowmarine sedimentary rocks and one main unit of basalticvolcanic rocks (DAWES 1997). Onshore it extends over 300 kmfrom north to south (DAWES 1997). The coastal outcrops disap-pear under the sea in down-faulted blocks. This suggests thatthe onshore outcrops are the preserved fragments of a largeroffshore basin. Potential field and seismic reflection profileshave been interpreted as consistent with a sedimentary sectionof several km thickness (KEEN & BARRETT 1973, HOOD &BOWER 1973, ROSS & FALCONER 1975, NEWMAN 1982,JACKSON et al. 1992). However, the age of the offshore sedi-mentary deposits is unknown.
The lack of deformation and low metamorphic grade of theThule Supergroup suggests that little tectonic activityoccurred in the region during the Phanerozoic. To the south ofthe study area localized deposits of younger rocks are exposedon Bylot Island. Here sedimentary deposits of Late Cretaceousto Tertiary age are mapped.
The tectonic history of northern Baffin Bay from Cretaceousto Tertiary is deduced from plate reconstructions based onregional magnetic anomalies in the Labrador Sea, Norwegianand Greenland seas and the Arctic Ocean. Local evidence ofoceanic crust to the south of 76 °N based on refraction resultsand gravity modelling has been reported by REID & JACKSON
(1997). The plate reconstructions (e.g., SRIVASTAVA 1985) andother geophysical data are consistent with an extinct spreadingcentre in the Labrador Sea that is postulated to continue intoBaffin Bay, on the basis of a linear gravity low. The oceaniccrust terminates in northern Baffin Bay. From northern BaffinBay through Nares Strait, a plate boundary has been inter-preted that is strike-slip evolving in time to a compressionalzone. The plate boundary is required for Greenland to move asan independent plate. The timing of the motion and the conse-quence of it are consistent with the Eurekan Orogeny on Elles-mere Island and Axel Heiberg Island to the north. However,the presence of the Thule Basin, an intracratonic feature,straddling the plate boundary argues against such a dynamichistory (DAWES 1976).
The rocks exposed along Nares Strait and northern Baffin Bay(TRETTIN 1991) can be divided into five types: 1) Archean toLower Proterozoic metamorphic-plutonic basement, 2) upperMiddle to Upper Proterozoic sedimentary and volcanic rocksof the Thule Supergroup, 3) undeformed Cambrian toDevonian rocks of the interior platform, 4) Lower Paleozoicrocks of the Franklinian Mobile Belt and 5) late Cretaceousand Tertiary sedimentary rocks.
98
Fig. 1: Regional geology map of the study area(modified from WILLIAMSON 1988, Thule Basintaken from PEEL & CHRISTIE 1982). Dashed linesshow the outline of Tertiary offshore basins(HARRISON in press). Segments with airgun shotsalong Line 3 are shown as bold line. Ocean bot-tom seismometers (OBS) are indicated by opencircles and locations of land seismometers areshown as grey diamonds, annotations specify thestation number. Refraction seismic lines relevantto this study are shown by thin lines with circlesindicating the OBS locations: lines 91-1 and 91-3 (JACKSON & REID 1994), lines 91-2 and 91-4(Reid & Jackson 1997). CB = Carey Basin;NWB = North Water Basin; GB = Glacier Basin;SLB = Steensby Land Basin.
WIDE-ANGLE SEISMIC EXPERIMENT
Data acquisition
The survey was carried out in August and September 2001onboard the Canadian Coast Guard ship CCGS “Louis S. St-Laurent”. The seismic source used along refraction/wide-anglereflection Line 3 (Fig. 1) was an airgun array consisting of six1000 in.3 (16.4 L) guns towed at a depth of 6 m. This was themaximum number of airguns that could be safely towed in theice infested waters. Instead of using a tuned airgun array witha smaller volume, it was decided to use guns with themaximum volume chambers to ensure that the signal wasstrong enough to be recorded at large offsets (>150 km). As aresult, the data recorded are rather mono-frequent (maximumenergy between 5-6 Hz) and have a tendency to ringing in thesignal. The shot interval was 60 s at a ship’s speed of 4 knots,resulting in an average shot spacing of 128 m. Ice conditionsprevented shooting in a 63 km long segment at the entrance toMakinson Inlet on Ellesmere Island (Fig. 1). The airgun arraywas triggered by a Global Positioning System (GPS) clock.Occasional periods with no satellite reception resulted in a fewshort shot gaps.
Eight digital ocean bottom seismometers (OBS) of the Geolo-gical Survey of Canada (GSC) were deployed along Line 3with station numbers 8 through 15 (Fig. 1). Originally it wasplanned to have another OBS east of Cape Combermere (OBS7), but it appeared too risky to deploy the instrument at thatlocation due to large ice floes. All OBS were equipped withthree-component 4.5-Hz geophones and a hydrophone(frequency range 0-5000 Hz) and the average spacing of theOBS was 20 km. Six ORION land stations with three-compo-nent 1-Hz geophones were deployed by the ship’s helicopters.Station 1 was located at Stenkul Fiord at western EllesmereIsland, stations 2 through 6 were placed along the southernshore of Makinson Inlet and at Smith Bay with an averagespacing of 24 km, and station 16 was installed on SaundersIsland off Greenland. In addition, we could utilize a broadbandseismometer (GURALP CMG-40 seismometer with Nanome-tric ORION datalogger) located in Pituffik/Thule Air Base(station 17).
All navigation (station and shot locations) and timing (shotsand recording) was based on the GPS system. Water depthsalong the profile were obtained from the ship’s echosounderusing a depth-velocity function from one CTD (conductivity,temperature, depth) measurement in southern Nares Strait(78.33 °N, 73.64 °W) down to a depth of 662 m.
Data processing
All seismic data were converted to SEGY format, time correc-tions for the drift of the OBS clock were applied, and datawere de-biased. Travel times of the direct wave were used todetermine the exact position of the OBS at the seafloor, fromwhich the shot-receiver ranges were calculated.
The maximum seismic energy was recorded between 5-6 Hzand the data were band-pass filtered from 4-10 Hz. To sharpenthe wavelet and remove some of the ringing that resulted fromthe mono-frequent source, a deconvolution was applied. Allrecord sections in Figures 2 through 11 are displayed with a
reduction velocity of 7.0 km s-1 and traces are weighted bytheir distance to the station to increase the amplitudes for largeoffsets.
Methodology
For the two-dimensional velocity modeling along Line 3, allstation locations were projected on a great circle arc runningfrom station 1 at Stenkul Fiord to station 17 at Pituffik/ThuleAir Base. In this framework, station 1 defines the origin of thehorizontal axis (x = 0 km) and station 17 marks the eastern endat a range of x = 377.57 km. The velocity model for the crustand uppermost mantle was developed using the programRAYINVR (ZELT & SMITH 1992, ZELT & FORSYTH 1994). Theuppermost layer in this model was the water column along theshot line. Static corrections were applied to the land stations tocorrect for their elevation. First, observed travel times ofcompressional phases (P waves) were fitted by forwardmodelling, with the model being developed from top tobottom. In a second step, velocities within individual layerswere optimized using the inversion algorithm in RAYINVR.Layer boundaries were adjusted accordingly and the geometryof the Moho discontinuity was refined by inversion.
Finally, available shear-wave observations were used todevelop a gross S wave velocity model of the crust. The Swave velocity model is defined by the P wave velocity modeland assigned Poisson’s ratios for individual layers.
Seismic data
All instruments could be successfully recovered after the expe-riment. However, due to technical problems, station 4 did notwork and station 1 did not record the shots fired in MakinsonInlet. In addition, station 5 was destroyed by a polar bear andonly the shots in the eastern segment could be retrieved. Thisleaves the experiment with a reduced number of observationson Ellesmere Island (Fig. 1). During the shooting in NaresStrait, the wind speed was 50 km/h with gusts up to 100 km/h.This resulted in reduced signal-to-noise ratios and the OBSwere most affected by these conditions. However, despite theseimpediments, a reasonable quality data set was collected.
Below a selection of record sections is discussed, whichaddresses some of the structures encountered along the line.The following phase nomenclature is used in the description.Refracted P waves within the five sedimentary layers arelabeled PS1 through PS5, reflections from the base of theselayers are named PS1P through PS5P. For refractions within thethree crustal layers, the terms Pc1 (upper crust), Pc2 (middlecrust), and Pc3 (lower crust) are used; Pc1P and Pc2P are reflec-tions from the base of the upper and middle crust, respectively.The crust-mantle boundary (Moho) is marked by PmP reflec-tions and refractions in the mantle are named Pn. Shear phasesuse the letter S instead of P.
Figure 2 illustrates some complexity encountered in theeastern part of Line 3. The refraction within sediment layer S3(PS3) has a phase velocity of 6.2 km s-1. At an offset of 33 km,this phase fades out and the next visible refraction Pc1 isdelayed by c. 800 ms. This indicates a low-velocity zone(LVZ) underneath layer S3 down to the basement.
99

The following description of record sections begins in the eastat Pituffik/Thule Air Base and moves subsequently westwards.Station 17 (Fig. 3) records the last part of a refraction withinsediment layer S2 (PS2) with a phase velocity of 4.8 km s-1. ThePS3 refraction is very strong up to an offset of 33 km and conti-nues weakly up to 45 km. A corresponding S phase (SS3)displays similar characteristics. The delay to the Pc1 phase iscaused by the LVZ as mentioned above. The Moho reflectionPmP can be identified between offsets of 40 and 210 km, defi-ning large parts of the Moho geometry along the profile.Rather unusual is the observation of a P to S conversion at theMoho (PmS) at 11.3 s reduced travel time with high amplitudesbetween 69 and 88 km on the vertical component. On the East-component, the phase is even more prominent. PmS phases arethought to indicate a fairly sharp Moho transition relative tothe incident P wavelength (GUEST et al. 1993). At offsets of c.200 km, there are hints of a rather weak arrival ahead of the
PmP with a phase velocity of 7.0 km/s. This observationmatches the predicted arrival time of the Pc3.
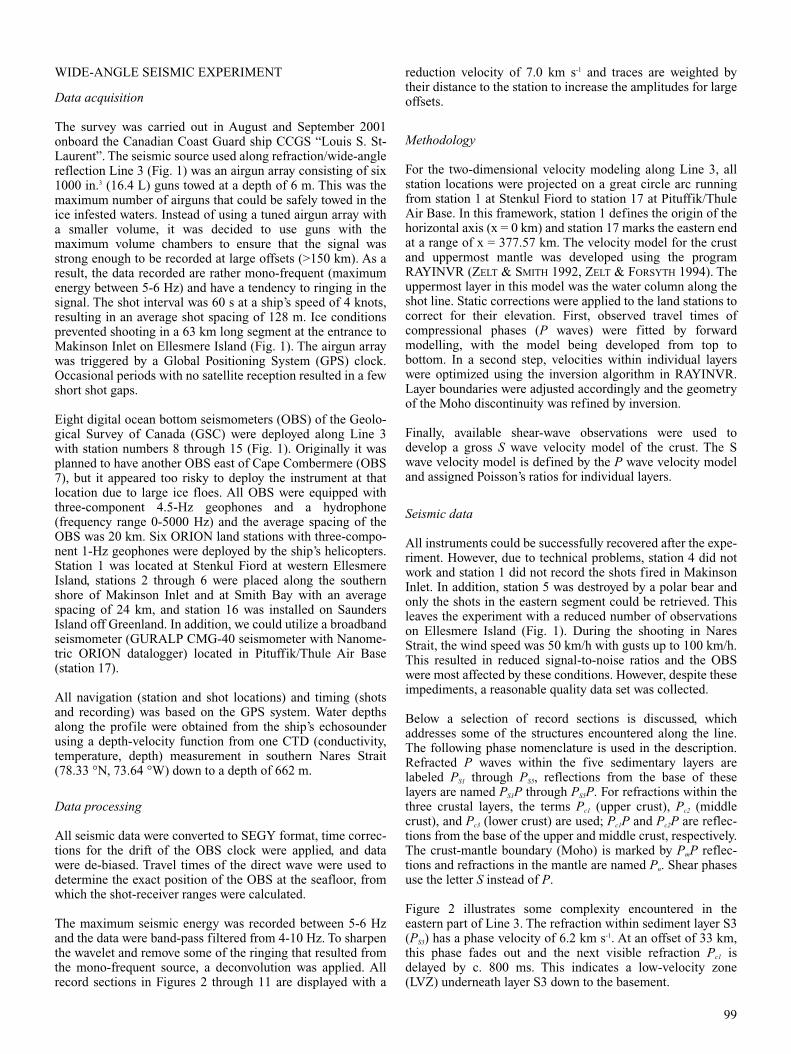
Station 16 (Fig. 4) is located on Saunders Island close to theeastern end of Line 3. As discussed above the record isaffected by the LVZ, causing the delay between the PS3 and Pc1
phases. The PS3 has a high amplitude and so has the correspon-ding shear wave SS3. Although by definition no refractionsfrom the LVZ can be observed, there is a strong reflection ofthe base of the LVZ (PS4P). The PmP phase on station 16 isagain characterized by high amplitudes, weak pre-critical PmParrivals can be identified as close as 24 km.
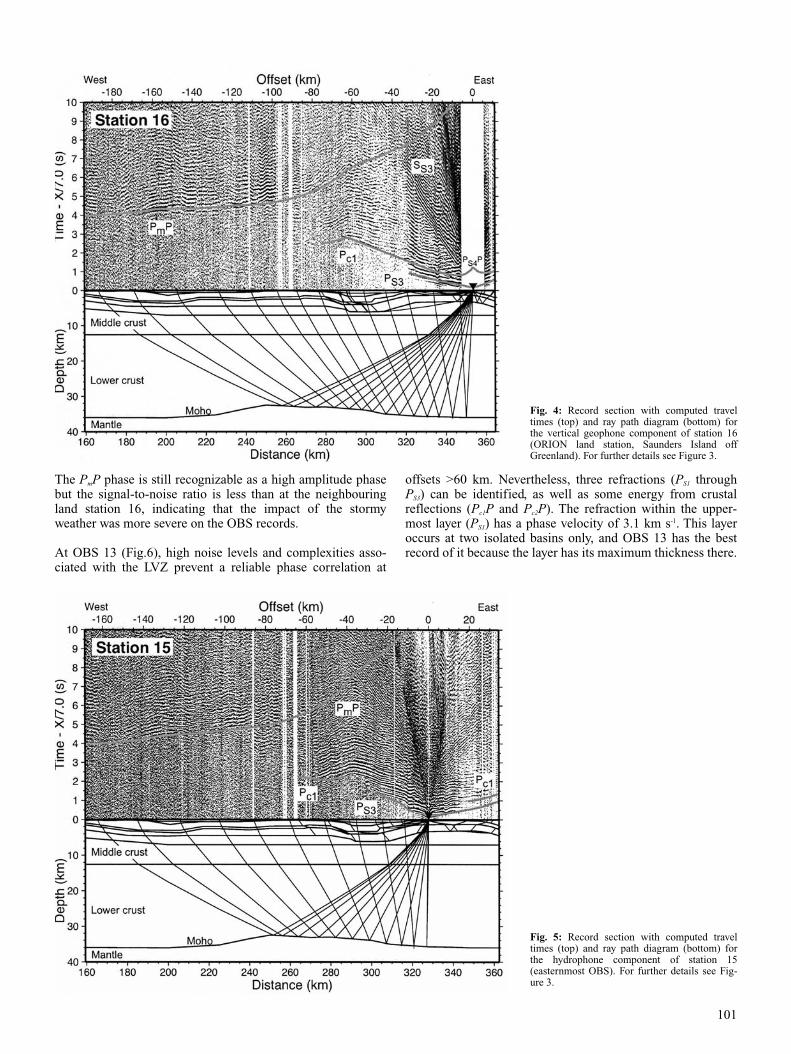
OBS 15 (Fig. 5) indicates a westward dip of sediment layer 3,as the PS3 phase velocities are lower to the west (<5.8 km s-1)than to the east (6.5 km s-1). Pc1 arrivals show the characteristicjump relative to the PS3, indicating that the LVZ is still present.
100
Fig. 2: Detail of record section for the verticalgeophone component of station 16 (ORION landstation, Saunders Island off Greenland). Hori-zontal scale is shot-receiver distance (offset) andthe vertical scale is the travel time using a reduc-tion velocity of 7.0 km s-1. Processing includes aband-pass filter from 4 to 10 Hz. Traces areweighted by their distance to the station.
Fig. 3: Record section with computed travel times (top) and ray path diagram (bottom) forthe vertical geophone component of station 17(broadband seismometer in Pituffik / Thule AirBase). Horizontal scale in the record section isshot-receiver distance (offset) and the verticalscale is the travel time using a reduction velocityof 7.0 km s-1. A triangle indicates the receiver lo-cation. See text for description of phases. Thehorizontal scale in the ray path diagram is distance along the velocity model.
The PmP phase is still recognizable as a high amplitude phasebut the signal-to-noise ratio is less than at the neighbouringland station 16, indicating that the impact of the stormyweather was more severe on the OBS records.
At OBS 13 (Fig.6), high noise levels and complexities asso-ciated with the LVZ prevent a reliable phase correlation at
offsets >60 km. Nevertheless, three refractions (PS1 throughPS3) can be identified, as well as some energy from crustalreflections (Pc1P and Pc2P). The refraction within the upper-most layer (PS1) has a phase velocity of 3.1 km s-1. This layeroccurs at two isolated basins only, and OBS 13 has the bestrecord of it because the layer has its maximum thickness there.
101
Fig. 4: Record section with computed travel times (top) and ray path diagram (bottom) forthe vertical geophone component of station 16(ORION land station, Saunders Island off Greenland). For further details see Figure 3.
Fig. 5: Record section with computed travel times (top) and ray path diagram (bottom) forthe hydrophone component of station 15 (easternmost OBS). For further details see Fig-ure 3.

For OBS 9 (Fig. 7) the signal-to-noise ratio is improved again.Along the shot segment in Makinson Inlet, the Moho reflec-tion PmP can be identified. OBS 8 (Fig. 8) shows clear PmPreflections to either side of the instrument. However, no clearPc1 phase is recognizable on that record section. To the west,this could be related to the shot gap off Ellesmere Island atoffsets where the Pc1 phase would be expected. Its absence to
the east may be related to complications associated with theLVZ. The velocity within the upper crustal layer might beslightly lower than in the high velocity sediment layer 3,preventing upper crustal refractions. Comparison betweenphase velocities of the Pc1 and PS3 at other stations showssimilar values around 6.0 km s-1, in support of this explanation.
102
Fig. 6: Record section with computed travel times (top) and ray path diagram (bottom) forstation 13 (OBS in eastern Nares Strait). For fur-ther details see Figure 3.
Fig. 7: Record section with computed travel times (top) and ray path diagram (bottom) forthe vertical geophone component of station 9(OBS in western Nares Strait). For further de-tails see Figure 3.

Stations on Ellesmere Island are not affected by the complica-tions associated with the LVZ in the Thule Basin. Land station3 (Fig. 9) recorded both refractions from within the upper andmiddle crust (Pc1 and Pc2) up to offsets of 160 km. The recordalso exhibits a strong PmP phase and has the clearest Pn phaseof all stations. The mantle refraction can be correlated from130 to 300 km with the highest amplitudes observed at offsets
of 200 to 230 km. The station is not located on basement(upper crust) as can be seen by an additional refraction PS5 thatcomes in before the Pc1 phase. The phase velocity of the PS5 isaround 5.0 km s-1.
Station 2 (Fig. 10) at the westernmost end of Makinson Inlethas an excellent signal-to-noise ratio and recorded both high-
103
Fig. 8: Record section with computed travel times (top) and ray path diagram (bottom) forthe hydrophone component of station 8 (westernmost OBS). For further details see Fig-ure 3.
Fig. 9: Record section with computed travel times (top) and ray path diagram (bottom) forthe vertical geophone component of station 3(ORION land station, western part of MakinsonInlet). For further details see Figure 3.

amplitude P and S refractions from within the upper crust (Pc1
and Sc1). Just before the major shot gap, a strong phase followsthe Pc1 at an offset of 52 km. It could be either a reflection(Pc2P) or more likely a diffraction from the mid-crustalboundary based on calculations from the velocity model. Tothe east of the shot gap, a weak refraction can be correlated,which is interpreted as Pc3 phase, followed by strong PmPreflections.
Modelling of station 1 (Fig. 11) was difficult, because of theinstrument’s failure to record the shots in Makinson Inlet; theclosest shot was at an offset of 161 km. When the velocitymodel is continued horizontally from station 2 towards station1, the calculated arrival times of the PmP phase appear to comein ca. 700 ms too early, if the moderate amplitude phasebetween 160 and 180 km is indeed the PmP. A better fit can beachieved in many ways, e.g. by a deepening of the Moho, a
104
Fig. 10: Record section with computed travel times (top) and ray path diagram (bottom) forthe vertical geophone component of station 2(ORION land station, westernmost station atMakinson Inlet). For further details see Figure 3.
Fig. 11: Record section with computed travel times (top) and ray path diagram (bottom) forthe vertical geophone component of station 1(ORION land station at Stenkul Fiord, easternEllesmere Island). For further details see Figure3.

reduction of crustal velocities west of station 2 or by introdu-cing thicker/slower sediment layers around station 1. None ofthese alternatives can be confirmed by the seismic data due tothe lack of observations, in particular lack of reverse observa-tions, and therefore no attempt was made to improve the traveltime fit for this instrument. The remaining stations notdiscussed in this section are shown with the ray-tracing andtravel time curves in Figure 12.
RESULTS
Velocity model
The velocity model (Fig. 13) shows a 5-km thick sedimentpackage consisting of three individual layers (sediment layers2 through 4) between km 132 and 378. This package is inter-preted to represent the Thule Supergroup (Thule Basin). Theuppermost layer (sediment layer 2) is ~2 km thick, P wavevelocities range from 4.5 to 5.0 km s-1, and the Poisson’s ratiois 0.30. The velocity of the middle layer (sediment layer 3) is6.1 km s-1 and its Poisson’s ratio is 0.28. The thickness of thislayer is not very well determined, since no reflections from itsbase were observed and the velocity inversion preventedrefractions in the underlying layer. However, to model therange of the PS3 phase, lateral thickness variations wererequired. The model uses a thickness of 1000 m in the east and400 m in the west giving a general sense of the lateral
thickness variations in this layer. Due to the low velocity zone,no velocity information was obtained from within the lower-most layer in the Thule Group (sediment layer 4). In themodel, we are assuming a velocity of 5.05 km s-1, whichpresents the downward continuation of velocities found in theupper layer (4.5-5.0 km s-1). The base of the Thule Group isdefined by occasional reflections (PS4P) and by crustal refrac-tions (Pc1), locating it at a depth between 4.4 and 6.2 km,before the Thule Basin thins westwards and eventually disap-pears at km 132. However, these depth values depend on thevelocities in sediment layer 4.
Within the Thule Supergroup, two isolated sedimentary basins(sediment layer 1) can be identified with lower velocities. Oneof these basins is located at km 200 with velocities of 3.2 km s-1. Its maximum thickness is 800 m. The other basin extendsfrom km 280 to 310 with a maximum thickness of 900 m andvelocities of 2.9 km s-1. West of km 105, a 900 m thick layer(sediment layer 5) with a velocity of 5.05 km s-1 was intro-duced to explain the delay of crustal refractions in the area ofMakinson Inlet.
The crust is divided into three layers. The base of the uppercrust is at a depth of 4.7 km west of km 150 and at a depth of7.0 km in the eastern part. Velocities range from 5.95-6.05 kms-1 in the west to around 6.15 km s-1 in the east. The Poisson’sratio in the upper crust is 0.25. Velocities in the middle crustare around 6.1 km s-1 in the west and 6.2 km s-1 in the east with
105
Fig. 12: Comparison of observed and calculatedtravel times for stations 5, 6, 10, 11, 12, and 14,shown together with the corresponding ray paths. Observed data are indicated by verticalbars with heights representing pick uncertainty;calculated data are indicated by solid lines. Tri-angles mark the receiver locations. Horizontalscale is the model position; a reduction velocityof 7.0 km s-1 has been applied for the travel times.

a Poisson’s ratio of 0.26. The mid-crustal boundary, whichseparates middle and lower crust is located at a depth of 13.5km in the west and 12.5 km in the east. Lower crustal veloci-ties do not show lateral variations, they are 6.65 km s-1 at thetop and 6.85 km s-1 at the bottom of the layer with a Poisson’sratio of 0.26.
The crust-mantle boundary is at a depth of 36 km but shallowsslightly between km 210 and 330 where a minimum Mohodepth of 33 km is found. Velocities in the uppermost mantleare best modelled with 8.15 km s-1.
Model Resolution and uncertainty
Travel time residuals, number of observations, and normalized�2 for individual phases are summarized in Table 1. The totalroot-mean-square (rms) misfit is 151 ms. The estimated pickuncertainty varied between 50 ms for high-amplitude observa-tions close to the stations to 250 ms for low-amplitude arrivalsat larger offsets. The �2 of the experiment is 2.247, comparedto the optimum value of 1.0, when all arrivals are modelledwithin the given pick uncertainties. The rather high �2 value inthis study is mainly attributed to the complex velocity struc-ture in the upper few kilometres of the model, which made theray tracing difficult. Often head waves had to be used insteadof refracted waves to obtain the desired ray coverage. Thesedifficulties are related to the low velocity zone (LVZ) encoun-tered in sediment layer 4. The fact that the velocities above andbelow the LVZ are very similar, added to the ray tracingproblems. In addition, sediment layer 3 was very sensitive to
changes in the model because refractions (PS3) within thisrather thin layer often were required to propagate for 40 ormore kilometres.
Figure 14 shows the values of the diagonal of the resolutionmatrix for the velocity nodes of the model. Ideally, thesevalues are 1, with values <1 indicating spatial averaging of thetrue Earth’s structure by a linear combination of model para-meters (ZELT 1999). Resolution matrix diagonals of greaterthan 0.5-0.7 indicate reasonably well resolved model parame-ters (LUTTER & NOWACK 1990). Using this definition, thewesternmost part of the model is poorly constrained. This is
106
Fig. 13: P wave velocity model with a contour interval (thin solid lines) of 0.1 km s-1 between 5.9 and 8.3 km s-1. Numbers indicate velocity in km/s. Layer bound-aries constrained by reflections are drawn with bold solid lines. Triangles mark the location of receivers (white indicates that all shots were recorded; yellow indicates that the shots in Makinson Inlet were not recorded; red means no data recovery). For some layers, the Poisson’s ratio (σ) is specified. Sed. = sedimentaryrocks.
Tab. 1: Number of observations (n), RMS misfit between calculated andpicked travel times (trms), and normalized �2 for individual phases.

related to shot gaps and station failures in that area. Sedimentlayers 1 and 2 are also poorly resolved due to the lack ofreversed ray-path coverage. However, since the geometry ofthese two layers is mostly defined by the seafloor, the uncer-tainty is less than what the formal resolution analysis indi-cates. Sediment layer 3 (high-velocity basalt layer) is wellconstrained, while velocities in the underlying low-velocityzone (sediment layer 4) are not resolved.
Upper crustal velocities are well resolved, while reasonableresolution in the mid-crustal layer is restricted to the areabetween 60 and 210 km. This reflects the lack of Pc2 arrivals inmost parts of the model. Also Pc3 phases are scarce. However,here the numerous Moho reflections observed over longdistances result in a well-resolved lower-crustal velocity struc-ture east of c. 150 km. Resolution in the mantle is againreduced because long branches of the Pn phase were onlyobserved on OBS 3 (Fig. 9). However, since the Mohogeometry is well constrained, the mantle velocity cannot bevaried too much.
Another way to estimate the uncertainties of the model is tovary individual velocity and boundary nodes and check howmuch they can be varied without a significant increase in thetravel time residuals. The LVZ itself is unconstrained in velo-city, except that it must be lower than in the overlying sedi-ment layer 3. Since sediment layer 3 appears to be intercalatedto the Thule Group, it seems fair to assume that the velocity insediment layer 4 is similar to layer 2. This leaves a total spec-trum of 5.0-6.1 km s-1 as possible velocities for layer 4. Thedepth of the base of the Thule Group depends on this velocity.If the layer 4 velocity were 6.1 km s-1, the Thule basin wouldbe ~450 m deeper. Variations within other layers yield esti-mates that the velocities within sediment layers 1, 2, 3, and 5are accurate within ±0.1 km s-1. In the upper and middle crust,the allowable change in velocity is ±0.15 km s-1, and in thelower crust and mantle ±0.1 km s-1.
Segments of layer boundaries that are mapped by reflectionsare shown as bold lines in Figure 13. This shows that almostthe entire Moho east of km 100 is well constrained and cannotbe changed by more than ±1 km without increasing the traveltime residuals. The layer boundaries between upper/middle
crust and between middle/lower crust are less well mappedand can be varied by up to 2 km. The S wave arrivals are sensi-tive to changes in Poisson’s ratio >0.01.
Gravity Modelling
Two-dimensional gravity modelling (TALWANI et al. 1959) wasperformed along the line to verify how consistent the velocitymodel is with the gravity data. Gravity anomalies wereextracted from the map of OAKEY et al. (2001). The densitymodel was derived from conversion of P wave velocities todensity using the empirical relation of Ludwig, NAFE &DRAKE (1970) that is approximated by
ρ = -0.00283·v4 + 0.0704·v3 - 0.598·v2 + 2.23·v - 0.7
with ρ the density in g cm-3 and v the P wave velocity in km s-1.
Results of the gravity modelling are shown in Figure 15 andindicate a reasonable match between the calculated andobserved gravity. There is some misfit but the positions andshape of the gravity highs and lows are matched. No attemptwas made to modify the model in order to improve the fit. Thereason for this is that the structure is not two-dimensional ascan be seen on the gravity map in Figure 16. For example,close to OBS 8 and 9, there is a lateral change of the gravitysignature. To the north of line 3 there is a gravity low (-80mgal), while immediately to the south a gravity high withvalues of up to 80 mgal is encountered. Similar north-southvariations occur at the Carey Islands and between OBS 13 and14. Other problems can be expected at either end of line 3. Atthe eastern end of line 3, the Thule Supergroup is 5 km thickand this is the value the gravity model was extended with toinfinity to avoid edge effects. However, as the geology map(Fig. 1) indicates, the Thule Group disappears ca. 30 km to theeast of line 3. At the western end of line 3, the continuation ofthe density model to infinity has some problems, too. Asdiscussed above, the velocity model is not constrained verywell for station 1 and the PmP phase indicates some misfit(Fig. 11 and discussion in 3.4). So it is no surprise that thegravity model has the largest misfit at the western end.
107
Fig. 14: Diagonal values of the resolution matrixof the P wave velocity model displayed in con-tour format (0.1 contour interval).

Figure 15 also shows the lithostatic pressure at the base of themodel (50 km). The average pressure is 1450 MPa with varia-tions of ±10 MPa, indicating that the model is approximatelyisostatically balanced at its base. The most pronounced devia-tion occurs in the area with the reduced crustal thickness in thevicinity of the Carey Islands (km 240 to 280).
DISCUSSION
Thule Group
The velocity model (Fig. 13) shows that the Thule Supergroup
is a continuous feature that can be correlated from Greenlandacross Nares Strait to Ellesmere Island, where it thins anddisappears at Cape Combermere (Fig. 1). The most intriguingfeature within the Thule Basin is certainly the interbeddedhigh-velocity layer with velocities around 6.1 km s-1. A Pois-son’s ratio of 0.28 indicates a rather mafic composition of thislayer and CHRISTENSEN & MOONEY (1995) specify the averageP wave velocity of basalts at a depth of 5 km as 5.85 km s-1
(standard deviation of 0.55 km s-1). A basaltic composition ofthe 6.1-km s-1 layer in the Thule Group therefore appearslikely. We assume that the layer correlates with the CapeCombermere Formation (DAWES 1997); a formation thatconsists of a complex suite of effusive, hypabyssal and
108
Fig. 15: Two-dimensional gravity modelling forLine 3. The P wave velocity model (Fig. 13) wasconverted to density using the velocity-densityrelationship of LUDWIG et al. (1970). Densities inthe model (middle) are given in g cm-3, trianglesmark the OBS positions. Observed and calculat-ed gravity anomalies (top) are shown by solidand dashed lines, respectively. The lithostaticpressure (bottom) at the base of the model (depthof 50 km) is shown as solid line.
Fig. 16: Gravity anomaly map (data from OAKEY
et al. (2001). Offshore areas are presented byfree-air gravity, land areas represent Bouguergravity anomalies. Red line = shot segments ofLine 3; yellow circles = position of OBS; bluediamonds = location of seismic land stations.Refraction seismic lines relevant to this study areshown by solid lines; lines 91-1 and 91-3(JACKSON & REID 1994), lines 91-2 and 91-4(REID & JACKSON 1997).

pyroclastic basaltic rocks with interbedded water-lain volca-niclastic and clastic sediments and subordinate siliciclasticcarbonate rocks. Individual sills are up to 140 m thick. Theformation is exposed at Cape Combermere on EllesmereIsland, in the vicinity where the high-velocity layer outcrops /disappears on line 3 (Fig. 13).
Velocities within the upper layer of the Thule Basin (sedimentlayer 2, Fig. 13) of 4.5 to 5.0 km s-1 and a Poisson’s ratio of0.30 are compatible with a high content in carbonates. This isconsistent with rocks found on Saunders Island, the location ofland station 16. Here the Narssârssuk Group is characterizedby a cyclic arrangement of siliciclastic and carbonate units(DAWES 1997). Velocities within the lower layer of the ThuleBasin (sediment layer 4, Fig. 13) are not constrained becausethey represent a low velocity zone. However, with the over-lying layer interpreted as Cape Combermere Formation, sedi-ment layer 4 should represent rocks of the lower Nares StraitGroup, the Northumberland Formation. The dominant litholo-gies are sandstones, mainly quartz arenites, with shale and silt-stone units (DAWES 1997).
The PS3 refractions from the unit interpreted as Cape Comber-mere Formation are the phases that are best recognized on therecord sections and they make sediment layer 3 to be a markerhorizon in the velocity model (Fig. 13). The top of the layer iswell defined east of OBS 8 and shows some depth variationsindicating flexure within the Thule Basin. East of OBS 12, thecharacter of the flexure indicates horst and graben structures.The region between km 285 and 315 is interpreted as a grabenwhile the neighboring area from km 315 to 360 appears as ahorst with uplift. In this zone, the high-velocity layer of theCape Combermere Formation is almost exposed at the surface.Horst and graben structures are also known from the onshoregeology of the Thule Group in Greenland (DAWES 1997).
Two sedimentary basins (sediment layer 1) overlie the ThuleBasin. The basin around km 200 is at the southern tip of thegravity low that correlates with the North Water Basin (Fig.16) mapped by JACKSON et al. (1992). The age of the depositsin the basin is unknown. The other basin around km 295 has Pwave velocities of 2.9 km s-1 and correlates well with anothergravity low that continues into Inglefield Bredning (Fig. 16).The southwestern part of this basin was first defined byNEWMAN (1982) and subsequently called Steensby LandBasin. Again, the age of the strata in the basin is unknown.KEEN & BARRETT (1973) suggest that the basin and the asso-ciated physiographic low are due to erosion by glaciation withpartial infilling by recent sedimentation. Presently, activeglaciers are located at the eastern tip of Inglefield Bredning. Incontrast, HARRISON (2006) correlates the Steensby Land Basininto the North Water Basin (Fig. 1).
Crustal variations across Nares Strait
Rocks within the upper and middle crust of Line 3 are charac-terized by P wave velocities of 6.0-6.3 km s-1 and by a Pois-son’s ratio of 0.25-0.26 (Fig. 13). These properties fit wellwith those of granite (6.1 km s-1 ±0.2, Poisson’s ratio σ = 0.24±0.04), felsic gneiss (6.2 km s-1 ±0.2, σ = 0.25 ±0.03), quartz-mica schists (6.3 km s-1 ±0.1, σ = 0.26 ±0.04) or granodiorite(6.1 km s-1 ±0.4, σ = 0.27 ±0.02) using the compilation ofHOLBROOK et al. (1992). These rock types are compatible with
those typically encountered at the basement of NW Greenland,that are gneiss, schists and granites (DAWES 1976).
North of Line 3, Precambrian granitic gneiss was recovered onthe Greenland side of North Water Basin and measurements ofthis sample gave a P wave velocity of 6.2 km s-1 (NEWMAN
1982). This agrees with our upper crustal velocities of 6.2 kms-1 in that area, and our Poisson’s ratio is also consistent with agneissic composition.
Lower crustal rocks along Line 3 have velocities between 6.65and 6.85 km s-1 and a Poisson’s ratio of 0.26. These values plotbetween intermediate granulite (6.4 km s-1 ±0.2, σ = 0.27±0.03) and metapelite/granulite (7.2 km s-1 ±0.4, σ = 0.27±0.01) (HOLBROOK et al. 1992). Hence, we estimate that thelower crust is composed of granulites.
The velocity model of line 3 (Fig. 13) shows a uniform velo-city structure consistent with the crustal composition foundwithin the shield of northwest Greenland. This lateral homoge-neity strongly suggests that the shield on either side of NaresStrait belongs to the same geological province. Any lateralchange in the velocity structure could have argued in favour ofa plate boundary or of strike-slip movement in Nares Strait inresponse to the northward movement of Greenland relative toNorth America, as predicted by plate reconstructions (ROEST
& SRIVASTAVA 1989).
REID & JACKSON (1997) suggested a transform plate boundaryin southern Nares Strait based on their refraction seismic line91-2 some 80 km to the south of Line 3 (Fig. 1). They locatethe plate boundary within the Carey Basin, where they see aminimum crustal thickness of 7 km compared to up to 20 kmalong the remainder of the line. The thickness of the sedimentsin the Carey Basin is 10 km and additional evidence for strike-slip movement was taken from seismic reflection recordsshowing flower-structures as indication for transpression(JACKSON et al. 1992). The suggested transform plate boundaryextends from Carey Basin to the North Water Basin (REID &JACKSON 1997) and would therefore coincide with the 1 kmdeep sedimentary basin at km 200 on Line 3 (Fig. 13). At thisposition there is no evidence for a shallowing of the Moho asseen on line 91-2. The Moho stays flat at a depth of 36 km.Also there is no jump in the geometry of the Thule Group or ofother layer boundaries that could indicate strike-slip motion.
Based on the velocity model of Line 3, the most likely positionof a transform plate boundary would be in the area of theMoho uplift between km 250 and 300, where the young sedi-mentary basin (sediment layer 1) and graben structure withinthe Thule Group is observed at km 300. However, the trend ofthis basin does not follow Nares Strait but turns towardsGreenland as seen by the associated gravity low (Fig. 16). Theshallowing of the Moho is interpreted to be a local feature andnot a linear trend that could delineate a transform plateboundary. The gravity map (Fig. 16) reveals a circular patternaround the Carey Islands that correlates with the change inMoho depth as seen in the gravity modelling (Fig. 15). Theshallowing of the Moho is interpreted to be associated withuplift at the Carey Islands and the age of this uplift is probablyolder than 120 Ma based on apatite (U-Th) He data (pers.comm. A. Grist 2003). This predates the opening of theLabrador Sea, with sea-floor spreading starting around 92 Ma(ROEST & SRIVASTAVA 1989). Hence, given the circular shape
109

and the age, it appears unlikely that the observed Moho shallo-wing on Line 3 is associated with a transform boundarybetween Greenland and North America.
Studies of other transform faults may provide an idea how themovement along the fault may affect the crustal structure. Arefraction seismic study across the Dead Sea Transform(DESERT Group et al. 2004) shows an offset of the seismicbasement by 3-5 km under the fault. Moho depth is affectedwithin a 40-km-wide zone with a maximum shallowing of 2km. Crustal velocities do not change across the fault. Theseresults indicate that a transform fault is most likely detected byvariations of the layer geometry. Variations of such dimensionsare observed in our velocity model (Fig. 13) but a relation to atransform fault is dismissed (see above). If there was a trans-form fault in Nares Strait with similar characteristics as theDead Sea Transform, seismic resolution should have beensufficient to recognize the fault.
Given the continuity in the nature of the crust and the undi-sturbed correlation of a 5 km thick sequence of sediments ofthe Thule Supergroup across Nares Strait, we suggest that theshield of southwestern Ellesmere Island could be part of theGreenland plate. In this case, the plate boundary should belocated west of the Archean/Proterozoic shield, which isapproximately west of station 3 (Fig. 1). This is also the regionthat is least constrained in our velocity model. The recordsection of station 1 (Fig. 11 and discussion in below) indicatessome changes in the velocity model at the western end of theline, which is not surprising given the changing surfacegeology. However, the resolution of the data in the western-most portion of Line 3 is not sufficient to map lateral velocityvariations.
Comparison with other studies
Other available refraction seismic data in the vicinity of Line 3include the four lines from the 1991 experiment. Lines 91-1
and 91-3 (JACKSON & REID 1994) are the most relevant linessince they cross or lie within the immediate vicinity of Line 3.Figure 17 summarizes some velocity-depth profiles of theselines for comparison with Line 3. At the crosspoint of lines 3and 91-3, the depth of the Thule Basin is 4 km in both casesand the Moho depth differs by less than 1 km. This is an excel-lent agreement. Slight differences can be seen in lower crustalvelocities, which are 6.3-6.6 km s-1 on line 91-3 and 6.7-6.8km s-1 on Line 3. However, the signal-to-noise ratio on line 91-3 is generally not as good as on Line 3 and line 91-3 lacks PmPreflections that can be observed over wide ranges, which werethe major constraint on the lower crustal velocities on Line 3(e.g., station 16, Fig. 4).
At its northern end, line 91-1 (Fig. 1) is less than 10 km awayfrom line 3. There seems to be a difference of >13 km in Mohodepth between the two lines (Fig. 17), which is a substantialmisfit. On Line 3, Moho depth is constrained by PmP reflec-tions in the vicinity of the northern end of line 91-1. On line91-1, Moho is also well constrained by PmP reflections withexception of the northernmost 30 km of the line. In order to fitthe models for the two lines, the Moho needs to shallow by 13km from the northernmost constrained point on line 91-1 toLine 3, which is a 40 km-wide zone. This is a large change ofMoho depth over such a short distance. However, the gravitymap (Fig. 16) provides some support that this change is notunreasonable. The part of line 91-1 that has a Moho depth of21 km lies within the prominent gravity high in the centre ofBaffin Bay that disappears just to the south of Line 3. Themaximum free-air gravity on line 91-1 is 75 mgal anddecreases to -13 mgal on Line 3 where the two lines areclosest. This variation in gravity can be matched by a substan-tial change in Moho depth, which indicates that the apparentdiscrepancy in crustal thickness between lines 3 and 91-1 (Fig.17) is real. The thickness variations are probably related to thegeneral southward thinning of the continental crust in Nort-hern Baffin Bay as the line is approaching the continent-oceanboundary. This is also evidenced by line 91-2 that is parallel toLine 3 some 70 km to the south. Here the minimum Moho
110
Fig. 17: Velocity-depth profiles for Line 3 andcomparison with results from lines 91-1 and 91-3 (JACKSON & REID 1994). For locations see Fig-ure 1.

depth is 17 km (REID & JACKSON 1997).
The model of line 91-1 does not show the high-velocity layerin the Thule Basin as modelled for Line 3. However, inspec-tion of the record section of the northernmost OBS on line 91-1 (Fig. 5 in JACKSON & REID (1994)) shows evidence for alow-velocity zone (the delay occurs at an offset of 12 km)similar to the stations on Line 3 (e.g., Fig. 2). JACKSON & REID
(1994) define the basement (velocity of 5.7 km s-1) on line 91-1 at about the same depth level (~2.5 km) where we see thehigh-velocity layer (6.1 km s-1) within the Thule Basin on Line3 (Fig. 17). If the upper crustal layer on line 91-1 is reinter-preted as a high-velocity layer compatible to sediment layer 3,the two lines match reasonably well.
Lower crustal velocities of 6.2-6.7 km s-1 on lines 91-1 and 91-3 (JACKSON & REID 1994) are significantly lower than thoseobserved on Line 3 (6.7-6.9 km s-1; Fig. 17). We attribute thismisfit to the generally lower data quality on the older lines, onwhich no mid-crustal reflections (Pc2P) were identified.JACKSON & REID (1994) continued therefore the rather lowmid-crustal velocities down to the base of the crust. Despitethe general lack of lower crustal refractions in both experi-ments, the lower crust on Line 3 is well resolved (Fig. 14) bynumerous PmP reflections observed over wide ranges. Incontrast, resolution on lines 91-1 and 91-3 was not deter-mined.
Other crustal scale observations from the general working area include the teleseismic receiver function analysis of DARBYSHIRE (2003). The most relevant stations in the broad-band seismometer network are the ones in Pituffik/Thule AirBase (the same recorder as our station 17 on Line 3) and thestation in Grise Fiord on southern Ellesmere Island (Fig. 1).Both stations are located on the Archean/Lower Proterozoicshield. The station at Grise Fiord shows the Moho as a promi-nent discontinuity at a depth of 34 km and the S wave velocityas 3.8 km s-1 below a depth of 21 km. These values comparewell with Line 3, with a crustal thickness of 36 km and lowercrustal S wave velocities of 3.8-3.9 km s-1. This is an indepen-dent confirmation for the accuracy of the Poisson’s ratiosobtained for Line 3. The northwestern receiver functions forthe station in Pituffik/Thule Air Base yield a Moho depth of37 km and S wave velocities at a depth from 3-20 km are 3.50km s-1 (DARBYSHIRE 2003). Likewise, DAHL-JENSEN et al.(2003) calculate a Moho depth of 37 km at the Pituffik/ThuleAir Base station from receiver function analysis. These resultsalso match our observations on the eastern end of Line 3where the Moho depth is 36 km and upper and mid-crustal Swave velocities are 3.55 km s-1.
CONCLUSIONS
Seismic refraction Line 3 confirms that the Proterozoic ThuleBasin is an intracratonic feature that can be correlated conti-nuously from Greenland through Nares Strait to eastern Elles-mere Island. The thickness of the basin varies between 4-5 kmand the most characteristic layer within the basin is a high-velocity layer, which is probably associated with basaltic sillsof the Cape Combermere Formation. Depth variations of thiswell-mapped layer indicate horst and graben structures withinthe basin.
P wave velocities, Poisson’s ratios and Moho depth are almostidentical on the Canadian Shield and in Greenland, indicatingthat both sides of Nares Strait belong to the same geologicalprovince. Absence of significant lateral changes within thecrust is difficult to reconcile with interpretations that southernNares Strait is a major plate-tectonic boundary separatingGreenland from North America. However, this could still leavethe possibility that strike-slip movement occurred within theArchean/Lower Proterozoic shield, which would be difficult toresolve if the crustal composition on either side of the fault issimilar. If there is a strike-slip fault, the most likely horizons todetect it would be the Thule basin and the Moho, since theseare well imaged. However, despite undulations in the depth ofthe high-velocity layer in the Thule basin (sediment layer 3)there is no indication for a sudden jump in layer depth, whichcould support a strike-slip fault. Similarly, the Moho stays flatat 36 km other than in the zone from km 220-320. But thisMoho shallowing is associated with local uplift around theCarey Islands and there is no linear trend in the gravity data(Fig. 16) that would suggest that the crustal thinning is a linearfeature as one would expect from a fault.
In consequence, if there is no obvious transform plateboundary in southern Nares Strait, eastern Ellesmere Island ispossibly part of the Greenland plate and moved together withit. In this case, the plate boundary could be located on Elles-mere Island. Moho depth on line 3 is basically not resolvedwest of km 100 (Fig. 13), which is also the region where thecrustal velocities are less resolved. Hence, there could beroom in the velocity model to accommodate a plate boundarywest of km 100, which is just not resolved by the sparse data inthat region. More likely it should be found west of km 60where the surface geology changes from the Archean/Protero-zoic shield in the east to Paleozoic rocks of the Arctic platformin the west (Fig. 1).
ACKNOWLEDGMENTS
We thank the officers, crew, helicopter pilots, technicians, andscientists onboard CCGS “Louis S. St-Laurent” for thesupport in carrying out the experiment. Trine Dahl-Jensenprovided the data from the broadband seismometer inPituffik/Thule Air Base. The manuscript was improved byconstructive comments by Keith Louden and Wilfried Jokat.The Nares Strait cruise was funded by the German FederalAgency of Geosciences and Natural Resources (BGR) and bythe Geological Survey of Canada (GSC). Data analysis wascovered by grants of the Danish National Research Foundation(Danmarks Grundforskningsfond).
References
Bendix-Almgreen, S.E., Fristrup, B. & Nichols, R.L. (1967): Notes on thegeology and geomorphology of the Carey Øer, north-west Greenland.-Meddel. om Grønland 164: 1-19.
Christensen, N.I. & Mooney, W.D. (1995): Seismic velocity structure andcomposition of the continental crust: a global view.- J. Geophys. Res. 100:9761-9788.
Dahl-Jensen, T., Larsen, T.B., Woelbern, I., Bach, T., Hanka, W., Kind, R.,Gregersen, S., Mosegaard, K., Voss, P. & Gudmundsson, O. (2003): Depthto Moho in Greenland: Receiver function analysis suggest two Protero-zoic blocks in Greenland.- Earth Planet. Sci. Letters 205: 379-393.
Darbyshire, F.A. (2003): Crustal structure across the Canadian high Arcticregion from teleseismic receiver function analysis.- Geophys. J. Internat.
111

152: 372-391.Dawes, P.R. (1976): Precambrian to Tertiary of northern Greenland.- In: A.
Escher & W.S. Watt (eds), Geology of Greenland, Geol. Surv. Greenland,Copenhagen, 248-303.
Dawes, P.R. (1997): The Proterozoic Thule Supergroup, Greenland andCanada: History, lithostratigraphy and development.- Geol. GreenlandSurv. Bull. 174: 1-150.
Dawes, P.R. & Kerr, J.W. (1982a): Nares Strait and the drift of Greenland: aconflict in plate tectonics.- Meddel. om Grønland, Geosci. 8: 1-392.
Dawes, P.R. & Kerr, J.W. (1982b): The case against major displacement alongNares Strait.- Meddel. om Grønland, Geosci. 8: 369-386.
DESERT Group, Weber, M., Abu-Ayyash, K., Abueladas, A., Agnon, A., Al-Amoush, H., Babeyko, A., Bartov, Y., Baumann, M., Ben-Avraham, Z.,Bock, G., Bribach, J., El-Kelani, R., Förster, A., Förster, H.J., Frieslander,U., Garfunkel, Z., Grunewald, S., Götze, H.J., Haak, V., Haberland, Ch.,Hassouneh, M., Helwig, S., Hofstetter, A., Jäckel, K.-H., Kesten, D., Kind,R., Maercklin, N., Mechie, J., Mohsen, A., Neubauer, F.M., Oberhänsli, R.,Qabbani, I., Ritter, O., Rümpker, G., Rybakov, M., Ryberg, T., Scherbaum,F., Schmidt, J., Schulze, A., Sobolev, S., Stiller, M., Thoss, H., Weckmann,U. & Wylegalla, K. (2004): The crustal structure of the Dead Sea Trans-form.- Geophys. J. Internat. 156: 655-681.
Funck, T., Jackson, H.R., Reid, I.D. & Dehler, S.A. (2002): Refraction seismicstudies in Nares Strait between Ellesmere Island, Nunavut, and northwestGreenland.- Current Res. 2002-E11: 1-6, Geol. Surv. Canada.
Guest, W.S., Thomson, C.J., & Spencer, C.P. (1993): Anisotropic reflection andtransmission calculations with application to a crustal seismic surveyfrom the East Greenland shelf.- J. Geophys. Res. 98: 14161-14184.
Harrison, J.C. (in press) Development of a new Geological map of the NaresStrait region.
Holbrook, W.S., Mooney, W.D. & Christensen, N.I. (1992): The seismic velo-city structure of the deep continental crust.- In: D.M. Fountain, R. Arculus& R. Kay (eds), Continental lower crust, Elsevier, Amsterdam, 1-43.
Hood, P.J. & Bower, M. (1975): Northern Baffin Bay: Low level aeromagneticprofiles obtained in 1974.- Report Activ., Part A. Geol. Surv. Canada,Paper 75-1A, 89-93.
Jackson, H.R., Dickie, K. & Marillier, F. (1992): A seismic reflection study ofnorthern Baffin Bay: Implication for tectonic evolution.- Can. J. EarthSci. 29: 2353-2369.
Jackson, H.R. & Reid, I. (1994): Crustal thickness between the Greenland andEllesmere Island margins determined from seismic refraction.- Can. J.Earth Sci. 31: 1407-1418.
Keen, C.E. & Barrett, D.L. (1973): Structural characteristics of some sedimen-
tary basins in northern Baffin Bay.- Can. J. Earth Sci. 10: 1267-1278.Ludwig, W.J., Nafe, J.E. & Drake, C.L. (1970): Seismic refraction.- In: A.E.
Maxwell (ed), The Sea, Wiley Interscience, New York, 53-84.Lutter, W.J. & Nowack, R.L. (1990): Inversion for crustal structure using
reflections from the PASSCAL Ouachita experiment.- J. Geophys. Res.95: 4633-4646.
Newman, P.H. (1982): Marine geophysical study of southern Nares Strait.-Meddel. om Grønland, Geosci. 8: 255-260.
Oakey, G., Hearty, B., Forsberg, R. & Jackson, H.R. (2001): Gravity anomalymap, Bouguer on land, free air at sea, Innuitian region, Canadian andGreenland Arctic, scale 1:1500000.- Geol. Surv. Canada, Calgary, Openfile 3934D.
Peel, J.S. & Christie, R.L. (1982): Cambrian-Ordovician platform strati-graphy: Correlations around Kane Basin.- Meddel. om Grønland, Geosci.8: 117-135.
Reid, I. & Jackson, H.R. (1997): Crustal structure of northern Baffin Bay:Seismic refraction results and tectonic implications.- J. Geophys. Res.102: 523-542.
Roest, W.R. & Srivastava, S.P. (1989): Sea-floor spreading in the LabradorSea: A new reconstruction.- Geology 17: 1000-1003.
Ross, D.I. & Falconer, R.K.H. (1975): Geological studies of Baffin Bay, DavisStrait, and adjacent continental margins.- Geol. Surv. Canada, Paper 75-1:181-183.
Srivastava, S.P. (1985): Evolution of the Eurasian Basin and its implications tothe motion of Greenland along Nares Strait.- Tectonophysics 114: 29-53.
Talwani, M., Worzel, J.L. & Landisman, M. (1959): Rapid gravity computa-tions for two-dimensional bodies with application to the Mendocinosubmarine fracture zone.- J. Geophys. Res. 64: 49-59.
Trettin, H.P. (1991): Tectonic framework.- In: H.P. Trettin (ed), Geology of theInnuitian Orogen and Arctic platform of Canada and Greenland, Geologyof Canada 3, Geol. Surv. Canada, Ottawa, 57-66.
Williamson, M.-C. (1988): The Cretaceous igneous province of the SverdrupBasin, Canadian Arctic: Field relations and petrochemical studies.- Ph.D.thesis, Dalhousie University, Halifax, 1-416.
Zelt, C.A. (1999): Modelling strategies and model assessment for wide-angleseismic traveltime data.- Geophys. J. Internat. 139: 183-204.
Zelt, C.A. & Forsyth, D.A. (1994): Modeling wide-angle seismic data forcrustal structure: Southeastern Grenville Province.- J. Geophys. Res. 99:11687-11704.
Zelt, C.A., & Smith, R.B. (1992): Seismic traveltime inversion for 2-D crustalvelocity structure.- Geophys. J. Internat. 108: 16-34.
112