a regional perspective ˆˇ˘ 2017 - asean
TRANSCRIPT

Global Value Chains in ASEANA Regional Perspective
PAPER 1J U L Y
2017Global Value Chains in ASEANA Regional Perspective
PAPER 1SEPTEMBER
2017

For inquiries, contact ASEAN-Japan Centre (ASEAN Promotion Centre on Trade, Investment and Tourism)
1F, Shin Onarimon Bldg., 6-17-19, Shimbashi, Minato-ku, Tokyo 105-0004 Japan Phone/Fax: +813-5402-8002/8003 (Planning & Coordination) +81-3-5402-8004/8005 (Trade)+81-3-5402-8006/8007 (Investment)+81-3-5402-8008/8009 (Tourism & Exchange) +81-3-5004-8118/8003 (PR)e-mail address: [email protected]://www.asean.or.jp
Copyright © ASEAN Promotion Centre on Trade, Investment and Tourism. All Rights Reserved.
Paper 1 / September 2017 / Global Value Chains in ASEAN: A Regional Perspective
Global Value Chains in ASEANA Regional Perspective
PAPER 1SEPTEMBER
2017

GLOBAL VALUE CHAINS IN ASE AN – SEPTEMBER 2017ii
List of papers under the project on global value chains in ASEAN by the ASEAN-Japan Centre
The current paper is the first of a 16-paper series on ASEAN GVCs. The other 15 papers were published or will be produced subsequently.
Paper 1. A Regional PerspectivePaper 2. Brunei DarussalamPaper 3. CambodiaPaper 4. IndonesiaPaper 5. Lao People’s Democratic RepublicPaper 6. MalaysiaPaper 7. MyanmarPaper 8. Philippines (Published in July 2017)Paper 9. SingaporePaper 10. ThailandPaper 11. Viet NamPaper 12. AutomobilesPaper 13. ElectronicsPaper 14. Textiles and clothingPaper 15. AgribusinessPaper 16. Tourism
Prepared by Masataka Fujita (ASEAN-Japan Centre – AJC). The author wishes to thank Lizanne Martinez (UNCTAD), Brad Boicourt (UNCTAD), Yuka Kubota (AJC) and other staff members of AJC for their research and statistical assistance and comments. The manuscript was edited by Lise Lingo and typeset by Laurence Duchemin. Errors and omissions are only those of the author and should not be attributed to his organization.
NOTES
The terms country and economy as used in this study also refer, as appropriate, to territories or areas; the designations employed and the presentation of the material do not imply the expression of any opinion whatsoever on the part of the ASEAN-Japan Centre concerning the legal status of any country, territory, city or area or of its authorities, or concerning the delimitation of its frontiers or boundaries.
The following symbols have been used in the tables:
• Two dots (..) indicate that data are not available or are not separately reported.
• A dash (-) indicates that the item is equal to zero or its value is negligible.
• Use of a dash (-) between dates representing years, e.g., 2015–2016, signifies the full period involved, including the beginning and end years.
• Reference to “dollars” ($) means United States dollars, unless otherwise indicated.
PAPER1 A REGIONAL PERSPECTIVE 1
CONTENTS
INTRODUCTION . . . . . . . . . . . . . . . . . . . . . . . . . . . . . . . . . . . . . . . . . . . . . . . . . . . . . . . . . . . . . . . . . . . . . . . . . 3
I. TRENDS AND PATTERNS OF GVCs IN ASEAN . . . . . . . . . . . . . . . . . . . . . . . . . . . . . . . . . . . . 5
1. Current picture of ASEAN GVCs . . . . . . . . . . . . . . . . . . . . . . . . . . . . . . . . . . . . . . . . . . . . . . . . . 52. Evolution of ASEAN GVCs . . . . . . . . . . . . . . . . . . . . . . . . . . . . . . . . . . . . . . . . . . . . . . . . . . . . . . .103. GVC participation . . . . . . . . . . . . . . . . . . . . . . . . . . . . . . . . . . . . . . . . . . . . . . . . . . . . . . . . . . . . . . . . .144. Regional value chains . . . . . . . . . . . . . . . . . . . . . . . . . . . . . . . . . . . . . . . . . . . . . . . . . . . . . . . . . . . .16
II. FIVE INDUSTRIES SUBJECT TO STUDY . . . . . . . . . . . . . . . . . . . . . . . . . . . . . . . . . . . . . . . . . .18
1. Automobiles . . . . . . . . . . . . . . . . . . . . . . . . . . . . . . . . . . . . . . . . . . . . . . . . . . . . . . . . . . . . . . . . . . . . . . .182. Electronics . . . . . . . . . . . . . . . . . . . . . . . . . . . . . . . . . . . . . . . . . . . . . . . . . . . . . . . . . . . . . . . . . . . . . . . .203. Textiles and clothing . . . . . . . . . . . . . . . . . . . . . . . . . . . . . . . . . . . . . . . . . . . . . . . . . . . . . . . . . . . . .214. Agribusiness . . . . . . . . . . . . . . . . . . . . . . . . . . . . . . . . . . . . . . . . . . . . . . . . . . . . . . . . . . . . . . . . . . . . . .235. Tourism. . . . . . . . . . . . . . . . . . . . . . . . . . . . . . . . . . . . . . . . . . . . . . . . . . . . . . . . . . . . . . . . . . . . . . . . . . . .25
III. IMPACTS OF GVCs ON ASEAN ECONOMY . . . . . . . . . . . . . . . . . . . . . . . . . . . . . . . . . . . . . . .26
IV. A POLICY FRAMEWORK FOR ASEAN GVCs . . . . . . . . . . . . . . . . . . . . . . . . . . . . . . . . . . . . .29
1. Embedding GVCs in development strategy . . . . . . . . . . . . . . . . . . . . . . . . . . . . . . . . . . . .292. Enabling participation in GVCs . . . . . . . . . . . . . . . . . . . . . . . . . . . . . . . . . . . . . . . . . . . . . . . . . .293. Building domestic productive capacity . . . . . . . . . . . . . . . . . . . . . . . . . . . . . . . . . . . . . . . . .304. Providing a strong environmental, social and governance framework . . . . .315. Synergizing trade and investment policies and institutions . . . . . . . . . . . . . . . . . .31
CONCLUDING REMARKS: TOWARDS AN INTENSIFIED RELATIONSHIP BETWEEN REGIONAL INTEGRATION AND GVCs . . . . . . . . . . . . . . .32
REFERENCES . . . . . . . . . . . . . . . . . . . . . . . . . . . . . . . . . . . . . . . . . . . . . . . . . . . . . . . . . . . . . . . . . . . . . . . . . .35
ANNEX TABLES . . . . . . . . . . . . . . . . . . . . . . . . . . . . . . . . . . . . . . . . . . . . . . . . . . . . . . . . . . . . . . . . . . . . . . .37

GLOBAL VALUE CHAINS IN ASE AN – SEPTEMBER 20172
PAPER1 A REGIONAL PERSPECTIVE 3
INTRODUCTION
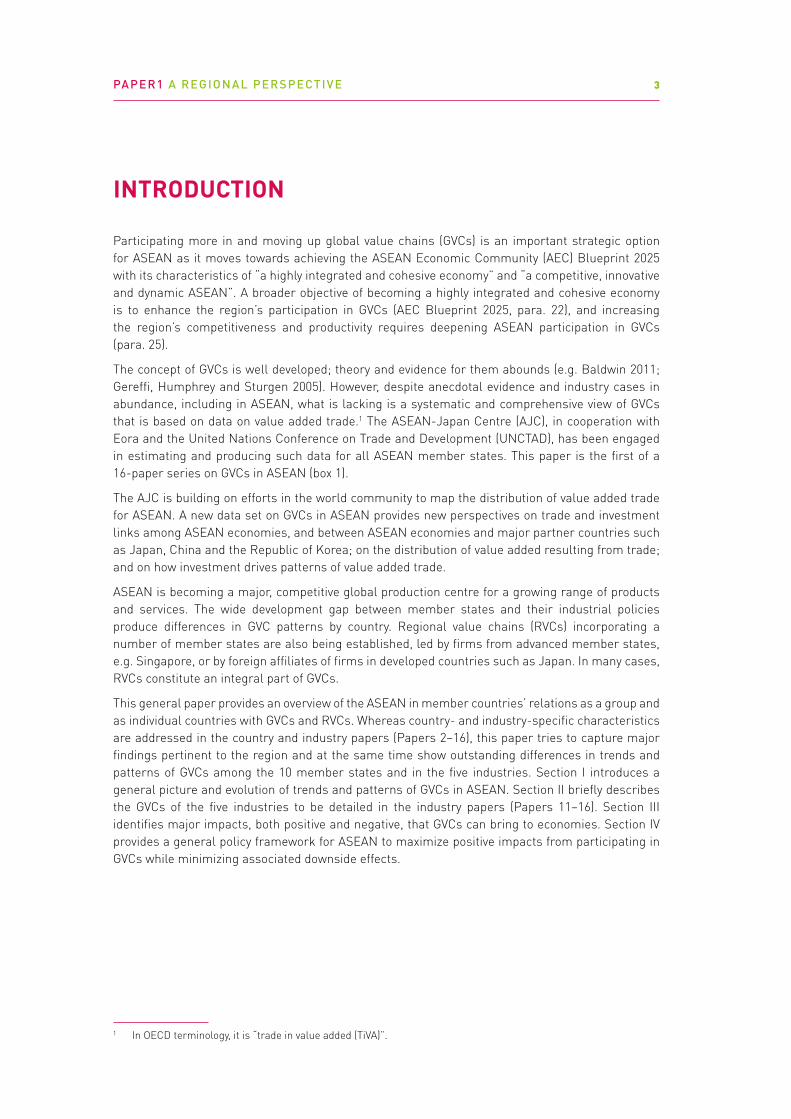
Participating more in and moving up global value chains (GVCs) is an important strategic option for ASEAN as it moves towards achieving the ASEAN Economic Community (AEC) Blueprint 2025 with its characteristics of “a highly integrated and cohesive economy” and “a competitive, innovative and dynamic ASEAN”. A broader objective of becoming a highly integrated and cohesive economy is to enhance the region’s participation in GVCs (AEC Blueprint 2025, para. 22), and increasing the region’s competitiveness and productivity requires deepening ASEAN participation in GVCs (para. 25).
The concept of GVCs is well developed; theory and evidence for them abounds (e.g. Baldwin 2011; Gereffi, Humphrey and Sturgen 2005). However, despite anecdotal evidence and industry cases in abundance, including in ASEAN, what is lacking is a systematic and comprehensive view of GVCs that is based on data on value added trade.1 The ASEAN-Japan Centre (AJC), in cooperation with Eora and the United Nations Conference on Trade and Development (UNCTAD), has been engaged in estimating and producing such data for all ASEAN member states. This paper is the first of a 16-paper series on GVCs in ASEAN (box 1).
The AJC is building on efforts in the world community to map the distribution of value added trade for ASEAN. A new data set on GVCs in ASEAN provides new perspectives on trade and investment links among ASEAN economies, and between ASEAN economies and major partner countries such as Japan, China and the Republic of Korea; on the distribution of value added resulting from trade; and on how investment drives patterns of value added trade.
ASEAN is becoming a major, competitive global production centre for a growing range of products and services. The wide development gap between member states and their industrial policies produce differences in GVC patterns by country. Regional value chains (RVCs) incorporating a number of member states are also being established, led by firms from advanced member states, e.g. Singapore, or by foreign affiliates of firms in developed countries such as Japan. In many cases, RVCs constitute an integral part of GVCs.
This general paper provides an overview of the ASEAN in member countries’ relations as a group and as individual countries with GVCs and RVCs. Whereas country- and industry-specific characteristics are addressed in the country and industry papers (Papers 2–16), this paper tries to capture major findings pertinent to the region and at the same time show outstanding differences in trends and patterns of GVCs among the 10 member states and in the five industries. Section I introduces a general picture and evolution of trends and patterns of GVCs in ASEAN. Section II briefly describes the GVCs of the five industries to be detailed in the industry papers (Papers 11–16). Section III identifies major impacts, both positive and negative, that GVCs can bring to economies. Section IV provides a general policy framework for ASEAN to maximize positive impacts from participating in GVCs while minimizing associated downside effects.
1 In OECD terminology, it is “trade in value added (TiVA)”.

GLOBAL VALUE CHAINS IN ASE AN – SEPTEMBER 20174
Box 1. GVC work undertaken by the ASEAN-Japan Centre: First Phase
This is a multiyear and first-phase research effort, producing every year value chain data for individual countries of ASEAN and analytical papers based on the results of these data. The first year (FY2016) generated basic data sets for ASEAN as a group and its individual member states (which are used in the present paper). In the remaining years, the AJC will produce evidence-based, policy-oriented technical papers while maintaining and updating the database created in the first year.
This work also reinforces the Centre’s technical cooperation programme in trade, investment and tourism by identifying which sectors to target for their promotional activities from the point of view of value chains. It assesses the size and significance of economic partnerships between ASEAN and Japan through GVCs in different sectors, in part to identify for which sectors the Centre should make more promotional efforts and try to derive synergies between its technical cooperation and its analytical contribution.
Output 1: Creation of the database on ASEAN GVCs
On the basis of the UNCTAD-Eora GVC database and further data construction for ASEAN countries, a unique database on GVCs was established for 10 ASEAN member countries, with special emphasis on Japan as a partner. Other important partners of ASEAN such as China and the Republic of Korea are included in the database. This database uses value added trade data derived from the Eora global, multiregional input-output (MRIO) table (www.worldmrio.com). The Centre’s database is called the AJC-UNCTAD-Eora database on ASEAN GVCs. It will be made public after the estimated data on GVCs is validated. Data have been updated from time to time.
Value added trade statistics can lead to important policy insights for trade, investment and development. The Centre, as part of new efforts to conduct research and policy analysis, aims to provide analysis of the relevance, impact and patterns of value added trade and GVCs across ASEAN, and in member countries. The database is helpful for this purpose.
Variables in the database include foreign value added trade, domestic value added trade, value added integrated in other countries’ exports and gross exports for 26 industries in Brunei Darussalam and the CLM countries (Cambodia, the Lao People’s Democratic Republic and Myanmar), 77 industries in Indonesia and the Philippines, 113 industries in Viet Nam, 154 industries in Singapore, 180 industries in Thailand, 298 industries in Malaysia and 462 industries in Japan, covering the period 1990–2013. Data are collected and estimated along these variables in a systematic manner. They are also presented in a standardized industry classification in the database for comparability among ASEAN countries on the following five variables:
• Foreign value added: FVA • Domestic value added: DVA • Value added incorporated in other countries’ exports: DVX• GVC participation: FVA + DVX• Gross exports (total value added exports): FVA + DVA
Output 2: 16 evidence-based, policy-oriented technical reports
In a collaborative effort with the Eora project and UNCTAD, the new database of the Centre will be used to assess the patterns, development impact and policy implications of value added trade and investment. Under this multiyear programme, 16 evidence-based and policy-oriented technical reports will be prepared: in addition to this general paper on ASEAN as a whole (Paper 1), individual reports on 10 ASEAN member countries (Papers 2–11) and five selected industries (Papers 12–16) – electronics, automobiles, textiles and clothing, agribusiness, and tourism. These industries not only are central economic – and strategically important – activities of many ASEAN member countries, but also develop significant GVCs as well as RVCs.

PAPER1 A REGIONAL PERSPECTIVE 5
I. TRENDS AND PATTERNS OF GVCs IN ASEAN
1. Current picture of ASEAN GVCs
Exports data as used in GVCs, which are referred to as value added exports, are all estimated from the countries’ input-output tables. Thus, these data differ to a certain extent from exports data available from customs-clearance-based merchandise trade and those from national account statistics, in the sense that value added exports do not include the value of the trade in materials used for processing2 or the value of re-exports, and are evaluated in the base prices. In trade statistics from certain countries (such as Singapore), re-exports are relatively large and exports are expressed in the freight-on-board price. Therefore, it is often the case that value added exports are lower than regular exports (table 1). For example, in 2013, the most recent year for which value added export data could be estimated, whereas exports of goods and services were $1,562 billion, value added exports amounted to $1,418 billion.
Ownership of each value for value added exports is attributable to a certain industry (not necessarily to the industry of the product) and to a certain country (not necessarily to the country of shipment). Some exports from an ASEAN country may be part of products used as inputs to other export products from another ASEAN country, and other exports may contain inputs from other countries. In total, 38 per cent or $532 billion of ASEAN exports contain imports from other countries, leaving 62 per cent or $886 billion for the value created domestically (figure 1). For the former, the value of imports integrated into a country’s own exports is called foreign value added, and for the latter, it is the domestic value added that constitutes the country’s gross domestic product (GDP) (see box 2 on GVC terminology).
2 Until the publication of the fifth edition of the Balance-of-Payments Manual, the value of processing trade was included in both the merchandise (goods) exports and the imports of the country in question. This approach inflates the value of trade even though it does not belong to the country. In the current edition (BOP6), this practice is no longer used; instead, differences in exports and imports of the processing trade are recorded in the services trade as value added created in the economy (see IMF 2009, Chapter 10).
Table 1. Comparision of value added exports with exports of goods and services from ASEAN, 1990-2015 (Billions of dollars)
Year Value added exports Exports of goods and services
1990-1994 182 243
1995-1999 315 431
2000-2004 429 537
2005-2009 888 972
2010 1 124 1 247
2011 1 369 1 479
2012 1 384 1 530
2013 1 418 1 562
2014 .. 1 597
2015 .. 1 455Source: AJC-UNCTAD-Eora for value added exports data and UNCTAD for exports of goods and services data.

GLOBAL VALUE CHAINS IN ASE AN – SEPTEMBER 20176
From any country’s viewpoint, the more value added accrues to the country, the better. Indeed, in many ASEAN countries, exports generate value added for the country, and its share in GDP is significant. However, not all exports from a country contribute to its GDP, as more than one third of the export value belongs to foreign countries. The real contribution share in ASEAN was 35 per cent in 2013 (figure 2). However, ASEAN should not simply strive for more domestic value added at the expense of lowering foreign value added. As shown later, higher foreign value added is likely to lead to higher economic growth rates. There is a need for proper balance between foreign value added and domestic value added. This is the essence of GVCs.
1 418 532
88638%
Figure 1. Value added exports from ASEAN, 2013 (Billions of dollars)
Source: AJC-UNCTAD-Eora database on ASEAN GVCs.
Gross exports Foreign valueadded in exports
Domestic valueadded in exports
Source: AJC-UNCTAD-Eora database on ASEAN GVCs. GDP data from IMF.
Figure 2. Domestic value added in exports as a share of GDP, 2013 (Per cent)
34%
16%
25%
15%
62%
9%
33%
51%
43%
10%
Brunei Darussalam
Cambodia
Indonesia Lao People's
Democratic Republic
Malaysia
Myanmar
Philippines
Singapore
Thailand
Viet Nam
Average 35%

PAPER1 A REGIONAL PERSPECTIVE 7
Box 2. GVC terminology used in the AJC paper series
A country’s exports can be divided into domestically produced value added and imported (foreign) value added that is incorporated into exported goods and services. Furthermore, exports can go to a foreign market either for final consumption or as intermediate inputs to be exported again to third countries (or back to the original country). The analysis of GVCs takes into account both foreign value added in exports (the upstream perspective) and exported value added incorporated in third-country exports (the downstream perspective). The indicators used in this paper series are as follows:
1. Foreign value added: Foreign value added (FVA) indicates what part of a country’s gross exports consists of inputs that have been produced in other countries. The FVA share is the share of the country’s exports that do not add to its GDP.
2. Domestic value added: Domestic value added (DVA) is the part of exports created in country, i.e. the part of exports that contributes to GDP. Domestic value added can be put in relation to other variables:
• As a share of GDP it measures the extent to which trade contributes to the GDP of a country.
• As a share of global value added trade (the “slice of the value added trade pie”) it can be compared with a country’s share in global gross exports (relative value capture from trade).
The sum of foreign and domestic value added equates to gross exports.
3. Value added incorporated in other countries’ exports: DVX indicates the extent to which a country’s exports are used as inputs to exports from other countries. At the global level, the sum of this value and the sum of foreign value added is the same.
4. GVC participation indicates a country’s exports that is part of a multistage trade process, by adding to the foreign value added used in a country’s own exports (FVA) the value added supplied to other countries’ exports (DVX). Although the degree to which exports are used by other countries for further export generation may appear less relevant for policymakers, as it does not change the domestic value added contribution of trade, the participation rate is a useful indicator for the extent to which a country’s exports are integrated in international production networks.
The GVC participation corrects the limitation of the foreign and domestic value added indicators, in which countries at the beginning of the value chain (e.g. exporters of raw materials) by definition have a low foreign value added content of exports. It gives a more complete picture of the involvement of countries in GVCs, both upstream and downstream.
GVC indicators can also be used to assess the extent to which industries rely on internationally integrated production networks. A number of complex methods have been devised in the literature to measure GVC length; however, the degree of double counting in industries, conceptually, can serve as a rough proxy for the length of GVCs. Data on value added trade by industry can provide useful indications on the comparative advantages and competitiveness of countries, and hence form a basis for development strategies and policies.Source: Adapted from UNCTAD (2013).
Among ASEAN member countries, the contribution of exports to GDP is largest in Malaysia, followed by Singapore and Thailand. The other seven countries show a lower contribution to GDP from exports than the ASEAN average. In the CLMV countries – Cambodia, the Lao People’s Democratic Republic, Myanmar and Viet Nam – for exports, the value created domestically seems to be low, much lower than the ASEAN average. There are different reasons for this low share. For Cambodia, Myanmar and the Lao People’s Democratic Republic, exports are generally small, and thus domestic value
GLOBAL VALUE CHAINS IN ASE AN – SEPTEMBER 20178
added exports are also small, whereas for Viet Nam, exports are growing, but much of their value goes to foreign countries and the domestic value added is small.
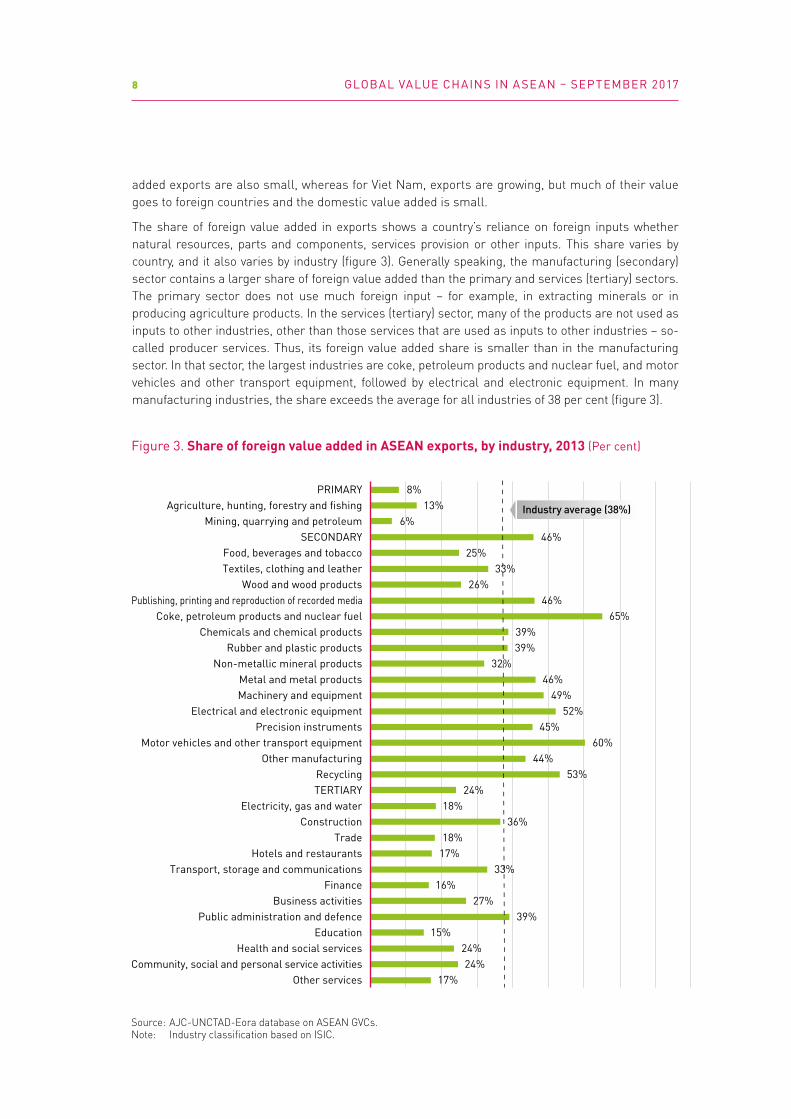
The share of foreign value added in exports shows a country’s reliance on foreign inputs whether natural resources, parts and components, services provision or other inputs. This share varies by country, and it also varies by industry (figure 3). Generally speaking, the manufacturing (secondary) sector contains a larger share of foreign value added than the primary and services (tertiary) sectors. The primary sector does not use much foreign input – for example, in extracting minerals or in producing agriculture products. In the services (tertiary) sector, many of the products are not used as inputs to other industries, other than those services that are used as inputs to other industries – so-called producer services. Thus, its foreign value added share is smaller than in the manufacturing sector. In that sector, the largest industries are coke, petroleum products and nuclear fuel, and motor vehicles and other transport equipment, followed by electrical and electronic equipment. In many manufacturing industries, the share exceeds the average for all industries of 38 per cent (figure 3).
Source: AJC-UNCTAD-Eora database on ASEAN GVCs.Note: Industry classification based on ISIC.
Figure 3. Share of foreign value added in ASEAN exports, by industry, 2013 (Per cent)
Industry average (38%)
8% 13%
6% 46%
25% 33%
26% 46%
65% 39% 39%
32% 46%
49% 52%
45% 60%
44% 53%
24% 18%
36% 18%
17% 33%
16% 27%
39% 15%
24% 24%
17%
PRIMARY Agriculture, hunting, forestry and fishing
Mining, quarrying and petroleum SECONDARY
Food, beverages and tobacco Textiles, clothing and leather
Wood and wood products Publishing, printing and reproduction of recorded media
Coke, petroleum products and nuclear fuel Chemicals and chemical products
Rubber and plastic products Non-metallic mineral products
Metal and metal products Machinery and equipment
Electrical and electronic equipment Precision instruments
Motor vehicles and other transport equipment Other manufacturing
Recycling TERTIARY
Electricity, gas and water Construction
Trade Hotels and restaurants
Transport, storage and communications Finance
Business activities Public administration and defence
Education Health and social services
Community, social and personal service activities Other services

PAPER1 A REGIONAL PERSPECTIVE 9
Differences in the foreign value added share in exports by industry indicate which industries tend to be more engaged in GVCs. The manufacturing sector, in particular electrical and electronic equipment, is the largest exporter in ASEAN, accounting for more than half of the total value added exports. The export capacity and GVCs reinforce each other. The industries with a higher foreign value added share tend to be exporting industries. The services (tertiary) sector contributes about one quarter of total exports; however, this does not mean that services are not important in value added trade. GVCs utilize services extensively. For example, the financial industry creates its own GVCs but also provides financial services to other GVCs. Indeed, many services products or producer services such as professional services are an integral part of production of any kind. Services provide value added inputs. Therefore, altogether more than two fifths of value added in trade is contributed by services sector activities, with Brunei Darussalam, Singapore and Cambodia heading the list in terms of the services share in value added trade (figure 4).
Source: AJC-UNCTAD-Eora database on ASEAN GVCs.
Figure 4. Structure of value added exports from ASEAN, by country and value added creator industry, 2013 (Per cent)
UnspecifiedTertiarySecondaryPrimary
16%
17%
37%
34%
13%
57%
7%
11%
47%
17%
15%
20%
31%
36%
22%
48%
17%
45%
41%
44%
20%
41%
42%
64%
51%
28%
43%
39%
26%
48%
59%
45%
33%
41%
42%
Brunei Darussalam
Cambodia
Indonesia
Lao People's Democratic Republic
Malaysia
Myanmar
Philippines
Singapore
Thailand
Viet Nam
ASEAN
World
0%

GLOBAL VALUE CHAINS IN ASE AN – SEPTEMBER 201710
2. Evolution of ASEAN GVCs
GVCs in ASEAN are manifesting the growth and spread of international and regional production networks in the region.3 These networks involve both transnational corporations (TNCs) and local firms as producers, and they form a number of value chains. Production value chains created in ASEAN spread into several ASEAN countries, forming RVCs, and may often go beyond the region, forming GVCs. Although the formation of GVCs/RVCs differs by industry and in some cases even by product, generally speaking, ASEAN member countries have intensified their production networks by importing more and more intermediate products from abroad and integrating these products into their export products, thus establishing value chains. Furthermore, these export products have been increasingly reintegrated into exports from other countries as intermediate products.
Already in 1990, 35 per cent of ASEAN exports was value added created by foreign countries (foreign value added or FVA – see box 2); in other words, more than one third of exports from ASEAN consisted of foreign inputs. Over the past two decades, ASEAN countries have used significant amounts of foreign inputs in their exports. Today this share, which once reached 40 per cent, is 38 per cent (2013 data – the most recent available year) (figure 5). Interestingly, this share started to decline in the latter half of the 2000s. Its decline implies increases in the share of value added created by domestic entities, both local and foreign firms. This domestic value added part of exports belongs to a country’s own GDP. Although the decline is small, more domestic value added in trade implies greater competitiveness in the ASEAN region. This is because not only do local firms participate in GVCs but also, as shown below, because imported parts and components have been substituted by local production in the region by foreign TNCs.
3 Part of this section is based on Fujita (2014), which is the basis for ASEAN and UNCTAD (2014). Data are updated.
Source: AJC-UNCTAD-Eora database on ASEAN GVCs.
Figure 5. Value added exports from ASEAN, by domestic, ASEAN and other top four foreign country value added creators, 1990, 1995, 2000, 2005, 2010 and 2013 (Per cent)
China United States
Germany Rest of the world
JapanASEANDomestic
0
20
40
60
80
100
1990 1995 2000 2005 2010 2013
Top 4 (excl.ASEAN members)
Domestic
Rest of the world
ASEAN
PAPER1 A REGIONAL PERSPECTIVE 11
Among those foreign inputs used for ASEAN exports, the most important source country until the beginning of the 2000s had long been Japan, followed by the United States (figure 5). However, both countries have lost importance in contributing to ASEAN exports since the mid-2000s. Instead, the share of ASEAN inputs used in their exports has been increasing. This suggests greater competitiveness of ASEAN products as intermediate products over the years. In 2013, ASEAN inputs accounted for 8 per cent of total exports from ASEAN, compared with 3 per cent in 1990 and 6 per cent in 2000 (figure 5). The majority of those inputs have come from Indonesia, Malaysia, Singapore and Thailand. CLMV countries accounted for less than 3 per cent of total ASEAN exports in 2013. Companies based in these countries that are involved in GVCs are still limited in number; growing them requires domestic capacity-building (section IV).
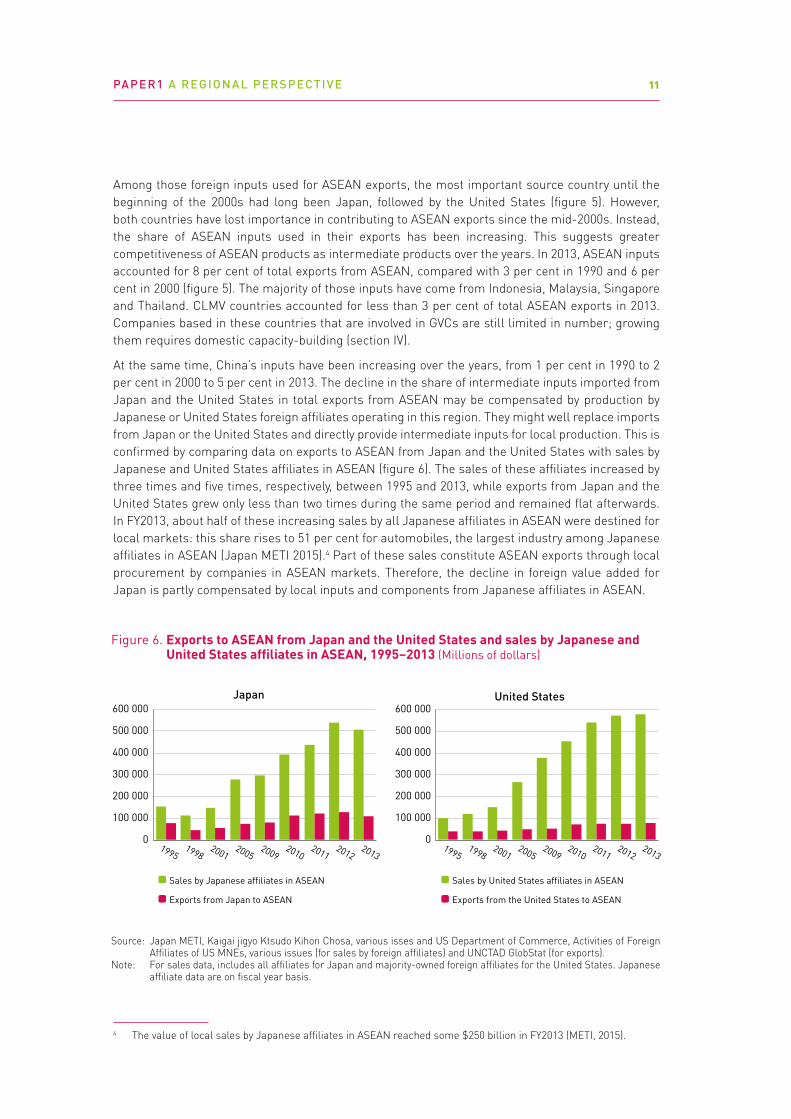
At the same time, China’s inputs have been increasing over the years, from 1 per cent in 1990 to 2 per cent in 2000 to 5 per cent in 2013. The decline in the share of intermediate inputs imported from Japan and the United States in total exports from ASEAN may be compensated by production by Japanese or United States foreign affiliates operating in this region. They might well replace imports from Japan or the United States and directly provide intermediate inputs for local production. This is confirmed by comparing data on exports to ASEAN from Japan and the United States with sales by Japanese and United States affiliates in ASEAN (figure 6). The sales of these affiliates increased by three times and five times, respectively, between 1995 and 2013, while exports from Japan and the United States grew only less than two times during the same period and remained flat afterwards. In FY2013, about half of these increasing sales by all Japanese affiliates in ASEAN were destined for local markets: this share rises to 51 per cent for automobiles, the largest industry among Japanese affiliates in ASEAN (Japan METI 2015).4 Part of these sales constitute ASEAN exports through local procurement by companies in ASEAN markets. Therefore, the decline in foreign value added for Japan is partly compensated by local inputs and components from Japanese affiliates in ASEAN.
4 The value of local sales by Japanese affiliates in ASEAN reached some $250 billion in FY2013 (METI, 2015).
Source: Japan METI, Kaigai jigyo Ktsudo Kihon Chosa, various isses and US Department of Commerce, Activities of Foreign Affiliates of US MNEs, various issues (for sales by foreign affiliates) and UNCTAD GlobStat (for exports).Note: For sales data, includes all affiliates for Japan and majority-owned foreign affiliates for the United States. Japanese affiliate data are on fiscal year basis.
Figure 6. Exports to ASEAN from Japan and the United States and sales by Japanese and United States affiliates in ASEAN, 1995–2013 (Millions of dollars)
Exports from Japan to ASEAN
Sales by Japanese affiliates in ASEAN
Exports from the United States to ASEAN
Sales by United States affiliates in ASEAN
0
100 000
200 000
300 000
400 000
500 000
600 000
0
100 000
200 000
300 000
400 000
500 000
600 000
1995 1998
2001 2005
2009 2010
2011 2012
2013 1995
1998 2001
2005 2009
2010 2011
2012 2013
Japan United States

GLOBAL VALUE CHAINS IN ASE AN – SEPTEMBER 201712
Despite the decline in the foreign value added share, the ASEAN share is higher than that of other regional groups in developing countries as well as the world average (30 per cent in 2013) and almost the same as the share in the EU (figure 7). This reflects the fact that ASEAN has a higher presence of foreign direct investment (FDI) than other developing regions: the share of FDI stock in GDP, for example, was 65 per cent for ASEAN, compared with 31 per cent each for COMESA (Common Market for Eastern and Southern Africa) and Mercosur (Southern Common Market) in 2013. Economic groups involving both developed and developing countries such as the Trans-Pacific Partnership (defunct as of July 2017), the Regional Comprehensive Economic Partnership (under negotiation), Asia-Pacific Economic Cooperation and the North American Free Trade Agreement show a somewhat lower foreign value added share. This is because the large volume of exports from countries such as Japan and the United States does not necessarily contain much imported parts and components, and such countries’ exports through GVCs are relatively small compared with the sheer size of their total exports. In 2013, the foreign value added share was 20 per cent for Japan and 16 per cent for the United States, about half of the share in ASEAN as a whole.
The evolution of GVCs by industry points to a general rise in the foreign value added share in exports from ASEAN in many industries (figure 8). This is particularly the case for the manufacturing and services sectors, though industries in each sector exhibit some variance. In the case of the manufacturing sector, resources-based industries such as metal and metal products, and rubber and plastic products tend to use more foreign inputs into their processed products, which implies that these industries are more involved in GVCs. Integration of these resources-based products into GVCs is what ASEAN governments have been striving for over the years. In the case of the services sector, all industries except the utility industry (electricity, gas and water) have more foreign inputs.
Source: AJC-UNCTAD-Eora database on ASEAN GVCs.Note: TPP = Trans-Pacific Partnership (including the United States); RCEP = Regional Comprehensive Economic Partnership; APEC = Asia-Pacific Economic Partnership; NAFTA = North American Free Trade Agreement; MERCOSUR = Mercado Comum do Sul; CARICOM – Caribbean Community; SADC = Southern African Development Community; COMESA = Common Market for Eastern and Southern Africa; and ECOWAS = Economic Community of West African States
Figure 7. Which regional groups import more foreign value added in their exports in 2013? (Per cent)
0 5 10 15 20 25 30 35 40 45
European Union
ECOWAS
COMESA
SADC
CARICOM
MERCOSUR
NAFTA
APEC
RCEP
TPP
ASEAN
World average (30%)
PAPER1 A REGIONAL PERSPECTIVE 13
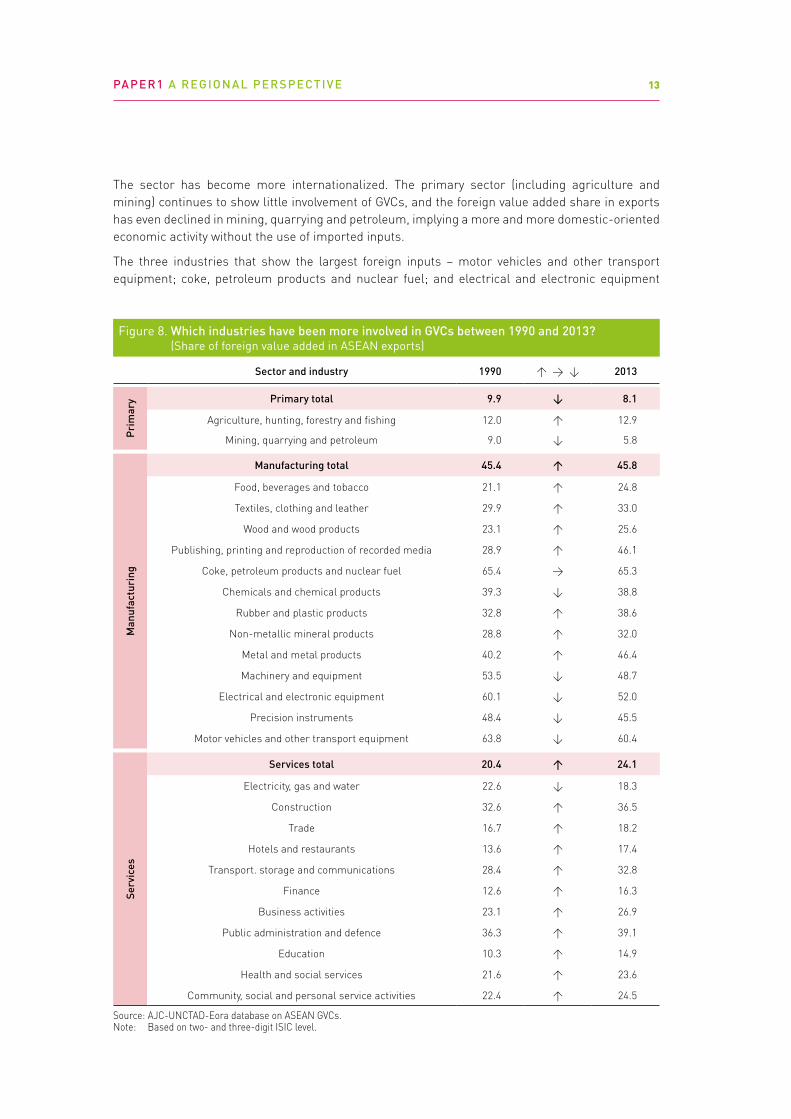
The sector has become more internationalized. The primary sector (including agriculture and mining) continues to show little involvement of GVCs, and the foreign value added share in exports has even declined in mining, quarrying and petroleum, implying a more and more domestic-oriented economic activity without the use of imported inputs.
The three industries that show the largest foreign inputs – motor vehicles and other transport equipment; coke, petroleum products and nuclear fuel; and electrical and electronic equipment
Figure 8. Which industries have been more involved in GVCs between 1990 and 2013? (Share of foreign value added in ASEAN exports)
Sector and industry 1990 ↑ → ↓ 2013
Prim
ary Primary total 9.9 ↓ 8.1
Agriculture, hunting, forestry and fi shing 12.0 ↑ 12.9
Mining, quarrying and petroleum 9.0 ↓ 5.8
Man
ufac
turi
ng
Manufacturing total 45.4 ↑ 45.8
Food, beverages and tobacco 21.1 ↑ 24.8
Textiles, clothing and leather 29.9 ↑ 33.0
Wood and wood products 23.1 ↑ 25.6
Publishing, printing and reproduction of recorded media 28.9 ↑ 46.1
Coke, petroleum products and nuclear fuel 65.4 → 65.3
Chemicals and chemical products 39.3 ↓ 38.8
Rubber and plastic products 32.8 ↑ 38.6
Non-metallic mineral products 28.8 ↑ 32.0
Metal and metal products 40.2 ↑ 46.4
Machinery and equipment 53.5 ↓ 48.7
Electrical and electronic equipment 60.1 ↓ 52.0
Precision instruments 48.4 ↓ 45.5
Motor vehicles and other transport equipment 63.8 ↓ 60.4
Serv
ices
Services total 20.4 ↑ 24.1
Electricity, gas and water 22.6 ↓ 18.3
Construction 32.6 ↑ 36.5
Trade 16.7 ↑ 18.2
Hotels and restaurants 13.6 ↑ 17.4
Transport. storage and communications 28.4 ↑ 32.8
Finance 12.6 ↑ 16.3
Business activities 23.1 ↑ 26.9
Public administration and defence 36.3 ↑ 39.1
Education 10.3 ↑ 14.9
Health and social services 21.6 ↑ 23.6
Community, social and personal service activities 22.4 ↑ 24.5
Source: AJC-UNCTAD-Eora database on ASEAN GVCs.Note: Based on two- and three-digit ISIC level.

GLOBAL VALUE CHAINS IN ASE AN – SEPTEMBER 201714
– all use foreign imports equivalent to more than half of their exports but exhibit some declines or plateaus in foreign content in respective exports (figure 8). As pointed out earlier, inputs from local firms, whether foreign or domestic, are gaining in importance (figure 5). This suggests that not only are imports replaced by direct investment by TNCs, particularly in automobiles, but also that domestic producers have become competitive enough to produce more value added products in these industries.
3. GVC participation
The sum of domestic value added (DVA – see box 2) and the value added created by ASEAN in exports from its other member states (part of FVA) yields the total of value added that constitutes ASEAN’s GDP. As noted earlier, the former is created in each ASEAN member states and the latter is the value created by other ASEAN member states. In particular, with constant increases in the latter over the past two decades, the share of ASEAN value added in total exports rose from 64 per cent in 1995 to 70 per cent in 2013 (figure 5). The rise of ASEAN’s share in value added trade is mainly due to the rise of ASEAN inputs in exports from ASEAN, as the share of domestic value added remained almost the same (from 59 per cent to 62 per cent) during this period. This suggests that regional production networks are becoming stronger.
The foreign value added share in exports shows only one-sided participation of GVCs. Value chains are extended both upstream and downstream. Foreign value added is the upward part of value chains. Exports from ASEAN can be also used as intermediate products in other countries’ exports. This downward part of value chains is also an important indicator of GVCs. Combining the upstream part (foreign value added or FVA – see box 2) and the downstream part (domestic value added integrated into other countries’ exports = DVX – see box 2) gives the total participation in GVCs. This GVC participation of ASEAN also varies by country (figure 9). Singapore is the ASEAN member most integrated into GVCs, followed by Malaysia. Both are more involved, in both directions, than the ASEAN average (64 per cent). In contrast, Cambodia, the Lao People’s Democratic Republic and Myanmar are the least involved. Four countries – Malaysia, Singapore, Thailand and Viet Nam – derived more than half of their participation in GVCs from the upstream part of value chains (foreign value added). In three countries – Brunei Darussalam, Indonesia, and the Lao People’s Democratic Republic – more than half of their participation derives from the downstream part of value chains. These countries are essentially dependent on commodities or natural resources, in which foreign inputs are not required much; however, their products are used extensively as basic inputs to many industries after exporting. And in the case of Myanmar, almost full participation in GVCs is only through the downstream part as this commodity-dependent country was essentially closed until recently and has not established production networks. Significant amounts of FDI to the country started only after 2013.
The extent to which ASEAN participates in GVCs seems to be again larger than any other major regional groups in developing countries (e.g. MERCOSUR and COMESA, as well as CARICOM (Community of Caribbean Countries), SADC (Southern African Development Community) and ECOWAS (Economic Community of West African States)) and, in the world, just behind the EU (figure 10). This participation largely emanates from the upstream part of the value chains. When it comes to the downstream part of the chains, ASEAN’s share is lower than that of most of the other regional groups. This is because the export structure of ASEAN is more manufacturing oriented and includes both intermediate and final products. By contrast, in other developing-country regional groups, exports are more commodity-dependent and tend to be used or incorporated into other products as basic materials (e.g. energy, raw materials, foods). Such regional groups include ECOWAS, COMESA and SADC in Africa and MERCOSUR in Latin America.

PAPER1 A REGIONAL PERSPECTIVE 15
Source: AJC-UNCTAD-Eora database on ASEAN GVCs.
Figure 9. GVC participation by ASEAN member states, 2013 (Per cent)
FVA (Foreign value added)
DVX (Domestic value added incorporated in other countries' exports)
0 20 40 60 80
ASEAN
Viet Nam
Thailand
Singapore
Philippines
Myanmar
Malaysia
Lao People's Democratic
Indonesia
Cambodia
Brunei Darussalam
Source: AJC-UNCTAD-Eora database on ASEAN GVCs.Note: TPP = Trans-Pacific Partnership (including the United States); RCEP = Regional Comprehensive Economic Partnership; APEC = Asia-Pacific Economic Partnership; NAFTA = North American Free Trade Agreement; MERCOSUR = Mercado Comum do Sul; CARICOM = Caribbean Community; SADC = Southern African Development Community; COMESA = Common Market for Eastern and Southern Africa; and ECOWAS = Economic Community of West African States.
Figure 10. Which regional groups are more involved in GVC participation in 2013? (Per cent of gross exports)
0 10 20 30 40 50 60 70 80
European Union
ECOWAS
COMESA
SADC
CARICOM
NAFTA
APEC
RCEP
ASEAN
World average (61%)
DVX (Domestic value added incorporated in other countries' exports)
FVA (Foreign value added)
MERCOSUR
TPP
GLOBAL VALUE CHAINS IN ASE AN – SEPTEMBER 201716
4. Regional value chains
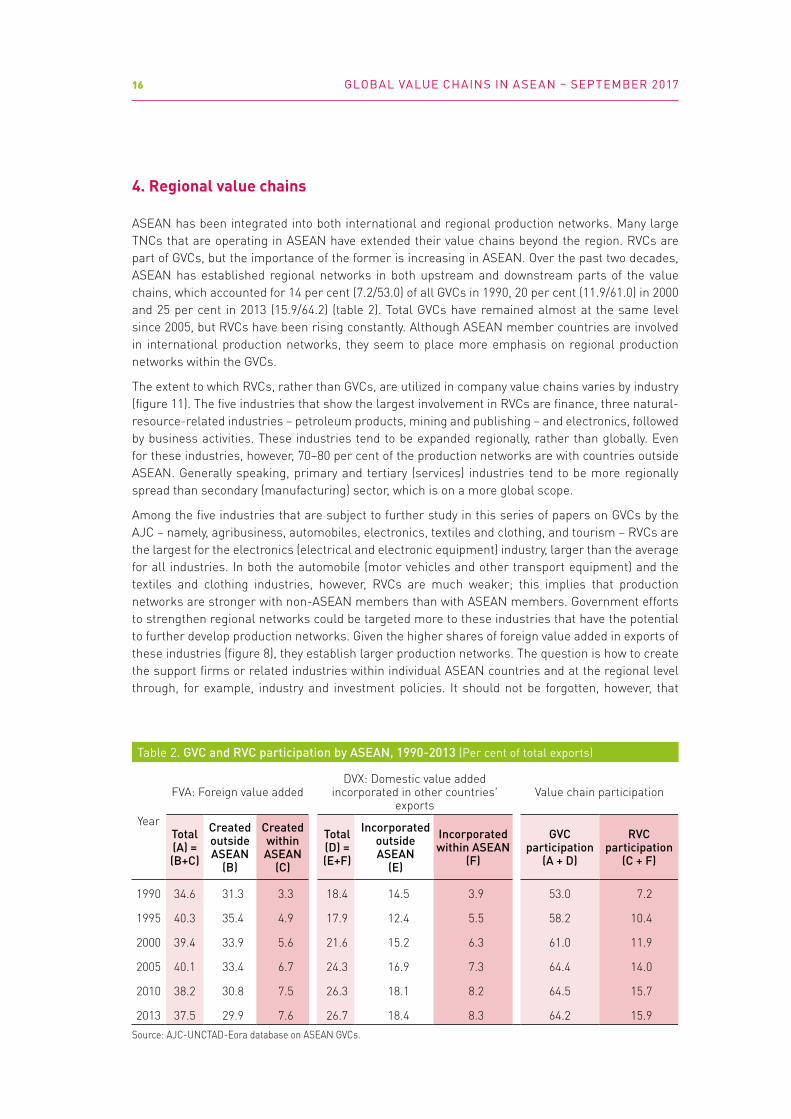
ASEAN has been integrated into both international and regional production networks. Many large TNCs that are operating in ASEAN have extended their value chains beyond the region. RVCs are part of GVCs, but the importance of the former is increasing in ASEAN. Over the past two decades, ASEAN has established regional networks in both upstream and downstream parts of the value chains, which accounted for 14 per cent (7.2/53.0) of all GVCs in 1990, 20 per cent (11.9/61.0) in 2000 and 25 per cent in 2013 (15.9/64.2) (table 2). Total GVCs have remained almost at the same level since 2005, but RVCs have been rising constantly. Although ASEAN member countries are involved in international production networks, they seem to place more emphasis on regional production networks within the GVCs.
The extent to which RVCs, rather than GVCs, are utilized in company value chains varies by industry (figure 11). The five industries that show the largest involvement in RVCs are finance, three natural-resource-related industries – petroleum products, mining and publishing – and electronics, followed by business activities. These industries tend to be expanded regionally, rather than globally. Even for these industries, however, 70–80 per cent of the production networks are with countries outside ASEAN. Generally speaking, primary and tertiary (services) industries tend to be more regionally spread than secondary (manufacturing) sector, which is on a more global scope.
Among the five industries that are subject to further study in this series of papers on GVCs by the AJC – namely, agribusiness, automobiles, electronics, textiles and clothing, and tourism – RVCs are the largest for the electronics (electrical and electronic equipment) industry, larger than the average for all industries. In both the automobile (motor vehicles and other transport equipment) and the textiles and clothing industries, however, RVCs are much weaker; this implies that production networks are stronger with non-ASEAN members than with ASEAN members. Government efforts to strengthen regional networks could be targeted more to these industries that have the potential to further develop production networks. Given the higher shares of foreign value added in exports of these industries (figure 8), they establish larger production networks. The question is how to create the support firms or related industries within individual ASEAN countries and at the regional level through, for example, industry and investment policies. It should not be forgotten, however, that
Table 2. GVC and RVC participation by ASEAN, 1990-2013 (Per cent of total exports)
Year
FVA: Foreign value addedDVX: Domestic value added
incorporated in other countries' exports
Value chain participation
Total (A) = (B+C)
Created outside ASEAN
(B)
Created within ASEAN
(C)
Total (D) = (E+F)
Incorporated outside ASEAN
(E)
Incorporated within ASEAN
(F)
GVC participation
(A + D)
RVC participation
(C + F)
1990 34.6 31.3 3.3 18.4 14.5 3.9 53.0 7.2
1995 40.3 35.4 4.9 17.9 12.4 5.5 58.2 10.4
2000 39.4 33.9 5.6 21.6 15.2 6.3 61.0 11.9
2005 40.1 33.4 6.7 24.3 16.9 7.3 64.4 14.0
2010 38.2 30.8 7.5 26.3 18.1 8.2 64.5 15.7
2013 37.5 29.9 7.6 26.7 18.4 8.3 64.2 15.9Source: AJC-UNCTAD-Eora database on ASEAN GVCs.

PAPER1 A REGIONAL PERSPECTIVE 17
Source: AJC-UNCTAD-Eora database on ASEAN GVCs.Note: The higher the share of RVC participation in GVC participation is, the more production networks are established in the region. However, for any industry, the degree of participation of countries other than ASEAN in GVCs is larger than that of ASEAN. Industry classification is at the two- to three-digit level of ISIC.
Figure 11. How important are RVCs, compared with GVCs, by industry in 2013? (Share of RVC participation in GVC participation)
RVC
Wea
k St
rong
0 10 20 30 40 50
Primary
Secondary
Tertiary
Other manufacturing
Public administration and defence
Textiles, clothing and leather
Health and social services
Motor vehicles and other transport equipment
Metal and metal products
Machinery and equipment
Other services
Education
Trade
Construction
Wood and wood products
Precision instruments
Hotels and restaurants
Electricity, gas and water
Agriculture, hunting, forestry and fishing
Food, beverages and tobacco
Recycling
Community, social and personal service activities
Non-metallic mineral products
Rubber and plastic products
Transport, storage and communications
Chemicals and chemical products
Business activities
Electrical and electronic equipment
Publishing, printing and reproduction of recorded media
Finance
Mining, quarrying and petroleum
Coke, petroleum products and nuclear fuel
value chain participation by countries outside ASEAN also contributes to ASEAN’s economic growth, by improving the productivity and competitiveness of its export products. This is a subject to be dealt with in section III.

GLOBAL VALUE CHAINS IN ASE AN – SEPTEMBER 201718
II. FIVE INDUSTRIES SUBJECT TO STUDY
As noted earlier, for the industry papers of this series (Papers 12–16), electronics, automobiles, textiles and clothing, agribusiness and tourism were chosen as the industries subject to study. These industries have attracted both FDI and non-equity modes (NEMs) of operations (e.g. subcontracting and licensing) by TNCs. In each of these five industries, a majority of the firms is foreign owned or foreign linked; foreign countries include ASEAN members and other Asian economies. Furthermore, the industry contributed to regional integration through investment.
1. Automobiles
Most global auto firms have a presence in ASEAN, and many pursue a regional production networks strategy. ASEAN as a whole posted $45 billion in value added trade in transport equipment in 2013, more than 10 times as high as in 1990. Thailand is by far the largest exporter at $29 billion in 2013, followed by Malaysia with $3 billion (table 3).5
Automobile firms in Indonesia, Malaysia and Thailand – major producers – undertake full production of assembling automobiles. These firms drive the value chain, using numerous parts and components from various countries as well as from within the countries. Engines, gearboxes, batteries, wheels, doors and air-conditioning systems may come from different places through value chains.
Indonesia’s production is essentially for domestic use. Thus, this industry section focuses on Thailand and Malaysia. Both countries have considered the automobile industry as strategically important for the country but adopted different approaches. This difference is reflected in their respective value chain patterns (figure 12).
5 Value added trade data differ from merchandise trade data, which are available from various sources including the UNCTAD GlobStat database. The latter data set is larger than the former and particularly so for industries that use processing trade.
Table 3. Value added exports in automobiles from Malaysia and Thailand, 1990-2013(Millions of dollars)
Malaysia Thailand
Year TotalForeign
value addedDomestic
value added TotalForeign
value addedDomestic
value added
1990 286 121 165 2 911 2 036 875
1995 1 067 577 490 7 782 5 532 2 250
2000 903 529 374 9 509 7 145 2 364
2005 1 536 892 644 16 046 11 171 4 875
2010 2 569 1 390 1 179 22 538 16 024 6 513
2013 3 019 1 576 1 443 29 315 20 355 8 960Source: AJC-UNCTAD-Eora database on ASEAN GVCs.
PAPER1 A REGIONAL PERSPECTIVE 19
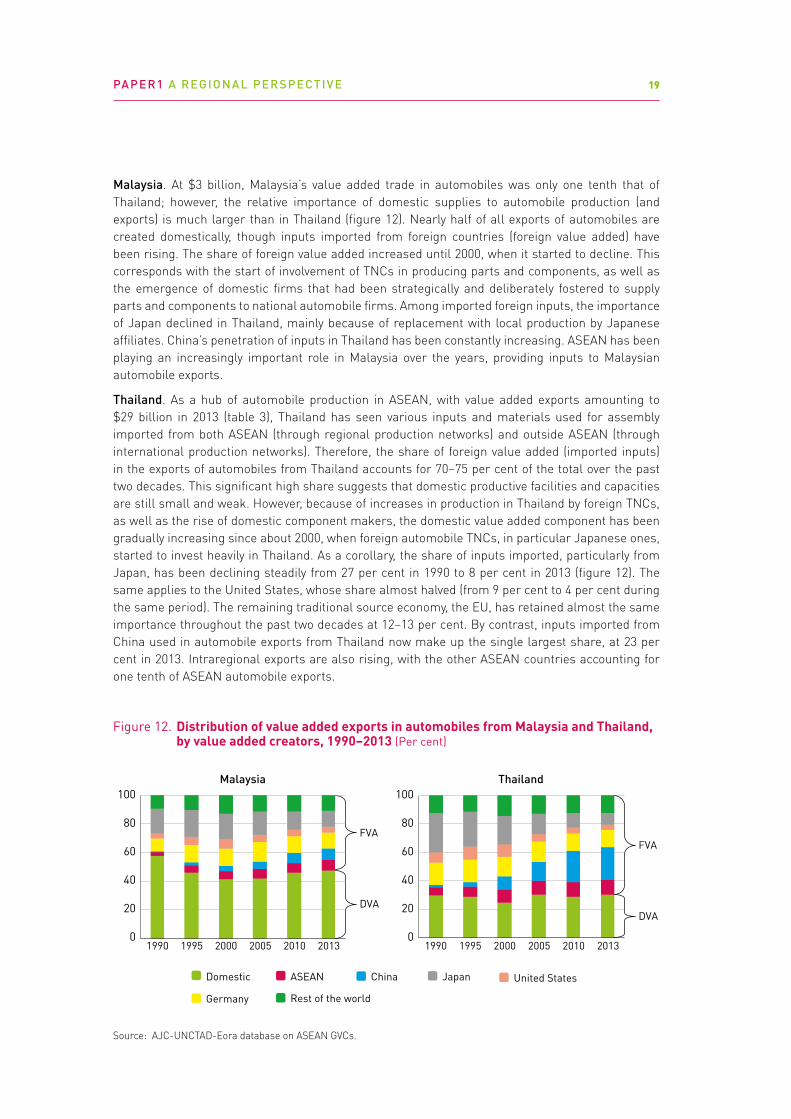
Malaysia. At $3 billion, Malaysia’s value added trade in automobiles was only one tenth that of Thailand; however, the relative importance of domestic supplies to automobile production (and exports) is much larger than in Thailand (figure 12). Nearly half of all exports of automobiles are created domestically, though inputs imported from foreign countries (foreign value added) have been rising. The share of foreign value added increased until 2000, when it started to decline. This corresponds with the start of involvement of TNCs in producing parts and components, as well as the emergence of domestic firms that had been strategically and deliberately fostered to supply parts and components to national automobile firms. Among imported foreign inputs, the importance of Japan declined in Thailand, mainly because of replacement with local production by Japanese affiliates. China’s penetration of inputs in Thailand has been constantly increasing. ASEAN has been playing an increasingly important role in Malaysia over the years, providing inputs to Malaysian automobile exports.
Thailand. As a hub of automobile production in ASEAN, with value added exports amounting to $29 billion in 2013 (table 3), Thailand has seen various inputs and materials used for assembly imported from both ASEAN (through regional production networks) and outside ASEAN (through international production networks). Therefore, the share of foreign value added (imported inputs) in the exports of automobiles from Thailand accounts for 70–75 per cent of the total over the past two decades. This significant high share suggests that domestic productive facilities and capacities are still small and weak. However, because of increases in production in Thailand by foreign TNCs, as well as the rise of domestic component makers, the domestic value added component has been gradually increasing since about 2000, when foreign automobile TNCs, in particular Japanese ones, started to invest heavily in Thailand. As a corollary, the share of inputs imported, particularly from Japan, has been declining steadily from 27 per cent in 1990 to 8 per cent in 2013 (figure 12). The same applies to the United States, whose share almost halved (from 9 per cent to 4 per cent during the same period). The remaining traditional source economy, the EU, has retained almost the same importance throughout the past two decades at 12–13 per cent. By contrast, inputs imported from China used in automobile exports from Thailand now make up the single largest share, at 23 per cent in 2013. Intraregional exports are also rising, with the other ASEAN countries accounting for one tenth of ASEAN automobile exports.
FVA
DVA
FVA
DVA
Figure 12. Distribution of value added exports in automobiles from Malaysia and Thailand, by value added creators, 1990–2013 (Per cent)
Source: AJC-UNCTAD-Eora database on ASEAN GVCs.
China United States
Germany Rest of the world
JapanASEANDomestic
0
20
40
60
80
100
1990 1995 2000 2005 2010 2013 0
20
40
60
80
100
1990 1995 2000 2005 2010 2013
Malaysia Thailand

GLOBAL VALUE CHAINS IN ASE AN – SEPTEMBER 201720
Differences in the GVC pattern of automobile industries for these two countries relate to the evolution of FDI and trade. During 2001–2013 in Thailand, the share of automobile exports in value added tripled (figure 13). Behind this growth, FDI also increased but did not bring value added exports up to the level of its growth rate. This is because FDI started from a low level and exports started only after the Asian financial crisis. Malaysia’s value added exports also more than tripled during the same period (no FDI data are available after 2008).
2. Electronics
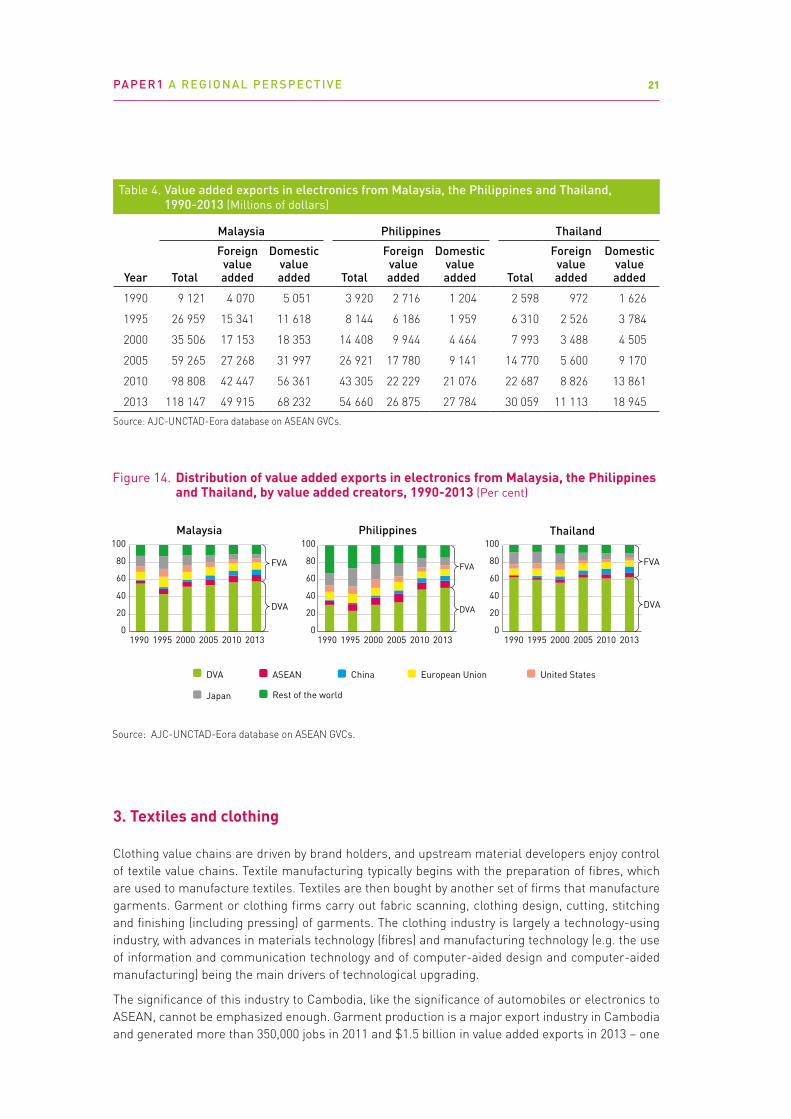
Total value added exports of electric and electronics (including parts and components) from ASEAN reached $353 billion in 2013, compared with only $27 billion in 1990, making this industry by far the largest value added export source in ASEAN. Malaysia and Singapore are the largest exporters (one third each of the ASEAN total), followed by the Philippines (15 per cent) and Thailand (8 per cent).
In ASEAN, electronic firms range from those producing electronics components to those engaged in intermediate- to high-technology products. Typical value chains of electronics in ASEAN include all segments except for frontier research and development operations. The hard disk drive industry is one of the important components of the electronics industry and has driven the establishment of an RVC in the industry.
ASEAN electronics component firms have absorptive capacities to learn and adopt best practices to increase productivity. Malaysia, the Philippines and Thailand have large-scale industry bases, exporting $118 billion, $55 billion and $30 billion, respectively in value added terms in 2013 (table 4). Unlike in the automobile industry, Malaysia and Thailand show similar GVC patterns (figure 14). ASEAN, China, the EU and Japan have contributed almost the same share of inputs to electronics exports from Malaysia and Thailand. In the Philippines, the Japanese share of foreign value added has been the largest, followed by that of ASEAN as a whole.
Source: UNCTAD, World Investment Report 2017, annex tables for inward FDI and AJC-UNCTAD-Eora database on ASEAN GVCs for value-added exports.Note: Inward stock data for Malaysia are on an approval basis. Data are not available after 2009.
Figure 13. Inward FDI in and value added exports of automobiles from Malaysia and Thailand (2001 = 100)
0
200
400
600
800
1 000
1 200
2001
20
02
2003
20
04
2005
20
06
2007
20
08
2009
20
10
2011
20
12
2013
Inward FDI stock Gross (value-added) exports
Malaysia
0 200 400 600 800
1 000 1 200 1 400
2001
20
02
2003
20
04
2005
20
06
2007
20
08
2009
20
10
2011
20
12
2013
Thailand
PAPER1 A REGIONAL PERSPECTIVE 21
3. Textiles and clothing
Clothing value chains are driven by brand holders, and upstream material developers enjoy control of textile value chains. Textile manufacturing typically begins with the preparation of fibres, which are used to manufacture textiles. Textiles are then bought by another set of firms that manufacture garments. Garment or clothing firms carry out fabric scanning, clothing design, cutting, stitching and finishing (including pressing) of garments. The clothing industry is largely a technology-using industry, with advances in materials technology (fibres) and manufacturing technology (e.g. the use of information and communication technology and of computer-aided design and computer-aided manufacturing) being the main drivers of technological upgrading.
The significance of this industry to Cambodia, like the significance of automobiles or electronics to ASEAN, cannot be emphasized enough. Garment production is a major export industry in Cambodia and generated more than 350,000 jobs in 2011 and $1.5 billion in value added exports in 2013 – one
Table 4. Value added exports in electronics from Malaysia, the Philippines and Thailand, 1990-2013 (Millions of dollars)
Malaysia Philippines Thailand
Year Total
Foreign value added
Domestic value added Total
Foreign value added
Domestic value added Total
Foreign value added
Domestic value added
1990 9 121 4 070 5 051 3 920 2 716 1 204 2 598 972 1 626
1995 26 959 15 341 11 618 8 144 6 186 1 959 6 310 2 526 3 784
2000 35 506 17 153 18 353 14 408 9 944 4 464 7 993 3 488 4 505
2005 59 265 27 268 31 997 26 921 17 780 9 141 14 770 5 600 9 170
2010 98 808 42 447 56 361 43 305 22 229 21 076 22 687 8 826 13 861
2013 118 147 49 915 68 232 54 660 26 875 27 784 30 059 11 113 18 945Source: AJC-UNCTAD-Eora database on ASEAN GVCs.
Figure 14. Distribution of value added exports in electronics from Malaysia, the Philippines and Thailand, by value added creators, 1990-2013 (Per cent)
Source: AJC-UNCTAD-Eora database on ASEAN GVCs.
China United StatesEuropean Union
Rest of the worldJapan
ASEANDVA
Malaysia Philippines Thailand
0
20
40
60
80
100
0
20
40
60
80
100
0
20
40
60
80
100
1990 1995 2000 2005 2010 2013 1990 1995 2000 2005 2010 2013 1990 1995 2000 2005 2010 2013
FVA
DVA
FVA
DVA
FVA
DVA
GLOBAL VALUE CHAINS IN ASE AN – SEPTEMBER 201722
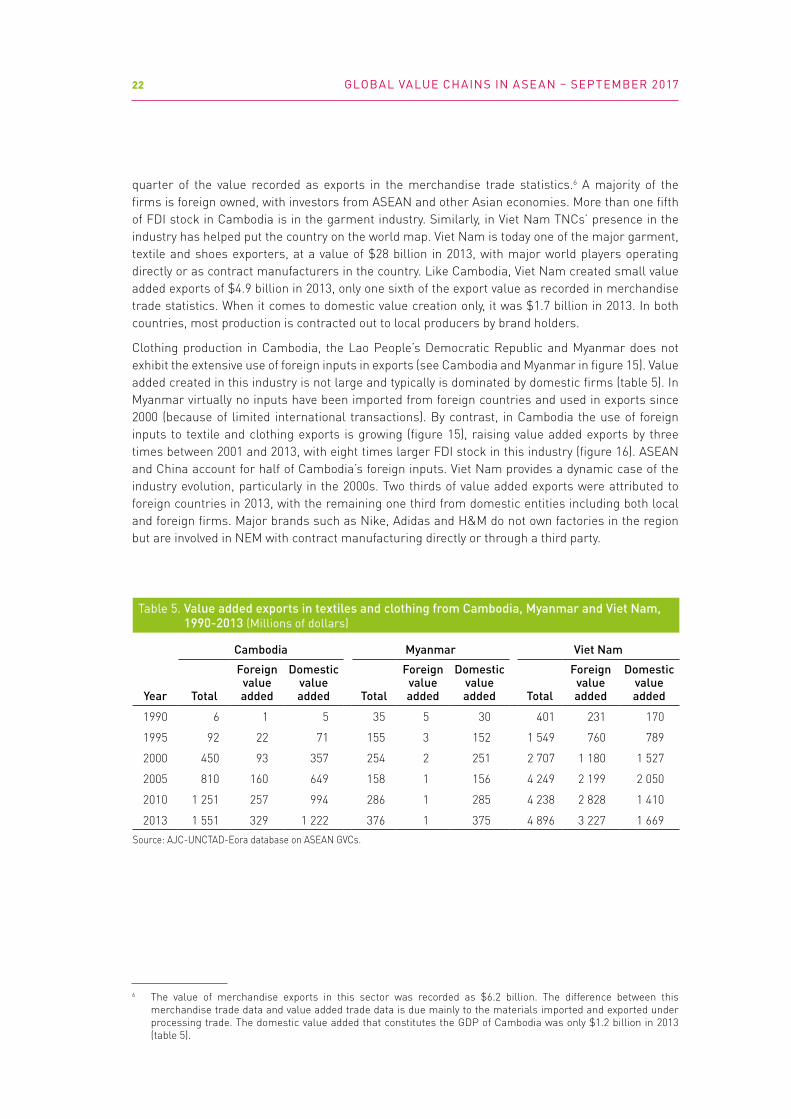
quarter of the value recorded as exports in the merchandise trade statistics.6 A majority of the firms is foreign owned, with investors from ASEAN and other Asian economies. More than one fifth of FDI stock in Cambodia is in the garment industry. Similarly, in Viet Nam TNCs’ presence in the industry has helped put the country on the world map. Viet Nam is today one of the major garment, textile and shoes exporters, at a value of $28 billion in 2013, with major world players operating directly or as contract manufacturers in the country. Like Cambodia, Viet Nam created small value added exports of $4.9 billion in 2013, only one sixth of the export value as recorded in merchandise trade statistics. When it comes to domestic value creation only, it was $1.7 billion in 2013. In both countries, most production is contracted out to local producers by brand holders.
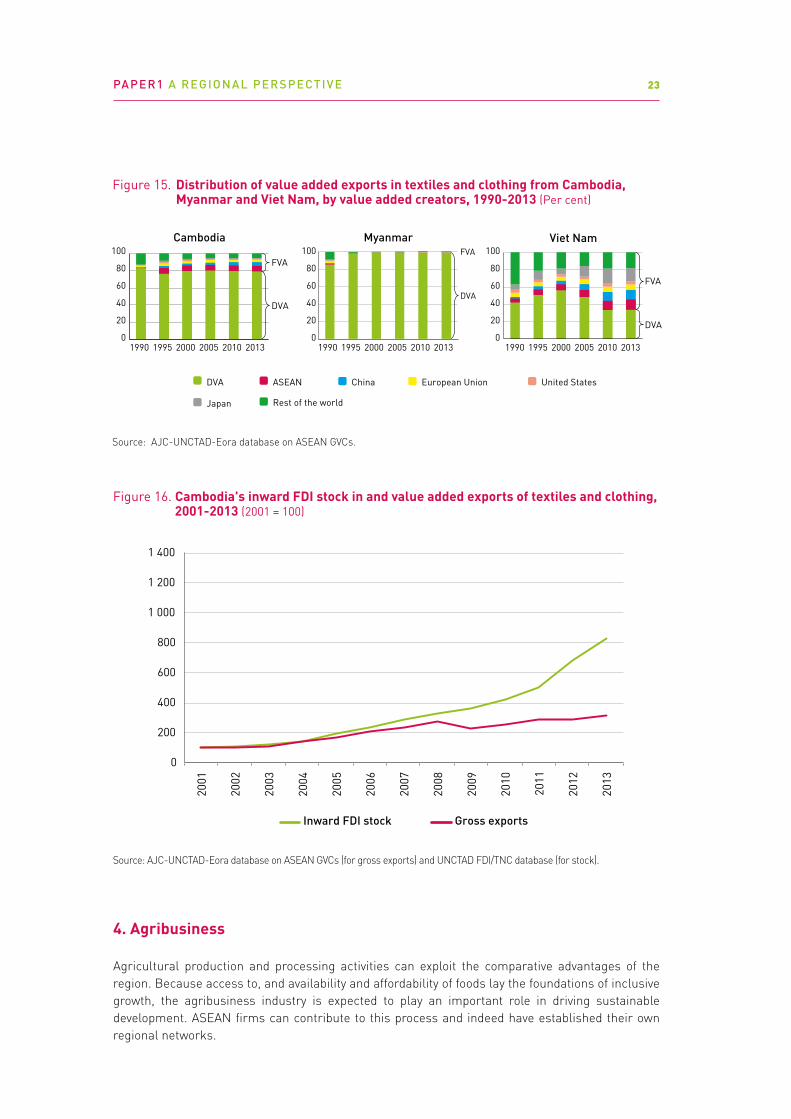
Clothing production in Cambodia, the Lao People’s Democratic Republic and Myanmar does not exhibit the extensive use of foreign inputs in exports (see Cambodia and Myanmar in figure 15). Value added created in this industry is not large and typically is dominated by domestic firms (table 5). In Myanmar virtually no inputs have been imported from foreign countries and used in exports since 2000 (because of limited international transactions). By contrast, in Cambodia the use of foreign inputs to textile and clothing exports is growing (figure 15), raising value added exports by three times between 2001 and 2013, with eight times larger FDI stock in this industry (figure 16). ASEAN and China account for half of Cambodia’s foreign inputs. Viet Nam provides a dynamic case of the industry evolution, particularly in the 2000s. Two thirds of value added exports were attributed to foreign countries in 2013, with the remaining one third from domestic entities including both local and foreign firms. Major brands such as Nike, Adidas and H&M do not own factories in the region but are involved in NEM with contract manufacturing directly or through a third party.
6 The value of merchandise exports in this sector was recorded as $6.2 billion. The difference between this merchandise trade data and value added trade data is due mainly to the materials imported and exported under processing trade. The domestic value added that constitutes the GDP of Cambodia was only $1.2 billion in 2013 (table 5).
Table 5. Value added exports in textiles and clothing from Cambodia, Myanmar and Viet Nam, 1990-2013 (Millions of dollars)
Cambodia Myanmar Viet Nam
Year Total
Foreign value added
Domestic value added Total
Foreign value added
Domestic value added Total
Foreign value added
Domestic value added
1990 6 1 5 35 5 30 401 231 170
1995 92 22 71 155 3 152 1 549 760 789
2000 450 93 357 254 2 251 2 707 1 180 1 527
2005 810 160 649 158 1 156 4 249 2 199 2 050
2010 1 251 257 994 286 1 285 4 238 2 828 1 410
2013 1 551 329 1 222 376 1 375 4 896 3 227 1 669Source: AJC-UNCTAD-Eora database on ASEAN GVCs.
PAPER1 A REGIONAL PERSPECTIVE 23
4. Agribusiness
Agricultural production and processing activities can exploit the comparative advantages of the region. Because access to, and availability and affordability of foods lay the foundations of inclusive growth, the agribusiness industry is expected to play an important role in driving sustainable development. ASEAN firms can contribute to this process and indeed have established their own regional networks.
FVA
Figure 15. Distribution of value added exports in textiles and clothing from Cambodia, Myanmar and Viet Nam, by value added creators, 1990-2013 (Per cent)
Source: AJC-UNCTAD-Eora database on ASEAN GVCs.
China United StatesEuropean Union
Rest of the worldJapan
ASEANDVA
Cambodia Myanmar Viet Nam
0
20
40
60
80
100
0
20
40
60
80
100
0
20
40
60
80
100
1990 1995 2000 2005 2010 2013 1990 1995 2000 2005 2010 2013 1990 1995 2000 2005 2010 2013
FVA
DVA
FVA
DVA
DVA
Source: AJC-UNCTAD-Eora database on ASEAN GVCs (for gross exports) and UNCTAD FDI/TNC database (for stock).
Figure 16. Cambodia's inward FDI stock in and value added exports of textiles and clothing, 2001-2013 (2001 = 100)
0
200
400
600
800
1 000
1 200
1 400
2001
2002
2003
2004
2005
2006
2007
2008
2009
2010
2011
2012
2013
Inward FDI stock Gross exports
GLOBAL VALUE CHAINS IN ASE AN – SEPTEMBER 201724
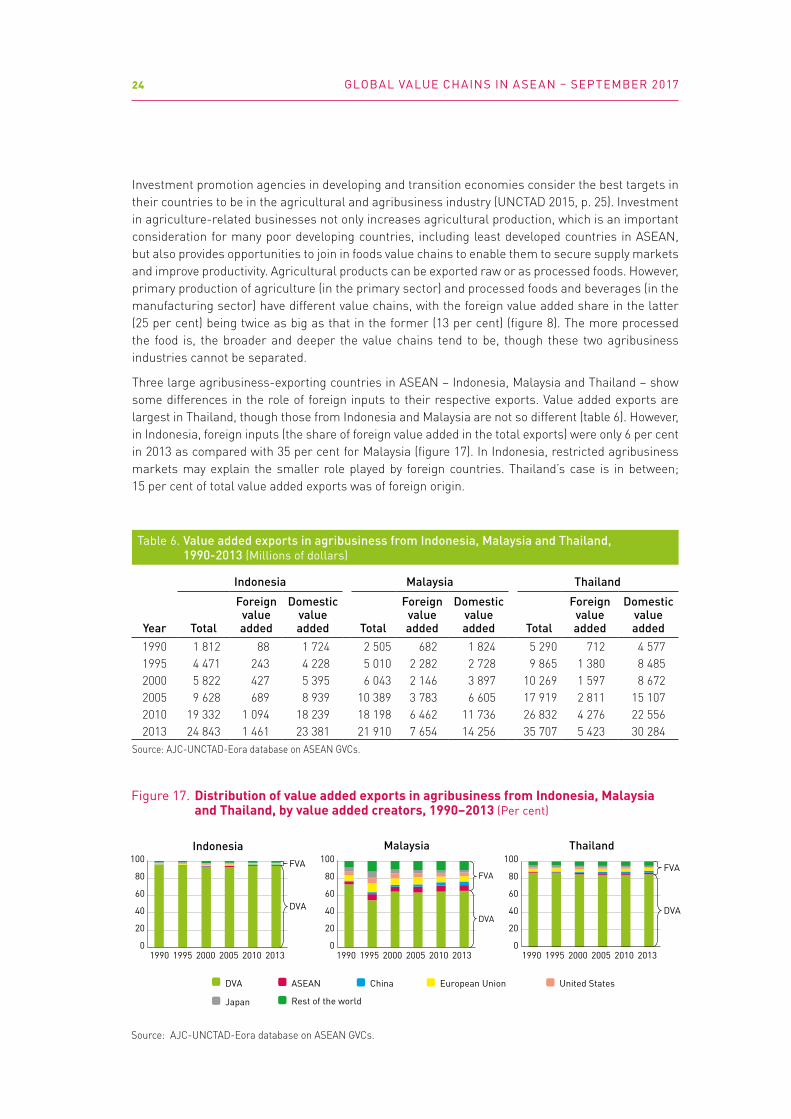
Investment promotion agencies in developing and transition economies consider the best targets in their countries to be in the agricultural and agribusiness industry (UNCTAD 2015, p. 25). Investment in agriculture-related businesses not only increases agricultural production, which is an important consideration for many poor developing countries, including least developed countries in ASEAN, but also provides opportunities to join in foods value chains to enable them to secure supply markets and improve productivity. Agricultural products can be exported raw or as processed foods. However, primary production of agriculture (in the primary sector) and processed foods and beverages (in the manufacturing sector) have different value chains, with the foreign value added share in the latter (25 per cent) being twice as big as that in the former (13 per cent) (figure 8). The more processed the food is, the broader and deeper the value chains tend to be, though these two agribusiness industries cannot be separated.
Three large agribusiness-exporting countries in ASEAN – Indonesia, Malaysia and Thailand – show some differences in the role of foreign inputs to their respective exports. Value added exports are largest in Thailand, though those from Indonesia and Malaysia are not so different (table 6). However, in Indonesia, foreign inputs (the share of foreign value added in the total exports) were only 6 per cent in 2013 as compared with 35 per cent for Malaysia (figure 17). In Indonesia, restricted agribusiness markets may explain the smaller role played by foreign countries. Thailand’s case is in between; 15 per cent of total value added exports was of foreign origin.
Table 6. Value added exports in agribusiness from Indonesia, Malaysia and Thailand, 1990-2013 (Millions of dollars)
Indonesia Malaysia Thailand
Year Total
Foreign value added
Domestic value added Total
Foreign value added
Domestic value added Total
Foreign value added
Domestic value added
1990 1 812 88 1 724 2 505 682 1 824 5 290 712 4 5771995 4 471 243 4 228 5 010 2 282 2 728 9 865 1 380 8 4852000 5 822 427 5 395 6 043 2 146 3 897 10 269 1 597 8 6722005 9 628 689 8 939 10 389 3 783 6 605 17 919 2 811 15 1072010 19 332 1 094 18 239 18 198 6 462 11 736 26 832 4 276 22 5562013 24 843 1 461 23 381 21 910 7 654 14 256 35 707 5 423 30 284
Source: AJC-UNCTAD-Eora database on ASEAN GVCs.
Figure 17. Distribution of value added exports in agribusiness from Indonesia, Malaysia and Thailand, by value added creators, 1990–2013 (Per cent)
Source: AJC-UNCTAD-Eora database on ASEAN GVCs.
China United StatesEuropean Union
Rest of the worldJapan
ASEANDVA
Malaysia
0
20
40
60
80
100
1990 1995 2000 2005 2010 2013
FVA
DVA
FVA
Thailand
0
20
40
60
80
100
1990 1995 2000 2005 2010 2013
DVA
Indonesia
0
20
40
60
80
100
1990 1995 2000 2005 2010 2013
FVA
DVA

PAPER1 A REGIONAL PERSPECTIVE 25
5. Tourism
Tourism is a set of integrated activities such as transportation to, from and within a country; hotels and restaurants; tour operators, travel agents and guides; supply of goods and services used by tourists (souvenirs or financial services); and marketing. Some of these activities are relatively capital-intensive (air transportation, hotel construction, car rentals), and many are increasingly knowledge-intensive. For these reasons, some ASEAN countries that lack capital, knowledge or access to consumers or marketing networks have traditionally relied in part on FDI in tourism development. This is where value chains are formed internationally.
Value chains in this industry are complex, but because of tourism’s connectivity with other industries, its value chain can affect others. Inbound tourism (exports of services) and outbound tourism (imports of services) interplay through GVCs. Value added trade in tourism in ASEAN is largest in Thailand, followed closely by Singapore (table 7). The Philippines’ trade is about half that of these countries.
Generally speaking, the foreign value added share is smaller in this sector than in automobiles or electronics. Tourism is location-bound and not transportable across borders. This limits internationally created value chains, though tourism has strong and broad connections with local industries and firms. Among the three countries, Singapore exhibits a somewhat different picture in which Singaporean tourism uses foreign inputs as shown for a higher foreign value added share (figure 18).
Table 7. Value added exports in tourism from the Philippines, Singapore and Thailand, 1990-2013 (Millions of dollars)
Philippines Singapore Thailand
Year Total
Foreign value added
Domestic value added Total
Foreign value added
Domestic value added Total
Foreign value added
Domestic value added
1990 535 49 486 534 163 371 1 740 173 1 5671995 998 128 871 1 313 386 926 2 944 310 2 6342000 933 124 809 1 471 418 1 053 2 306 269 2 0372005 1 623 203 1 420 2 898 888 2 010 4 364 515 3 8492010 2 785 305 2 480 5 703 1 718 3 985 6 504 794 5 7102013 3 439 358 3 081 7 286 2 132 5 155 8 581 992 7 588
Source: AJC-UNCTAD-Eora database on ASEAN GVCs.Note: Mainly hotels and restaurants because of unavailability of data of other tourism-related industries.
FVA
Figure 18. Distribution of value added exports in tourism from the Philippines, Singapore and Thailand, by value added creators, 1990–2013 (Per cent)
Source: AJC-UNCTAD-Eora database on ASEAN GVCs.Note: Mainly hotels and restaurants because of unavailability of data of other tourism-related industries.
China United StatesEuropean Union
Rest of the worldJapan
ASEANDVA
Philippines Singapore Thailand
0
20
40
60
80
100
0
20
40
60
80
100
0
20
40
60
80
100
1990 1995 2000 2005 2010 2013 1990 1995 2000 2005 2010 2013 1990 1995 2000 2005 2010 2013
FVA
DVA
FVA
DVADVA

GLOBAL VALUE CHAINS IN ASE AN – SEPTEMBER 201726
III. IMPACTS OF GVCs ON ASEAN ECONOMY
GVCs can make a contribution to development through direct GDP and through employment gains and by providing opportunities for industrial upgrading, but these benefits are not automatic and GVC participation involves risks. GVCs can contribute to domestic value added creation even where participation requires higher imported content of exports. In terms of export share, the foreign value added share and the domestic value added share should move in opposite directions, but in the value amount, foreign value added and domestic value added can increase or decrease together, and do not necessarily move in the opposite direction.
As shown, GVC participation can generate value added in domestic economies (e.g. figure 2) and can contribute to faster GDP growth through domestic value added in exports. In addition to contributing to GDP, GVCs generate employment and enhance skill development through technology transfer. At the same time, negative impacts regarding possible lock-in to low value added activity and potential social and environmental damage need to be minimized. Technical dissemination, corporate social responsibility (CSR) practices, reduction of gas emissions, and upgrading of long-term productive capabilities are required policies (see section IV).
The size, content, volume and direction of trade of goods and services is increasingly determined by where to locate FDI as well as by NEMs of operations. The latter mode has been growing along with the growth of value chains and forms special trade relationships between clients and contract holders. Because of the absence of data on NEMs, this paper looks at an analysis of FDI and trade.7 Value-chain-based analysis overhauls the traditional interpretation of both trade and FDI patterns. ASEAN needs to examine the implications for welfare gains from international production networks. Value created by domestic entities constitutes 60–70 per cent of total value added exports from ASEAN, and the remaining share is accounted for by foreign companies through their inputs to ASEAN products (figure 5). In the domestic value, a considerable share is generated by foreign affiliates operating in ASEAN. Thus, the overall contribution by foreign companies to ASEAN trade is significant. For example, exports by just Japanese and United States affiliates operating in ASEAN accounted for some 40 per cent of total exports from ASEAN in 2013.8
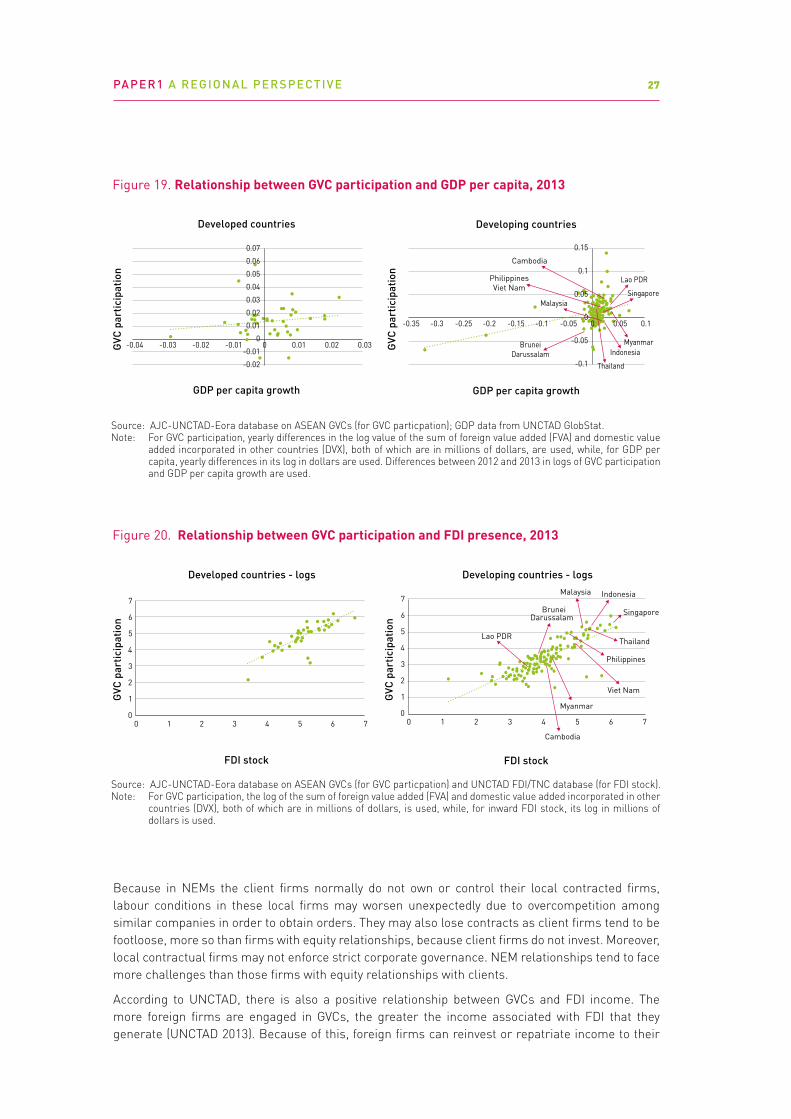
Generally speaking, the positive relationship between economic growth and GVC participation is confirmed by data in both developed and developing countries (UNCTAD 2013). This relationship seems to also apply to ASEAN. The more the ASEAN countries have been involved in GVC participation, the greater the real GDP per capita attained (figure 19). This greater GVC participation is closely related to the degree of presence of FDI (figure 20).
TNCs tend to integrate FDI and trade in their operations, whereas national governments tend to think separate trade and FDI policies. There is no NEM-specific policy. Because of close interlinking, those policies should be coordinated in order to avoid any counterproductive results. This has implications for the nature of institutions and of international investment and trade treaties (see section IV).
7 The AJC has started to work on NEMs in each ASEAN member state to measure the importance of such operations in the economy and to provide policy suggestions for maximizing benefits from NEMs while minimizing downside effects associated with them.
8 Exports from Japanese and United States foreign affiliates in ASEAN reached $253 billion and $371 billion in 2013, respectively, the sum of which accounted for 40 per cent of all ASEAN exports of goods and services ($1.5 trillion in 2013; table 1).
PAPER1 A REGIONAL PERSPECTIVE 27
Because in NEMs the client firms normally do not own or control their local contracted firms, labour conditions in these local firms may worsen unexpectedly due to overcompetition among similar companies in order to obtain orders. They may also lose contracts as client firms tend to be footloose, more so than firms with equity relationships, because client firms do not invest. Moreover, local contractual firms may not enforce strict corporate governance. NEM relationships tend to face more challenges than those firms with equity relationships with clients.
According to UNCTAD, there is also a positive relationship between GVCs and FDI income. The more foreign firms are engaged in GVCs, the greater the income associated with FDI that they generate (UNCTAD 2013). Because of this, foreign firms can reinvest or repatriate income to their
Source: AJC-UNCTAD-Eora database on ASEAN GVCs (for GVC particpation); GDP data from UNCTAD GlobStat.Note: For GVC participation, yearly differences in the log value of the sum of foreign value added (FVA) and domestic value added incorporated in other countries (DVX), both of which are in millions of dollars, are used, while, for GDP per capita, yearly differences in its log in dollars are used. Differences between 2012 and 2013 in logs of GVC participation and GDP per capita growth are used.
Figure 19. Relationship between GVC participation and GDP per capita, 2013
Indonesia
Singapore
Cambodia
BruneiDarussalam
Myanmar
Lao PDR
Malaysia
Thailand
PhilippinesViet Nam
-0.02
-0.01
0
0.01
0.02
0.03
0.04
0.05
0.06
0.07
-0.04 -0.03 -0.02 -0.01 0 0.01 0.02 0.03 GVC
par
ticip
atio
n
GDP per capita growth
Developed countries
-0.1
-0.05
0
0.05
0.1
0.15
-0.35 -0.3 -0.25 -0.2 -0.15 -0.1 -0.05 0 0.05 0.1
GVC
par
ticip
atio
n GDP per capita growth
Developing countries
Figure 20. Relationship between GVC participation and FDI presence, 2013
GVC
par
ticip
atio
n
FDI stock
Developed countries - logs
GVC
par
ticip
atio
n
FDI stock
Developing countries - logs
0
1
2
3
4
5
6
7
0 1 2 3 4 5 6 70
1
2
3
4
5
6
7
0 1 2 3 4 5 6 7
Lao PDR
Cambodia
Indonesia Malaysia
Myanmar
Philippines
Singapore
Thailand
Viet Nam
BruneiDarussalam
Source: AJC-UNCTAD-Eora database on ASEAN GVCs (for GVC particpation) and UNCTAD FDI/TNC database (for FDI stock).Note: For GVC participation, the log of the sum of foreign value added (FVA) and domestic value added incorporated in other countries (DVX), both of which are in millions of dollars, is used, while, for inward FDI stock, its log in millions of dollars is used.

GLOBAL VALUE CHAINS IN ASE AN – SEPTEMBER 201728
shareholders in home and other countries. In ASEAN, foreign firms are free to do with this income and no regulations are imposed on the remittance of income. Although host-country governments expect that foreign firms operating locally will reinvest, foreign firms tend to repatriate the majority of such income to their home countries or third countries. During 2014–2015, the share of reinvested earnings in total FDI inflows was less than one fifth, and this share has declined over the past decade (figure 21). This share is low compared with that in other regions, both developed and developing, where reinvested earnings reach about half of FDI flows. In FY2015, Japanese affiliates in ASEAN generated net income of ¥1.9 trillion ($15.8 billion), of which as much as ¥1.4 trillion ($11.6 billion) was paid as dividends to shareholders in Japan and third countries (Japan METI 2017). There is a need for policy to encourage foreign companies to reinvest from their earnings.
A country’s GVC participation, measured as a share of exports, effectively assesses the reliance of exports on GVCs both upstream and downstream. In this sense, it is also an indicator of how much damage to GVCs – and the local economy – would occur if a country’s exports would be blocked. For example, ASEAN’s clothing industry, which was already well integrated into GVCs, was affected by the economic crisis in 2008. The number of job losses in the first quarter of 2010 was 100,000 in Indonesia, 75,000 in Cambodia and 30,000 in Viet Nam (Staritz 2011). ASEAN’s high GVC participation may represent a vulnerability to external shocks.
In order to maximize positive impacts and minimize associated negative impacts, policy actions are called for. Support firms, including parts and component firms and their related industries, should be more created in the ASEAN countries and at the regional level through, for example, industry policies. Strong and growth-oriented small and medium-size enterprises (SMEs) are required. At the same time, there should be recognition that value chain participation by countries outside ASEAN also contributes to economic growth in ASEAN by improving the productivity and competitiveness of member countries’ export products. Maximizing the benefits of GVCs requires a proper balance between domestic value added and foreign value added, and among various countries providing inputs to ASEAN.
Source: AJC-UNCTAD-Eora database on ASEAN GVCs.Note: Includes only Brunei Darussalam, Cambodia, the Philippines, Singapore and Thailand for which components of FDI inflows are available - equity capital, reinvested earnings and intracompany loans.
Figure 21. Reinvested earnings as a share of total FDI inflows to ASEAN, 2003-2015 (Per cent)
0
10
20
30
40
50
60
2004 2005 2006 2007 2008 2009 2010 2011 2012 2013 2014 2015

PAPER1 A REGIONAL PERSPECTIVE 29
IV. A POLICY FRAMEWORK FOR ASEAN GVCs
Specific country or industry policy measures are the subject of the country and industry papers of this series (Papers 2–16). Each ASEAN country or industry has its own specific policy framework. This general paper touches upon a general policy framework required for ASEAN GVCs; gaining access to GVCs, benefiting from GVC participation and realizing opportunities to upgrade in GVCs all require a structured approach. The general framework consists of the following elements:
• Embedding GVCs in overall development strategies and industrial development policies
• Enabling GVC growth by maintaining a conducive trade and investment environment and by putting in place infrastructural prerequisites
• Building productive capacities in local firms
• Mitigating the risks involved in GVC participation, which requires a strong environmental, social and governance framework
• Aligning trade and investment policies, which implies the identification of synergies between the two policy areas and in relevant institutions
For each of these elements, specific policies are required.9
1. Embedding GVCs in development strategy
Mainstreaming GVCs in development strategy is the basic principle for ASEAN as a region and its individual member states to follow as an important development tool. In its AEC Blueprint 2025, ASEAN proclaims that “[T]he broader objective of becoming a highly integrated and cohesive economy is to enhance the region’s participation in global value chains (GVCs)” (para. 22). Although ASEAN supports the enhancement of participation in GVCs, the question is whether its individual member states recognize the importance of GVCs, incorporate GVCs in industrial development policies and set policy objectives along GVC development paths.
Embedding GVCs in development strategy can be put in place in the overall sustainable development framework that virtually all member states have already adopted to pursue the Sustainable Development Goals (SDGs). Along GVC paths, governments, firms, consumers and all other stakeholders can strengthen and maintain enforcement of environment, social and governance (ESG) issues, as GVCs provide such occasions for host ASEAN countries through partner firms or owners (e.g. TNCs).
2. Enabling participation in GVCs
This policy element has two dimensions: creating and maintaining an environment conducive for trade and investment, and putting in place infrastructural prerequisites for GVC participation.
A conducive environment for trade and investment refers first and foremost to the overall policy environment for business, including trade and investment policies, but also competition policy, labour market regulation, intellectual property rights, and a range of other policy areas.
9 For GVCs in general, see for example UNCTAD (2013).
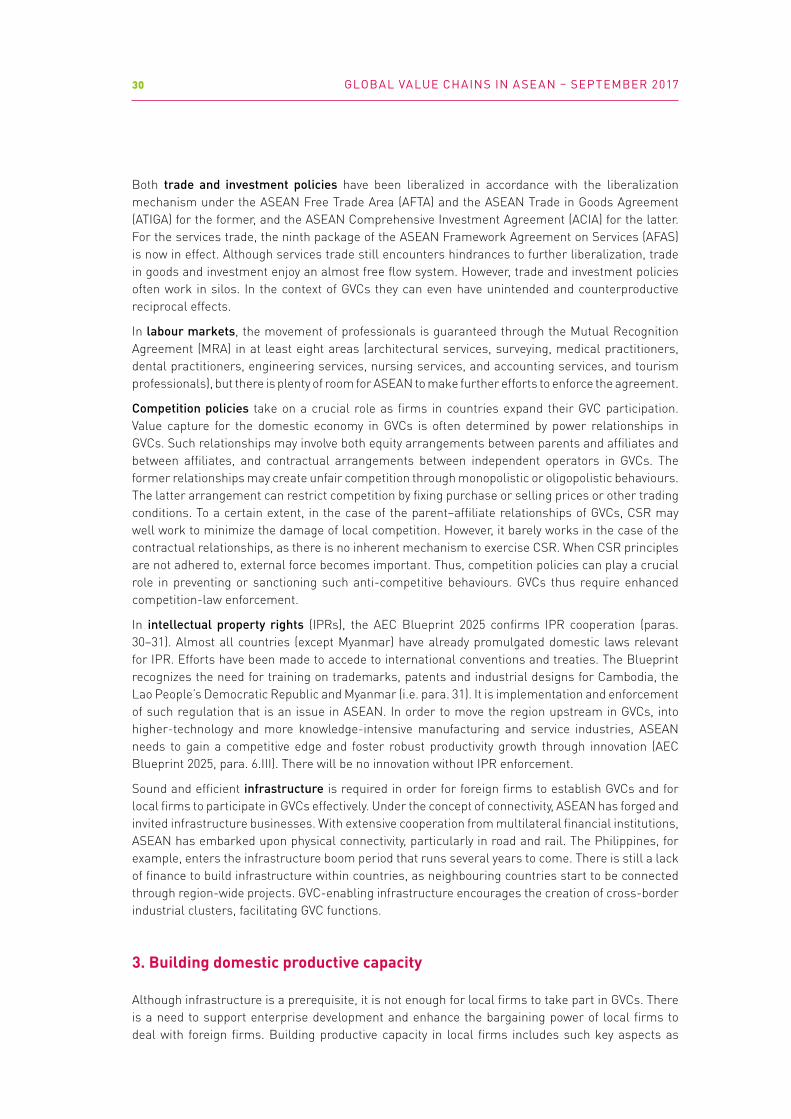
GLOBAL VALUE CHAINS IN ASE AN – SEPTEMBER 201730
Both trade and investment policies have been liberalized in accordance with the liberalization mechanism under the ASEAN Free Trade Area (AFTA) and the ASEAN Trade in Goods Agreement (ATIGA) for the former, and the ASEAN Comprehensive Investment Agreement (ACIA) for the latter. For the services trade, the ninth package of the ASEAN Framework Agreement on Services (AFAS) is now in effect. Although services trade still encounters hindrances to further liberalization, trade in goods and investment enjoy an almost free flow system. However, trade and investment policies often work in silos. In the context of GVCs they can even have unintended and counterproductive reciprocal effects.
In labour markets, the movement of professionals is guaranteed through the Mutual Recognition Agreement (MRA) in at least eight areas (architectural services, surveying, medical practitioners, dental practitioners, engineering services, nursing services, and accounting services, and tourism professionals), but there is plenty of room for ASEAN to make further efforts to enforce the agreement.
Competition policies take on a crucial role as firms in countries expand their GVC participation. Value capture for the domestic economy in GVCs is often determined by power relationships in GVCs. Such relationships may involve both equity arrangements between parents and affiliates and between affiliates, and contractual arrangements between independent operators in GVCs. The former relationships may create unfair competition through monopolistic or oligopolistic behaviours. The latter arrangement can restrict competition by fixing purchase or selling prices or other trading conditions. To a certain extent, in the case of the parent–affiliate relationships of GVCs, CSR may well work to minimize the damage of local competition. However, it barely works in the case of the contractual relationships, as there is no inherent mechanism to exercise CSR. When CSR principles are not adhered to, external force becomes important. Thus, competition policies can play a crucial role in preventing or sanctioning such anti-competitive behaviours. GVCs thus require enhanced competition-law enforcement.
In intellectual property rights (IPRs), the AEC Blueprint 2025 confirms IPR cooperation (paras. 30–31). Almost all countries (except Myanmar) have already promulgated domestic laws relevant for IPR. Efforts have been made to accede to international conventions and treaties. The Blueprint recognizes the need for training on trademarks, patents and industrial designs for Cambodia, the Lao People’s Democratic Republic and Myanmar (i.e. para. 31). It is implementation and enforcement of such regulation that is an issue in ASEAN. In order to move the region upstream in GVCs, into higher-technology and more knowledge-intensive manufacturing and service industries, ASEAN needs to gain a competitive edge and foster robust productivity growth through innovation (AEC Blueprint 2025, para. 6.III). There will be no innovation without IPR enforcement.
Sound and efficient infrastructure is required in order for foreign firms to establish GVCs and for local firms to participate in GVCs effectively. Under the concept of connectivity, ASEAN has forged and invited infrastructure businesses. With extensive cooperation from multilateral financial institutions, ASEAN has embarked upon physical connectivity, particularly in road and rail. The Philippines, for example, enters the infrastructure boom period that runs several years to come. There is still a lack of finance to build infrastructure within countries, as neighbouring countries start to be connected through region-wide projects. GVC-enabling infrastructure encourages the creation of cross-border industrial clusters, facilitating GVC functions.
3. Building domestic productive capacity
Although infrastructure is a prerequisite, it is not enough for local firms to take part in GVCs. There is a need to support enterprise development and enhance the bargaining power of local firms to deal with foreign firms. Building productive capacity in local firms includes such key aspects as

PAPER1 A REGIONAL PERSPECTIVE 31
development of linkages between local firms and foreign firms, science and technology support and an effective IPR framework, access to SME finance, and entrepreneurship promotion and development.
ASEAN country governments encourage foreign funds as well as domestic funds to be accessible to SMEs. Private equity funds that start to look at ASEAN for investment locations, foreign funds created for SMEs (e.g. Japan-ASEAN Women Empowerment Fund) and the like may be accessible after finance conditions are met. In Viet Nam, the Philippines and Indonesia, more than 60 per cent of adults over the age of 25 do not have a bank account, compared with about 20 per cent in Thailand and Malaysia (World Bank). This implies that start-up firms have difficulties accessing finance. With technology emerging related to raising finance and providing financial services, such as cloud funding for the former and fintech for the latter, financial conditions for SMEs are improving. However, they should know how to utilize the emerging finance technologies that many ASEAN SMEs lack.
4. Providing a strong environmental, social and governance framework
Sustainability is becoming an important factor for attracting and being engaged in GVC activities. Negative effects and risks associated with GVC participation can be minimized through regulation, and public and private standards on ESG. At the same time, GVCs may support local firms in complying with international standards.
Minimizing social and environmental impacts means mainstreaming sustainable development in GVC policies and maximizing the use of CSR. Capturing greenhouse gas emissions distributed along the value chains throughout the region and reducing the emissions requires a coordinated regional approach to find a collective solution.
In this respect, economic processing zones (EPZs) may become significant GVC hubs by offering benefits to TNCs and suppliers in GVCs. ASEAN member states have established many EPZs and special economic zones. They could also offer support services for CSR efforts, becoming catalysts for CSR implementation. Policymakers could consider setting up relevant services, including technical assistance for certification and reporting, support on occupational safety and health issues, and recycling or alternative energy facilities, and transforming EPZs into centres of excellence for sustainable business.
5. Synergizing trade and investment policies and institutions
TNCs utilize and integrate both FDI and trade into their operations, whereas national governments tend to think about trade and FDI policies separately. ASEAN governments also tend to formulate trade and FDI policies, and trade and FDI promotion measures separately. Different ministries and agencies look after the respective policies without particular coordination. Because of their close interlinkages, those policies should be coordinated in order to avoid counterproductive results. Such coordination has implications for the nature of institutions and for international investment and trade treaties.
Therefore, in many ASEAN countries, investment promotion agencies and trade promotion agencies are separate organizations (except in Singapore and, to a lesser extent, Brunei Darussalam). And their objectives are not necessarily the same (table 8). At the institutional level, the trade and investment links in GVCs call for closer coordination and collaboration between trade and investment promotion agencies. Where the trade institution may want to foster local products and even export them, the investment institution may want to promote foreign investment in these products. If foreign affiliates
GLOBAL VALUE CHAINS IN ASE AN – SEPTEMBER 201732
need services from abroad in their production and these services are difficult to import, GVCs do not work effectively. To avoid this, policymakers should carefully review those policy instruments that simultaneously affect investment and trade in GVCs; i.e. trade measures affecting investment and investment measures affecting trade. There may be a lack of synergies in trade and development policies and institutions. ASEAN member states should ensure coherence between trade and investment policies.
Each of these five elements for a GVC policy framework requires specific policy measures. International organizations including the AJC can help through the establishment of benchmarks, exchanges of best practices and capacity-building programmes.
CONCLUDING REMARKS: TOWARDS AN INTENSIFIED RELATIONSHIP BETWEEN REGIONAL INTEGRATION AND GVCs
Both trade and FDI play an interactive role in advancing value chains, and regional factors are becoming more prominent trade and FDI determinants. Regional integration is beginning to assert more significant influence in trade and FDI patterns and decision making, and is increasingly being referred in corporate investment plans. ASEAN integration frameworks such as the AEC and its regional policy mechanisms and measures (e.g. ATIGA (ASEAN Trade in Goods Agreement), AFAS, ACIA (ASEAN Comprehensive Investment Agreement), MRA (Mutual Recognition Arrangement)) are encouraging the growth of regional production networks and of global and regional value chains by TNCs. ASEAN’s integration offers significant opportunities for TNCs to further engage in the region, subregions such as the Mekong, and individual member states through measures related to trade, investment and movement of people, which in turn furthers regional integration. Liberalization, facilitation, promotion and cooperation measures help shape the current economic landscape and considerably improve the overall environment for GVCs.
The ASEAN experience reveals a number of issues concerning the relationship between regional integration and trade and FDI flows. First, without appropriate economic conditions and an enabling policy framework, joining a large (and potentially more prosperous) economic grouping may not necessarily bring benefits in terms of attracting FDI and could even result in FDI decreases in certain
Table 8. Key operational differences between investment promotion agencies and trade promotion offi ces
Operational items Trade promotion Investment promotion
Clients In-country exporters (SMEs) Overseas TNCs
Targeting Purchasing director CEO, CFO, COO
Cycle Purchase (routine decisions) Strategic decision (years)
Business information Country production and exporters
Investment climate and cost of operations
Staff skills Sales and marketing Location consultant
Performance indicators Exports, jobs FDI projects, jobs
Support Full support from local industry Partial support – pressure by local industry fearing competition
Source: UNCTAD (2013), p. 193.

PAPER1 A REGIONAL PERSPECTIVE 33
member states. A second issue concerns the importance of ensuring consistency in and coordination of investment policies among member states, as well as between trade and investment policies, and the harmonization of policies and institutions within a country. This requires considerable efforts and resources, and can lead to unnecessary bureaucratization and over-regulation. Yet, such harmonization also offers opportunities for increasing transparency and reducing administrative burdens, which could reap large rewards in terms of attracting foreign investors. Third, there is also the question of whether membership and further integration through the establishment of the AEC positively affects FDI through a perceived reduction of risks. So far, there are increased investment flows and no major incidence of relocation of investment among member states. What is taking place instead is additional location of foreign facilities, often characterized as “Thailand plus one”.
This general paper does not discuss the usefulness and importance of GVCs in individual member states and different industries, or specific policy considerations related to each of them. However, the overall understanding of the issues related to GVCs in ASEAN within this paper will lead ASEAN policymakers and readers to a better understanding and use of GVCs in individual country and industry settings.

GLOBAL VALUE CHAINS IN ASE AN – SEPTEMBER 201734

PAPER1 A REGIONAL PERSPECTIVE 35
REFERENCES
ASEAN and UNCTAD (2014). ASEAN Investment Report 2013–2014: FDI Development and Regional Value Chains. Jakarta.
Baldwin, Richard (2011). Trade and industrialisation after globalisation’s 2nd unbundling: How building and joining a supply chain are different and why it matters, NBER Working Paper No. 17716, National Bureau of Economic Research, Cambridge, MA.
Fujita, Masataka (2014). Global and Regional Value Chains in ASEAN, prepared for ASEAN and UNCTAD (2014).
Gereffi, G., J. Humphrey and T. Sturgen (2005). The governance of global value chains, Review of International Political Economy, 12: 78–104.
IMF (International Monetary Fund) (2009). Balance of Payments and International Investment Position Manual, Sixth Edition (BPM6). Washington, DC: IMF.
METI (Japan Ministry of Economy, Trade and Industry) (2015). Dai 44-kai Kaigai Jigyo Katsudo Kihon Chosa.
METI (Japan Ministry of Economy, Trade and Industry) (2017). Dai 46-kai Kaigai Jigyo Katsudo Kihon Chosa.
Staritz, C. (2011). Making the Cut? Low-Income Countries and the Global Clothing Value Chain in a Post-Quota and Post-Crisis World. Washington, DC: World Bank.
UNCTAD (2013). World Investment Report 2013: Global Value Chains: Investment and Trade for Development. New York and Geneva: United Nations.
UNCTAD (2015). World Investment Report 2015: Reforming International Investment Governance. New York and Geneva: United Nations.

GLOBAL VALUE CHAINS IN ASE AN – SEPTEMBER 201736

PAPER1 A REGIONAL PERSPECTIVE 37
ANNEX TABLESAnnex table 1. Value added exports of goods and services from ASEAN, by value added creator,
1990-2013 (Millions of dollars)
Value added creator Exports from ASEAN1990 1995 2000 2005 2010 2013
Fore
ign
valu
e ad
ded
(FVA
)
World 44 746 118 378 147 472 265 722 430 234 532 079Developed countries 29 294 78 320 88 746 146 291 212 806 252 144
Europe 10 363 27 479 29 407 57 638 84 732 105 798European Union (28) 9 536 25 139 26 969 53 202 76 606 95 916
Germany 2 811 7 339 7 242 14 117 21 865 27 480United Kingdom 1 491 4 218 5 417 9 473 12 589 15 372France 1 207 3 184 3 314 6 697 9 216 11 560Italy 1 024 2 352 2 479 5 000 7 063 8 932Netherlands 725 2 238 2 283 4 182 6 082 7 499Belgium 503 1 441 1 379 2 924 4 084 5 187Spain 271 801 859 2 242 2 933 3 768Sweden 507 991 853 1 743 2 557 3 257Austria 241 613 670 1 485 2 150 2 736Finland 240 572 616 1 237 1 798 2 194Ireland 80 224 366 808 1 104 1 337Denmark 119 316 368 699 1 016 1 263Czech Republic 56 164 204 579 988 1 210Poland 64 179 233 525 806 1 035Hungary 29 92 150 370 498 630
Other developed Europe 828 2 340 2 439 4 437 8 126 9 882Norway 206 629 766 1 365 2 356 2 629Switzerland 612 1 694 1 649 3 031 5 712 7 176
North America 7 186 19 256 25 345 35 842 54 216 65 492Canada 436 1 122 2 063 3 392 5 750 7 153United States 6 747 18 130 23 278 32 444 48 457 58 328
Other developed countries 11 745 31 584 33 993 52 811 73 857 80 854Australia 1 204 2 842 3 230 6 630 13 145 16 419Japan 10 289 28 062 29 791 44 434 57 709 60 666New Zealand 134 373 493 927 1 593 1 986
Developing countries 14 997 39 223 57 629 116 413 211 713 271 794Africa 392 1 226 2 149 4 664 7 531 9 041Latin America and the Caribbean 567 1 626 2 329 4 393 9 280 11 357
Asia 14 018 36 320 53 089 107 255 194 726 251 156West Asia 1 057 2 368 3 508 7 747 13 243 18 432South, East and South-east Asia 12 961 33 952 49 581 99 509 181 483 232 724
East Asia 8 207 17 830 26 368 49 210 84 751 108 860China 1 263 4 512 8 548 22 737 51 600 69 959Hong Kong, China 701 2 216 2 693 4 225 5 512 6 387Korea, Republic of 1 388 5 214 6 541 12 402 17 712 22 197Taiwan Province of China 4 845 5 870 8 542 9 769 9 800 10 146
South Asia 503 1 708 2 393 5 764 12 585 16 504Bangladesh 9 31 72 103 173 240India 359 1 152 1 665 4 100 9 345 11 944Iran, Islamic Republic of 85 384 470 1 260 2 552 3 658Pakistan 33 100 127 199 348 436Sri Lanka 12 33 46 78 129 176
ASEAN 4 250 14 414 20 820 44 535 84 147 107 359Brunei Darussalam 35 71 115 243 411 528Cambodia 3 31 48 76 118 152Indonesia 1 057 4 108 5 338 11 532 24 832 31 541Lao People’s Democratic Republic 11 31 48 96 189 256Malaysia 1 401 3 989 6 642 14 904 27 576 34 179Myanmar 56 118 532 447 996 1 415Philippines 244 804 1 043 2 838 6 845 9 187Singapore 720 2 825 3 692 7 258 12 515 15 896Thailand 657 2 186 2 803 6 217 9 794 13 151VietNam 65 250 558 923 871 1 056
Oceania 21 51 61 102 176 240Transition economies 455 835 1 098 3 017 5 715 8 142
Russian Federation 376 654 832 2 338 4 512 6 574Domestic value added (DVA) 84 506 175 463 226 011 395 910 693 866 886 376Gross exports 129 253 293 841 373 483 661 631 1124 100 1418 456
Source: AJC-UNCTAD-Eora database on ASEAN GVCs.Note: All values are estimated. The region/country refers to that to which the value added is attributed. For the GVC terminology, see box 2.

GLOBAL VALUE CHAINS IN ASE AN – SEPTEMBER 201738
Annex table 2-1. Value added exports of goods and services from ASEAN, by value added creator, and by sector/industry, 1990 (Millions of dollars)
Exports from ASEAN by sector/industry Exports from ASEAN by sector/industry
Primary Manufacturing Services
Value added creator
Total
Agriculture, hunting,
forestry and fi shing
Mining, quarrying
and petroleum Total
Food, beverages
and tobacco
Textiles, clothing
and leather
Coke, petroleum
products and nuclear fuel
Chemicals and chemical
products
Machinery and
equipment
Electrical and electronic
equipment
Motor vehicles and other transport
equipment Total Construction TradeHotels and restaurants
Transport, storage and
communications FinanceBusiness activities
Fore
ign
valu
e ad
ded
(FVA
)
World 1 599 591 1 008 36 428 1 651 2 548 2 533 1 817 1 951 16 067 2 487 6 682 180 1 219 581 2 602 364 1 129Developed countries 1 011 356 654 23 801 1 028 1 345 1 552 1 242 1 420 10 406 1 878 4 456 110 810 360 1 740 239 780
Europe 355 139 216 8 603 408 570 643 555 571 3 203 597 1 395 42 246 146 480 72 254European Union (28) 330 128 202 7 919 370 538 595 515 526 2 990 560 1 277 39 226 135 431 65 236
Germany 96 36 60 2 354 100 147 110 150 178 973 181 359 11 65 34 117 18 71United Kingdom 52 19 33 1 234 45 61 181 76 67 480 74 204 5 32 20 74 11 39France 40 17 23 990 54 82 66 70 57 359 63 175 5 30 24 60 8 28Italy 34 12 22 854 37 75 80 50 72 294 48 135 5 24 13 46 7 25Netherlands 26 13 14 604 36 46 71 50 31 201 36 94 2 15 12 34 5 16Belgium 16 8 9 426 20 40 24 31 23 128 24 60 2 12 7 19 3 10Spain 10 4 6 222 12 16 11 17 13 85 14 39 2 7 5 12 3 7Sweden 21 7 14 410 21 25 17 27 34 143 28 75 3 14 6 25 4 15Austria 7 2 5 206 6 9 6 9 13 102 14 28 1 6 2 8 2 5Finland 6 2 4 205 6 7 5 10 12 72 50 28 1 8 2 8 1 6Ireland 3 1 2 65 6 3 3 4 3 30 3 12 0 2 2 4 1 2Czech Republic 2 1 1 46 2 3 3 3 3 20 3 7 0 1 1 3 0 1Denmark 5 2 3 93 11 6 5 6 7 30 8 21 0 3 4 6 1 3Poland 2 1 1 53 3 3 3 3 4 19 4 8 0 1 1 3 0 1Hungary 1 0 1 24 1 2 1 2 1 10 2 5 0 1 0 2 0 1
Other developed Europe 25 11 14 684 38 32 48 40 45 213 37 118 3 20 10 49 6 18Norway 8 4 4 171 16 9 31 15 8 47 8 27 1 4 3 10 1 5Switzerland 16 6 10 507 20 23 16 25 37 165 29 89 2 15 7 38 5 13
North America 278 96 182 5 487 251 266 549 326 252 2 464 302 1 412 21 201 92 618 92 269Canada 16 7 8 353 31 24 62 24 14 92 14 67 2 11 8 29 3 9United States 262 88 174 5 132 219 241 486 301 238 2 372 287 1 345 20 190 84 589 90 260
Other developed countries 378 122 256 9 711 369 509 360 361 596 4 738 980 1 648 47 363 122 642 75 257Australia 57 26 31 956 83 82 168 49 44 250 36 190 5 31 30 70 10 26Japan 309 91 218 8 557 259 416 186 301 544 4 411 934 1 417 41 326 84 561 63 223New Zealand 7 3 4 103 23 8 3 7 4 28 2 23 0 3 7 5 1 3
Developing countries 568 223 345 12 251 595 1 177 954 553 504 5 553 593 2 168 67 396 215 843 122 341Africa 23 11 12 302 23 28 43 18 16 79 12 65 2 12 7 26 3 9Latin America and the Caribbean 26 12 14 449 33 31 64 28 23 141 17 90 2 15 10 36 5 13
Asia 517 200 318 11 483 537 1 116 846 506 464 5 329 563 2 010 63 369 197 780 115 318West Asia 51 20 30 749 54 65 201 54 22 153 19 257 4 31 18 151 8 31South, East and South-east Asia 466 179 287 10 734 483 1 052 645 452 442 5 176 544 1 753 59 338 179 629 107 288
East Asia 253 96 156 6 942 258 818 227 217 284 3 614 346 1 009 38 223 98 356 48 153China 62 34 27 1 009 72 111 87 62 45 350 62 192 6 33 25 72 10 29Hong Kong, China 16 5 11 617 13 60 8 14 22 317 29 68 2 12 6 27 2 12Korea, Republic of 44 16 28 1 155 43 161 41 42 60 530 63 188 7 40 15 71 10 27Taiwan Province of China 130 41 89 4 154 129 485 91 98 157 2 416 191 559 23 137 52 186 25 85
South Asia 18 9 9 415 26 53 39 26 15 107 10 70 2 10 9 25 4 12Bangladesh 0 0 0 7 1 3 0 0 0 1 0 1 0 0 0 1 0 0India 12 6 6 306 20 32 20 20 12 79 7 40 2 6 6 12 2 7Iran, Islamic Republic of 3 2 2 61 3 4 18 4 2 20 1 21 0 3 1 10 2 3Pakistan 1 1 1 27 1 13 1 1 1 3 1 4 0 1 1 1 0 1Sri Lanka 0 0 0 10 1 1 1 0 0 2 1 2 0 0 0 1 0 0
ASEAN 196 74 122 3 378 199 180 379 210 143 1 455 188 674 19 105 72 248 54 123Brunei Darussalam 1 1 1 23 3 3 2 1 1 3 1 11 0 1 1 7 0 1Cambodia 0 0 0 2 0 0 0 0 0 0 0 1 0 0 0 0 0 0Indonesia 37 20 18 856 49 43 219 56 49 233 23 163 5 24 16 60 18 29Lao People’s Democratic Republic
0 0 0 9 1 1 0 6 0 0 0 1 0 0 0 0 0 0
Malaysia 35 11 23 1 192 65 39 116 58 42 592 119 174 5 29 21 59 12 34Myanmar 4 3 1 44 9 2 0 18 1 3 1 8 0 1 2 2 0 1Philippines 11 5 7 177 8 6 4 11 9 99 6 56 1 8 3 22 6 14Singapore 67 17 51 526 27 35 12 31 19 256 32 127 3 24 13 47 8 19Thailand 33 13 20 505 27 46 21 25 21 256 6 118 4 16 13 45 9 22Viet Nam 5 3 2 45 9 5 4 3 2 11 1 15 0 2 3 5 1 3
Oceania 1 1 1 16 1 2 0 1 1 4 1 3 0 1 0 1 0 0Transition economies 21 11 9 376 28 26 27 23 27 108 16 58 3 13 7 19 2 8
Russian Federation 15 9 6 318 24 21 25 20 22 93 14 43 3 10 5 14 2 6Domestic value added (DVA) 14 565 4 320 10 245 43 829 6 192 5 976 1 339 2 810 1 694 10 673 1 412 26 060 373 6 084 3 692 6 575 2 526 3 764Gross exports 16 164 4 911 11 253 80 257 7 843 8 524 3 872 4 627 3 645 26 740 3 900 32 741 553 7 304 4 273 9 177 2 889 4 893Source: AJC-UNCTAD-Eora database on ASEAN GVCs.Note: All values are estimated. The region/country refers to that to which the value added is attributed. For the GVC terminology, see box 2.

PAPER1 A REGIONAL PERSPECTIVE 39
Annex table 2-1. Value added exports of goods and services from ASEAN, by value added creator, and by sector/industry, 1990 (Millions of dollars)
Exports from ASEAN by sector/industry Exports from ASEAN by sector/industry
Primary Manufacturing Services
Value added creator
Total
Agriculture, hunting,
forestry and fi shing
Mining, quarrying
and petroleum Total
Food, beverages
and tobacco
Textiles, clothing
and leather
Coke, petroleum
products and nuclear fuel
Chemicals and chemical
products
Machinery and
equipment
Electrical and electronic
equipment
Motor vehicles and other transport
equipment Total Construction TradeHotels and restaurants
Transport, storage and
communications FinanceBusiness activities
Fore
ign
valu
e ad
ded
(FVA
)
World 1 599 591 1 008 36 428 1 651 2 548 2 533 1 817 1 951 16 067 2 487 6 682 180 1 219 581 2 602 364 1 129Developed countries 1 011 356 654 23 801 1 028 1 345 1 552 1 242 1 420 10 406 1 878 4 456 110 810 360 1 740 239 780
Europe 355 139 216 8 603 408 570 643 555 571 3 203 597 1 395 42 246 146 480 72 254European Union (28) 330 128 202 7 919 370 538 595 515 526 2 990 560 1 277 39 226 135 431 65 236
Germany 96 36 60 2 354 100 147 110 150 178 973 181 359 11 65 34 117 18 71United Kingdom 52 19 33 1 234 45 61 181 76 67 480 74 204 5 32 20 74 11 39France 40 17 23 990 54 82 66 70 57 359 63 175 5 30 24 60 8 28Italy 34 12 22 854 37 75 80 50 72 294 48 135 5 24 13 46 7 25Netherlands 26 13 14 604 36 46 71 50 31 201 36 94 2 15 12 34 5 16Belgium 16 8 9 426 20 40 24 31 23 128 24 60 2 12 7 19 3 10Spain 10 4 6 222 12 16 11 17 13 85 14 39 2 7 5 12 3 7Sweden 21 7 14 410 21 25 17 27 34 143 28 75 3 14 6 25 4 15Austria 7 2 5 206 6 9 6 9 13 102 14 28 1 6 2 8 2 5Finland 6 2 4 205 6 7 5 10 12 72 50 28 1 8 2 8 1 6Ireland 3 1 2 65 6 3 3 4 3 30 3 12 0 2 2 4 1 2Czech Republic 2 1 1 46 2 3 3 3 3 20 3 7 0 1 1 3 0 1Denmark 5 2 3 93 11 6 5 6 7 30 8 21 0 3 4 6 1 3Poland 2 1 1 53 3 3 3 3 4 19 4 8 0 1 1 3 0 1Hungary 1 0 1 24 1 2 1 2 1 10 2 5 0 1 0 2 0 1
Other developed Europe 25 11 14 684 38 32 48 40 45 213 37 118 3 20 10 49 6 18Norway 8 4 4 171 16 9 31 15 8 47 8 27 1 4 3 10 1 5Switzerland 16 6 10 507 20 23 16 25 37 165 29 89 2 15 7 38 5 13
North America 278 96 182 5 487 251 266 549 326 252 2 464 302 1 412 21 201 92 618 92 269Canada 16 7 8 353 31 24 62 24 14 92 14 67 2 11 8 29 3 9United States 262 88 174 5 132 219 241 486 301 238 2 372 287 1 345 20 190 84 589 90 260
Other developed countries 378 122 256 9 711 369 509 360 361 596 4 738 980 1 648 47 363 122 642 75 257Australia 57 26 31 956 83 82 168 49 44 250 36 190 5 31 30 70 10 26Japan 309 91 218 8 557 259 416 186 301 544 4 411 934 1 417 41 326 84 561 63 223New Zealand 7 3 4 103 23 8 3 7 4 28 2 23 0 3 7 5 1 3
Developing countries 568 223 345 12 251 595 1 177 954 553 504 5 553 593 2 168 67 396 215 843 122 341Africa 23 11 12 302 23 28 43 18 16 79 12 65 2 12 7 26 3 9Latin America and the Caribbean 26 12 14 449 33 31 64 28 23 141 17 90 2 15 10 36 5 13
Asia 517 200 318 11 483 537 1 116 846 506 464 5 329 563 2 010 63 369 197 780 115 318West Asia 51 20 30 749 54 65 201 54 22 153 19 257 4 31 18 151 8 31South, East and South-east Asia 466 179 287 10 734 483 1 052 645 452 442 5 176 544 1 753 59 338 179 629 107 288
East Asia 253 96 156 6 942 258 818 227 217 284 3 614 346 1 009 38 223 98 356 48 153China 62 34 27 1 009 72 111 87 62 45 350 62 192 6 33 25 72 10 29Hong Kong, China 16 5 11 617 13 60 8 14 22 317 29 68 2 12 6 27 2 12Korea, Republic of 44 16 28 1 155 43 161 41 42 60 530 63 188 7 40 15 71 10 27Taiwan Province of China 130 41 89 4 154 129 485 91 98 157 2 416 191 559 23 137 52 186 25 85
South Asia 18 9 9 415 26 53 39 26 15 107 10 70 2 10 9 25 4 12Bangladesh 0 0 0 7 1 3 0 0 0 1 0 1 0 0 0 1 0 0India 12 6 6 306 20 32 20 20 12 79 7 40 2 6 6 12 2 7Iran, Islamic Republic of 3 2 2 61 3 4 18 4 2 20 1 21 0 3 1 10 2 3Pakistan 1 1 1 27 1 13 1 1 1 3 1 4 0 1 1 1 0 1Sri Lanka 0 0 0 10 1 1 1 0 0 2 1 2 0 0 0 1 0 0
ASEAN 196 74 122 3 378 199 180 379 210 143 1 455 188 674 19 105 72 248 54 123Brunei Darussalam 1 1 1 23 3 3 2 1 1 3 1 11 0 1 1 7 0 1Cambodia 0 0 0 2 0 0 0 0 0 0 0 1 0 0 0 0 0 0Indonesia 37 20 18 856 49 43 219 56 49 233 23 163 5 24 16 60 18 29Lao People’s Democratic Republic
0 0 0 9 1 1 0 6 0 0 0 1 0 0 0 0 0 0
Malaysia 35 11 23 1 192 65 39 116 58 42 592 119 174 5 29 21 59 12 34Myanmar 4 3 1 44 9 2 0 18 1 3 1 8 0 1 2 2 0 1Philippines 11 5 7 177 8 6 4 11 9 99 6 56 1 8 3 22 6 14Singapore 67 17 51 526 27 35 12 31 19 256 32 127 3 24 13 47 8 19Thailand 33 13 20 505 27 46 21 25 21 256 6 118 4 16 13 45 9 22Viet Nam 5 3 2 45 9 5 4 3 2 11 1 15 0 2 3 5 1 3
Oceania 1 1 1 16 1 2 0 1 1 4 1 3 0 1 0 1 0 0Transition economies 21 11 9 376 28 26 27 23 27 108 16 58 3 13 7 19 2 8
Russian Federation 15 9 6 318 24 21 25 20 22 93 14 43 3 10 5 14 2 6Domestic value added (DVA) 14 565 4 320 10 245 43 829 6 192 5 976 1 339 2 810 1 694 10 673 1 412 26 060 373 6 084 3 692 6 575 2 526 3 764Gross exports 16 164 4 911 11 253 80 257 7 843 8 524 3 872 4 627 3 645 26 740 3 900 32 741 553 7 304 4 273 9 177 2 889 4 893Source: AJC-UNCTAD-Eora database on ASEAN GVCs.Note: All values are estimated. The region/country refers to that to which the value added is attributed. For the GVC terminology, see box 2.

GLOBAL VALUE CHAINS IN ASE AN – SEPTEMBER 201740
Annex table 2-2. Value added exports of goods and services from ASEAN, by value added creator, and by sector/industry, 1995 (Millions of dollars)
Exports from ASEAN by sector/industry Exports from ASEAN by sector/industry
Primary Manufacturing Services
Value added creator
Total
Agriculture, hunting,
forestry and fi shing
Mining, quarrying
and petroleum Total
Food, beverages
and tobacco
Textiles, clothing
and leather
Coke, petroleum
products and nuclear fuel
Chemicals and chemical
products
Machinery and
equipment
Electrical and electronic
equipment
Motor vehicles and other transport
equipment Total Construction TradeHotels and restaurants
Transport, storage and
communications FinanceBusiness activities
Fore
ign
valu
e ad
ded
(FVA
)
World 3 671 1 497 2 174 98 852 4 123 5 724 7 579 4 783 5 177 44 752 7 038 15 845 289 2 428 1 342 6 085 958 3 191Developed countries 2 320 870 1 450 65 309 2 561 3 127 4 625 3 249 3 760 29 811 5 121 10 685 186 1 645 857 4 081 630 2 211
Europe 818 338 480 23 347 1 013 1 316 2 281 1 437 1 446 8 826 1 720 3 312 73 496 333 1 161 174 686European Union (28) 752 309 443 21 359 908 1 238 2 092 1 326 1 312 8 107 1 616 3 025 68 456 308 1 048 158 632
Germany 227 88 138 6 250 243 341 433 391 449 2 549 478 862 20 130 75 294 45 190United Kingdom 115 47 68 3 596 120 156 623 210 175 1 309 288 507 11 74 45 190 27 104France 94 41 53 2 670 128 166 249 183 145 1 002 178 419 8 60 52 147 21 82Italy 70 25 45 2 001 85 144 170 111 160 730 124 280 8 43 28 94 14 59Netherlands 72 38 35 1 904 109 151 290 140 88 633 102 262 5 35 33 94 13 52Belgium 40 20 21 1 246 55 84 149 82 62 391 96 155 4 25 18 51 7 31Spain 26 11 15 679 34 42 36 45 39 260 68 95 3 16 11 29 5 19Sweden 35 12 23 823 38 46 36 49 64 301 59 133 3 21 10 47 7 31Austria 16 5 11 534 14 22 18 21 33 264 40 63 2 12 5 19 4 14Finland 13 5 8 497 15 16 15 24 27 195 100 62 1 14 4 17 4 14Ireland 6 2 4 186 13 8 10 10 8 91 11 31 0 4 4 11 2 6Czech Republic 4 2 3 141 5 8 8 7 8 66 11 18 0 3 2 6 1 4Denmark 11 4 7 254 23 14 18 15 19 89 20 51 1 6 11 15 2 9Poland 6 2 3 154 7 8 10 10 11 57 12 20 0 3 2 6 1 4Hungary 3 1 2 77 3 4 4 5 4 36 6 12 0 2 1 5 1 2
Other developed Europe 65 29 37 1 988 104 78 189 112 134 719 104 286 5 40 26 113 16 54Norway 19 11 8 537 50 21 135 41 22 143 23 72 2 9 9 30 3 13Switzerland 45 17 28 1 438 51 56 54 71 112 573 80 211 3 31 16 83 14 40
North America 645 240 405 15 016 676 635 1 413 879 715 6 681 961 3 594 40 470 240 1 456 259 805Canada 36 17 19 930 70 47 172 66 39 262 40 155 3 21 19 67 6 25United States 608 222 386 14 082 604 588 1 241 813 676 6 419 921 3 438 37 449 221 1 389 253 779
Other developed countries 858 292 566 26 946 873 1 176 932 932 1 599 14 304 2 440 3 779 74 679 284 1 464 197 720Australia 125 63 62 2 292 230 161 351 118 112 664 91 425 8 57 80 142 22 69Japan 706 217 490 24 107 571 985 563 770 1 465 13 430 2 321 3 247 65 608 182 1 294 168 629New Zealand 15 7 8 296 61 21 8 30 11 77 7 61 1 7 19 12 3 10
Developing countries 1 320 610 710 32 829 1 522 2 557 2 895 1 496 1 365 14 713 1 883 5 070 98 766 477 1 973 323 965Africa 47 22 25 1 025 65 62 219 64 49 276 39 153 4 24 17 62 6 25Latin America and the Caribbean 58 28 30 1 343 106 73 203 81 61 451 60 224 4 31 24 92 11 39
Asia 1 212 559 653 30 419 1 347 2 416 2 472 1 349 1 253 13 976 1 782 4 686 90 710 435 1 816 305 900West Asia 96 43 53 1 761 117 123 453 121 55 382 50 511 6 57 36 296 17 68South, East and South-east Asia 1 116 516 600 28 659 1 230 2 293 2 019 1 228 1 198 13 594 1 732 4 175 84 653 399 1 520 288 832
East Asia 529 253 276 15 429 527 1 522 577 494 665 7 885 983 1 871 41 340 168 679 102 346China 235 152 83 3 727 253 394 241 205 176 1 341 287 550 13 88 73 185 31 103Hong Kong, China 46 16 30 1 965 45 176 34 42 88 1 076 97 205 4 30 16 79 9 43Korea, Republic of 122 44 78 4 525 103 386 172 129 188 2 426 350 566 12 107 36 229 33 95Taiwan Province of China 125 40 84 5 197 126 565 130 117 211 3 037 246 548 12 115 43 185 30 104
South Asia 61 36 25 1 406 104 151 183 95 51 407 44 241 5 30 34 91 15 41Bangladesh 1 1 0 26 3 10 1 1 1 6 1 4 0 1 1 2 0 1India 42 26 16 980 80 92 76 66 39 305 33 131 4 17 24 39 7 25Iran, Islamic Republic of 12 6 6 284 13 13 98 22 8 75 6 87 1 10 5 45 7 13Pakistan 4 1 3 83 5 32 6 4 2 13 2 12 0 2 3 4 0 2Sri Lanka 1 1 0 27 3 3 2 1 1 7 2 4 0 1 1 2 0 1
ASEAN 526 227 299 11 823 598 620 1 258 640 483 5 302 705 2 063 39 283 196 750 172 444Brunei Darussalam 2 1 1 50 5 6 7 2 1 7 2 18 0 2 1 12 0 2Cambodia 3 2 0 24 5 3 0 1 1 2 0 4 0 0 1 1 0 1Indonesia 127 77 50 3 444 203 175 678 198 146 1 250 144 537 11 67 56 192 52 116Lao People’s Democratic Republic
1 1 0 27 2 2 0 19 0 1 0 3 0 0 1 1 0 0
Malaysia 63 23 39 3 445 123 92 345 170 126 1 748 372 481 11 79 37 174 38 104Myanmar 7 6 1 91 19 6 2 21 2 7 2 20 0 2 5 10 0 2Philippines 31 15 17 602 28 20 15 33 31 336 22 171 2 21 12 59 23 45Singapore 178 52 126 2 200 94 129 53 104 96 1 138 127 447 6 66 34 163 33 93Thailand 93 42 50 1 749 95 174 102 76 75 776 33 345 8 40 42 125 23 75Viet Nam 22 8 14 191 24 13 56 16 5 35 4 37 0 4 7 14 2 6
Oceania 2 1 1 42 4 6 1 2 2 10 2 7 0 1 1 2 0 1Transition economies 31 17 14 714 40 39 59 38 53 227 34 90 4 17 9 31 5 15
Russian Federation 22 13 9 568 32 29 53 31 39 180 26 63 3 11 6 22 3 11Domestic value added (DVA) 25 481 7 869 17 612 98 411 11 990 12 038 3 150 6 379 4 252 25 025 3 987 51 543 537 11 933 6 879 12 214 5 497 8 112Gross exports 29 152 9 366 19 786 197 264 16 113 17 762 10 729 11 162 9 429 69 777 11 025 67 388 826 14 360 8 221 18 299 6 455 11 303Source: AJC-UNCTAD-Eora database on ASEAN GVCs.Note: All values are estimated. The region/country refers to that to which the value added is attributed. For the GVC terminology, see box 2.
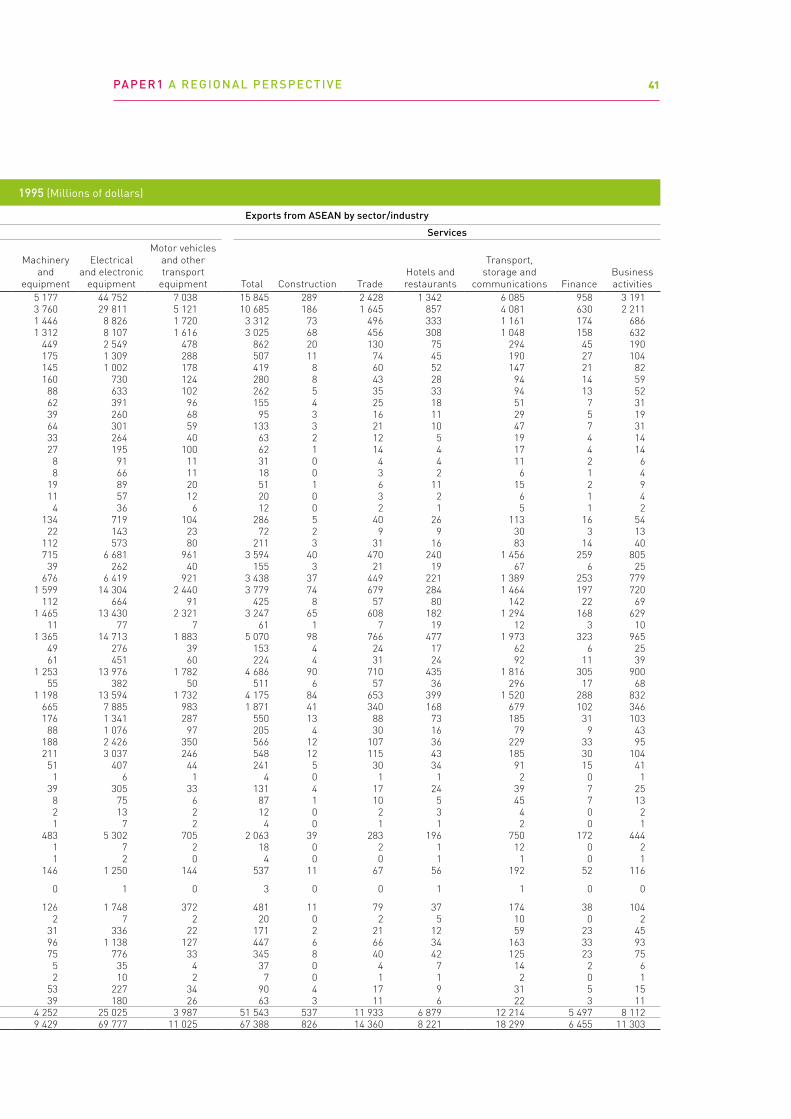
PAPER1 A REGIONAL PERSPECTIVE 41
Annex table 2-2. Value added exports of goods and services from ASEAN, by value added creator, and by sector/industry, 1995 (Millions of dollars)
Exports from ASEAN by sector/industry Exports from ASEAN by sector/industry
Primary Manufacturing Services
Value added creator
Total
Agriculture, hunting,
forestry and fi shing
Mining, quarrying
and petroleum Total
Food, beverages
and tobacco
Textiles, clothing
and leather
Coke, petroleum
products and nuclear fuel
Chemicals and chemical
products
Machinery and
equipment
Electrical and electronic
equipment
Motor vehicles and other transport
equipment Total Construction TradeHotels and restaurants
Transport, storage and
communications FinanceBusiness activities
Fore
ign
valu
e ad
ded
(FVA
)
World 3 671 1 497 2 174 98 852 4 123 5 724 7 579 4 783 5 177 44 752 7 038 15 845 289 2 428 1 342 6 085 958 3 191Developed countries 2 320 870 1 450 65 309 2 561 3 127 4 625 3 249 3 760 29 811 5 121 10 685 186 1 645 857 4 081 630 2 211
Europe 818 338 480 23 347 1 013 1 316 2 281 1 437 1 446 8 826 1 720 3 312 73 496 333 1 161 174 686European Union (28) 752 309 443 21 359 908 1 238 2 092 1 326 1 312 8 107 1 616 3 025 68 456 308 1 048 158 632
Germany 227 88 138 6 250 243 341 433 391 449 2 549 478 862 20 130 75 294 45 190United Kingdom 115 47 68 3 596 120 156 623 210 175 1 309 288 507 11 74 45 190 27 104France 94 41 53 2 670 128 166 249 183 145 1 002 178 419 8 60 52 147 21 82Italy 70 25 45 2 001 85 144 170 111 160 730 124 280 8 43 28 94 14 59Netherlands 72 38 35 1 904 109 151 290 140 88 633 102 262 5 35 33 94 13 52Belgium 40 20 21 1 246 55 84 149 82 62 391 96 155 4 25 18 51 7 31Spain 26 11 15 679 34 42 36 45 39 260 68 95 3 16 11 29 5 19Sweden 35 12 23 823 38 46 36 49 64 301 59 133 3 21 10 47 7 31Austria 16 5 11 534 14 22 18 21 33 264 40 63 2 12 5 19 4 14Finland 13 5 8 497 15 16 15 24 27 195 100 62 1 14 4 17 4 14Ireland 6 2 4 186 13 8 10 10 8 91 11 31 0 4 4 11 2 6Czech Republic 4 2 3 141 5 8 8 7 8 66 11 18 0 3 2 6 1 4Denmark 11 4 7 254 23 14 18 15 19 89 20 51 1 6 11 15 2 9Poland 6 2 3 154 7 8 10 10 11 57 12 20 0 3 2 6 1 4Hungary 3 1 2 77 3 4 4 5 4 36 6 12 0 2 1 5 1 2
Other developed Europe 65 29 37 1 988 104 78 189 112 134 719 104 286 5 40 26 113 16 54Norway 19 11 8 537 50 21 135 41 22 143 23 72 2 9 9 30 3 13Switzerland 45 17 28 1 438 51 56 54 71 112 573 80 211 3 31 16 83 14 40
North America 645 240 405 15 016 676 635 1 413 879 715 6 681 961 3 594 40 470 240 1 456 259 805Canada 36 17 19 930 70 47 172 66 39 262 40 155 3 21 19 67 6 25United States 608 222 386 14 082 604 588 1 241 813 676 6 419 921 3 438 37 449 221 1 389 253 779
Other developed countries 858 292 566 26 946 873 1 176 932 932 1 599 14 304 2 440 3 779 74 679 284 1 464 197 720Australia 125 63 62 2 292 230 161 351 118 112 664 91 425 8 57 80 142 22 69Japan 706 217 490 24 107 571 985 563 770 1 465 13 430 2 321 3 247 65 608 182 1 294 168 629New Zealand 15 7 8 296 61 21 8 30 11 77 7 61 1 7 19 12 3 10
Developing countries 1 320 610 710 32 829 1 522 2 557 2 895 1 496 1 365 14 713 1 883 5 070 98 766 477 1 973 323 965Africa 47 22 25 1 025 65 62 219 64 49 276 39 153 4 24 17 62 6 25Latin America and the Caribbean 58 28 30 1 343 106 73 203 81 61 451 60 224 4 31 24 92 11 39
Asia 1 212 559 653 30 419 1 347 2 416 2 472 1 349 1 253 13 976 1 782 4 686 90 710 435 1 816 305 900West Asia 96 43 53 1 761 117 123 453 121 55 382 50 511 6 57 36 296 17 68South, East and South-east Asia 1 116 516 600 28 659 1 230 2 293 2 019 1 228 1 198 13 594 1 732 4 175 84 653 399 1 520 288 832
East Asia 529 253 276 15 429 527 1 522 577 494 665 7 885 983 1 871 41 340 168 679 102 346China 235 152 83 3 727 253 394 241 205 176 1 341 287 550 13 88 73 185 31 103Hong Kong, China 46 16 30 1 965 45 176 34 42 88 1 076 97 205 4 30 16 79 9 43Korea, Republic of 122 44 78 4 525 103 386 172 129 188 2 426 350 566 12 107 36 229 33 95Taiwan Province of China 125 40 84 5 197 126 565 130 117 211 3 037 246 548 12 115 43 185 30 104
South Asia 61 36 25 1 406 104 151 183 95 51 407 44 241 5 30 34 91 15 41Bangladesh 1 1 0 26 3 10 1 1 1 6 1 4 0 1 1 2 0 1India 42 26 16 980 80 92 76 66 39 305 33 131 4 17 24 39 7 25Iran, Islamic Republic of 12 6 6 284 13 13 98 22 8 75 6 87 1 10 5 45 7 13Pakistan 4 1 3 83 5 32 6 4 2 13 2 12 0 2 3 4 0 2Sri Lanka 1 1 0 27 3 3 2 1 1 7 2 4 0 1 1 2 0 1
ASEAN 526 227 299 11 823 598 620 1 258 640 483 5 302 705 2 063 39 283 196 750 172 444Brunei Darussalam 2 1 1 50 5 6 7 2 1 7 2 18 0 2 1 12 0 2Cambodia 3 2 0 24 5 3 0 1 1 2 0 4 0 0 1 1 0 1Indonesia 127 77 50 3 444 203 175 678 198 146 1 250 144 537 11 67 56 192 52 116Lao People’s Democratic Republic
1 1 0 27 2 2 0 19 0 1 0 3 0 0 1 1 0 0
Malaysia 63 23 39 3 445 123 92 345 170 126 1 748 372 481 11 79 37 174 38 104Myanmar 7 6 1 91 19 6 2 21 2 7 2 20 0 2 5 10 0 2Philippines 31 15 17 602 28 20 15 33 31 336 22 171 2 21 12 59 23 45Singapore 178 52 126 2 200 94 129 53 104 96 1 138 127 447 6 66 34 163 33 93Thailand 93 42 50 1 749 95 174 102 76 75 776 33 345 8 40 42 125 23 75Viet Nam 22 8 14 191 24 13 56 16 5 35 4 37 0 4 7 14 2 6
Oceania 2 1 1 42 4 6 1 2 2 10 2 7 0 1 1 2 0 1Transition economies 31 17 14 714 40 39 59 38 53 227 34 90 4 17 9 31 5 15
Russian Federation 22 13 9 568 32 29 53 31 39 180 26 63 3 11 6 22 3 11Domestic value added (DVA) 25 481 7 869 17 612 98 411 11 990 12 038 3 150 6 379 4 252 25 025 3 987 51 543 537 11 933 6 879 12 214 5 497 8 112Gross exports 29 152 9 366 19 786 197 264 16 113 17 762 10 729 11 162 9 429 69 777 11 025 67 388 826 14 360 8 221 18 299 6 455 11 303Source: AJC-UNCTAD-Eora database on ASEAN GVCs.Note: All values are estimated. The region/country refers to that to which the value added is attributed. For the GVC terminology, see box 2.

GLOBAL VALUE CHAINS IN ASE AN – SEPTEMBER 201742
Annex table 2-3. Value added exports of goods and services from ASEAN, by value added creator, and by sector/industry, 2000 (Millions of dollars)
Exports from ASEAN by sector/industry Exports from ASEAN by sector/industry
Primary Manufacturing Services
Value added creator
Total
Agriculture, hunting,
forestry and fi shing
Mining, quarrying
and petroleum Total
Food, beverages
and tobacco
Textiles, clothing
and leather
Coke, petroleum
products and nuclear fuel
Chemicals and chemical
products
Machinery and
equipment
Electrical and electronic
equipment
Motor vehicles and other transport
equipment Total Construction TradeHotels and restaurants
Transport, storage and
communications FinanceBusiness activities
Fore
ign
valu
e ad
ded
(FVA
)
World 3 123 1 556 1 567 125 308 4 811 8 975 8 818 7 193 6 467 56 197 9 320 18 982 330 2 802 1 460 7 182 1 150 4 136Developed countries 1 712 851 861 75 429 2 786 4 452 4 986 4 480 4 345 34 462 5 665 11 568 196 1 686 856 4 275 698 2 640
Europe 607 320 286 25 142 1 059 1 786 1 969 1 805 1 611 9 697 1 838 3 645 73 524 316 1 299 201 805European Union (28) 555 292 264 23 061 955 1 679 1 785 1 662 1 468 8 933 1 729 3 340 68 483 292 1 179 183 742
Germany 149 75 75 6 217 231 436 322 432 465 2 575 480 872 18 125 64 305 48 205United Kingdom 104 54 50 4 638 159 259 656 326 237 1 735 361 672 13 95 52 259 36 144France 71 40 32 2 792 134 209 212 230 158 1 064 186 449 8 63 48 160 24 93Italy 49 23 26 2 126 92 183 120 137 178 801 134 303 8 45 27 102 17 69Netherlands 52 33 19 1 958 105 199 205 159 97 688 109 272 5 35 31 97 14 58Belgium 28 16 11 1 192 53 99 105 98 64 399 93 159 4 26 17 52 8 34Spain 19 10 9 737 34 58 31 54 46 283 69 102 3 17 10 32 6 22Sweden 19 9 10 719 32 63 23 49 59 258 52 115 3 17 8 41 7 29Austria 12 5 6 587 16 33 17 28 39 286 42 71 2 13 5 22 4 17Finland 10 5 5 535 16 23 14 33 30 212 95 71 1 15 4 20 4 17Ireland 7 3 4 303 19 16 13 20 13 146 17 56 1 7 5 19 4 13Czech Republic 4 2 2 176 6 14 8 12 11 78 13 24 0 4 2 8 1 5Denmark 9 5 5 302 25 21 21 23 23 103 23 57 1 7 10 19 3 11Poland 5 3 2 201 9 14 10 16 14 76 15 27 1 4 2 9 1 6Hungary 3 2 2 127 4 8 5 12 7 57 10 20 0 3 1 8 1 4
Other developed Europe 51 29 22 2 081 105 107 184 143 143 764 109 305 5 41 24 120 18 63Norway 19 12 7 655 54 34 140 59 28 180 30 92 2 11 9 39 3 18Switzerland 31 16 15 1 407 47 71 44 82 113 580 78 210 3 29 14 80 14 45
North America 517 261 257 20 860 814 1 002 2 125 1 398 1 002 9 391 1 237 3 958 48 479 260 1 533 281 974Canada 45 25 20 1 760 100 89 371 139 75 518 88 258 4 35 24 115 10 45United States 472 235 237 19 097 711 913 1 754 1 259 927 8 873 1 148 3 700 44 445 236 1 418 271 928
Other developed countries 588 270 318 29 427 913 1 664 891 1 277 1 733 15 373 2 590 3 964 74 683 280 1 444 217 861Australia 102 62 40 2 628 246 226 325 151 155 768 120 499 9 59 87 177 25 86Japan 461 193 268 26 005 580 1 385 548 1 054 1 546 14 282 2 429 3 313 64 607 167 1 225 182 742New Zealand 13 7 6 398 71 36 8 49 16 105 11 82 1 8 22 17 4 16
Developing countries 1 374 683 691 48 941 1 981 4 457 3 762 2 653 2 053 21 423 3 603 7 291 130 1 092 595 2 860 446 1 476Africa 56 27 28 1 870 80 107 266 111 83 772 67 222 5 33 20 91 9 42Latin America and the Caribbean 59 33 26 1 964 133 126 284 148 90 672 92 305 6 40 30 126 15 58
Asia 1 257 621 636 45 056 1 763 4 219 3 211 2 393 1 877 19 966 3 442 6 757 119 1 018 544 2 640 422 1 376West Asia 123 60 63 2 662 151 202 553 224 86 618 84 723 7 83 43 411 29 101South, East and South-east Asia 1 134 562 572 42 395 1 612 4 018 2 658 2 168 1 791 19 348 3 358 6 034 111 935 501 2 229 393 1 274
East Asia 509 259 250 23 091 690 2 649 724 908 1 043 11 001 2 192 2 757 54 520 222 936 152 569China 197 120 77 7 443 307 956 277 349 335 2 962 1 031 903 19 166 102 284 43 185Hong Kong, China 40 19 21 2 382 53 270 37 59 94 1 282 117 270 4 35 19 104 15 64Korea, Republic of 113 54 60 5 676 134 571 229 237 239 2 749 547 749 13 142 41 300 40 138Taiwan Province of China 158 66 92 7 553 193 849 180 261 372 3 996 491 829 17 176 59 247 53 181
South Asia 66 43 23 1 996 130 272 207 152 77 572 70 330 7 39 44 126 19 60Bangladesh 1 1 0 64 3 40 1 2 2 9 1 6 0 1 1 2 0 1India 45 32 13 1 417 102 163 86 110 60 437 53 202 5 23 32 67 10 40Iran, Islamic Republic of 13 7 6 357 15 20 110 32 10 96 10 100 1 12 6 50 8 15Pakistan 4 1 3 108 5 43 8 6 3 18 3 14 0 2 3 4 0 2Sri Lanka 1 1 0 38 3 5 2 2 1 9 3 6 0 1 1 2 0 1
ASEAN 558 260 299 17 308 793 1 096 1 727 1 108 671 7 775 1 097 2 947 51 376 235 1 167 222 645Brunei Darussalam 4 2 2 85 7 10 11 6 2 13 3 26 0 3 2 17 1 3Cambodia 3 3 0 39 6 5 0 1 2 5 1 5 0 1 1 2 0 1Indonesia 93 64 29 4 618 228 301 720 276 176 1 919 289 626 16 77 60 230 42 147Lao People’s Democratic Republic
1 1 1 43 3 3 0 30 1 2 1 3 0 1 1 1 0 0
Malaysia 122 40 82 5 639 190 191 617 399 190 2 750 533 879 15 143 48 344 79 185Myanmar 22 15 7 391 51 27 15 46 9 31 10 120 1 13 11 78 2 10Philippines 22 12 10 842 31 46 15 38 38 513 37 179 2 21 10 70 20 45Singapore 149 56 93 2 944 122 219 59 135 139 1 543 164 598 7 70 42 228 45 137Thailand 102 54 48 2 262 115 261 148 128 102 924 46 439 10 40 49 169 29 104Viet Nam 41 13 27 445 40 34 142 49 12 77 13 71 1 7 11 29 4 13
Oceania 2 1 1 51 4 4 1 3 3 13 2 7 0 1 1 3 0 1Transition economies 37 22 15 937 45 67 71 60 69 312 52 123 5 23 9 47 6 21
Russian Federation 25 16 9 718 34 48 59 48 49 240 38 88 3 16 7 35 4 15Domestic value added (DVA) 32 109 9 827 22 282 134 190 14 618 16 430 5 548 9 918 6 273 40 359 4 893 59 581 579 12 484 6 701 14 422 6 170 11 303Gross exports 35 231 11 383 23 848 259 498 19 429 25 406 14 366 17 111 12 740 96 555 14 213 78 562 909 15 286 8 161 21 603 7 320 15 439Source: AJC-UNCTAD-Eora database on ASEAN GVCs.Note: All values are estimated. The region/country refers to that to which the value added is attributed. For the GVC terminology, see box 2.

PAPER1 A REGIONAL PERSPECTIVE 43
Annex table 2-3. Value added exports of goods and services from ASEAN, by value added creator, and by sector/industry, 2000 (Millions of dollars)
Exports from ASEAN by sector/industry Exports from ASEAN by sector/industry
Primary Manufacturing Services
Value added creator
Total
Agriculture, hunting,
forestry and fi shing
Mining, quarrying
and petroleum Total
Food, beverages
and tobacco
Textiles, clothing
and leather
Coke, petroleum
products and nuclear fuel
Chemicals and chemical
products
Machinery and
equipment
Electrical and electronic
equipment
Motor vehicles and other transport
equipment Total Construction TradeHotels and restaurants
Transport, storage and
communications FinanceBusiness activities
Fore
ign
valu
e ad
ded
(FVA
)
World 3 123 1 556 1 567 125 308 4 811 8 975 8 818 7 193 6 467 56 197 9 320 18 982 330 2 802 1 460 7 182 1 150 4 136Developed countries 1 712 851 861 75 429 2 786 4 452 4 986 4 480 4 345 34 462 5 665 11 568 196 1 686 856 4 275 698 2 640
Europe 607 320 286 25 142 1 059 1 786 1 969 1 805 1 611 9 697 1 838 3 645 73 524 316 1 299 201 805European Union (28) 555 292 264 23 061 955 1 679 1 785 1 662 1 468 8 933 1 729 3 340 68 483 292 1 179 183 742
Germany 149 75 75 6 217 231 436 322 432 465 2 575 480 872 18 125 64 305 48 205United Kingdom 104 54 50 4 638 159 259 656 326 237 1 735 361 672 13 95 52 259 36 144France 71 40 32 2 792 134 209 212 230 158 1 064 186 449 8 63 48 160 24 93Italy 49 23 26 2 126 92 183 120 137 178 801 134 303 8 45 27 102 17 69Netherlands 52 33 19 1 958 105 199 205 159 97 688 109 272 5 35 31 97 14 58Belgium 28 16 11 1 192 53 99 105 98 64 399 93 159 4 26 17 52 8 34Spain 19 10 9 737 34 58 31 54 46 283 69 102 3 17 10 32 6 22Sweden 19 9 10 719 32 63 23 49 59 258 52 115 3 17 8 41 7 29Austria 12 5 6 587 16 33 17 28 39 286 42 71 2 13 5 22 4 17Finland 10 5 5 535 16 23 14 33 30 212 95 71 1 15 4 20 4 17Ireland 7 3 4 303 19 16 13 20 13 146 17 56 1 7 5 19 4 13Czech Republic 4 2 2 176 6 14 8 12 11 78 13 24 0 4 2 8 1 5Denmark 9 5 5 302 25 21 21 23 23 103 23 57 1 7 10 19 3 11Poland 5 3 2 201 9 14 10 16 14 76 15 27 1 4 2 9 1 6Hungary 3 2 2 127 4 8 5 12 7 57 10 20 0 3 1 8 1 4
Other developed Europe 51 29 22 2 081 105 107 184 143 143 764 109 305 5 41 24 120 18 63Norway 19 12 7 655 54 34 140 59 28 180 30 92 2 11 9 39 3 18Switzerland 31 16 15 1 407 47 71 44 82 113 580 78 210 3 29 14 80 14 45
North America 517 261 257 20 860 814 1 002 2 125 1 398 1 002 9 391 1 237 3 958 48 479 260 1 533 281 974Canada 45 25 20 1 760 100 89 371 139 75 518 88 258 4 35 24 115 10 45United States 472 235 237 19 097 711 913 1 754 1 259 927 8 873 1 148 3 700 44 445 236 1 418 271 928
Other developed countries 588 270 318 29 427 913 1 664 891 1 277 1 733 15 373 2 590 3 964 74 683 280 1 444 217 861Australia 102 62 40 2 628 246 226 325 151 155 768 120 499 9 59 87 177 25 86Japan 461 193 268 26 005 580 1 385 548 1 054 1 546 14 282 2 429 3 313 64 607 167 1 225 182 742New Zealand 13 7 6 398 71 36 8 49 16 105 11 82 1 8 22 17 4 16
Developing countries 1 374 683 691 48 941 1 981 4 457 3 762 2 653 2 053 21 423 3 603 7 291 130 1 092 595 2 860 446 1 476Africa 56 27 28 1 870 80 107 266 111 83 772 67 222 5 33 20 91 9 42Latin America and the Caribbean 59 33 26 1 964 133 126 284 148 90 672 92 305 6 40 30 126 15 58
Asia 1 257 621 636 45 056 1 763 4 219 3 211 2 393 1 877 19 966 3 442 6 757 119 1 018 544 2 640 422 1 376West Asia 123 60 63 2 662 151 202 553 224 86 618 84 723 7 83 43 411 29 101South, East and South-east Asia 1 134 562 572 42 395 1 612 4 018 2 658 2 168 1 791 19 348 3 358 6 034 111 935 501 2 229 393 1 274
East Asia 509 259 250 23 091 690 2 649 724 908 1 043 11 001 2 192 2 757 54 520 222 936 152 569China 197 120 77 7 443 307 956 277 349 335 2 962 1 031 903 19 166 102 284 43 185Hong Kong, China 40 19 21 2 382 53 270 37 59 94 1 282 117 270 4 35 19 104 15 64Korea, Republic of 113 54 60 5 676 134 571 229 237 239 2 749 547 749 13 142 41 300 40 138Taiwan Province of China 158 66 92 7 553 193 849 180 261 372 3 996 491 829 17 176 59 247 53 181
South Asia 66 43 23 1 996 130 272 207 152 77 572 70 330 7 39 44 126 19 60Bangladesh 1 1 0 64 3 40 1 2 2 9 1 6 0 1 1 2 0 1India 45 32 13 1 417 102 163 86 110 60 437 53 202 5 23 32 67 10 40Iran, Islamic Republic of 13 7 6 357 15 20 110 32 10 96 10 100 1 12 6 50 8 15Pakistan 4 1 3 108 5 43 8 6 3 18 3 14 0 2 3 4 0 2Sri Lanka 1 1 0 38 3 5 2 2 1 9 3 6 0 1 1 2 0 1
ASEAN 558 260 299 17 308 793 1 096 1 727 1 108 671 7 775 1 097 2 947 51 376 235 1 167 222 645Brunei Darussalam 4 2 2 85 7 10 11 6 2 13 3 26 0 3 2 17 1 3Cambodia 3 3 0 39 6 5 0 1 2 5 1 5 0 1 1 2 0 1Indonesia 93 64 29 4 618 228 301 720 276 176 1 919 289 626 16 77 60 230 42 147Lao People’s Democratic Republic
1 1 1 43 3 3 0 30 1 2 1 3 0 1 1 1 0 0
Malaysia 122 40 82 5 639 190 191 617 399 190 2 750 533 879 15 143 48 344 79 185Myanmar 22 15 7 391 51 27 15 46 9 31 10 120 1 13 11 78 2 10Philippines 22 12 10 842 31 46 15 38 38 513 37 179 2 21 10 70 20 45Singapore 149 56 93 2 944 122 219 59 135 139 1 543 164 598 7 70 42 228 45 137Thailand 102 54 48 2 262 115 261 148 128 102 924 46 439 10 40 49 169 29 104Viet Nam 41 13 27 445 40 34 142 49 12 77 13 71 1 7 11 29 4 13
Oceania 2 1 1 51 4 4 1 3 3 13 2 7 0 1 1 3 0 1Transition economies 37 22 15 937 45 67 71 60 69 312 52 123 5 23 9 47 6 21
Russian Federation 25 16 9 718 34 48 59 48 49 240 38 88 3 16 7 35 4 15Domestic value added (DVA) 32 109 9 827 22 282 134 190 14 618 16 430 5 548 9 918 6 273 40 359 4 893 59 581 579 12 484 6 701 14 422 6 170 11 303Gross exports 35 231 11 383 23 848 259 498 19 429 25 406 14 366 17 111 12 740 96 555 14 213 78 562 909 15 286 8 161 21 603 7 320 15 439Source: AJC-UNCTAD-Eora database on ASEAN GVCs.Note: All values are estimated. The region/country refers to that to which the value added is attributed. For the GVC terminology, see box 2.

GLOBAL VALUE CHAINS IN ASE AN – SEPTEMBER 201744
Annex table 2-4. Value added exports of goods and services from ASEAN, by value added creator, and by sector/industry, 2005 (Millions of dollars)
Exports from ASEAN by sector/industry Exports from ASEAN by sector/industry
Primary Manufacturing Services
Value added creator
Total
Agriculture, hunting,
forestry and fi shing
Mining, quarrying
and petroleum Total
Food, beverages
and tobacco
Textiles, clothing
and leather
Coke, petroleum
products and nuclear fuel
Chemicals and chemical
products
Machinery and
equipment
Electrical and electronic
equipment
Motor vehicles and other transport
equipment Total Construction TradeHotels and restaurants
Transport, storage and
communications FinanceBusiness activities
Fore
ign
valu
e ad
ded
(FVA
)
World 5 084 2 555 2 529 222 019 8 540 14 452 18 345 13 229 11 747 100 246 14 588 38 599 761 5 752 2 711 14 534 2 458 8 537Developed countries 2 624 1 310 1 315 121 386 4 669 7 283 8 851 7 582 7 389 54 531 7 924 22 271 421 3 297 1 518 8 167 1 448 5 108
Europe 1 021 534 487 48 760 1 937 3 129 4 362 3 503 3 159 19 372 3 240 7 853 179 1 161 612 2 759 455 1 768European Union (28) 940 489 451 45 017 1 757 2 949 3 984 3 242 2 902 17 970 3 061 7 241 167 1 078 569 2 523 412 1 642
Germany 251 126 125 11 956 428 783 759 826 898 5 019 842 1 909 46 280 127 663 110 455United Kingdom 158 79 78 8 027 255 412 1 275 575 417 3 114 497 1 287 27 182 90 483 74 286France 122 67 55 5 600 249 375 459 444 321 2 237 358 975 20 144 95 342 54 208Italy 86 41 45 4 239 168 342 309 279 354 1 601 255 674 19 104 52 227 37 154Netherlands 80 49 31 3 554 181 257 490 303 179 1 275 185 548 11 73 55 197 30 119Belgium 51 30 21 2 503 106 180 263 203 138 857 170 369 10 61 34 120 20 81Spain 41 22 19 1 914 80 131 89 139 120 787 174 287 9 48 25 88 16 63Sweden 33 16 17 1 454 59 129 57 102 119 529 98 257 7 38 16 91 15 63Austria 21 10 12 1 290 33 66 42 64 85 651 86 174 4 31 11 54 10 42Finland 17 8 9 1 063 31 44 31 66 61 436 177 157 3 33 9 44 10 38Ireland 12 6 6 670 41 32 32 44 29 345 34 125 2 15 12 44 9 28Czech Republic 10 5 5 496 16 33 28 32 31 227 35 73 2 11 5 25 4 17Denmark 15 7 7 565 43 36 50 42 42 198 38 120 2 14 19 41 6 24Poland 10 5 5 448 18 29 29 34 32 174 32 67 2 10 5 23 3 15Hungary 6 3 3 311 9 18 15 23 18 149 24 52 1 8 3 19 4 12
Other developed Europe 81 45 36 3 742 179 179 378 262 257 1 402 179 613 12 83 44 236 44 126Norway 28 19 10 1 164 90 54 283 106 52 313 49 173 4 22 16 72 7 34Switzerland 50 25 25 2 546 83 123 94 154 204 1 080 128 434 7 60 27 162 37 91
North America 708 350 357 27 998 1 146 1 355 3 020 2 110 1 404 12 278 1 387 7 134 88 867 398 2 664 605 1 833Canada 61 36 25 2 869 168 136 522 221 130 911 149 461 9 67 42 190 20 87United States 646 314 332 25 123 975 1 219 2 498 1 889 1 275 11 366 1 238 6 672 79 800 356 2 474 584 1 746
Other developed countries 896 425 471 44 628 1 587 2 799 1 469 1 969 2 825 22 881 3 297 7 284 155 1 268 507 2 745 388 1 507Australia 168 100 68 5 369 448 381 681 308 335 1 687 239 1 092 23 142 169 379 60 197Japan 688 302 386 37 867 981 2 351 749 1 540 2 432 20 605 2 996 5 878 128 1 091 283 2 282 306 1 240New Zealand 22 12 10 728 133 42 19 79 30 213 20 177 2 17 48 38 9 34
Developing countries 2 377 1 192 1 185 98 057 3 752 7 009 9 264 5 485 4 160 44 846 6 527 15 971 323 2 385 1 168 6 244 991 3 363Africa 96 46 50 4 044 151 191 682 241 199 1 675 133 522 14 82 41 211 21 102Latin America and the Caribbean 95 54 41 3 672 233 217 526 270 181 1 316 162 625 13 86 56 246 34 126
Asia 2 183 1 090 1 092 90 257 3 361 6 593 8 054 4 969 3 774 41 830 6 228 14 811 296 2 215 1 069 5 782 935 3 133West Asia 220 110 110 5 753 320 376 1 376 484 193 1 345 176 1 773 20 206 93 1 029 60 254South, East and South-east Asia 1 963 980 983 84 504 3 041 6 217 6 678 4 485 3 581 40 486 6 051 13 037 276 2 009 976 4 753 875 2 878
East Asia 840 453 387 42 892 1 284 3 881 1 690 1 695 1 918 21 628 3 921 5 477 126 1 026 412 1 842 293 1 174China 476 290 186 19 579 780 1 936 861 989 929 8 367 2 465 2 682 63 499 253 836 139 584Hong Kong, China 53 24 29 3 723 74 376 57 95 154 2 076 182 448 8 63 28 174 20 105Korea, Republic of 179 84 94 10 772 235 843 538 382 489 5 690 916 1 450 34 284 74 541 86 288Taiwan Province of China 130 54 76 8 752 192 720 233 225 342 5 473 348 886 21 178 56 289 48 195
South Asia 127 82 45 4 769 302 503 680 383 191 1 405 150 867 20 102 104 339 48 160Bangladesh 2 1 1 88 6 44 2 3 3 15 2 14 0 2 2 5 0 3India 91 61 30 3 458 246 334 292 283 151 1 100 115 551 15 65 81 179 31 114Iran, Islamic Republic of 27 16 11 973 36 44 377 85 27 237 23 259 3 30 13 142 16 35Pakistan 4 2 2 168 9 71 4 7 5 30 5 27 1 4 6 8 1 5Sri Lanka 2 1 1 65 5 8 4 4 3 17 4 12 0 1 2 4 0 2
ASEAN 996 445 551 36 843 1 455 1 832 4 308 2 406 1 472 17 452 1 980 6 694 130 880 461 2 572 534 1 544Brunei Darussalam 7 4 4 171 15 19 23 12 5 28 6 65 1 8 4 41 1 8Cambodia 6 5 1 59 6 10 1 2 4 9 2 12 0 3 2 4 0 2Indonesia 164 108 55 9 914 427 419 1 936 632 371 4 231 489 1 454 38 181 115 542 98 352Lao People’s Democratic Republic
2 1 1 87 5 5 0 62 2 3 2 7 0 2 2 2 0 1
Malaysia 218 69 149 12 554 350 352 1 543 878 461 6 293 1 002 2 132 38 347 105 811 193 482Myanmar 17 11 6 317 41 22 17 44 9 29 11 113 1 13 10 73 2 10Philippines 46 25 21 2 305 72 112 42 103 105 1 450 82 487 5 62 23 186 57 124Singapore 282 104 178 5 723 250 426 92 293 264 3 035 272 1 253 18 153 82 466 101 286Thailand 195 101 95 4 974 229 422 397 295 229 2 238 94 1 047 27 98 102 398 73 258Viet Nam 59 18 41 739 61 45 255 86 20 135 21 124 2 13 17 50 8 23
Oceania 3 2 2 85 7 8 2 5 6 25 4 14 0 2 2 5 1 2Transition economies 83 53 30 2 576 119 161 230 162 198 869 137 357 17 70 25 122 19 66
Russian Federation 60 42 19 2 020 95 118 194 133 143 683 104 257 13 49 19 90 12 49Domestic value added (DVA) 50 768 15 281 35 487 232 297 25 111 25 935 9 858 18 268 11 189 72 723 8 675 112 794 1 212 23 868 11 826 27 633 11 963 21 348Gross exports 55 852 17 836 38 016 454 317 33 651 40 388 28 204 31 497 22 936 172 969 23 263 151 393 1 973 29 619 14 537 42 167 14 421 29 885Source: AJC-UNCTAD-Eora database on ASEAN GVCs.Note: All values are estimated. The region/country refers to that to which the value added is attributed. For the GVC terminology, see box 2.

PAPER1 A REGIONAL PERSPECTIVE 45
Annex table 2-4. Value added exports of goods and services from ASEAN, by value added creator, and by sector/industry, 2005 (Millions of dollars)
Exports from ASEAN by sector/industry Exports from ASEAN by sector/industry
Primary Manufacturing Services
Value added creator
Total
Agriculture, hunting,
forestry and fi shing
Mining, quarrying
and petroleum Total
Food, beverages
and tobacco
Textiles, clothing
and leather
Coke, petroleum
products and nuclear fuel
Chemicals and chemical
products
Machinery and
equipment
Electrical and electronic
equipment
Motor vehicles and other transport
equipment Total Construction TradeHotels and restaurants
Transport, storage and
communications FinanceBusiness activities
Fore
ign
valu
e ad
ded
(FVA
)
World 5 084 2 555 2 529 222 019 8 540 14 452 18 345 13 229 11 747 100 246 14 588 38 599 761 5 752 2 711 14 534 2 458 8 537Developed countries 2 624 1 310 1 315 121 386 4 669 7 283 8 851 7 582 7 389 54 531 7 924 22 271 421 3 297 1 518 8 167 1 448 5 108
Europe 1 021 534 487 48 760 1 937 3 129 4 362 3 503 3 159 19 372 3 240 7 853 179 1 161 612 2 759 455 1 768European Union (28) 940 489 451 45 017 1 757 2 949 3 984 3 242 2 902 17 970 3 061 7 241 167 1 078 569 2 523 412 1 642
Germany 251 126 125 11 956 428 783 759 826 898 5 019 842 1 909 46 280 127 663 110 455United Kingdom 158 79 78 8 027 255 412 1 275 575 417 3 114 497 1 287 27 182 90 483 74 286France 122 67 55 5 600 249 375 459 444 321 2 237 358 975 20 144 95 342 54 208Italy 86 41 45 4 239 168 342 309 279 354 1 601 255 674 19 104 52 227 37 154Netherlands 80 49 31 3 554 181 257 490 303 179 1 275 185 548 11 73 55 197 30 119Belgium 51 30 21 2 503 106 180 263 203 138 857 170 369 10 61 34 120 20 81Spain 41 22 19 1 914 80 131 89 139 120 787 174 287 9 48 25 88 16 63Sweden 33 16 17 1 454 59 129 57 102 119 529 98 257 7 38 16 91 15 63Austria 21 10 12 1 290 33 66 42 64 85 651 86 174 4 31 11 54 10 42Finland 17 8 9 1 063 31 44 31 66 61 436 177 157 3 33 9 44 10 38Ireland 12 6 6 670 41 32 32 44 29 345 34 125 2 15 12 44 9 28Czech Republic 10 5 5 496 16 33 28 32 31 227 35 73 2 11 5 25 4 17Denmark 15 7 7 565 43 36 50 42 42 198 38 120 2 14 19 41 6 24Poland 10 5 5 448 18 29 29 34 32 174 32 67 2 10 5 23 3 15Hungary 6 3 3 311 9 18 15 23 18 149 24 52 1 8 3 19 4 12
Other developed Europe 81 45 36 3 742 179 179 378 262 257 1 402 179 613 12 83 44 236 44 126Norway 28 19 10 1 164 90 54 283 106 52 313 49 173 4 22 16 72 7 34Switzerland 50 25 25 2 546 83 123 94 154 204 1 080 128 434 7 60 27 162 37 91
North America 708 350 357 27 998 1 146 1 355 3 020 2 110 1 404 12 278 1 387 7 134 88 867 398 2 664 605 1 833Canada 61 36 25 2 869 168 136 522 221 130 911 149 461 9 67 42 190 20 87United States 646 314 332 25 123 975 1 219 2 498 1 889 1 275 11 366 1 238 6 672 79 800 356 2 474 584 1 746
Other developed countries 896 425 471 44 628 1 587 2 799 1 469 1 969 2 825 22 881 3 297 7 284 155 1 268 507 2 745 388 1 507Australia 168 100 68 5 369 448 381 681 308 335 1 687 239 1 092 23 142 169 379 60 197Japan 688 302 386 37 867 981 2 351 749 1 540 2 432 20 605 2 996 5 878 128 1 091 283 2 282 306 1 240New Zealand 22 12 10 728 133 42 19 79 30 213 20 177 2 17 48 38 9 34
Developing countries 2 377 1 192 1 185 98 057 3 752 7 009 9 264 5 485 4 160 44 846 6 527 15 971 323 2 385 1 168 6 244 991 3 363Africa 96 46 50 4 044 151 191 682 241 199 1 675 133 522 14 82 41 211 21 102Latin America and the Caribbean 95 54 41 3 672 233 217 526 270 181 1 316 162 625 13 86 56 246 34 126
Asia 2 183 1 090 1 092 90 257 3 361 6 593 8 054 4 969 3 774 41 830 6 228 14 811 296 2 215 1 069 5 782 935 3 133West Asia 220 110 110 5 753 320 376 1 376 484 193 1 345 176 1 773 20 206 93 1 029 60 254South, East and South-east Asia 1 963 980 983 84 504 3 041 6 217 6 678 4 485 3 581 40 486 6 051 13 037 276 2 009 976 4 753 875 2 878
East Asia 840 453 387 42 892 1 284 3 881 1 690 1 695 1 918 21 628 3 921 5 477 126 1 026 412 1 842 293 1 174China 476 290 186 19 579 780 1 936 861 989 929 8 367 2 465 2 682 63 499 253 836 139 584Hong Kong, China 53 24 29 3 723 74 376 57 95 154 2 076 182 448 8 63 28 174 20 105Korea, Republic of 179 84 94 10 772 235 843 538 382 489 5 690 916 1 450 34 284 74 541 86 288Taiwan Province of China 130 54 76 8 752 192 720 233 225 342 5 473 348 886 21 178 56 289 48 195
South Asia 127 82 45 4 769 302 503 680 383 191 1 405 150 867 20 102 104 339 48 160Bangladesh 2 1 1 88 6 44 2 3 3 15 2 14 0 2 2 5 0 3India 91 61 30 3 458 246 334 292 283 151 1 100 115 551 15 65 81 179 31 114Iran, Islamic Republic of 27 16 11 973 36 44 377 85 27 237 23 259 3 30 13 142 16 35Pakistan 4 2 2 168 9 71 4 7 5 30 5 27 1 4 6 8 1 5Sri Lanka 2 1 1 65 5 8 4 4 3 17 4 12 0 1 2 4 0 2
ASEAN 996 445 551 36 843 1 455 1 832 4 308 2 406 1 472 17 452 1 980 6 694 130 880 461 2 572 534 1 544Brunei Darussalam 7 4 4 171 15 19 23 12 5 28 6 65 1 8 4 41 1 8Cambodia 6 5 1 59 6 10 1 2 4 9 2 12 0 3 2 4 0 2Indonesia 164 108 55 9 914 427 419 1 936 632 371 4 231 489 1 454 38 181 115 542 98 352Lao People’s Democratic Republic
2 1 1 87 5 5 0 62 2 3 2 7 0 2 2 2 0 1
Malaysia 218 69 149 12 554 350 352 1 543 878 461 6 293 1 002 2 132 38 347 105 811 193 482Myanmar 17 11 6 317 41 22 17 44 9 29 11 113 1 13 10 73 2 10Philippines 46 25 21 2 305 72 112 42 103 105 1 450 82 487 5 62 23 186 57 124Singapore 282 104 178 5 723 250 426 92 293 264 3 035 272 1 253 18 153 82 466 101 286Thailand 195 101 95 4 974 229 422 397 295 229 2 238 94 1 047 27 98 102 398 73 258Viet Nam 59 18 41 739 61 45 255 86 20 135 21 124 2 13 17 50 8 23
Oceania 3 2 2 85 7 8 2 5 6 25 4 14 0 2 2 5 1 2Transition economies 83 53 30 2 576 119 161 230 162 198 869 137 357 17 70 25 122 19 66
Russian Federation 60 42 19 2 020 95 118 194 133 143 683 104 257 13 49 19 90 12 49Domestic value added (DVA) 50 768 15 281 35 487 232 297 25 111 25 935 9 858 18 268 11 189 72 723 8 675 112 794 1 212 23 868 11 826 27 633 11 963 21 348Gross exports 55 852 17 836 38 016 454 317 33 651 40 388 28 204 31 497 22 936 172 969 23 263 151 393 1 973 29 619 14 537 42 167 14 421 29 885Source: AJC-UNCTAD-Eora database on ASEAN GVCs.Note: All values are estimated. The region/country refers to that to which the value added is attributed. For the GVC terminology, see box 2.

GLOBAL VALUE CHAINS IN ASE AN – SEPTEMBER 201746
Annex table 2-5. Value added exports of goods and services from ASEAN, by value added creator, and by sector/industry, 2010 (Millions of dollars)
Exports from ASEAN by sector/industry Exports from ASEAN by sector/industry
Primary Manufacturing Services
Value added creator
Total
Agriculture, hunting,
forestry and fi shing
Mining, quarrying
and petroleum Total
Food, beverages
and tobacco
Textiles, clothing
and leather
Coke, petroleum
products and nuclear fuel
Chemicals and chemical
products
Machinery and
equipment
Electrical and electronic
equipment
Motor vehicles and other transport
equipment Total Construction TradeHotels and restaurants
Transport, storage and
communications FinanceBusiness activities
Fore
ign
valu
e ad
ded
(FVA
)
World 7 773 4 012 3 761 355 295 14 251 20 356 37 664 23 241 21 527 149 039 21 769 67 130 1 737 9 459 4 318 25 242 4 297 15 190Developed countries 3 662 1 866 1 796 174 121 7 256 9 611 17 138 11 977 12 032 72 042 9 949 35 006 847 4 875 2 257 12 900 2 330 8 066
Europe 1 370 726 644 70 993 2 842 3 973 6 878 5 419 5 360 27 503 4 277 12 362 351 1 742 869 4 299 722 2 883European Union (28) 1 237 650 587 64 196 2 532 3 685 6 113 4 920 4 829 25 024 3 969 11 166 323 1 586 794 3 844 634 2 627
Germany 353 181 173 18 338 654 1 086 1 186 1 342 1 578 7 562 1 228 3 173 95 448 188 1 078 183 790United Kingdom 195 96 99 10 526 338 450 1 912 820 643 3 950 504 1 866 48 243 123 685 113 437France 152 86 66 7 652 352 468 604 630 517 2 987 485 1 412 37 205 130 493 74 301Italy 112 54 58 5 917 240 435 494 423 567 2 102 349 1 034 37 153 72 349 55 240Netherlands 102 62 40 5 149 268 267 815 463 304 1 810 253 830 21 107 75 299 44 184Belgium 67 40 27 3 473 148 212 400 308 228 1 163 187 544 18 86 44 177 28 122Spain 49 27 23 2 473 107 151 133 203 186 998 162 410 16 62 33 125 24 96Sweden 44 22 22 2 117 85 161 95 161 195 755 137 396 13 56 23 136 23 101Austria 28 13 14 1 853 48 87 66 95 139 919 116 269 8 45 15 83 15 68Finland 22 11 11 1 536 45 59 50 99 101 627 235 240 6 49 12 67 14 60Ireland 16 8 8 902 57 38 49 63 46 458 42 186 3 22 15 67 13 43Czech Republic 15 8 7 839 27 49 50 57 62 377 56 133 4 19 8 45 7 32Denmark 19 9 10 817 61 45 80 62 69 283 50 180 4 21 25 60 9 39Poland 14 8 6 684 28 40 48 50 57 260 47 107 3 16 8 35 5 25Hungary 8 4 4 407 14 23 24 31 30 176 29 83 2 12 5 31 6 19
Other developed Europe 133 76 57 6 796 310 288 765 499 530 2 479 309 1 196 28 156 75 455 88 256Norway 44 30 14 2 008 146 78 566 187 98 500 78 303 10 37 26 124 12 62Switzerland 86 45 42 4 742 156 206 197 309 429 1 967 228 883 18 117 48 329 75 192
North America 998 502 496 41 871 1 784 1 751 7 170 3 440 2 328 15 829 1 769 11 342 184 1 343 589 4 319 1 003 2 808Canada 91 55 36 4 852 265 184 1 291 383 223 1 297 213 807 19 107 65 350 33 152United States 906 447 460 37 012 1 516 1 566 5 879 3 056 2 104 14 530 1 556 10 534 165 1 236 524 3 969 970 2 656
Other developed countries 1 294 638 656 61 258 2 630 3 887 3 090 3 119 4 344 28 711 3 903 11 302 312 1 790 799 4 282 605 2 375Australia 302 179 123 10 605 881 641 1 464 642 727 3 300 455 2 237 62 277 320 769 125 427Japan 926 421 505 48 284 1 474 3 149 1 546 2 291 3 500 24 418 3 351 8 497 242 1 451 389 3 356 441 1 815New Zealand 35 19 16 1 239 233 61 39 109 61 362 34 319 4 30 78 72 17 65
Developing countries 3 960 2 045 1 915 176 318 6 768 10 475 19 992 10 923 9 091 75 446 11 565 31 419 854 4 456 2 015 12 099 1 929 6 988Africa 142 72 70 6 437 245 277 1 429 431 365 2 224 207 949 33 137 68 391 38 189Latin America and the Caribbean 172 97 74 7 740 434 356 1 950 594 387 2 238 285 1 365 38 173 102 582 67 268
Asia 3 640 1 872 1 769 161 996 6 076 9 828 16 608 9 888 8 329 70 943 11 067 29 080 782 4 142 1 842 11 118 1 823 6 526West Asia 323 160 163 9 837 482 526 2 773 870 381 2 179 271 3 082 48 345 137 1 769 105 479South, East and South-east Asia 3 318 1 712 1 606 152 159 5 594 9 302 13 835 9 018 7 948 68 764 10 796 25 998 734 3 797 1 705 9 349 1 718 6 047
East Asia 1 433 802 631 72 671 2 293 5 654 2 969 3 334 4 178 33 820 7 311 10 644 369 1 909 702 3 456 558 2 402China 984 604 380 44 002 1 624 3 596 1 998 2 347 2 507 18 953 5 562 6 612 204 1 196 500 2 081 331 1 501Hong Kong, China 64 29 35 4 799 93 387 86 140 233 2 728 237 649 14 86 34 258 27 155Korea, Republic of 257 115 142 15 048 376 1 017 624 587 1 032 6 740 1 162 2 407 123 452 111 799 148 518Taiwan Province of China 125 52 73 8 717 197 644 258 254 400 5 361 335 957 28 169 55 313 51 224
South Asia 243 157 87 10 388 634 850 1 713 897 485 2 993 308 1 952 57 222 201 763 108 382Bangladesh 3 2 1 141 11 53 5 8 7 29 4 29 0 4 3 11 1 6India 184 122 62 7 852 530 600 865 693 398 2 416 244 1 308 46 149 162 432 73 284Iran, Islamic Republic of 45 26 19 1 974 66 71 825 174 61 456 45 533 9 58 23 294 31 76Pakistan 6 4 3 289 16 111 8 13 11 57 9 53 1 7 10 16 2 10Sri Lanka 3 2 1 105 8 11 7 8 6 27 5 21 0 2 3 8 1 4
ASEAN 1 642 754 888 69 099 2 666 2 798 9 153 4 787 3 285 31 951 3 177 13 402 308 1 667 803 5 129 1 052 3 263Brunei Darussalam 11 5 6 286 22 26 45 21 10 44 9 114 1 13 5 73 2 14Cambodia 9 8 1 87 8 14 1 4 7 14 2 22 0 4 2 9 1 4Indonesia 315 207 108 21 181 892 709 4 779 1 462 927 8 585 772 3 336 97 387 228 1 250 221 850Lao People’s Democratic Republic
4 3 2 170 10 8 1 122 4 7 3 15 1 3 3 4 1 1
Malaysia 350 111 239 22 894 598 542 3 080 1 672 1 050 11 153 1 614 4 330 90 665 197 1 622 380 1 042Myanmar 35 22 12 696 86 42 46 91 19 63 21 265 3 30 22 173 4 22Philippines 87 47 40 5 642 146 210 99 236 307 3 646 169 1 116 14 140 45 419 126 299Singapore 504 185 318 9 680 489 689 170 596 523 4 856 416 2 330 45 256 138 864 187 556Thailand 278 152 126 7 759 371 523 670 497 414 3 459 151 1 756 54 155 149 666 124 452Viet Nam 47 13 35 705 44 36 262 87 22 125 19 118 2 13 12 51 7 21
Oceania 5 3 2 145 13 14 5 10 10 41 6 25 1 4 3 8 1 4Transition economies 152 101 50 4 856 227 270 533 340 403 1 550 254 705 36 129 46 242 38 137
Russian Federation 115 82 32 3 878 185 203 453 282 304 1 234 200 519 27 95 35 179 25 103Domestic value added (DVA) 85 405 25 376 60 029 406 813 41 199 39 977 20 110 35 291 21 621 133 093 13 435 201 550 2 854 40 467 19 370 49 692 21 229 39 235Gross exports 93 178 29 388 63 790 762 109 55 450 60 333 57 774 58 532 43 147 282 132 35 203 268 680 4 590 49 926 23 688 74 933 25 526 54 425Source: AJC-UNCTAD-Eora database on ASEAN GVCs.Note: All values are estimated. The region/country refers to that to which the value added is attributed. For the GVC terminology, see box 2.

PAPER1 A REGIONAL PERSPECTIVE 47
Annex table 2-5. Value added exports of goods and services from ASEAN, by value added creator, and by sector/industry, 2010 (Millions of dollars)
Exports from ASEAN by sector/industry Exports from ASEAN by sector/industry
Primary Manufacturing Services
Value added creator
Total
Agriculture, hunting,
forestry and fi shing
Mining, quarrying
and petroleum Total
Food, beverages
and tobacco
Textiles, clothing
and leather
Coke, petroleum
products and nuclear fuel
Chemicals and chemical
products
Machinery and
equipment
Electrical and electronic
equipment
Motor vehicles and other transport
equipment Total Construction TradeHotels and restaurants
Transport, storage and
communications FinanceBusiness activities
Fore
ign
valu
e ad
ded
(FVA
)
World 7 773 4 012 3 761 355 295 14 251 20 356 37 664 23 241 21 527 149 039 21 769 67 130 1 737 9 459 4 318 25 242 4 297 15 190Developed countries 3 662 1 866 1 796 174 121 7 256 9 611 17 138 11 977 12 032 72 042 9 949 35 006 847 4 875 2 257 12 900 2 330 8 066
Europe 1 370 726 644 70 993 2 842 3 973 6 878 5 419 5 360 27 503 4 277 12 362 351 1 742 869 4 299 722 2 883European Union (28) 1 237 650 587 64 196 2 532 3 685 6 113 4 920 4 829 25 024 3 969 11 166 323 1 586 794 3 844 634 2 627
Germany 353 181 173 18 338 654 1 086 1 186 1 342 1 578 7 562 1 228 3 173 95 448 188 1 078 183 790United Kingdom 195 96 99 10 526 338 450 1 912 820 643 3 950 504 1 866 48 243 123 685 113 437France 152 86 66 7 652 352 468 604 630 517 2 987 485 1 412 37 205 130 493 74 301Italy 112 54 58 5 917 240 435 494 423 567 2 102 349 1 034 37 153 72 349 55 240Netherlands 102 62 40 5 149 268 267 815 463 304 1 810 253 830 21 107 75 299 44 184Belgium 67 40 27 3 473 148 212 400 308 228 1 163 187 544 18 86 44 177 28 122Spain 49 27 23 2 473 107 151 133 203 186 998 162 410 16 62 33 125 24 96Sweden 44 22 22 2 117 85 161 95 161 195 755 137 396 13 56 23 136 23 101Austria 28 13 14 1 853 48 87 66 95 139 919 116 269 8 45 15 83 15 68Finland 22 11 11 1 536 45 59 50 99 101 627 235 240 6 49 12 67 14 60Ireland 16 8 8 902 57 38 49 63 46 458 42 186 3 22 15 67 13 43Czech Republic 15 8 7 839 27 49 50 57 62 377 56 133 4 19 8 45 7 32Denmark 19 9 10 817 61 45 80 62 69 283 50 180 4 21 25 60 9 39Poland 14 8 6 684 28 40 48 50 57 260 47 107 3 16 8 35 5 25Hungary 8 4 4 407 14 23 24 31 30 176 29 83 2 12 5 31 6 19
Other developed Europe 133 76 57 6 796 310 288 765 499 530 2 479 309 1 196 28 156 75 455 88 256Norway 44 30 14 2 008 146 78 566 187 98 500 78 303 10 37 26 124 12 62Switzerland 86 45 42 4 742 156 206 197 309 429 1 967 228 883 18 117 48 329 75 192
North America 998 502 496 41 871 1 784 1 751 7 170 3 440 2 328 15 829 1 769 11 342 184 1 343 589 4 319 1 003 2 808Canada 91 55 36 4 852 265 184 1 291 383 223 1 297 213 807 19 107 65 350 33 152United States 906 447 460 37 012 1 516 1 566 5 879 3 056 2 104 14 530 1 556 10 534 165 1 236 524 3 969 970 2 656
Other developed countries 1 294 638 656 61 258 2 630 3 887 3 090 3 119 4 344 28 711 3 903 11 302 312 1 790 799 4 282 605 2 375Australia 302 179 123 10 605 881 641 1 464 642 727 3 300 455 2 237 62 277 320 769 125 427Japan 926 421 505 48 284 1 474 3 149 1 546 2 291 3 500 24 418 3 351 8 497 242 1 451 389 3 356 441 1 815New Zealand 35 19 16 1 239 233 61 39 109 61 362 34 319 4 30 78 72 17 65
Developing countries 3 960 2 045 1 915 176 318 6 768 10 475 19 992 10 923 9 091 75 446 11 565 31 419 854 4 456 2 015 12 099 1 929 6 988Africa 142 72 70 6 437 245 277 1 429 431 365 2 224 207 949 33 137 68 391 38 189Latin America and the Caribbean 172 97 74 7 740 434 356 1 950 594 387 2 238 285 1 365 38 173 102 582 67 268
Asia 3 640 1 872 1 769 161 996 6 076 9 828 16 608 9 888 8 329 70 943 11 067 29 080 782 4 142 1 842 11 118 1 823 6 526West Asia 323 160 163 9 837 482 526 2 773 870 381 2 179 271 3 082 48 345 137 1 769 105 479South, East and South-east Asia 3 318 1 712 1 606 152 159 5 594 9 302 13 835 9 018 7 948 68 764 10 796 25 998 734 3 797 1 705 9 349 1 718 6 047
East Asia 1 433 802 631 72 671 2 293 5 654 2 969 3 334 4 178 33 820 7 311 10 644 369 1 909 702 3 456 558 2 402China 984 604 380 44 002 1 624 3 596 1 998 2 347 2 507 18 953 5 562 6 612 204 1 196 500 2 081 331 1 501Hong Kong, China 64 29 35 4 799 93 387 86 140 233 2 728 237 649 14 86 34 258 27 155Korea, Republic of 257 115 142 15 048 376 1 017 624 587 1 032 6 740 1 162 2 407 123 452 111 799 148 518Taiwan Province of China 125 52 73 8 717 197 644 258 254 400 5 361 335 957 28 169 55 313 51 224
South Asia 243 157 87 10 388 634 850 1 713 897 485 2 993 308 1 952 57 222 201 763 108 382Bangladesh 3 2 1 141 11 53 5 8 7 29 4 29 0 4 3 11 1 6India 184 122 62 7 852 530 600 865 693 398 2 416 244 1 308 46 149 162 432 73 284Iran, Islamic Republic of 45 26 19 1 974 66 71 825 174 61 456 45 533 9 58 23 294 31 76Pakistan 6 4 3 289 16 111 8 13 11 57 9 53 1 7 10 16 2 10Sri Lanka 3 2 1 105 8 11 7 8 6 27 5 21 0 2 3 8 1 4
ASEAN 1 642 754 888 69 099 2 666 2 798 9 153 4 787 3 285 31 951 3 177 13 402 308 1 667 803 5 129 1 052 3 263Brunei Darussalam 11 5 6 286 22 26 45 21 10 44 9 114 1 13 5 73 2 14Cambodia 9 8 1 87 8 14 1 4 7 14 2 22 0 4 2 9 1 4Indonesia 315 207 108 21 181 892 709 4 779 1 462 927 8 585 772 3 336 97 387 228 1 250 221 850Lao People’s Democratic Republic
4 3 2 170 10 8 1 122 4 7 3 15 1 3 3 4 1 1
Malaysia 350 111 239 22 894 598 542 3 080 1 672 1 050 11 153 1 614 4 330 90 665 197 1 622 380 1 042Myanmar 35 22 12 696 86 42 46 91 19 63 21 265 3 30 22 173 4 22Philippines 87 47 40 5 642 146 210 99 236 307 3 646 169 1 116 14 140 45 419 126 299Singapore 504 185 318 9 680 489 689 170 596 523 4 856 416 2 330 45 256 138 864 187 556Thailand 278 152 126 7 759 371 523 670 497 414 3 459 151 1 756 54 155 149 666 124 452Viet Nam 47 13 35 705 44 36 262 87 22 125 19 118 2 13 12 51 7 21
Oceania 5 3 2 145 13 14 5 10 10 41 6 25 1 4 3 8 1 4Transition economies 152 101 50 4 856 227 270 533 340 403 1 550 254 705 36 129 46 242 38 137
Russian Federation 115 82 32 3 878 185 203 453 282 304 1 234 200 519 27 95 35 179 25 103Domestic value added (DVA) 85 405 25 376 60 029 406 813 41 199 39 977 20 110 35 291 21 621 133 093 13 435 201 550 2 854 40 467 19 370 49 692 21 229 39 235Gross exports 93 178 29 388 63 790 762 109 55 450 60 333 57 774 58 532 43 147 282 132 35 203 268 680 4 590 49 926 23 688 74 933 25 526 54 425Source: AJC-UNCTAD-Eora database on ASEAN GVCs.Note: All values are estimated. The region/country refers to that to which the value added is attributed. For the GVC terminology, see box 2.

GLOBAL VALUE CHAINS IN ASE AN – SEPTEMBER 201748
Annex table 2-6. Value added exports of goods and services from ASEAN, by value added creator, and by sector/industry, 2013 (Millions of dollars)
Exports from ASEAN by sector/industry Exports from ASEAN by sector/industry
Primary Manufacturing Services
Value added creator
Total
Agriculture, hunting,
forestry and fi shing
Mining, quarrying
and petroleum Total
Food, beverages
and tobacco
Textiles, clothing
and leather
Coke, petroleum
products and nuclear fuel
Chemicals and chemical
products
Machinery and
equipment
Electrical and electronic
equipment
Motor vehicles and other transport
equipment Total Construction TradeHotels and restaurants
Transport, storage and
communications FinanceBusiness activities
Fore
ign
valu
e ad
ded
(FVA
)
World 9 365 4 877 4 488 440 164 17 621 24 742 47 869 29 005 27 033 183 739 27 386 82 505 2 254 11 889 5 167 31 052 5 204 18 288Developed countries 4 182 2 161 2 021 206 628 8 649 11 227 21 032 14 409 14 525 84 787 11 811 41 312 1 051 5 869 2 613 15 169 2 739 9 356
Europe 1 647 881 766 88 802 3 516 4 930 8 687 6 790 6 813 34 417 5 399 15 339 460 2 219 1 047 5 326 887 3 501European Union (28) 1 491 791 700 80 529 3 149 4 583 7 782 6 184 6 150 31 362 5 020 13 887 424 2 025 960 4 775 779 3 195
Germany 427 221 206 23 094 816 1 362 1 526 1 694 2 017 9 516 1 556 3 957 125 574 228 1 343 226 964United Kingdom 229 113 116 12 875 407 539 2 386 1 003 795 4 815 621 2 266 61 303 145 831 135 519France 183 105 78 9 618 440 578 765 793 659 3 766 617 1 758 48 262 159 613 91 366Italy 136 67 69 7 494 301 540 654 539 723 2 656 446 1 301 48 198 88 439 69 295Netherlands 121 74 46 6 362 327 325 1 020 571 381 2 234 316 1 017 28 135 88 367 53 221Belgium 82 50 33 4 418 187 265 524 393 294 1 476 240 686 24 112 54 224 35 150Spain 61 33 28 3 184 136 191 175 261 244 1 291 210 523 22 80 40 159 31 120Sweden 54 27 27 2 704 108 207 122 206 253 959 176 499 18 73 28 171 29 124Austria 34 16 17 2 363 60 110 85 122 180 1 174 149 339 10 58 18 105 19 84Finland 25 13 12 1 878 54 71 62 122 126 764 291 291 7 61 15 81 17 71Ireland 18 9 9 1 094 69 45 59 77 56 554 51 224 4 27 18 80 16 51Czech Republic 18 9 9 1 029 33 60 63 70 77 463 70 162 5 24 9 55 8 38Denmark 23 11 12 1 018 77 55 101 78 87 351 63 222 5 27 29 74 12 48Poland 18 10 8 880 36 51 63 64 74 334 61 137 4 21 10 45 7 31Hungary 10 5 5 513 18 29 31 40 38 221 36 106 2 15 6 40 8 23
Other developed Europe 156 89 67 8 273 367 347 905 606 664 3 055 378 1 452 35 193 87 551 108 306Norway 48 33 15 2 246 162 86 649 210 111 549 87 335 11 42 28 137 13 67Switzerland 104 55 49 5 967 193 256 253 393 549 2 490 288 1 105 24 150 57 410 94 237
North America 1 157 588 568 50 752 2 144 2 079 8 829 4 175 2 872 19 133 2 167 13 578 233 1 659 683 5 166 1 189 3 314Canada 109 66 43 6 050 327 224 1 645 478 282 1 599 265 993 25 135 77 433 40 182United States 1 047 522 525 44 693 1 812 1 854 7 183 3 696 2 590 17 533 1 901 12 583 208 1 524 605 4 733 1 149 3 132
Other developed countries 1 379 692 687 67 075 2 989 4 219 3 516 3 444 4 840 31 237 4 246 12 396 358 1 991 883 4 677 663 2 542Australia 365 217 148 13 292 1 094 799 1 857 807 928 4 121 579 2 760 81 354 382 954 153 515Japan 933 427 506 50 793 1 552 3 300 1 555 2 402 3 760 25 862 3 542 8 938 266 1 559 394 3 531 463 1 867New Zealand 43 23 19 1 553 290 76 51 138 78 449 44 389 6 38 93 89 21 78
Developing countries 4 973 2 574 2 398 226 600 8 650 13 138 26 039 14 107 11 930 96 741 15 207 40 199 1 151 5 836 2 491 15 540 2 414 8 744Africa 168 84 83 7 740 297 304 1 758 518 448 2 670 251 1 130 41 168 79 466 44 219Latin America and the Caribbean 203 116 88 9 496 530 439 2 328 723 490 2 786 361 1 654 50 217 121 696 81 320
Asia 4 594 2 370 2 224 209 165 7 805 12 376 21 946 12 851 10 977 91 229 14 587 37 382 1 059 5 446 2 287 14 366 2 287 8 199West Asia 442 214 228 13 708 653 702 3 975 1 224 532 2 994 378 4 280 69 490 180 2 471 141 650South, East and South-east Asia 4 152 2 156 1 996 195 457 7 152 11 674 17 971 11 627 10 446 88 235 14 209 33 102 990 4 956 2 107 11 895 2 146 7 549
East Asia 1 804 1 027 777 93 423 2 956 7 100 3 900 4 369 5 495 43 198 9 778 13 628 497 2 510 873 4 394 698 3 012China 1 295 801 494 59 766 2 178 4 778 2 752 3 196 3 473 25 807 7 636 8 895 290 1 652 646 2 786 437 1 978Hong Kong, China 71 33 38 5 570 107 433 101 164 273 3 183 283 745 17 103 37 297 29 174Korea, Republic of 308 139 169 18 908 464 1 245 777 735 1 314 8 553 1 494 2 980 160 574 132 985 180 627Taiwan Province of China 126 53 73 9 037 203 630 265 267 425 5 602 346 982 30 175 55 318 52 228
South Asia 309 198 111 13 629 822 1 078 2 380 1 181 645 3 904 406 2 565 78 299 249 1 018 141 488Bangladesh 4 3 2 195 16 73 8 11 10 40 5 41 1 5 5 16 1 9India 228 151 78 10 051 677 752 1 149 891 520 3 093 316 1 664 62 196 197 551 92 352Iran, Islamic Republic of 62 36 26 2 841 93 99 1 201 249 90 652 65 755 13 85 31 416 44 107Pakistan 8 5 3 362 21 135 11 17 15 72 11 67 2 9 12 21 2 12Sri Lanka 4 3 1 144 11 15 10 11 8 36 7 29 1 3 4 11 1 6
ASEAN 2 040 931 1 109 88 405 3 375 3 496 11 691 6 076 4 306 41 133 4 025 16 910 414 2 147 985 6 484 1 306 4 050Brunei Darussalam 14 7 7 366 27 32 59 27 13 57 12 147 2 17 7 94 3 18Cambodia 11 10 2 112 11 18 1 6 10 19 3 29 1 6 3 11 1 5Indonesia 379 249 130 26 969 1 119 858 6 177 1 850 1 199 10 967 984 4 192 130 498 278 1 568 277 1 052Lao People’s Democratic Republic
6 4 2 230 14 10 1 165 6 10 5 20 1 5 4 5 1 2
Malaysia 426 134 292 28 440 727 654 3 803 2 050 1 347 13 950 1 987 5 312 116 829 236 1 985 460 1 265Myanmar 49 31 18 987 120 59 66 129 28 89 30 379 4 43 30 248 5 31Philippines 109 60 49 7 634 188 278 129 306 429 4 980 228 1 443 19 188 55 540 162 383Singapore 636 232 404 12 336 625 869 209 762 673 6 196 550 2 923 62 333 170 1 089 226 677Thailand 354 190 164 10 471 492 674 922 673 575 4 716 204 2 325 76 211 189 882 162 593Viet Nam 57 15 42 859 53 43 325 108 27 148 23 141 3 17 13 61 9 25
Oceania 7 4 3 199 19 19 7 14 14 56 9 34 1 5 4 11 1 6Transition economies 210 142 68 6 935 322 376 798 489 578 2 211 368 993 52 184 63 343 52 188
Russian Federation 162 117 45 5 659 267 291 686 413 448 1 800 296 752 40 140 49 261 35 145Domestic value added (DVA) 106 195 32 819 73 376 520 503 53 302 50 169 25 387 45 817 28 438 169 398 17 986 259 545 3 928 53 275 24 611 63 544 26 760 49 808Gross exports 115 560 37 696 77 864 960 667 70 924 74 910 73 255 74 823 55 471 353 137 45 372 342 050 6 182 65 165 29 777 94 595 31 965 68 096Source: AJC-UNCTAD-Eora database on ASEAN GVCs.Note: All values are estimated. The region/country refers to that to which the value added is attributed. For the GVC terminology, see box 2.

PAPER1 A REGIONAL PERSPECTIVE 49
Annex table 2-6. Value added exports of goods and services from ASEAN, by value added creator, and by sector/industry, 2013 (Millions of dollars)
Exports from ASEAN by sector/industry Exports from ASEAN by sector/industry
Primary Manufacturing Services
Value added creator
Total
Agriculture, hunting,
forestry and fi shing
Mining, quarrying
and petroleum Total
Food, beverages
and tobacco
Textiles, clothing
and leather
Coke, petroleum
products and nuclear fuel
Chemicals and chemical
products
Machinery and
equipment
Electrical and electronic
equipment
Motor vehicles and other transport
equipment Total Construction TradeHotels and restaurants
Transport, storage and
communications FinanceBusiness activities
Fore
ign
valu
e ad
ded
(FVA
)
World 9 365 4 877 4 488 440 164 17 621 24 742 47 869 29 005 27 033 183 739 27 386 82 505 2 254 11 889 5 167 31 052 5 204 18 288Developed countries 4 182 2 161 2 021 206 628 8 649 11 227 21 032 14 409 14 525 84 787 11 811 41 312 1 051 5 869 2 613 15 169 2 739 9 356
Europe 1 647 881 766 88 802 3 516 4 930 8 687 6 790 6 813 34 417 5 399 15 339 460 2 219 1 047 5 326 887 3 501European Union (28) 1 491 791 700 80 529 3 149 4 583 7 782 6 184 6 150 31 362 5 020 13 887 424 2 025 960 4 775 779 3 195
Germany 427 221 206 23 094 816 1 362 1 526 1 694 2 017 9 516 1 556 3 957 125 574 228 1 343 226 964United Kingdom 229 113 116 12 875 407 539 2 386 1 003 795 4 815 621 2 266 61 303 145 831 135 519France 183 105 78 9 618 440 578 765 793 659 3 766 617 1 758 48 262 159 613 91 366Italy 136 67 69 7 494 301 540 654 539 723 2 656 446 1 301 48 198 88 439 69 295Netherlands 121 74 46 6 362 327 325 1 020 571 381 2 234 316 1 017 28 135 88 367 53 221Belgium 82 50 33 4 418 187 265 524 393 294 1 476 240 686 24 112 54 224 35 150Spain 61 33 28 3 184 136 191 175 261 244 1 291 210 523 22 80 40 159 31 120Sweden 54 27 27 2 704 108 207 122 206 253 959 176 499 18 73 28 171 29 124Austria 34 16 17 2 363 60 110 85 122 180 1 174 149 339 10 58 18 105 19 84Finland 25 13 12 1 878 54 71 62 122 126 764 291 291 7 61 15 81 17 71Ireland 18 9 9 1 094 69 45 59 77 56 554 51 224 4 27 18 80 16 51Czech Republic 18 9 9 1 029 33 60 63 70 77 463 70 162 5 24 9 55 8 38Denmark 23 11 12 1 018 77 55 101 78 87 351 63 222 5 27 29 74 12 48Poland 18 10 8 880 36 51 63 64 74 334 61 137 4 21 10 45 7 31Hungary 10 5 5 513 18 29 31 40 38 221 36 106 2 15 6 40 8 23
Other developed Europe 156 89 67 8 273 367 347 905 606 664 3 055 378 1 452 35 193 87 551 108 306Norway 48 33 15 2 246 162 86 649 210 111 549 87 335 11 42 28 137 13 67Switzerland 104 55 49 5 967 193 256 253 393 549 2 490 288 1 105 24 150 57 410 94 237
North America 1 157 588 568 50 752 2 144 2 079 8 829 4 175 2 872 19 133 2 167 13 578 233 1 659 683 5 166 1 189 3 314Canada 109 66 43 6 050 327 224 1 645 478 282 1 599 265 993 25 135 77 433 40 182United States 1 047 522 525 44 693 1 812 1 854 7 183 3 696 2 590 17 533 1 901 12 583 208 1 524 605 4 733 1 149 3 132
Other developed countries 1 379 692 687 67 075 2 989 4 219 3 516 3 444 4 840 31 237 4 246 12 396 358 1 991 883 4 677 663 2 542Australia 365 217 148 13 292 1 094 799 1 857 807 928 4 121 579 2 760 81 354 382 954 153 515Japan 933 427 506 50 793 1 552 3 300 1 555 2 402 3 760 25 862 3 542 8 938 266 1 559 394 3 531 463 1 867New Zealand 43 23 19 1 553 290 76 51 138 78 449 44 389 6 38 93 89 21 78
Developing countries 4 973 2 574 2 398 226 600 8 650 13 138 26 039 14 107 11 930 96 741 15 207 40 199 1 151 5 836 2 491 15 540 2 414 8 744Africa 168 84 83 7 740 297 304 1 758 518 448 2 670 251 1 130 41 168 79 466 44 219Latin America and the Caribbean 203 116 88 9 496 530 439 2 328 723 490 2 786 361 1 654 50 217 121 696 81 320
Asia 4 594 2 370 2 224 209 165 7 805 12 376 21 946 12 851 10 977 91 229 14 587 37 382 1 059 5 446 2 287 14 366 2 287 8 199West Asia 442 214 228 13 708 653 702 3 975 1 224 532 2 994 378 4 280 69 490 180 2 471 141 650South, East and South-east Asia 4 152 2 156 1 996 195 457 7 152 11 674 17 971 11 627 10 446 88 235 14 209 33 102 990 4 956 2 107 11 895 2 146 7 549
East Asia 1 804 1 027 777 93 423 2 956 7 100 3 900 4 369 5 495 43 198 9 778 13 628 497 2 510 873 4 394 698 3 012China 1 295 801 494 59 766 2 178 4 778 2 752 3 196 3 473 25 807 7 636 8 895 290 1 652 646 2 786 437 1 978Hong Kong, China 71 33 38 5 570 107 433 101 164 273 3 183 283 745 17 103 37 297 29 174Korea, Republic of 308 139 169 18 908 464 1 245 777 735 1 314 8 553 1 494 2 980 160 574 132 985 180 627Taiwan Province of China 126 53 73 9 037 203 630 265 267 425 5 602 346 982 30 175 55 318 52 228
South Asia 309 198 111 13 629 822 1 078 2 380 1 181 645 3 904 406 2 565 78 299 249 1 018 141 488Bangladesh 4 3 2 195 16 73 8 11 10 40 5 41 1 5 5 16 1 9India 228 151 78 10 051 677 752 1 149 891 520 3 093 316 1 664 62 196 197 551 92 352Iran, Islamic Republic of 62 36 26 2 841 93 99 1 201 249 90 652 65 755 13 85 31 416 44 107Pakistan 8 5 3 362 21 135 11 17 15 72 11 67 2 9 12 21 2 12Sri Lanka 4 3 1 144 11 15 10 11 8 36 7 29 1 3 4 11 1 6
ASEAN 2 040 931 1 109 88 405 3 375 3 496 11 691 6 076 4 306 41 133 4 025 16 910 414 2 147 985 6 484 1 306 4 050Brunei Darussalam 14 7 7 366 27 32 59 27 13 57 12 147 2 17 7 94 3 18Cambodia 11 10 2 112 11 18 1 6 10 19 3 29 1 6 3 11 1 5Indonesia 379 249 130 26 969 1 119 858 6 177 1 850 1 199 10 967 984 4 192 130 498 278 1 568 277 1 052Lao People’s Democratic Republic
6 4 2 230 14 10 1 165 6 10 5 20 1 5 4 5 1 2
Malaysia 426 134 292 28 440 727 654 3 803 2 050 1 347 13 950 1 987 5 312 116 829 236 1 985 460 1 265Myanmar 49 31 18 987 120 59 66 129 28 89 30 379 4 43 30 248 5 31Philippines 109 60 49 7 634 188 278 129 306 429 4 980 228 1 443 19 188 55 540 162 383Singapore 636 232 404 12 336 625 869 209 762 673 6 196 550 2 923 62 333 170 1 089 226 677Thailand 354 190 164 10 471 492 674 922 673 575 4 716 204 2 325 76 211 189 882 162 593Viet Nam 57 15 42 859 53 43 325 108 27 148 23 141 3 17 13 61 9 25
Oceania 7 4 3 199 19 19 7 14 14 56 9 34 1 5 4 11 1 6Transition economies 210 142 68 6 935 322 376 798 489 578 2 211 368 993 52 184 63 343 52 188
Russian Federation 162 117 45 5 659 267 291 686 413 448 1 800 296 752 40 140 49 261 35 145Domestic value added (DVA) 106 195 32 819 73 376 520 503 53 302 50 169 25 387 45 817 28 438 169 398 17 986 259 545 3 928 53 275 24 611 63 544 26 760 49 808Gross exports 115 560 37 696 77 864 960 667 70 924 74 910 73 255 74 823 55 471 353 137 45 372 342 050 6 182 65 165 29 777 94 595 31 965 68 096Source: AJC-UNCTAD-Eora database on ASEAN GVCs.Note: All values are estimated. The region/country refers to that to which the value added is attributed. For the GVC terminology, see box 2.

GLOBAL VALUE CHAINS IN ASE AN – SEPTEMBER 201750
Annex table 3. ASEAN’s value added exports incorporated in other countries’ exports, by region/country, 1990-2013 (Millions of dollars)
DVX from ASEANRegion/country 1990 1995 2000 2005 2010 2013
World 23 783 52 595 80 495 160 547 295 786 378 666Developed countries 12 004 24 806 37 519 73 521 125 437 159 386
Europe 7 796 16 506 24 938 49 870 86 782 107 488European Union (28) 7 620 16 118 24 387 48 665 84 555 104 746
Germany 1 823 3 532 5 572 11 974 21 562 27 106Netherlands 1 402 2 917 4 096 8 042 13 886 16 979United Kingdom 823 1 849 2 829 5 248 8 859 10 789Belgium 848 1 624 2 117 4 112 6 935 8 377France 755 1 527 2 450 4 182 6 621 8 100Ireland 351 1 029 1 742 3 662 6 528 8 062Italy 492 1 089 1 495 2 902 5 006 6 097Spain 230 584 836 1 741 2 833 3 534Hungary 38 175 481 1 111 2 154 2 744Austria 145 271 432 970 1 672 2 111Denmark 180 365 564 991 1 634 2 067Sweden 180 344 479 877 1 513 1 873Czech Republic 49 117 247 585 1 164 1 519Finland 80 233 312 663 1 167 1 423Poland 42 126 211 487 944 1 234
Other developed Europe 176 388 552 1 205 2 226 2 743Norway 69 144 194 312 582 676Switzerland 104 238 349 879 1 615 2 026
North America 1 181 2 964 5 468 8 349 12 922 16 566Canada 341 884 1 631 2 752 3 979 5 005United States 838 2 079 3 835 5 595 8 940 11 558
Other developed countries 3 028 5 336 7 113 15 302 25 733 35 332Australia 278 778 1 026 1 953 3 902 5 437Japan 2 639 4 333 5 719 12 642 20 593 28 344New Zealand 48 120 170 297 585 740
Developing countries 11 696 27 671 42 757 86 608 169 501 218 114Africa 112 256 389 701 1 320 1 746Latin America and the Caribbean 147 834 1 854 3 445 5 441 7 044
Asia 11 414 26 551 40 478 82 407 162 629 209 181West Asia 174 489 574 1 147 2 311 3 281South, East and South-east Asia 11 240 26 062 39 905 81 260 160 317 205 900
East Asia 6 050 9 647 15 637 31 056 64 876 83 416China 255 1 419 3 651 12 519 29 363 38 571Hong Kong, China 569 1 409 1 727 3 878 7 912 10 372Korea, Republic of 1 174 2 591 5 119 9 222 21 268 27 602Taiwan Province of China 4 042 4 212 5 113 5 391 6 238 6 744
South Asia 127 389 651 1 605 3 491 5 134Bangladesh 11 23 36 63 126 211India 47 218 415 1 195 2 728 3 942Iran, Islamic Republic of 12 21 35 92 182 347Pakistan 20 36 39 68 139 209Sri Lanka 30 70 94 134 212 283
ASEAN 5 062 16 026 23 617 48 599 91 951 117 350Brunei Darussalam 50 64 63 118 257 357Cambodia 0 19 55 93 147 198Indonesia 862 2 067 4 007 6 399 11 534 14 920Lao People’s Democratic Republic 3 10 13 27 43 59Malaysia 945 4 400 4 943 9 657 17 933 21 991Myanmar 3 1 1 1 0 1Philippines 307 1 077 1 844 3 705 5 322 6 699Singapore 2 059 6 247 9 155 22 148 45 729 59 037Thailand 714 1 797 2 946 5 233 9 151 11 837Viet Nam 118 343 589 1 218 1 834 2 251
Oceania 24 30 35 55 111 143Transition economies 83 117 219 418 849 1 166
Russian Federation 45 58 114 219 445 629Source: AJC-UNCTAD-Eora database on ASEAN GVCs.Note: All values are estimated. The value refers to that incorporated in exports from the countries listed. For the GVC terminology,
see box 2.

ASEAN Promotion Centre on Trade, Investment and Tourismwww.asean.or.jp/en