a report by worldatwork dow scott, ph.d., loyola...
TRANSCRIPT

A report by WorldatWork
Dow Scott, Ph.D., Loyola University ChicagoTom McMullen, Hay Group
Mark Royal, Ph.D., Hay GroupMay 2011
Reward Fairnessre
sear
ch
Contact:
WorldatWork Customer Relations
14040 N. Northsight Blvd.
Scottsdale, Arizona USA
85260-3601
Toll free: 877-951-9191
Fax: 480-483-8352

WorldatWork Reward fairness: slippery slope or manageable terrain?
1
Table of Figures
Figure 1: Participant demographics, Organization size ............................................................................ 3
Figure 2: Participant demographics, Industry ........................................................................................... 4
Figure 3: Participant demographics, Organization type ............................................................................ 4
Table 1: Employee concerns about internal equity or fairness of reward elements .................................. 6
Table 2: Employee concerns about external equity or market competitiveness of reward elements ..... 7
Table 3: Impact of incentives on employee engagement .......................................................................... 8
Table 4: Determinants of organization rewards ....................................................................................... 9
Table 5: Employee concerns about internal equity or fairness of reward elements examined by organization size (i.e., number of employees) ........................................................................................ 10
Table 6: Employee concerns about internal equity or fairness of reward elements examined by organization size (i.e., number of employees) ........................................................................................ 11
Table 7: Employee concerns about internal equity and fairness of reward elements examined by organization type .................................................................................................................................... 12
Table 8: Employee concerns about external equity or market competitiveness of reward elements examined by organization type ............................................................................................................... 13
Figure 4: Perceptions of reward fairness: What works well (top 5) ......................................................... 14
Figure 5: Perceptions of reward fairness: What erodes perceptions of fairness (top 5) ......................... 15
WorldatWork Reward fairness: slippery slope or manageable terrain?
2
Reward fairness: slippery slope or manageable terrain?
Dow Scott, Ph.D., Loyola University Chicago Tom McMullen, Hay Group Mark Royal, Ph.D., Hay Group
Introduction
Management faces numerous challenges in determining how to reward employees. They must balance market competitiveness, internal equity, organizational performance and individual performance considerations. Notably, issues of “fairness” underlie each of these areas. No matter how sophisticated the design, reward programs, policies and practices that are not perceived as fair will not successfully attract, retain and engage employees.
Justice and equity are related concepts that have long been associated with perceptions of pay fairness. Specifically, reward fairness and the related constructs of pay justice and equity have been found to be strongly related to employee attitudes including pay satisfaction, (e.g., Cowherd & Levine, 1992; Folger & Konovsky, 1989; Lee, Law & Bobko, 1999; Miceli & Mulvey, 2000; Shaw & Gupta, 2001; Tekleab, Bartol, & Liu, 2005), commitment (Cohen & Gattiker, 1994; Dulebohn & Martocchio, 1998), intention to quit (Miceli, Jung, Near, & Greenberger, 1991) and perceived organization support (Miceli & Mulvey, 2000). Perceptions of reward fairness also have been found to impact employee behavior such as absenteeism and citizenship behavior (Lee, 1995; Colquitt et al., 2001), individual performance (Cohen-Charash & Spector, 2001; Colquitt et al., 2001) and organization outcomes (e.g., employee turnover and customer satisfaction) (Simons & Roberson, 2003).
Although we know that employee perceptions of reward fairness are strongly related to employee attitudes, behaviors and performance, it is less clear what impact reward practices have on these perceptions. In other words, do certain types of reward programs or policies more closely align with perceptions of fairness than other programs or policies?
To survive (and thrive), organizations must ensure that reward programs are rooted in principles of fairness in order to motivate and engage employees from different backgrounds and experiences. The challenges of creating a fair reward system become even more pronounced as organizations develop a global presence and attempt to integrate reward strategies across countries with different legislative requirements, traditions and cultures and accepted business and norms. This study examines how management defines what constitutes fair rewards and the tools reward professionals use to create reward programs, policies and structures that are perceived as fair.
Data collection and sample characteristics
A sample of 5,000 WorldatWork members, primarily mid-level to senior reward professionals, was invited to participate in this study. The survey was open for approximately a month from November 15, 2010, through December 20, 2010. A reminder to complete the survey was sent out half way through the period and again just before the survey closed. The survey required approximately 15 minutes to complete. We were delighted to have 568 WorldatWork members from around the world respond. The 11% response rate is considered good for a survey of this type and length.
Ideally, we would have liked to survey employees directly about their perceptions of reward fairness, but from a practical perspective, few organizations allow such access and employees may have limited perspective concerning how reward programs affect their pay. Because reward professionals are accountable for the design and administration of reward program, policies and practices, we felt that they would be the single most

WorldatWork Reward fairness: slippery slope or manageable terrain?
3
knowledgeable resource about employee concerns about perceptions of reward fairness and equity within their organizations. They would also provide the best view regarding how senior management within their organizations assess the impact of reward programs on employee perceptions of fairness.
Figures 1 through 3 indicate that the organizations sampled in this research study are diverse. Figure 1 shows that respondents represented organizations that ranged in size from less than 100 to over 40,000 employees. Approximately 11% of organizations had less than 100 employees; 35% had between 100 and less than 1,000 employees; 26% had between 1,000 and less than 5,000 employees, 10% had between 5,000 and less than 10,000 employees, 10% had between 10,000 and less than 40,000 employees, 9% had 40,000 employees or more
Figure 1: Participant demographics, Organization size
Figure 2 shows the diverse range of industries are represented by the respondents; the largest representations were from professional, scientific and technical services (17%); finance and insurance (10%); manufacturing (10%); and health care and social assistance (7%).
Less than 10011%
100 to 99935%
1,000 to 4,99926%
5,000 to 9,999 10%
10,000 to 39,99910%
40,000 or more9%

WorldatWork Reward fairness: slippery slope or manageable terrain?
4
Figure 2: Participant demographics, Industry
Figure 3 shows that organizations in different sectors of the economy are represented, i.e., public sector (local, state, federal government) (13%), private sector - publicly traded (29%), private sector - privately held (43%) and nonprofit/not-for-profit (education/academic organizations, charitable organizations) (15%).
Figure 3: Participant demographics, Organization type
17%
10% 10%
7%
0%
10%
20%
Professional, scientific and technical services
Finance and insurance Manufacturing Health care andsocial assistance
13%
29%
43%
15%
0%
10%
20%
30%
40%
50%
Public sector Publicly traded Privately held Nonprofit
WorldatWork Reward fairness: slippery slope or manageable terrain?
5
Finally, the majority of respondents were from organizations in the United States (76%). Canada and U.K. had the next largest representation at 17% and 6%, respectively. China, Germany, Singapore and Mexico are each represented by 4% of the respondents. Brazil and Australia are each represented by 3% of the respondents; and Switzerland and Russia made up 2% of our sample. We have a few respondents from other parts of Europe, Asia-Pacific, and the Middle East (each making up less than 1% of the sample). A few respondents did not indicate what countries they represented.
The research findings are presented in a series of tables that group responses to statements in terms of internal perceptions of fairness, external perceptions of fairness, and determinants of fairness. The first four tables report the findings from the overall sample. The remaining four tables break the information down into organization size (i.e., number of employees) and type (i.e., public sector, private sector - publicly traded, private sector - privately held, and nonprofit/not-for-profit).
WorldatWork Reward fairness: slippery slope or manageable terrain?
6
Findings and implications
Our findings are presented in the following sections and in their respective tables:
Employee concerns about internal equity or fairness
Employee concerns about external equity or fairness
Determinants of reward fairness
Reward fairness and organization demographics
Suggestions to increase employee perceptions of reward fairness
Impact of internal reward equity
Employee concerns about internal equity or fairness
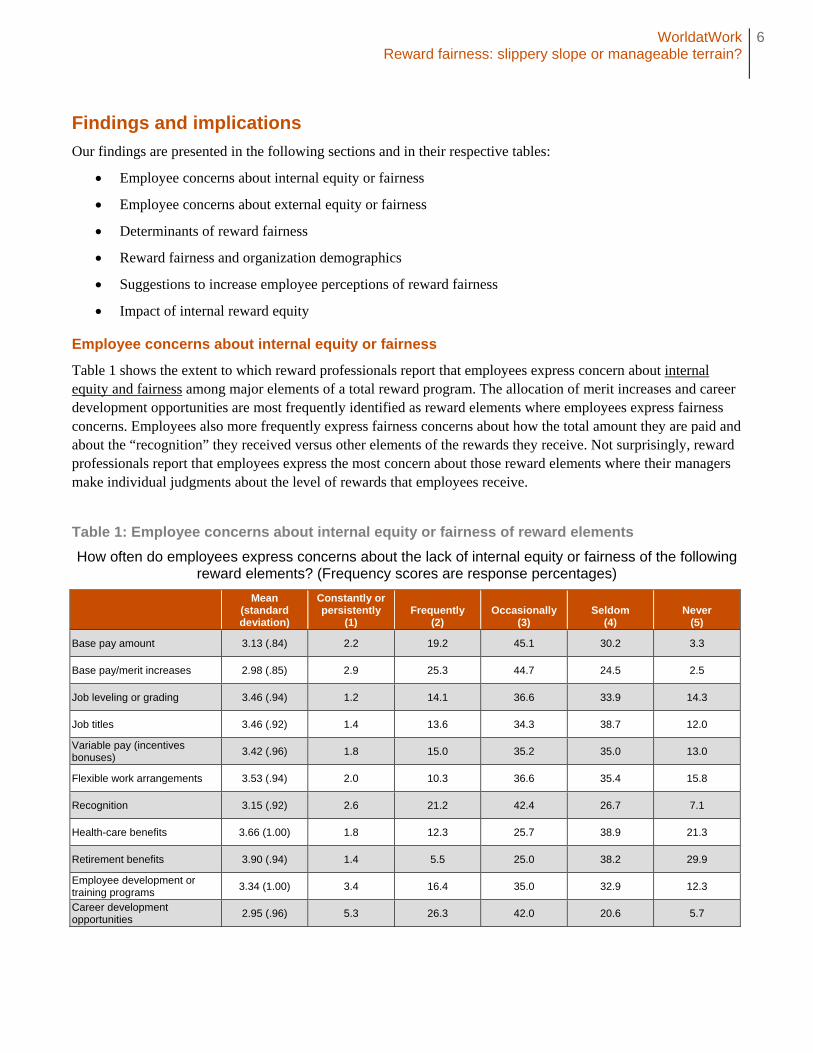
Table 1 shows the extent to which reward professionals report that employees express concern about internal equity and fairness among major elements of a total reward program. The allocation of merit increases and career development opportunities are most frequently identified as reward elements where employees express fairness concerns. Employees also more frequently express fairness concerns about how the total amount they are paid and about the “recognition” they received versus other elements of the rewards they receive. Not surprisingly, reward professionals report that employees express the most concern about those reward elements where their managers make individual judgments about the level of rewards that employees receive.
Table 1: Employee concerns about internal equity or fairness of reward elements
How often do employees express concerns about the lack of internal equity or fairness of the following reward elements? (Frequency scores are response percentages)
Mean (standard deviation)
Constantly or persistently
(1) Frequently
(2) Occasionally
(3) Seldom
(4) Never
(5)
Base pay amount 3.13 (.84) 2.2 19.2 45.1 30.2 3.3
Base pay/merit increases 2.98 (.85) 2.9 25.3 44.7 24.5 2.5
Job leveling or grading 3.46 (.94) 1.2 14.1 36.6 33.9 14.3
Job titles 3.46 (.92) 1.4 13.6 34.3 38.7 12.0
Variable pay (incentives bonuses)
3.42 (.96) 1.8 15.0 35.2 35.0 13.0
Flexible work arrangements 3.53 (.94) 2.0 10.3 36.6 35.4 15.8
Recognition 3.15 (.92) 2.6 21.2 42.4 26.7 7.1
Health-care benefits 3.66 (1.00) 1.8 12.3 25.7 38.9 21.3
Retirement benefits 3.90 (.94) 1.4 5.5 25.0 38.2 29.9
Employee development or training programs
3.34 (1.00) 3.4 16.4 35.0 32.9 12.3
Career development opportunities
2.95 (.96) 5.3 26.3 42.0 20.6 5.7

WorldatWork Reward fairness: slippery slope or manageable terrain?
7
Employees expressed the least concern about “health-care benefits” and “retirement benefits” decisions. This finding is not surprising because these rewards are typically extended to virtually all employees as a group and management does not tend to individually differentiate in terms of who will receive them or the individual levels of value to be received.
We were surprised, however, that almost 50% of organizations reported that employees seldom or never expressed concern about fairness concerns around variable pay (e.g., incentives and bonuses). Although one might think of incentives and bonuses as an individual reward, employees may think of it as reward over which their supervisor has little control. Often incentive or bonus funding is based on corporate or team performance and individual payout targets are often based on the position and grade level of the employee. Thus, individual performance as judged by an employee’s supervisor may have little overall perceived affect on the size of the bonus.
Finally, Table 1 shows that for most elements of reward programs, reward professionals say that only 10 to 20% of employees express “constantly or persistently” or “frequently” concern about elements of reward programs.
Employee concerns about external equity or fairness
Table 2 shows the extent to which reward professionals report that employees express concern about external equity and fairness among major reward elements. As is true for concerns about internal equity, reward professionals indicate that employees have the most external fairness concerns about the allocation of base pay, career development opportunities and merit increases relative to the external market. Again, these reward elements individually differentiate employees and have major influence on their financial wellbeing and status. However, concerns about “recognition” were not perceived as being as prevalent. We suspect that even though recognition is an individually focused reward, it is not easy for most employees to compare what is done in the employee’s organization in this regard to other organizations.
Table 2: Employee concerns about external equity or market competitiveness of reward elements
How often do employees express concerns about the lack of external equity or market competitiveness of the reward elements? (Frequency scores are response percentages)
Mean (standard deviation)
Constantly or persistently
(1) Frequently
(2) Occasionally
(3) Seldom
(4) Never
(5)
Base pay amount 2.94 (.83) 3.3 24.3 50.8 18.4 3.3
Base pay/merit increases 3.14 (.94) 3.7 19.9 42.1 27.1 7.2
Job leveling or grading 3.80 (.89) .4 6.6 28.8 40.7 23.5
Job titles 3.68 (.88) 1.2 8.0 28.5 46.1 16.2
Variable pay (incentives bonuses)
3.45 (.99) 2.1 15.6 32.3 35.6 14.4
Flexible work arrangements 3.68 (.96) 2.0 8.2 30.0 39.0 20.8
Recognition 3.61 (.93) .8 11.9 29.9 40.7 16.8
Health-care benefits 3.64 (.99) 1.6 11.7 27.6 38.9 20.2
Retirement benefits 3.88 (.94) .8 7.6 23.1 39.9 28.6
Employee development or training programs
3.57 (.99) 2.5 12.3 29.3 39.1 16.8
Career development opportunities
2.95 (1.00) 3.3 19.1 36.6 29.6 11.3

WorldatWork Reward fairness: slippery slope or manageable terrain?
8
Reward professionals reported that employees expressed less concern about external comparisons as opposed to internal comparisons regarding rewards. Over 50% of respondents indicated that employees were “seldom” or “never” concerned about external reward equity or fairness as it related to retirement, job leveling or grading, job titles, health-care benefits, recognition, and employee development or training programs decisions. The findings in Table 1 and Table 2 seem to imply that reward professionals hear more issues and complaints from employees about internal fairness or inequity as compared to external unfairness or inequity. This reaffirms previous research that reward satisfaction and perceptions of fairness are more strongly driven by internal inequity and perceived unfairness than by external comparisons.
Determinants of reward fairness
Table 3 shows a list of criteria that are believed to most directly influence perceptions of reward fairness. Respondents were asked to select the two (2) criteria they thought were the most important in driving perceptions of reward fairness for base pay, variable pay and non-financial rewards. While respondents were asked to identify two (2) criteria for each type of reward, some reported only one criterion, thus the columns do not add to 100%.
Table 3: Impact of incentives on employee engagement
Please identify the two (2) most important criteria in determining reward fairness for your organization in each column. (Frequency scores are response percentages)
Base pay Variable pay Non-financial rewards
Seniority/tenure at organization 22.2 8.1 25.5
Time in job 23.9 5.8 16.7
Work responsibilities associated with the job 63.7 20.2 18.0
Individual potential 16.4 12.7 19.7
Individual performance 63.2 55.3 37.7
Team/Department/SBU performance 10.2 27.3 23.1
Overall organizational performance 19.4 51.9 16.5
For base pay, reward professionals believe that work responsibilities associated with the job and individual performance are the criteria that most affects perceptions of reward fairness. Each of these factors was chosen by more than 60% of the respondents. The factors chosen least frequently were team/department/business unit performance (10%) and individual potential (16%).
For variable or incentive pay, individual performance (55%) and overall organizational performance (52%) were chosen as most important criteria for affecting perceptions of reward fairness. The least important factors for variable pay, as may be expected, are organizational seniority or tenure (8%) and time in the job (6%).
Finally, the top driver of the perceived fairness of non-financial rewards was reported to be individual performance (38%), with responses to other factors more evenly divided among criteria than were previously noted as affecting either base pay or variable pay.
Overall, reward professionals believe individual performance is a very important determinant of reward fairness for the three main categories of rewards (i.e., base pay, variable pay and non-financial rewards). However, work
WorldatWork Reward fairness: slippery slope or manageable terrain?
9
responsibility is also identified as a primary driver of reward fairness for base pay, so one should not lose touch with the importance of job valuing processes (i.e., market pricing and job evaluation) or suffer the consequences.
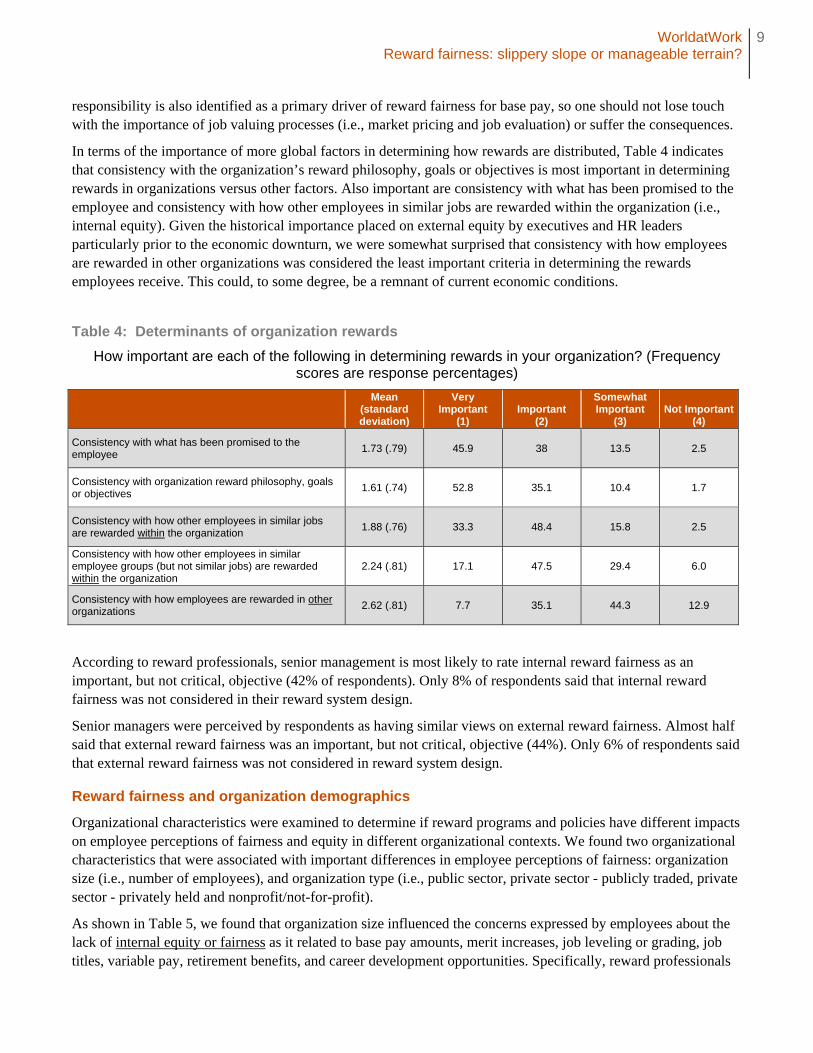
In terms of the importance of more global factors in determining how rewards are distributed, Table 4 indicates that consistency with the organization’s reward philosophy, goals or objectives is most important in determining rewards in organizations versus other factors. Also important are consistency with what has been promised to the employee and consistency with how other employees in similar jobs are rewarded within the organization (i.e., internal equity). Given the historical importance placed on external equity by executives and HR leaders particularly prior to the economic downturn, we were somewhat surprised that consistency with how employees are rewarded in other organizations was considered the least important criteria in determining the rewards employees receive. This could, to some degree, be a remnant of current economic conditions.
Table 4: Determinants of organization rewards
How important are each of the following in determining rewards in your organization? (Frequency scores are response percentages)
Mean (standard deviation)
Very Important
(1) Important
(2)
Somewhat Important
(3) Not Important
(4)
Consistency with what has been promised to the employee
1.73 (.79) 45.9 38 13.5 2.5
Consistency with organization reward philosophy, goals or objectives
1.61 (.74) 52.8 35.1 10.4 1.7
Consistency with how other employees in similar jobs are rewarded within the organization
1.88 (.76) 33.3 48.4 15.8 2.5
Consistency with how other employees in similar employee groups (but not similar jobs) are rewarded within the organization
2.24 (.81) 17.1 47.5 29.4 6.0
Consistency with how employees are rewarded in other organizations
2.62 (.81) 7.7 35.1 44.3 12.9
According to reward professionals, senior management is most likely to rate internal reward fairness as an important, but not critical, objective (42% of respondents). Only 8% of respondents said that internal reward fairness was not considered in their reward system design.
Senior managers were perceived by respondents as having similar views on external reward fairness. Almost half said that external reward fairness was an important, but not critical, objective (44%). Only 6% of respondents said that external reward fairness was not considered in reward system design.
Reward fairness and organization demographics
Organizational characteristics were examined to determine if reward programs and policies have different impacts on employee perceptions of fairness and equity in different organizational contexts. We found two organizational characteristics that were associated with important differences in employee perceptions of fairness: organization size (i.e., number of employees), and organization type (i.e., public sector, private sector - publicly traded, private sector - privately held and nonprofit/not-for-profit).
As shown in Table 5, we found that organization size influenced the concerns expressed by employees about the lack of internal equity or fairness as it related to base pay amounts, merit increases, job leveling or grading, job titles, variable pay, retirement benefits, and career development opportunities. Specifically, reward professionals

WorldatWork Reward fairness: slippery slope or manageable terrain?
10
consistently indicated that more concerns about rewards were expressed by employees in larger organizations than in smaller organizations. These results are interesting in that one might have thought that because larger organization are more likely to have more formalized and structured reward systems and larger human resource staffs, employees might express fewer concerns about the rewards they receive. However, smaller organizations are able to likely provide more of personal human touch and understanding regarding employee reward program concerns that aren’t possible in larger organizations.
Table 5: Employee concerns about internal equity or fairness of reward elements examined by organization size (i.e., number of employees)
Q1 – How often do employees express concerns about the lack of internal equity or fairness of the following?
Statement
Small – less than 1,000 Medium – 1,000 to 10,000 Large – Over 10,000
F Sig. N Mean S.D. S.E. N Mean S.D. S.E. N Mean S.D. S.E.
Q1. Base pay amount 219 3.28 .820 .055 166 3.07 .813 .063 88 2.99 .809 .086 5.387 .005
Q2. Base pay/merit increases 219 3.11 .857 .058 166 2.93 .825 .064 88 2.82 .810 .086 4.624 .0l0
Q3. Job leveling or grading 218 3.71 .957 .065 164 3.29 .849 .066 87 3.22 .945 .101 14.037 .000
Q4. Job titles 218 3.58 .919 .062 166 3.39 .857 .067 87 3.26 1.005 .108 4.338 .014
Q5. Variable pay (incentives or bonuses)
215 3.58 1.020 .070 163 3.37 .868 .068 87 3.23 .898 .096 4.779 .009
Q6. Flexible work arrangements
219 3.60 .964 .065 166 3.57 .855 .066 86 3.40 1.021 .110 1.558 .212
Q7. Recognition 220 3.25 .945 .064 166 3.14 .816 .063 87 3.00 1.012 .108 2.536 .080
Q8. Health-care benefits 217 3.73 1.007 .068 166 3.61 .996 .077 87 3.62 .979 .105 .786 .456
Q9. Retirement benefits 219 4.05 .884 .060 166 3.79 .952 .074 87 3.74 .982 .105 5.431 .005
Q10. Employee development/ training
218 3.44 1.042 .071 165 3.36 .930 .072 86 3.19 1.023 .110 1.924 .147
Q11. Career development opportunities
217 3.10 .998 .068 165 2.93 .887 .069 87 2.78 .855 .092 3.917 .021
Response Scale: 1 = Constantly or persistently, 2 = Frequently, 3 = Occasionally, 4 = Seldom, and 5 = Never
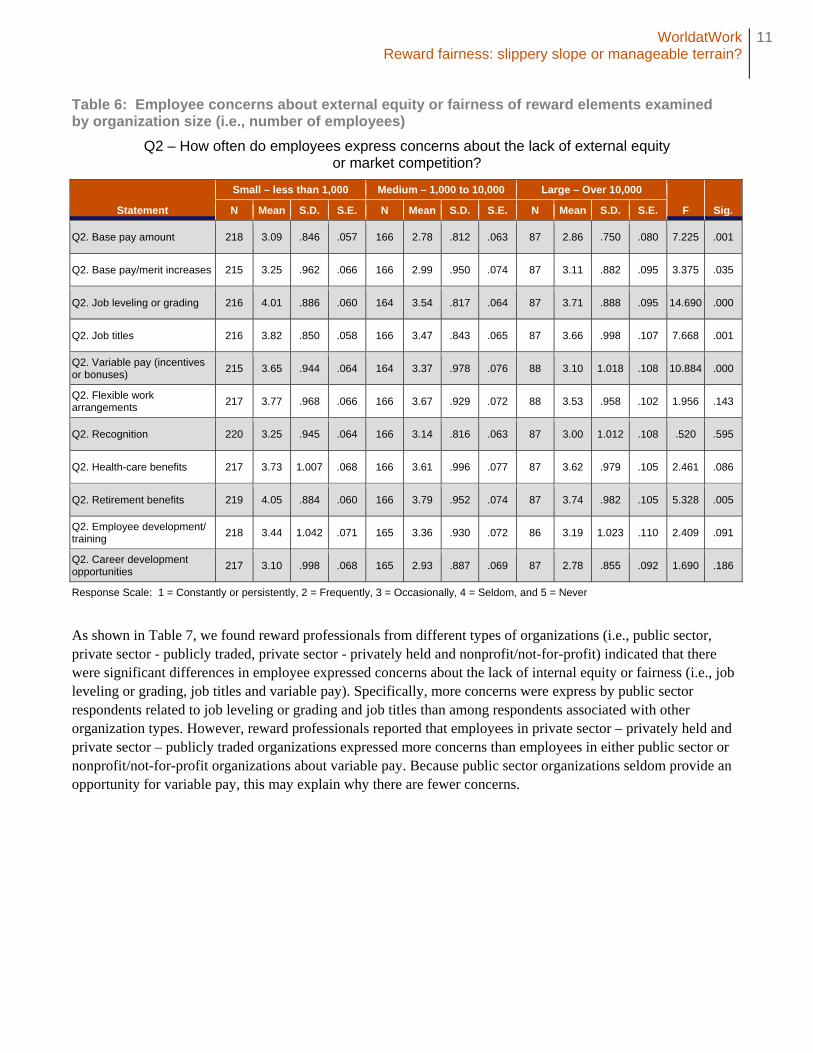
We also found that organization size influenced the concerns expressed by employees about the lack of external equity or fairness as it related to base pay amounts, merit increases, job leveling or grading, job titles, variable pay, and retirement benefits (see Table 6). Although reward professionals consistently indicated that more concerns about rewards were expressed by employees in larger organizations than in small organizations, reward professionals in mid-sized organization indicated almost equal numbers of employee concerns as they related to external fairness and equity as did respondents in large organizations.
WorldatWork Reward fairness: slippery slope or manageable terrain?
11
Table 6: Employee concerns about external equity or fairness of reward elements examined by organization size (i.e., number of employees)
Q2 – How often do employees express concerns about the lack of external equity or market competition?
Statement
Small – less than 1,000 Medium – 1,000 to 10,000 Large – Over 10,000
F Sig. N Mean S.D. S.E. N Mean S.D. S.E. N Mean S.D. S.E.
Q2. Base pay amount 218 3.09 .846 .057 166 2.78 .812 .063 87 2.86 .750 .080 7.225 .001
Q2. Base pay/merit increases 215 3.25 .962 .066 166 2.99 .950 .074 87 3.11 .882 .095 3.375 .035
Q2. Job leveling or grading 216 4.01 .886 .060 164 3.54 .817 .064 87 3.71 .888 .095 14.690 .000
Q2. Job titles 216 3.82 .850 .058 166 3.47 .843 .065 87 3.66 .998 .107 7.668 .001
Q2. Variable pay (incentives or bonuses)
215 3.65 .944 .064 164 3.37 .978 .076 88 3.10 1.018 .108 10.884 .000
Q2. Flexible work arrangements
217 3.77 .968 .066 166 3.67 .929 .072 88 3.53 .958 .102 1.956 .143
Q2. Recognition 220 3.25 .945 .064 166 3.14 .816 .063 87 3.00 1.012 .108 .520 .595
Q2. Health-care benefits 217 3.73 1.007 .068 166 3.61 .996 .077 87 3.62 .979 .105 2.461 .086
Q2. Retirement benefits 219 4.05 .884 .060 166 3.79 .952 .074 87 3.74 .982 .105 5.328 .005
Q2. Employee development/ training
218 3.44 1.042 .071 165 3.36 .930 .072 86 3.19 1.023 .110 2.409 .091
Q2. Career development opportunities
217 3.10 .998 .068 165 2.93 .887 .069 87 2.78 .855 .092 1.690 .186
Response Scale: 1 = Constantly or persistently, 2 = Frequently, 3 = Occasionally, 4 = Seldom, and 5 = Never
As shown in Table 7, we found reward professionals from different types of organizations (i.e., public sector, private sector - publicly traded, private sector - privately held and nonprofit/not-for-profit) indicated that there were significant differences in employee expressed concerns about the lack of internal equity or fairness (i.e., job leveling or grading, job titles and variable pay). Specifically, more concerns were express by public sector respondents related to job leveling or grading and job titles than among respondents associated with other organization types. However, reward professionals reported that employees in private sector – privately held and private sector – publicly traded organizations expressed more concerns than employees in either public sector or nonprofit/not-for-profit organizations about variable pay. Because public sector organizations seldom provide an opportunity for variable pay, this may explain why there are fewer concerns.

WorldatWork Reward fairness: slippery slope or manageable terrain?
12
Table 7: Employee concerns about internal equity and fairness of reward elements examined by organization type
How often do employees express concerns about the lack of internal equity or fairness of the following?
Statement
Public sector Private sector – publicly traded
Private sector – privately held
Nonprofit/ Not-for-profit
F Sig. N Mean S.D. N Mean S.D. N Mean S.D. N Mean S.D.
Q1-1. Base pay amount 61 3.10 .768 140 3.04 .781 203 3.22 .846 71 3.24 .853 1.722 .162
Q1-2. Base pay/merit increases
61 2.89 .858 140 2.90 .825 203 3.03 .875 71 3.13 .755 1.664 .174
Q1-3. Job leveling or grading 61 2.97 .948 139 3.37 .869 201 3.69 .935 70 3.50 .913 10.689 .000
Q1-4. Job titles 61 3.21 .859 139 3.37 .879 202 3.56 .982 71 3.51 .826 2.738 .043
Q1-5. Variable pay (incentives or bonuses)
58 3.64 .968 139 3.32 .877 202 3.32 .982 68 3.90 .849 8.327 .000
Q1-6. Flexible work arrangements
61 3.49 .924 138 3.62 .922 203 3.56 .960 71 3.45 .923 .625 .599
Q1-7. Recognition 61 3.15 .997 139 3.25 .885 204 3.14 .942 71 3.07 .799 .741 .528
Q-2-8. Health-care benefits 61 3.61 1.130 139 3.73 .962 201 3.63 1.027 71 3.70 .885 .353 .787
Q1-9. Retirement benefits 61 3.87 1.040 139 3.84 .870 203 3.90 .975 71 4.03 .845 .646 .586
Q1-10. Employee development/ training
61 3.38 .986 138 3.40 .956 201 3.29 1.099 71 3.45 .789 .563 .640
Q1-11. Career development opportunities
61 2.97 1.032 139 2.97 .876 200 2.97 .997 71 2.99 .784 .006 .999
Response Scale: 1 = Constantly or persistently, 2 = Frequently, 3 = Occasionally, 4 = Seldom, and 5 = Never
As shown in Table 8, we found organization type was related to significant differences in employee concerns about the lack of external equity or market competitiveness (i.e., job titles, variable pay and employee development and training). Specifically, more concerns were expressed by public sector organizations related to job titles than the other organization types. However, reward professionals reported that employees in the private sector – privately held and private sector – publicly traded expressed more concerns then either the public sector or nonprofit/not-for-profit about variable pay and employee development and training.

WorldatWork Reward fairness: slippery slope or manageable terrain?
13
Table 8: Employee concerns about external equity or market competitiveness of reward elements examined by organization type
How often do employees express concerns about the lack of external equity or market competitiveness?
Statement
Public sector Private sector – publicly traded
Private sector – privately held
Nonprofit/ Not-for-profit
F Sig. N Mean S.D. N Mean S.D. N Mean S.D. N Mean S.D.
Q2-1. Base pay amount 61 3.03 .836 139 2.89 .729 204 2.90 .839 69 3.01 .931 .768 .512
Q2-2. Base pay/merit increases
61 3.15 .980 138 3.06 .886 202 3.13 .976 69 3.20 .948 .403 .751
Q2-3. Job leveling or grading 61 3.62 1.003 138 3.72 .852 201 3.89 .884 69 3.78 .838 1.759 .154
Q2-4. Job titles 61 3.41 .864 139 3.58 .876 202 3.75 .902 69 3.81 .827 3.499 .016
Q2-5. Variable pay (incentives or bonuses)
59 3.64 1.047 140 3.29 .977 203 3.34 .980 67 3.87 .869 6.968 .000
Q2-6. Flexible work arrangements
61 3.80 .853 140 3.62 .985 203 3.66 .990 69 3.83 .839 1.092 .352
Q2-7. Recognition 61 3.70 .919 139 3.67 .846 203 3.49 1.002 69 3.70 .828 1.771 .152
Q-2-8. Health-care benefits 61 3.59 1.086 139 3.68 .919 203 3.56 1.015 69 3.78 .937 1.012 .387
Q2-9. Retirement benefits 61 3.93 1.078 139 3.86 .836 203 3.78 .991 69 4.12 .832 2.254 .081
Q2-10. Employee development/ training
60 3.77 .890 140 3.51 1.007 202 3.42 1.059 69 3.72 .765 2.886 .035
Q2-11. Career development opportunities
60 3.35 1.071 140 3.22 .960 200 3.23 1.036 69 3.39 .911 .680 .564
Response Scale: 1 = Constantly or persistently, 2 = Frequently, 3 = Occasionally, 4 = Seldom, and 5 = Never
Suggestions to increase employee perceptions of reward fairness
To obtain insight about what reward programs, policies and practices would enhance employee fairness, we asked reward professionals to respond to two open-end questions.
In terms of improving employee perceptions of internal and/or external reward fairness, what is your organization doing that works particularly well?
What has eroded employee perceptions of internal or external reward fairness in your organization, if anything?
We received numerous observations (338) from survey respondents about what worked particularly well to enhance employee perceptions of reward fairness in their organization. Reward communications was, by a wide margin, the most significant theme reported in terms of the factor that impacts perceptions of reward fairness (at 62% of all open ended responses). Communication sub-themes include distilling down to core messages, the frequency of communications, senior leadership involvement in communications as well as the creativity and innovation of communications. Fourteen percent of organizations said conducting market pay surveys enhanced perceptions of fairness. Other factors reported include a culture of openness and transparency (9%) and non-financial recognition programs (7%). Respondent-specific responses to this open-ended question can be found in Figure 4.

WorldatWork Reward fairness: slippery slope or manageable terrain?
14
Figure 4: Perceptions of reward fairness: What works well (top 5)?
Figure 5 shows the programs, policies and practices reward professionals believe that erodes employee perception of fairness in their organizations. The 349 observations are much more diverse than those regarding factors that enhance perceptions of fairness and equity. Pay cuts, lack of pay increases, pay freezes, reduced incentive amounts and benefit reductions were the top reasons, cited by 34% of respondents, indicating that issues and challenges surrounding fairness in reward systems resulting from the recession are still top of mind in terms of employees. However, inconsistent treatment, favoritism and exceptions in a variety of situations is also attributed to the erosion of employee perceptions of fairness (19%). Poor reward communications also was identified as eroding reward fairness (11%). Other factors identified as eroding employee perceptions of fairness or equity include leadership and management (3%) and reward strategy and design (2%).
7%
9%
9%
14%
62%
0% 10% 20% 30% 40% 50% 60% 70%
Non -financial recognition
Culture of openness and transparency
Reward strategy and design
Market survey/ external benchmarking
Communication
Percent of total open-ended mentions

WorldatWork Reward fairness: slippery slope or manageable terrain?
15
Figure 5: Perceptions of reward fairness: What erodes perceptions of fairness (top 5)?
Impact of internal reward equity on employees
Finally, we asked reward professionals about what influence they believe internal reward equity or fairness has on “employee engagement,” “employee motivation” and “employee satisfaction.” We found that more than 50% of reward professionals believe that it is “extremely influential” for engagement (56%), motivation (53%) and satisfaction (55%). Few reward professionals believe that engagement, motivation and satisfaction are only “mildly influential” or have “no effect or neutral” influence, 10%, 12% and 11% respectively.
Conclusions and recommendations
This study reaffirms that reward fairness is important to employees. What this study uniquely contributes is an understanding of how reward programs and policies influence those perceptions. The headlines or key lessons from this study are:
This research indicates that employees express different levels of concern about different reward elements. Reward professionals need to pay particular attention to fairness issues where individual performance is the primary criterion for rewarding employees, as compared to reward programs that are distributed to employees based on membership (e.g., retirement and health-care benefits) or on team or group results (e.g., incentives).
Even though executives and HR leaders emphasize the importance of externally benchmarking reward programs and policies, internal comparisons are the major driver of fairness and equity perceptions. As such, management should make solid investments in job evaluation and work valuing programs to support perceptions of internally fairness and equity.
2%
3%
11%
19%
34%
0% 10% 20% 30% 40%
Reward strategyand design
Leadership
Communications
Inconsistent application, favoritism, exceptions
Poor economy, pay cuts pay freezes
Percent of total open-ended mentions

WorldatWork Reward fairness: slippery slope or manageable terrain?
16
Reward communications are very important for creating perceptions of reward fairness and equity, and
communicating reward issues poorly can erode these perceptions.
The recession has had a substantial corrosive impact on employee perceptions of reward fairness and equity. As such, reward professionals need to work to regain employee trust in reward systems.
Reward decisions based on individual measures of performance are important in establishing reward programs that are perceived as fair. Employees are more likely to be concerned about fairness issues if individual performance is not rewarded or recognized.
The frequency of reward concerns expressed by employees in large organizations is higher than in smaller organization. Although larger organization may have more formally structured reward programs, policies and structures, they would be well advised to give more attention to issues of perceived fairness and equity and to more fully understand the employee’s perspective in reward program values.
Organization type also has influence on the concerns employees express about the reward programs. Fairness issues are different for reward professionals in private sector organizations and those in not-for-profit or government sectors.
Reward professionals believe that employee perceptions of fairness and equity have a strong influence on employee engagement, commitment and tenure. To foster and maintain high levels of employee motivation, perceptions of fairness should be monitored and actions taken if they deteriorate.
References
Cohen, A., and Gattiker, U.E. (1994) Rewards and organizational commitment across structural characteristics: A meta-analysis. Journal of Business and Psychology, 9(2), 137-157.
Cohen-Charash, Y., and Spector, P.E. (2001). The role of justice in organizations: A meta-analysis. Organizational Behavior and Human Decision Processes, 86, 278–321.
Colquitt, J.A., Conlon, D.E., Wesson, M.J., Porter, C.O., and Ng, K.Y. (2001). Justice at the millennium: A meta-analytic review of 25 years of organizational justice research. Journal of Applied Psychology, 86, 425–445.
Cowherd, D.M., and Levine, D.I. (1992) Product Quality and Pay Equity between Lower-Level Employees and Top Management: An Investigation of Distributive Justice Theory. Administrative Science Quarterly, 37: 302-320
Dulebohn, J.H., and Martocchio, J.J. (1998) Employee perceptions of the fairness of work group incentives pay plans. Journal of Management, 24(4), 469-488.
Folger, R., and Konovsky, M.A. (1989) Effects of Procedural and Distributive Justice on Reactions to Pay Raise Decisions. Academy of Management Journal. 32(1), 115-130.
Hambrick, D.C., and Siegel, P.A. (1997) Pay dispersion within top management groups: Harmful effects on performance of high-technology firms. Academy of Management Proceedings. 26- 29.
Lee, C. (1995) Prosocial organizational behaviors: The roles of workplace justice, achievement striving, and pay satisfaction. Journal of Business and Psychology. 10(2) 197-206.
Lee, C., Law, K.S., and Bobko, P. (1999) The importance of justice perceptions on pay effectiveness: A two-year study of a skill pay plan. Journal of Management. 25(6), 851-873.
Miceli, M.P., Jung, I., Near, J.P., and Greenberger, D. B. (1991) Predictors and outcomes of reactions to pay-for-performance plans. Journal of Applied Psychology, 76, 508–521.

WorldatWork Reward fairness: slippery slope or manageable terrain?
17
Miceli, M.P., and Mulvey, P.W. (2000) Consequences of satisfaction with pay systems: Two field studies. Industrial Relations. 39(1), 62-87.
Shaw J. D., and Gupta, N. (2001) Pay fairness and employee outcomes: Exacerbation and attenuation effects of financial need. Journal of Occupational and Organizational Psychology. 74(3), 299-320.
Simons, T., and Roberson, Q. (2003) Why managers should care about fairness: The effects of aggregate justice perceptions on organizational outcomes. Journal of Applied Psychology. 88(3), 432-443.
Tekleab, A.G., Bartol, K.M., and Liu, W. (2005) Is it pay levels or pay raises that matter to fairness and turnover? Journal of Organizational Behavior, 26: 899-921.