a report of a working group for the america 2050’s driving and flying.pdf · a report of a...
TRANSCRIPT

BEYOND DRIVING AND FLYING:
A REPORT OF A WORKING GROUP FOR THE
AMERICA 2050’S
STRATEGIC INVESTMENT FRAMEWORK
For Presentation at Pocantico Conference Center
December 10 – 12, 2008
1
INTRODUCTION
If one wishes to travel between metropolitan areas today there are, at least theoretically,
four choices – drive, fly, take a train, or take a bus. In fact, in many cases all four choices
may not be reasonable or even available options. Where distances are long, driving may
be too arduous and time consuming and flying too expensive. Where distances are short,
flying may be impractical, while drivers must face mounting highway congestion within
and between metropolitan areas. Meanwhile, the intercity rail option may be non-
existent, or it may be slow, infrequent or unreliable, a result of years of under-funding.
And the choice of intercity bus travel, while less expensive than flying or even the
railroad, faces the same relatively long, slow and unreliable options that the driver
experiences, albeit with someone else doing the driving. Thus, while driving or flying
exists as an option for travel between most metro areas, rail or bus is either non-existent
or woefully inadequate as a competitive choice in many markets.
This report presents a first vision of what might be done to remedy this imbalance by
designing and implementing a robust national network with emphasis on the intercity bus
and rail networks that could connect to metropolitan transit systems, thereby creating a
vibrant, multimodal and intermodal passenger system. To be sure there are steps that
should be taken to optimize all modes of intercity travel, including highway and air travel
which today carry the bulk of interstate travel.1
Steps to address the rail and bus networks will require addressing issues as to how we pay
for, price and manage all these other networks to create a multimodal and intermodal
system that meets the challenges of anticipated growth. And taken together, these four
modes of transportation can become a network of mobility that will benefit a nation
whose population will be approaching a half billion people by mid-century.
1 Today, there are approximately 700 million trips per year made by air, 600 million by intercity bus and 30 million by rail. Intercity auto trips are not counted, but that number is likely to exceed the other modes by many times.
2
WHY CHANGE?
Individuals today do not always have an alternative to flying that is less expensive and
more reliable or and an alternative to driving that is less time consuming, less stressful,
more reliable or that provides an opportunity to work, rest or read while traveling. And
they seldom have a reasonable option that is more reliable than today’s modes.
Intercity rail and intercity bus travel today do not always provide these options but they
each can.
• Rail and buses could and sometimes do provide relief to overcrowded airports and
airspace;
• Rail and buses are more energy efficient and produce fewer carbon-based
emissions than air or auto alternatives; and
• Rail, and particularly buses can serve smaller towns and smaller markets not
served by air; moreover, buses can supplement intercity rail to offer more
frequent service and connections to smaller towns and to local transit systems;
Both these modes can also offer benefits that go beyond the individual:
• They can provide an economic boost to cities, deter land consuming sprawl and
dampen vehicle travel growth in metropolitan areas with related social and equity
benefits to urban areas;
• They can save energy, reduce carbon emissions and lower the threat of global
warming; and
• Given the expected growth in population and employment in the Untied States –
possibly by as much as 50 percent between now and 2050, and in particular in the
megaregions, it is unrealistic and unwise to ignore the optimization of all modes
through both capacity and management measures.
BARRIERS
Even if there was full agreement on the premise of this paper that significant investments
in infrastructure and changes in current policies should be made to support intercity
3
passenger rail and bus travel, there are many barriers to the successful implementation of
such a strategy.
For rail travel these barriers include (with no pretense of suggesting that the order of
presentation represents their level of importance or any priority for addressing them):
1. Intercity passenger rail rights-of-way are shared with rail freight operations. Fully
97 percent of Amtrak used rights of way are owned by freight railroads. This
leads to less than ideal operations of passenger rail service, which often do not
have operational preference or the ability to upgrade the lines on which they
operate.
2. Related to this is the current mission of the federal agency in charge of federal
policy regarding rail service, the Federal Railroad Administration, which divides
its attention between the often competing needs of passenger and freight.
Moreover, they have traditionally been limited to a safety and security function
rather than long range planning.
3. Under-investment in passenger rail service has left Amtrak, the only intercity
passenger rail carrier in the United States today, with a backlog of capital
investment, including older rolling stock, out-of-date signals, aging rail, structures
and power supply subject to breakdowns, with resulting delays and unreliability.
4. The lack of rail capacity to absorb growth, most notably in the Northeast
Corridor, has resulted in Amtrak being unable to add capacity to handle
diversions from air travel.
5. There is an inability to plan for new or expanded services which cross state lines
because of the absence of appropriate institutional arrangements.
6. The competition between intercity rail and commuter rail services for track
capacity and preferences, where they often operate over the some track. Typically,
the commuter rail services have a higher volume of riders and higher frequency of
services, which puts intercity service at a disadvantage.
7. In many cities, particularly smaller ones, the withered state of the local transit
system puts intercity rail at a disadvantage for the last (or first) leg for local
connections for otherwise competitive trips by rail.

4
8. In a similar vein, the proximity of both the local transit systems and the intercity
bus terminal can be a problem that weakens mobility options and the value of
each mode for the other.
9. The vertical and horizontal alignments of the existing passenger rail rights-of-way
prevent increases in travel speed of service.
10. The capital and human cost of relocating passenger rail lines to make higher
speed service possible may be more than can be afforded or tolerated.
11. It is often difficult to make the case for intercity rail using standard cost-benefit
techniques. But progress has been made in spelling out many benefits that had
previously not been accounted for such as externalities related to mobility, the
environment, climate change, impact on future land uses, and equity should be
included in any analysis.
12. Funding for intercity rail projects is through the mechanism of separate funding
for Amtrak on an annual basis, each time subject to Congressional approval and
oversight. In contrast, funding for highways is distributed through a formula with
the project decisions decided on at the state level with minimal metropolitan level
oversight.
13. The justification for public investments in intercity rail (not unlike metropolitan
transit) undergoes a degree of public scrutiny not experienced by highway and air
modes of travel.
14. There is not now the travel demand data to develop credible market share models
for intercity travel. Data for rail and air is proprietary, for bus diffuse and
uncollected, and for auto trips it is non-existent
15. There is no widely held vision of what the intercity system could become.
Without this it is difficult to market a national network. A good point of
departure is the Federal Rail Administration HSR Corridors and the series of
maps created in “Vision for the Future: U.S. Intercity Passenger Rail Network
Through 2050” submitted to the National Surface Transportation Study
Commission by the Passenger Rail Working Group (PRWG).

5
Bus travel, while facing some of the same barriers as rail and also suffers from the
perception that it is a mode with lesser comfort and less relevance in addressing the
problems of intercity travel.
1. Bus terminals in center cities are often relegated to the unattractive and more
economically weakened locations and may be distant from rail stations, reducing
the opportunity for connecting between lines;
2. Similarly, terminals are not necessarily co-located with the nexus of the local
transit system;
3. Bus routes face mounting traffic congestion as they approach metropolitan
centers, and seldom have preferential treatments on the highways;
4. Where tolls are in place they are not relieved of that cost;
5. There is no governmental institutional voice for the bus industry nor a well
organized user group to press for improvements;
6. And as with rail, there is no vision of what an attractive, high amenity bus
network can become.
To be sure, some of this is changing as the bus industry modernizes. The success of bus
service in the Northeast Corridor, in the Midwest, and in California has come about with
new thinking and marketing. Private carriers are wooing customers who are increasingly
facing the unreliability of air and highway travel, and the infrequency or absence of rail
service with such amenities as internet access. The lower costs of these bus services can
be an excellent option for those who cannot afford either rail or air travel. Bus travel can
be especially relevant in smaller markets not served by air or without competitive rail
service, and can provide more frequent service than rail.
RECOMMENDED ACTIONS
In this paper we suggest actions that could be taken at the federal level to overcome the
barriers described here. Actions to overcome each of the barriers described above are
presented below. To put forth an illustrative a national vision two maps are presented,
one for rail and an illustrative one for intercity bus for the Piedmont mega-region to

6
demonstrate the possibilities for integrated rail and bus networks that focus on addressing
the growth expected in the mega-regions and beyond.
Passenger and Freight ROW Conflicts
Congress has gone a long way to addressing these conflicts with the passage of the
Passenger Rail Investment and Improvement Act of 2008. This law mandates
investigation of conflicts between passengers and freight rail and where these conflicts
arise the Surface Transportation Board must intervene. This process should go further by
such measures as temporal assignments, jointly controlled train operations, infrastructure
investments identified that are in the national interest and not assigned to either the
passenger or freight services. Congress should mandate that USDOT establish a
passenger and freight rail network, working with all interested parties that recognizes the
important role that both freight and intercity rail travel play in the nation, the existing and
potential size of markets, and the modal options to rail.
Federal Institutional Structure
An Office of Intercity and Intermodal Affairs should be established within the USDOT to
carry out this activity, with representation of the existing modal offices. This office
should also be assigned the task of address co-location issues among intercity rail, bus,
airports and local transit.
Funding
As a short–term measure the federal transportation bill now being considered should
identify a dedicated source of funds for Amtrak. In this way Amtrak could operate on a
multi-year basis to fund its capital program. The level of funding should be based on
bringing the existing Amtrak network to a state of good repair and maintenance and
system upgrade that allows Amtrak to bring its core network (to be defined) by 2020.
The federal match should be set as the same level as the highway and transit programs are
set. Where projects may benefit states disproportionately, a mechanism to allocate the
match in proportion to the benefit, perhaps by ridership, should be considered. Similarly,
7
funding to locate bus terminals more advantageously could also be included in an
intercity passenger dedicated funding source.
Funding for new intercity rail lines (in contrast to state of good repair and maintenance)
should be based on rigorous analysis of costs and benefits, but should include
externalities both positive and negative. This approach should also apply to projects
related to highway expansion and aviation system expansion. This will require a more
nuanced approach – a public benefit model – that acknowledges not only cost but energy
savings, decreased congestion (highway and air) decreased highway maintenance, among
others.
Rail travel speeds by market and rail segment should be established based on the
maximum market potential of rail based on distance, metropolitan area size and other
factors determined to impact market size such as existence of local transit service and
special market affinities. This too should account for externalities such as the
environment and economic benefit.
Where the potential for new service exceeds the current capacity to serve it, an analysis
of the full multimodal systems’ costs and benefits, including the use of new rights of way
or dramatically upgrading of the existing geometry, should be mandated by federal law.
The identification of the governmental role here in no way suggests that a private sector
role may not be possible. Private public partnerships should not be foreclosed,
notwithstanding that to date these efforts for transit have not led to successes.
Consideration of DBOM efforts should also be kept on the table. Funding that using
revenues generated in corridors by VMT fees may also be possible.
Institutional Barriers
An initial first step to address institutional barriers is found in H.R. 2095, which calls for
the Federal Railroad Administration to develop a national plan that is intended to

8
coordinate and integrate state rail plans. Issues of the appropriateness of the FRA and of
the incentives for states to cooperate remain.
The institutional barriers to planning multi-state rail projects and programs should be
addressed by establishing some equitable financial arrangement (see above) but also
through a program of incentives for the states to participate. This would be administered
(and the disagreements mediated) through the Office of Intermodal and Intercity Affairs,
which would hold “power of the purse-strings.”
Similarly the competition between intercity rail and commuter rail services can be
addressed by the Office of Intermodal and Intercity Affairs serving the same function.
To establish greater service and physical coordination between local and intercity
services, an Intermodal / Intercity program should be created to encourage interstate
compacts. Grants would have firm performance standards associated with them and
non-achievement would result in non-renewal in future years. A manual of best practices
would be written based on early success to help (and shame) the laggards.
The case for intercity rail in a corridor should be made on criteria beyond cost-
effectiveness. Both quantifiable and less quantifiable criteria should be included. These
should include mobility, the environment, climate change, and the impact on future land
uses, all not often accounted for now.
Data
Use the Bureau of Transportation Statistics as the institutional base, modeling the effort
through the National Personal Transportation Survey, design and carry out a data
collection effort to capture the necessary data by mode to enable the construction of a
model to estimate modal shares. This effort can be started by first collecting the data in
the Northeast Corridor and then proceed to other corridors. The bus companies and the
airlines, Amtrak, and the highway agencies would be assured that proprietary data will
9
not be revealed, but at the same time indicate that “a price will be paid” for failure to
cooperate.
VISION
The last section of this draft presents a Regional Plan Association analysis that refines the
findings of the Passenger Rail Working Group (PRWG) referenced earlier. The following
maps represent the illustrative network of new, upgraded, and existing rail links for an
intercity passenger rail network for the nation in 2050. The first map depicts the results
of city pair analyses in which criteria were used to build an index for the evaluation of
potential rail; markets. The second map presented here takes account of the FRA high
speed corridors and the recommendations of the PRWG and combines their results to
produce a composite map. A third map uses the Piedmont mega-region as an example as
to how the bus and rail network might be integrated to be mutually supportive.
The RPA mapping process began by selecting every incorporated place in the nation with
50,000 people or more. This yielded approximately 600 such places. Then city pairs
were creating by connecting each one of these 600 cities to every other city that was
between 100 and 500 miles from the originating city. This yielded approximately 27,000
city pairs. Eight distinct criteria were used to assess the potential viability of high speed
rail between these identified city pairs. These criteria were:
• City size: Each city was assigned 0 points if its population was under
100,000, 1 point for population of 100,000 – 500,000, 2 points for
population 500,000 – 1,500,000 and 3 points for population of over
1,500,000
• Metropolitan area size: Each city was assigned 0 points if the
metropolitan area in which is was located had a population of under
250,000, 1 point for population of 250,000 – 1,000,000, 2 points for
population 1,000,000 – 2,500,000 and 3 points for population of over
2,500,000
10
• Distance between city pairs: Each city pair was assigned a maximum of
2.5 points for a distance of 250 miles between cities. Awarded points fell
linearly for distances greater or less than 250 miles and fell to zero at 500
and 0 miles between cities
• Existence of transit: Cities were awarded 1 point each if it had a heavy
rail transit system, light rail transit, or commuter rail.
• Extent of transit system: Cities were awarded between 0 and 3 points
based on the extant (total number of miles) of its transit system.
• Metropolitan GDP: Each city pair was awarded between 0 and 3 points
based on the average of its combined GDP. City pairs were awarded 0
points for average per capita GDP less than $20,000 and 3 points of
average per capita GDP of greater than $70,000.
• Megaregion: Each city was awarded 1 point if it was located in a
megaregion
• TTI congestion index: Each city pair was awarded between 0 – 2.5 points
based on the average of their combined TTI congestion index as defined
by the Texas Transportation Institute
These criteria were weighted and then summed into an index that scored the city pairs
with the highest score representing the best potential market for high speed rail.2 This
index placed the heaviest weight on whether a city was the largest municipality within its
2 The equation used to calculate this index was: One half times whether the origin city has a light rail system (1, 0 for yes or no) plus one half times the length of the light rail system (0, 0.5, 1, 1.5) plus One half times whether the origin city has a heavy rail transit system (1, 0 for yes or no) plus one half times the length of the heavy rail transit system (0, 0.5, 1, 3) plus a scale representing the metropolitan population in which the origin city is located (0,1,2,3) plus ten times whether the origin city is the largest city in its metro area (1,0) plus a scaled number for origin city population (0,1,2,3) plus whether the origin city is in a megaregion (1,0) plus one half times whether the destination city has a light rail system (1, 0 for yes or no) plus one half times the length of the light rail system (0, 0.5, 1, 1.5) plus one half times whether the destination city has a heavy rail transit system (1, 0 for yes or no) plus one half times the length of the heavy rail transit system (0, 0.5, 1, 3) plus a scale representing the metropolitan population in which the destination city is located (0,1,2,3) plus ten times whether the destination city is the largest city in its metro area (1,0) plus a scaled number for destination city population (0,1,2,3) plus whether the origin city is in a megaregion (1,0) plus continuous scale for length of corridor which peaks at 2.5 at 250 miles and descends to 0 at 0 and 500 miles plus the combined gdp of the two metro regions (0, 0.5, 1, 1.5, 2, 2.5, 3) plus combined TTI index continuous scale, 0 – 2.275.
11
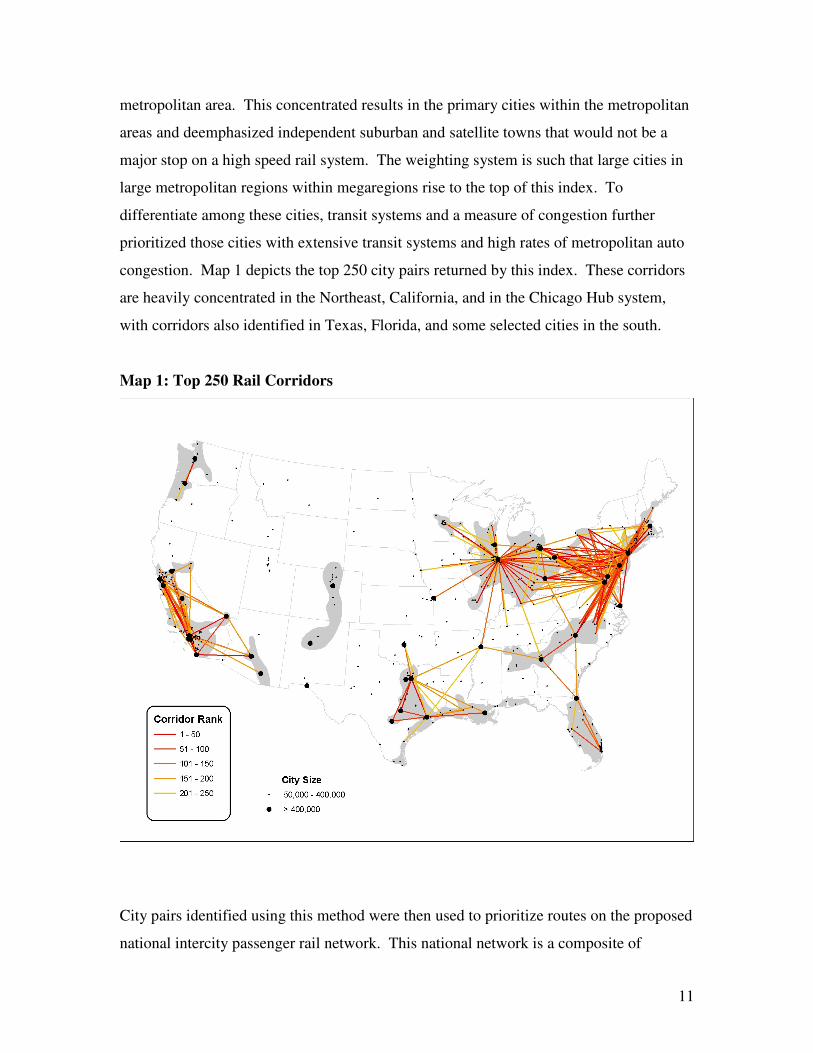
metropolitan area. This concentrated results in the primary cities within the metropolitan
areas and deemphasized independent suburban and satellite towns that would not be a
major stop on a high speed rail system. The weighting system is such that large cities in
large metropolitan regions within megaregions rise to the top of this index. To
differentiate among these cities, transit systems and a measure of congestion further
prioritized those cities with extensive transit systems and high rates of metropolitan auto
congestion. Map 1 depicts the top 250 city pairs returned by this index. These corridors
are heavily concentrated in the Northeast, California, and in the Chicago Hub system,
with corridors also identified in Texas, Florida, and some selected cities in the south.
Map 1: Top 250 Rail Corridors
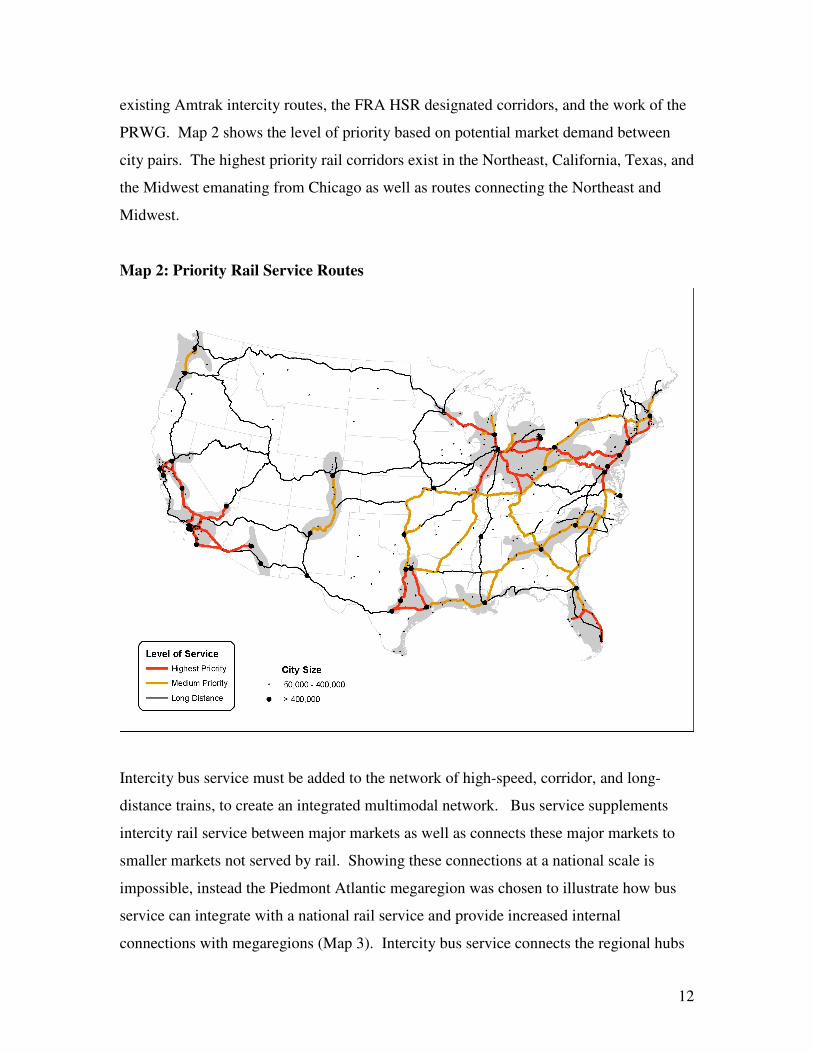
City pairs identified using this method were then used to prioritize routes on the proposed
national intercity passenger rail network. This national network is a composite of
12
existing Amtrak intercity routes, the FRA HSR designated corridors, and the work of the
PRWG. Map 2 shows the level of priority based on potential market demand between
city pairs. The highest priority rail corridors exist in the Northeast, California, Texas, and
the Midwest emanating from Chicago as well as routes connecting the Northeast and
Midwest.
Map 2: Priority Rail Service Routes
Intercity bus service must be added to the network of high-speed, corridor, and long-
distance trains, to create an integrated multimodal network. Bus service supplements
intercity rail service between major markets as well as connects these major markets to
smaller markets not served by rail. Showing these connections at a national scale is
impossible, instead the Piedmont Atlantic megaregion was chosen to illustrate how bus
service can integrate with a national rail service and provide increased internal
connections with megaregions (Map 3). Intercity bus service connects the regional hubs
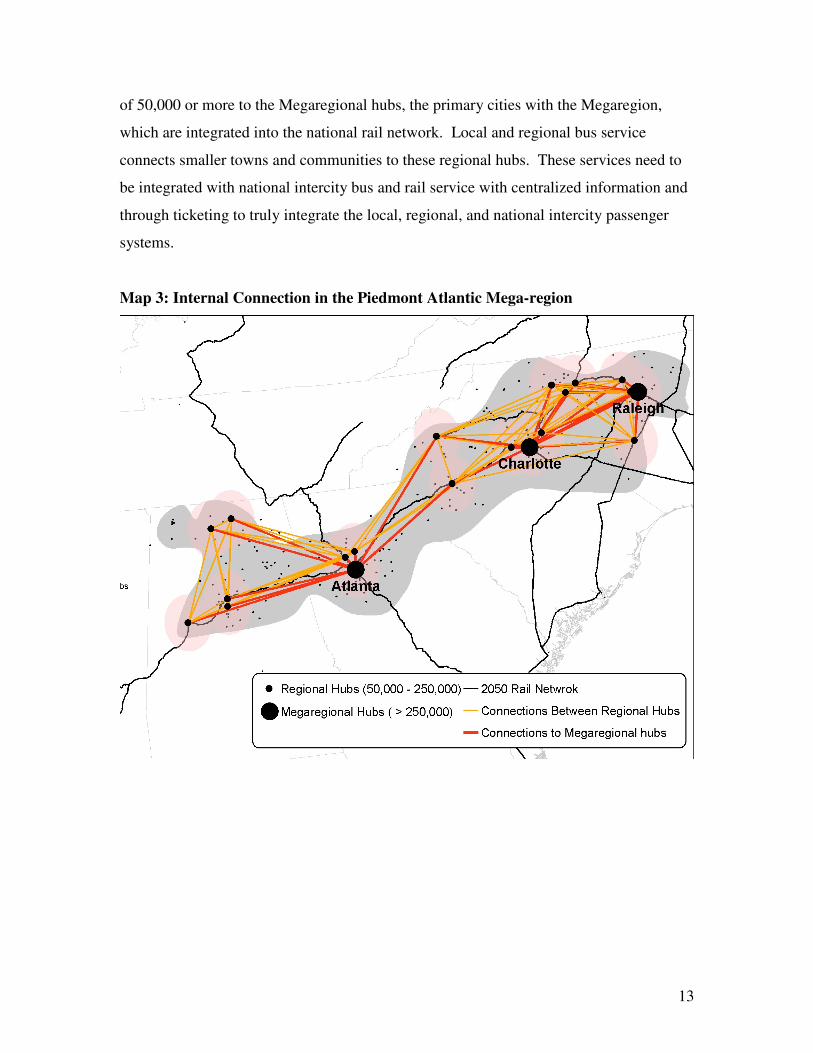
13
of 50,000 or more to the Megaregional hubs, the primary cities with the Megaregion,
which are integrated into the national rail network. Local and regional bus service
connects smaller towns and communities to these regional hubs. These services need to
be integrated with national intercity bus and rail service with centralized information and
through ticketing to truly integrate the local, regional, and national intercity passenger
systems.
Map 3: Internal Connection in the Piedmont Atlantic Mega-region