a report of the 24th northeast regional stock assessment workshop assessment …€¦ · ·...
TRANSCRIPT

Northeast Fisheries Science Center Reference Document 98-08
A Report of the 24th Northeast Regional Stock Assessment Workshop
Assessment of the Gulf of Maine
Atlantic Cod Stock for 1997
Ralph K. Mayo National Marine Fisheries Serv., Woods Hole, MA 02536
u.s. DEPARTMENT OF COMMERCE National Oceanic and Atmospheric Administration
National Marine Fisheries Service Northeast Region
Northeast Fisheries Science Center Woods Hole, Massachusetts
August 1998
The Northeast Fisheries Science Center Reference Document series comprises informal reports produced by the Center for timely transmission of results obtained through work at various Center laboratories. The reports are reviewed internally before publication, but are not considered formal literature. The National Marine Fisheries Service does not endorse any proprietary material, process, or product mentioned in these reports. To obtain additional copies of this report, contact: Research Communications Unit, Northeast Fisheries Science Center, Woods Hole, MA 02543-1026 (508-495-2260).
This report may be cited as: Mayo, R.K. 1998. Assessment of the Gulf of Maine Atlantic cod stock for 1997. Northeast Fish. Sci. Cent. Ref Doc. 98-08; 94 p. Available from: National Marine Fisheries Service, 166 Water Street, Woods Hole, MA 02543-1026.
The publication history of this report is as follows: manuscript submitted for review -- December 19, 1997; manuscript accepted through technical review -- May 11, 1998; manuscript accepted through policy review -- May 26,1998; and camera-ready copy submitted for pUblication - August 20,1998.
This report is a product of the 24th Northeast Regional Stock Assessment Workshop (24th SAW). Proceedings and products of the 24th SAW are scheduled to be documented and released as issues of the Northeast Fisheries Science Center Reference Document series. Tentative titles for the 24th SAW are:
An alternative stock assessment analysis for Gulf of Maine Atlantic cod
Assessment of the Georges Bank Atlantic cod stock for 1997
Assessment of the Gulf of Maine Atlantic cod stock for 1997
Assessment of the Southern New England yellowtail flounder stock for 1997
Evaluation of vessel logbook data for discard and catch-per-unit-of-effort (CPUE) estimates
Proration of 1994-96 commercial landings of Atlantic cod, haddock, and yellowtail flounder
Report of the 24th Northeast Regional Stock Assessment Workshop (24th SAW): Public Review Workshop
Report of the 24th Northeast Regional Stock Assessment Workshop (24th SAW): Stock Assessment Review Committee (SARC) consensus summary of assessments
Stock assessment of Georges Bank yellowtail flounder for 1997
Ten-year projections of landings, spawning stock biomass, and recruitment for the five groundfish stocks considered at the 24th Northeast Regional Stock Assessment Workshop (24th SAW)
U.S. assessment of the Georges Bank haddock stock, 1997
TABLE OF CONTENTS
ABSTRACT
INTRODUCTION
THE FISHERY
Commercial Fishery Landings Commercial Fishery Discards Recreational Fishery Catches
Commercial Fishery Sampling Intensity Commercial Landings Age Composition Commercial Landings Mean Weights at Age
Recreational Fishery Sampling Intensity Recreational Landings Age Composition Recreational Landings Mean Weights at Age
STOCK ABUNDANCE and BIOMASS INDICES
Commercial Catch Rates
The 1982-1993 Series The 1994-1996 Series
Trends in LPUE and Effort Research Vessel Survey Indices
MORTALITY
Total Mortality Estimates Natural Mortality
ESTIMATION of FISHING MORTALITY RATES and STOCK SIZE
Virtual Population Analysis Calibration Virtual Population Analysis Results Precision of F and SSB Retrospective Analyses
111
v
I
2
2 2 3
3 3 4
5 5 5
6
6
6 6
7 8
10
.10 10
10
10 12 13 13

TABLE OF CONTENTS (Continued)
YIELD and SPAWNING STOCK BIOMASS per RECRUIT
SHORT and MEDIUM-TERM PROJECTIONS
Short-Term Projection Results Medium-Term Projection Results
CONCLUSIONS
ACKNOWLEDGEMENTS
LITERATURE CITED
iv
14
14
14 15
15
16
16
ABSTRACT
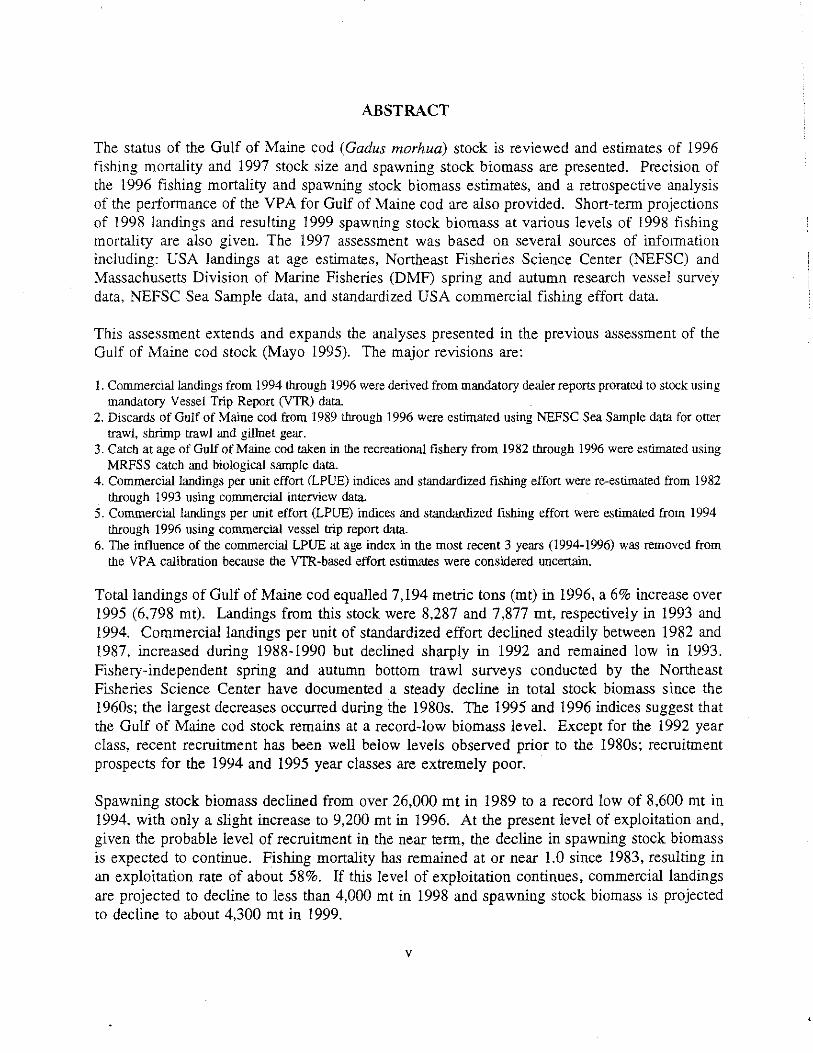
The status of the Gulf of Maine cod (Gadus morhua) stock is reviewed and estimates of 1996 fishing mortality and 1997 stock size and spawning stock biomass are presented. Precision of the 1996 fishing mortality and spawning stock biomass estimates, and a retrospective analysis of the performance of the VPA for Gulf of Maine cod are also provided. Short-term projections of 1998 landings and resulting 1999 spawning stock biomass at various levels of 1998 fishing mortality are also given. The 1997 assessment was based on several sources of information including: USA landings at age estimates, Northeast Fisheries Science Center (NEFSC) and Massachusetts Division of Marine Fisheries (DMF) spring and autumn research vessel survey data, NEFSC Sea Sample data, and standardized USA commercial fishing effort data.
This assessment extends and expands the analyses presented in the previous assessment of the Gulf of Maine cod stock (Mayo 1995). The major revisions are:
L Commercial landings from 1994 through 1996 were derived from mandatory dealer reports prorated to stock using mandatory Vessel Trip Report (VTR) data.
2. Discards of Gulf of Maine cod from 1989 through 1996 were estimated using NEFSC Sea Sample data for otter trawl, shrimp trawl and gillnet gear.
3. Catch at age of Gulf of Maine cod taken in the recreational fishery from 1982 through 1996 were estimated using MRFSS catch and biological sample data.
4. Commercial landings per unit effort (LPUE) indices and standardized fishing effort were re-estimated from 1982 through 1993 using commercial interview data.
5. Commercial landings per unit effort (LPUE) indices and standardized fishing effort were estimated from 1994 through 1996 using commercial vessel trip report data.
6. The influence of the commercial LPUE at age index in the most recent 3 years (1994-1996) was removed from the VPA calibration because the VTR-based effort estimates were considered uncertain.
Total landings of Gulf of Maine cod equalled 7,194 metric tons (mt) in 1996, a 6% increase over 1995 (6,798 mt). Landings from this stock were 8,287 and 7,877 mt, respectively in 1993 and 1994. Commercial landings per unit of standardized effort declined steadily between 1982 and 1987, increased during 1988-1990 but declined sharply in 1992 and remained low in 1993. Fishery-independent spring and autumn bottom trawl surveys conducted by the Northeast Fisheries Science Center have documented a steady decline in total stock biomass since the 1960s; the largest decreases occurred during the 1980s. The 1995 and 1996 indices suggest that the Gulf of Maine cod stock remains at a record-low biomass leveL Except for the 1992 year class, recent recruitment has been well below levels observed prior to the 1980s; recruitment prospects for the 1994 and 1995 year classes are extremely poor.
Spawning stock biomass declined from over 26,000 mt in 1989 to a record low of 8,600 mt in 1994, with only a slight increase to 9,200 mt in 1996. At the present level of exploitation and, given the probable level of recruitment in the near term, the decline in spawning stock biomass is expected to continue. Fishing mortality has remained at or near l.0 since 1983, resulting in an exploitation rate of about 58%. If this level of exploitation continues, commercial landings are projected to decline to less than 4,000 mt in 1998 and spawning stock biomass is projected to decline to about 4,300 mt in 1999.
v
"

INTRODUCTION
Atlantic cod (Gadus morhua) in the Gulf of Maine region have been commercially exploited since the 17th century, and reliable landings statistics are available since 1893. Historically, the Gulf of Maine fishery can be separated into four periods (Figure I): (1) an early era from 1893-1915 in which record-high landings (> 17 ,000 mt) in 1895 and 1906 were followed by about 10 years of sharply-reduced catches; (2) a later period from 1916-1940 in which annual landings were relatively stable, fluctuating between 5,000 - 11,500 mt and averaging 8,300 mt per year; (3) a period from 1941-1963.whenlandings sharply increased (1945: 14,500 mt) and then rapidly decreased, reaching a record-low of 2,600 mt in 1957; and (4) the most recent period from 1964 onward during which Gulf of Maine landings have generally increased. Total landings doubled between 1964 and 1968, doubled again between 1968 and 1977, and averaged 12,200 mt per year during 1976-1985 (Table 1). Although Gulf of Maine landings declined between 1984 and 1987, landings subsequently increased, reaching 17,800 mt in 1991, the highest level since the early 1900s. Total landings declined sharply in 1992 to 10,891 mt, decreased further in 1993 to 8,287 mt, and have remained approximately within the 7,000-8,000 mt range during 1994-1996.
This report presents an updated and revised analytical assessment of the Gulf of Maine cod stock (NAFO Division 5Y) for the period 1982-1996 based on analyses of commercial and research vessel survey data through 1996. From the early 1960s through 1993, information on the catch quantity by market category was derived from reports of landings transactions submitted voluntarily by processors and dealers. More detailed data on fishing effort and location of fishing activity were obtained for a subset of trips from personal interviews of fishing captains conducted by port agents in the major ports of the Northeast. Information acquired during the course of these interviews was used to augment the total catch information obtained from the dealer. After 1993, however, procedures for collecting and processing commercial fishery data in the Northeast were substantially revised.
Beginning in 1994, information on fishing effort and catch location was no longer obtained from personal interviews of fishing captains. Instead, data on number of hauls, average haul time, and catch locale were obtained from logbooks submitted to National Marine Fisheries Service (NMFS) by operators fishing for groundfish in the Northeast under a mandatory reporting program. Estimates of total catch by species and market category were derived from mandatory dealer reports submitted on a trip basis to NMFS. Catches by market category were allocated to stock based on a matched subset of trips between the dealer and logbook databases. Data in both databases were stratified by calendar quarter, port group, and gear group to form a pool of observations from which proportions of catch by stock could be allocated to market category within the matched subset. The cross-products of the market category by stock proportions derived from the matched subset were employed to compute the total catch by stock, market category, calendar quarter, port group and gear group in the full dealer database. A full description of the proration methodology and an evaluation of the 1994-1996 logbook data is given in Wigley et al. (1997) and DeLong et al. (MS 1997), and a description of data entty and auditing procedures is provided by Power et al. (MS 1997).
An initial analytical assessment of this stock was presented at the Seventh NEFC Stock Assessment Workshop in November 1988 (NEFC 1989) and subsequent revisions were presented at the 12th, 15th, and 19th Northeast Regional Stock Assessment Workshops in June 1991, December 1992, and December 1994 (NEFSC 1991,1993, 1995; Mayo et al. 1993; Mayo 1995).
1
"

THE FISHERY
Commercial Fishery Landings - Annual commercial landings data for Gulf of Maine cod in years prior to 1994 were obtained from trip-level detailed landings records contained in master data tiles maintained by the Northeast Fisheries Science Center, Woods Hole, Massachusetts (1963-1993) and from summary reports of the Bureau of Commercial Fisheries and its predecessor the U.S. Fish Commission (1895-1962). Beginning in 1994, landings estimates were derived from dealer reports prorated to stock based on the distribution of reported landed catch contained in fishing vessel logbooks as described above.
Total commercial landings in 1996 were 7,194 mt, 6% greater than in 1995, but 60% less than the 1991 peak (Table 1). Since 1977, the USA fishery has accounted for all of the commercial catch. Canadian landings reported as Gulf of Maine catch during 1977-1990 are believed by Canadian scientists to be misreported catches from the Scotian Shelf stock (Campana and Simon 1985; Campana and Hame11990). Although otter trawl catches account for most of the landings (56% by weight in 1996), the quantity taken by gill nets increased to over 40% in 1994 and 1995 from a low of 23% in 1991; the 1996 gill net percentage was similar to 1987-1989 (Table 2).
Commercial Fishery Discards - Discard rates were calculated by quarter and gear from NEFSC sea sampling data collected between 1989 and 1996 (Table 3). Discard and kept components of the catch were summed for all observed tows, within each gear type, occurring in Division 5Y, and the ratio of the discarded to kept quantity was applied to landings for the corresponding quarter and gear type within each year. Data were available for otter trawls, shrimp trawls and sink gill nets. Calculations and sample sizes are given in Appendix l:Tables 1-3 and Figures 1-3.
Discard to kept ratios and absolute quantities were highest in 1989 and 1990 for the otter trawl and shrimp trawl gear. Ratios in the otter trawl fishery declined from 0.30-0.60 in 1989 .and 1990 and remained low through 1996, fluctuating between 0.002 and 0.155. In the shrimp trawl fishery, ratios remained high throughout 1989-1991, but declined substantially in 1992 and remained negligible in 1993. Sea sampling data for 1994-1996 were minimal; therefore, landings by this gear component were not distinguished from all other otter trawls in the proration scheme employed to derive the landings by stock for the present assessment. Consequently, discard estimates from both otter trawl and shrimp trawl gear were combined for the 1994-1996 period.
Discards of Gulf of Maine cod ranged from 176 mt in 1996 to 3,599 mt in 1990 (Table 3). Discards exceeded 1,000 mt in each year between 1989 and 1991 before declining steadily since 1992. The relatively high discard rates calculated for otter trawl and shrimp trawl gear during 1989~1991 coincide with recruitment of the strong 1987 year class to the small mesh shrimp trawl gear and then the large mesh general otter trawl gear. Available length composition data for these gear types suggest that most of the discarded cod were about 30-50 cm with a mode around 40 cm. Discards emanating from these two gears are the likely result of minimum size regulations. In contrast, the relatively low, but persistent, discards of cod in the gill net fishery comprised fish of all sizes, up to 125 cm. The larger size range reflects discarding resulting from minimum size regulations as well as poor fish quality (in the case of the larger, marketable cod).
2

Recreational Fishery Catches - Estimates of the recreational cod catch were derived from the Marine Recreational Fishery Statistics Survey (MRFSS) conducted annually since 1979. The Gulf of Maine cod catch was estimated assuming that catches of cod recorded by that portion of the intercept survey were removed from the ocean in statistical areas adjacent to the state or county of landing. The MRFSS database has been recently revised, resulting in adjusted catch estimates for the years 1981 through 1996. Revised estimates of the total Gulf of Maine cod recreational catch as well as the portion of the catch excluding those caught and released are provided in Table 4. Information on the catch prior to 1981, which has not been revised, is included in Table 4 to provide a longer-term perspective. Further information on the details of the allocation scheme and sampling intensity are given in NEFSC (1992).
The quantity of cod retained generally exceeded 75% of the total recreational catch from 1979 through 1991, but has averaged less than 50% since 1992. The estimated total recreational cod catch declined from over 5,000 mt in 1980 and 1981 to less than 2,000 mt between 1983 and 1986, increased to over 3,500 mt in 1990 and 1991 and has fluctuated between 1,200 and 2,600 mt since 1992.
Commercial Fishery Sampling Intensity - A summary of USA length frequency and age sampling of Gulf of Maine cod landings during 1982-1996 is presented in Table 5. USA length frequency sampling averaged one sample per 155-200 mt landed during 1983-1987 but the sampling intensity was reduced in 1990 (1 sample per 387 mt) and 1993 (1 sample per 360 mt), and the absolute level of sampling was extremely low in 1993. Overall sampling improved slightly in 1994 and 1995, but the seasonal distribution was uneven and poorly matched to the landings. Sampling improved substantially in 1996, reaching an all-time high in terms of both absolute number of samples and samples per ton landed.
Virtually all of the USA samples have been taken from otter trawl landings, but sampling and the estimation of length composition is stratified by market category (scrod, market, and large). Although the length composition of cod differs among gear types (primarily between otter trawl and gillnet), the length composition of cod landings within each market category is virtually identical among gear types. Of the 77 samples collected in 1996, 27 were scrod samples (35%), 38 were market (49%), and 12 were large (16%). Compared with the 1996 market category landings distribution by weight (scrod: 23%; market: 61 %; large: 13%) (Table 6), sampling in "", 1996 reasonably approximated the market category distribution of the landings.
Commercial Landings Age Composition - The age composition of landings during 1982-1993 was estimated, by market category, from monthly length frequency and age samples, pooled by calendar quarter. Quarterly mean weights, by market category, were obtained by applying the NEFSC research vessel survey length-weight equation for cod:
In Weight (kg,a,,) == -11.7231 + 3.0521 In Length (,m)
to the quarterly market category sample length frequencies. Computed mean weights were then divided into quarterly market category landed weight to derive estimated numbers landed by
3
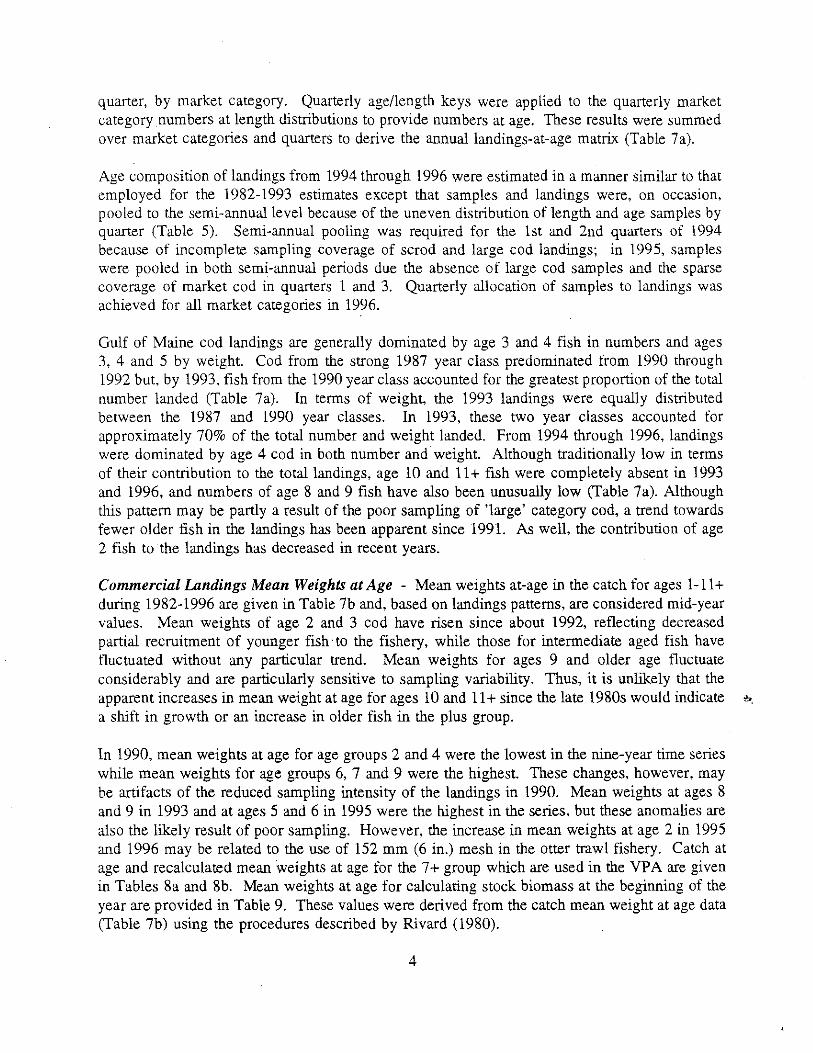
quarter, by market category. Quarterly age/length keys were applied to the quarterly market category numbers at length distributions to provide numbers at age. These results were summed over market categories and quarters to derive the annuallandings-at-age matrix (Table 7a).
Age composition of landings from 1994 through 1996 were estimated in a manner similar to that employed for the 1982-1993 estimates except that samples and landings were, on occasion, pooled to the semi-annual level because of the uneven distribution of length and age samples by quarter (Table 5). Semi-annual pooling was required for the 1st and 2nd quarters of 1994 because of incomplete sampling coverage of scrod and large cod landings; in 1995, samples were pooled in both semi-annual periods due the absence of large cod samples and the sparse coverage of market cod in quarters 1 and 3. Quarterly allocation of samples to landings was achieved for all market categories in 1996.
Gulf of Maine cod landings are generally dominated by age 3 and 4 fish in numbers and ages 3, 4 and 5 by weight. Cod from the strong 1987 year class predominated from 1990 through 1992 but. by 1993, fish from the 1990 year class accounted for the greatest proportion of the total number landed (Table 7a). In terms of weight, the 1993 landings were equally distributed between the 1987 and 1990 year classes. In 1993, these two year classes accounted for approximately 70% of the total number and weight landed. From 1994 through 1996, landings were dominated by age 4 cod in both number and· weight. Although traditionally low in terms of their contribution to the total landings, age 10 and 1l + fish were completely absent in 1993 and 1996, and numbers of age 8 and 9 fish have also been unusually low (Table 7a). Although this pattern may be partly a result of the poor sampling of 'large' category cod, a trend towards fewer older fish in the landings has been apparent since 1991. As well, the contribution of age 2 fish to the landings has decreased in recent years.
Commercial Landings Mean Weights at Age - Mean weights at-age in the catch for ages 1-11+ during 1982-1996 are given in Table 7b and, based on landings patterns, are considered mid-year values. Mean weights of age 2 and 3 cod have risen since about 1992, reflecting decreased partial recruitment of younger fish, to the fishery, while those for intermediate aged fish have t1uctuated without any particular trend. Mean weights for ages 9 and older age fluctuate considerably and are particularly sensitive to sampling variability. Thus, it is unlikely that the apparent increases in mean weight at age for ages 10 and 11 + since the late 1980s would indicate "'. a shift in growth or an increase in older fish in the plus group.
In 1990, mean weights at age for age groups 2 and 4 were the lowest in the nine-year time series while mean weights for age groups 6, 7 and 9 were the highest. These changes, however, may be artifacts of the reduced sampling intensity of the landings in 1990. Mean weights at ages 8 and 9 in 1993 and at ages 5 and 6 in 1995 were the highest in the series, but these anomalies are also the likely result of poor sampling. However, the increase in mean weights at age 2 in 1995 and 1996 may be related to the use of 152 mm (6 in.) mesh in the otter trawl fishery. Catch at age and recalculated mean weights at age for the 7+ group which are used in the VPA are given in Tables 8a and 8b. Mean weights at age for calculating stock biomass at the beginning of the year are provided in Table 9. These values were derived from the catch mean weight at age data (Table 7b) using the procedures described by Rivard (1980).
4

Recreational Fishery Sampling Intensity - Infonnation on the length frequency sampling levels of Gulf of Maine cod taken in the recreational fishery is provided in Table 4. An examination of the available length frequency sampling coverage was conducted to evaluate the potential utility of these data in estimating the overall length composition of the recreational cod catch. Overall, sampling for cod taken by recreational gear is poor, averaging less than I sample per 1.000 mt removed (Table 4). The length composition data, however, provide a general indication of the size composition of the catch. Length frequency sample data, summarized by wave and fishing mode over the 16-year period from 1981-1996, display only minor variation among seasons and fishing modes. Most cod caught are in the 40-70 cm range, with few fish larger than 100 cm. Length frequency data are available only for fishing modes 6 and 7 and waves 2 through 6 (March-December). These data, in conjunction with estimates of mean weight of the catch, indicate that cod taken in the recreational fishery are generally smaller, on average, than those taken by the commercial sector. The mean weights of cod taken in the recreational fishery (1.5-2.0 kg; Table 4) are comparable to those of age 2-3 cod in the commercial landings, or approximately equal to the mean weight of the scrod market category.
Recreational Landings Age Composition - Given the limited sampling coverage in this sector of the fishery, estimation of numbers caught by length and age required that samples be pooled on an annual basis. The low inter-seasonal variability displayed by the sample length composition data supports this approach. Differences between fishing modes 6 and 7 are also minimal. Therefore, estimates of the age composition of recreationally caught cod were derived from the length composition data applied to the retained number of cod based on pooled annual length frequency samples from Gulf of Maine trips. Only the retained cod were included because the intercept sampling does not accurately reflect the size composition of the released cod. Agelength keys obtained from sampling the commercial landings, augmented by age samples from NEFSC bottom trawl surveys for cod less than 40 cm, were applied to the number retained at length on an annual basis to derive the number retained at age (Table lOa).
Between 1982 and 1988, the Gulf of Maine cod recreational catch in number was dominated by age 3 fish, with age 2 fish next in importance. Since 1989, however, ages 3 and 4 cod dominated the catches. The strong 1987 year class dominated the catch in 1990, 1991 and 1992, at ages 3, 4 and 5, respectively. Age 3 and 4 cod generally predominated in tenns of weight caught, although the 1987 year class was dominant in 1992 at age 5. The 1982-1988 pattern represents a one age downward shift compared to the commercial landings at age, whereas the age composition since 1989 is more consistent with the commercial age composition. The earlier differences may reflect gear selectivity and the spatial distribution of the commercial and recreational fishing effort. The contribution of age 1 cod has become negligible in recent years.
Recreational Landings Mean Weights at Age Mean lengths and weights at age of recreationally-caught cod (Table lOb) were consistently lower than those taken in the commercial fishery. This pattern persists through age 5 but, for ages 6 and older, mean weights are highly variable due to the relatively poor sampling of fish at the larger sizes, combined with the lack of market category stratification.
5
STOCK ABUNDANCE and BIOMASS INDICES
Commercial Catch Rates - USA commercial LPUE indices (landings per unit effort, expressed in metric tons landed per day fished) were calculated from otter trawl trips landing cod from the Gulf of Maine (Division 5Y) between 1982 and 1996. Due to the change in data collection procedures implemented in 1994, methods employed to compute LPUE for the 1994-1996 period differed from those used to compute indices from 1982-1993.
The 1982-1993 Series - Standardized effort and LPUE series for Gulf of Maine cod for the period prior to 1994 were developed for a sub-fleet by applying a five-factor (year, area, quarter, tonnage class and depth) General Linear Model (GLM) to log LPUE data derived for all interviewed otter trawl trips taking cod from 1982 through 1993. Details regarding data selection and preparation and model formulation are provided by Mayo et al. (1994).
Effort standardization factors employed in the previous Gulf of Maine cod assessment were based on a GLM using data from 1982 through 1992. Standardized effort for the 1982 period and for 1993 were derived from the cross products of year, area, quarter, tonnage class and depth cell coefficients corresponding to the 1982-1992 period. For the present assessment, cell coefficients were re-computed using the same GLM formulation based on data from 1982 through 1993 inclusive. During the course of this analysis, it was discovered that a coefficient for one level of one factor (tonnage class 32) was mis-specified in the effort standardization software. The class 32 coefficient of 2.35 (Mayo 1995; Table 13) was erroneously entered as 0.55. When the previous effort analysis was re-run with the correct entry, the resulting effort series increased by about 22% across all years, i.e., standardized effort was re-scaled up by 22%. The impact of this change on the VPA outcome was minimal since the temporal pattern of LPUE was similar: terminal F in 1993 increased from 0.93 to 0.94 (1 %), terminal population estimates decreased by a corresponding amount, and coefficients of variation of the population estimates remained unchanged.
The 1994-1996 Series Beginning in 1994, information on fishing effort was no longer obtained from personal interviews of fishing captains. Instead, effort data for the 1994-1996 period were obtained from NMFS Northeast Region Vessel Trip Report (VTR) databases which were subjected to preliminary audits on selected fields (Power et al. MS 1997). These logbook data were extracted from the same database used to prorate total landings by stock. Fishing effort from otter trawl trips landing Gulf of Maine cod was computed from logbook records in which cod were reported from locations within Division 5Y. Effort in terms of days fished was computed as the product of the reported average haul time and the total number of hauls, converted to 24 hour days. Filtering of suspected outliers was performed. Trip data were aggregated in the same manner as the 1982-1993 interview records, i.e., by year, area, quarter, tonnage class and depth categories. Nominal effort for 1994-1996 was then adjusted by the cell cross products derived from the 1982-1993 GLM results to produce the standardized effort and LPUE series for this period.
6

Trends in LPUE and Fishing Effort - The LPUE analysis presented in previous assessments using' calculated effort' from cod trips weighted by catch within tonnage class was discontinued in the present assessment. However, previous information on the proportion of ' directed' cod trips, in which cod comprised 50% or more of the total trip catch by weight, and the catchweighted LPUE series based on all cod trips was retained to provide an historic perspective.
Directed trips have generally accounted for less than 45% (and as low as 14%) of USA Gulf of Maine otter trawl landings of cod but after 1987 'directed trips' began to account for an increasing percentage of the total catch (Table 11). The fraction of the otter trawl catch taken on 'directed trips' increased from 15% of the total in 1987 to 71 % in 1991. The 'directivity' of the otter trawl fishery declined in 1992 and 1993 to about 50%. The temporary increase in directivity, which peaked in 1991, is the likely result of the dominant innuence of the unusually strong 1987 year class in the fishery. This suggests that the very high 1990 and 1991 total LPUE indices were rather innated due to a marked change in tleet ' directivity'. This trend is apparent within and among all vessel class categories, but was particularly evident in class 4 (Mayo 1995).
Calculated LPUE values based on catch-weighted effort, within vessel tonnage class, increased during the late 1960s, declined during the early 1970s, sharply increased in 1974, and then stabilized during 1975-1983 at a relatively high level (Table 12). After 1983, LPUE indices tended downward, reaching record-low levels in 1987. The LPUE index increased between 1988 and 1991, attaining its highest value since 1977 (among the highest in the time-series). In 1992 and 1993, LPUE declined sharply, approaching the lowest on record in 1993. In terms of calculated effort (total landings/LPUE index), total fishing effort reached a record-high level in 1987, declined from 1988 to 1990, and has since increased well above the 1990 level (Table 12). To the extent that the 1990 and 1991 total LPUE indices were innated (due to increased neet 'directivity' for cod), the calculated effort values for 1990 and 1991 are underestimated. Therefore, the total calculated effort on Gulf of Maine cod since 1984 appears to have remained at a consistently high level relative to the 1960s and 1970s.
The updated 1982-1993 general linear model accounted for just under 25% of the total sum of squares variation in LPUE, and all five factors were highly significant (Table 13). For each year between 1982 and 1993, standardized effort in each area-quarter-tonnage class-depth category was estimated by multiplying the sum of the nominal effort for that cell by the product of the retransformed GLM coefficients for each factor. The estimated standardized sub-neet effort was then accumulated over all categories to provide annual estimates as given in Table 14. Total standardized effort was calculated by raising the sub-neet effort to account for all cod landings.
The 1982-1993 age composition of the landings corresponding to the effort sub-neet as presented by Mayo et al. (1994) was used with the updated standardized effort estimates to calculate a revised LPUE at age index. Numbers landed at age were estimated by applying quarterly commercial age-length keys to quarterly commercial numbers landed at length by market category. The LPUE at age indices were derived by dividing the estimated numbers landed at age by corresponding 1982 through 1993 standardized ftshing effort. Further details regarding data selection, preparation and estimation procedures are provided in Mayo et al. (1994).
7
Standardized fishing effort increased during the 1980s with peak effort occurring in 1987. Effort declined thereafter and remained variable between 1991 and 1993 (Table 14, Figure 2). As well, standardized LPUE declined gradually between 1982 and 1987, increased steadily until 1990 and then declined sharply by about 50-60% between 1991 and 1993 (Table 14, Figure 3). Over the 1982-1993 period, when both series were available, standardized LPUE and the weighted average LPUE based on all cod trips were rather consistent in both scale and trend (Figure 3).
Estimated standardized effort increased sharply in 1994, but declined thereafter, returning to pre-1994 levels by 1996. The abrupt increase in the 1994 raised effort (Figure 2) reflected a corresponding increase in the observed nominal and estimated standardized effort in the otter trawl sub-fleet (Table 14). The reported landings for the corresponding VTR trips declined sharply in 1994, however, resulting in a substantial decrease in the ratio of landings to nominal effort and the consequent standardized LPUE index. The sharp increase in raised effort occurred when the low sub-fleet LPUE index was raised to total landings. Standardized LPUE gradually increased over the 1994-1996 period, but remained well below the 1993 LPUE index (Figure 3).
The reasons for this dramatic one-year increase in estimated effort in 1994, followed by a more gradual decline in 1995 and 1996 may be related to changes in reporting methods, use of unaudited effort fields in the VTR data sets, or a change in the relationship between otter trawl LPUE and fixed gear LPUE. In the VTR data, effort is recorded in two fields, number of hauls and average haul duration. Trip effort must then be computed as the product of these factors. If either field is misinterpreted or entered incorrectly, the resulting effort estimate for the trip may be in error. A preliminary scan of the effort fields revealed some very large outliers. Consequently, data included in the effort calculations were restricted to computed effort of 12 days fished or less per trip. Analyses of the 1994-1996 computed effort per trip by DeLong et al. (MS 1997) indicated an abrupt shift in the distribution of 1994-1996 LPUE values towards a greater frequency of low LPUE and low effort trips compared to the 1991-1993 period.
As well, it is not known whether the landings reported in the VTR data reflect whole or eviscerated weights. Estimates of standardized effort and LPUE for 1994-1996 provided in Figures 2 and 3 were derived to account for either assumption: i.e., the higher LPUE and lower estimates of effort correspond to the assumption that the kept portion of the catch reported on VTR records reflected fish in eviscerated condition. Given the uncertainty about the effort data in the VTR data sets, estimates of effort and LPUE for 1994-1996 must be considered provisional, and further analyses of the VTR-based estimates of LPUE in relation to the interview-based estimates are required.
Research Vessel Survey Indices - Indices of cod abundance (stratified mean catch per tow in numbers) and biomass (stratified mean weight per tow in kilograms), developed from Northeast Fisheries Science Center (NEFSC) and Commonwealth of Massachusetts Division od Marine Fisheries (DMF) research vessel bottom trawl survey data, have been used to monitor changes and assess trends in population size and recruitment of cod popUlations off New England. Offshore (> 27 m) stratified random NEFSC surveys have been conducted annually in the Gulf of Maine in autumn since 1963 and in spring since 1968. Inshore areas of the Gulf of Maine «
8
27 m) have been sampled during spring and autumn NEFSC and DMF inshore bottom trawl surveys since 1978. For the NEFSC surveys, a "36 Yankee" trawl has been the standard sampling gear except for the spring 1973-1981 period when a modified "41 Yankee" trawl was used.
Prior to 1985, BMV oval doors (550 kg) were used in all NEFSC surveys; since 1985, Portuguese polyvalent doors (450 kg) have been used. Details on NEFSC survey sampling design and procedures are provided in Azarovitz (1981) and Clark (1981). The DMF inshore bottom trawl sampling program is described in Howe et al. (1981). No adjustments in the survey catch per tow data for cod have been made for any of the trawl differences, but vessel and door coefficients have been applied to adjust the stratified means (number and weight per tow) as described in Table 15. Unadjusted catch per tow (number) at age indices from NEFSC spring and autumn surveys are listed in Appendix 2:Table 1 and standardized catch per tow (number) at age indices are listed in Appendix 2:Table 2. Catch per tow (number) at age indices from Massachusetts spring and autumn surveys are listed in Appendix 2:Table 3.
NEFSC spring and autumn offshore catch per tow indices for Gulf of Maine cod have generally exhibited similar trends throughout the survey time series (Table 15, Figure 4). Number per tow indices declined during the mid- and late 1960s but since 1972-73 have fluctuated as a result of a series of recruitment pulses. Sharp increases in the number per tow indices reflect above average recruitment of the 1971, 1973, 1977-1980, 1983, and 1985-1987 year classes at ages 1 and 2 (Appendix 2:Table 2, Figure 5). The sequential dominance of these cohorts at older ages can be discerned from number per tow at age values in both spring and autumn NEFSC surveys (Appendix 2:Table 2).
Spring NEFSC number per tow indices have remained relatively low since 1985 at a level below the 1981-1984 average (Table 15); spring weight per tow indices have also remained relatively low through 1991 but the index increased substantially in 1992, and remained relatively high in 1993, due to a large contribution from the 1987 year class (Appendix 2:Table 2). The index declined markedly in 1994, remained low in 1995 and increased moderately in 1996. Autumn number and weight per tow indices declined sharply in 1991 to unprecedented low levels; weight per tow continued to decline to record low levels through 1993 and has remained extremely low through 1996 (Figure 4). Increased abundance in 1988 and 1989, resulting from recruitment of the strong 1986 and 1987 year classes, were depleted by 1991, resulting in the sharp declines in the overall index. This reduction, combined with a general paucity of large fish in the surveys in recent years (Appendix 2:Table 2) has resulted in the decline and persistence of low weight per tow indices since 1991. Overall, the 1987 year class appears to have been one of the strongest ever produced; catch per tow indices of this cohort at ages 1-3 in the NEFSC autumn surveys and at ages 0 and 1 in the Massachusetts DMF autumn inshore surveys were nearly all record-high values (Appendix 2:Tables 2 and 3). Based on Massachusetts DMF and NEFSC survey catch per tow indices from 1989-1996, only the 1992 year class appears to be of moderate strength; the remaining year classes of Gulf of Maine cod appear to be below average, and the 1994 and 1995 year classes are likely to be record lows.
9
, .

MORTALITY
Total Mortality Estimates Pooled estimates of instantaneous total mortality (Z) were calculated for nine time periods encompassed by the NEFSC spring and autumn offshore surveys: 1964-1967,1968-1972,1973-1976,1977-1981, 1982-1984, 1985-1987, 1988-1990, 1991-1993, and 1994-1996 (Table 16). Total mortality was calculated from survey catch per tow at age data (Appendix 2:Table 2) for fully recruited age groups (age3+) by the loge ratio of the pooled age 3+/age 4+ indices in the autumn surveys, and the pooled age 4+/age 5+ indices in the spring surveys. For example, the 1982-1984 values were derived from:
Spring: In ( L age 4+ for 1982-841 L age 5+ for 1983-85)
Autumn: In ( L age 3+ for 1981-83/ L age 4+ for 1982-84)
Different age groups were used in the spring and autumn analyses so that Z could be evaluated over the same year classes within each time period.
Except for the 1988-1990 and 1994-1996 periods, values of Z derived from the spring surveys are slightly lower than those calculated from the autumn data. Rather than selecting one survey series over the other, total mortality was calculated by taking a geometric mean of the spring and autumn estimates in each time period. The pooled estimates indicate that total mortality was relatively low (Z = 0.40) between 1964 and 1976 but increased significantly thereafter to 0.75-0.78 during 1982-1987. Total mortality increased further to 0.94 during 1988-1990, to 1.10 during 1991-1993, and remained high (Lll) during 1994-1996.
Natural Mortality - Instantaneous natural mortality (M) for Gulf of Maine cod is assumed to be 0.20, the conventional value of M used for all Northwest Atlantic cod stocks (Paloheirno and Koehler 1968; Pinhorn 1975; Minet 1978).
ESTIMATION of FISHING MORTALITY RATES and STOCK SIZE
Virtual Population Analysis Calibration - The ADAPT calibration method (Parrack 1986, Gavaris 1988, Conser and Powers 1990) was used to derive estimates of terminal fishing mortality (F) in 1996. As in previous assessments, age-disaggregated analyses were performed. Several exploratory ADAPT formulations were performed using NEFSC spring and autumn (ages 2-6), and Massachusetts DMF spring (ages 2-4) and autumn (ages 2 and 3) survey series. Due to uncertainty in the interpretation of effort units in the 1994-1996 VTR data, USA commercial LPUE abundance indices for age 3-6 were included only through 1993. This change effectively removed the influence of the LPUE indices on the terminal year outcome of the calibration, while preserving the historic relationship employed in the previous assessment As in the previous assessment (Mayo 1995), the USA commercial LPUE indices from 1982 through 1993 were
10

derived from the catch at age corresponding to the effort sub-neet used in the estimation of standardized fishing effort as described by Mayo et al. (1994). The NEFSC and Massachusetts DMF autumn indices were lagged forward by one age and one year whereby age 1-6 indices were related to age 2-7 stock sizes in the subsequent year for corresponding cohorts. All NEFSC and Massachusetts DMF indices were related to January I stock sizes, and USA commercial LPUE indices were related to mid-year stock sizes.
The 1982-1996 commerciallandings at age as provided in Table 7a includes true ages 2-10 as well as the 11 + group. In recent years, however, older fish beyond age 7 have been poorly represented. As reported by Mayo (1995), a previous calibration run employing an extended age complement (true ages 2-9) produced high coefficients of variation (CV) on the terminal year stock size estimates and variable estimates of F on ages 7-9 in most years prior to the terminal year. Therefore, as in previous assessments of this stock (Mayo et at. 1993; Mayo 1995) all trial formulations employed a reduced age range (ages 2-6 and 7+).
As in the past, Massachusetts DMF survey data were included in the VPA calibration primarily to improve the estimates of recruiting year class strength. In exploratory analyses, the DMF autumn age 3 (age 2 before lagging) index often accounted for up to 40% of the total sum of squares; this index was again, as in previous assessments, excluded from the final calibration because of its high variability. The series of trial formulations is summarized in Table 17. All of the trial calibrations employed equal weighting among indices in all years. The formulation identical to that employed in the previous assessment (Mayo 1995) is presented first. This formulation and the second one listed in Table 17 employed commercial landings at age data only as in all previous assessments. The second trial calibration included an extended age range in the landings data, but included direct estimates of ages 2-6 stock sizes as in the previous trial. Two additional trial calibration runs were performed, incorporating estimates of recreational landings at age. The first of these employed the same age range in the direct estimation of terminal populations and the same calibration block as the previous trials, while the second of the two trials incorporating recreational data included a direct estimate of age 1 numbers and two age 1 calibration indices from the Massachusetts DMF spring and autumn surveys.
In all trials, a rather sharp increase in the 1996 F is evident between ages 4 and 5, although the CVs are similar among trials. The F pattern in 1994 was also rather unstable in all formulations with unusually high Fs on ages 4 and 5, particularly on age 5. None of the variations on the initial formulation produced noticeably different results in terms of terminal Fs, population numbers, or CVs. The impact of including the recreational landings in the VPA was an increase in the 1997 terminal population numbers while changes in 1996 terminal F estimates were minimal. Incorporation of age 1 in the formulation slightly improved the precision of the estimate of the age 2 population numbers (CV = 0.37 vs.0.46), but slightly reduced the precision of the estimate of the age 6 numbers (CV = 0.65 vs. 0.57). As well, age 1 numbers were poorly estimated (CV = 0.74). Prior to the terminal year, estimates of F at younger ages were generally higher and stock size estimates at all ages increased over those obtained from the trial which employed only commercial landings at age. Noting (a) the low precision on ages 1 and 6, (b) taking into account the poor length sampling for cod in the recreational fishery, and (c)
11
recognizing the rather uncertain estimates of the recreational catch allocation between the Gulf of Maine and Georges Bank stocks, recreational landings were excluded from the final VPA. The ADAPT formulation employed in the final VPA calibration provided direct stock size estimates for ages 2 through 6 in 1997 and corresponding estimates of F on ages I through 5 in 1996. Since the age at full recruitment was defined as 4 years in the input partial recruitment vector, the terminal year F on age 6 was estimated as the mean of the age 4 and 5 Fs; age 6 is also the oldest true age in the terminal year. In all years prior to the terminal year, F on the oldest true age (age 6) was determined from weighted estimates of Z for ages 4 through 6. In all years, the age 6 F was applied to the 7+ group. Spawning stock biomass (SSB) was calculated at spawning time (March 1) by applying a series of period-specific maturity ogives provided by O'Brien (pers. comm.).
Virtual Population Analysis Results - Full results from the final VP A calibration are presented in Appendix 3, and estimates of F, stock size, and spawning stock biomass are given in Table 18. Except for a few cases, the final calibration yielded low correlations « 0.10) among estimates of slopes (q) and moderately low correlations « 0.20) between stock sizes and qs. The highest correlations were noted between stock size estimates and the NEFSC spring and autumn abundance index for the corresponding age (Appendix 3, page 11). All parameter estimates were significant. Coefficients of variation on the stock size estimates ranged from 0.31 (ages 3 and 4) to 0.57 (age 6), while CVs on the estimates of slopes were between 0.16 and 0.18. Slopes of the abundance index-stock size relationships (Appendix 3, page 10) increased with age generally up to age 4 for the NEFSC spring and autumn surveys and the USA commercial LPUE indices. The Massachusetts DMF indices also exhibited an increasing trend in q between ages 2 and 4.
Average (ages 4-5, unweighted) fishing mortality in 1996 was estimated at 1.04 (Table 18, Figure 6). This high level of mean fully-recruited F is consistent with estimates of continued high fishing effort indicated by the general linear modelling results (Figure 3). The spawning stock biomass of mature cod age 2 and older declined from 22,445 mt in 1982 to 14,343 mt in 1987. Following the recruitment and maturation of the strong 1987 year class, SSB increased sharply in 1989 to a maximum of 26,080 mt but declined to 8,593 mt in 1994, a 5-year reduction of 67% (Table 18, Figure 7). SSB increased by 13% to 9,719 mt in 1995 due to the growth and maturation of the 1992 year class, but the spawning biomass declined again in 1996. Total stock size (ages 2+) has also declined sharply in recent years from 28 million fish in 1989 to 4.2 million in 1997, a decrease of 85% (Table 18).
Since 1982, recruitment at age 2 has ranged from less than 1 million fish (1994 and 1995 year classes) to 17.7 million fish (1987 year class). Over the 1982-1996 period, geometric mean recruitment for the 1980-1994 year classes was 4.7 million fish. The 1987 year class is the highest in the 1982-1996 series and about twice the size of the above average 1980 and 1986 year classes. Except for the moderate 1992 year class, recent recruitment has been poor as the 1988-1989 and the 1993-1995 year classes (all.::; 3.1 million at age 2) are estimated to be among the poorest in the series (Table 18, Figure 7). In particular, the 1994 and the 1995 year classes are each estimated to be less than 1 million fish.
12

Precision of F and SSB - A bootstrap procedure (Efron 1982) was used to evaluate the precision of the final estimates, by generating 1,000 estimates of the 1996 fishing mortality rate and spawning stock biomass. The distributions of the bootstrap estimates and the corresponding cumulative probability curves are shown in Figures 8 and 9. The cumulative probability expresses the likelihood that the fishing mortality rate was greater than a given level (Figure 8) or the likelihood that spawning stock biomass was less than a given level (Figure 9), when measurement error is considered. An evaluation of the precision of the 1997 stock size, 1996 fishing mortality, 1996 spawning stock biomass, and q estimates is presented in Appendix 4.
Coefficients of variation for the 1997 stock size (numbers) estimates ranged from 0.31 (age 3) to 0.70 (age 6), and CVs for qs among all indices ranged from 0.15 to 0.19 (Appendix 4:Table 1). Fully-recruited fishing mortality in 1996 for ages 4+ was reasonably well estimated (CV = 0.25). The mean bootstrap estimate of F (1.079) was slightly higher than the point estimate (1.036) from the VPA (Appendix 4:Table 5) and individual bootstrap estimates ranged from 0.46 to 2.04. The 80% probability interval ranges from 0.79 to 1.41 (Figure 8). F2o% and Fm«x are much lower than the lowest bootstrap estimate, and FI996 is certainly above the oveIilshing definition mortality rate and the maximum F allowable to achieve stock rebuilding.
Although the abundance estimates for individual ages in 1997 had wide variances (CV = 0.31 to 0.70), the estimate of 1996 spawning stock biomass was robust (CV = 0.15). The bootstrap mean (9,585 mt) was slightly higher than the VPA point estimate (9,249) (Appendix 4:Table 6) and individual bootstrap estimates ranged from 6,000 mt to 14,700 mt. The 80% probability interval ranges from 7,800 mt to 11,300 mt (Figure 9). Despite this variability, spawning stock biomass in 1996 is estimated to be among the lowest observed in the VP A time series.
In general, estimates of stock size and fishing mortality in the present assessment are slightly less precise than in the previous assessment of this stock (Mayo 1995). This may be due to greater variability in the estimates of landings at age resulting from lower sampling in recent years, or to the exclusion of commercial LPUE indices in the most recent years of the VPA calibration. Despite this lower precision, the VPA results are sufficient to accurately characterize the overall status of the Gulf of Maine cod stock.
Retrospective Analysis - Retrospective analyses of the Gulf of Maine cod VPA were carried '1>.
out using the final ADAPT formulation with the terminal year ranging from 1996 back to 1991. Results are given in Table 19 and Figure 10. Convergence of estimates is generally evident within 3 years, and often within 2 years, prior to any given terminal year. Retrospective patterns with respect to terminal F are evident for Gulf of Maine cod in the most recent years. Mean (ages 4-5, unweighted) F in the terminal year was generally under-estimated by the ADAPT calibration in the most recent years and slightly over-estimated in earlier years. Terminal Fs appear to have been well estimated through 1993. Despite these patterns, the retrospective analysis provides additional evidence to substantiate the current high levels of F. Retrospective patterns for SSB and age 2 recruits are similar, both indicating relatively consistent estimates of terminal year values from 1991-1996. Although subject to some variability, terminal year recruitment and SSB appear to have been estimated with a high degree of reliability in recent years.
13

YIELD and SPAWNING STOCK BIOMASS per RECRUIT
Yield, total stock biomass, and spawning stock biomass per recruit analyses were performed using the method of Thompson and Bell (1934). Mean weights at age for application to yield per recruit were computed as a 15-year arithmetic average of catch mean weights at age (Table 7b) over the 1982-1996 period. Mean weights at age for application to SSB per recruit were computed as a 15-year arithmetic average of stock mean weights at age (Table 9) over the 1992-1996 period. The maturation ogive was the same as used in computing SSB during the 1990-1996 period in the VP A. To obtain the exploitation pattern for these analyses, a three-year geometric mean F at age was first computed over the period 1994-1996 from the final converged VP A results. These years were chosen specifically to encompass the period since enactment of the increase in the minimum allowable mesh (152 mm). A smoothed exploitation pattern was then obtained by dividing the F at age by the mean unweighted F for ages 4-5, and adjusting the age 2-4 ratios by the average for ages 5 and 6. The final exploitation pattern is as follows:
Age 1 0.000, Age 2 0.028, Age 3 0.211, Age 4 0.768, Ages 5+ 1.000
This pattern differs from those used in the previous two Gulf of Maine cod assessments (Mayo et al. 1993; Mayo 1995), and reflects recent management actions designed to increase mesh selectivity. This partial recruitment pattern was used in yield and SSB per recruit calculations (Table 20). Results of the yield and SSB per recruit calculations are listed in Table 20 and are illustrated in Figure 11. The yield per recruit analyses indicate that FO.I = 0.16 and Fm", = 0.29, and SSB per recruit calculations indicate that F2o% = 0.37. There reference points are either identical to, or slightly higher than, those reported in the previous assessment (Mayo 1995).
SHORT and MEDIUM-TERM PROJECTIONS
Short and medium-term projections of spawning stock biomass, recruitment at age 2 and commercial landings were performed using the VPA-calibrated 1996 fully recruited mean F (ages 4-5, u) and 1997 stock size estimates from the 1000 bootstrap replications as starting conditions. The stochastic simulations were repeated 50 times to obtain a series of probability profiles for each projected variable. The exploitation pattern and maturation rates were as described above for the yield and SSB per recruit analyses; catch and stock mean weights at age were computed as a five-year arithmetic average over the 1992-1996 period. '"
Short- Term Projections - Recruitment was generated based on the model 9 formulation of Brodziak and Rago (MS 1994). In this model, age 2 recruitment is estimated two years ahead by re-sampling the distribution of a specified range of empirical recruitment. For the near term, age 2 recruitment in 1997 was fixed at the level estimated in the VPA calibration, and recruitment in 1998 and 1999 was derived by re-sampling the distribution of values observed for the 1988-1994 year classes. Short-term projections are provided over a range of F levels which includes FO.I, Fm"" F2o%, and F,q (=F96). Input and output from the projections are given in Table 21. The assumption of stattis quo F in 1997 equal to 1.04 resulted in a 1997 catch of about 5,800 mt and a corresponding SSB of 6,900 mt. Given the delayed implementation of effort restrictions under Amendment 7 in 1997, and the potential for further shifts in fishing effort toward coastal Gulf of Maine grounds, the assumption of status quo F in 1997 appears reasonable.
14

Continued fishing at F = 1.04 in 1998 will result in projected 1998 landings of about 3,900 mt and will result in a continued decline in SSB to 4,300 mt in 1999 from the record low 1997 level of 6,900 mt (Table 21, Figure 12), SSB is projected to decline even further in 1999 if F remains at the current level in 1998, Even if fishing mortality is reduced to F20% (037) in 1998 and 1999, SSB will not increase above the record-low 1997 level (Table 21, Figure 12).
Medium -Term Projection Results - Medium-term projections spanning a lO-year time horizon, beginning on January I, 1997, are described and summarized by Overholtz et al. (1997) for five groundfish stocks in the Georges Bank region, including Gulf of Maine cod. A time series of spawning stock and recruitment data was assembled, and a probabilistic Beverton-Holt stockrecruitment relationship was established to estimate recruitment and associated variability in each of the forecast years. Starting conditions, including stock sizes in 1997, exploitation pattern, maturation schedules, and mean weights were as employed in the final VPA formulation as above. Medium-term projections for Gulf of Maine cod were performed over a range of F levels which included Fma< (0.29) and F,q (1.04). Further details on application of stochastic projection methodology may be found in Brodziak and Rago (MS 1994) and Overholtz et al. (1997),
At the current level of fishing mortality (F,q = 1.04), median SSB declines from about 6,800 mt in 1997 to 2,000 mt in 2006, and recruitment remains extremely poor, declining to less than 1 million f1sh per year after 2000; landings decline from 5,800 mt to 1,400 mt. Fishing at Pm", (0.29) over the lO-year time horizon results in considerably improved stock conditions. At this level of F, median SSB increases from 7,600 mt in 1997 to over 40,000 mt after 10 years, and recruitment improves from recent levels of about 1-2 million fish to about 7-8 million fish; landings increase from 2,200 mt in 1997 to about 11,000 mt in 2006 (Overholtz et al. 1997).
CONCLUSIONS
The Gulf of Maine cod stock is presently at a low biomass level and remains over exploited, Fishing mortality has remained at or near 1.0 since 1983, while spawning stock biomass (SSB) has declined from over 26,000 mt in 1989 to a record low of 8,600 mt in 1994, and is expected to decline further in 1997 to a new record-low of 6,900 mt Accounting for the estimation uncertainty associated with the 1996 SSB (9,200 mt) and 1996 F (1.04) estimates, there is an 80% probability that the 1996 SSB lies between 7,800 mt and 11,300 mt, and that the 1996 F lies between 0.79 and 1.41. This further implies a 90% probability that the 1996 F was greater than 0.79, or more than two times greater than the overfishing definition (F20%=O.37),
At the present level of exploitation and probable levels of recruitment in the near term, further declines in spawning stock biomass are expected, At the current level of exploitation (60%), commercial landings are expected to decline to less than 4,000 mt in 1998 and spawning stock biomass is projected to decline to about 4,300 mt in 1999, Current SSB is no longer dominated by the 1987 year class, but by a series of very low to average year classes produced from 1988 through 1995. The moderate 1992 year class was the only above average year class since 1987. Recruitment from the two most recent year classes, produced in 1994 and 1995, is expected to be extremely poor, well below any previously observed levels,
15

An immediate and substantial reduction in fishing mortality, in tbe order of 65%, is required to halt tbe continuing decline in SSB. Rebuilding of SSB will require even further reductions over the long term. If fishing mortality is not reduced from tbe present level, SSB will decline to less than 5.000 mt in tbe near future.
ACKNOWLEDGEMENTS
The author is indebted to Dr. Ray Conser for his considerable efforts· in tbe development and implementation of tbe algoritbms used in tbe ADAPT and bootstrapping procedures. Sincere appreciation is also extended to members of tbe Northern and Southern Demersal Subcommittees who provided a thorough, constructive review of tbe initial version of tbis assessment. Special thanks to Susan Wigley for developing software to implement commercial landings proration algorithms, to Allison DeLong preparing discard ratios from Sea Sample data, to Loretta O'Brien for developing catch and effort estimates from VTR files, to Katby Sosebee for providing analyses of the distribution of effort and LPUE data from tbe VTR data sets, and to Mark Terciero for producing MRFSS recreational catch and length frequency data sets.
LITERATURE CITED
Azarovitz, T.R. 1981. A brief historical review of tbe Woods Hole Laboratory trawl survey time series, p. 62-67. IN: Doubleday, W. G., and D. Rivard (eds.), Bottom Trawl Surveys. Can. Spec. Pub!. Fish. Aquat. Sci. 58: 273 p.
Brodziak, J. and PJ. Rago. MS 1994. A general approach for short-term stochastic projections in age-structured fisheries assessment models. Working Paper No.4, 18tb SARC Assessment Metbods Subcommittee: 27 p.
Campana, S., and J. Hamel. 1990. Assessment of the 1989 4X cod fishery. CAFSAC Res. Doc. 90/44: 46 p.
Campana, S., and J. Simon. 1985. An analytical assessment of tbe 4X cod fishery. CAFSAC Res. Doc. 85/32: 40 p.
Clark, S.H. 1981. Use of trawl survey data in assessments, p. 82-92. IN: Doubleday, W. G., and D. Rivard (eds.), Bottom Trawl Surveys. Can. Spec. Pub!. Fish. Aquat. Sci. 58: 273 p.
Conser, R.J. and J.E. Powers. 1990. Extension of tbe ADAPT VPA tuning metbod designed to facilitate assessment work on tuna and swordfish stocks. ICCAT, Coil. Vol. Sel Pap. 32:461-467.
16

DeLong, A., K. Sosebee and S. Cadrin. MS 1997. Evaluation of vessellogbook data for discard and CPUE estimates. SAW24/SARC Working Paper Gen 5.
Efron, B. 1982. The jacknife, the bootstrap and other resampling plans. Phila. Soc. for Ind. and App!. Math. 34: 92p.
Gavaris, S. 1988. An adaptive framework for the estimation of population size. CAFSAC Res. Doc. 88/29: 12p.
Howe, A.B., F.J. Germano, J.L. Buckley, D. Jimenez, and B.T. Estrella. 1981. Fishery resource assessment, coastal Massachusetts. Completion Rept., Mass. Div. Mar. Fish., Comm. Fish. Rev. Div. Proj. 3-287-R-3: 32 p.
Mayo, R.K. 1995. Assessment of the Gulf of Maine Cod Stock for 1993. NMFS, NEFSC, Woods Hole Lab. Ref. Doc. 95-02: 74 p.
Mayo, R.K., L. O'Brien, and P.M. Serchuk. 1993. Assessment of the Gulf of Maine Cod Stock for 1992. NMFS, NEFSC, Woods Hole Lab. Ref. Doc. 94-04: 54 p.
Mayo, R.K., T.E. Helser, L. O'Brien, K.A. Sosebee, B.P. Figuerido and D.B. Hayes. 1994. Estimation of standardized otter trawl effort, landings per unit effort, and landings at age for Gulf of Maine and Georges Bank cod. NMFS, NEFSC, Woods Hole Lab. Ref. Doc. 94-12: 17 p.
Minet, J.P. 1978. Dynamics and yield assessment of the northeastern Gulf of St. Lawrence cod stock. Int. Comm. Northw. Atlant. Fish., Selected Papers 3: 7-16.
NEFC (Northeast Fisheries Center). 1989. Report of the Seventh NEFC Stock Assessment Workshop (Seventh SAW). NMFS, NEFC, Woods Hole Lab. Ref. Doc. 89-04: 108 p.
NEFSC (Northeast Fisheries Science Center). 1991. Report of the Twelfth Northeast Regional Stock Assessment Workshop (12th SAW). NMFS, NEFSC, Woods Hole Lab. Ref. Doc. 91-03: 187 p.
NEFSC (Northeast Fisheries Science Center). 1992. Report of the Thirteenth Northeast Regional Stock Assessment Workshop (13th SAW). NMFS, NEFSC, Woods Hole Lab. Ref. Doc. 92-02: 183 p.
NEFSC (Northeast Fisheries Science Center). 1993. Report of the Fifteenth Northeast Regional Stock Assessment Workshop (15th SAW). Stock Assessment Review Committee (SARC) Consensus Summary of Assessments. NMFS, NEFSC, Woods Hole Lab. Ref. Doc. 93-06: 108 p. .
17

NEFSC (Northeast Fisheries Science Center). 1995. Report of the Nineteenth Northeast Regional Stock Assessment Workshop (l9th SAW). Stock Assessment Review Committee (SARC) Consensus Summary of Assessments. NMFS, NEFSC, Woods Hole Lab. Ref. Doc. 95-08: 221 p.
O'Brien. L. Personal Communication, Northeast Fisheries Science Center, October, 1996.
Overholtz, WJ., S.A. Murawski, PJ. Rago, W.L. Gabriel and M. Terceiro. 1997. Ten-year projections of landings, spawning stock biomass and recruitment for the five groundfish stocks considered at SAW 24. NMFS, NEFSC, Woods Hole Lab. Ref. Doc. 97-xx: xx p.
Paloheimo, J.E., and A.C. Koehler. 1968. Analysis of the southern Gulf of St. Lawrence cod populations. J. Fish. Res. Board Can. 25(3): 555-578.
Parrack, M.L. 1986. A method of analyzing catches and abundance indices from a fishery. lnt Comm. Conserv. Atlantic Tunas, Coll. Vol. Sci. Pap. 24:209-221.
Pinhorn, A.T. 1975. Estimates of natural mortality for the cod stock complex in ICNAF Division 2J, 3K and L. lnt. Comm. Northw. Atlant. Fish. Res. Bull. 11: 31-36.
Power, G., K. Wilhelm, K. McGrath and T. Theriault. MS 1997. Commercial fisheries dependent data collection in the Northeastern United States. SAW24/SARC Working Paper Gen 3.
Rivard, D. 1980. APL programs for stock assessment. Can. Tech. Rep. Fish. Aquat. Sci. 953: 103 p.
Thompson, W.F., and F.R. Bell. 1934. Biological statistics of the Pacific halibut fishery. 2. Effect of changes in intensity upon total yield and yield per unit of gear. Rep. lnt. Fish. (Pacific Halibut) Comm. 8: 49 p.
Wigley, S.E., M. Terceiro, A. DeLong and K. Sosebee. MS 1997. Proration of 1994-1996 commercial landings of cod, haddock and yellowtail flounder. SA W24/SARC Working Paper Gen 4.
18
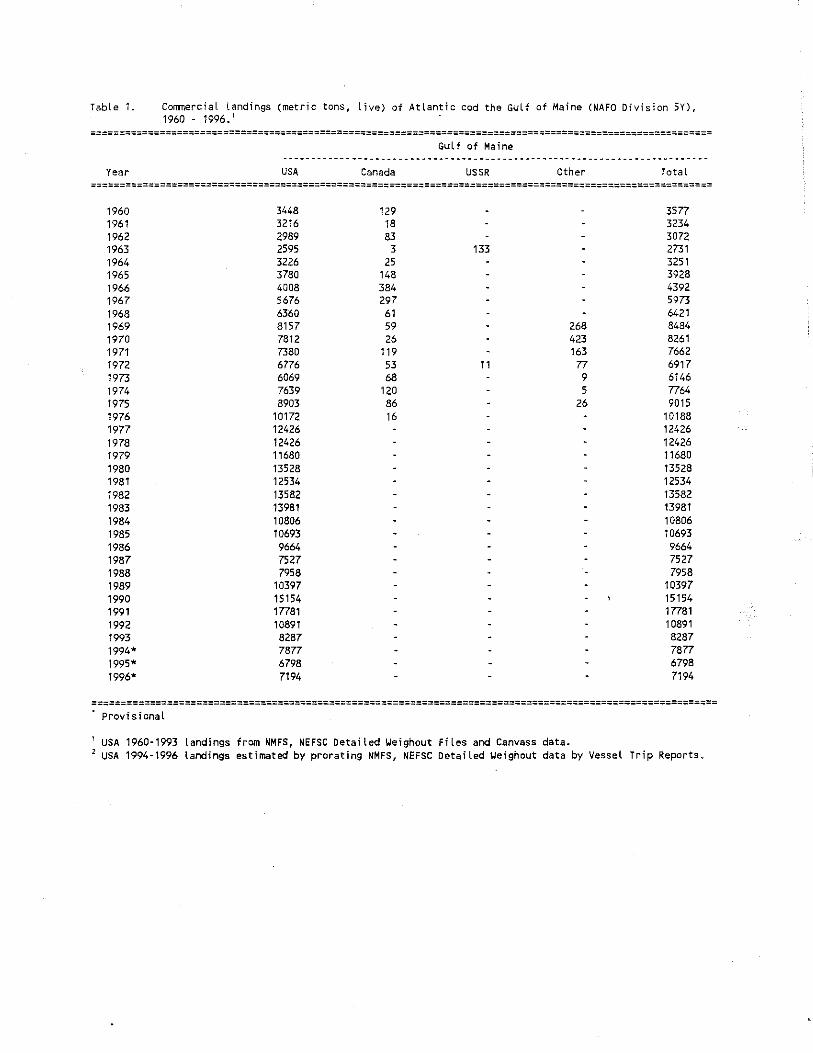
Table 1. Commercial landings (metric tons, live) of Atlantic cod the Gulf of Maine (NAFO Division SY), 1960 - 1996.'
============================================================================================================ Gulf of Maine
Year USA Canada USSR Other Total ============================================================================================================
1960 3448 1961 3216 1962 2989 1963 2595 1964 3226 1965 3780 1966 4008 1967 5676 1968 6360 1969 8157 1970 7812 1971 7380 1972 6776 1973 6069 1974 7639 1975 8903 1976 10172 1977 12426 1978 12426 1979 11680 1980 13528 1981 12534 1982 13582 1983 13981 1984 10806 1985 10693 1986 9664 1987 7527 1988 7958 1989 10397 1990 15154 1991 17781 1992 10891 1993 8287 1994* 7877 1995" 6798 1996" 7194
129 18 83 3
25 148 384 297
61 59 26
119 53 68
120 86 16
133
11
268 423 163 77 9 5
26
3577 3234 3072 2731 3251 3928 4392 5973 6421 8484 8261 7662 6917 6146 7764 9015
10188 12426 12426 11680 13528 12534 13582 13981 10806 10693 9664 7527 7958
10397 15154 17781 10891 8287 7877 6798 7194
============================================================================================================ Provisional
USA 1960-1993 landings from NMFS, NEFSC Detailed Weighout Files and Canvass data. 2 USA 1994-1996 landings estimated by prorating NMFS, NEFSC Detailed Weighout data by Vessel Trip Reports.
, '
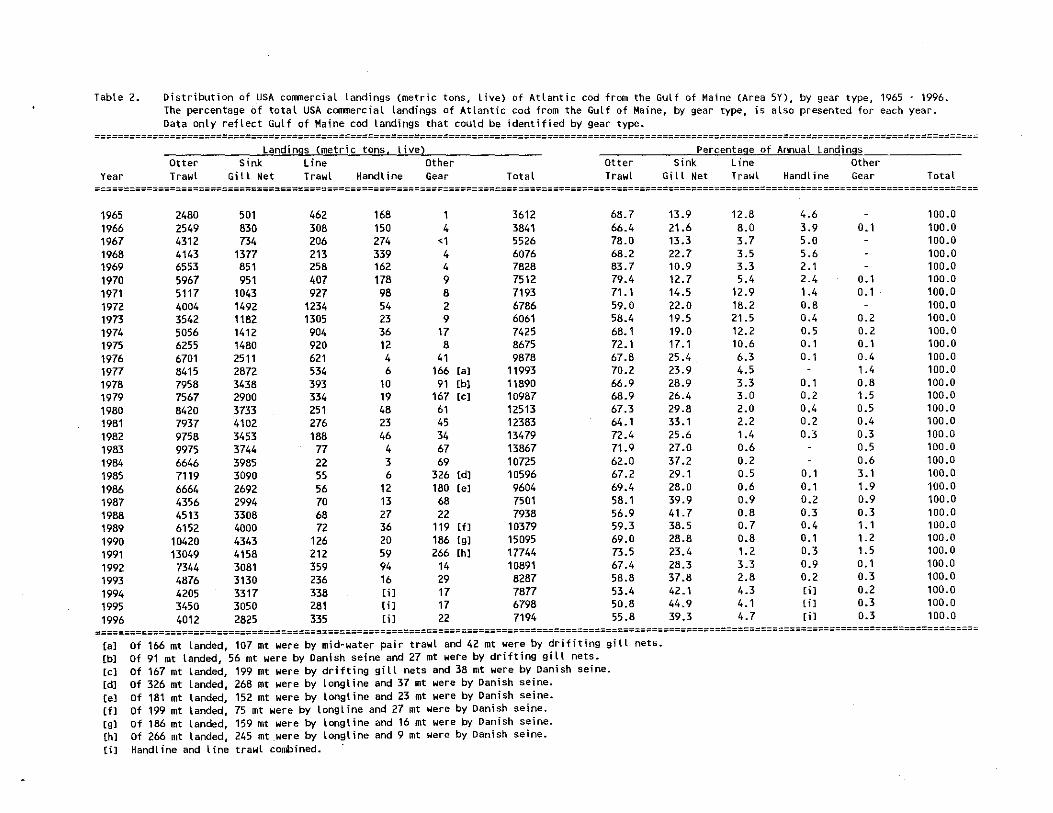
Table 2. Distribution of USA commercial landings (metric tons, live) of Atlantic cod from the Gulf of Maine (Area 5Y), by gear type, 1965 . 1996. The percentage of total USA commercial landings of Atlantic cod from the Gulf of Maine, by gear type, is also presented for each year. Data only reflect Gulf of Maine cod landings that could be identified by gear type.
=========================================================================================================================================================
Year Otter Trawl
Landings (metric tQns, live) Sink Line Other
Gill Net TrawL Handline Gear Total Otter Trawl
Percentage . ..!>f Aonu"!L Langings Sink Line Other
Gill Net Trawl Handline Gear Total =========================================================================================================================================================
1965 1966 1967 1968 1969 1970 1971 1972 1973 1974 1975 1976 1977 1978 1979 1980 1981 1982 1983 1984 1985 1986 1987 1988 1989 1990 1991 1992 1993 1994 1995 1996
2480 2549 4312 4143 6553 5967 5117 4004 3542 5056 6255 6701 8415 7958 7567 8420 7937 9758 9975 6646 7119 6664 4356 4513 6152
10420 13049
7344 4876 4205 3450 4012
501 830 734
1377 851 951
1043 1492 1182 1412 1480 2511 2872 3438 2900 3733 4102 3453 3744 3985 3090 2692 2994 3308 4000 4343 4158 3081 3130 3317 3050 2825
462 308 206 213 258 407 927
1234 1305 904 920 621 534 393 334 251 276 188
77 22 55 56 70 68 72
126 212 359 236 338 281 335
168 150 274 339 162 178 98 54 23 36 12 4 6
10 19 48 23 46
4 3 6
12 13 27 36 20 59 94 16 [iJ [iJ [iJ
4 <1 4 4 9 8 2 9
17 8
41 166 [a]
91 [b] 167 [e]
61 45 34 67 69
326 [d]
180 tel 68 22
119 [Il 186 [9] 266 [h]
14 29 17 17 22
3612 3841 5526 6076 7828 7512 7193 6786 6061 7425 8675 9878
11993 11890 10987 12513 12383 13479 13867 10725 10596 9604 7501 7938
10379 15095 17744 10891 8287 7877 6798 7194
68.7 66.4 78.0 68.2 83.7 79.4 71.1 59.0 58.4 68.1 72.1 67.8 70.2 66.9 68.9 67.3 64.1 72.4 71.9 62.0 67.2 69.4 58.1 56.9 59.3 69.0 73.5 67.4 58.8 53.4 50.8 55.8
13.9 21.6 13.3 22.7 10.9 12.7 14.5 22.0 19.5 19.0 17.1 25.4 23.9 28.9 26.4 29.8 33.1 25.6 27.0 37.2 29.1 28.0 39.9 41.7 38.5 28.8 23.4 28.3 37.8 42.1 44.9 39.3
12.8 8.0 3.7 3.5 3.3 5.4
12.9 18.2 21.5 12.2 10.6 6.3 4.5 3.3 3.0 2.0 2.2 1.4 0.6 0.2 0.5 0.6 0.9 0.8 0.7 0.8 1.2 3.3 2.8 4.3 4.1 4.7
4.6 3.9 5.0 5.6 2.1 2.4 1.4 0.8 0.4 0.5 0.1 0.1
0.1 0.2 0.4 0.2 0.3
0.1 0.1 0.2 0.3 0.4 0.1 0.3 0.9 0.2 [iJ {i] [1]
0.1
0.1 0.1
0.2 0.2 0.1 0.4 1.4 0.8 1.5 0.5 0.4 0.3 0.5 0.6 3.1 1.9 0.9 0.3 1.1 1.2 1.5 0.1 0.3 0.2 0.3 0.3
100.0 100.0 100.0 100.0 100.0 100.0 100.0 100.0 100.0 100.0 100.0 100.0 100.0 100.0 100.0 100.0 100.0 100.0 100.0 100.0 100.0 100.0 100.0 100.0 100.0 100.0 100.0 100.0 100.0 100.0 100.0 100.0
========================================================================================================================================================= [a] Of 166 mt landed, 107 mt were by mid~water pair trawl and 42 mt were by drifiting gill nets. [b] Of 91 mt landed, 56 mt were by Danish seine and 27 mt were by drifting giLL nets. [c] Of 167 mt landed, 199 mt were by drifting gill nets and 38 mt were by Danish seine. Cd] Of 326 mt landed, 268 mt were by longline and 37 mt were by Danish seine. [el Of 181 mt landed, 152 mt were by longtine and 23 mt were by Danish seine. [f] Of 199 mt landed, 75 mt were by longline and 27 mt were by Danish seine. (g] of 186 mt landed, 159 mt were by Longline and 16 mt were by Danish seine. [hl of 266 mt landed, 245 mt .were by longline and 9 mt were by Danish seine. (i] Handline and line trawl combined.

Table 3. Discard and total catch estimates (metric tons, l lye) for Gulf of Maine cod by otter trawl, shrimp trawl, and sink g; llnet gear.
===================================================================
Year
1989 1990 1991 1992 1993 1994 1995 1996
Total Landings
10397 15154 17781 10891 8287 7877 6798 7194
Discard Estimates
Included Discard Discard to TotaL Landings Estimate Landings Ratio Discard
10182 1513 0.1486 1545 14827 3521 0.2375 3599 17374 1032 0.0594 1056 10511 582 0.0554 603 8058 320 0.0397 329 7522 228 0.0303 239 6500 393 0.0605 411 6837 167 0.0244 176
Table 4. Estimated number (OOO's) and weight (metric tons, live) of AtLantic cod caught by marine recreational fishermen from the GuLf of Maine stock, 1979 - 1996. 1
================================================================================================================= Total Cod Caught
Year No. of Cod Wt. of Cod (OOO's) (mt)
Total Cod Retained (excluding those caught and reLeased)
No. of Cod (OOO'S)
W't. of Cod (mt)
Sample Mean Weight (kg)
Number Percent of Measured Total Landing
=================================================================================================================
1979 2698 3466 not estimated , ------. not estimated -.-.-- , , , 1980 2254 6860 not estimated , ------- not estimated -.---- , , , 1981 2933 5944 2738 5549 1.595 380 30.7 1982 1833 2138 1736 2025 1. 121 377 13 .0 1983 1455 1388 1237 1180 1.323 882 7.8 1984 1098 1705 905 1405 1.520 596 11.5 1985 1671 1964 1471 1729 1.238 295 13.9 1986 1114 967 993 862 1.942 75 8.2 1987 2625 2317 2054 1813 1.738 320 19.4 1988 1487 2114 1300 1848 2.049 407 18.8 1989 1769 2690 1193 1814 1.736 404 14.9 1990 1725 3882 1247 2806 1.964 206 15.6 1991 1770 3635 1419 2914 2.004 370 14.1 1992 585 1154 332 655 2.001 922 5.7 1993 1564 2378 m 1174 1.831 290 12.4 1994 1424 2578 516 934 1.844 750 10.6 1995 1206 1799 517 771 1.716 1028 10.2 1996 812 2112 351 913 2.099 1068 11.3 ================================================================================================================= ,
1981-1996 from Revised Marine Recreational Fishery Statistics Survey database expanded catch estimates.

Table 5. USA sampling of commercial Atlantic cod landings from the Gulf of Maine cod stock (NAFO Division 5Y), 1982 ~ 1996.
;;;;=;;=;============================================================================================================================================================
Year
Number of SampLes
length Samples No. # Fish
Measured
Age Sarrptes No. # Fish
Aged
Number of Samples. by Mar~et Gateg9ry & Quarter
Scrod Market Large
Ql Q2 Q3 Q4 I Ql Q2 Q3 Q4 I 01 02 Q3 Q4
Annual Sampling Intensity
No. of Tons Landed/SampLe
I Sed Mkt 1ge I
=====================================================================================================================================================================
1982 48 3848 48 866 6 7 6 6 25 4 3 7 4 18 o 2 2 5 134 348 792 266
1983 71 5241 67 1348 14 10 10 4 38 4 10 6 2 22 3 5 2 11 106 294 318 197
1984 55 3925 55 1224 7 5 6 7 25 4 3 5 6 18 6 3 2 12 85 319 245 193
1985 69 5426 66 1546 5 6 7 5 23 8 6 7 4 25 7 5 3 6 21 95 229 132 155
1986 53 3970 51 1160 5 5 6 3 19 5 6 8 2 21 5 4 3 13 124 242 170 182
1987 43 3184 42 939 4 4 3 4 15 5 5 3 5 18 423 10 83 224 225 175
1988 34 2669 33 741 4 3 4 4 15 5 3 5 14 220 5 147 271 391 234
1989 32 2668 32 714 3 3 3 3 12 4 5 4 14 2 2 6 209 430 311 325
1990 39 2982 38 789 3 7 3 5 18 4 7 4 3 18 o 2 o 3 300 378 966 387
1991 56 4519 56 1152 2 10 4 3 19 5 11 11 3 30 o 3 3 7 250 313 519 318
1992 51 4086 51 1002 2 8 6 3 19 6 7 7 3 23 3 4 9 104 232 375 214
1993 23 1753 23 447 333 10 2 4 8 2 5 177 453 527 360
1994 30 2696 33 665 o 224 8 4 4 6 15 023 2 7 180 284 272 263
1995 31 2568 32 662 4 2 2 4 12 2 7 2 12 o 5 0 2 7 133 300 202 219
1996 77 7027 71 1483 6 5 7 9 27 7 9 10 12 38 3 3 5 12 62 116 79 93
=====================================================================================================================================================================
Source: 1978-1985 from Serchuk and Yigtey CYoods Hole lab. Ref 86-12); 1986-1996 from NEFSC files.

TabLe 6. Percentage (by weight) of USA commerciaL AtLantic cod landings from the Gulf of Maine (NAFO Division 5Y), by market category, 1964 - 1996.
============================================================= GuLf of Maine
Year Large Market Scrod Total (al =============================================================
1964 1965 1966 1967 1968 1969 1970 1971 1972 1973 1974 1975 1976 1977 1978 1979 1980 1981 1982 1983 1984 1985 1986 1987 1988 1989 1990 1991 1992 1993 1994 1995 1996
29 39 42 41 47 35 43 52 58 52 39 32 29 33 38 37 36 29 29 25 26 25 22 29 26 17 34 26 31 32 24 21 13
59 54 48 41 43 55 52 42 35 36 33 42 45 42 44 49 45 45 45 45 51 51 51 52 45 55 43 51 49 44 54 53 61
12 7
10 17
9
9
6 6
7
11 28 26 20 22 17 14 19 22 24 28 19 20 23 16 23 23 19 20 18 21 18 23 23
100 100 100 100 100 100 100 100 100 100 100 100 100 100 100 100 100 100 100 100 100 100 100 100 100 100 100 100 100 100 100 100 100
============================================================= [al Includes landings of 'mixed' cod.
.. ,

Table 7a. Catch at age (thousands of fish; metric tons) of total commercial landings of Atlantic cod from the Gulf of Maine stock (NAfO Division 5Y), 1982 - 1996.
====================================================================================================================================== Age
Year 2 3 4 5 6 7 8 9 10 11+ Total ======================================================================================================================================
1982 1983 1984 1985 1986 1987 1988 1989 1990 1991 1992 1993 1994 1995 1996
1982 1983 1984 1985 1986 1987 1988 1989 1990 1991 1992 1993 1994 1995 1996
30
4
2
24
3
2
1380 866 446 407
84 216 160 337 205 344 313 76 29
218 65
1595 1009 516 513 110 283 203 420 219 388 480
99 43
361 110
1633 2357 1240 1445 2164
595 1443 1583 3425
934 530
1487 1016 880 584
2717 3913 2071 2523 3976 1001 2715 2811 5794 1463 1019 2809 1975 1689 1247
Total Commercial Catch in Numbers (OOO'sl at Age
1143 1058 1500 991 813
1109 953
1454 2064 4161
484 641
1135 1153 1738
633 638 437 630 250 277 406 449 430 851
2018 129 288 194 347
69 422 194 128 177
66 43 81
157 143 202 457
72 12 45
91 47 74 78 39 51 9
35 27 41 62 28 54
8 5
61 61 19 32 24 9
17 6
30 30
7 6
17 22 2
41 23 15 4
20 8 1 3
10 6
12 2
13 3 3
Total Commercial Catch in Weight (Tons I at Age
3160 2619 4080 2816 2375 3641 2311 4351 4687
10455 1313 1611 3576 3200 4131
3019 2410 1607 2814 1153 1340 2097 1737 1834 3520 6175
561 991 997
1267
461 2518 1145
705 1072 451 295 325
1200 1045 1011 2819
442 96
333
813 271 603 615 296 455
85 323 290 399 594 281 451
92 49
608 643 186 363 243 88
191 67
354 369 88 79
218 291
18
531 227 193
51 253 116
11 43
153 93
161 27
156 45 39
4 9
11 11 4 8 2 5
15 1 3
41 102 152 141 54
110 36 87
214 32 49
20 27
33 15 17 11 8 3 1 7
17 1
613 269 250 152 132 40 14
163 350
17
6
5118 5496 3957 3737 3583 2344 3035 3960 6380 6512 3631 2825 2626 2491 2789
13582 13981 10816 10693 9664 7527 7958
10397 15095 17781 10891 8286 7877 6798 7194
=====================================================================================================================================
.It

Table 7b. Mean weight (kg) and mean length (cm) at age of total commercial landings of Atlantic cod from the Gulf of Maine stock (NAFO Division 5Y). 1982 - 1996.
====================================================================================================================================== Age
------------------------------------------------------------------------------------_._--------Year 2 3 4 5 6 7 8 9 10 11+ Average
======================================================================================================================================
1982 1983 1984 1985 1986 1987 1988 1989 1990 1991 1992 1993 1994 1995 1996
1982 1983 1984 1985 1986 1987 1988 1989 1990 1991 1992 1993 1994 1995 1996
0.801
0.589
1.028
43.2
39.0
47.0
1.156 1.164 1.159 1.260 1.304 1.313 1.268 1.247 1.071 1.130 1.533 1.293 1.450 1.652 1.687
48.3 48.6 48.4 49.8 50.3 50.4 50.1 49.8 47.5 47.7 53.1 50.5 52.4 54.4 54.6
1.664 1.660 1.670 1.746 1.837 1.684 1.881 1.776 1.692 1.568 1.922 1.889 1.943 1.921 2.136
53.8 53.8 54.1 55.1 55.9 54.4 56.4 55.5 54.8 52.6 56.6 56.8 57.2 56.9 58.8
Total Commercial Catch Mean Weight (kg) at Age
2.764 2.475 2.721 2.840 2.923 3.283 2.426 2.993 2.271 2.512 2.714 2.513 3.151 2.775 2.376
4.770 3.778 3.677 4.466 4.619 4.831 5.166 3.864 4.265 4.136 3.061 4.356 3.444 5.142 3.648
6.739 5.962 5.898 5.525 6.067 6.824 6.767 4.872 7.645 7.309 5.000 6.174 6.132
. 8.290 7.376
8.944 5.808 8.119 7.901 7.669 8.878 9.932 9.267
10.734 9.642 9.566 9.999 8.321
10.755 10.440
9.931 10.522 9.595
11.218 10.030 10.023 11.126 11. 938 11. 758 12.322 12.462 13.869 12.628 12.914 11. 928
12.922 10.089 12.889 11.420 12.463 13.752 14.960 14.806 15.015 15.547 13.449 17.544 12.052 16.433 13.471
Total Commercial Catch Mean Length (em) at Age
63.4 61.4 63.4 64.6 65.0 67.8 61.1 65.7 60.0 61.8 62.9 61.7 66.6 63.4 60.7
76.8 70.8 69.7 74.9 75.4 76.9 78.7 71.5 73.7 72.6 65.6 74.2 68.1 78.6 69.3
86.1 82.4 81.8 80.3 82.6 86.5 86.4 76.7 90.0 88.6 77.0 83.7 82.7 92.5 88.9
94.6 80.5 91.5 90.8 89.9 93.8 98.6 95.8
100.9 97.2 97.3 98.6 92.0
101.1 99.9
97.9 98.8 96.7
101.9 98.7 98.7
102.3 103.4 104.0 105.0 106.1 110.0 106.4 107.2 104.8
107.4 97.5
106.9 103.1 105.8 109.5 113.0 112.6 111.8 113 .3 109.1 119.1 104.9 116.1 108.7
10.618 10.898 13.951 13.386 12.907 14.738 15.763 18.196 14.784 24.328 16.631
21.532 21.504
101.0 100.0 109.6 108.2 107.5 111 .7 114.8 120.4 112.6 132.5 117.0
127.3 127.2
18.456 17.813 15.028 14.523 16.554 14.596 20.356 21.521 20.295 21.885
19.369
120.7 118.7 112.0 109.7 116.2 111.3 125.0 126.8 124.6 128.0
123.0
2.654 2.544 2.731 2.861 2.697 3.211 2.622 2.626 2.366 2.730 2.999 2.933 3.000 2.729 2.579
59.9 59.8 61.6 62.8 61.6 65.4 61.4 61.7 59.2 62.2 64.3 63.5 64.4 62.3 61.8
=====================================================================================================================================
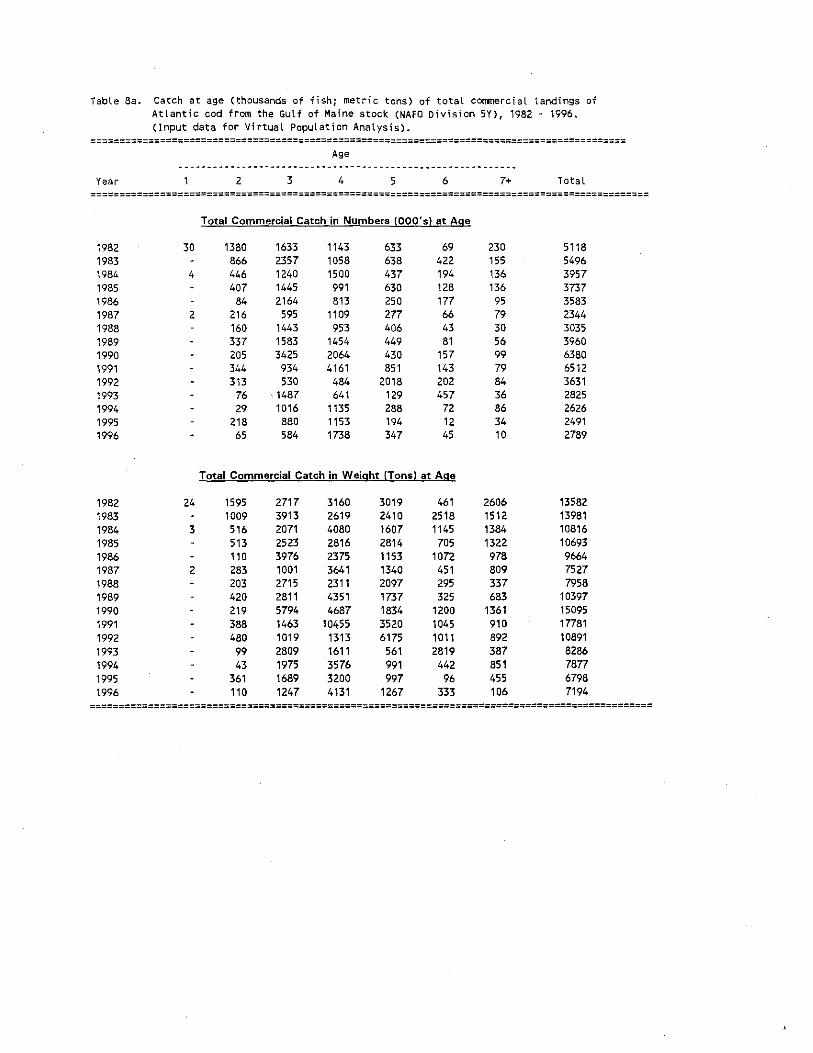
Table 8a. Catch at age (thousands of fish; metric tons) of total commercial landings of Atlantic cod from the Gulf of Maine stock (NAFO Division 5Y), 1982 . 1996. (Input data for VirtuaL population AnaLysis).
==========================================================;:================================= Age
Year 2 3 4 5 6 7+ Total =================================================================================================
1982 1983 1984 1985 1986 1987 1988 1989 1990 1991 1992 1993 1994 1995 1996
1982 1983 1984 1985 1986 1987 1988 1989 1990 1991 1992 1993 1994 1995 1996
30
4
2
24
3
2
Total Commercial Catch in Numbers (OOO's) at Age
1380 866 446 407
84 216 160 337 205 344 313
76 29
218 65
1633 2357 1240 1445 2164 595
1443 1583 3425 934 530
. 1487 1016 880 584
1143 1058 1500 991 813
1109 953
1454 2064 4161 484 641
1135 1153 1738
633 638 437 630 250 277 406 449 430 851
2018 129 288 194 347
69 422 194 128 177 66 43 81
157 143 202 457
72 12 45
Total Commercial Catch in Weight (Tons) at Age
1595 1009 516 513 110 283 203 420 219 388 480 99 43
361 110
2717 3913 2071 2523 3976 1001 2715 2811 5794 1463 1019 2809 1975 1689 1247
3160 2619 4080 2816 2375 3641 2311 4351 4687
10455 1313 1611 3576 3200 4131
3019 2410 1607 2814 1153 1340 2097 1737 1834 3520 6175
561 991 997
1267
461 2518 1145 705
1072 451 295 325
1200 1045 1011 2819 442
96 333
230 155 136 136 95 79 30 56 99 79 84 36 86 34 10
2606 1512 1384 1322 978 809 337 683
1361 910 892 387 851 455 106
5118 5496 3957 3737 3583 2344 3035 3960 6380 6512 3631 2825 2626 2491 2789
13582 13981 10816 10693 9664 7527 7958
10397 15095 17781 10891 8286 7877 6798 7194
=================================================================================================

Table ab. Mean weight (kg) and mean length (em) at age of total commercial landings of Atlantic cod from the Gulf of Maine stock (NAFO Division 5Y), 1982 M 1996. (Input data for Virtual Population Analysis)
===========================================================:================================= Age
Year 2 3 4 5 6 7+ Average =================================================================================================
Total Commercial Catch Mean Weight {kgl at Age
1982 0.801 1.156 1.664 2.764 4.nO 6.739 11.330 2.654 1983 1.164 1.660 2.475 3.778 5.962 9.755 2.544 1984 0.589 1.159 1.670 2.721 3.6n 5.898 10.176 2.731 1985 1.260 1.746 2.840 4.466 5.525 9.721 2.861 1986 1.304 1.837 2.923 4.619 6.067 10.295 2.697 1987 1.028 1.313 1.684 3.283 4.831 6.824 10.241 3.211 1988 1.268 1.881 2.426 5.166 6.767 11. 233 2.622 1989 1.247 1.776 2.993 3.864 4.872 12.200 2.626 1990 1.071 1.692 2.271 4.265 7.645 13.747 2.366 1991 1.130 1.568 2.512 4.136 7.309 11.449 2.730 1992 1.533 1.922 2.714 3.061 5.000 10.614 2.999 1993 1.293 1.889 2.513 4.353 6.174 11.063 2.933 1994 1.450 1.943 3.151 3.444 6.132 10.018 3.000 1995 1.652 1.921 2.m 5.142 8.290 12.969 2.729 1996 1.687 2.136 2.376 3.648 7.376 11.647 2.579
Total Commercial Catch Mean Length {em! at Age
1982 43.2 48.3 53.8 63.4 76.8 86.1 101.6 59.9 1983 48.6 53.8 61.4 70.8 82.4 95.1 59.8 1984 39.0 48.4 54.1 63.4 69.7 81.8 98.0 61.6 1985 49.8 55.1 64.6 74.9 80.3 96.7 62.8 1986 50.3 55.9 65.0 75.4 82.6 98.4 61.6 1987 47.0 50.4 54.4 67.8 76.9 86.5 98.4 65.4 1988 50.1 56.4 61.1 78.7 86.4 103.1 61.4 1989 .49.8 55.5 65.7 71.5 76.7 103.6 61.7 1990 47.5 54.8 60.0 73.7 90.0 108.8 59.2 1991 47.7 52.6 61.8 72.6 88.6 102.2 62.2 1992 53.1 56.6 62.9 65.6 n.o 100.4 64.3 1993 50.5 56.8 61.7 74.2 83.7 101.6 63.5 1994 52.4 57.2 66.6 68.1 82.7 97.6 64.4 1995 54.4 56.9 63.4 78.6 92.5 107.1 62.3 1996 54.6 58.8 60.7 69.3 88.9 103.5 61.8
=================================================================================================

Table 9. Mean weight at age (kg) at the beginning of the year (January 1) for AtLantic cod from the Gulf of Maine stock (NAFO Division 5Y), 1982 - 1996. Values derived from commercial landings mean weight-at-data (mid-year) using procedures described by Rivard (1980).
====================================================================================================================================== Age
Year 2 3 4 5 6 7 8 9 10+ raj ======================================================================================================================================
1982 0.791 0.965 1.364 2.364 (3.750) (5.600) (7.400) 9.853 (11.650) 17.771 1983 0.793 1.024 1.385 2.029 3.231 5.333 6.256 9.701 10.010 17.771 1984 0.761 1.021 1.394 2.125 3.017 4.720 6.957 (9.670) 11.646 17.771 1985 0.748' 1.065 1.423 2.178 3.486 4.507 6.826 9.544 10.468 17.771 1986 0.745 1.083 1.521 2.259 3.622 5.205 6.509 8.902 11.824 17.771 1987 0.758 1.087 1.482 2.456 3.758 5.614 7.339 8.767 11.744 17.771 1988 0.765 1.068 1.572 2.021 4.118 5.718 8.233 9.939 12.245 17.771
1989 0.825 1.059 1.501 2.373 3.062 5.017 7.919 10.889 12.835 17.771
1990 0.803 0.982 1.453 2.008 3.573 5.435 7.232 10.438 13.388 17.771
1991 0.690 1.008 1.296 2.062 3.065 5.583 8.586 11. 501 13.520 17.771
1992 0.751 1.175 1.474 2.063 2.773 4.548 8.362 10.962 12.873 17.771
1993 0.709 1.079 1. 702 2.198 3.438 4.347 7.071 11.518 14.786 17.771
1994 0.664 1.142 1.585 2.440 2.942 5.168 7.168 11.237 12.929 17.771
1995 0.657 1.219 1.669 2.322 4.025 5.343 8.113 10.366 14.405 17.771
1996 0.657 1.232 1.878 2.136 3.182 6.159 9.303 11.316 13.190 17.771
Mean Values 1992·96 0.688 1.169 1.662 2.232 3.272 5.113 8.003 11.080 13.637 17.771
1982·96 0.741 1.081 1.513 2.202 3.437 5.330 7.608 10.160 12.479 17.771
======================================================================================================================================
[a] Mean weight-at-age values for 10+ set equal to mean (1982-1996) catch (mid-year) weight at age value for 10+.
( ) Values in parentheses are modified from calculated values.

Table 10a. Catch at age (thousands of fish; metric tons) of total recreational landings of Atlantic cod from the Gulf of Maine stock (NAFO Division SY), 1982 - 1996. (Partial input data for trial Virtual Population Analysis)
====:===:======:===:========================================================================= Age
Year 2 3 4 5 6 7+ TotaL =================================================================================================
1982 1983 1984 1985 1986 1987 1988 1989 1990 1991 1992 1993 1994 1995 1996
1982 1983 1984 1985 1986 1987 1988 1989 1990 1991 1992 1993 1994 1995 1996
58 14 20 49 26 39
6 5 7 5
26 6 9
18 11 11 1 3
Total Recreational Catch in Numbers 1000's) at Age
615 471 367 582 124 691 360 193 89
103 37 76 28 61 21
717 539 332 666 586 823 697 701 770 415
70 511 364 272 104
243 126 136 131 116 416 196 244 309 787 42
146 93
171 205
84 47 32 35 25 53 28 36 58 95
166 11 27 10 21
6 26 11 5
20 13
8 10 10
8 14 24
2 2
Total Recreational Catch in Weight {Tons} at Age
556 412 304 494 103 634 310 208 80
119 56 73 35 91 32
1018 751 480 899 970
1184 1049 1111 1147 582 130 841 593 443 193
559 272 332 305 304
1111 425 628 727
1749 119 292 214 331 406
373 158 103 115 99
224 107 124 212 287 509
33 56 36 54
33 173 47 20
114 96 26 61 66 48 69
108 7 4 7
12 14 6 1
95 18 4 5 6 6 2 3 2
132 168
78 5
1247 189 26 43 63 34 19 41 17
3
1735 1237 904
1469 992
2053 1299 1194 1249 1419
331 772 517 516 352
2697 1940 1353 1856 2848 3449 1944 2178 2296 2820 902
1389 922 905 695
=================================================================================================
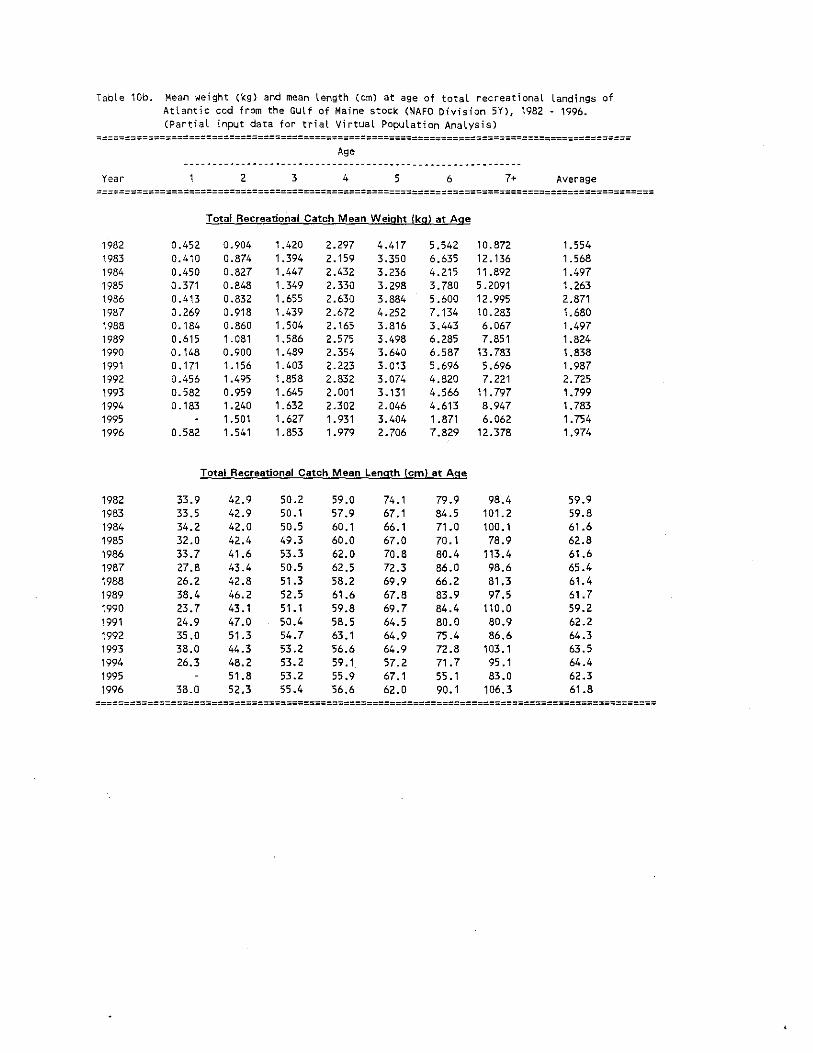
Table 10b. Mean weight (kg) and mean length (em) at age of total recreationaL Landings of AtLantic cod from the GuLf of Maine stock (NAFO Division 5Y), 1982 - 1996. (Partial input data for triaL VirtuaL Poputation AnaLysis)
============================================================================================= Age
Year 2 3 4 5 6 7+ Average =================================================================================================
1982 1983 1984 1985 1986 1987 1988 1989 1990 1991 1992 1993 1994 1995 1996
1982 1983 1984 1985 1986 1987 1988 1989 1990 1991 1992 1993 1994 1995 1996
0.452 0.410 0.450 0.371 0.413 0.269 0.184 0.615 0.148 0.171 0.456 0.582 0.183
0.582
33.9 33.5 34.2 32.0 33.7 27.8 26.2 38.4 23.7 24.9 35.0 38.0 26.3
38.0
Total Recreational Catch Mean Weight (kg) at Age
0.904 0.874 0.827 0.848 0.832 0.918 0.860 1. 081 0.900 1.156 1.495 0.959 1.240 1 .501 1.541
1 . .420 1.394 1.447 1.349 1.655 1.439 1.504 1.586 1.489 1.403 1.858 1.645 1.632 1.627 1.853
2.297 2.159 2.432 2.330 2.630 2.672 2.165 2.575 2.354 2.223 2.832 2.001 2.302 1. 931 1.979
4.417 3.350 3.236 3.298 3.884 4.252 3.816 3.498 3.640 3.013 3.074 3.131 2.046 3.404 2.706
5.542 6.635 4.215 3.780 5.600 7.134 3.443 6.285 6.587 5.696 4.820 4.566 4.613 1.871 7.829
Total Recreational Catch Mean Length (cm) at Age
42.9 42.9 42.0 42.4 41.6 43.4 42.8 46.2 43.1 47.0 51.3 44.3 48.2 51.8 52.3
50.2 50.1 50.5 49.3 53.3 50.5 51.3 52.5 51. 1 50.4 54.7 53.2 53.2 53.2 55.4
59.0 57.9 60.1 60.0 62.0 62.5 58.2 61.6 59.8 58.5 63.1 56.6 59.1 55.9 56.6
74.1 67.1 66.1 67.0 70.8 72.3 69.9 67.8 69.7 64.5 64.9 64.9 57.2 67.1 62.0
79.9 84.5 71.0 70.1 80.4 86.0 66.2 83.9 84.4 80.0 75.4 72.8 71.7 55.1 90.1
10.872 12.136 11.892 5.2091 12.995 10.283 6.067 7.851
13.783 5.696 7.221
11.797 8.947 6.062
12.378
98.4 101.2 100.1 78.9
113.4 98.6 81.3 97.5
110.0 80.9 86.6
103.1 95.1 83.0
106.3
1. 554 1.568 1.497 1.263 2.871 1.680 1.497 1.824 1.838 1.987 2.725 1.799 1. 783 1.754 1.974
59.9 59.8 61.6 62.8 61.6 65.4 61.4 61.7 59.2 62.2 64.3 63.5 64.4 62.3 61.8
=================================================================================================
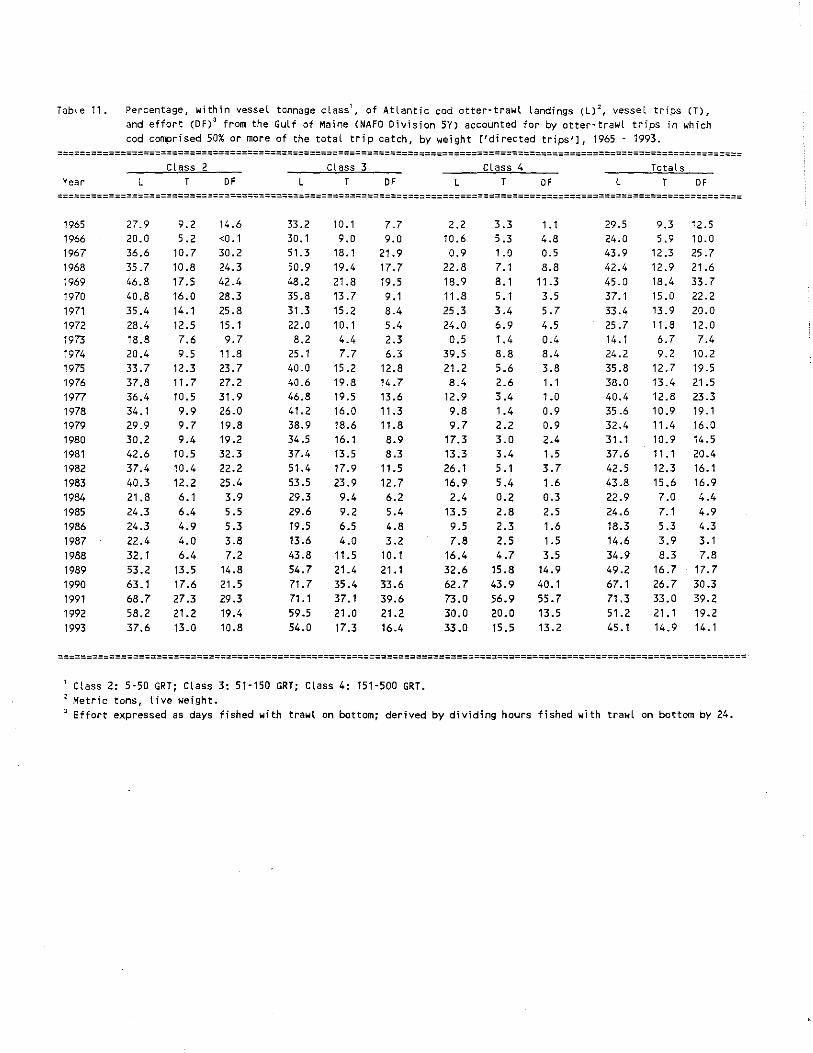
Table 11. Percentage, within vessel tonnage class', of Atlantic cod otter-trawl landings (L)2, vessel trips (n, and effort (DF)3 from the Gulf of Maine (NAFO Division 5Y) accounted for by otter-trawl trips in which cod comprised 50% or more of the total trip catch, by weight ('directed trips'], 1965 - 1993.
======================================================================================================================= Class 2 Class 3 Class 4 Totals
Year L T OF L T OF L T OF L T OF =======================================================================================================================
1965 1966 1967 1968 1969 1970 1971 1972 1973 1974 1975 1976 1977 1978 1979 1980 1981 1982 1983 1984 1985 1986 1987 1988 1989 1990 1991 1992 1993
27.9 20.0 36.6 35.7 46.8 40.8 35.4 28.4 18.8 20.4 33.7 37.8 36.4 34.1 29.9 30.2 42.6 37.4 40.3 21.8 24.3 24.3 22.4 32.1 53.2 63.1 68.7 58.2 37.6
9.2 5.2
10.7 10.8 17.5 16.0 14.1 12.5 7.6 9.5
12.3 11.7 10.5 9.9 9.7 9.4
10.5 10.4 12.2 6.1 6.4 4.9 4.0 6.4
13.5 17.6 27.3 21.2 13.0
14.6 <0.1 30.2 24.3 42.4 28.3 25.8 15.1 9.7
11.8 23.7 27.2 31.9 26.0 19.8 19.2 32.3 22.2 25.4 3.9 5.5 5.3 3.8 7.2
14.8 21.5 29.3 19.4 10.8
33.2 30.1 51.3 50.9 48.2 35.8 31.3 22.0 8.2
25.1 40.0 40.6 46.8 41.2 38.9 34.5 37.4 51.4 53.5 29.3 29.6 19.5 13.6 43.8 54.7 71.7 71.1 59.5 54.0
10.1 9.0
18.1 19.4 21.8 13.7 15.2 10.1 4.4 7.7
15.2 19.8 19.5 16.0 18.6 16.1 13.5 17.9 23.9 9.4 9.2 6.5 4.0
11.5 21.4 35.4 37.1 21.0 17.3
7.7 9.0
21.9 17.7 19.5 9.1 8.4 5.4 2.3 6.3
12.8 14.7 13.6 11.3 11.8 8.9 8.3
11.5 12.7 6.2 5.4 4.8 3.2
10.1 21.1 33.6 39.6 21.2 16.4
2.2 10.6 0.9
22.8 18.9 11.8 25.3 24.0
0.5 39.5 21.2 8.4
12.9 9.8 9.7
17.3 13.3 26.1 16.9 2.4
13.5 9.5 7.8
16.4 32.6 62.7 73.0 30.0 33.0
3.3 5.3 1.0 7.1 8.1 5.1 3.4 6.9 1.4 8.8 5.6 2.6 3.4 1.4 2.2 3.0 3.4 5.1 5.4 0.2 2.8 2.3 2.5 4.7
15.8 43.9 56.9 20.0 15.5
1.1 4.8 0.5 8.8
11.3 3.5 5.7 4.5 0.4 8.4 3.8 1.1 1.0 0.9 0.9 2.4 1.5 3.7 1.6 0.3 2.5 1.6 1.5 3.5
14.9 40.1 55.7 13.5 13.2
29.5 24.0 43.9 42.4 45.0 37.1 33.4 25.7 14.1 24.2 35.8 38.0 40.4 35.6 32.4 31.1 37.6 42.5 43.8 22.9 24.6 18.3 14.6 34.9 49.2 67.1 71.3 51.2 45.1
9.3 12.5 5.9 10.0
12.3 25.7 12.9 21.6 18.4 33.7 15.0 22.2 13.9 20.0 11.8 12.0 6.7 7.4 9.2 10.2
12.7 19.5 13.4 21.5 12.8 23.3 10.9 19.1 11.4 16.0 10.9 14.5 11.1 20.4 12.3 16.1 15.6 16.9 7.0 4.4 7.1 4.9 5.3 4.3 3.9 3.1 8.3 7.8
16.7 17.7 26.7 30.3 33.0 39.2 21.1 19.2 14.9 14.1
=======================================================================================================================
, Class 2: 5·50 GRT; Class 3: 51-150 GRT; Class 4: 151-500 GRT. 2 Metric tons, live weight. 3 Effort expressed as days fished with trawl on bottom; derived by dividing hours fished with trawL on bottom by 24.
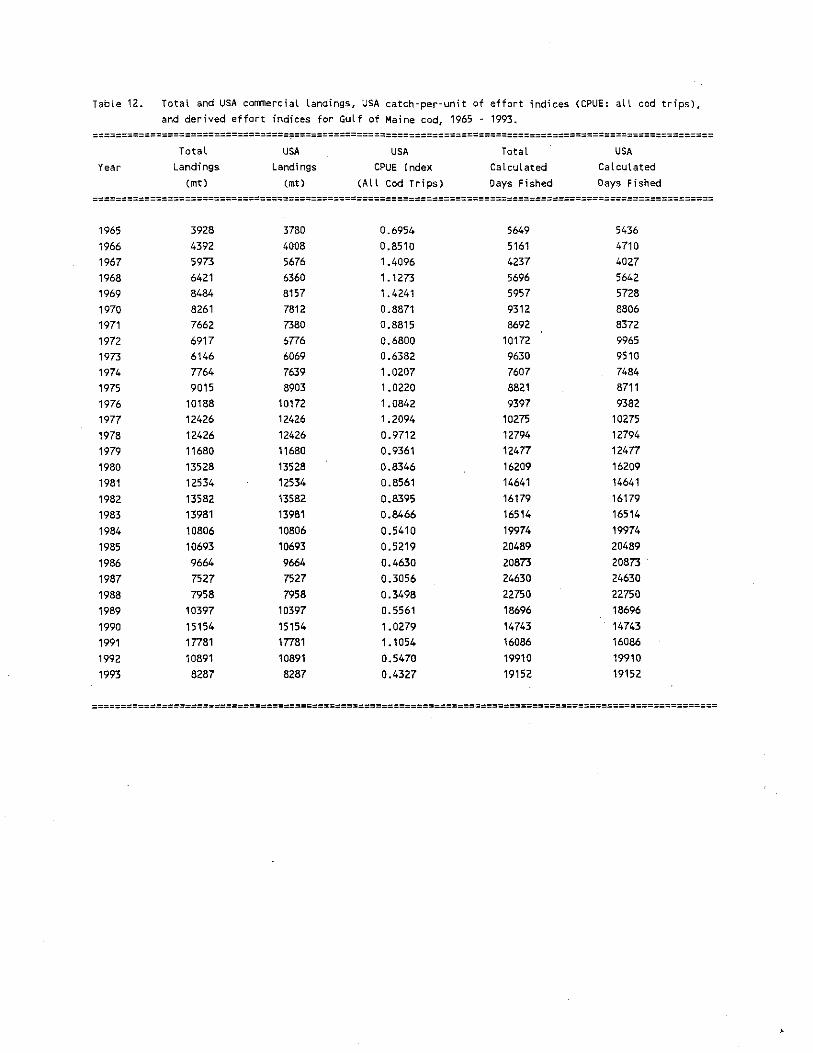
TabLe 12. Total and USA COlll11erc;al Landings, USA catch~per·un;t of effort indices (CPUE: atl cod trips),
and der ived effort indi ces for GuL f of Ma; ne cod, 1965 ~ 1993. ==================================?=========================================================================
Year
TotaL
Landings
(mt)
USA Landings
(mt)
USA CPUE Index
(All Cod Trips)
Total
Calculated
Days Fished
USA Calculated
Days Fished
============================================================================================================
1965 1966 1967 1968 1969 1970 1971 1972 1973 1974 1975 1976 1977 1978 1979 1980 1981 1982 1983 1984 1985 1986 1987 1988 1989 1990 1991 1992 1993
3928 4392 5973 6421 8484 8261 7662 6917 6146 7764 9015
10188 12426 12426 11680 13528 12534 13582 13981 10806 10693 9664 7527 7958
10397 15154 17781 10891 8287
3780 4008 5676 6360 8157 7812 7380 6776 6069 7639 8903
10172 12426 12426 11680 13528 12534 13582 13981 10806 10693 9664 7527 7958
10397 15154 17781 10891 8287
0.6954 0.8510 1.4096 1.1273 1 .4241 0.8871 0.8815 0.6800 0.6382 1.0207 1.0220 1.0842 1.2094 0.9712 0.9361 0.8346 0.8561 0.8395 0.8466 0.5410 0.5219 0.4630 0.3056 0.3498 0.5561 1.0279 1.1054 0.5470 0.4327
5649 5161 4237 5696 5957 9312 8692
10172 9630 7607 8821 9397
10275 12794 12477 16209 14641 16179 16514 19974 20489 20873 24630 22750 18696 14743 16086 19910 19152
5436 4710 4027 5642 5728 8806 8372 9965 9510 7484 8711 9382
10275 12794 12477 16209 14641 16179 16514 19974 20489 20873 24630 22750 18696 14743 16086 19910 19152
============================================================================================================

Table 13. Results of fishing effort standardization for GuLf of Maine cod using SAS General linear ModeLs Procedure on Landings and effort data from 1982 through 1993.
==============================================~===========================================================================
General linear ModeLs Procedure Dependent VariabLe: lNCPUEDF
Source OF Sum of Squares Mean Square F Va Lue Pr > F
Model 25 11590.71659123 463.62866365 297.95 0.000
Error 24312 37830.50628931 1.55604254
Corrected TotaL 24337 49421.22288055
R~Square C.V. Root MSE lNCPUEDF Mea
0.234529 ·112.2323 1.24741434 '1.1114573
Source OF Tt:l2e I 55 Mean Sguare F VaLue Pr > F YEAR 11 4833.96208197 439.45109836 282.42 0.000 AREA 4 164.54673741 41. 13668435 26.44 0.000 QTR 3 1191. 97998989 397.32666330 255.34 0.000 TONCLA55 4 3340.33653032 835.08413258 536.67 0.000 OEPTHCO 3 2059.89125164 686.63041721 441.27 0.000
Source OF Tt:l2e II I SS Mean Sguare F Value Pr > F YEAR 11 4372.73212998 397.52110273 255.47 0.000 AREA 4 302.41968487 75.60492122 48.59 0.000 QTR 3 1241.37073929 413.79024643 265.92 0.000 TON CLASS 4 4005 . 54777969 1001.38694492 643.55 0.000 DEPTHCO 3 2059.89125164 686.63041721 441.27 0.000
T for HO: Pr > i TI Std Error of Retransformed Parameter Estimate Parameter=O Estimate Estimate INTERCEPT '0.975002369 B ·23.16 0.0001 0.04210412 AREA 511 0.314761808 B 5.46 0.0001 0.05768044 1.372214
512 0.076641989 B 2.22 0.0262 0.03448159 1. 080298 513 0.259103053 B 10.62 0.0001 0.02440657 1.296153 515 '0.021602360 B ·0.71 0.4778 0.03043501 0.979083
.. , 514 0.000000000 B 1.000000
QTR 1 '0.443624023 B ·18.41 0.0001 0.02409136 0.641893 3 '0.572620753 B '25.38 0.0001 0.02255770 0.564189 4 '0.496972511 B '22.60 0.0001 0.02199250 0.608517 2 0.000000000 B 1.000000
TONCLA55 31 0.452176751 B 18.79 0.0001 0.02406528 1.572185 32 0.867362374 B 35.22 0.0001 0.02462967 2.381346 33 0.9284318n B 34.51 0.0001 0.02690090 2.531454 41 1.357558269 B 46.92 0.0001 0.02893149 3.888318 25 0.000000000 B 1.000000
DEPTHCD 1 0.631312591 B 20.09 0.0001 0.03142483 1.881005 2 0.360688553 B 14.82 0.0001 0.02433859 1.434742 4 ·0.647192169 B ·25.11 0.0001 0.02576926 0.523688 3 0.000000000 B 1.000000
==========================================================================================================================

Table 14. Nominal and standardized (GLM) Gulf of Maine cod landings (mt). effort (days fished) and landings per day fished (LPUE) for the otter trawl effort standardization fleet. 1982-1996.
===================================================================================== Effort Standardization Subfleet Sunrnary: Results TotaL Raised Landings Nominal Standardized Landings Effort
Year {mt2 Effort LPUE Effort LPUE {mt2 1982 3395 3158 1.075 6042 0.562 13582 24167 1983 3698 3791 0.975 7069 0.523 13981 26730 1984 2423 3798 0.638 6700 0.362 10806 29881 1985 3012 5294 0.569 9985 0.302 10693 35446
1986 2794 5568 0.502 10280 0.272 9664 35558 1987 1708 5100 0.335 9618 0.178 7527 42392 1988 2060 4753 0.433 9552 0.216 7958 36898 1989 2316 3524 0.657 7363 0.314 10397 33061 1990 4916 4053 1.213 9020 0.545 15154 27807 1991 5432 4737 1.147 10139 0.536 17781 33188
1992 2m 4978 0.558 9637 0.288 10891 37795 1993 2284 4727 0.483 8605 0.265 8287 31219 1994* 1160 5005 0.232 9034 0.128 7877 61357 1995' 1829 7215 0.254 14002 0.131 6798 52031
1996' 2065 6695 0.308 11930 0.173 7194 41558
===================================================================================== * 1982-1993 data from interviews; 1994-1996 data from Vessel Trip Reports
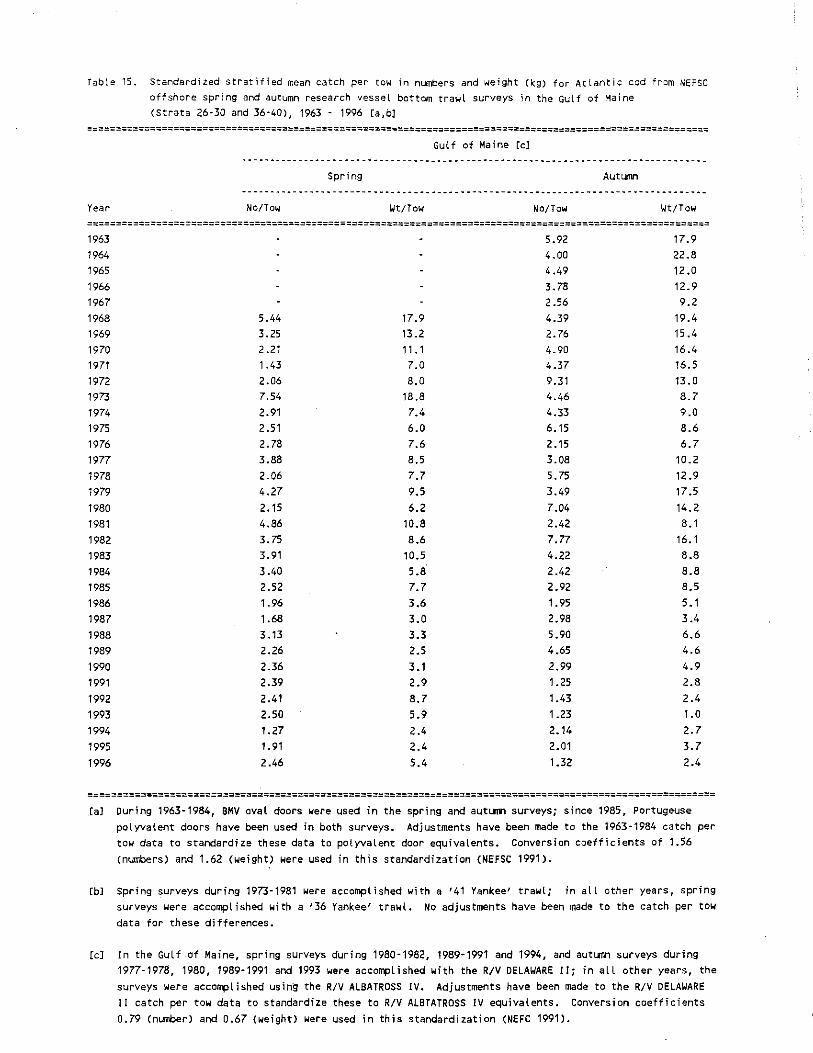
fable 15. Standardized stratified mean catch per tow in numbers and weight (kg) for Atlantic cod from NEFSC offshore spring and autumn research vessel bottom trawl surveys in the Gulf of Maine (Strata 26·30 and 36·40), 1963 . 1996 [a,b]
=====================================================~======================================================
Gulf of Maine [cl
Spring Autumn
Year No/Tow \.It!Tow No/Tow \.It/ToW ============================================================================================================ 1963 5.92 17.9 1964 4.00 22.8 1965 4.49 12.0 1966 3.78 12.9 1967 2.56 9.2 1968 5.44 17.9 4.39 19.4 1969 3.25 13.2 2.76 15.4 1970 2.21 11. 1 4.90 16.4 1971 1.43 7.0 4.37 16.5 1972 2.06 8.0 9.31 13.0 1973 7.54 18.8 4.46 8.7 1974 2.91 7.4 4.33 9.0 1975 2.51 6.0 6.15 8.6 1976 2.78 7.6 2.15 6.7 1977 3.88 8.5 3.08 10.2 1978 2.06 7.7 5.75 12.9 1979 4.27 9.5 3.49 17.5 1980 2.15 6.2 7.04 14.2 1981 4.86 10.8 2.42 8.1 1982 3.75 8.6 7.77 16.1 1983 3.91 10.5 4.22 8.8 1984 3.40 5.8 2.42 8.8 1985 2.52 7.7 2.92 8.5 1986 1.96 3.6 1.95 5.1 1987 1.68 3.0 2.98 3.4 1988 3.13 3.3 5.90 6.6 1989 2.26 2.5 4.65 4.6 1990 2.36 3.1 2.99 4.9 1991 2.39 2.9 1.25 2.8
1992 2.41 8.7 1.43 2.4 1993 2.50 5.9 1.23 1.0 1994 1.27 2.4 2.14 2.7 1995 1. 91 2.4 2.01 3.7 1996 2.46 5.4 1.32 2.4
============================================================================================================ raj During 1963-1984, BMV oval doors were used in the spring and autumn surveys; since 1985, Portugeuse
poLyvaLent doors have been used in both surveys. Adjustments have been made to the 1963-1984 catch per tow data to standardize these data to polyvaLent door equivalents. Conversion coefficients of 1.56 (numbers) and 1.62 (weight) were used in this standardization (NEFSC 1991).
[b] Spring surveys during 1973-1981 were accomplished with a '41 Yankee' trawl; in all other years, spring surveys were accomplished with a '36 Yankee' trawl. No adjustments have been made to the catch per tow data for these differences.
[e] In the Gulf of Maine, spring surveys during 1980-1982, 1989-1991 and 1994, and autumn surveys during 1977-1978, 1980, 1989-1991 and 1993 were accomplished with the R/V DELA~ARE II; in aLL other years, the surveys were accompL ished using the R/V ALBATROSS IV. Adjustments have been made to the R/V DELAWARE II catch per tow data to standardize these to R/V ALB TAT ROSS IV equivaLents. Conversion coefficients 0.79 (number) and 0.67 (weight) were used in this standardization (NEFC 1991).

Table 16. Estimates of instantaneous total mortality (Z) and fishing mortality (F)l for Gulf of Maine Atlantic cod for eight time periods, 1964 ~ 1993, derived from NEFSC offshore spring and autumn bottom trawl survey data. 2
======================================================================================
Time Period Z
Spring Gulf of Maine
Autumn Geometric Mean Z F Z F
======================================================================================
1964-1967 0.39 0.19 0.39 0.19
1968-1972 0.373 0.17 0.43 7 0.23 0.40 0.20
1973-1976 0.354 0.15 0.45 0.25 0.40 0.20
1977-1981 0.52 0.32 0.578 0.37 0.54 0.34
1982-1984 0.73 0.53 0.78 0.58 0.75 0.55
1985-1987 0.58' 0.38 1.05 0.85 0.78 0.58
1988-1990 1.24 1.04 0.72 0.61 0.94 0.74
1991-1993 1.028 0.82 1.18 0.98 1.10 0.90
1994-1996 1.31 1. 11 0.94 0.74 1. 11 0.91 ======================================================================================
Instantaneous natural mortality (M) assumed to be 0.20.
Estimates derived from:
Spring: Ln (1: age 4+ for year ; to j/ ~ age 5+ for years ;+1 to j+1 ). Autumn: Ln (~ age 3+ for years ;~1 to j-l/ ~ age 4+ for years i to j).
Excludes spring 1972-1973 data (4+{5+) since these gave large negative Z value •
• Excludes spring 1973-1974 data (4+{5+) since these gave unreasonably high Z value.
Excludes spring 1985-1986 data (4+{5+) since these gave unreasonably high Z value.
Excludes spring 1991-1992 data (4+{5+) sfnce these gave unreasonabLy tow Z va Lue.
Exctudes auturm 1967-1968 data (3+{4+) since these gave Large negative Z value.
Excludes autUflV1 1976-1977 data (3+{4+) since these gave Large negative Z value.

TabLe 17. Summary statistics of the base, alternative, and final ADAPT VPA calibration for Gulf of Maine cod; terminaL year 1996.
~~~~~~====~~====================================================================~========== ADAPT Run Number 361 1997 4 16 9 8 15
COD: GULF OF MAINE STOCK· COMMERCIAL LANDINGS ONLY FINAL CALIBRATION RUN ALL INDICES UNWEIGHTED;
N 2 N 3 N 4 N 5 N 6
NO TIME TAPERED WEIGHTING APPLIED 7+CAA
PAR. EST. STD. ERR. T·STATISTIC --------- --------- -----------7.21262E2 3.29056E2 2.19191EO 7.30254E2 2.24368E2 3.25471EO 1. 36997E3 4.25191E2 3.22201EO 1. 24398E3 5.05247E2 2.46212EO 1.25367E2 7.18052E1 1. 74593EO
ADAPT Run Number 358 1997 4 17 14 1 58 COD: GULF OF MAINE STOCK· COMERCIAL LANDINGS ONLY
ALL INDICES UNWEIGHTED;
N 2 N 3 N 4 N 5 N 6
NO TIME TAPERED WEIGHTING APPLIED FULL CAA 2·10+
PAR. EST. STD. ERR. T·STATISTIC --------- --------- -----------7.24209E2 3.29251E2 2.19956EO 7.33445E2 2.24515E2 3.26680EO 1.38003E3 4.26110E2 3.23868EO 1.34525E3 5.28603E2 2.54492EO 1.34433E2 7.58129E1 1.77322EO
ADAPT Run Number 356 1997 4 8 11 10 48
C.V. 1996 F Estimate ---------------
0.46 F 2 0.08 0.31 F 3 0.33 0.31 F 4 0.82 0.41 F 5 1.25 0.57 F 6 1.04
F 7+ 1.04
c.v. 1996 F Estimate ---------------
0.45 F 2 0.08 0.31 F 3 0.32 0.31 F 4 0.77 0.39 F 5 1.20 0.56 F 6 0.99
F 7 0.99 F 8 0.99 F 9 0.99 F 10+ 0.99
COD: GULF OF MAINE STOCK· COMMERCIAL AND RECREATIONAL LANDINGS ALL INDICES UNWEIGHTED;
N 2 N 3 N 4 N 5 N 6
NO TIME TAPERED WEIGHTING APPLIED 7+CAA
PAR. EST. STD. ERR. T·STATISTIC --------- --------- -----------9.05232E2 4. 16297E2 2. 17449EO 9.14172E2 2.82058E2 3.24108EO 1. 73550E3 5.27683E2 3.28890EO 1.54337E3 6.06747E2 2.54368EO 1.40041E2 7.99724E1 1.75112EO
ADAPT Run Number 360 1997 4 9 12 6 32
c.v.
0.46 0.31 0.30 0.39 0.57
COD: GULF OF MAINE STOCK· COMMERCIAL AND RECREATIONAL ALL INDICES UNWEIGHTED;
N 1 N 2 N 3 N 4 N 5 N 6
NO TIME TAPERED WEIGHTING APPLIED ESTIMATING AGE 1; ADDED AGE 1 INDICES FROM MASS SURVEYS 7+CAA
PAR. EST. STD. ERR_ T·STATISTIC --------- -----_.-- -----------6.45573E3 4.79997E3 1.34495EO 1.14175E3 4.25627E2 2.68251EO 1.83336E3 5.33715E2 3.43509EO 2.40028E3 7.09920E2 3.38106EO 1.57653E3 6.69826E2 2.35364EO 1.39938E2 9.11111E1 1.53591EO
c.v.
0.74 0.37 0.29 0.30 0.42 0.65
1996 F Estimate ---------------F 2 0.07 F 3 0.29 F 4 0.73 F 5 1.20 F 6 0.97 F 7+ 0.97
1996 F Estimate ---------------F 1 0.00 F 2 0.04 F 3 0.22 F 4 0.72 F 5 1.20 F 6 0.96 F 7+ 0.96
=~=========================================================================================
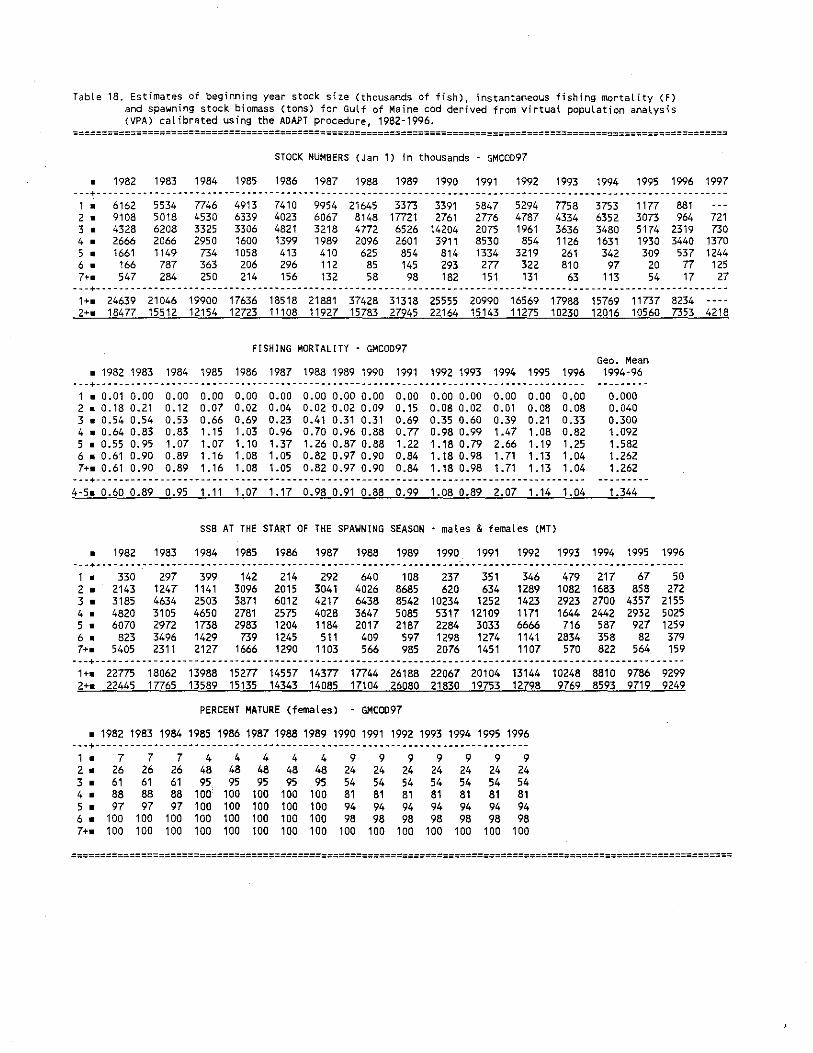
TabLe 18. Estimates of beginning year stock size (thousands of fish), instantaneous fishing mortaLity (F) and spawning stock biomass (tons) for Gulf of Maine cod derived from virtual popuLation analysis (VPA) caLibrated using the ADAPT procedure, 1982-1996.
==================================================================================================================
STOCK NUMBERS (Jan 1) in thousands - GMCOD97
• 1982 1983 1984 1985 1986 1987 1988 1989 1990 1991 1992 1993 1994 1995 1996 1997 ---+--------------------------------------------------------------------------------------------------------------1 • 6162 5534 7746 4913 7410 9954 21645 3373 3391 5847 5294 7758 3753 1177 881 2 • 9108 5018 4530 6339 4023 6067 8148 17721 2761 2776 4787 4334 6352 3073 964 721 3 • 4328 6208 3325 3306 4821 3218 4772 6526 14204 2075 1961 3636 3480 5174 2319 730 4 • 2666 2066 2950 1600 1399 1989 2096 2601 3911 8530 854 1126 1631 1930 3440 1370 5 • 1661 1149 734 1058 413 410 625 854 814 1334 3219 261 342 309 537 1244 6 • 166 787 363 206 296 112 85 145 293 277 322 810 97 20 77 125 7+. 547 284 250 214 156 132 58 98 182 151 131 63 113 54 17 27
---+------------------------------------------------------------------------------------------_.------------------1+. 24639 21046 19900 17636 18518 21881 37428 31318 25555 20990 16569 17988 15769 11737 8234 2+. 18477 15512 12154 12723 11108 11927 15783 27945 22164 15143 11275 10230 12016 10560 7353 4218
FISHING MORTALITY - GMC0097 Geo. Mean
• 1982 1983 1984 1985 1986 1987 1988 1989 1990 1991 1992 1993 1994 1995 1996 1994-96 ---+------------------------------------------------------------------------------------- ---------1 • 0.01 0.00 0.00 0.00 0.00 0.00 0.00 0.00 0.00 0.00 0.00 0.00 0.00 0.00 0.00 0.000 2.0.180.21 0.12 0.07 0.02 0.04 0.02 0.02 0.09 0.15 0.08 0.02 0.01 0.08 0.08 0.040 3 • 0.54 0.54 0.53 0.66 0.69 0.23 0.41 0.31 0.31 0.69 0.35 0.60 0.39 0.21 0.33 0.300 4 • 0.64 0.83 0.83 1.15 1.03 0.96 0.70 0.96 0.88 0.77 0.98 0.99 1.47 1.08 0.82 1.092 5 • 0.55 0.95 1.07 1.07 1.10 1.37 1.26 0.87 0.88 1.22 1.180.79 2.66 1.19 1.25 1.582 6 • 0.61 0.90 0.89 1.16 1.08 1.05 0.82 0.97 0.90 0.84 1.180.98 1.71 1.13 1.04 1.262 7+_ 0.61 0.90 0.89 1 .16 1.08 1.05 0.82 0.97 0.90 0.84 1.18 0.98 1.71 1.13 1.04 1.262
---+------------------------------------------------------------------------------------- ---------4-5. 0.60 0.89 0.95 1. 11 1.07 1 .17 0.98 0.91 0.88 0.99 1.08 0.89 2.07 1.14 1.04 1.344
SSB AT THE START OF THE SPAWNING SEASON - males & females (MT)
• 1982 1983 1984 1985 1986 1987 1988 1989 1990 1991 1992 1993 1994 1995 1996 ---+-------------------------------------------------- -------------~--------------------------------------1 • 330 297 399 142 214 292 640 108 237 351 346 479 217 67 50 2 • 2143 1247 1141 3096 2015 3041 4026 8685 620 634 1289 1082 1683 858 272 3 • 3185 4634 2503 3871 6012 4217 6438 8542 10234 1252 1423 2923 2700 4357 2155 4 • 4820 3105 4650 2781 2575 4028 3647 5085 5317 12109 1171 1644 2442 2932 5025 5 • 6070 2972 1738 2983 1204 1184 2017 2187 2284 3033 6666 716 587 927 1259 6 • 823 3496 1429 739 1245 511 409 597 1298 1274 1141 2834 358 82 379 7+. 5405 2311 2127 1666 1290 1103 566 985 2076 1451 1107 570 822 564 159
---+---------------------------------------------------------------------------.--------------------------1+. 22775 18062 13988 15277 14557 14377 17744 26188 22067 20104 13144 10248 8810 9786 9299 2+. 22445 17765 13589 15135 14343 14085 17104 26080 21830 19753 12798 9769 8593 9719 9249
PERCENT MATURE (females) - GMC0097
• 1982 1983 1984 1985 1986 1987 1988 1989 1990 1991 1992 1993 1994 1995 1996 ---+----------------------------------------------------------------------.----1 • 7 7 7 4 4 4 4 4 9 9 9 9 9 9 9 2 • 26 26 26 48 48 48 48 48 24 24 24 24 24 24 24 3 • 61 61 61 95 95 95 95 95 54 54 54 54 54 54 54 4 • 88 88 88 100 100 100 100 100 81 81 81 81 81 81 81 5 • 97 97 97 100 100 100 100 100 94 94 94 94 94 94 94 6 • 100 100 100 100 100 100 100 100 98 98 98 98 98 98 98 7+. 100 100 100 100 100 100 100 100 100 100 100 100 100 100 100
==================================~===============================================================================

Table 19. Results of retrospective analysis of Gulf of Maine cod VPA based on final ADAPT formulation. ===========================================================================================================================
A: Recruitment at age 2
STOCK NUMBERS (Jan 1) in thousands· GMCOO97_RETRO
Term Yr • 1982 1983 1984 1985 1986 1987 1988 1989 1990 1991 1992 1993 1994 1995 1996 1997 ----------------------------------------------------------------------------------------------------------_.---_.-_._-- ..
1991 • 9107 5017 4530 6333 4011 5984 8086 16868 3555 2680 4024 1992 • 9108 5018 4531 6339 4027 6069 8189 17742 2783 2741 4473 5090 1993 • 9108 5018 4531 6339 4024 6067 8156 17728 2827 2553 4213 4329 4221 1994 • 9108 5018 4531 6339 4025 6072 8162 17843 2776 2900 4821 4683 5345 3910 1995 • 9108 5018 4530 6339 4023 6067 8151 17738 2776 2782 4977 4370 5776 3623 723 1996 • 9108 5018· 4530 6339 4023 6067 8148 17721 2761 2776 4787 4333 6350 3071 964 721
B: Average (ages 4-5) unweighted f
FISHING MORTALITY· GMCOO97_RETRO
Term Yr • 1982 1983 1984 1985 1986 1987 1988 1989 1990 1991 1992 1993 1994 1995 1996
1991 .0.590.890.95 1.11 1.07 1.170.990.940.931.07 1992 • 0.59 0.89 0.95 1. 11 1.07 1.170.980.91 0.870.98 1.06 1993 • 0.590.89 0.95 1.11 1.07 1.170.980.920.870.99 1.040.97 1994 • 0.59 0.89 0.95 1. 11 1.07 1.170.980.910.870.99 1.05 0.82 1.46 1995 • 0.59 0.89 0.95 1. 11 1.07 1.170.980.920.881.00 1.07 0.87 1.89 0.89 1996 • 0.59 0.89 0.95 1. 11 1.07 1.170.980.920.881.00 1.08 0.89 2.06 1.13 1.04
c: Spawning Stock Biomass
SSB AT THE START Qf THE SPAYNING SEASON - males & females (MT)
Term Yr • 1982 1983 1984 1985 1986 1987 1988 1989 1990 1991 1992 1993 1994 1995 1996
1991 • 22775 18061 13986 15271 14537 14304 17547 25532 21397 18983 1992 • 22776 18062 13988 15278 14560 14386 1m6 26259 22158 20192 13296 1993 • 22775 18062 13988 15277 14558 14379 17751 26207 22083 20073 12968 9516 1994 • 22775 18062 13988 15278 14559 14384 17767 26280 22194 20338 13527 10757 9318 1995 • 22775 18062 13988 15277 14557 14379 17749 26204 22089 20158 13262 10431 9168 10099 1996 • 22775 18062 13988 15277 14557 14377 17744 26188 22067 20104 13143 10247 8808 9782 9292
_._---------_._._----_._----_._-----.--_._-----_._--------_. __ .... __ ._------_._----- .... _------_._-._------- ..... _-
===========================================================================================================================

Table 20. Yield and spawning stock biomass per recruit estimates and input data for GuLf of Maine cod.
=====================================================================
The NEFC Yield and Stock Size per Recruit Program - PDBYPRC PC Ver.1.2 (Method of Thompson and BeLL (1934)] 1-Jan-1992
Run Date: 17- 4-1997; Time: 15:07:56.86 GULF OF MAINE COO (5Y)· 1997 UPDATED AVE WTS, FPAT AND MAT VECTORS
Proportion of F before spawning: .1667 Proportion of M before spawning: .1667 Natural Mortal ity is Constant at: .200 Initial age is: 1; Last age is: 10 last age is a PLUS group; Original age-specific PRs, Mats, and Mean Wts from fiLe: ==> YRCODGMA.DAT
Age-specific Input data for Yield per Recruit AnaLysis
Age 1 Fish Mort Nat Mort i Proportion I Average Weights
1 2 3 4 5 6 7 8 9
10+
i Pattern Pattern I Mature i Catch stock
.0000
.0281
.2110
.7680 1.0000 1.0000 1.0000 1.0000 1.0000 1. 0000
1.0000 1.0000 1. DODO 1.0000 1.0000 1.0000 1.0000 1.0000 1.0000 1.0000
.0900
.2400
.5400
.8100
.9400 1.0000 1.0000 1.0000 1.0000 1.0000
.500 1.312 1. 799 2.716 4.215 6.439 9.064
11.484 13.787 17.771
.741 1.081 1.513 2.202 3.437 5.330 7.608
10.160 12.479 17.771
Summary of Yield per Recruit Analysis for: GULF OF MAINE COD (5Y)· 1997 UPDATED AVE WTS, FPAT AND MAT VECTORS
SLope of the Yield/Recruit Curve at F-O.OO: --> 27.4085 F Level at sLope=1/10 of the above sLope (FO.1): -----> .163
Yield/Recruit corresponding to FO.1: -----> 1.7404 F level to produce Maximum Yield/Recruit (Fmax): ___ eo> .289
Yield/Recruit corresponding to Fmax: ___ eo> 1.8713 F LeveL at 20 % of Max Spawning Potential (F20): -----> .373
SSB/Recruit corresponding to F20: --------> 5.5590
Listing of Yield per Recruit Results for: GULF OF MAINE COD (5Y)· 1997 UPDATED AVE WTS, FPAT AND MAT VECTORS
FMORT TOTCTHN TOTCTHW TOTSTKN TOTSTKW SPNSTKN SPNSTKW % MSP ------------------------------------------------------.---------------------
.00 .00000 .00000 5.5167 30.8756 3.4286 27.7974 100.00
.10 .18611 1.45976 4.5906 17.9353 2.5073 15.0585 54.17 FO.l .16 .25119 1.74042 4.2678 13.9846 2.1874 11.2009 40.29
.20 .28051 1.81725 4.1228 12.3471 2.0439 9.6100 34.57 Fmax .29 .33293 1.87129 3.8642 9.6907 1. 7891 7.0440 25.34
.30 .33816 1.87072 3.8384 9.4471 1.7638 6.8099 24.50 F20% .37 .36799 1.84735 3.6920 8.1405 1.6203 5.5590 20.00
.40 .3m9 1.83317 3.6460 7.7596 1.5753 5.1961 18.69
.50 .40605 1.77175 3.5061 6.6935 1.4392 4.1860 15.06
.60 .42809 1.70884 3.3992 5.9758 1.3359 3.5123 12.64
.70 .44568 1.65149 3.3144 5.4673 1.2545 3.0392 10.93
.80 .46013 1.60133 3.2450 5.0916 1.1884 2.6927 9.69
.90 .47229 1. 5581 0 3.1870 4.8040 1.1334 2.4297 8.74 1.00 .48271 1.52096 3.1374 4.5773 1.0869 2.2242 8.00 1.10 .49179 1.48898 3.0945 4.3941 1.0469 2.0595 7.41 1.20 .49979 1.46130 3.0569 4.2428 1.0120 1.9247 6.92 1.30 .50694 1.43721 3.0234 4.1157 .9811 1.8123 6.52 1.40 .51337 1.41609 2.9933 4.0072 .9537 1.7170 6.18 1.50 .51920 1.39747 2.9662 3.9133 .9290 1.6352 5.88 1.60 .52454 1.38094 2.9414 3.8311 .9066 1.5642 5.63 1. 70 .52946 1.36618 2.9187 3.7584 .8863 1.5017 5.40 1.80 .53400 1.35292 2.8977 3.6934 .8676 1.4464 5.20 1.90 .53823 1.34094 2.8782 3.6350 .8503 1.3969 5.03 2.00 .54217 1.33006 2.8600 3.5820 .8344 1.3524 4.87
===============================================================================

Table 21. Stochastic stock biomass and catch projections, starting conditions and input data for Gulf of Maine cod.
================================================================================== Input for Projections:
Number of Years: 4; Initial Year: 1994j FinaL Year: 1997 Number of Ages: 6; Age at Recruitment: 2; Last Age: 7 NaturaL Mortality is assumed constant over time at: .200 Proportion of F before spawning: .1667 Proportion of M before spawning: .1667 Last age is a PLUS group;
Age-specific Input data for Projection # 1
Age I Stock Size I Fish Mort Nat Mort I proportion I Average ~eights in 1997 I Pattern Pattern I Mature Catch Stock
2 721. .0281 1.0000 .2400 1.523 1.169 3 730. .2111 1.0000 .5400 1.962 1.662 4 1370. .7680 1.0000 .8100 2.706 2.232 5 1224. 1.0000 1.0000 .9400 3.930 3.272 6 125. 1.0000 1.0000 1. 0000 6.594 5.113 7+ 27. 1. 0000 1 .0000 1.0000 11.262 11. 262
projections for 1997-1999; F(97)=1.04, Basis: Status quo 1996 point estimate. Recruitment (age 2) of the 1996 and 1997 year classes derived by resampLing the distribution of empirical recruitment of the 1988-1994 year classes (median=3.1 million).
SSB was estimated to be 9,300 t in 1996.
1997 1998 1999
F Landings SSB F Landings SSB SSB
1.04 5838 6861 F, =0.00 0 5335 9456 1.04 5838 6861 FO.1=0.16 842 5411 8264 1.04 5838 6861 Fma)f =0.29 1437 5313 7419 1.04 5838 6861 F20",=0.37 1789 5250 6926 1.04 5838 6861 FSo. =1.04 3857 4781 4296
--------------------------------------------------------------------------

20
18
~
.:E 16 01 QI ~ 14 QI > :::. 12 Ul I:
~ 10 o Z 8 QI :E - 6 o Ul
g 4 o
2
GULF OF MAINE COD TOTAL COMMERCIAL LANDINGS
1893 - 1996
20
18
16
14
12
10
8
6
4
2
o f'-LLLU· 'I' " 'I"-,·"-LU" 'I' "" 1 ' " " 'I '" "" F L" 1 '" , 'L~~~Dt"-U~' I=LL'1 0 1890 1900 1910 1920 1930 1940 1950 1960 1970 1980 1990 2000
Year
Figure 1. Total commercial landings of Gulf of Maine cod (Division 5Y), 1893-1996.
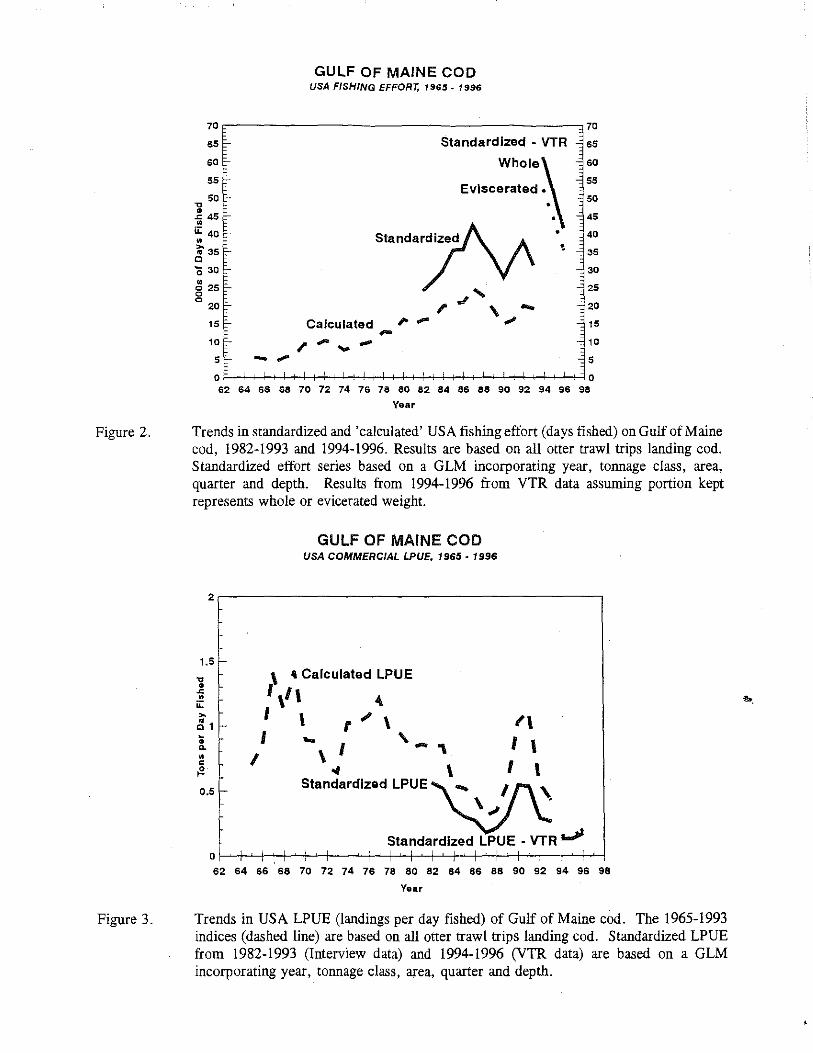
Figure 2.
Figure 3.
GULF OF MAINE COD USA FISHING EFFORT, 1965 . 1996
70~--------------------------------------~70
65 Standardized - VTR 65
~ ~ 60 WhOle\ 60
-g 50 Eviscerated .... 50
~ 45 45 • U::: 40 .. 40 • ~35 '!. 35 o o 30 30
~ 25 25 g
20 ,. 20
15
10
5 -,.
Calculated 1>" 15
10
5
a a ~~~~ronN76n~~~~~~~~96~
Year
Trends in standardized and 'calculated' USA fishing effort (days fished) on Gulf of Maine cod, 1982-1993 and 1994-1996. Results are based on all otter trawl trips landing cod. Standardized effort series based on a GLM incorporating year, tonnage class, area, quarter and depth. Results from 1994-1996 from VTR data assuming portion kept represents whole or evicerated weight.
GULF OF MAINE COD USA COMMERCIAL LPUE, 1965 - 1996
2.-------------------------------------------,
1.5 ~
... • .c • ii:
'" ~, I-~ a. • I c {!.
0.5 I-
\ • Calculated LPUE
I ,1\ ~ I \ r ~ , 1'\
I "',' ,_,\ '\ ~ \ I \
Standardized LPUE ~I , \ -~
Standardized LPUE - VTR .J
,
a .L I I
Year
Trends in USA LPUE (landings per day fished) of Gulf of Maine cod. The 1965-1993 indices (dashed line) are based on all otter trawl trips landing cod. Standardized LPUE from 1982-1993 (Interview data) and 1994-1996 (VTR data) are based on a GLM incorporating year, tonnage class, area, quarter and depth.
...

GULF OF MAINE COD USA RESEARCH VESSEL BOTTOM-TRAWL SURVEYS
STRATIFIED MEAN CATCH [KG] PER TOW
27'1 -------------------------------------------------, 27
24
;: Z1 ~ Q; 18 Q. ~
~15 ---.£: .~ 12 II)
::: c: 9 III II)
:iE 6
3
Fall Survey
\
\ \ \ I
"
\ 'I I I I I I I
\ ,I \ ,
\,
Spring Survey
• I \ I \
24
21
18
15
12
19
16
3
o I I ' I ' I 'I I' 1 I ' I -t---'--t I '+-"--t ' l ' I 0
62 64 66 68 70 72 74 76 78 80 82 84 86 88 90 92 94 96 98
Year
Figure 4. Standardized stratitled mean catch (kg) per tow of Atlantic cod in NEFSC spring and autumn research vessel bottom trawl surveys
in the Gulf of Maine, 1963-1996 .
. 'l'
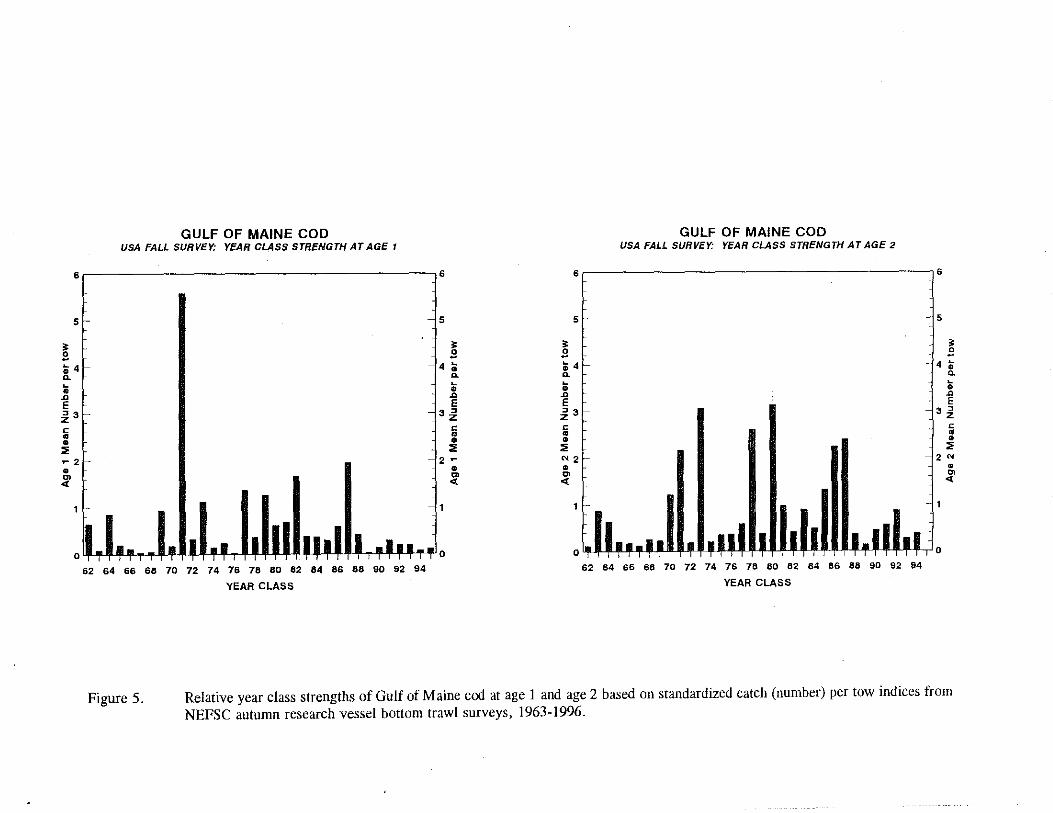
GULF OF MAINE COD GULF OF MAINE COD USA FALL SURVEY; YEAR CLASS STRENGTH AT AGE 1 USA FALL SURVEY: YEAR CLASS STRENGTH AT AGE 2
6, 16 61 16
5
~ :;4 Il.
i .., E ~3 c • & :; ~2
&
~
5
~ 4 ~
& Il.
:; .., E
3 ~ Z c • ~
2 &
~
~""TT"""'T""""""T""Tfo ~~~~ronNHnW~~~"w~~
YEAR CLASS
~ .'l
5
:; 4 Il.
:; ~ ~3 c ~ & :; "'2 &
'" ..:
5
~ 4 :;
Il.
:; .., E
3,i -1 i
& :;
2 '" • '" ..:
o~n"'I'n'nnnnnnnnnnn" ,'0 ~M~~ronNHnW~~~"w~~
YEAR CLASS
Figure 5. Relative year class strengths of Gulf of Maine cod at age 1 and age 2 based on standardized catch (number) per tow indices trom NEFSC autumn research vessel bottom trawl surveys, 1963-1996.

Trends in Landings and Fishing Mortality
26 2.5 24 r A1 Average F (Ages 4~5. u)
22 r ~ 20 r Landings: - 2.0 S-
E 18 r Commercial and Recreational ",-
~ 16 -------. ..;.
r
~~ 1.5 ..
0 Commercial Only <II e..14 r '" ~ 12 r "\. ::s
\. 1.0 U-
.S 10 r <II
." '" c 8 r .. .. ~
-' <II 6 r 0.5 ~ 4
~~~n~ 2
0 0.0 1960 1965 1970 1975 1980 1985 1990 1995
Year
Figure 6. Trends in total commercial landings and fishing mortality for Gulf of Maine cod, 1982-1996.
Trends in Spawning Stock Biomass and Recruitment
22 32
20 A2 sse 28
(ij"18 y-c 24 ~ 16
·E 14 20
cJ 12 <II 16 ~10 .!!! 8 12 .:; ~ 6 () 8 .. tr 4
2 4
0 0 1980 1982 1984 1986 1988 1990 1992 1994 1996
Recruitment Year Class, sse Year
z-E ..
0 0 0 ~
CD en en
Figure 7. Trends in spawning stock biomass and recruitment for Gulf of Maine cod.

c ;:, :;; • .., 0 -a. • > ." • ;; E , 0
0
Gulf at Maine Cod Precision of 1996 F Estimate
Fishing Mortality
Figure 8. Precision of the estimates of the instantaneous rate of fishing mortality (F) on the fully recruited ages (ages 4+) in 1996 for Gulf of Maine cod. The vertical bars display both the range of the estimator and the probability of individual values within the range. The solid line gives the probability that F is greater than any selected value on the X-axis. The precision estimates were derived from 1000 bootstrap replicates of the final ADAPT VPA formulation.
~ ~ 'is • ~ .. • > " • .. e , u
Gulf ot Maino Cod Precision of 1996 SSB Estimate
spawning Stock I!Uomus (OOOs t)
~ ~ ~ • ~ ..
Figure 9. Precision of the estimates of spawning stock biomass (SSB) at the beginning of the spawning season (March I) for Gulf of Maine cod, 1996. The vertical bars display both the range of the estimator and the probability of individual values within the range. The solid line gives the probability that SSB is less than any selected value on the X-axis. The precision estimates were derived from 1000 bootstrap replicates of the final ADAPT VPA formulation.
, .
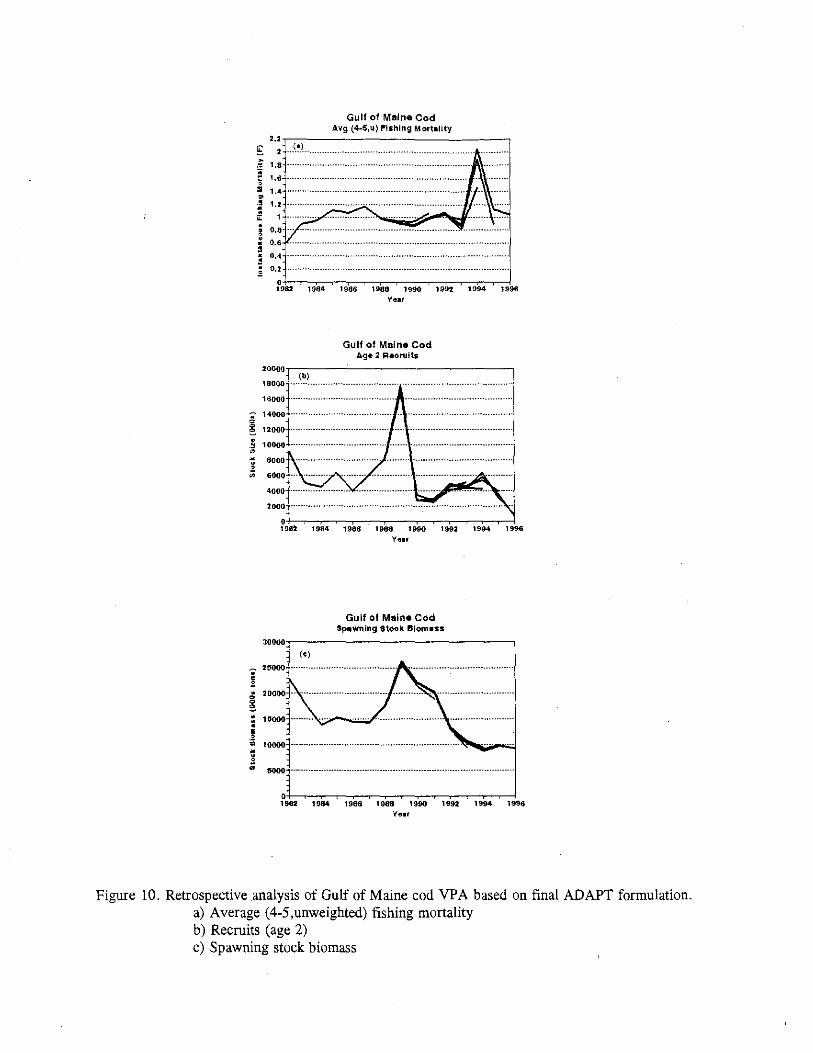
~ • e • ., • · • •
· ~
~ · i • i •
Gulf of Maine Cod Avg (4-5,u) !'ishing Mort.Uty
2.2,-;7---------------, E .. C.
II)
> ,,= 1.8 .....
=- 1.6 , :II 1.4 .•...... • ~ ~
i • 0.6
! ::: O'+c~~~~~~-r_~~~_r~~~ 1982 1984 1986 1988 1990 1992 1994 1996
20000
18000
16000 ...
14000
12000
10000
2000
(0'
Y~lIt
Gulf of Maine Cod Ag. 2 R.cruitl
O,~~~~~~_r_r_r~~~_,~~ 198~ 1 984 1988 1988 1 !HIO 1992 1994 1996
Ye ..
Gulf of Maine Cod Sp.wning Stock Blomus
30000'.------------------,
(0'
3000 ----.-- ..•• --- ••.•• -.... -.- .•• -.. -._ .. -- ...•.•. -_.-.-•••.•... -..•..... -- ....•
10 ... 1::-~.,.19" .. ::--19116T~-:I'988~.....,1c:9~90~-,:c90':92:-~19" .. :-:-~1998 Yellt
Figure 10. Retrospective analysis of Gulf of Maine cod VPA based on final ADAPT formulation. a) Average (4-5,unweighted) fishing mortality b) Recruits (age 2) c) Spawning stock biomass

Yield and Spawning Stock Biomass per Recruit
2.2,-----------------------------------~
2.0l- A3
1.8 ~
1.6 \
_ 1.41- 1 Cl
YPR
/
32
28
24
20
~ 1.2l-
if 1.01- \ - 16
> " 0.8 ~ SSB/R -12
.... 0.6 ,'/ -8
0.4 -.. FO. l Fmax F20% -.. .... F96 ~ - ..,. - -
0.2 '" '" '" -O.O~~~~~~~~~~~~~~~~~~~~
0.0 0.1 0.2 0.3 0.4 0.5 0.6 0.7 0.8 0.9 1.0 1.1
Fishing Mortality (F)
4
0
C; ~ a: ~
!Xl en en
Figure 11. Yield per recruit (YPR) and spawning stock biomass per recruit (SSB/R) for Gulf of Maine cod.
Short-Term Commercial Landings and Spawning Stock Biomass
14 14
E A4 g 12 12 0 e
10 E ~ 10 .... '" SSB .. .... 0
.E , 0 8 .... 8 e .. -.. '" '" .5 -.. '" -.. '" ." 6 - 6 ~
c -" Landings - .E -I
III -;; 4 ~ 4 en (; F
(J)
~ F" .. 0.1
E 2 1 2 E 0 U
0 0 0.0 . 0.2 0.4 0.6 0.8 1.0 1.2 1.4 1.6
Fishing Mortality (F)
Figure 12. Predicted catches in 1998 and spawning stock biomasses in 1999 of Gulf of Maine cod over a range of fishing mortalities in 1998 from F=O.O to F=I.6.

Appendix 1. Discard Estimates for Gulf of Maine cod derived from NEFSC Sea Sampling data, 1989-1996.
Table 1. Gulf of Maine cod discard estimates for otter trawl gear. Figure 1. Gulf of Maine cod discard estimates for otter trawl gear.
Table 2. Gulf of Maine cod discard estimates for shrimp trawl gear. Figure 2. Gulf of Maine cod discard estimates for shrimp trawl gear.
Table 3. Gulf of Maine cod discard estimates for sink gillnet gear. Figure 3. Gulf of Maine cod discard estimates for sink gillnet gear.

Appendix 1 :Table 1. Gulf of Maine cod discard estimates (mt) for otter trawl gear.
Quarterly Totals Annual Totals Gear=050 Gear=050
Year Quarter Num Tow D/K Ratio Landings Discard Catch Landings Discard Catch 1989 1 37 0.066 1145 75.6 1220.6
2 83 0.093 1956 181.9 2137.9 3 82 0.342 1280 437.8 1717.8 4 35 0.316 1553 490.7 2043.7 5934.0 1186.0 7120.0
1990 1 3 0.046 1297 59.7 1356.7
2 22 0.614 3543 2175.4 5718.4
3 39 0.120 2484 298.1 2782.1
4 57 0.095 2928 278.2 3206.2 10252.0 2811.3 13063.3
1991 1 33 0.127 1984 252.0 2236.0
2 61 0.078 4455 347.5 4802.5
3 76 0.028 3448 96.5 3544.5
4 395 0.039 2631 102.6 2733.6 12518.0 798.6 13316.6
1992 1 190 0.046 1496 68.8 1564.8
2 87 0.049 3248 159.2 3407.2
3 83 0.028 1326 37.1 1363.1
4 85 0.155 1267 196.4 1463.4 7337.0 461.5 7798.5 1993 1 52 0.027 1046 28.2 1074.2
2 33 0.018 1858 33.4 1891.4
3 79 0.083 1000 83.0 1083.0
4 43 0.075 987 74.0 1061.0 4891.0 218.7 5109.7
1994 1 29 0.024 1312 31.5 1343.5
2 5 0.055 1283 70.6 1353.6
3 22 0.002 763 1.5 764.5
4 27 0.014 848 11.9 859.9 4206.0 115.5 4321.5
1995 1 137 0.017 675 11.5 686.5
2 62 0.064 1376 88.1 1464.1
3 64 0.060 824 49.4 873.4 .. 4 100 0.085 575 48.9 623.9 3450.0 197.9 3647.9
1996 1 46 0.005 678 3.4 681.4
2 70 0.018 1669 30.0 1699.0
3 11 0.000 678 0.0 678.0
4 1 0.000 987 0.0 987.0 4012.0 33.4 4045.4

0 -ctl a: -0-a> ~ --"0 ... ctl (.) Ih
0
1
O,g
0,8
0.7
0.6
0.5
0.4
0,3
0.2
0.1
Gulf of Maine Cod Gear: Otter Trawl
Landings (Solid) Discard (Dashed)
.......
.......
.......
Year and quarter
----:: a> >
-E -"0 ... ctl
2500 (.) Ih
0 "0
r:::: ctl
500 Ih Ol r::::
000 :s r:::: ctl
...J
Appendix I : Figure I, Gulf of Maine cod discard estimates (dashed line) and D/K ratios (bar) for otter trawl gear.
l!>,

Appendix 1 :Table 2. Gulf of Maine cod discard estimates (mt) for shrimp trawl gear.
Quarterly Totals Annual Totals
Gear=058 Gear=058
Year Quarter Num Tow D/K Ratio Landings Discard Catch Landings Discard Catch
1989 1 34 0.901 173.4 156.2 329.6
2 37 1.272 30.0 38.2 68.2
3 a 0.0 0.0 0.0 4 77 1.008 45.3 45.7 91.0 248.7 240.1 488.8
1990 1 48 1.922 95.2 183.0 278.2
2 17 2.892 78.2 226.2 304.4
3 a 0.0 0.0 0.0
4 12 0.124 27.0 3.3 30.3 200.4 412.5 612.9
1991 1 68 0.924 77.6 71.7 149.3
2 36 0.284 39.1 11.1 50.2
3 a 0.0 0.0 0.0
4 13 0.203 8.6 1.7 10.3 125.3 84.6 209.9
1992 1 168 0.377 31.3 11.8 43.1
2 3 0.000 5.8 0.0 5.8
3 a 0.0 0.0 0.0
4 7 0.500 0.6 0.3 0.9 37.7 12.1 49.8
1993 139 0.000 0.5 0.0 0.5
2 2 0.000 1.7 0.0 1.7
3 a 0.0 0.0 0.0
4 2 0.000 0.2 0.0 0.2 2.4 0.0 2.4
1994 0.0 0.0
2 0.0 0.0
3 0.0 0.0
4 0.0 0.0 0.0 0.0 0.0
1995 1 0.0 0.0
2 0.0 0.0
3 0.0 0.0
4 0.0 0.0 0.0 0.0 0.0
1996 1 0.0 0.0
2 0.0 0.0
3 0.0 0.0
4 0.0 0.0 0.0 0.0 0.0

0 -(1l
II: -0.. Q)
~ --"'C ... (1l (.) IJ)
Cl
Gulf of Maine Cod Gear: Shrimp Trawl
Landings (Solid) Discard (Dashe9) 3 250
...... -2.5 ::
200 G)
>
-2 E '-"
150 "'C ... (1l
1.5 (.) IJ)
Cl 100 "'C
c: 1 (1l
IJ)
Ol c:
0.5 50 "'C
c: (1l
...J
o 0 1989 1990 1991 1992 1993 1994 1995 1996
Year and quarter
Appendix l :Figure 2. Gulf of Maine cod discard estimates (dashed line) and D/K ratios (bar) for shrimp trawl gear.

Appendix 1 :Table 3. Gulf of Maine cod discard estimates (mt) for sink gillnet gear.
Quarterly Totals Annual Totals Gear=100 Gear=100
Year Quarter Num Sets D/K Ratio Landings Discard Catch Landings Discard Catch 1989 0 415.8 0.0 415.8
2 0 1393.1 0.0 1393.1 3 104 0.034 1473.3 50.1 1523.4 4 133 0.051 717.3 36.6 753.9 3999.5 86.7 4086.2
1990 1 84 0.138 215.0 29.7 244.7
2 177 0.097 1572.7 152.6 1725.3 3 107 0.026 1481.8 38.5 1520.3
4 102 0.069 1105.3 76.3 1181.6 4374.8 297.0 4671.8
1991 59 0.067 289.7 19.4 309.1
2 534 0.029 1668.4 48.4 1716.8
3 1460 0.021 1945.6 40.9 1986.5
4 909 0.048 826.8 39.7 866.5 4730.5 148.3 4878.8 1992 1 252 0.070 180.8 12.7 193.5
2 1006 0.032 1056.7 33.8 1090.5
3 978 0.019 1213.7 23.1 1236.8
4 743 0.056 685.1 38.4 723.5 3136.3 107.9 3244.2 1993 1 124 0.056 225.4 12.6 238.0
2 781 0.031 889.2 27.6 916.8
3 524 0.016 1053.9 16.9 1070.8
4 533 0.044 995.7 43.8 1039.5 3164.2 100.9 3265.1
1994 1 93 0.121 227.0 27.5 254.5
2 47 0.023 931.0 21.4 952.4
3 95 0.018 1069.0 19.2 i088.2
4 71 0.041 1089.0. 44.6 1133.6 3316.0 112.8 3428.8
1995 1 33 0.017 314.0 5.3 319.3
2 59 0.064 794.0 50.8 844.8
3 91 0.060 1043.0 62.6 1105.6
4 47 0.085 899.0 76.4 975.4 3050.0 195.1 3245.1
1996 1 29 0.050 237.0 11.9 248.9 2 67 0.047 1090.0 51.2 1141.2
3 51 0.049 926.0 45.4 971.4
4 6 0.044 572.0 25.2 597.2 2825.0 133.6 2958.6
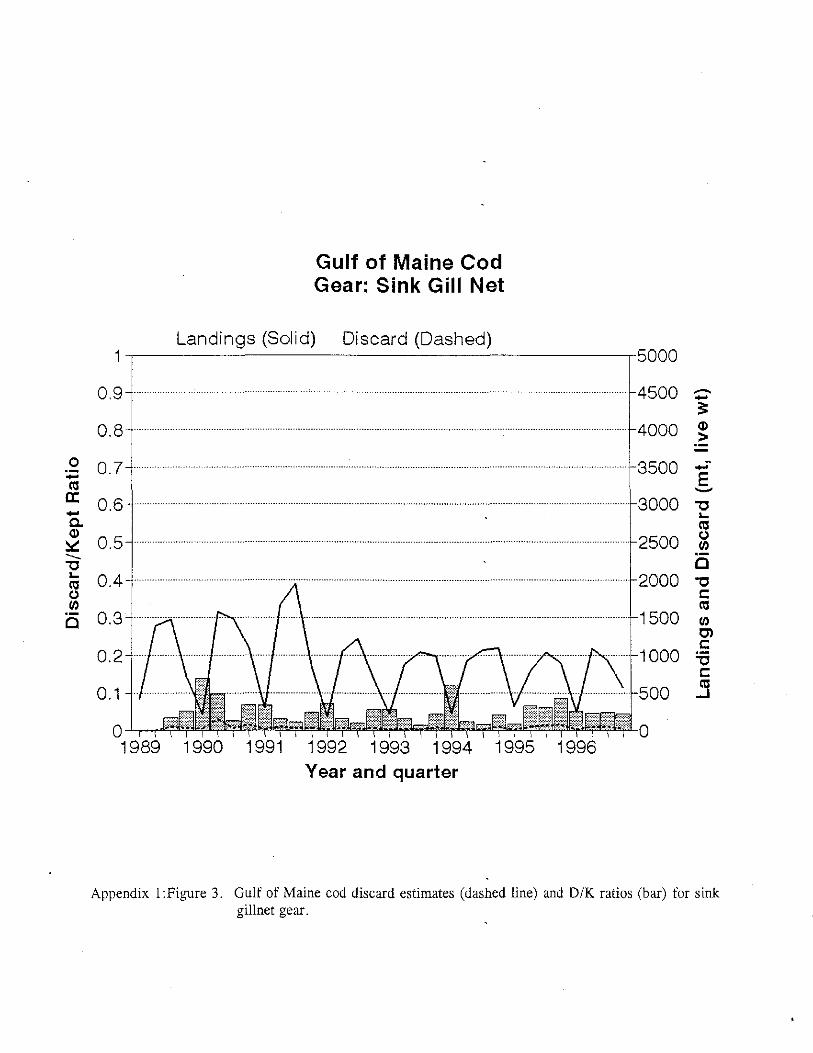
0 -(lI a: -0. Q)
~ --"'C .... (lI 0 (J)
0
Gulf of Maine Cod Gear: Sink Gill Net
Landings (Solid) Discard (Dashed) 1 5000
0.9 ----== 0.8 Q)
>
0.7 -E ....... 0.6 ......... "'C ....
(lI
0.5 0 (J)
0 0.4 "'C
c (lI
0.3 1500 (J)
OJ c
0.2 1000 ::a c
0.1 (lI
...J
Year and quarter
Appendix l:Figure 3. Gulf of Maine cod discard estimates (dashed line) and D/K ratios (bar) for sink gillnet gear.

Appendix 2. Age-specific bottom trawl survey abundance indices for Gulf of Maine cod.
Table 1. Stratified mean catch per tow at age (numbers) of Atlantic cod in NEFC offshore spring and autumn bottom trawl surveys in the Gulf of Maine, 1963 - 1996.
Table 2. Standardized [for both door and gear changes] stratified mean number per tow at age and standardized stratified mean weight (kg) per tow of Atlantic cod in NEFSC offshore spring and autumn research vessel bottom trawl surveys in the Gulf of Maine, 1963-1996.
Table 3. Stratified mean catch per tow in numbers and weight (kg) of Atlantic cod in State of Massachusetts inshore spring and autumn bottom trawl surveys in territorial waters adjacent to the Georges Bank area (Mass. Regions 1-3) and in the Gulf of Maine (Mass. Regions 4-5), 1978 - 1996.
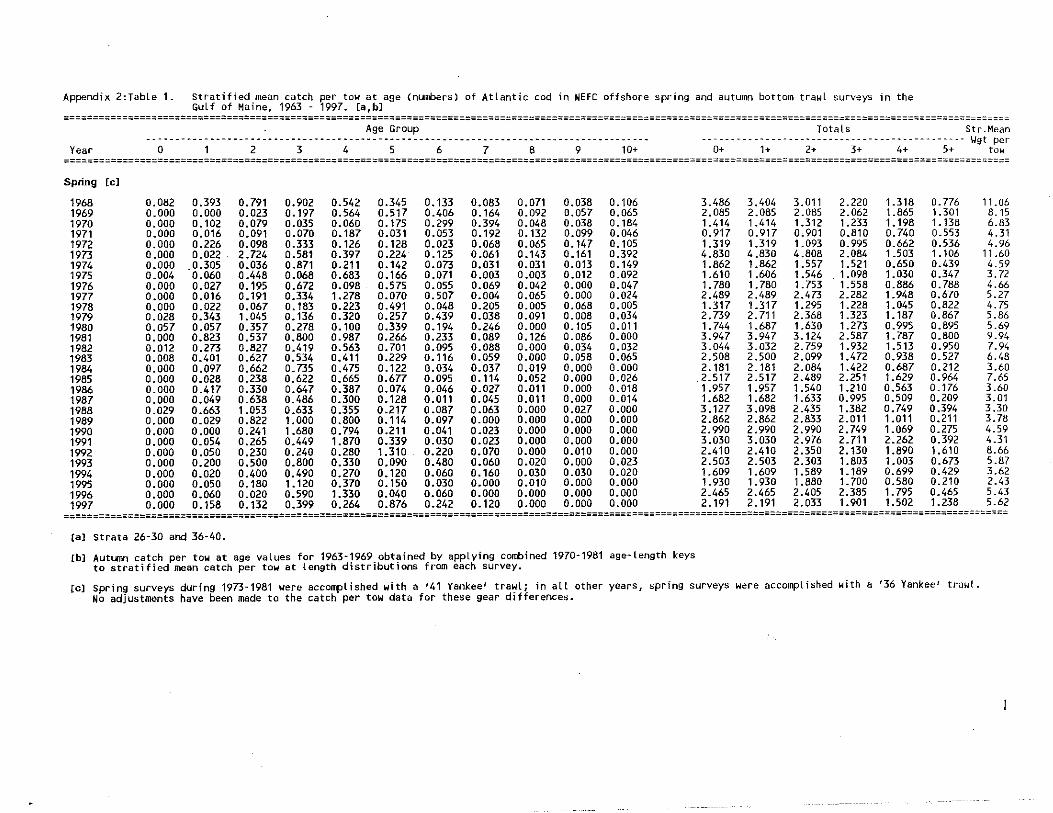
Appendix 2:Table 1. Stratified mean catch per tow at age (numbers) of Atlantic cod in NEFC offshore spring and autumn bottom trawl surveys 1n the Gulf of Maine, 1963 - 1997. [a,b]
===============~========~=======================================================~=============================================================~===================== Age Group Totals Str.Mean
------------------------------------------------------------------------------------- ---------------------------------------------- Ygt per Year 0 2 3 4 5 6 7 8 9 10+ 0+ 1+ 2+ 3+ 4+ 5+ tow
====================================================================================================================================================================
Spring [e]
1968 0.082 0.393 0.791 0.902 0.542 0.345 0.133 0.083 0.071 0.038 0.106 3.486 3.404 3.011 2.220 1.318 0.776 11.06 1969 0.000 0.000 0.023 0.197 0.564 0.517 0.406 0.164 0.092 0.057 0.065 2.085 2.085 2.085 2.062 1.865 1.301 8.15 1970 0.000 0.102 0.079 0.035 0.060 0.175 0.299 0.394 0.048 0.038 0.184 1.414 1.414 1.312 1.233 1.198 1.138 6.83 1971 0.000 0.016 0.091 0.070 0.187 0.031 0.053 0.192 0.132 0.099 0.046 0.917 0.917 0,901 0.810 0.740 0.553 4.31 1972 0.000 0.226 0.098 0.333 0.126 0.128 0.023 0.068 0.065 0.147 0.105 1.319 1.319 1.093 0.995 0.662 0.536 4.96 1973 0.000 0.022 2.724 0.581 0.397 0.224 0.125 0.061 0.143 0.161 0.392 4.830 4.830 4.808 2.084 1.503 1.106 11.60 1974 0.000 .0.305 0.036 0.871 0.211 0.142 0.073 0.031 0.031 0.013 0.149 1.862 1.862 1.557 1.521 0.650 0.439 4.59 1975 0.004 0.060 0.448 0.068 0.683 0.166 0.071 0.003 0.003 0.012 0.092 1.610 1.606 1.546 1.098 1.030 0.347 3.72 1976 0.000 0.027 0.195 0.672 0.098 0.575 0.055 0.069 0.042 0.000 0.047 1.780 1.780 1.753 1.558 0.886 0.788 4.66 1977 0.000 0.016 0.191 0.334 1.278 0.070 0.507 0.004 0.065 0.000 0.024 2.489 2.489 2.473 2.282 1.948 0.670 5.27 1978 0.000 0.022 0.067 0.183 0.223 0.491 0.048 0.205 0.005 0.068 0.005 1.317 1.317 1.295 1.228 1.045 0.822 4.75 1979 0.028 0.343 1.045 0.136 0.320 0.257 0.439 0.038 0.091 0.008 0.034 2.739 2.711 2.368 1.323 1.187 0.867 5.86 1980 0.057 0.057 0.357 0.278 0.100 0.339 0.194 0.246 0.000 0.105 0.011 1. 744 1.687 1.630 1.273 0.995 0.895 5.69 1981 0.000 0.823 0.537 0.800 0.987 0.266 0.233 0.089 0.126 0.086 0.000 3.947 3.947 3.124 2.587 1.787 0.800 9.94 1982 0.012 0.273 0.827 0.419 0.563 0.701 0.095 0.088 0.000 0.034 0.032 3.044 3.032 2.759 1.932 1.513 0.950 7.94 1983 0.008 0.401 0.627 0.534 0.411 0.229 0.116 0.059 0.000 0.058 0.065 2.508 2.500 2.099 1.472 0.938 0.527 6.48 1984 0.000 0.097 0.662 0.735 0.475 0.122 0.034 0.037 0.019 0.000 0.000 2.181 2.181 2.084 1.422 0.687 0.212 3.60 1985 0.000 0.028 0.238 0.622 0.665 0.677 0.095 0.114 0.052 0.000 0.026 .2.517 2.517 2.489 2.251 1.629 0.964 7.65 1986 0.000 0.417 0.330 0.647 0.387 0.074 0.046 0.027 0.011 0.000 0.018 1.957 1.957 1.540 1.210 0.563 0.176 3.60 1987 0.000 0.049 0.638 0.486 0.300 0.128 0.011 0.045 0.011 0.000 0.014 1.682 1.682 1.633 0.995 0.509 0.209 3.01 1988 0.029 0.663 1.053 0.633 0.355 0.217 0.087 0.063 0.000 0.027 0.000 3.127 3.098 2.435 1.382 0.749 0.394 3.30 1989 0.000 0.029 0.822 1.000 0.800 0.114 0.097 0.000 0.000 0.000 0.000 2.862 2.862 2.833 2.011 1.011 0.211 3.78 1990 0.000 0.000 0.241 1.680 0.794 0.211 0.041 0.023 0.000 0.000 0.000 2.990 2.990 2.990 2.749 1.069 0.275 4.59 1991 0.000 0.054 0.265 0.449 1.870 0.339 0.030 0.023 0.000 0.000 0.000 3.030 3.030 2.976 2.711 2.262 0.392 4.31 1992 0.000 0.050 0.230 0.240 0.280 1.310 0.220 0.070 0.000 0.010 0.000 2.410 2.410 2.350 2.130 1.890 1.610 8.66 1993 0.000 0.200 0.500 0.800 0.330 0.090 0.480 0.060 0.020 0.000 0.023 2.503 2.503 2.303 1.803 1.003 0.673 5.87 1994 0.000 0.020 0.400 0.490 0.270 0.120 0.060 0.160 0.030 0.030 0.020 1.609 1.609 1.589 1.189 0.699 0.429 3.62 1995 0.000 0.050 0.180 1. 120 0.370 0.150 0.030 0.000 0.010 0.000 0.000 1.930 1.930 1.880 1.700 0.580 0.210 2.43 1996 0.000 0.060 0.020 0.590 1.330 0.040 0.060 0.000 0.000 0.000 0.000 2.465 2.465 2.405 2.385 1.795 0.465 5.43 1997 0.000 0.158 0.132 0.399 0.264 0.876 0.242 0.120 0.000 0.000 0.000 2.191 2.191 2.033 1.901 1.502 1.238 5.62
====================================================================================================================================================================
[a] Strata 26-30 and 36-40.
[b] Autumn catch per tow at age values for 1963-1969 obtained by applying combined 1970-1981 age-length keys to stratified mean catch per tow at length distributions from each survey.
[e] Spring surveys during 1973-1981 were accomplished with a '41 Yankee' trawl; in all other years, spring surveys were accomplished with a '36 Yankee/ trawl. No adjustments have been made to the catch per tow data for these gear differences.
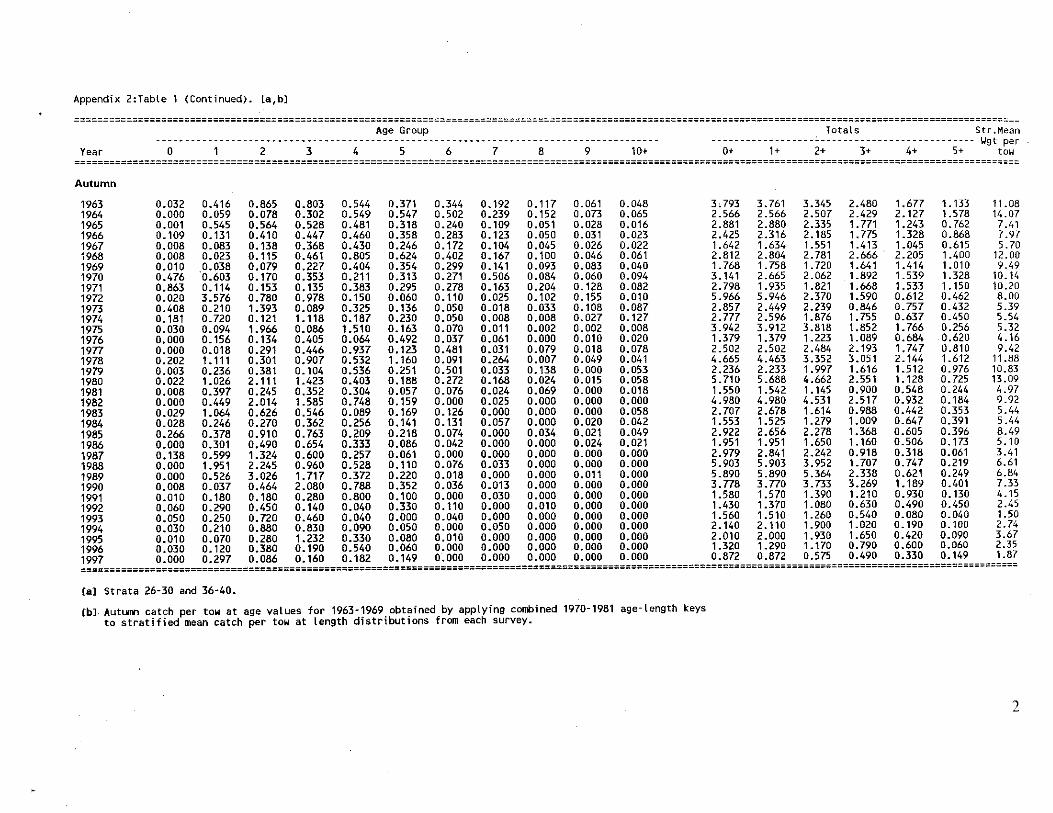
Appendix 2:Tabte 1 (Continued). [a,b]
==================================================================================================================================================================== Age Group Totats Str.Mean
--------------------------------------------------------------------------------------- ---------------------------------------------- Ygt per Year 0 2 3 4 5 6 7 8 9 10+ 0+ 1+ 2+ 3+ 4+ 5+ tow =============================================================~======================================================================================================
Autumn
1963 0.032 0.416 0.865 0.803 0.544 0.371 0.344 0.192 0.117 0.061 0.048 30793 3.761 3.345 2.480 1.677 1.133 11.08 1964 0.000 0.059 0.078 0.302 0.549 0.547 0.502 0.239 0.152 0.073 0.065 2.566 2.566 2.507 2.429 2.127 1.578 14.07 1965 0.001 0.545 0.564 0.528 0.481 0.318 0.240 0.109 0.051 0.028 0.016 2.881 2.880 2.335 1.771 1.243 0.762 7.41 1966 0.109 0.131 0.410 0.447 0.460 0.358 0.283 0.123 0.050 0.031 0.023 2.425 2.316 2.185 1.775 1.328 0.868 7.97 1967 0.008 0.083 0.138 0.368 0.430 0.246 0.172 0.104 0.045 0.026 0.022 1.642 1.634 1.551 1.413 1.045 0.615 5.70 1968 0.008 0.023 0.115 0.461 0.805 0.624 0.402 0.167 0.100 0.046 0.061 2.812 2.804 2.781 2.666 2.205 1.400 12.00 1969 0.010 0.038 0.079 0.227 0.404 0.354 0.299 0.141 0.093 0.083 0.040 1. 768 1.758 1.720 1.641 1.414 1.010 9.49 1970 0.476 0.603 0.170 0.353 0.211 0.313 0.271 0.506 0.084 0.060 0.094 3.141 2.665 2.062 1.892 1.539 1.328 10.14 1971 0.863 0.114 0.153 0.135 0.383 0.295 0.278 0.163 0.204 0.128 0.082 2.798 1.935 1.821 1.668 1.533 1. 150 10.20 1972 0.020 3.576 0.780 0.978 0.150 0.060 0.110 0.025 0.102 0.155 0.010 5.966 5.946 2.370 1.590 0.612 0.462 8.00 1973 0.408 0.210 1.393 0.089 0.325 0.136 0.050 0.018 0.033 0.108 0.087 2.857 2.449 2.239 0.846 0.757 0.432 5.39 1974 0.181 0.720 0.121 1.118 0.187 0.230 0.050 0.008 0.008 0.027 0.127 2.777 2.596 1.876 1.755 0.637 0.450 5.54 1975 0.030 0.094 1.966 0.086 1.510 0.163 0.070 0.011 0.002 0.002 0.008 3.942 3.912 3.818 1.852 1.766 0.256 5.32 1976 0.000 0.156 0.134 0.405 0.064 0.492 0.037 0.061 0.000 0.010 0.020 1.379 1.379 1.223 1.089 0.684 0.620 4.16 1977 0.000 0.018 0.291 0.446 0.937 0.123 0.481 0.031 0.079 0.018 0.078 2.502 2.502 2.484 2.193 1.747 0.810 9.42 1978 0.202 1. 111 0.301 0.907 0.532 1.160 0.091 0.264 0.007 0.049 0.041 4.665 4.463 3.352 3.051 2.144 1.612 l1.BB 1979 0.003 0.236 0.381 0.104 0.536 0.251 0.501 0.033 0.138 0.000 0.053 2.236 2.233 1.997 1.616 1.512 0.976 10.83 1980 0.022 1.026 2.111 1.423 0.403 0.188 0.272 0.168 0.024 0.015 0.058 5.710 5.688 4.662 2.551 1.128 0.725 13.09 1981 0.008 0.397 0.245 0.352 0.304 0.057 0.076 0.024 0.069 0.000 0.018 1.550 1.542 1.145 0.900 0.548 0.244 4.97 1982 0.000 0.449 2.014 1.585 0.748 0.159 0.000 0.025 0.000 0.000 0.000 4.980 4.980 4.531 2.517 0.932 0.184 9.92 1983 0.029 1.064 0.626 0.546 0.089 0.169 0.126 0.000 0.000 0.000 0.058 2.707 2.678 1.614 0.988 0.442 0.353 5.44 1984 0.028 0.246 0.270 0.362 0.256 0.141 0.131 0.057 0.000 0.020 0.042 1.553 1.525 1.279 1.009 0.647 0.391 5.44 1985 0.266 0.378 0.910 0.763 0.209 0.218 0.074 0.000 0.034 0.021 0.049 2.922 2.656 2.278 1.368 0.605 0.396 8.49 1986 0.000 0.301 0.490 0.654 0.333 0.086 0.042 0.000 0.000 0.024 0.021 1.951 1.951 1.650 1.160 0.506 0.173 5.10 1987 0.138 0.599 1.324 0.600 0.257 0.061 0.000 0.000 0.000 0.000 0.000 2.979 2.841 2.242 0.918 0.318 0.061 3.41 1988 0.000 1.951 2.245 0.960 0.528 0.110 0.076 0.033 0.000 0.000 0.000 5.903 5.903 3.952 1.707 0.747 0.219 6.61 1989 0.000 0.526 3.026 1.717 0.372 0.220 0.018 0.000 0.000 0.011 0.000 5.890 5.890 5.364 2.338 0.621 0.249 6.84 1990 0.008 0.037 0.464 2.080 0.788 0.352 0.036 0.013 0.000 0.000 0.000 3.778 3.770 3.733 3.269 1.189 0.401 7.33 1991 0.010 0.180 0.180 0.280 0.800 0.100 0.000 0.030 0.000 0.000 0.000 1.580 1.570 1.390 1.210 0.930 0.130 4.15 1992 0.060 0.290 0.450 0.140 0.040 0.330 0.110 0.000 0.010 0.000 0.000 1.430 1.370 1.080 0.630 0.490 0.450 2.45 1993 0.050 0.250 0.720 0.460 0.040 0.000 0.040 0.000 0.000 0.000 0.000 1.560 1.510 1.260 0.540 0.080 0.040 1.50 1994 0.030 0.210 0.880 0.830 0.090 0.050 0.000 0.050 0.000 0.000 0.000 2.140 2.110 1.900 1.020 0.190 0.100 2.74 1995 0.010 0.070 0.280 1.232 0.330 0.080 0.010 0.000 0.000 0.000 0.000 2.010 2.000 1.930 1.650 0.420 0.090 3.67 1996 0.030 0.120 0.380 0.190 0.540 0.060 0.000 0.000 0.000 0.000 0.000 1.320 1.290 1.170 0.790 0.600 0.060 2.35 1997 0.000 0.297 0.086 0.160 0.182 0.149 0.000 0.000 0.000 0.000 0.000 0.872 0.872 0.575 0.490 0.330 0.149 1.87 ===================================================================================================================================================================
Cal Strata 26·30 and 36·40.
[bl Autumn catch per tow at age vaLues for 1963-1969 obtained by appLying combined 1970-1981 age-tength keys to stratified mean catch per tow at length distributions from each survey.
2

Appendix 2:Table 2. Standardized (for both door and gear changes] stratified mean number per tow at age and standardized stratified mean weight (kg) per tow of AtLantic cod in NEfSC offshore spring and autumn research vesseL bottom trawl surveys in the GuLf of Maine, 1963-1997. [a,b)
========================================================================================================================================================================== Age Group Totals Standardized
------ .. -._. __ ._ .... _-----_._._.-.-._---------_. __ ._----_ .. _------------------------------ -----------------_._---------_._------.-._------ Mean W't Year 0 2 3 4 5 6 7 8 9 10+ 0+ 1+ 2+ 3+ 4+ 5+ (kg)/Tow ==========================================================================================================================================================================
Spring [c,d,ej
1968 0.128 0.613 1.234 1.407 0.846 0.538 0.207 0.129 0.111 0.059 0.165 5.438 5.310 4.697 3.463 2.056 1. 211 17.92 1969 0.000 0.000 0.036 0.307 0.880 0.807 0.633 0.256 0.144 0.089 0.101 3.253 3.253 3.253 3.217 2.909 2.030 13.20 1970 0.000 0.159 0.123 0.055 0.094 0.273 0.466 0.615 0.075 0.059 0.287 2.206 2.206 2.047 1.923 1.869 1.775 11.06 1971 0.000 0.025 0.142 0.109 0.292 0.048 0.083 0.300 0.206 0.154 0.072 1.431 1.431 1.406 1.264 1. 154 0.863 6.98 1972 0.000 0.353 0.153 0.519 0.197 0.200 0.036 0.106 0.101 0.229 0.164 2.058 2.058 1.705 1.552 1.033 0.836 8.04 1973 0.000 0.034 4.249 0.906 0.619 0.349 0.195 0.095 0.223 0.251 0.612 7.535 7.535 7.500 3.251 2.345 1.725 18.79 1974 0.000 0.476 0.056 1.359 0.329 0.222 0.114 0.048 0.048 0.020 0.232 2.905 2.905 2.429 2.373 1.014 0.685 7.44 1975 0.006 0.094 0.699 0.106 1.065 0.259 0.111 0.005 0.005 0.019 0.144 2.512 2.505 2.412 1.713 1.607 0.541 6.03 1976 0.000 0.042 0.304 1.048 0.153 0.897 0.086 0.108 0.066 0.000 0.073 2.777 2.777 2.735 2.430 1.382 1.229 7.55 1977 0.000 0.025 0.298 0.521 1.994 0.109 0.791 0.006 0.101 0.000 0.037 3.883 3.883 3.858 3.560 3.039 1.045 8.54 1978 0.000 0.034 0.105 0.285 0.348 0.766 0.075 0.320 0.008 0.106 0.008 2.055 2.055 2.020 1.916 1.630 1.282 7.70 1979 0.044 0.535 1.630 0.212 0.499 0.401 0.685 0.059 0.142 0.012 0.053 4.273 4.229 3.694 2.064 1.852 1.353 9.49 1980 0.070 0.070 0.440 0.343 0.123 0.418 0.239 0.303 0.000 0.129 0.014 2.149 2.079 2.009 1.569 1.226 1. 103 6.18 1981 0.000 1.014 0.662 0.986 1.216 0.328 0.287 0.110 0.155 0.106 0.000 4.864 4.864 3.850 3.188 2.202 0.986 10.79 1982 0.015 0.336 1.019 0.516 0.694 0.864 0.117 0.108 0.000 0.042 0.039 3.751 3.737 3.400 2.381 1.865 1.171 8.62 1983 0.012 0.626 0.978 0.833 0.641 0.357 0.181 0.092 0.000 0.090 0.101 3.912 3.900 3.274 2.296 1.463 0.822 10.50 1984 0.000 0.151 1.033 1.147 0.741 0.190 0.053 0.058 0.030 0.000 0.000 3.402 3.402 3.251 2.218 1.072 0.331 5.B3 1985 0.000 0.028 0.238 0.622 0.665 0.677 0.095 0.114 0.052 0.000 0.026 2.517 2.517 2.489 2.251 1.629 0.964 7.65 1986 0.000 0.417 0.330 0.647 0.387 0.074 0.046 0.027 0.011 0.000 0.018 1.957 1.957 1.540 1.210 0.563 0.176 3.60 1987 0.000 0.049 0.638 0.486 0.300 0.128 0.011 0.045 0.011 0.000 0.014 1.682 1.682 1.633 0.995 0.509 0.209 3.01 1988 0.029 0.663 1.053 0.633 0.355 0.217 0.087 0.063 0.000 0.027 0.000 3.127 3.098 2.435 1.382 0.749 0.394 3.30 1989 0.000 0.023 0.649 0.790 0.632 0.090 0.077 0.000 0.000 0.000 0.000 2.261 2.261 2.238 1.589 0.799 0.167 2.53 1990 0.000 0.000 0.190 1.327 0.627 0.167 0.032 0.018 0.000 0.000 0.000 2.362 2.362 2.362 2.172 0.845 0.217 3.08 1991 0.000 0.043 0.209 0.355 1.477 0.268 0.024 0.018 0.000 0.000 0.000 2.394 2.394 2.351 2.142 1.787 0.310 2.89 1992 0.000 0.050 0.230 0.240 0.280 1.310 0.220 0.070 0.000 0.010 0.000 2.410 2.410 2.360 2.130 1.890 1.610 8.66 1993 0.000 0.200 0.500 0.800 0.330 0.090 0.480 0.060 0.020 0.000 0.023 2.503 2.503 2.303 1.803 1.003 0.673 5.87 1994 0.000 0.016 0.316 0.387 0.213 0.095 0.047 0.126 0.024 0.024 0.018 1.266 1.266 1.251 0.935 0.547 0.334 2.43 1995 0.000 0.050 0.180 1.120 0.370 0.150 0.030 0.000 0.010 0.000 0.000 1. 910 1. 910 1.860 1.680 0.560 0.190 2.43 1996 0.000 0.060 0.020 0.590 1.330 0.400 0.060 0.000 0.000 0.000 0.000 2.465 2.465 2.405 2.385 1.795 0.465 5.43 1997 0.000 0.158 0.132 0.399 0.264 0.876 0.242 0.120 0.000 0.000 0.000 2.191 2.191 2.033 1.901 1.502 1.238 5.62 ==========================================================================================================================================================================
[a]
[b]
[e]
[d]
eel
Strata 26-30 and 36-40.
Autumn catch per tow at age values for 1963-1969 obtained by applying combined 1970-1981 age-length keys to stratified mean catch per tow at length distributions from each survey.
Spring surveys during 1973-1981 were accomplished with a '41 Yankee' trawl; in all other years, spring surveys were accompLished with a '36 yankee' trawl. No adjustments have been made to the catch per tow data for these differences.
During 1963-1984, BMV oval doors were used in the spring and autumn surveys; since 1985, Portugeuse polyvalent doors have been used in both surveys. Adjustments have been made to the 1963-1984 catch per tow data to standardize these data to poLyvalent door equivaLents. conversion coefficients of 1.56 (numbers) and 1.62 (weight) were used in this standardization (NEFSC 1991).
In the Gulf of Maine, spring surveys during 1980-1982, 1989-1991 amd 1994, and autumn surveys during 1977-1978, 1980, 1989-1991 and 1993, were accomplished with the R/V DELAWARE II; in all other years, the surveys were accompLished using the R/V ALBATROSS IV. Adjustments have been made to the R/V DELAWARE II catch per tow data to standardize these to R/V ALB TAT ROSS IV equivalents. ConVersion coefficients of 0.79 (numbers) and 0.67 (weight) were used in this standardization (NEfSC 1991).
3
I'

Appendix 2:Table 2 (Continued). [a,b1
========================================================================================================================================================================== Age Group
Year o 2 3. 4 5 6 7 8
Totals
9 10+ 0+ 1+ 2+ 3+ 4+ 5+
Standardized Mean \..It
(kg)/Tow ==========================================================================================================================================================================
Autumn [d,e)
0.649 0.092 0.850 0.204 0.129 0.036 0.059 0.941 0.178. 5.579 0.328 1.123 0.147 0.243 0.022 1.369 0.368 1.264 0.619 0.700 1.660 0.384 0.378 0.301 0.599 1.951 0.416 0.029 0.142 0.290 0.198 0.210 0.070 0.120 0.297
1.349 0.122 0.880 0.640 0.215 0.179 0.123 0.265 0.239 1.217 2.173 0.189 3.067 0.209 0.359 0.371 0.594 2.602 0.382 3.142 0.977 0.421 0.910 0.490 1.324 2.245 2.391 0.367 0.142 0.450 0.569 0.880 0.280 0.380 0.086
1.253 0.471 0.824 0.697 0.574 0.719 0.354 0.551 0.211 1.526 0.139 1. 744 0.134 0.632 0.550 1.118 0.162 1. 754 0.549 2.473 0.852 0.565 0.763 0.654 0.600 0.960 1.356 1.643 0.221 0.140 0.363 0.830 1.230 0.190 0.160
0.849 0.856 0.750 0.718 0.671 1.256 0.630 0.329 0.597 0.234 0.507 0.292 2.356 0.100 1.155 0.656 0.836 0.497 0.474 1.167 0.139 0.399 0.209 0.333 0.257 0.528 0.294 0.623 0.632 0.040 0.032 0.090 0.330 0.540 0.182
0.579 0.853 0.496 0.558 0.384 0.973 0.552 0.488 0.460 0.094 0.212 0.359 0.254 0.768 0.152 1.430 0.392 0.232 0.089 0.248 0.264 0.220 0.218 0.086 0.061 0.110 0.174 0.278 0.079 0.330 0.000 0.050 0.080 0.060 0.149
0.537 0.783 0.374 0.441 0.268 0.627 0.466 0.423 0.434 0.172 0.078 0.078 0.109 0.058 0.593 0.112 0.782 0.335 0.119 0.000 0.197 0.204 0.074 0.042 0.000 0.076 0.014 0.028 0.000 0.110 0.032 0.000 0.010 0.000 0.000
0.300 0.373 0.170 0.192 0.162 0.261 0.220 0.789 0.254 0.039 0.028 0.012 0.017 0.095 0.038 0.325 0.051 0.207 0.037 0.039 0.000 0.089 0.000 0.000 0.000 0.033 0.000 0.010 0.024 0.000 0.000 0.050 0.000 0.000 0.000
0.183 0.237 0.080 0.078 0.070 0.156 0.145 0.131 0.318 0.159 0.051 0.012 0.003 0.000 0.097 0.009 0.215 0.030 0.108 0.000 0.000 0.000 0.034 0.000 0.000 0.000 0.000 0.000 0.000 0.010 0.000 0.000 0.000 0.000 0.000
0.095 0.114 0.044 0.048 0.041 0.072 0.129 0.094 0.200 0.242 0.168 0.042 0.003 0.016 0.022 0.060 0.000 0.018 0.000 0.000 0.000 0.031 0.021 0.024 0.000 0.000 0.009 0.000 0.000 0.000 0.000 0.000 0.000 0.000 0.000
0.075 0.101 0.025 0.036 0.034 0.095 0.062 0.147 0.128 0.016 0.136 0.198 0.012 0.031 0.096 0.051 0.083 0.071 0.028 0.000 0.090 0.066 0.049 0.021 0.000 0.000 0.000 0.000 0.000 0.000 0.000 0.000 0.000 0.000 0.000
5.917 4.003 4.494 3.783 2.562 4.387 2.758 4.900 4.365 9.307 4.457 4.332 6.150 2.151 3.083 5.749 3.488 7.037 2.418 7.769 4.223 2.423 2.922 1.951 2.979 5.903 4.653 2.985 1.248 1.430 1.232 2.140 2.010 1.320 0.872
5.867 4.003 4.493 3.613 2.549 4.374 2.742 4.157 3.019 9.276 3.820 4.050 6.103 2.151 3.083 5.500 3.483 7.010 2.406 7.769 4.178 2.379 2.656 1. 951 2.841 5.903 4.653 2.978 1.240 1.370 1.193 2.110 2.000 1.290 0.872
5.218 3.911 3.643 3.409 2.420 4.338 2.683 3.217 2.841 3.697 3.493 2.927 5.956 1.908 3.061 4.131 3.115 5.745 1. 786 7.068 2.518 1.995 2.278 1.650 2.242 3.952 4.238 2.949 1.098 1.080 0.995 1.900 1.930 1.170 0.575
3.869 3.789 2.763 2.769 2.204 4.159 2.560 2.952 2.602 2.480 1.320 2.738 2.889 1.699 2.703 3.760 2.521 3.144 1.404 3.927 1.541 1.574 1.368 1. 160 0.918 1.707 1.847 2.583 0.956 0.630 0.427 1.020 1.650 0.790 0.490
2.616 3.318 1.939 2.072 1.630 3.440 2.206 2.401 2.391 0.955 1. 181 0.994 2.755 1.067 2.153 2.642 2.359 1.390 0.855 1.454 0.690 1.009 0.605 0.506 0.318 0.747 0.491 0.939 0.735 0.490 0.063 0.190 0.420 0.600 0.330
1. 767 2.462 1. 189 1.354 0.959 2.184 1.576 2.072 1.794 0.721 0.674 0.702 0.399 0.967 0.998 1.987 1.523 0.893 0.381 0.287 0.551 0.610 0.396 0.173 0.061 0.219 0.197 0.317 0.103 0.450 0.032 0.100 0.090 0.060 0.149
17.95 22.79 12.00 12.91 9.23
19.44 15.37 16.43 16.52 12.96 8.73 8.97 8.62 6.74
10.22 12.89 17.54 14.21 8.05
16.07 8.81 8.81 8.49 5.10 3.41 6.61 4.58 4.91 2.78 2.45 1.00 2.74 3.67 2.35 1.87
1963 1964 1965 1966 1967 1968 1969 1970 1971 1972 1973 1974 1975 1976 1977 1978 1979 1980 1981 1982 1983 1984 1985 1986 1987 1988 1989 1990 1991 1992 1993 1994 1995 1996 1997
0.050 0.000 0.002 0.170 0.012 0.012 0.016 0.743 1.346 0.031 0.636 0.282 0.047 0.000 0.000 0.249 0.005 0.027 0.012 0.000 0.045 0.044 0.266 0.000 0.138 0.000 0.000 0.006 0.008 0.060 0.040 0.030 0.010 0.030 0.000
=========================================================================================================================================================================
[a] Strata 26·30 and 36·40.
[bl Autumn catch per tow at age values for 1963-1969 obtained by applying 'combined 1970-1981 age· length keys to stratified mean catch per tow at length distributions from each survey.
[dJ During 1963·1984, BMV oval doors were used in the spring and autumn surveys; since 1985, Portugeuse polyvalent doors have been used in both surveys. Adjustments have been made to the 1963-1984 catch per tow data to standardlze these data to polyvalent door eqUivalents. Conversion coefficients of 1.56 (numbers) and 1.62 (weight) were used in this standardization (NEFSC 1991).
[oj In the Gulf of Maine, spring surveys during 1980·1982, 1989-1991 and 1994, and autumn surveys during 1977·1978, 1980, 1989·1991 and 1993 were accomplished with the R/V DELAUARE II; in all other years, the surveys were accomplished using the R/V ALBATROSS IV. Adjustments have been made to the R/V DELAUARE II catch per tow data to standardize these to R/V ALBTATROSS IV equivalents. Conversion coefficients of 0.79 (numbers) and 0.67 (weight) were used in this standardization (NEFSC 1991).
,I
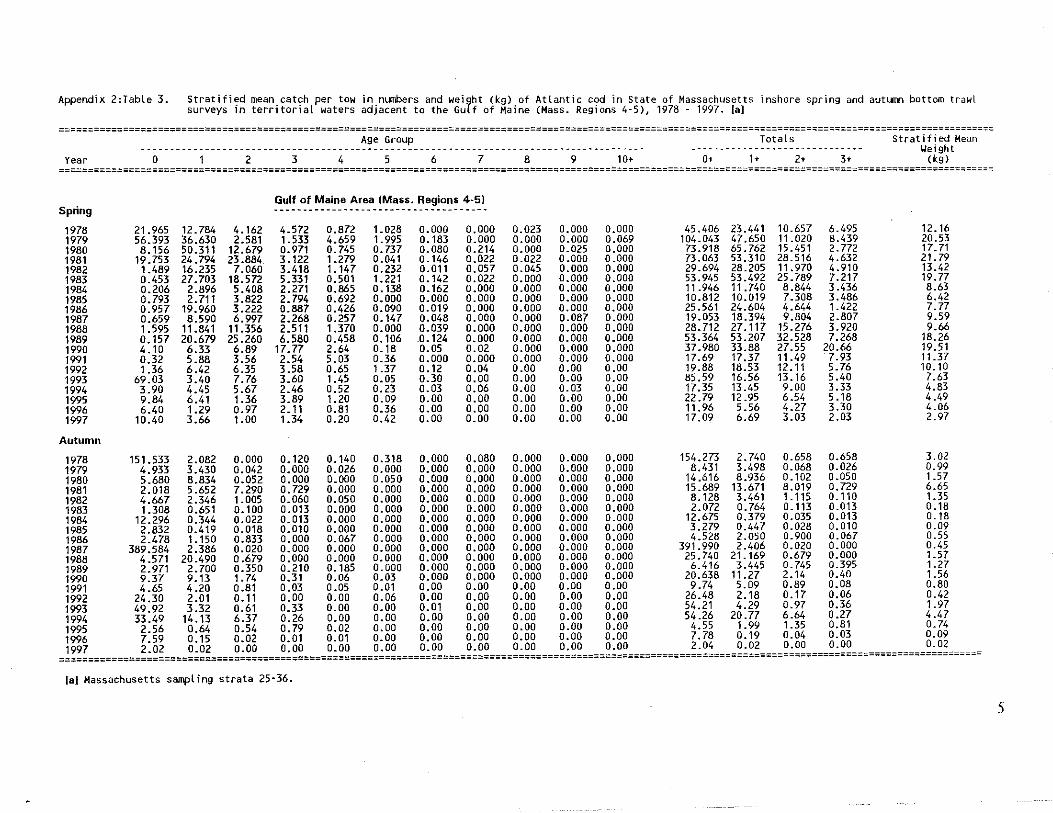
Appendix 2:Table 3. Stratified mean catch per tow in numbers and weight (kg) of AtLantic cod in State of Massachusetts inshore spring and autumn bottom trawl surveys in territorial waters adjacent to the GuLf of Maine (Mass. Regions 4-5), 1978 - 1997. fal
================================================================================================================================================================== Age Group
Year o 2 3 4 5 6 7 8 9 10+ 0+ 1+
Totals
2+ 3+
Stratified Mean Weight
(kg) ==================================================================================================================================================================
Spring
1978 1979 1980 1981 1982 1983 1984 1985 1986 1987 1988 1989 1990 1991 1992 1993 1994 1995 1996 1997
Autumn
21. 965 56.393 8.156
19.753 1.489 0.453 0.206 0.793 0.957 0.659 1.595 0.157 4.10 0.32 1.36
69.03 3.90 9.84 6.40
10.40
151.533 4.933 5.680 2.018 4.667 1.308
12.296 2.832 2.478
389.584 4.571 2.971 9.37 4.65
24.30 49.92 33.49 2.56 7.59
12.784 36.630 50.311 24.794 16.235 27.703
2.896 2.711
19.960 8.590
11.841 20.679 6.33 5.88 6.42 3.40 4.45 6.41 1.29 3.66
2.082 3.430 8.834 5.652 2.346 0.651 0.344 0.419 1.150 2.386
20.490 2.700 9.13 4.20 2.01 3.32
14.13 0.64 0.15
4.162 2.581
12.679 23.884
7.060 18.572 5.408 3.822 3.222 6.997
11.356 25.260 6.89 3.56 6.35 7.76 5.67 1.36 0.97 1.00
Gulf of Maine Area (Mass. Regions 4-5)
4.572 1.533 0.971 3.122 3.418 5.331 2.271 2.794 0.887 2.268 2.511 6.580
17.77 2.54 3.58 3.60 2.46 3.89 2.11 1.34
0.872 4.659 0.745 1.279 1.147 0.501 0.865 0.692 0.426 0.257 1.370 0.458 2.64 5.03 0.65 1.45 0.52 1.20 0.81 0.20
1.028 1.995 0.737 0.041 0.232 1.221 0.138 0.000 0.090 0.147 0.000 0.106 0.18 0.36 1.37 0.05 0.23 0.09 0.36 0.42
0.318 0.000 0.050 0.000 0.000 0.000 0.000 0.000 0.000 0.000 0.000 0.000 0.03 0.01 0.06 0.00 0.00 0.00 0.00 0.00
0.000 0.183 0.080 0.146 0.011 0.142 0.162 0.000 0.019 0.048 0.039 .0.124 0.05 0.000 0.12 0.30 0.03 0.00 0.00 0.00
0.000 0.000 0.000 0.000 0.000 0.000 0.000 0.000 0.000 0.000 0.000 0.000 0.000 0.00 0.00 0.01 0.00 0.00 0.00 0.00
0.000 0.000 0.214 0.022 0.057 0.022 0.000 0.000 0.000 0.000 0.000 0.000 0.02 0.000 0.04 0.00 0.06 0.00 0.00 0.00
0.080 0.000 0.000 0.000 0.000 0.000 0.000 0.000 0.000 0.000 0.000 0.000 0.000 0.00 0.00 0.00 0.00 0.00 0.00 0.00
0.023 0.000 0.000 0.022 0.045 0.000 0.000 0.000 0.000 0.000 0.000 0.000 0.000 0.000 0.00 0.00 0.00 0.00 0.00 0.00
0.000 0.000 0.000 0.000 0.000 0.000 0.000 0.000 0.000 0.000 0.000 0.000 0.000 0.00 0.00 0.00 0.00 0.00 0.00 0.00
0.000 0.000 0.025 0.000 0.000 0.000 0.000 0.000 0.000 0.087 0.000 0.000 0.000 0.000 0.00 0.00 0.03 0.00 0.00 0.00
0.000 0.000 0.000 0.000 0.000 0.000 0.000 0.000 0.000 0.000 0.000 0.000 0.000 0.00 0.00 0.00 0.00 0.00 0.00 0.00
0.000 0.069 0.000 0.000 0.000 0.000 0.000 0.000 0.000 0.000 0.000 0.000 0.000 0.000 0.00 0.00 0.00 0.00 0.00 0.00
0.000 0.000 0.000 0.000 0.000 0.000 0.000 0.000 0.000 0.000 0.000 0.000 0.000 0.00 0.00 0.00 0.00 0.00 0.00 0.00
45.406 104.043 73.918 73.063 29.694 53.945 11.946 10.812 25.561 19.053 28.712 53.364 37.980 17.69 19.88 85.59 17.35 22.79 11.96 17.09
154.273 8.431
14.616 15.689 8.128 2.072
12.675 3.279 4.528
391. 990 25.740 6.416
20.638 9.74
26.48 54.21 54.26
4.55 7.78 2.04
23.441 47.650 65.762 53.310 28.205 53.492 11 .740 10.019 24.604 18.394 27.117 53.207 33.88 17.37 18.53 16.56 13.45 12.95 5.56 6.69
2.740 3.498 8.936
13.671 3.461 0.764 0.379 0.447 2.050 2.406
21.169 3.445
11.27 5.09 2.18 4.29
20.77 1.99 0.19 0.02
10.657 11.020 15.451 28.516 11. 970 25.789 8.844 7.308 4.644 9.804
15.276 32.528 27.55 11.49 12.11 13.16 9.00 6.54 4.27 3.03
0.658 0.068 0.102 8.019 1. 115 0.113 0.035 0.028 0.900 0.020 0.679 0.745 2.14 0.89 0.17 0.97 6.64 1.35 0.04 0.00
6.495 8.439 2.772 4.632 4.910 7.217 3.436 3.486 1.422 2.807 3.920 7.268
20.66 7.93 5.76 5.40 3.33 5.18 3.30 2.03
0.658 0.026 0.050 0.729 0.110 0.013 0.013 0.010 0.067 0.000 0.000 0.395 0.40 0.08 0.06 0.36 0.27 0.81 0.03 0.00
12.16 20.53 17.71 21. 79 13.42 19.77 8.63 6.42 7.77 9.59 9.66
18.26 19.51 11.37 10.10 7.63 4.83 4.49 4.06 2.97
3.02 0.99 1.57 6.65 1.35 0.18 0.18 0.09 0.55 0.45 1.57 1.27 1.56 0.80 0.42 1.97 4.47 0.74 0.09 0.02
1978 1979 1980 1981 1982 1983 1984 1985 1986 1987 1988 1989 1990 1991 1992 1993 1994 1995 1996 1997 2.02 0.02
0.000 0.042 0.052 7.290 1.005 0.100 0.022 0.018 0.833 0.020 0.679 0.350 1. 74 0.81 0.11 0.61 6.37 0.54 0.02 0.00
0.120 0.000 0.000 0.729 0.060 0.013 0.013 0.010 0.000 0.000 0.000 0.210 0.31 0.03 0.00 0.33 0.26 0.79 0.01 0.00
0.140 0.026 0.000 0.000 0.050 0.000 0.000 0.000 0.067 0.000 0.000 0.185 0.06 0.05 0.00 0.00 0.00 0.02 0.01 0.00
================================================================================================================================================================
fa] Massachusetts sampt ing strata 25-36.
5

Appendix 3. Full listing of final ADAPT VPA calibration for Gulf of Maine cod including:
Estimates of 1997 N for ages 2-6 using: NEFSC spring and autumn surveys for ages 2-6, Massachusetts DMF spring surveys for ages 2-4 and autumn surveys for age 2, and USA commercial LPUE indices through 1993 for ages 3-6.

ADAPT Run Number 361
COD: GULF OF MAINE STOCK COMMERCIAL LANDINGS ONLY
1997 4 16 9 8 15
ALL INDICES UNWEIGHTED; NO TIME TAPERED WEIGHTING APPLIED GMCOD97
Output option selected for input parameters: fulL Output option seLected for resuLts: fulL
INPUT PARAMETERS AND OPTIONS SELECTED
NaturaL mortaLity is 0.2
Oldest age (not in the plus group) is 6
For all yrs prior to the terminal year (1996), backcaLculated stock sizes for the folLowing ages used to estimate totaL mortaLity (Z) for age 6~ 456 This method for estimating F on the oldest age is generalLy used when a fLat-topped partiaL recruitment curve is thought to be characteristic of the stock.
F for age 7+ is then caLculated from the folLowing ratios of F(age 7+] to FCage 6]
1982 1. 0000 1983 1.0000 1984 1.0000 1985 1.0000 1986 1.0000 1987 1.0000 1988 1.0000 1989 1.0000 1990 1.0000 1991 1.0000 1992 1.0000 1993 1.0000 1994 1.0000 1995 1.0000 1996 1.0000
Stock size of the 7+ group is then caLculated using the folLowing method: CATCHEQ
Partial recruitment estimate for 1996 1 0.0001 2 0.0530 3 0.4210 4 1. 0000 5 1.0000 6 1.0000
Objective function is SUM w*( LOG(OBS) . LOG(PRED) )**2
Indices normalized (by dividing by mean observed value) before tuning to VPA stocksizes
The residuals for years prior to the terminaL year are downweighted using the following algorithm: NONE
Biomass estimates (other than SSS) reflect mean stock ·sizes. SSB caLcuLated as in the NEFSC projection program (see note below SSS tabLe for description of the algorithm).
1

Initial estimates of parameters for the Marquardt algorithm and lower and upper bounds on the parameter estimates:
Par. N 2 N 3 N 4 N 5 N 6 qRV SPR 2 qRV SPR 3 qRV SPR 4 qRV SPR 5 qRV SPR 6 qRV FAL 2 qRV FAL 3 qRV FAL 4 qRV FAL 5 qRV FAL 6 qCM CPE 3 qCM CPE 4 qCM CPE 5 qCM CPE 6 qMA SPR 2 qMA SPR 3 qMA SPR 4 qMA FAL 2
Initial Est 3.0000000E3 3.0000000E3 5.0000000E2 5.0000000E2 5.0000000E2 1.0000000E·2 1.0000000E·2 1.0000000E·2 1. OOOOOOOE· 2 1 . OOOOOOOE· 2 1. OOOOOOOE· 2 1 . OOOOOOOE· 2 1 . OOOOOOOE· 2 1 . OOOOOOOE· 2 1. 0000000E·2 1.0000000E·2 1. OOOOOOOE· 2 1.0000000E·2 1. OOOOOOOE· 2 1.0000000E·2 1.0000000E·2 1.0000000E·2 1.0000000E·2
Lower Bnd 1 .OOOOOOOEO 1 .OOOOOOOEO 1.0000000EO 1 .OOOOOOOEO 1.0000000EO O.OOOOOOOEO O.OOOOOOOEO O.OOOOOOOEO O.OOOOOOOEO O.OOOOOOOEO O.OOOOOOOEO O.OOOOOOOEO O.OOOOOOOEO O.OOOOOOOEO O.OOOOOOOEO O.OOOOOOOEO O.OOOOOOOEO O.OOOOOOOEO O.OOOOOOOEO O.OOOOOOOEO O.OOOOOOOEO O.OOOOOOOEO O.OOOOOOOEO
Upper Bnd 1 .0000000E6 1 .0000000E6 1 .0000000E6 1.0000000E6 1.0000000E6 1.0000000EO 1 .OOOOOOOEO 1.0000000EO 1 .OOOOOOOEO 1 .OOOOOOOEO 1 .OOOOOOOEO 1 .OOOOOOOEO 1 .OOOOOOOEO 1.0000000EO 1.0000000EO 1.0000000EO 1.0000000EO 1 .OOOOOOOEO 1.0000000EO 1.0000000EO 1. OOOOOOOEO 1.0000000EO 1.0000000EO
The foltowing indices of abundance are available:
1 RV SPR 2 2 RV SPR 3 3 RV SPR 4 4 RV SPR 5 5 RV SPR 6 6 RV FAL 2 7 RV FAL 3 8 RV FAL 4 9 RV FAL 5
10 RVFAL6 11 CM CPE 2 12 CM CPE 3 13 CM CPE 4 14 CM CPE 5 15 CM CPE 6 16 MA SPR 1 17 MA SPR 2 18 MA SPR 3 19 MA SPR 4 20 MA FAL 1 21 MA FAL 2 22 MA FAL 3 23 24 25 26 27 28 29 30
Indices that will be used 1n this run are: 1 2 3 4 5 6 7 8 9 10 12 13 14 15 17 18 19 21
2
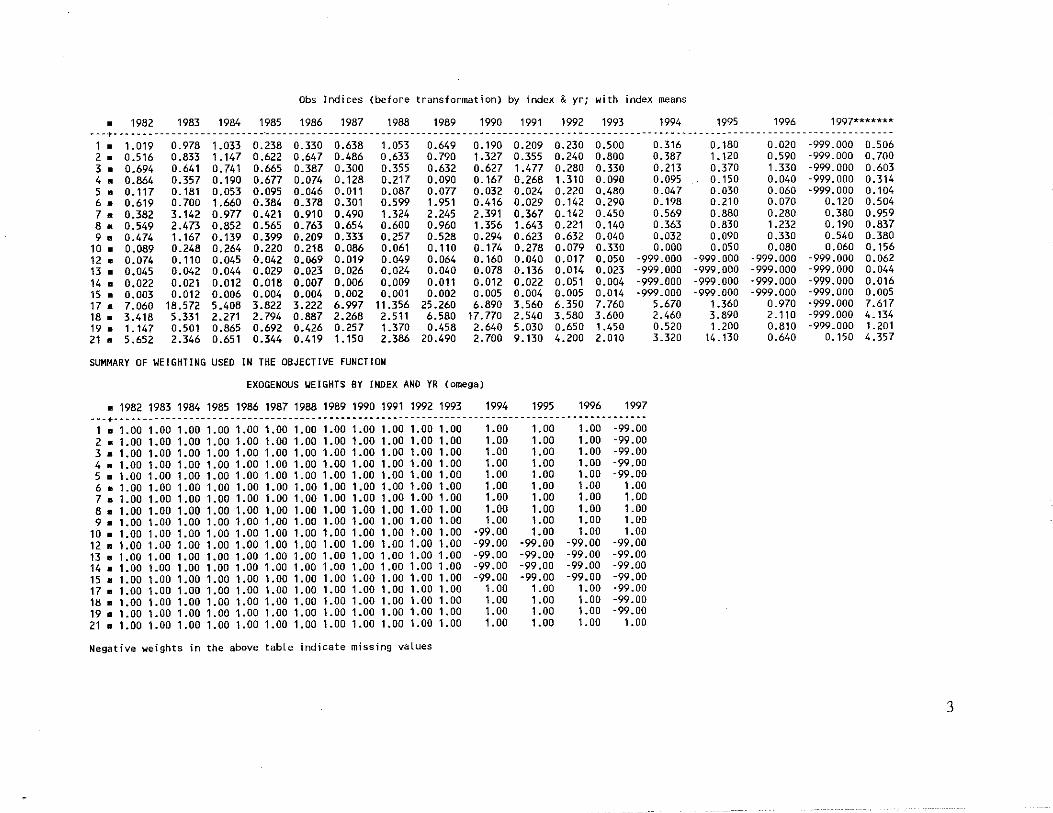
Obs Indices (before transformation) by index & yr; with index means
• 1982 1983 1984 1985 1986 1987 1988 1989 1990 1991 1992 1993 1994 1995 1996 1997******* ---+--------------------------"-----------------------------------------------------------------------------------------------._------------1 • 1.019 0.978 1.033 0.238 0.330 0.638 1.053 0.649 0.190 0.209 0.230 0.500 0.316 0.180 0.020 ·999.000 0.506 2 • 0.516 0.833 1.147 0.622 0.647 0.486 0.633 0.790 1.327 0.355 0.240 0.800 0.387 1. 120 0.590 ·999.000 0.700 3 • 0.694 0.641 0.741 0.665 0.387 0.300 0.355 0.632 0.627 1.477 0.280 0.330 0.213 0.370 1.330 ·999.000 0.603 4 • 0.864 0.357 0.190 0.677 0.074 0.128 0.217 0.090 0.167 0.268 1.310 0.090 0.095 0.150 0.040 ·999.000 0.314 5 • 0.117 0.181 0.053 0.095 0.046 0.011 0.087 0.077 0.032 0.024 0.220 0.480 0.047 0.030 0.060 ·999.000 0.104 6 • 0.619 0.700 1.660 0.384 0.378 0.301 0.599 1.951 0.416 0.029 0.142 0.290 0.198 0.210 0.070 0.120 0.504 7. 0.382 3.142 0.977 0.421 0.910 0.490 1.324 2.245 2.391 0.367 0.142 0.450 0.569 0.880 0.280 0.380 0.959 8 • 0.549 2.473 0.852 0.565 0.763 0.654 0.600 0.960 1.356 1.643 0.221 0.140 0.363 0.830 1.232 0.190 0.837 9 • 0.474 1.167 0.139 0.399 0.209 0.333 0.257 0.528 0.294 0.623 0.632 0.040 0.032 0.090 0.330 0.540 0.380
10 • 0.089 0.248 0.264 0.220 0.218 0.086 0.061 0.110 0.174 0.278 0.079 0.330 0.000 0.050 0.080 0.060 0.156 12 • 0.074 0.110 0.045 0.042 0.069 0.019 0.049 0.064 0.160 0.040 0.017 0.050 ·999.000 ·999.000 ·999.000 ·999.000 0.062 13 • 0.045 0.042 0.044 0.029 0.023 0.026 0.024 0.040 0.078 0.136 0.014 0.023 -999.000 ·999.000 ·999.000 ·999.000 0.044 14 • 0.022 0.021 0.012 0.018 0.007 0.006 0.009 0.011 0.012 0.022 0.051 0.004 -999.000 ·999.000 ·999.000 ·999.000 0.016 15 • 0.003 0.012 0.006 0.004 0.004 0.002 0.001 0.002 0.005 0.004 0.005 0.014 -999.000 -999.000 ·999.000 ·999.000 0.005 17 • 7.060 18.572 5.408 3.822 3.222 6.997 11.356 25.260 6.890 3.560 6.350 7.760 5.670 1.360 0.970 ·999.000 7.617 18 • 3.418 5.331 2.271 2.794 0.887 2.268 2.511 6.580 17.770 2.540 3.580 3.600 2.460 3.890 2.110 ·999.000 4.134 19 • 1.147 0.501 0.865 0.692 0.426 0.257 1.370 0.458 2.640 5.030 0.650 1.450 0.520 1.200 0.810 ·999.000 1.201 21 • 5.652 2.346 0.651 0.344 0.419 1.150 2.386 20.490 2.700 9.130 4.200 2.010 3.320 14.130 0.640 0.150 4.357
SUMMARY Of YEIGHTING USEO IN THE OBJECTIVE fUNCTION
EXOGENOUS ~EIGHTS BY INDEX AND YR (omega)
• 1982 1983 1984 1985 1986 1987 1988 1989 1990 1991 1992 1993 1994 1995 1996 1997 ---+--------------------------------------------------------------------------------------------1 .1.00 1.00 1.00 1.00 1.00 1.00 1.00 1.00 1.00 1.00 1.00 1.00 1.00 1.00 1.00 ·99.00 2.1.00 1.00 1.00 1.00 1.00 1.00 1.00 1.00 1.00 1.00 1.00 1.00 1.00 1.00 1.00 ·99.00 3.1.00 1.00 1.00 1.00 1.00 1.00 1.00 1.00 1.00 1.00 1.00 1.00 1.00 1.00 1.00 -99.00 4. 1.00 1.00 1.00 1.00 1.00 1.00 1.00 1.00 1.00 1.00 1.00 1.00 1.00 1.00 1.00 -99.00 5 • 1.00 1.00 1.00 1.00 1.00 1.00 1.00 1.00 1.00 1.00 1.00 1.00 1.00 1.00 1.00 ·99.00 6.1.00 1.00 1.00 1.00 1.00 1.00 1.00 1.00 1.00 1.00 1.00 1.00 1.00 1.00 1.00 1.00 7 • 1.00 1.00 1.00 1.00 1.00 1.00 1.00 1.00 1.00 1.00 1.00 1.00 1.00 1.00 1.00 1.00 8. 1.00 1.00 1.00 1.00 1.00 1.00 1.00 1.00 1.00 1.00 1.00 1.00 1.00 1.00 1.00 1.00 9 • 1.00 1.00 1.00 1.00 1.00 1.00 1.00 1.00 1.00 1.00 1.00 1.00 1.00 1.00 1.00 1.00
10 • 1.00 1.00 1.00 1.00 1.00 1.00 1.00 1.00 1.00 1.00 1.00 1.00 -99.00 1.00 1.00 1.00 12. 1.00 1.00 1.00 1.00 1.00 1.00 1.00 1.00 1.00 1.00 1.00 1.00 ·99.00 -99.00 ·99.00 ·99.00 13. 1.00 1.00 1.00 1.00 1.00 1.00 1.00 1.00 1.00 1.00 1.00 1.00 ·99.00 -99.00 ·99.00 -99.00 14 • 1.00 1.00 1.00 1.00 1.00 1.00 1.00 1.00 1.00 1.00 1.00 1.00 ·99.00 -99.00 ·99.00 -99.00 15 • 1.00 1.00 1.00 1.00 1.00 1.00 1.00 1.00 1.00 1.00 1.00 1.00 -99.00 -99.00 -99.00 -99.00 17. 1.00 1.00 1.00 1.00 1.00 1.00 1.00 1.00 1.00 1.00 1.00 1.00 1.00 1.00 1.00 -99.00 18. 1.00 1.00 1.00 1.00 1.00 1.00 1.00 1.00 1.00 1.00 1.00 1.00 1.00 1.00 1.00 -99.00 19. 1.00 1.00 1.00 1.00 1.00 1.00 1.00 1.00 1.00 1.00 1.00 1.00 1.00 1.00 1.00 ·99.00 21 • 1.00 1.00 1.00 1.00 1.00 1.00 1.00 1.00 1.00 1.00 1.00 1.00 1.00 1.00 1.00 1.00
Negative weights in the above table indicate missing values
3

OOWNWEIGHTS BY YEAR (delta)
• 1982 1983 1984 1985 1986 1987 1988 1989 1990 1991 1992 1993 1994 1995 1996 1997 ---+------------------------------------------------------------------.----.--.----------------.--------------------
.,.0000'.0000,.0000 1.0000 1.0000 1.0000 1.0000 1.0000 1.0000 1.0000 1.0000 1.0000 1.0000 1.0000 1.0000 1.0000
ITERATIVE RE'WEIGHTS BY INDEX (chi)
• 2 3 4 5 6 7 8 9 10 12 13 14 15 17 18 19 21 ---+----------------------------~--------------------- ---------------.----------------------------
.1.0000 1.0000 1.0000 1.0000 1.0000 1.0000 1.0000 1.0000 1.0000 1.0000 1.0000 1.0000 1.0000 1.0000 1.0000 1.0000 1.0000 1.0000
FINAL SS WEIGHTS BY INDEX NUMBER AND YR - GMCDD97
• 1982 19B3 1984 1985 1986 1987 1988 1989 1990 1991 1992 1993 1994 1995 1996 1997 ---+--------------------------------------------------------------------------------------------------------------.-------------1 ".0000 1.0000 1.0000 1.0000 1.0000 1.0000 1.0000 1.0000 1.0000 1.0000 1.0000 1.0000 1.0000 1.0000 1.0000 -99.0000 2.1.0000 1.0000 1.0000 1.0000 1.0000 1.0000 1.0000 1.0000 1.0000 1.0000 1.0000 1.0000 1.0000 1.0000 1.0000 -99.0000 3.1.00001.0000 1.0000 1.0000 1.0000 1.0000 1.0000 1.0000 1.0000 1.0000 1.0000 1.0000 1.0000 1.0000 1.0000 -99.0000 4".0000'.00001.0000 1.0000 1.0000 1.0000 1.0000 1.0000 1.0000 1.0000 1.0000 1.0000 1.0000 1.0000 1.0000 -99.0000 5. 1.0000 1.0000 1.0000 1.0000 1.0000 1.0000 1.0000 1.0000 1.0000 1.0000 1.0000 1.0000 1.0000 1.0000 1.0000 -99.0000 6. 1.0000 1.0000 1.0000 1.0000 1.0000 1.0000 1.0000 1.0000 1.0000 1.0000 1.0000 1.0000 1.0000 1.0000 1.0000 1.0000 7. 1.0000 1.0000 1.0000 1.0000 1.0000 1.0000 1.0000 1.0000 1.0000 1.0000 1.0000 1.0000 1.0000 1.0000 1.0000 1.0000 8.1.00001.0000 1.0000 1.0000 1.0000 1.0000 1.0000 1.0000 1.0000 1.0000 1.0000 1.0000 1.0000 1.0000 1.0000 1.0000 9. 1.0000 1.0000 1.0000 1.0000 1.0000 1.0000 1.0000 1.0000 1.0000 1.0000 1.0000 1.0000 1.0000 1.0000 1.0000 1.0000
10.1.00001.0000 1.0000 1.0000 1.0000 1.0000 1.0000 1.0000 1.0000 1.0000 1.0000 1.0000 -99.0000 1.0000 1.0000 1.0000 12".0000 1.0000 1.0000 1.0000 1.0000 1.0000 1.0000 1.0000 1.0000 1.0000 1.0000 1.0000 -99.0000 -99.0000 -99.0000 -99.0000 13.1.0000 1.0000 1.0000 1.0000 1.0000 1.0000 1.0000 1.0000 1.0000 1.0000 1.0000 1.0000 -99.0000 -99.0000 -99.0000 -99.0000 14.,.0000 1.0000 1.0000 1.0000 1.0000 1.0000 1.0000 1.0000 1.0000 1.0000 1.0000 1.0000 -99.0000 -99.0000 -99.0000 -99.0000 15.1.0000 1.0000 1.0000 1.0000 1.0000 1.0000 1.0000 1.0000 1.0000 1.0000 1.0000 1.0000 -99.0000 -99.0000 -99.0000 -99.0000 17. 1.0000 1.0000 1.0000 1.0000 1.0000 1.0000 1.0000 1.0000 1.0000 1.0000 1.0000 1.0000 1.0000 1.0000 1.0000 -99.0000 18 • 1.0000 1.0000 1.0000 1.0000 1.0000 1.0000 1.0000 1.0000 1.0000 1.0000 1.0000 1.0000 1.0000 1.0000 1.0000 -99.0000 19. 1.0000 1.0000 1.0000 1.0000 1.0000 1.0000 1.0000 1.0000 1.0000 1.0000 1.0000 1.0000 1.0000 1.0000 1.0000 -99.0000 21 • 1.0000 1.0000 1.0000 1.0000 1.0000 1.0000 1.0000 1.0000 1.0000 1.0000 1.0000 1.0000 1.0000 1.0000 1.0000 1.0000
Negative weights in the above table indicate missing values
CATCH AT AGE (thousands) - GMCDD97
• 1982 1983 1984 1985 1986 1987 1988 1989 1990 1991 1992 1993 1994 1995 1996 ---+------------------------------------------------------.-.-.-------------------------------,. 30 0 4 0 0 2 0 0 0 0 0 0 0 0 0 2. 1380 866 446 407 84 216 160 337 205 344 313 76 29 218 65 3. 1633 2357 1240 1445 2164 595 1443 1583 3425 934 530 1487 1016 880 584 4. 1143 1058 1500 991 813 1109 953 1454 2064 4161 484 641 1135 1153 1738 5. 633 638 437 630 250 277 406 449 430 851 2018 129 288 194 347 6 • 69 422 194 128 177 66 43 81 157 143 202 457 72 12 45 7. 230 155 136 136 95 79 30 56 99 79 84 36 86 34 10
---+------------------------------------------------------------------------------------------1+. 5118 5496 3957 3737 3583 2344 3035 3960 6380 6512 3631 2826 2626 2491 2789
4

CAA summary for ages 2 5 3 5 4 5 5 5
• 1982 1983 1984 1985 1986 1987 1988 1989 1990 1991 1992 1993 1994 1995 1996 ~N.+ ____ . __ ... ___________ . ____________________________ ________________________________________
2 • 4789 4919 3623 3473 3311 2197 2962 3823 6124 6290 3345 2333 2468 2445 2734 3 • 3409 4053 3177 3066 3227 1981 2802 3486 5919 5946 3032 2257 2439 2227 2669 4 • 1776 1696 1937 1621 1063 1386 1359 1903 2494 5012 2502 770 1423 1347 2085 5 • 633 638 437 630 250 277 406 449 430 851 2018 129 288 194 347
WT AT AGE (MIO-YR) in kg .. GMCOO97
• 1982 1983 1984 1985 1986 1987 1988 1989 1990 1991 1992 1993 1994 1995 1996 ---+----------------------------------------------------------------------------------------------------------------------1. 0.900 0.900 0.900 0.900 0.900 0.900 0.900 0.900 0.900 0.900 0.900 0.900 0.900 0.900 0.900 2. 1.156 1.164 1.159 1.260 1.304 1.313 1.268 1.247 1.071 1.130 1.533 1.293 1.450 1.652 1.687 3. 1.664 1.660 1.670 1.746 1.837 1.684 1.881 1.776 1.692 1.568 1.922 1.889 1.943 1.921 2.136 4. 2.764 2.475 2.721 2.840 2.923 3.283 2.426 2.993 2.271 2.512 2.714 2.513 3.151 2.775 2.376 5. 4.770 3.778 3.677 4.466 4.619 4.831 5.166 3.864 4.265 4.136 3.061 4.356 3.444 5.142 3.648 6. 6.739 5.962 5.898 5.525 6.067 6.824 6.767 4.872 7.645 7.309 5.000 6.174 6.132 8.290 7.376 7. 11.309 9.756 10.187 9.764 10.243 10.313 11.512 12.179 13.732 11.449 10.614 11.064 10.018 12.965 11.649
WT AT AGE (JAN 1) in kg. - GMCOO97
• 1982 1983 1984 1985 1986 1987 1988 1989 1990 1991 1992 1993 1994 1995 1996 1997 ---+------------------------------------------------------------------------------------------------------------------------------1. 0.791 0.793 0.761 0.748 0.745 0.758 0.765 0.825 0.803 0.690 0.751 0.709 0.664 0.657 0.657 0.739 2. 0.965 1.024 1.021 1.065 1.083 1.087 1.068 1.059 0.982 1.008 1.175 1.079 1.142 1.219 1.232 1.232 3. 1.364 1.385 1.394 1.423 1.521 1.482 1.572 1.501 1.453 1.296 1.474 1.702 1.585 1.669 1.878 2.310 4. 2.364 2.029 2.125 2.178 2.259 2.456 2.021 2.373 2.008 2.062 2.063 2.198 2.440 2.322 2.136 2.429 5. 4.267 3.231 3.017 3.486 3.622 3.758 4.118 3.062 3.573 3.065 2.773 3.438 2.942 4.025 3.182 2.642 6. 5.670 5.333 4.720 4.507 5.205 5.614 5.718 5.017 5.435 5.583 4.548 4.347 5.168 5.343 6.159 4.183 7. 11.309 9.756 10.187 9.764 10.243 10.313 11.512 12.179 13.732 11.449 10.614 11.064 10.018 12.965 11.649 11.649
Yeights at age at the start of the spawning season are assumed to be the same as the Janl weight at age estimates.
PERCENT MATURE (females) . GMCOO97
• 1982 1983 1984 1985 1986 1987 1988 1989 1990 1991 1992 1993 1994 1995 1996 ---+----------------------------------------------------.----------------------1. 7 7 7 4 4 4 4 4 9 9 9 9 9 9 9 2. 26 26 26 48 48 48 48 48 24 24 24 24 24 24 24 3. 61 61 61 95 95 95 95 95 54 54 54 54 54 54 54 4. 88 88 88 100 100 100 100 100 81 81 81 81 81 81 81 5. 97 97 97 100 100 100 100 100 94 94 94 94 94 94 94 6. 100 100 100 100 100 100 100 100 98 98 98 98 98 98 98 7. 100 100 100 100 100 100 100 100 100 100 100 100 100 100 100
.il'
5

SEX RATIO (Percent Female) - GMCOD97
• 1982 1983 1984 1985 1986 1987 1988 1989 1990 1991 1992 1993 1994 1995 1996 ---+---------------------------------------------------------------------------1 • 50 50 50 50 50 50 50 50 50 50 50 50 50 50 50 2 • 50 50 50 50 50 50 50 50 50 50 50 50 50 50 50 3 • 50 50 50 50 50 50 50 50 50 50 50 50 50 50 50 4 • 50 50 50 50 50 50 50 50 50 50 50 50 50 50 50 5 • 50 50 50 50 50 50 50 50 50 50 50 50 50 50 50 6 • 50 50 50 50 50 50 50 50 50 50 50 50 50 50 50 7. 50 50 50 50 50 50 50 50 50 50 50 50 50 50 50
BEGIN MARQUARDT ALGORITHM -------------------------
LAMBDA 1.00000E-2 RSS 3.00344E3 NPHI 3.00344E3
par 3.00000E3 3.00000E3 5.00000E2 5.00000E2 5.00000E2 1.00000E-2 1.00000E-2 1.00000E·2 1.00000E·2 1.00000E-2 1.00000E-2 1.00000E-2 1.00000E-2 1.00000E-2 1.00000E-2 1.00000E-2 1.00000E-2 1.00000E-2 1.00000E·2 1.00000E-2 1.00000E-2 1.00000E-2 1.00000E-2
LAMBDA 1.00000E-1 RSS 2.31612E3 NPHI 2.31612E3
par 2.56508E3 2.57276E3 5.51574E2 5.58491E2 4.49776E2 5.78612E-3 6.20138E-3 6.74726E-3 7.53569E·3 8.91658E-3 5.76161E-3 6.05487E-3 6.66827E-3 7.61226E-3 9.12623E-3 6.39222E-3 7.20220E-3 B.18280E-3 9.34452E-3 5.82705E-3 6.05245E-3 6.58914E-3 5.47602E-3
LAMBDA 1. OOOOOEO RSS 1. 81344E3 NPHI 1.81344E3
par 2. 22699E3 2.23906E3 5.98788E2 6.11512E2 4.04959E2 3.68622E-3 4.16251E-3 4.B3699E·3 5.90988E-3 B.06442E-3 3.659B6E-3 3.99162E-3 4.73909E-3 6.02504E·3 8.42B30E-3 4.39139E-3 5.4403BE·3 6.B7254E·3 B.80057E-3 3.731B4E-3 3.987B5E-3 4.63592E-3 3.35115E·3
LAMBDA 1.00000E1 RSS 1.46858E3 NPHI 1.46858E3
par 1.92416E3 1.93950E3 6.16339E2 6.28190E2 3.54475E2 2.622D4E-3 3.06800E-3 3.73375E-3 4.87950E-3 7.44511E·3 2.60106E·3 2.90817E-3 3.64751E-3 5.02902E·3 7.93016E-3 3.2B045E-3 4.35B23E-3 5.97233E-3 B.37B9BE·3 2.66420E-3 2.90085E-3 3.52982E-3 2.32155E-3
6
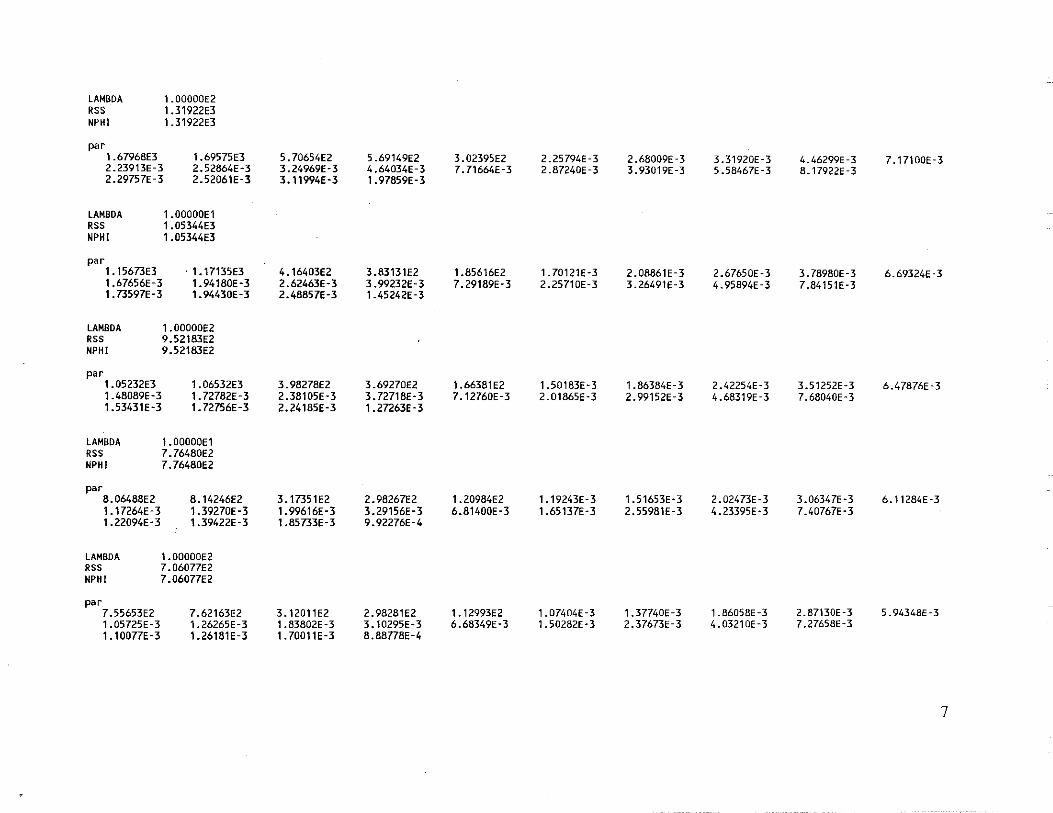
LAMBDA 1.00000E2 RSS 1.31922E3 NPHI 1.31922E3
par 1.67968E3 1.69575E3 5.70654E2 5.69149E2 3.02395E2 2.25794E·3 2.68009E-3 3.31920E-3 4.46299E-3 7.17100E-3 2.23913E-3 2.52864E-3 3.24969E-3 4.64034E-3 7.71664E-3 2.87240E-3 3.93019E-3 5.58467E-3 8.17922E-3 2.29757E-3 2.52061E-3 3.11994E-3 1. 97859E-3
LAMBOA 1.00000E1 RSS 1.05344E3 NPHI 1.05344E3
par 1.15673E3 ·1.17135E3 4.16403E2 3.83131E2 1.85616E2 1.70121 E -3 2.08861E-3 2.67650E-3 3.78980E-3 6.69324E·3 1.67656E-3 1.94180E-3 2.62463E-3 3.99232E-3 7.29189E-3 2.25710E-3 3.26491E-3 4.95894E-3 7.84151E-3 1. 73597E-3 1.94430E-3 2.48857E-3 1.45242E-3
LAMBDA 1.00000E2 RSS 9.52183E2 NPHI 9.52183E2
par 1.05232E3 1.06532E3 3.98278E2 3.69270E2 1.66381E2 1.50183E-3 1. 86384E-3 2.42254E-3 3.51252E-3 6.47876E-3 1.48089E-3 1. 72782E-3 2.38105E-3 3.72718E-3 7. 12760E-3 2.01865E-3 2.99152E-3 4.68319E-3 7.68040E-3 1.53431E-3 1. 72756E-3 2.24185E-3 1.27263E-3
LAMBDA 1.00000E1 RSS 7.76480E2 NPHI 7.76480E2
par 8.06488E2 8.14246E2 3.17351E2 2.98267E2 1.20984E2 1.19243E-3 1.51653E-3 2.02473E-3 3.06347E-3 6.11284E-3 1. 17264E-3 1. 39270E-3 1.99616E-3 3.29156E-3 6.81400E-3 1.65137E-3 2.55981E-3 4.23395E-3 7.40767E-3 1.22094E-3 1.39422E-3 1.85733E-3 9.92276E-4
LAMBDA 1.00000E2 RSS 7.06077E2 NPHI 7.06077E2
par 7.55653E2 7.62163E2 3.12011E2 2.98281E2 1.12993E2 1 . 07404E -3 1.37740E-3 1.86058E-3 2.87130E-3 5.94348E-3 1.05725E-3 1. 26265E-3 1.83802E-3 3.10295E-3 6.68349E-3 1.50282E-3 2.37673E-3 4.03210E-3 7.27658E-3 1.10077E-3 1.26181E-3 1.70011E-3 8.88778E-4
7

LAMBDA 1.00000El RSS 5.86076E2 NPHr 5.86076E2
par 6.23591E2 6.25832E2 2.68001E2 2.66822E2 9.23577E1 8.87895E·4 1. 15957E·3 1.60041E-3 2.55857E·3 5.65689E·3 8.73426E·4 1.05661E-3 1. 58674E·3 2.79600E-3 6.44328E·3 1.26993E·3 2.08373E·3 3.70053E·3 7.05419E-3 9.11616E-4 1.05527E·3 1.45193E-3 7.25241E-4
LAMBDA 1.00000EO RSS 1.15175E2 NPHr 1.15175E2
par 3.58091E2 ·3.53498E2 2.79218E2 3.22346E2 5.51918E1 1.38336E·4 2.50766E-4 4.90782E·4 1. 18266E-3 4.30560E·3 1.45096E-4 2.17446E·4 5.09464E-4 1.41221E-3 S.38829E-3 2.95088E-4 8.08800E-4 2.18660E-3 5.97896E·3 1.48629E-4 1.99536E·4 4.01380E-4 8.45688E-5
LAMBDA 1.00000E-1 RSS 9.48195El NPHr 9.48195El
par 5.79106E2 5.90639E2 7.00512E2 7.89769E2 8.43254El 1.51728E-4 2.33182E-4 3.93746E·4 8.51742E·4 3.46225E·3 1.49966E·4 2.01941E·4 3.57590E-4 8.98423E-4 4.47309E·3 2.76533E-4 6.08136E-4 1.61017E-3 5.22378E-3 1.58808E·4 2.00164E-4 3.38008E-4 1.07139E-4
LAMBDA 1.00000E-2 RSS 9.25340El NPHr 9.25340El
par 7.02535E2 7.15265E2 1. 16645E3 1.19852E3 1.09625E2 1.49036E·4 2.25818E·4 3.90716E·4 8.65240E-4 3.44880E·3 1.45398E·4 1.95207E-4 3.61779E·4 9.43452E-4 4.38384E-3 2.75334E·4 6.16223E·4 1.63754E·3 5.20585E·3 1.55226E·4 1.94710E-4 3.33773E-4 1.09400E-4
LAMBDA 1.00000E·3 RSS 9.24186El NPHr 9.24186El
par 7.20526E2 7.29815E2 1.34496E3 1.23975E3 1.21818E2 1.48398E·4 2.24996E·4 3.90367E·4 8.63385E·4 3.44184E·3 1.44791E-4 1.94534E·4 3.61517E-4 9.46532E-4 4.35408E·3 2.75293E·4 6.16269E·4 1.63773E·3 5.20538E·3 1.54573E-4 1.93979E·4 3.33483E-4 1.08944E-4
8
.'1

LAMBDA 1.00000E-4 RSS 9.24166El NPHI 9.24166El
par 7.21189E2 7.30181E2 1.36831E3 1. 24270E3 1. 24828E2 1.48299E-4 2.24846E-4 3.90271E-4 8.62910E-4 3.44017E-3 1.44695E-4 1.94408E-4 3.61265E-4 9.45910E-4 4.34659E-3 2.75284E-4 6.16257E-4 1.63769E-3 5.20529E-3 1.54470E-4 1. 93850E-4 3.33401E-4 1.08872E-4
LAMBDA 1.00000E-5 RSS 9.24166El NPHI 9.24166El
par 7.21262E2 7.30254E2 1. 36997E3 1. 24398E3 1. 25367E2 1.48284E-4 2.24824E-4 3.90246E-4 8.62821E-4 3.43984E-3 1.44680E-4 1. 94388E-4 3.61219E-4 9.45758E-4 4.34502E-3 2.75283E-4 6.16255E-4 1. 63768E-3 5.20527E-3 1.54454E-4 1.93831E-4 3.33380E-4 1.08860E-4
RELATIVE CHANGE IN RESIDUAL SUM OF SQUARES LESS THAN 0.00001
9

RESUL TS
APPROXIMATE STATISTICS ASSUMING LINEARITY NEAR SOLUTION
SUM OF SQUARES •.••.••••••••• 92.416601 ORTHOGONALITY OFFSET •••.•••.. 0.002585 MEAN SQUARE RESIDUALS •••.•.. 0.385069
PAR. EST. STD. ERR. T·sTATISTIC C.V . ......... ......... . ....... --.
N 2 7.21262E2 3.29056E2 2.19191EO 0.46 " 3 7.30254E2 2.24368E2 3.25471EO 0.31 " 4 1.36997E3 4.25191E2 3.22201EO 0.31
" 5 1.24398E3 5.05247E2 2.46212EO 0.41 N 6 1.25367E2 7.18052El 1.74593EO 0.57 qRV SPR 2 1.48284E·4 2.42032E·5 6.12665EO 0.16 qRV SPR 3 2.24824E·4 3.64429E·5 6.16921EO 0.16 qRV SPR 4 3.90246E·4 6.30466E·5 6.18981EO 0.16 qRV SPR 5 8.62821E·4 1.39447E·4 6. 18746EO 0.16 qRV SPR 6 3.43984E·3 5.55621E·4 6.19098EO 0.16 qRV FAL 2 1.44680E·4 2.32530E·5 6.22200EO 0.16 qRV FAL 3 1. 94388E·4 3.07506E·5 6.32144EO 0.16 qRV FAL 4 3.61219E·4 5.69530E·5 6.34240EO 0.16 qRV FAL 5 9.45758E·4 1.50098E·4 6.30094EO 0.16 qRV FAL 6 4.34502E·3 7.32247E-4 5.93381EO 0.17 qCM CPE 3 2.75283E-4 4.95592E-5 5.55463EO 0.18 qCM CPE 4 6.16255E-4 1.10944E-4 5.55466EO 0.18 qCM CPE 5 1.63768E-3 2.94830E-4 5.55464EO 0.18 qCM CPE 6 5.20527E-3 9.37100E-4 5.55466EO 0.18 qMA SPR 2 1.54454E-4 2.52103E-5 6.12665EO 0.16 qMA SPR 3 1.93831E-4 3.14191E-5 6.16921EO 0.16 qMA SPR 4 3.33380E-4 5.38595E-5 6.18981EO 0.16 qMA FAL 2 1.08860E-4 1.74961E-5 6.22200EO 0.16
CATCHABILITY ESTIMATES IN ORIGINAL UNITS
ESTIMATE STD. ERR. C.V • . __ ._--_ .. .-.----- ..
qRV SPR 2 7.49741E-5 1. 22374E-5 0.16 qRV SPR 3 1.57272E·4 2.54931E-5 0.16 qRV SPR 4 2.35263E-4 3.80081E-5 0.16 qRV SPR 5 2.71319E-4 4.38498E-5 0.16 qRV SPR 6 3.57788E·4 5.77919E-5 0.16 qRV FAL 2 7.29443E·5 1.17236E-5 0.16 qRV FAL 3 1.86478E-4 2.94993E-5 0.16 qRV FAL 4 3.02327E-4 4.76676E-5 0.16 qRV FAL 5 3.59762E-4 5.70966E-5 0.16 qRV FAL 6 6.79688E-4 1.14545E-4 0.17 qeM CPE 3 1.69371E-5 3.04919E-6 0.18 qeM CPE 4 2. 68792f-5 4.83904E-6 0.18 qeM CPE 5 2.64767E-5 4.76660E-6 0.18 qeM CPE 6 2.69298E-5 4.84814E-6 0.18 qMA SPR 2 1.17650E-3 1.92030E-4 0.16 qMA SPR 3 8.01297E-4 1. 29886E-4 0.16 qMA SPR 4 4.00411E-4 6.46888E-5 0.16 qMA FAL 2 4.74346E-4 7.62369E-5 0.16
10
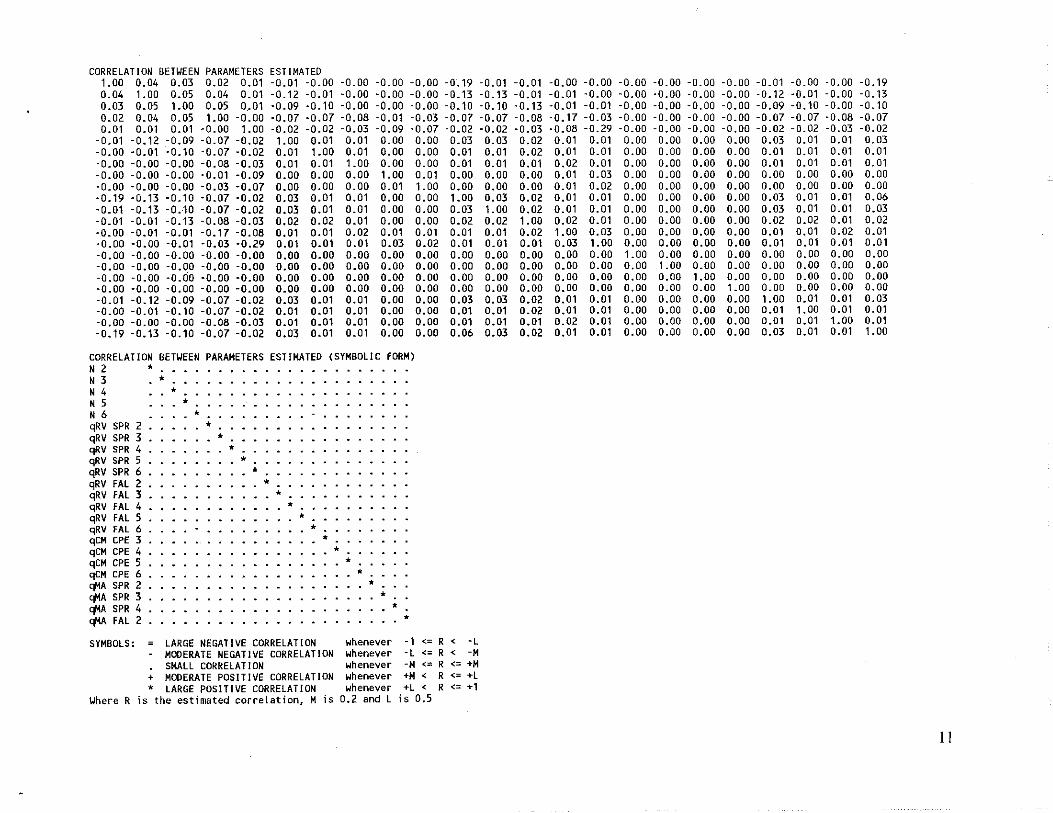
CORRELATION BETWEEN PARAMETERS ESTIMATED 1.00 0.04 0.03 0.02 0.01 '0.01 '0.00 '0.00 '0.00 -0.00 -0;19 -0.01 -0.01 -0.00 -0.00 -0.00 -0.00 -0.00 -0.00 -0.01 -0.00 -0.00 -0.19 0.04 1.00 0.05 0.04 0.01 -0.12 -0.01 -0.00 -0.00 -0.00 -0.13 -0.13 -0.01 -0.01 -0.00 -0.00 -0.00 -0.00 -0.00 -0.12 -0.01 -0.00 -0.13 0.03 0.05 1.00 0.05 0 .. 01 -0.09 -0.10 -0.00 -0.00 -0.00 -0.10 -0.10 -0.13 -0.01 -0.01 -0.00 -0.00 -0.00 -0.00 -0.09 -0.10 -0.00 -0.10 0.02 0.04 0.05 1.00 -0.00 -0.07 '0.07 -O.OB -0.01 -0.03 -0.07 -0.07 -O.OB '0.17 -0.03 -0.00 -0.00 '0.00 -0.00 -0.07 -0.07 '0.08 -0.07 0.01 0.01 0.01 -0.00 1.00 -0.02 -0.02 -0.03 -0.09 '0.07 -0.02 -0.02 '0.03 '0.08 -0.29 '0.00 -0.00 -0.00 -0.00 -0.02 -0.02 -0.03 -0.02
-0.01 -0.12 -0.09 -0.07 -0.02 1.00 0.01 0.01 0.00 0.00 0.03 0.03 0.02 0.01 0.01 0.00 0.00 0.00 0.00 0.03 0.01 0.01 0.03 -0.00 -0.01 -0.10 -0.07 -0.02 0.01 1.00 0.01 0.00 0.00 0.01 0.01 0.02 0.01 0.01 0.00 0.00 0.00 0.00 0.01 0.01 0.01 0.01 -0.00 -0.00 -0.00 -0.08 -0.03 0.01 0.01 1.00 0.00 0.00 0.01 0.01 0.01 0.02 0.01 0.00 0.00 0.00 0.00 0.01 0.01 0.01 0.01 -0.00 -0.00 -0.00 -0.01 -0.09 0.00 0.00 0.00 1.00 0.01 0.00 0.00 0.00 0.01 0.03 0.00 0.00 0.00 0.00 0.00 0.00 0.00 0.00 -0.00 -0.00 -0.00 -0.03 -0.07 0.00 0.00 0.00 0.01 1.00 0.00 0.00 0.00 0.01 0.02 0.00 0.00 0.00 0.00 0.00 0.00 0.00 0.00 -0.19 -0.13 -0.10 -0.07 -0.02 0.03 0.01 0.01 0.00 0.00 1.00 0.03 0.02 0.01 0.01 0.00 0.00 0.00 0.00 0.03 0.01 0.01 0.06 -0.01 -0.13 -0.10 -0.07 -0.02 0.03 0.01 0.01 0.00 0.00 0.03 1.00 0.02 0.01 0.01 0.00 0.00 0.00 0.00 0.03 0.01 0.01 0.03 -0.01 -0.01 -0.13 -0.08 -0.03 0.02 0.02 0.01 0.00 0.00 0.02 0.02 1.00 0.02 0.01 0.00 0.00 0.00 0.00 0.02 0.02 0.01 0.02 -0.00 -0.01 -0.01 -0.17 -0.08 0.01 0.01 0.02 0.01 0.01 0.01 0.01 0.02 1.00 0.03 0.00 0.00 0.00 0.00 0.01 0.01 0.02 0.01 -0.00 -0.00 -0.01 -0.03 -0.29 0.01 0.01 0.01 0.03 0.02 0.01 0.01 0.01 0.03 1.00 0.00 0.00 0.00 0.00 0.01 0.01 0.01 0.01 -0.00 -0.00 -0.00 -0.00 -0.00 0.00 0.00 0.00 0.00 0.00 0.00 0.00 0.00 0.00 0.00 1.00 0.00 0.00 0.00 0.00 0.00 0.00 0.00 -0.00 -0.00 -0.00 -0.00 -0.00 0.00 0.00 0.00 0.00 0.00 0.00 0.00 0.00 0.00 0.00 0.00 1.00 0.00 0.00 0.00 0.00 0.00 0.00 -0.00 -0.00 -0.00 -0.00 -0.00 0.00 0.00 0.00 0.00 0.00 0.00 0.00 0.00 0.00 0.00 0.00 0.00 1.00 0.00 0.00 0.00 0.00 0.00 -0.00 -0.00 -0.00 -0.00 -0.00 0.00 0.00 0.00 0.00 0.00 0.00 0.00 0.00 0.00 0.00 0.00 0.00 0.00 1.00 0.00 0.00 0.00 0.00 -0.01 -0.12 -0.09 -0.07 -0.02 0.03 0.01 0.01 0.00 0.00 0.03 0.03 0.02 0.01 0.01 0.00 0.00 0.00 0.00 1.00 0.01 0.01 0.03 -0.00 -0.01 -0.10 -0.07 -0.02 0.01 0.01 0.01 0.00 0.00 0.01 0.01 0.02 0.01 0.01 0.00 0.00 0.00 0.00 0.01 1.00 0.01 0.01 -0.00 -0.00 -0.00 -0.08 -0.03 0.01 0.01 0.01 0.00 0.00 0.01 0.01 0.01 0.02 0.01 0.00 0.00 0.00 0.00 0.01 0.01 1.00 0.01 -0.19 -0.13 -0.10 -0.07 -0.02 0.03 0.01 0.01 0.00 0.00 0.06 0.03 0.02 0.01 0.01 0.00 0.00 0.00 0.00 0.03 0.01 0.01 1.00
CORRELATION BETWEEN PARAMETERS ESTIMATED (SYMBOLIC FORM) N 2 • N 3 • N 4 • N 5 * N 6 • qRV SPR 2 * qRV SPR 3 • qRV SPR 4 • qRV SPR 5 • qRV SPR 6 • qRV FAL 2 • qRV FAL 3 • qRV FAL 4 • qRV FAL 5 • qRV FAL 6 qeM ePE 3
* • qCM CPE 4 qCM CPE 5 qeM ePE 6 ctlA SPR 2 ctlA SPR 3 ctlA SPR 4 ctlA FAL 2
• •
• •
• •
• SYMBOLS: LARGE NEGATIVE CORRELATION whenever -1 <= R < -L
MODERATE NEGATIVE CORRELATION whenever -L <= R < -M SMALL CORRELATION whenever -M <= R <= +M
+ MODERATE POSITIVE CORRELATION whenever +M < R <= +L
• LARGE POSITIVE CORRELATION whenever +L < R <= +1 Uhere R is the estimated correlation, M is 0.2 and L is 0.5
11

SUMMMARY OF RESIDUALS
Index 1 RV SPR 2 Index is tuned to the sum of Janl fuLL stock sizes (in number> for ages: 2 SORTED BY YEAR
Yr Observed Pred l.Jeight l.Jt Res std Res Pred stocks i ze 1982 0.7010 0.3005 1.0000 0.4005 0.6454 9107.659 1983 0.6599 -0.2956 1.0000 0.9555 1.5398 5017.878 1984 0.7142 -0.3978 1.0000 1.1120 1. 7920 4530.472 , 1985 ·0.7535 '0.0620 1.0000 '0.6915 ·1.1144 6338.648 1986 -0.4267 -0.5166 1.0000 0.0900 0.1450 4022.788 1987 0.2326 '0.1058 1.0000 0.3384 0.5453 6066.650 1988 0.7336 0.1891 1.0000 0.5445 0.8775 8147.605 1989 0.2503 0.9662 1.0000 ·0.7159 -1.1537 17721.445 1990 -0.9767 '0.8929 1. 0000 -0.0838 -0.1350 2761.393 1991 -0.8818 -0.8876 1.0000 0.0059 0.0095 2775.918 1992 ·0.7877 -0.3428 1.0000 -0.4449 ·0.7170 4786.727 1993 '0.0112 ·0.4421 1. 0000 0.4309 0.6944 4334.207 1994 -0.4700 -0.0598 1.0000 -0.4102 '0.6610 6352.080 1995 -1.0328 ·0.7860 1. 0000 -0.2468 '0.3978 3072.999 1996 -3.2300 ·1.9455 1.0000 -1.2845 -2.0700 963.770
Partial vari ance for this index is 0.436486
Index 2 RV SPR 3 Index is tuned to the sum of Jan1 full stock sizes (in number) for ages: 3 SORTED BY YEAR
Yr Observed Pred Weight l.Jt Res Std Res Pred Stocksize 1982 -0.3036 '0.0273 1.0000 -0.2763 '0.4453 4328.310 1983 0.1747 0.3334 1.0000 -0.1587 ·0.2558 6208.045 1984 0.4941 '0.2911 1.0000 0.7852 1.2653 3324.702 1985 -0.1175 '0.2968 1.0000 0.1793 0.2890 3305.679 1986 -0.0781 0.0806 1. 0000 -0.1587 '0.2557 4821.377 1987 '0.3642 '0.3238 1.0000 -0.0404 -0.0651 3217.574 1988 -0.0999 0.0702 1.0000 -0.1702 '0.2742 4771.508 1989 0.1216 0.3833 1.0000 -0.2617 -0.4218 6525.920 1990 0.6404 1.1611 1.0000 -0.5207 -0.8391 14204.162 1991 '0.6791 -0.7623 1.0000 0.0832 0.1341 2075 .346 1992 ·1.0698 '0.8187 1.0000 '0.2510 -0.4045 ' 1961.465 1993 0.1342 -0.2016 1.0000 0.3358 0.5411 3635.826 1994 ·0.5917 '0.2455 1.0000 '0.3463 -0.5580 3479.781 1995 0.4707 0.1513 1.0000 0.3194 0.5147 5174.403 1996 -0.1703 '0.6514 1.0000 0.4811 0.7754 2318.704
PartiaL variance for this index is 0;129842
Index 3 RV SPR 4 Index is tuned to the sum of Jan1 fulL stock sizes (in number) for ages: 4 SORTED BY YEAR
Yr Observed Pred Weight Wt Res $td Res Pred Stocksize 1982 0.1406 0.0397 1.0000 0.1009 0.1626 2666.212 1983 0.0616 -0.2153 1.0000 0.2769 0.4462 2066.121 1984 0.2063 0.1408 1.0000 0.0655 0.1055 2950.015 1985 0.0981' , -0.4710 1.0000 0.5691 0.9170 1600.037 1986 '0.4433> -0.6052 ' 1.0000 0.1620 0.2610 1398.971 1987 -0.6979 -0.2532 1.0000 ·0.4447 ·0.7167 1989.342 1988 -0.5296,· -0.2010 1.0000 -0.3286 -0.5295 2095.949 1989 0.0472 0.0149 1.0000 0.0323 0.0521 2600.900 1990 0.0397 0.4227 1.0000 -0.3830 -0.6173 3910.614 1991 0.8963 1.2026 1.0000 -0.3064 -0.4937 8530.316 1992 -0.7669 -1.0988 1.0000 0.3319 0.5348 854.031 1993 -0.6026 -0.8220 1.0000 0.2194 0.3536 1126.348 1994 -1.0390 -0.4516 1.0000 -0.5874 -0.9465 1631.269 1995 -0.4882 -0.2836 1.0000 -0.2046 -0.3296 1929.689 1996 0.7913 0.2945 1.0000 0.4967 0.8004 3440.186
-Partial variance for this index is 0.129747
12
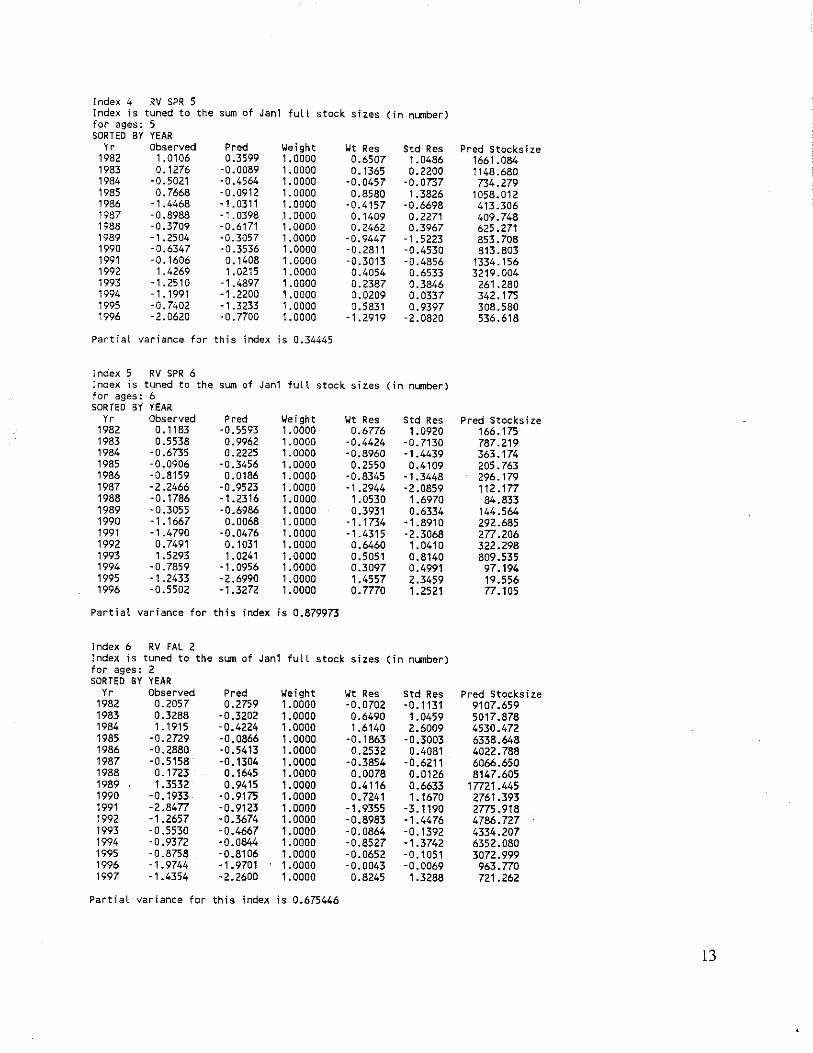
Index 4 RV SPR 5 Index is tuned to the sum of Janl fuLl stock sizes (in number) for ages: 5 SORTED BY YEAR
Yr Observed Pred Weight Wt Res Std Res Pred Stocksize 1982 1.0106 0.3599 1.0000 0.6507 1.0486 1661.084 1983 0.1276 '0.0089 1. 0000 0.1365 0.2200 1148.680 1984 ·0.5021 '0.4564 1.0000 -0.0457 '0.0737 734.279 1985 0.7668 '0.0912 1.0000 0.8580 1.3826 1058.012 1986 ·1.4468 ·1.0311 1. 0000 '0.4157 -0.6698 413.306 1987 '0.8988 '1.0398 1.0000 0.1409 0.2271 409.748 1988 '0.3709 '0.6171 1.0000 0.2462 0.3967 625.271 1989 -1.2504 '0.3057 1.0000 '0.9447 '1.5223 853.708 1990 '0.6347 '0.3536 1.0000 '0.2811 '0.4530 813.803 1991 -0.1606 0.1408 1.0000 '0.3013 ·0.4856 1334.156 1992 1.4269 1.0215 1.0000 0.4054 0.6533 3219.004 1993 -1.2510 ·1.4897 1.0000 0.2387 0.3846 261.280 1994 ·1.1991 -1.2200 1.0000 0.0209 0.0337 342.175 1995 ·0.7402 -1. 3233 1.0000 0.5831 0.9397 308.580 1996 ·2.0620 ·0.7700 1.0000 -1.2919 -2.0820 536.618
Partial variance for this index is 0.34445
Index 5 RV SPR 6 Index is tuned to the sum of Janl full stock sizes (in number) for ages: 6 SORTED BY YEAR
Yr Observed Pred Weight Wt Res Std Res Pred Stocks i ze 1982 0.1183 -0.5593 1.0000 0.6776 1.0920 166.175 1983 0.5538 0.9962 1.0000 ·0.4424 '0.7130 787.219 1984 '0.6735 0.2225 1.0000 '0.8960 -1.4439 363.174 1985 '0.0906 '0.3456 1.0000 0.2550 0.4109 205.763 1986 -0.8159 0.0186 1.0000 '0.8345 '1.3448 296.179 1987 -2.2466 ·0.9523 1.0000 '1.2944 '2.0859 112.177 1988 -0.1786 ·1.2316 1. 0000 1.0530 1.6970 84.833 1989 -0.3055 '0.6986 1. 0000 0.3931 0.6334 144.564 1990 -1.1667 0.0068 1. 0000 ·1.1734 -1.8910 292.685 1991 -1.4790 ·0.0476 1.0000 ·1.4315 '2.3068 277.206 1992 0.7491 0.1031 1. 0000 0.6460 1.0410 322.298 1993 1.5293 1.0241 1.0000 0.5051 0.8140 809.535 1994 ·0.7859 -1.0956 1.0000 0.3097 0.4991 97.194 1995 ·1.2433 -2.6990 1.0000 1.4557 2.3459 19.556 1996 '0.5502 -1.3272 1.0000 0.7770 1.2521 77.105
PartiaL vari" ance for this index is 0.879973
Index 6 RV FAL 2 Index is tuned to the sum of Janl fuLL stock sizes (in number) for ages: 2 SORTED BY YEAR
Yr Observed Pred Weight Wt Res Std Res Pred stocksize 1982 0.2057 0.2759 1.0000 '0.0702 ·0.1131 9107.659 1983 0.3288 ·0.3202 1.0000 0.6490 1.0459 5017.878 1984 1. 1915 ·0.4224 1.0000 1.6140 2.6009 4530.472 1985 ·0.2729 '0.0866 1.0000 '0.1863 '0.3003 6338.648 1986 ·0.2880 ·0.5413 1.0000 0.2532 0.4081 4022.788 1987 ·0.5158 ·0.1304 1.0000 -0.3854 ·0.6211 6066.650 1988 0.1723 0.1645 1.0000 0.0078 0.0126 8147.605 1989 1.3532 0.9415 1.0000 0.4116 0.6633 17721.445 1990 -0.1933 -0.9175 1.0000 0.7241 1.1670 2761.393 1991 -2.8477 -0.9123 1.0000 -1.9355 -3.1190 2m.918 1992 -1.2657 '0.3674 1.0000 '0.8983 -1.4476 4786.727 1993 '0.5530 '0.4667 1. 0000 '0.0864 -0.1392 4334.207 1994 '0.9372 '0.0844 1. 0000 '0.8527 -1.3742 6352.080 1995 '0.8758 '0.8106 1. 0000 '0.0652 ·0.1051 3072.999 1996 ·1.9744 -1.9701 1.0000 '0.0043 -0.0069 963.770 1997 -1.4354 '2.2600 1.0000 0.8245 1.3288 721.262
Partial variance for this index is 0.675446
13

Index 7 RV FAL 3 Index is tuned to the sum of Jan1 full stock sizes (in number) for ages: 3 SORTED BY YEAR
Yr Observed Pred Wei ght Wt Res Std Res Pred Stockslze 1982 -0_9203 -0_1727 1.0000 -0_7475 -1.2047 4328_310 1983 1.1864 0_1879 1.0000 0_9984 1.6089 6208.045 1984 0.0178 -0_4365 1.0000 0.4543 0.7322 3324.702 1985 -0.8231 -0.4423 1.0000 -0.3808 -0.6137 3305 _679 1986 -0.0528 -0.0648 1.0000 0.0121 0.0195 4821_377 1987 -0.6718 -0.4693 1.0000 -0_2025 -0.3264 3217.574 1988 0.3222 -0_0752 1.0000 0_3974 0.6405 4771.508 1989 0_8503 0_2379 1.0000 0.6124 0.9868 6525.920 1990 0.9131 1_0156 1.0000 -0.1026 -0.1653 14204.162 1991 -0_9620 -0_9078 1.0000 -0.0543 -0.0875 2075.346 1992 -1.9090 -0_9642 1.0000 -0.9448 -1.5225 1961.465 1993 -0.7570 -0_3471 1.0000 -0.4099 -0.6606 3635.826 1994 -0.5227 -0_3909 1.0000 -0_1318 -0_2123 3479_781 1995 -0.0863 0_0058 1.0000 -0.0921 -0.1484 5174_403 1996 -1.2314 -0_7969 1.0000 -0.4345 -0_7002 2318_704 1997 -0.9260 -1.9523 1.0000 1.0262 1.6538 730_254
Partial variance for this index is 0.327606
Index 8 RV FAL 4 Index is tuned to the sum of Jan1 full stock sizes (in number) for ages: 4 SORTED BY YEAR
Yr Observed Pred Weight Wt Res Std Res Pred Stocksize 1982 -0_4215 -0.0376 1.0000 -0.3839 -0.6186 2666.212 1983 1.0832 -0_2926 1.0000 1.3758 2_2172 2066.121 1984 0.0175 0.0635 1.0000 -0.0460 -0_0742 2950.015 1985 -0_3935 -0_5482 1.0000 0.1548 0_2494 1600.037 1986 -0_0925 -0.6825 1.0000 0.5900 0.9508 1398_971 1987 -0_2467 -0.3305 1.0000 0.0838 0_ 1350 1989_342 1988 -0_3329 -0.2783 1.0000 -0.0546 -0_0880 2095_949 1989 0_1372 -0.0624 1.0000 0.1996 0_3216 2600_900 1990 0_4828 0.3454 1.0000 0.1374 0_2214 3910_614 1991 0_6746 1. 1254 1.0000 -0.4507 -0.7264 8530_316 1992 -1_3307 -1.1761 1.0000 -0_1547 -0.2492 854_031 1993 -1. 7881 -0.8993 1.0000 -0.8888 -1.4324 1126_348 1994 -0_8343 -0.5289 1.0000 -0.3054 -0.4921 1631.269 1995 -0_0084 -0.3609 1.0000 0_3526 0.5681 1929_689 1996 0.3866 0.2173 1.0000 0_1694 0.2729 3440_186 1997 -1.4828 -0.7035 1.0000 -0_7793 -1.2558 1369.969
Partial vari ance for this index is 0.295731
Index 9 RV FAL 5 Index is tuned to the sum of Jan1 fuLL stock sizes (in number) for ages: 5 SORTED BY YEAR
Yr Observed Pred Weight Wt Res Std Res Pred stocksize 1982 0.2205 0.4517 1.0000 -0.2312 -0.3726 1661.084 1983 1.1209 0_0828 1.0000 1.0380 1.6728 1148_680 1984 -1. 0079 -0.3646 1.0000 -0.6433 -1.0366 734_279 1985 0.0487 0.0006 1.0000 0.0480 0.0774 1058_012 1986 -0.5989 -0_9393 1.0000 0_3405 0_5487 413.306 1987 -0.1331 -0_9480 1.0000 0.8149 1_3132 409.748 1988 -0.3921 -0_5253 1.0000 0.1332 0_2147 625.271 1989 0.3279 -0.2139 1.0000 0_5418 0_8731 853.708 1990 -0.2580 -0.2618 '_0000 0_0038 0.0061 813_803 1991 0.4926 0.2325 1.0000 0_2600 0_4190 1334_156 1992 0.5077 1.1133 1.0000 -0_6056 -0_9760 3219_004 1993 -2.2523 -1.3979 1.0000 -0_8544 -1.3769 261_280 1994 -2.4881 -1.1282 1.0000 -1_3599 -2_1914 342_175 1995 -1.4414 -1.2315 1.0000 -0_2099 -0_3382 308_580 1996 -0_1421 -0.6782 1.0000 0_5361 0.8640 536_618 1997 0_3504 0.1625 1.0000 0_1878 0.3027 1243_978
Partial variance for this index is 0.408818
14

Index 10 RV FAL 6 Index is tuned to the sum of Jan1 full stock sizes (in number) for ages: 6 SORTED BY YEAR
Yr Observed Pred Weight Wt Res Std Res Pred Stocksize 1982 -0.5649 -0.3257 1.0000 -0.2392 -0.3854 166.175 1983 0.4610 1.2298 1.0000 -0.7688 -1.2389 787.219 1984 0.5220 0.4562 1.0000 0.0658 0.1061 363.174 1985 0.3408 -0.1120 1.0000 0.4528 0.7298 205.763 1986 0.3319 0.2522 1.0000 0.0797 0.1284 296.179 1987 '0.5983 -0.7186 1.0000 0.1204 0.1940 112.177 1988 '0.9417 -0.9980 1.0000 0.0563 0.0907 84.833 1989 ·0.3521 -0.4650 1.0000 0.1129 0.1819 144.564 1990 0.1053 0.2404 1.0000 '0.1351 -0.2177 292.685 1991 0.5753 0.1860 1.0000 0.3893 0.6273 277.206 1992 -0.6832 0.3367 1.0000 -1.0199 -1.6436 322_298 1993 0.7465 1.2577 1.0000 -0.5112 '0.8239 809.535 1995 -1.1406 -2.4654 1.0000 1.3249 2.1350 19.556 1996 -0.6706 -1.0936 1. 0000 0.4230 0.6816 77.105 1997 -0.9583 -0.6075 1.0000 -0.3508 -0.5653 125.367
Partial variance for this index is 0.32232
Index 12 eM ePE 3 Index is tuned to the sum of mean full stock sizes (in number) for ages: 3 SORTED BY YEAR
Yr Observed Pred Weight Wt Res Std Res Pred Stocksize 1982 0.1822 -0.1718 1.0000 0.3540 0.5705 3059.062 1983 0.5802 0.1868 1.0000 0.3934 0.6339 4378.862 1984 -0.3178 -0.4321 1.0000 0.1143 0.1841 2358.183 1985 -0.3755 -0.4936 1.0000 0.1181 0.1903 2217.348 1986 0.1113 '0.1271 1.0000 0.2384 0.3842 3199.115 1987 -1.1957 -0.3280 1.0000 -0.8678 -1.3984 2616.821 1988 -0.2235 -0.0154 1.0000 -0.2081 -0.3353 3577.110 1989 0.0347 0.3407 1.0000 -0.3060 -0.4932 5107.147 1990 0.9528 1.1194 1.0000 -0.1667 -0.2686 11127.182 1991 -0.4197 -0.9711 1. 0000 0.5514 0.8886 1375.486 1992 -1. 2671 -0.8808 1.0000 -0.3862 -0.6224 1505.499 1993 -0.2080 -0.3732 1.0000 0.1652 0.2663 2501.076
Partial variance for this index is 0.164347
Index 13 eM ePE 4 Index is tuned to the sum of mean full stock sizes (in number) for ages: 4 SORTED BY YEAR
Yr Observed Pred Weight Wt Res Std Res Pred Stocksize 1982 0.0317 0.1049 1.0000 -0.0733 -0.1180 1802.198 1983 -0.0341 -0.2315 1.0000 0.1974 0.3180 1287.377 1984 0.0128 0.1284 1.0000 -0.1157 -0.1864 1845.103 1985 -0.4101 -0.6157 1.0000 0.2055 0.3312 876.726 ... 1986 -0.6590 -0.7003 1.0000 0.0413 0.0666 805.589 1987 -0.5177 -0.3198 1.0000 -0.1979 -0.3189 1178.591 1988 -0.5898 -0.1598 1.0000 -0.4300 -0.6929 1383.076 1989 -0.0952 -0.0536 1.0000 -0.0416 -0.0671 1538.089 1990 0.5833 . 0.3896 1.0000 0.1936 0.3120 2395.823 1991 1.1336 ' 1.2115 1.0000 -0.0779 -0.1256 5449.990 1992 -1.1507 -1.1763 1.0000 0.0256 0.0412 500.476 1993 -0.6295 -0.9024 1.0000 0.2729 0.4398 658.187
Partial variance for this index is 0.041607
15

Index 14 CM CPE 5 Index is tuned to the sum of mean full stock sizes (in number) for ages: 5 SORTED BY YEAR
Yr Observed Pred 'Weight 'Wt Res Std Res Pred Stocksize 1982 0.2935 0.6505 1.0000 '0.3570 '0.5753 1170.273 1983 0.2584 0.1108 1.0000 0.1476 0.2379 682.167 1984 ·0.3157 ·0.3851 1.0000 0.0695 0.1119 415.446 1985 0.1033 ·0.0203 1.0000 0.1236 0.1992 598.369 1986 -0.8937 '0.9725 1.0000 0.0787 0.1269 230.908 1987 ·1.0393 -1.0851 1.0000 0.0457 0.0737 206.314 1988 '0.5511 ·0.6207 1.0000 0.0696 0.1122 328.248 1989 ·0.4228 -0.1528 1.0000 ·0.2699 -0.4350 524.079 1990 ·0.2820 -0.2034 1.0000 -0.0786 -0.1267 498.252 1991 0.2942 0.1540 1.0000 0.1402 0.2259 712.286 1992 1. 1580 1.0503 1.0000 0.1077 0.1735 1745.528 1993 ·1.3800 '1.3029 1.0000 '0.0771 '0.1242 165.931
Partial variance for this index is 0.02786
Index 15 CM CPE 6 Index is tuned to the sum of mean ful L stock sizes (in number) for ages: 6 SORT EO BY YEAR
Yr Observed Pred 'Weight Wt Res Std Res Pred stocksize 1982 '0.6697 '0.5246 1.0000 ·0.1450 '0.2337 113.686 1983 0.8666 0.9113 1. 0000 '0.0448 '0.0721 477.908 1984 0.0652 0.1398 1. 0000 -0.0746 '0.1202 220.939 1985 '0.3611 -0.5367 1.0000 0.1755 0.2829 112.326 1986 ·0.1896 -0.1398 1.0000 '0.0498 '0.0802 167.044 1987 -1.0740 -1.0989 1. 0000 0.0249 0.0401 64.018 1988 -1.2612 .1. 2850 1.0000 0.0238 0.0383 53.148 1989 '0.8068 -0.8112 1. 0000 0.0043 0.0070 85.364 1990 -0.0144 '0.0785 1.0000 0.0641 0.1032 177.615 1991 ·0.2711 ·0.1104 1.0000 ·0.1607 '0.2590 172.030 1992 0.0029 -0.0944 1.0000 0.0973 0.1568 174.805 1993 0.9916 0.9066 1.0000 0.0850 0.1370 475.646
PartiaL variance for this index is 0.010232
Index 17 MA SPR 2 Index is tuned to the sum of Janl fulL stock sizes (in nlJll'tler) for ages: 2 SORTED BY YEAR
Yr Observed Pred 'Weight Wt Res Std Res Pred Stocksize 1982 '0.0760 0.3413 1.0000 ·0.4172 '0.6723 9107.659 1983 0.8913 -0.2548 1. 0000 1.1461 1.8469 5017.878 1984 ·0.3425 -0.3570 1.0000 0.0145 0.0234 4530.472 1985 '0.6896 -0.0212 1.0000 '0.6684 -1.0772 6338.648 1986 '0.8604 ·0.4759 1.0000 '0.3845 -0.6196 4022.788 1987 ·0.0849 '0.0651 1.0000 '0.0199 '0.0320 6066.650 1988 0.3993 0.2299 1.0000 0.1695 0.2731 8147.605 1989 1. 1988 1.0069 1.0000 0.1919 0.3093 17721.445 1990 -0.1003 -0.8521 1.0000 0.7518 1.2115 2761.393 1991 '0.7606 -0.8469' 1.0000 0.0862 0.1390 2m.918 1992 ·0.1819 '0.3020 1.0000 0.1201 0.1935 4786.727 1993 0.0186 -0.4013 1.0000 0.4199 0.6767 4334.207 1994 ·0.2952 ·0.0191 1.0000 -0.2761 -0.4450 6352.080 1995 '1.7229 '0.7452 1.0000 -0.9m -1.5756 3072.999 1996 -2.0609 -1.9048 1.0000 -0.1561 -0.2516 963.770
PartiaL variance for this index is 0.289191
16

Index 18 MA SPR 3 Index is tuned to the sum of Jan1 full stock sizes (in number) for ages: 3 SORTED BY YEAR
Yr Observed Pred Weight Wt Res Std Res Pred Stocksize 1982 ·0.1902 ·0.1756 1. 0000 '0.0146 ·0.0235 4328.310 1983 0.2543 0.1851 1.0000 0.0692 0.1115 6208.045 1984 '0.5990 '0.4394 1.0000 '0.1596 ·0.2573 3324.702 1985 '0.3918 '0.4451 1.0000 0.0534 0.0860 3305.679 1986 .1. 5392 '0.0677 1.0000 ·1.4714 '2.3712 4821.377 1987 '0.6003 '0.4721 1. 0000 '0.1282 ·0.2066 3217.574 1988 '0.4986 '0.0781 1.0000 '0.4205 '0.6776 4771.508 1989 0.4648 0.2350 1.0000 0.2298 0.3703 6525.920 1990 1.4583 1.0128 1.0000 0.4455 0.7179 14204.162 1991 ·0.4871 '0.9106 1.0000 0.4236 0.6826 2075 .346 1992 ·0.1439 '0.9671 1. 0000 0.8232 1.3266 1961.465 1993 ·0.1383 '0.3499 1. 0000 0.2116 0.3410 3635.826 1994 ·0.5191 '0.3938 1.0000 '0.1253 '0.2019 3479.781 1995 '0.0608 0.0030 1.0000 '0.0638 ·0.1028 5174.403 1996 '0.6726 '0.7998 1.0000 0.1272 0.2050 2318.704
Partial variance for this index is 0.260946
Index 19 MA SPR 4 Index is tuned to the sum of Jan1 full stock sizes (in number) for ages: 4 SORTED 8Y YEAR
Yr Observed Pred Weight \.It Res Std Res Pred Stocksize 1982 ·0.0461 '0.1178 1.0000 0.0718 0.1156 2666.212 1983 '0.8744 '0.3728 1.0000 ·0.5016 '0.8083 2066.121 1984 ·0.3282 ·0.0167 1.0000 '0.3116 '0.5021 2950.015 1985 '0.5514 '0.6284 1. 0000 0.0771 0.1242 1600.037 1986 ·1.0365 ·0.7627 1.0000 '0.2738 '0.4412 1398.971 1987 '1.5419 ·0.4107 1.0000 ·1.1312 ·1.8230 1989.342 1988 0.1316 '0.3585 1.0000 0.4901 0.7897 2095.949 1989 '0.9641 '0.1426 1.0000 '0.8215 '1.3238 2600.900 1990 0.7876 0.2652 1.0000 0.5223 0.8418 3910.614 1991 1.4322 1.0452 1.0000 0.3871 0.6237 8530.316 1992 '0.6140 ·1.2563 1.0000 0.6423 1.0350 854.031 1993 0.1884 '0.9795 1.0000 1.1678 1.8820 1126.348 1994 '0.8371 ·0.6091 1.0000 ·0.2280 '0.3675 1631.269 1995 '0.0009 '0.4411 1.0000 0.4402 0.7094 1929.689 1996 '0.3939 0.1371 1. 0000 '0.5310 '0.8557 3440.186
Partial variance for this index is 0.390324
Index 21 MA FAL 2 Index is tuned to the sum of Jan1 full stock sizes (in nLlTlber) for ages: 2 SORTED 8Y YEAR
Yr Observed Pred Weight I,It Res Std Res Pred Stocksize 1982 0.2601 '0.0086 1.0000 0.2687 0.4330 9107.659 1983 '0.6192 ·0.6047 1.0000 '0.0145 '0.0233 5017.878 1984 ·1.9011 '0.7069 1.0000 .1. 1943 .1. 9245 4530.472 1985 '2.5390 '0.3710 1.0000 '2.1680 '3.4937 6338.648 1986 '2.3418 '0.8257 1.0000 '1.5160 '2.4431 4022.788 1987 ·1.3321 ·0.4149 1.0000 ·0.9172 ·1.4781 6066.650 1988 '0.6023',' ·0.1200 1.0000 ·0.4823 ·0.m2 8147.605 1989 1.5481,: 0.6571, 1.0000 0.8910 1.4358 lm1.445 1990 '0.4786." .' ·1.2020 1.0000 0.7233 1.1657 2761.393 1991 0.7397 .1. 1967 1.0000 1. 9364 3.1205 2m.918 1992 '0.0368 ·0.6518 1.0000 0.6151 0.9912 4786.727 1993 '0.m7 '0.7511 1.0000 '0.0226 '0.0364 4334.207 1994 ·0:2719 '0.3689 1.0000 0.0970 0.1563 6352.080 1995 1.1764 ·1.0950 1.0000 2.2715 3.6605 3072.999 1996 ·1.9182 ·2.2546 1.0000 0.3364 0.5422 963.770 1997 ·3.3690 ·2.5444 1.0000 ·0.8245 ·1.3288 721.262
Partial variance for this index is 1.424958
17

Standardized residuals by index & yr; with row/column/grand means
• 1982 1983 1984 1985 1986 1987 1988 1989 1990 1991 1992 1993 1994 1995 1996 ---+---------------------------- .. --------------------------------------------_.-.--------------------._---------------_.--._------_.---------1 • 0.6454 1.5398 1.7920 -1.1144 0.1450 0.5453 0.8775 -1.1537 -0.1350 0.0095 -0.7170 0.6944 -0.6610 -0.3978 -2.0700 2 • -0.4453 -0.2558 1.2653 0.2890 -0.2557 -0.0651 -0.2742 -0.4218 -0.8391 0.1341 -0.4045 0.5411 -0.5580 0.5147 0.7754 3 • 0.1626 0.4462 0.1055 0.9170 0.2610 -0.7167 -0.5295 0.0521 -0.6173 -0.4937 0.5348 0.3536 -0.9465 -0.3296 0.8004 4 • 1.0486 0.2200 -0.0737 1.3826 -0.6698 0.2271 0.3967 -1.5223 -0.4530 -0.4856 0.6533 0.3846 0.0337 0.9397 -2.0820 5 • 1.0920 -0.7130 -1.4439 0.4109 -1.3448 -2.0859 1.6970 0.6334 -1.8910 -2.3068 1.0410 0.8140 0.4991 2.3459 1.2521 6 • -0.1131 1.0459 2.6009 -0.3003 0.4081 -0.6211 0.0126 0.6633 1.1670 -3.1190 -1.4476 -0.1392 -1.3742 -0.1051 -0.0069 7 • -1.2047 1.6089 0.7322 -0.6137 0.0195 -0.3264 0.6405 0.9868 -0.1653 -0.0875 -1.5225 -0.6606 -0.2123 -0.1484 -0.7002 8 • -0.6186 2.2172 -0.0742 0.2494 0.9508 0.1350 -0.0880 0.3216 0.2214 -0.7264 -0.2492 -1.4324 -0.4921 0.5681 0.2729 9 • -0.3726 1.6728 -1.0366 0.0774 0.5487 1.3132 0.2147 0.8731 0.0061 0.4190 -0.9760 -1.3769 -2.1914 -0.3382 0.8640
10 • -0.3854 -1.2389 0.1061 0.7298 0.1284 0.1940 0.0907 0.1819 -0.2177 0.6273 -1.6436 -0.8239 -99.0000 2.1350 0.6816 12 • 0.5705 0.6339 0.1841 0.1903 0.3842 -1.3984 -0.3353 -0.4932 -0.2686 0.8886 -0.6224 0.2663 -99.0000 -99.0000 -99.0000 13. -0.1180 0.3180 -0.1864 0.3312 0.0666 -0.3189 -0.6929 -0.0671 0.3120 -0.1256 0.0412 0.4398 -99.0000 -99.0000 -99.0000 14 • -0.5753 0.2379 0.1119 0.1992 0.1269 0.0737 0.1122 -0.4350 -0.1267 0.2259 0.1735 -0.1242 -99.0000 -99.0000 -99.0000 15 • -0.2337 -0.0721 -0.1202 0.2829 -0.0802 0.0401 0.0383 0.0070 0.1032 -0.2590 0.1568 0.1370 -99.0000 -99.0000 -99.0000 17 • -0.6723 1.8469 0.0234 -1.0772 -0.6196 -0.0320 0.2731 0.3093 1.2115 0.1390 0.1935 0.6767 -0.4450 -1.5756 -0.2516 18 • -0.0235 0.1115 -0.2573 0.0860 -2.3712 -0.2066 -0.6776 0.3703 0.7179 0.6826 1.3266 0.3410 -0.2019 -0.1028 0.2050 19 • 0.1156 -0.8083 -0.5021 0.1242 -0.4412 -1.8230 0.7897 -1.3238 0.8418 0.6237 1.0350 1.8820 -0.3675 0.7094 -0.8557 21 • 0.4330 -0.0233 -1.9245 -3.4937 -2.4431 -1.4781 -0.7772 1.4358 1.1657 3.1205 0.9912 -0.0364 0.1563 3.6605 0.5422 ** • -0.0386 0.4882 0.0724 -0.0739 -0.2882 -0.3635 0.0982 0.0232 0.0574 -0.0407 -0.0798 0.1076 -0.5201 0.5626 -0.0409
• 1997******* ---+-----------------
1 • -99.0000 0.0000 2 • -99.0000 0.0000 3 • -99.0000 0.0000 4 • -99.0000 0.0000 5 • -99.0000 0.0000 6 • 1.32880.0000 7 • 1.65380.0000 8 • -1. 2558 0.0000 9 • 0.3027 0.0000
10 • -0.5653 0.0000 12 • -99.0000 0.0000 13 • -99.0000 0.0000 14 • -99.0000 0.0000 15 • -99.0000 0.0000 17 • -99.0000 0.0000 18 • -99.0000 0.0000 19 • -99.0000 0.0000 21 • -1. 3288 0.0000 ** • 0.0226 0.0000
-99 in the above table indicates a missing vaLue
18
(I

Percent of total sum of squares by index & yr; with row/column sums
• 1982 1983 1984 1985 1986 1987 1988 1989 1990 1991 1992 1993 1994 1995 1996 1997******* ---+----------------------------------------------------------------------------------------------------------------1 • 0.17 0.99 1.34 0.52 0.01 0.12 0.32 0.55 0.01 0.00 0.21 0.20 0.18 0.07 1.79 '99.00 6.48 2 • 0.08 0.03 0.67 0.03 0.03 0.00 0.03 0.07 0.29 0.01 0.07 0.12 0.13 0.11 0.25 ·99.00 1.93 3 • 0.01 0.08 0.00 0.35 0.03 0.21 0.12 0.00 0.16 0.10 0.12 0.05 0.37 0.05 0.27 -99.00 1.93 4 • 0.46 0.02 0.00 0.80 0.19 0.02 0.07 0.97 0.09 0.10 0.18 0.06 0.00 0.37 1.81 -99.00 5.11 5 • 0.50 0.21 0.87 0.07 0.75 1.81 1.20 0.17 1.49 2.22 0.45 0.28 0.10 2.29 0.65 -99.00 13.07 6 • 0.01 0.46 2.82 0.04 0.07 0.16 0.00 O.lB 0.57 4.05 0.B7 0.01 0.79 0.00 0.00 0.74 10.76 7 • 0.60 LOB 0.22 0.16 0.00 0.04 0.17 0.41 0.01 0.00 0.97 0.18 0.02 0.01 0.20 1.14 5.22 B • 0.16 2.05 0.00 0.03 0.38 0.01 0.00 0.04 0.02 0.22 0.03 0.B5 0.10 0.13 0.03 0.66 4.71 9. 0.06 1.17 0.45 0.00 0.13 0.72 0.02 0.32 0.00 0.07 0.40 0.79 2.00 0.05 0.31 0.04 6.51
10 > 0.06 0.64 0.00 0.22 0.01 0.02 0.00 0.01 0.02 0.16 1.13 0.28 -99.00 1.90 0.19 0.13 4.79 12 • 0.14 0.17 0.01 0.02 0.06 O.Bl 0.05 0.10 0.03 0.33 0.16 0.03 -99.00 -99.00 -99.00 -99.00 1.91 13 • 0.01 0.04- 0.01 0.05 0.00 0.04 0.20 0.00 0.04 0.01 0.00 0.08 -99.00 -99.00 -99.00 -99.00 0.48 14 • 0.14 0.02 0.01 0.02 0.01 0.00 0.01 0.08 0.01 0.02 0.01 0.01 -99.00 -99.00 -99.00 -99.00 0.32 15 • 0.02 0.00 0.01 0.03 0.00 0.00 0.00 0.00 0.00 0.03 0.01 0.01 -99.00 -99.00 -99.00 -99.00 0.12 17 • 0.19 1.42 0.00 0.48 0.16 0.00 0.03 0.04 0.61 0.01 0.02 0.19 0.08 1.03 0.03 -99.00 4.29 18 • 0.00 0.01 0.03 0.00 2.34 0.02 0.19 0.06 0.21 0.19 0.73 0.05 0.02 0.00 0.02 -99.00 3.87 19 • 0.01 0.27 0.11 0.01 0.08 1.38 0.26 0.73 0.30 0.16 0.45 1.48 0.06 0.21 0.31 -99.00 5.80 21 • 0.08 0.00 1.54 5.09 2.49 0.91 0.25 0.86 0.57 4.06 0.41 0.00 0.01 5.58 0.12 0.74 22.70 •• • 2.69 8.65 8.09 7.90 6.73 6.29 2.92 4.59 4.42 11.74 6.21 4.67 3.86 11.81 5.97 3.44 100.00
-99 in the above table indicates a missing value
Partial variance (and proportion of total) by index
• 2 3 4 5 6 7 8 9 10 12 13 ---+------------------------------------------------------------------------------------------------------------------------------------".0.436485840.129842370.129746520.34445032 0.87997285 0.67544619 0.32760645 0.295730560.408818080.322320410.164346850.04160722 ".0.066538660.019793400.019778780.05250860 0.134144580.102966190.049940890.04508168 0.06232094 0.04913508 0.02505332 0.00634268
• 14 15 17 18 19 21************
---+-------------------------------------------------------------------------------••• 0.02785962 0.01023215 0.28919056 0.26094604 0.39032384 1.42495768 6.55988354 ••• 0.00424697 0.00155981 0.04408471 0.03977907 0.05950164 0.21722301 1.00000000
STOCK NUM8ERS (Jan 1) in thousands - GMCOO97
• 1982 1983 1984 1985 1986 1987 1988 1989 1990 1991 1992 1993 1994 1995 1996 1997 ---+--------------------------------------------------------------------------------------------------------------1 > 6162 5534 7746 4913 7410 9954 21645 3373 3391 5847 5294 7758 3753 1177 881 0 2. 9108 5018 4530 6339 4023 6067 8148 17721 2761 2776 4787 4334 6352 3073 964 721 3 > 4328 6208 3325 3306 4821 3218 4772 6526 14204 2075 1961 3636 3480 5174 2319 730 4. 2666 2066 2950 1600 1399 1989 2096 2601 3911 8530 854 1126 1631 1930 3440 1370 5. 1661 1149 734 1058 413 410 625 854 814 1334 3219 261 342 309 537 1244 6 • 166 787 363 206 296 112 85 145 293 277 322 810 97 20 77 125 7. 547 284 250 214 156 132 58 98 182 151 131 63 113 54 17 27 ---+-------------------------------------------------- ------------~----------------------------------------- ------
1+> 24639 21046 19900 17636 18518' 21881 37428 31318 25555 20990 16569 17988 15769 11737 8234 4218
19

summaries for ages 2 5 3 5 4 5 5 5
• 1982 1983 1984 1985 1986 1987 1988 1989 1990 1991 1992 1993 1994 1995 1996 1997 ---+-------------------------------------------------------------------------------------------------------------2 • 17763 14441 11539 12302 10656 11683 15640 27702 21690 14716 10821 9358 3 • 8656 9423 7009 5964 6634 5617 7493 9981 18929 11940 6035 5023 4 • 4327 3215 3684 2658 1812 2399 2721 3455 4724 9864 4073 1388 5 • 1661 1149 734 1058 413 410 625 854 814 1334 3219 261
f!SHING MORTALITY . GMCOO97
• 1982 1983 1984 1985 1986 1987 1988 1989 1990 1991 1992 1993 1994 1995 1996 ---+-------------------------------------------------------------------------------------1 • 0.01 0.00 0.00 0.00 0.00 0.00 0.00 0.00 0.00 0.00 0.00 0.00 0.00 0.00 0.00 2.0.180.21 0.12 0.07 0.02 0.04 0.020.020.09 0.15 0.080.02 0.01 0.08 0.08 3 • 0.54 0.54 0,53 0.66 0.69 0.23 0.41 0.31 0.31 0.69 0.35 0.60 0.39 0.21 0.33 4.0.640.83 0.83 1.15 1.03 0.96 0.700.960.88 0.77 0.980.99 1.47 1.08 0.82 5.0.550.95 1.07 1.07 1.10 1.37 1.260.870.88 1.22 1.180.79 2.66 1.19 1.25 6.0.610.90 0.89 1.16 1.08 1.05 0.820.970.90 0.84 1.180.98 1.71 1.13 1.04 7.0.61 0.90 0.89 1.16 1.08 1.05 0.820.970.90 0.84 1.180.98 1.71 1.13 1.04
Avg F for ages 2 5 3 5 4 5 5, 5
• 1982 1983 1984 1985 1986 1987 1988 1989 1990 1991 1992 1993 1994 1995 1996 ---+-------------------------------------------------------------------------------------2.0.480.64 0.64 0.74 0.71 0.65 0.600.540.54 0.71 0.650.60 1.13 0.64 0.62 3 • 0.58 0.78 0.81 0.96 0.94 0.85 0.79 0.71 0.69 0.89 0.84 0.79 1.51 0.82 0.80 4.0.590.89 0.95 1.11 1.07 1.17 0.980.920.88 1.00 1.080.89 2.06 1.13 1.04 5.0.550.95 1.07 1.07 1.10 1.37 1.260.870.88 1.22 1.180.79 2.66 1.19 1.25
Avg F (weighted by N) for ages 2 5 3 5 4 5 5 5
• 1982 1983 1984 1985 1986 1987 1988 1989 1990 1991 1992 1993 1994 1995 1996 ---+-----------------------------------------------------------------.-------------------2 • 0.37 0.50 0.48 0.46 0.50 0.30 0.28 0.20 0.40 0.68 0.53 0.38 0.40 0.36 0.59 3 • 0.57 0.66 0.71 0.87 0.78 0.57 0.560.53 0.45 0.81 0.88 0.70 0.85 0.48 0.67 4.0.61 0.88 0.87 1.12 1.05 1.03 0.830.940.88 0.83 1.140.95 1.67 1.09 0.88 5.0.550.95 1.07 1.07 1.10 1.37 1.260.870.88 1.22 1.180.79 2.66 1.19 1.25
Avg F (wt by catch) for ages 2 5 3 5 4 5 5 5
• 1982 1983 1984 1985 1986 1987 1988 1989 1990 1991 1992 1993 1994 1995 1996 ---+-----~--.---------------------------------.------- -----------------------------------2.0.460.60 0.67 0.81 0.78 0.72 0.600.600.53 0.79 0.920.70 1.14 0.69 0.75 3.0.580.68 0.74 0.90 0.80 0.80 0.630.660.55 0.82 1.000.72 1.16 0.74 0.77 4.0.610.88 0.88 1.12 1.05 1.04 0.870.940.88 0.85 1.140.96 1.71 1.10 0.89 5.0.550.95 1.07 1.07 1.10 1.37 1.260.870.88 1.22 1.180.79 2.66 1.19 1.25
11805 10486 7259 4065 5453 7413 6296 3344 1973 2238 3977 2614 342 309 537 1244
20
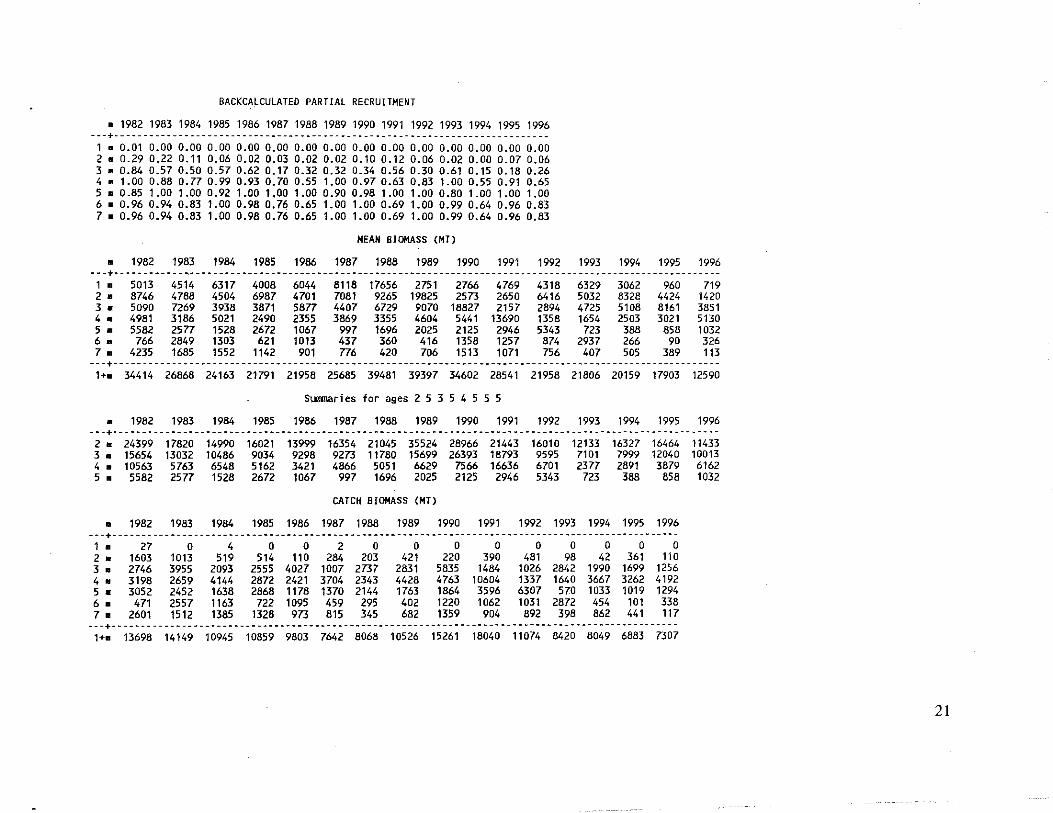
BACKCAlCUlATED PARTIAL RECRUITMENT
• 1982 1983 1984 1985 1986 1987 1988 1989 1990 1991 1992 1993 1994 1995 1996 - __ + ________________________________________________________ w ________ w ________ _
1 • 0.01 0.00 0.00 0.00 0.00 0.00 0.00 0.00 0.00 0.00 0.00 0.00 0.00 0.00 0.00 2.0.290.220.110.060.020.030.020.020.100.120.06 0.02 0.00 0.07 0.06 3.0.840.570.500.570.620.170.320.320.340.560.30 0.610.150.180.26 4 • 1.00 0.88 0.770.99 0.93 0.70 0.55 1.00 0.970.63 0.83 1.000.55 0.91 0.65 5.0.851.001.000.921.001.001.000.900.981.001.00 0.80 1.00 1.00 1.00 6 • 0.96 0.94 0.83 1.00 0.98 0.76 0.65 1.00 1.00 0.69 1.00 0.99 0.64 0.96 0.83 7. 0.96 0.94 0.83 1.00 0.98 0.76 0.65 1.00 1.00 0.69 1.00 0.99 0.64 0.96 0.83
MEAN BIOMASS (MT)
• 1982 1983 1984 1985 1986 1987 1988 1989 1990 1991 1992 1993 1994 1995 1996 ---+------------~------------------------------------- ---------------------------------.---------------------1 • 5013 4514 6317 4008 6044 8118 17656 2751 2766 4769 4318 6329 3062 960 719 2 • 8746 4788 4504 6987 4701 7081 9265 19825 2573 2650 6416 5032 8328 4424 1420 3 • 5090 7269 3938 3871 5877 4407 6729 9070 18827 2157 2894 4725 5108 8161 3851 4 • 4981 3186 5021 2490 2355 3869 3355 4604 5441 13690 1358 1654 2503 3021 5130 5 • 5582 2577 1528 2672 1067 997 1696 2025 2125 2946 5343 723 388 858 1032 6 • 766 2849 1303 621 1013 437 360 416 1358 1257 874 2937 266 90 326 7 • 4235 1685 1552 1142 901 776 420 706 1513 1071 756 407 505 389 113
---+---------------------------------------------------------------------------------------------------------1+. 34414 26868 24163 21791 21958 25685 39481 39397 34602 28541 21958 21806 20159 17903 12590
Summaries for ages 2 5 3 5 4 5 5 5
• 1982 1983 1984 1985 1986 1987 1988 1989 1990 1991 1992 1993 1994 1995 1996 ---+---------------------------------------------------------------------------------------------------------2. 24399 17820 14990 16021 13999 16354 21045 35524 28966 21443 16010 12133 16327 16464 11433 3. 15654 13032 10486 9034 9298 9273 11780 15699 26393 18793 9595 7101 7999 12040 10013 4. 10563 5763 6548 5162 3421 4866 5051 6629 7566 16636 6701 2377 2891 3879 6162 5. 5582 2577 1528 2672 1067 997 1696 2025 2125 2946 5343 723 388 858 1032
CATCH BIOMASS (MT)
• 1982 1983 1984 1985 1986 1987 1988 1989 1990 1991 1992 1993 1994 1995 1996 ---+--------------------------------------------------------------------------------------------------1 • 27 0 4 0 0 2 0 0 0 0 0 0 0 0 0 2. 1603 1013 519 514 110 284 203 421 220 390 481 98 42 361 110 3. 2746 3955 2093 2555 4027 1007 2737 2831 5835 1484 1026 2842 1990 1699 1256 4. 3198 2659 4144 2872 2421 3704 2343 4428 4763 10604 1337 1640 3667 3262 4192 5. 3052 2452 1638 2868 1178 1370 2144 1763 1864 3596 6307 570 1033 1019 1294 6 • 471 2557 1163 722 1095 459 295 402 1220 1062 1031 2872 454 101 338 7. 2601 1512 1385 1328 973 815 345 682 1359 904 892 398 862 441 117
---+--------------------------------------------------------------------------------------------------1+. 13698 14149 10945 10859 9803 7642 8068 10526 15261 18040 11074 8420 8049 6883 7307
21
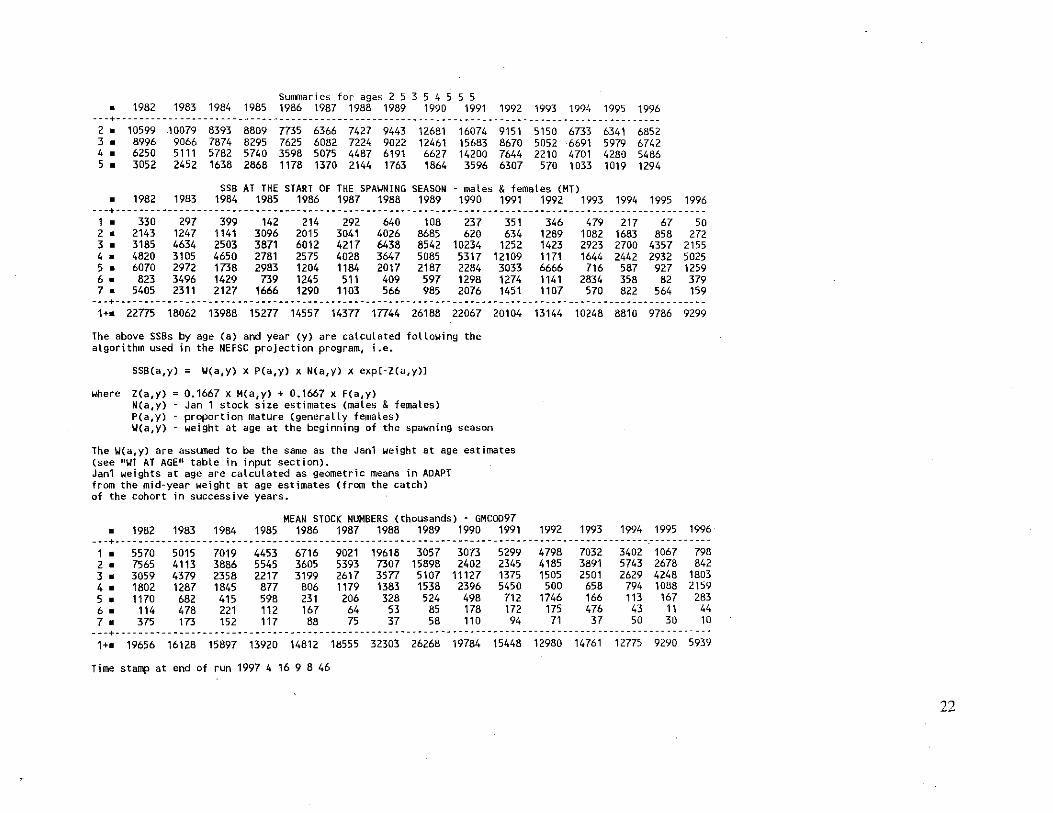
Summaries for ages 2 5 3 5 4 5 5 5 • 1982 1983 1984 1985 1986 1987 1988 1989 1990 1991 1992 1993 1994 1995 1996
~~~+~~~~~-~~--------~--------~-----~--------~---~----- ------------------------------------.-------2 • 10599 10079 8393 8809 7735 6366 7427 9443 12681 16074 9151 5150 6733 6341 6852 3 • 8996 9066 7874 8295 7625 6082 7224 9022 12461 15683 8670 5052 6691 5979 6742 4 • 6250 5111 5782 5740 3598 5075 4487 6191 6627 14200 7644 2210 4701 4280 5486 5 • 3052 2452 1638 2868 1178 1370 2144 1763 1864 3596 6307 570 1033 1019 1294
SSB AT THE START OF THE SPA~NING SEASON - males & females (MT) • 1982 1983 1984 1985 1986 1987 1988 1989 1990 1991 1992 1993 1994 1995 1996
---+-------------------------------------------------- --------------------------~-------------------------1 • 330 297 399 142 214 292 640 108 237 351 346 479 217 67 50 2 • 2143 1247 1141 3096 2015 3041 4026 8685 620 634 1289 1082 1683 858 272 3 • 3185 4634 2503 3871 6012 4217 6438 8542 10234 1252 1423 2923 2700 4357 2155 4 • 4820 3105 4650 2781 2575 4028 3647 5085 5317 12109 1171 1644 2442 2932 5025 5 • 6070 2972 1738 2983 1204 1184 2017 2187 2284 3033 6666 716 587 927 1259 6 • 823 3496 1429 739 1245 511 409 597 1298 1274 1141 2834 358 82 379 7 • 5405 2311 2127 1666 1290 1103 566 985 2076 1451 1107 570 822 564 159 ---+--------~------------------------------------------------------~----------------------------~---------1+. 22775 18062 13988 15277 14557 14377 17744 26188 22067
The above SSBs by age (a) and year (y) are calculated following the algorithm used in the NEFSC projection program, i.e.
where
SSB(a,Y) = Y(a,Y) x p(a,Y) x N(a,Y) x exp(-Z(a,y)]
Z(a,Y) N(a,Y) P(a,Y) Y(a,Y)
0.1667 x M(a,Y) + 0.1667 X F(a,y) Jan 1 stock size estimates (males & females) proportion mature (generally females) weight at age at the beginning of the spawning season
20104
The W(a,y) are assumed to be the same as the Jan1 weight at age estimates (see "WT AT AGEl! table in input section). Janl weights at age are calculated as geometric means in ADAPT from the mid-year weight at age estimates (from the catch) of the cohort in successive years.
MEAN STOCK NUMBERS (thousands) - GMCOO97 • 1982 1983 1984 1985 1986 1987 1988 1989 1990 1991
13144 10248 8810 9786 9299
1992 1993 1994 1995 1996 ---+-------------------------------------------------- ------------------------------------------~~---------
1 • 5570 5015 7019 4453 6716 9021 19618 3057 3073 5299 4798 7032 3402 1067 798 2 • 7565 4113 3866 5545 3605 5393 7307 15898 2402 2345 4185 3891 5743 2678 842 3 • 3059 4379 2358 2217 3199 2617 3577 5107 11127 1375 1505 2501 2629 4248 1803 4 • 1802 1287 1845 877 806 1179 1383 1538 2396 5450 500 658 794 1088 2159 5 • 1170 682 415 598 231 206 328 524 498 712 1746 166 113 167 283 6 • 114 478 221 112 167 64 53 85 178 172 175 476 43 11 44 7 • 375 173 152 117 88 75 37 58 110 94 71 37 50 30 10 ---+-------------------------------------------------- -------~---------------------------------------------
1+. 19656 16128 15897 13920 14812 18555 32303 26268 19784 15448 12980 14761 12775 9290 5939
Time stamp at end of run 1997 4 16 9 8 46
22

Appendix 4.
Precision estimates of the 1997 age-specific stock sizes, catchability coefficients, and 1996 instantaneous fishing mortality rates (F) and spawning stock biomass (SSB) for Gulf of Maine cod.
ADAPT ESTIMATE is from the final assessment run.
Standard errors, coefficients of variation (C. V.), and bias estimates are derived from 1000 bootstrap replications.
F on ages 4 + represents the fully-recruited portion of the stock.
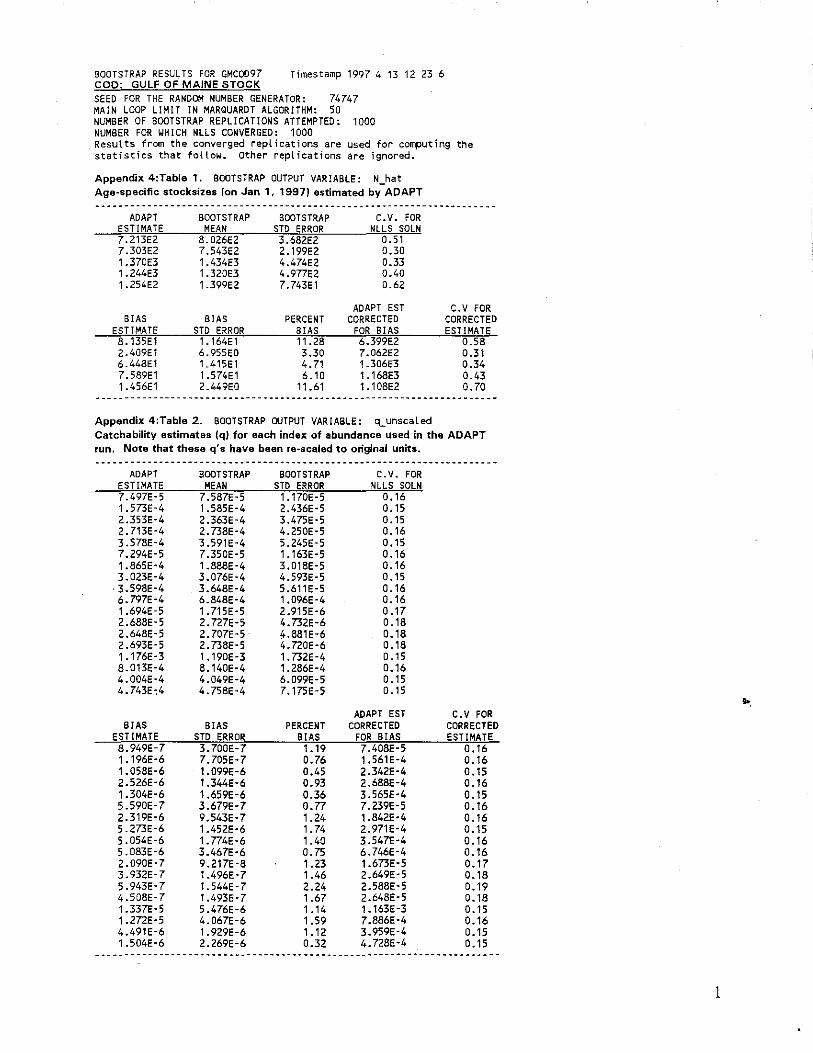
BOOTSTRAP RESULTS FOR GMC0097 COO: GULF OF MAINE STOCK
Timestamp 19974 13 12 23 6
SEED FOR THE RANDOM NUMBER GENERATOR: 74747 MAIN LOOP LIMIT IN MARQUARDT ALGORITHM: 50 NUMBER OF BOOTSTRAP REPLICATIONS ATTEMPTEO: 1000 NUMBER FOR WHICH NLLS CONVERGED: 1000 Results from the converged replications are used for computing the statistics that follow_ Other repLications are ignored.
Appendix 4:Table 1. BOOTSTRAP OUTPUT VARIABLE: N_hat Age-specific stocksizes (on Jan 1, 1997) estimated by ADAPT _ ... __ ... _._--_. __ ..... _--_ ... _ .. _-----------_.-----------------------
ADAPT BOOTSTRAP BOOTSTRAP C.V. fOR
.303EZ 0.30 1.370E3 1. 434E3 0.33 1.Z44E3 1.3Z0E3 0.40 1.Z54EZ 1.399EZ 0.6Z
ADAPT EST C.V FOR BIAS BIAS PERCENT CORRECTED CORRECTED
ESTIMATE STD ERROR BIAS FOR BIAS ESTlMAT5 8.135E1 1. 164E1 11.Z8 6.399EZ 0.58 Z.409E1 6.955EO 3.30 7.D6ZEZ 0.31 6.448E1 1.415E1 4.71 1.306E3 0.34 7.589E1 1.574E1 6.10 1. 168E3 0.43 1.456E1 Z.449EO 11.61 1.108E2 0.70
----------------.------------------------.---.---.-----------_._------
Appendix 4:Table 2. BOOTSTRAP OUTPUT VARIABLE: ~unscaled
Catchability estimates (q) for each index of abundance used in the ADAPT run. Note that these q's have been re-scaled to original units. --------_ .. _---------._-_.--------------------------------------------
ADAPT BOOTSTRAP BOOTSTRAP C.V. FOR ESTIMATE MEAN STD ERROR NLLS SOLN 7.497E·5 7.587E·5 1.170E-5 0.16 1.573E·4 1.585E·4 Z.436E·5 0.15 Z.353E·4 Z.363E-4 3.475E-5 0.15 Z.713E·4 Z.738E·4 4.Z50E-5 0.16 3.578E·4 3.591E·4 5.Z45E-5 0.15 7.Z94E·5 7.350E-5 1.163E-5 0.16 1.865E-4 1.888E·4 3.018E-5 0.16 3.0Z3E-4 3.076E-4 4.593E-5 0.15
·3.598E-4 3.648E-4 5.611E-5 0.16 6.797E-4 6.848E-4 1.096E-4 0.16 1.694E-5 1.715E-5 Z.915E-6 0.17 Z.688E·5 Z.727E-5 4.732E-6 0.18 Z.648E·5 Z.707E-5 4.881E-6 0.18 Z.693E-5 Z.738E-5 4.720E-6 0.18 1. 176E·3 1.190E-3 1. 73ZE-4 0.15 8.013E-4 8.140E·4 1. 286E-4 0.16 4.004E-4 4.049E-4 6.099E-5 0.15 4.743E,4 4.758E·4 7.175E-5 0.15
ADAPT EST C.V FOR BIAS BIAS PERCENT CORRECTED CORRECTED
EST IMATE STD ERROR BIAS FOR BIAS ESTIMATE 8.949E-7 3.700E-7 1.19 7.408E-5 0.16 1. 196E-6 7.705E-7 0.76 1.561E-4 0.16 1.058E-6 1.099E-6 0.45 Z.342E-4 0.15 Z.526E·6 1.344E-6 0.93 Z.688E-4 0.16 1.304E·6 1.659E-6 0.36 3.565E-4 0.15 5.590E-7 3.679E-7 0.77 7.Z39E·5 0.16 Z.319E-6 9.543E-7 1.Z4 1.842E·4 0.16 5. Z73E-6 1.45ZE·6 1.74 Z.971E·4 0.15 5.054E·6 1. 774E·6 1.40 3.547E-4 0.16 5.083E·6 3.467E-6 0.75 6.746E·4 0.16 2.090E·7 9.Z17E·8 1.Z3 1.673E·5 0.17 3.93ZE·7 1.496E-7 1.46 Z.649E·5 0.18 5.943E·7 1.544E·7 Z.Z4 Z.588E·5 0.19 4.508E·7 1.493E·7 1.67 Z.648E·5 0.18 1.337E·5 5.476E-6 1 .14 1.163E-3 0.15 1.272E·5 4.067E-6 1.59 7.886E-4 0.16 4.491E·6 1. 929E-6 1. 1Z 3.959E·4 0.15 1.504E·6 Z.Z69E-6 0.3Z 4.728E-4 0.15
-_._--_ .. _----_._-------_.------_._------------_._--------------------
.. ,
1
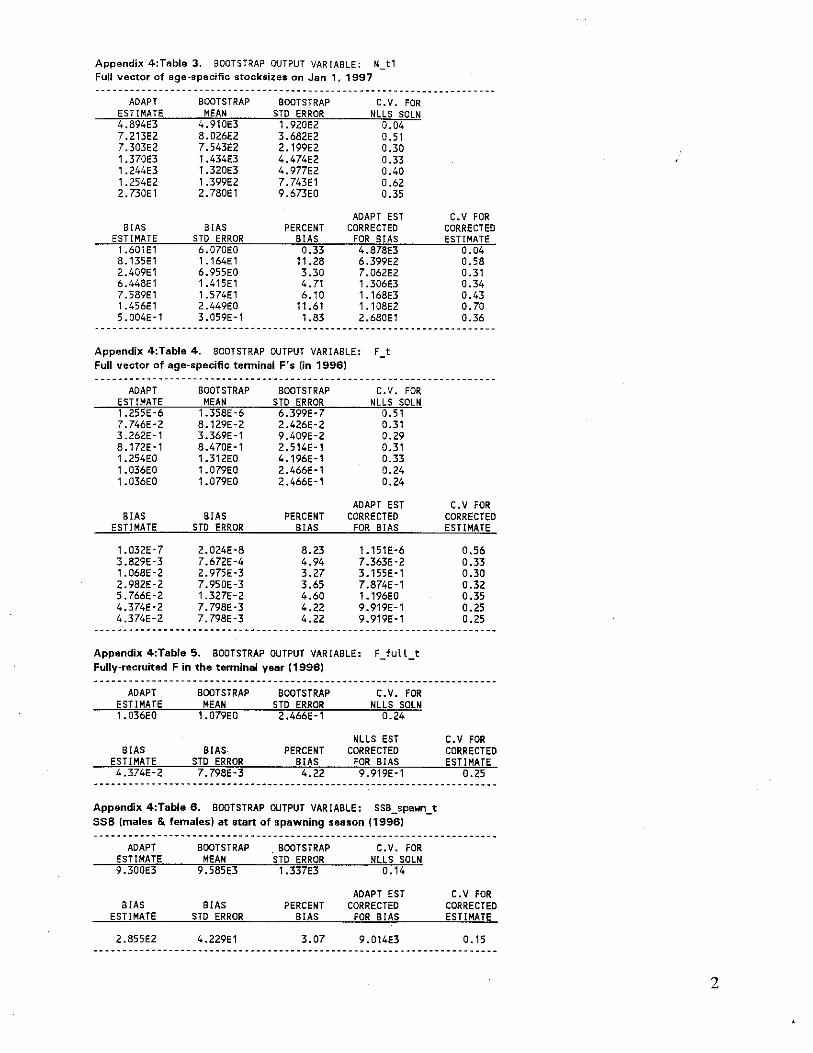
Appendix 4:Table 3. BOOTSTRAP OUTPUT VARIABLE: N_t1 Full vector of age·specific stocksizes on Jan 1, 1997 ----------------_._--------------._----------------------------------
ADAPT BOOTSTRAP BOOTSTRAP C.V. FOR ESTIMATE MEAN STO ERROR NLLS SOLN 4.894E3 4.910E3 1. 920EZ 0.04 7.Z13EZ 8.0Z6EZ 3.68ZEZ 0.51 7.303EZ 7.543EZ Z.199EZ 0.30 1. 370E3 1.434E3 4.474EZ 0.33 1.Z44E3 1.3Z0E3 4.977EZ 0.40 1.Z54EZ 1. 399EZ 7.743El 0.6Z Z.730El Z.780El 9.673EO 0.35
ADAPT EST C. V FOR BIAS BIAS PERCENT CORRECTED CORRECTED
ESTIMATE STD ERROR BIAS FOR BIAS ESTIMATE 1.601El 6.070EO 0.33 4.878E3 0.04 8.135El 1. 164El 11.Z8 6.399EZ 0.58 Z.409El 6.955EO 3.30 7.06ZEZ 0.31 6.448El 1.415El 4.71 1.306E3 0.34 7.589El 1.574El 6.1D 1.168E3 0.43 1.456El Z.449EO 11.61 1.108EZ 0.70 5.D04E·l 3.059E-l 1.83 Z.680El 0.36
----------------------------------------------------------------------
Appendix 4:Table 4. BOOTSTRAP OUTPUT VARIABLE: F _t Full vector of age-specific terminal F's (in 1996) ----------------------------------------------------------------------
ADAPT BOOTSTRAP BOOTSTRAP C.V. FOR ESTIMATE MEAN STD ERROR NllS SOlN 1.Z55E-6 1.358E-6 6.399E-7 0.51 7.746E-Z 8.1Z9E-Z Z.4Z6E-Z 0.31 3.Z6ZE-l 3.369E-l 9.409E-Z D.Z9 8.17ZE-l 8.470E-l Z.514E-l 0.31 1.Z54EO 1.31ZED 4.196E-l D.33 1.D36EO 1.D79EO Z.466E-l 0.Z4 1.036EO 1.079EO Z.466E-l 0.Z4
ADAPT EST C.V FOR BIAS BIAS PERCENT CORRECTED CORRECTED
ESTIMATE STD ERROR BIAS FOR BIAS ESTIMATE
1.D3ZE-7 Z.DZ4E-8 8.Z3 1.151E-6 0.56 3.8Z9E-3 7.67ZE-4 4.94 7.363E-Z 0.33 1.068E-Z Z.975E-3 3.Z7 3.155E-l 0.30 Z.98ZE-Z 7.950E-3 3.65 7.874E-l 0.3Z 5.766E-Z 1.3Z7E-Z 4.6D 1. 196EO 0.35 4.374E-Z 7.798E-3 4.ZZ 9.919E-l 0.Z5 4.374E-Z 7.798E-3 4.ZZ 9.919E-l 0.Z5
----------------------------------------------------------------------
Appendix 4:Table 5. BOOTSTRAP OUTPUT VARIABLE: F _full_t Fully-recruited F in the terminal year (1996)
ADAPT
BIAS ESTIMATE 4.374E-Z
BOOTSTRAP
BIAS STO ERROR 7.798E-3
BOOTSTRAP
PERCENT BIAS 4.ZZ
C.V. FOR
NllS EST CORRECTED
FOR BIAS 9.919E-l
Appendix 4:Table 6, BOOTSTRAP OUTPUT VARIABLE: SSB_spawn_t SSB (males & females) at start of spawning season (1996)
C.V FOR CORRECTED ESTIMATE
0.Z5
----------------------------------------------------------------------ADAPT BOOTSTRAP BOOTSTRAP C.V. fOR
ESTIMATE MEAN STD ERROR NllS SOlN 9.300E3 9.585E3 1.337E3 0.14
ADAPT EST C. V fOR 81AS BIAS PERCENT CORRECTED CORRECTED
ESTIMATE STD ERROR BIAS fOR BIAS ESTIMATE
Z.855EZ 4.ZZ9El 3.07 9.014E3 0.15
2