a report of the informal economy in sierra leone (draft
TRANSCRIPT
1
A Report of the Informal Economy in Sierra Leone (Draft paper for the Expert Group Meeting on Accounting for the Informal Sector in National Accounts)
Osman Awoto Soltani-Koroma Statistician and Head
Business and Industry Section Economic Statistics Division (ESD)
Statistics Sierra Leone (SSL)
Abstract
The thesis of this report is that solutions of the informal economy cannot be quantified explicitly as we do for the formal economy. The process of quantification of the informal economy can be done using its qualitative analysis. Thus a qualitative analysis of the Sierra Leone economy using the subjective method was carried out in order to quantify the informal economy in monetary terms.
However, with developments in Linear Algebra and the advent of the Linearization Theorem, two matrices were proposed to compile the GDP of Sierra Leone so that the contribution of the informal economy will be separated from the formal economy. One of the two matrices is the Quantity Matrix of Establishments and Employment, and the other is its corresponding Price Matrix. So that GDP is defined as the Value Matrix of Establishments and Employment. Against this background, it was proved that GDP is a Double Dot Product.
The objective of this report is to give a concise account of the composition and size of the informal economy in Sierra Leone using results from the 2004 Population and Housing Census and the 2011 Sierra Leone Integrated Household Survey (SLIHS). In this report, the informal economy is made up of unregistered establishments, household unincorporated enterprises and unregistered employment with no social security. Thus employment in the informal economy is defined as the sum of employment in unregistered establishment, unregistered employment in the formal economy and unpaid family workers. On this basis, both the 2004 Population and Housing Census and the 2011 SLIHS revealed that there are more persons engaged in informal sector employment than in the formal sector.
The method of analysis is analogous to the solutions of non-linear differential systems. Consequently, the report recommends that qualitative analysis of industries in terms of size of their informal economy should be obtained from stakeholders and users as well. And the ratio of Real GDP in the current year to Real GDP in the base year should be used as a multiplier to extrapolated benchmark estimates of the informal economy.
2
1 INTRODUCTION 1.1 Background
The compilation of Gross Domestic Product (GDP) and Employment in Sierra Leone is based on the concepts and principles of the 1993 System of National Accounts (SNA 1993). For the compilation of employment, the ILO concept of the informal sector is also taken into account. Therefore, GDP is generally compiled using the Production, Expenditure and Income approaches. As an extension, the Gross National Income (GNI), Gross National Disposable Income (GNDI) and Savings are computed by integrating GDP and the Balance of Payments (BOP) Statistics prepared by the Central Bank.
GDP by the Production approach is compiled as the sum of Gross Value Added (GVA) of industries and taxes less subsidies on products. The production of Non-Profit Institutions Serving Households (NPISH) is included in the GVA and Financial Intermediation Services Indirectly Measured (FISIM) deducted. GDP by Expenditure approach is compiled as the sum of Absorption and Trade Balance, while GDP by Income approach is compiled as the sum of its components which are Gross Operating Surplus (GOS) of business establishments, Compensation of Employees (COE), Mixed Income of household unincorporated enterprises, Taxes less subsidies on production, and Taxes less subsidies on products.
Generally, GDP is compiled as an aggregate sum with no distinction between the formal economy and the informal economy. Also, GDP is compiled on the assumptions of the Observed Economy and there is little or no report on the dynamics of the Non-Observed Economy (NOE) in Sierra Leone. The Informal Economy like the Formal Economy is made up of both the observed and non-observed economies but it is been speculated that the non-observed component of the Informal Economy is the source of many illegal activities. As such there are few or no legislation including National Policy on the management of the Informal Economy in Sierra Leone.
A study of administrative barriers in Sierra Leone conducted by the Foreign Investment Advisory Service (FIAS) in conjunction with Statistics Sierra Leone (SSL) at the request of the Government in 2005 revealed that in every aspect of the investment process (from start-up, location and operations), most firms find it simpler and more cost effective to remain in the informal sector than to comply with licensing, tax and other official requirements to operate a business. The informal economy in Sierra Leone was estimated at about 45% of GDP by the World Bank in 2005 using the Doing Business Database. Activities in the informal sector are less productive than formal ones, and operations tend to be sub-scale and sub-invested as they lack access to finance or avoid the scope of regulators, the study concluded. In addition, informal sector workers do not benefit from social protection, training and other human resource capacity building activities. At the level of macroeconomic management, the government is losing on substantial potential tax revenue, and it is believed that Sierra Leone’s low tax revenue share of GDP is mainly due to the large informal sector.
1.2. Compilation of GDP in Sierra Leone
Currently, GDP by Production approach is compiled by kind of economy activity using ISIC Revision 3.1 as shown in Table 1 below. The compilation of the output of the Agriculture industry is defined as the sum of estimates of administrative data collection from the Ministry of Agriculture, Forestry and Food Security (MAFFS) and the Ministry of Fisheries and Marine Resources (MFMR), estimates from the mini Charcoal Survey conducted by SSL and estimates from the Sierra Leone Integrated Household Survey (SLIHS). It is estimated that the Agriculture Industry contributed about 47.2% and 41.1% to GDP in 2012

3
and 2013 respectively. There is no quantitative measure of the contribution of the Informal Economy to Agriculture but it is believed that the industry is dominated by unregistered establishments and household unincorporated enterprises. This seems to suggest that the Agriculture Industry has a huge informal sector in Sierra Leone.
Table 1: GDP by production approach at Current Prices (in million Leones)
Gross Domestic Product at Current Prices (in Millions Leones) BY SECTOR
2010 2011 2012 2013 2014
1. Agriculture, Forestry and Fishing 5,429,597.03 6,986,660.45 8,355,507.70 10,228,785.49 11,243,456.83
1.1 Crops 3,508,077.17 4,349,156.51 5,020,505.73 6,306,111.63 6,753,632.56
1.2 Livestock 294,397.33 373,838.44 463,642.48 509,855.15 534,098.90
1.3 Forestry 705,200.83 975,151.77 1,253,046.50 1,460,614.41 1,560,444.89
1.4 Fishery 921,921.71 1,288,513.73 1,618,312.99 1,952,204.31 2,395,280.48
2. Industry 798,027.30 1,007,124.74 2,400,415.25 4,733,692.26 5,120,412.71
2.1 Mining and Quarrying 410,642.29 528,777.46 1,831,855.62 4,130,679.78 4,495,167.93
2.2 Manufacturing and Handicrafts 223,298.58 288,487.69 333,221.30 349,866.70 368,675.88
2.3 Electricity and Water Supply 24,443.46 30,236.65 37,805.02 43,890.45 60,501.26
2.4 Construction 139,642.97 159,622.94 197,533.32 209,255.33 196,067.64
3. Services 3,616,771.60 4,466,937.36 5,321,825.30 5,845,609.08 6,311,083.37
3.1 Wholesale and Retail Trade 905,193.82 1,157,426.45 1,386,813.80 1,576,865.21 1,681,688.51
3.2 Hotels and Restaurants 36,484.56 49,335.41 67,594.03 72,190.27 64,022.07
3.3 Transport and storage 329,472.97 389,236.34 418,871.15 458,229.05 464,668.56
3.4 Information and Communication 256,953.27 299,218.32 314,964.36 345,937.55 380,453.93
3.5 Financial Institutions and Insurance 237,594.42 290,267.41 342,122.00 380,199.68 414,906.60
3.6 Real Estate 241,539.61 293,266.17 341,957.42 371,352.47 402,115.96
3.7 Administration of Public Services 421,260.51 582,852.50 768,131.83 901,388.47 1,046,178.74
3.8 Other Services 410,017.88 497,824.65 580,478.93 602,197.34 642,861.90
3.9 Education 237,666.08 290,722.08 350,979.14 379,765.98 400,603.10
3.10 Health 437,171.41 479,580.49 538,252.21 564,593.58 611,274.45
3.11 NPISH 103,417.08 137,207.54 211,660.43 192,889.48 202,309.53
4. FISIM 152,963.03 186,728.25 224,581.52 252,005.95 275,858.42
5. Total Value Added at Basic Prices (1+2+3-4) 9,691,432.91 12,273,994.30 15,853,166.74 20,556,080.89 22,399,094.50
6.Taxes less Subsidies on Products 564,711.22 478,940.38 607,489.39 744,145.53 909,648.72
7. Gross Domestic Product at Market Prices (5+6) 10,256,144.13 12,752,934.68 16,460,656.13 21,300,226.42 23,308,743.22
(a) Other services-informal 143,506.26 174,238.63 203,167.63 210,769.07 225,001.67
(b) Annual Growth Rate 5.35 5.96 15.21 20.12 4.03
The compilation of the Mining and quarrying industry is based on production and export figures collected from the National Mineral Agency (NMA) and the Bank of Sierra Leone (BSL). This estimate of minerals produced and exported is integrated with the estimate of quarrying from the Sand Extraction and Stone Breaking Survey and adjustment made for smuggling. The Mining Industry is another area of economic activity that is believed to be dominated by a huge informal sector particularly in the mining of Diamonds and Gold.
Estimates of the output of the Manufacturing Industry are based on data collected from BSL Real Sector Survey, the Annual Economic Survey (AES) and the SLIHS. It is speculated that the Manufacturing industry has a large informal sector which includes the activities of tailors, carpenters, welders and handicrafts. For the compilation of the output of construction, estimates are based on a historical series
4
of the relationship between material and labour inputs of construction. On this basis, output is estimated using the share of imported construction materials and it is integrated with the output of construction for own use from the SLIHS. Data for imported construction materials are obtained from the Department of Customs (NRA) and the BSL. It is observed that a huge proportion of residential construction activities are dominated by informal sector workers. Also, the incidence of unregistered workers hired on contract by registered establishments is prevalent in the construction industry.
Electricity output is estimated from data collected from the National Power Authority (NPA), now dissolved into the Electricity Distribution and Supply Authority (EDSA) and the Electricity Generation and Transmission Corporation (EGTC), and the Bo-Kenema Power Services (BKPS). It is assumed that the production of electricity is regulated by the formal economy since no estimate is made about the output of electricity generated by households with mini generators particularly in the Northern Region.
The output of Water supply is estimated from data collected from the Guma Valley Water Company (GVWC) and the Sierra Leone Water Company (SALWACO), the public utilities responsible for water supply in Sierra Leone. On this basis, it is assumed that the production of water supply is regulated by the formal economy. But there is a clear evidence of the growing activities of NGOs and other civil society organizations in the provision of drill boreholes and protected dug wells for the production of water supply particularly in the rural areas. This output of water supply which is excluded from official estimate includes informal sector activities.
Wholesale and retail trade industry is assumed to be dominated by the trade of agricultural products, manufacturing products, minerals and other imported products. Estimates of output are based on the proportion of supply marketed and their associated trade margin. It is believed that the Wholesale and retail trade industry has a large informal sector due mainly to unregistered establishments and household unincorporated enterprises. Estimates of the output of Hotel and guest houses are based on administrative data collection about occupancy rate and guest night, and for bars and restaurants, Gross Value Added is assumed to be equal to the associate trade margin of these products. The phenomenon of households producing guest house facilities is not common in Sierra Leone and it is assumed that guest house and hotel services are provided by registered establishments. Thus the output of Hotel and Tourism is assumed to be regulated by the formal economy with minimal incidence of informality due mainly to unregistered workers hired seasonally.
The output of transport and storage is estimated based on data collected from the Sierra Leone Airport Authority (SLAA), Sierra Leone Road Transport Corporation (SLRTC), Sierra Leone Road Safety Authority (SLRSA), Sierra Leone Maritime Administration (SLMA) and the AES. It is observed that road and sea transports are highly dominated by unregistered operators and informal sector workers. Information and communication industry is assumed to be regulated by the formal economy and it is composed of public lines, mobile firms, internet providers, newspapers, broadcasting, postal and courier services.
Estimates of the output of Financial and Insurance activities are based on data collected from the Sierra Leone Insurance Commission (SLICOM), BSL and AES. It is assumed that this industry is regulated by the formal economy. Real estate activities are not well established in Sierra Leone but there are some public corporations such as National Social Security and Insurance Trust (NASSIT) and other private business establishments that now own investments and operate in the Real Estate Industry. Output is estimated as the sum of the production of the above establishments and household production of residential buildings for own use. It has a fair share of informal sector activities due to the production of residential buildings by households.
5
The output of Administration of Public Services, Education, Health and Non-Profit Institutions Serving Households (NPISH) are assumed to be regulated by the formal economy but there is a growing evidence of informal sector activities in the Education, Health and NPISH sectors due mainly to the activities of households in this industries such as running home schools, unregistered medical practices etc. It was recently estimated that 35% of the output of Other Services Industry is from the Informal Economy. Estimates of Financial Intermediation Services Indirectly Measured (FISIM) and Taxes less subsidies on products and production are assumed to be regulated by the formal economy.
1.3 Qualitative Analysis of the Informal Sector
The Survey Analysis Report of Sources of Informal Economic Activity in Sierra Leone conducted by FIAS in conjunction with SSL estimated that about two-thirds of the population is engaged in subsistence agriculture and accounts for 52% of GDP in 2006, while the industry sector accounts for about 30% and the service sector for about 18%. The survey was based on a sample of 1,362 business establishments operating across the four regions of Sierra Leone. According to the majority of community leaders who were interviewed during the survey, the proportion of unregistered establishments lies between 40% and 80%. The survey shows that 56% of respondents believed that formal businesses are in a much better situation to operate in Sierra Leone than their informal counterparts. The survey further revealed that 30% of businesses are informal because of avoiding licensing process, 27% because of avoiding labour taxes and contributions, 25% because of avoiding income and profit tax, and 18% because of avoidance of labour regulations and preferring flexibility of labour.
About one-fifth of businesses covered in the survey incurred some payment over the previous years in order to sustain their informal status. And 36% of completely informal businesses knew nothing about the procedures to become formal in their area of business and 40% knew few details only. The survey shows that over 27% of informal businesses failed to become formal because the steps were too costly, 26% failed due to complicated steps and 22% failed because they were unable to find all required information. About 88% of respondents believed that Government measures that would act as incentives to become formal included reduced taxes, increased transparency of all procedures to register, tax incentives and reduced administrative barriers. Also, 70% of community leaders interviewed believed that Government measures that would stimulate formalization include better access to information and reduction of administrative barriers in general. The survey show that 70% of businesses surveyed do not obtained Product Standards Certificate due mainly to high cost requirements, lack of information and unclear certificate policy.
The survey revealed that the majority of business establishments leased private land for their business activity. Over 50% of businesses that use land in their everyday operations leased private land and 55% of businesses with 3 or less workers also leased private land. Most businesses operate on land without rights because of land costs, administrative barriers and lack of information. The survey shows that 85% of businesses operate on informal land because land costs are too high and 64% of such businesses use land without land rights because of complicated and expensive barriers related to land purchase and lease as well as lack of information.
Over half of the businesses covered in the survey are believed to have reported less than 50% of their workers and 35% of such businesses think that most businesses in their industry of operation do not report any of their workers to government authorities. About 80% of businesses indicated that they did not report all employees because of high income tax, high social security contributions, rigid hiring and firing regulations as well as health, unemployment and retirement contributions. Also, about 60% of businesses reported less than 50% of their turnover because of high taxes. In addition, 75% of
6
businesses consider transportation infrastructure and availability of electricity as constraints. And over 60% of community leaders consider the lack of availability of information from government authorities as an obstacle to business growth.
1.4 Objectives of the Report
The objectives of this report include the following:
(a) To translate GDP by production approach from ISIC Revision 3.1 to ISIC Revision 4 with a view to examine and measure the size of informality by kind of economic activity;
(b) To construct a vector of registered establishment from the Business Register and AES by kind of economic activities using ISIC Revision 4;
(c) To construct a vector of unregistered business establishments (mainly household unincorporated enterprises) from the SLIHS by kind of economic activities using ISIC Revision 4;
(d) T o construct a matrix of business establishments operating in Sierra Leone based on the two vectors above. The columns of this matrix are registered establishments, unregistered establishments and total establishments while the rows are kind of economic activity using ISIC Revision 4;
(e) To translate the matrix of business establishments into a matrix of ratios representing a measure of formality and informality by industry in the economy. The matrix of ratios will be used to distribute aggregate GDP and employment by kind of economic activity using ISIC Revision 4.
1.5 Method of Analysis
The Method of Analysis used in this report is analogous to the method of analysis of the solutions of Non-Linear Differential systems. The solutions to Non-Linear Differential systems are qualitative since they cannot be solved explicitly as we do with Linear Differential systems where quantitative solutions can be computed and verified. Also, methods similar to Recurrence Quantification Analysis (RQA) are used in a practical way to generate quantification of the qualitative solution of the Informal Economy in Sierra Leone.
2. PRESENTATION AND ANALYSIS OF DATA 2.1 Matrix of Establishments and Employment Matrix
The 2004 Population and Housing Census revealed that there were 819, 848 households in Sierra Leone with a population of 4,976, 871 persons and an average household size of 6 persons. The 2004 Census Report distributed the Paid Labour Force and Self Employment by kind of economic activity using ISIC Revision 3.1 for analysis. By 2011, the SLIHS estimated that there were 1,042,245 households with a total population of 5,865,881 persons which gave an average of 5.6 persons per household. In Sierra Leone, the contribution of households to economic activities is significant particularly in agriculture, mining, manufacturing and trading. Also, the contribution of households to production is very important to understand the size of the informal economy. In this report, it is assumed that the informal economy is made up of unregistered establishments, household unincorporated enterprises, and informal private sector employees, informal self employed and unpaid family workers as shown in Table 2 below. The base of analysis in this report is the 2011 SLIHS and all data in this report is referenced to 2011 as the base year.
7
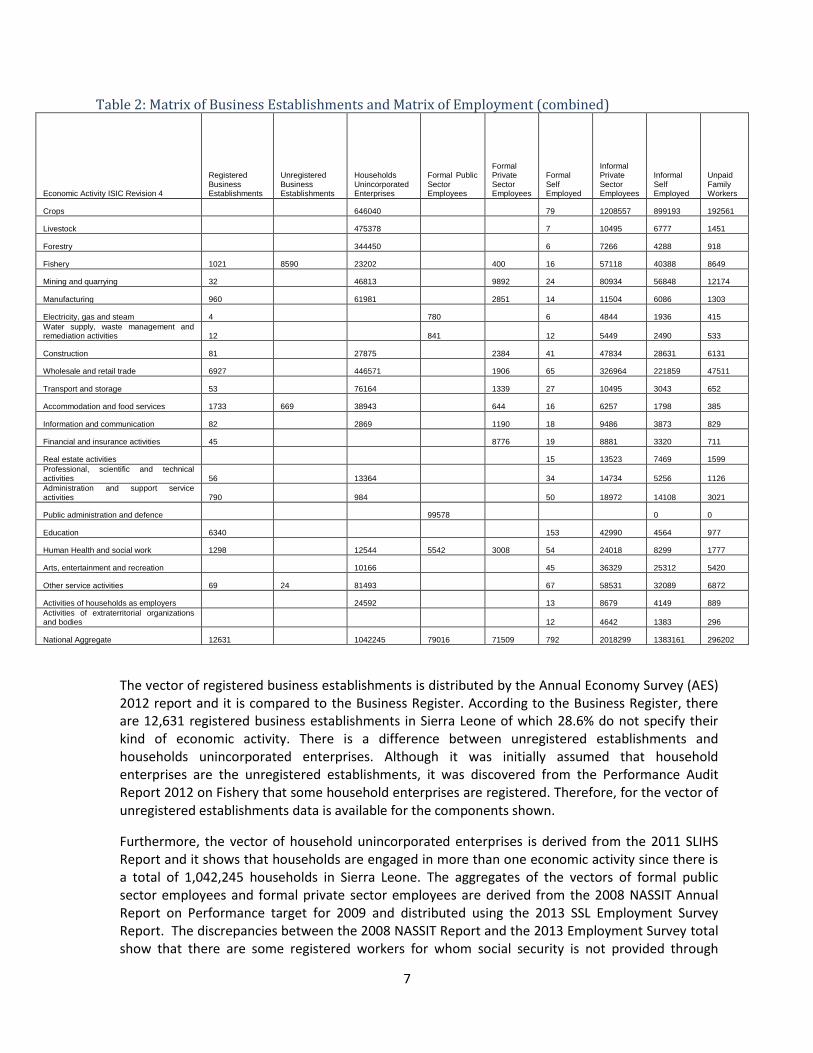
Table 2: Matrix of Business Establishments and Matrix of Employment (combined)
Economic Activity ISIC Revision 4
Registered Business Establishments
Unregistered Business Establishments
Households Unincorporated Enterprises
Formal Public Sector Employees
Formal Private Sector Employees
Formal Self Employed
Informal Private Sector Employees
Informal Self Employed
Unpaid Family Workers
Crops
646040
79 1208557 899193 192561
Livestock
475378
7 10495 6777 1451
Forestry
344450
6 7266 4288 918
Fishery 1021 8590 23202
400 16 57118 40388 8649
Mining and quarrying 32
46813
9892 24 80934 56848 12174
Manufacturing 960
61981
2851 14 11504 6086 1303
Electricity, gas and steam 4
780
6 4844 1936 415
Water supply, waste management and remediation activities 12
841
12 5449 2490 533
Construction 81
27875
2384 41 47834 28631 6131
Wholesale and retail trade 6927
446571
1906 65 326964 221859 47511
Transport and storage 53
76164
1339 27 10495 3043 652
Accommodation and food services 1733 669 38943
644 16 6257 1798 385
Information and communication 82
2869
1190 18 9486 3873 829
Financial and insurance activities 45
8776 19 8881 3320 711
Real estate activities
15 13523 7469 1599
Professional, scientific and technical activities 56
13364
34 14734 5256 1126
Administration and support service activities 790
984
50 18972 14108 3021
Public administration and defence
99578
0 0
Education 6340
153 42990 4564 977
Human Health and social work 1298
12544 5542 3008 54 24018 8299 1777
Arts, entertainment and recreation
10166
45 36329 25312 5420
Other service activities 69 24 81493
67 58531 32089 6872
Activities of households as employers
24592
13 8679 4149 889
Activities of extraterritorial organizations and bodies
12 4642 1383 296
National Aggregate 12631
1042245 79016 71509 792 2018299 1383161 296202
The vector of registered business establishments is distributed by the Annual Economy Survey (AES) 2012 report and it is compared to the Business Register. According to the Business Register, there are 12,631 registered business establishments in Sierra Leone of which 28.6% do not specify their kind of economic activity. There is a difference between unregistered establishments and households unincorporated enterprises. Although it was initially assumed that household enterprises are the unregistered establishments, it was discovered from the Performance Audit Report 2012 on Fishery that some household enterprises are registered. Therefore, for the vector of unregistered establishments data is available for the components shown.
Furthermore, the vector of household unincorporated enterprises is derived from the 2011 SLIHS Report and it shows that households are engaged in more than one economic activity since there is a total of 1,042,245 households in Sierra Leone. The aggregates of the vectors of formal public sector employees and formal private sector employees are derived from the 2008 NASSIT Annual Report on Performance target for 2009 and distributed using the 2013 SSL Employment Survey Report. The discrepancies between the 2008 NASSIT Report and the 2013 Employment Survey total show that there are some registered workers for whom social security is not provided through
8
NASSIT. The issue of whether such workers should be classified as part of the formal sector is critical in measuring informality. And the aggregate for the vector of formal self employed is derived from the 2008 NASSIT Report and distributed using the Sierra Leone Paid Labour Force by industry Table of ratios prepared from the 2004 Population and Housing Census Report.
Finally, the aggregate for the vector of informal private sector employees is derived from the 2011 SLIHS and distributed using the Cash Earnings Population 15-64 years by industry from the 2004 Population and Housing Census. In addition, the aggregates for the vectors of informal self employed and unpaid family workers are derived and distributed using the Labour and Employment Monograph of the 2004 Population and Housing Census.
2.2 Quantification of the Informal Economy
We will use two methods to quantify the overall economy into monetary aggregates in order to measure the informal economy by kind of economic activities. We call them the objective and subjective methods. In the objective method, we will identify the above matrix of establishments and employment matrix (combined) as a quantity matrix since its columns are quantities of establishments and workers respectively. So, let us specify the following vector quantities:
Q1 = vector of registered establishments by industry
Q2 = vector of unregistered establishments by industry
Q3 = vector of household unincorporated enterprises by industry
Q4 = vector of formal public sector employees by industry
Q5 = vector of formal private sector employees by industry
Q6 = vector of formal self employed by industry
Q7 = vector of Informal private sector workers by industry
Q8 = vector of informal self employed by industry
Q9 = vector of unpaid family workers by industry
The next step is to construct another matrix of output value (price) of establishments and average product (price) of workers. Qualitative analysis can be used or a survey can be conducted to fill in the values of this matrix in which we will have the following vectors:
P1 = vector of the output value of registered establishments by industry
P2 = vector of the output value of unregistered establishments by industry
P3 = vector of the output value of household unincorporated enterprises by industry
P4 = vector of the average product (wages/salaries) of formal public sector employees by industry
P5 = vector of the average product (wages/salaries) of formal private sector employees by industry
P6 = vector of the average product (wages/salaries) of formal self employed by industry
9
P7 = vector of the average product (cash/kind) of informal private sector workers by industry
P8 = vector of average product (cash/kind) of informal self employed by industry
P9 = vector of the average product (in kind) of the unpaid family workers by industry
We are now in position to determine the GDP of the overall economy by summing the dot product of a quantity vector and its corresponding price vector by industry.
GDP = P1*Q1 + P2*Q2 + P3*Q3 + P4*Q4 + P5*Q5 + P6*Q6 + P7*Q7 + P8*Q8 + P9*Q9
where * is a symbol representing the Dot Product (Pi dot Qi) and i ranges from 1 to 9. We can partition aggregate GDP into its formal and informal components as follows:
Informal GDP by industry = P2*Q2 + P3*Q3 + P7*Q7 + P8*Q8 + P9*Q9 and
Formal GDP by industry = P1*Q1 + P4*Q4 + P5*Q5 + P6*Q6
The above estimation of GDP and its separation into informal GDP and formal GDP should be refined to avoid double counting and overlaps between variables and industries.
2.3 Subjective Method of Quantification
The assumption of the subjective method is that the informal economy is modeled as a non-linear system. Therefore, the qualitative analysis of this system will be used to determine the shares of formality and informality in the economy.
We begin with Agriculture. The government of Sierra Leone has a strong presence in the production of crops through the Ministry of Agriculture, Forestry and Food Security (MAFFS), the Sierra Leone Agricultural Research Institute (SLARI), the West Africa Agricultural Productivity Programme (WAAPP) and other public corporations. Since 2010, the government has embarked on the distribution of seeds and equipments by district in which a total 97,847 bushels of seed rice and 480 tractors were distributed nationwide. It was also observed that there are registered private establishments in crop production particularly in the production of rice and cash crops such as coffee, cocoa, piassava, ginger etc. Therefore, the formal sector in crop production is likely higher than the informal sector. We therefore assume that the formal economy is about 58% and the informal economy is 42% for crop production.
Besides the provision of veterinary services in animal hospitals managed by MAFFS and other private agencies, government is not too involved in the production of livestock in Sierra Leone. The supply of Poultry product is either imported or produced by households or private establishments mainly in the informal sector. Therefore, it is likely that informal livestock production is higher than formal production. We assume that the formal economy is about 46% and the informal economy is about 54% for livestock production.
A list of registered business establishments for forestry does not exist at the moment even though there are major investors in the trade of timbers. Government involvement in forestry is mainly in the provision of forest guards for the preservation of the forest and planting of new tree seeds to promote forestation. It is also involved in the production of timbers through the Forestry Corporation, a unit of MAFFS based in Kenema. In addition to timber production, households and other informal sector workers are involved in the production of fence sticks, fuel wood, charcoal,
10
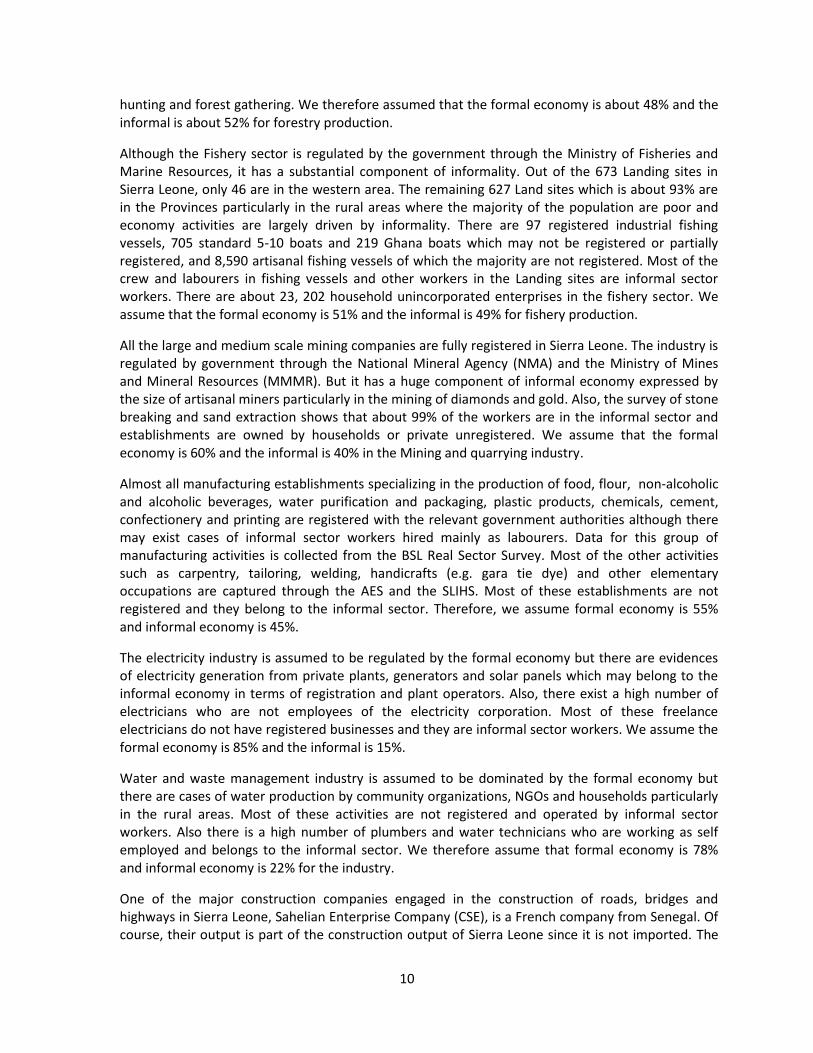
hunting and forest gathering. We therefore assumed that the formal economy is about 48% and the informal is about 52% for forestry production.
Although the Fishery sector is regulated by the government through the Ministry of Fisheries and Marine Resources, it has a substantial component of informality. Out of the 673 Landing sites in Sierra Leone, only 46 are in the western area. The remaining 627 Land sites which is about 93% are in the Provinces particularly in the rural areas where the majority of the population are poor and economy activities are largely driven by informality. There are 97 registered industrial fishing vessels, 705 standard 5-10 boats and 219 Ghana boats which may not be registered or partially registered, and 8,590 artisanal fishing vessels of which the majority are not registered. Most of the crew and labourers in fishing vessels and other workers in the Landing sites are informal sector workers. There are about 23, 202 household unincorporated enterprises in the fishery sector. We assume that the formal economy is 51% and the informal is 49% for fishery production.
All the large and medium scale mining companies are fully registered in Sierra Leone. The industry is regulated by government through the National Mineral Agency (NMA) and the Ministry of Mines and Mineral Resources (MMMR). But it has a huge component of informal economy expressed by the size of artisanal miners particularly in the mining of diamonds and gold. Also, the survey of stone breaking and sand extraction shows that about 99% of the workers are in the informal sector and establishments are owned by households or private unregistered. We assume that the formal economy is 60% and the informal is 40% in the Mining and quarrying industry.
Almost all manufacturing establishments specializing in the production of food, flour, non-alcoholic and alcoholic beverages, water purification and packaging, plastic products, chemicals, cement, confectionery and printing are registered with the relevant government authorities although there may exist cases of informal sector workers hired mainly as labourers. Data for this group of manufacturing activities is collected from the BSL Real Sector Survey. Most of the other activities such as carpentry, tailoring, welding, handicrafts (e.g. gara tie dye) and other elementary occupations are captured through the AES and the SLIHS. Most of these establishments are not registered and they belong to the informal sector. Therefore, we assume formal economy is 55% and informal economy is 45%.
The electricity industry is assumed to be regulated by the formal economy but there are evidences of electricity generation from private plants, generators and solar panels which may belong to the informal economy in terms of registration and plant operators. Also, there exist a high number of electricians who are not employees of the electricity corporation. Most of these freelance electricians do not have registered businesses and they are informal sector workers. We assume the formal economy is 85% and the informal is 15%.
Water and waste management industry is assumed to be dominated by the formal economy but there are cases of water production by community organizations, NGOs and households particularly in the rural areas. Most of these activities are not registered and operated by informal sector workers. Also there is a high number of plumbers and water technicians who are working as self employed and belongs to the informal sector. We therefore assume that formal economy is 78% and informal economy is 22% for the industry.
One of the major construction companies engaged in the construction of roads, bridges and highways in Sierra Leone, Sahelian Enterprise Company (CSE), is a French company from Senegal. Of course, their output is part of the construction output of Sierra Leone since it is not imported. The
11
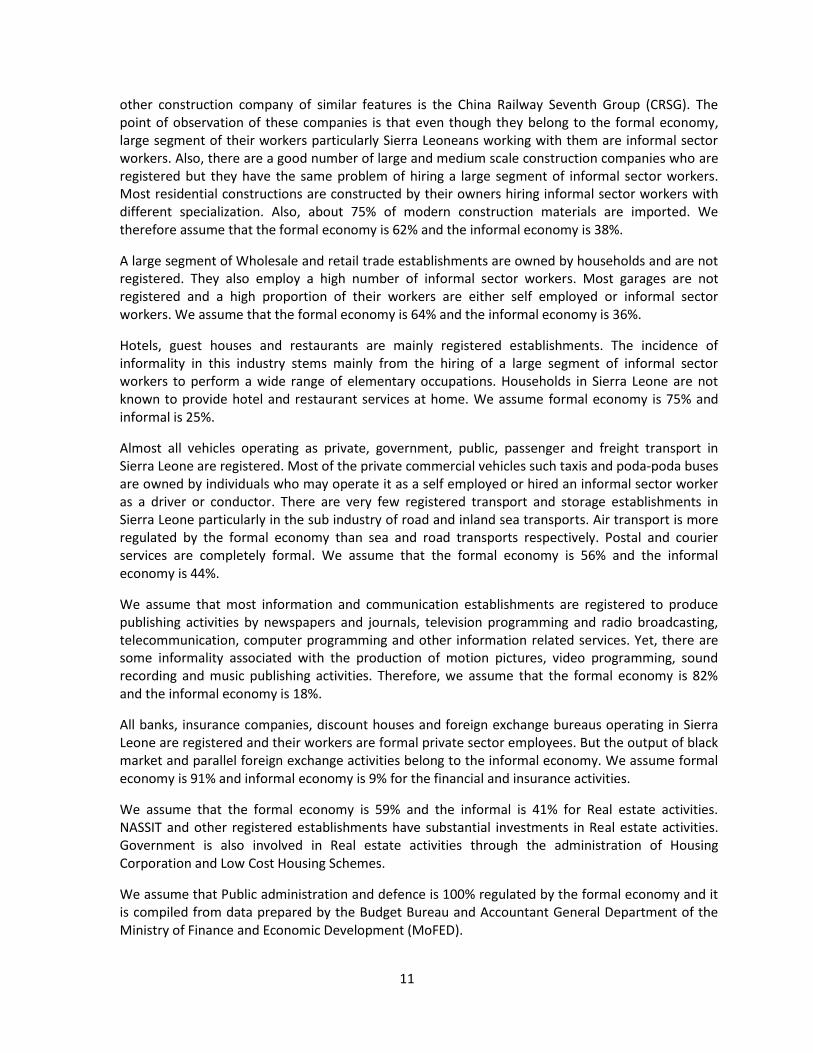
other construction company of similar features is the China Railway Seventh Group (CRSG). The point of observation of these companies is that even though they belong to the formal economy, large segment of their workers particularly Sierra Leoneans working with them are informal sector workers. Also, there are a good number of large and medium scale construction companies who are registered but they have the same problem of hiring a large segment of informal sector workers. Most residential constructions are constructed by their owners hiring informal sector workers with different specialization. Also, about 75% of modern construction materials are imported. We therefore assume that the formal economy is 62% and the informal economy is 38%.
A large segment of Wholesale and retail trade establishments are owned by households and are not registered. They also employ a high number of informal sector workers. Most garages are not registered and a high proportion of their workers are either self employed or informal sector workers. We assume that the formal economy is 64% and the informal economy is 36%.
Hotels, guest houses and restaurants are mainly registered establishments. The incidence of informality in this industry stems mainly from the hiring of a large segment of informal sector workers to perform a wide range of elementary occupations. Households in Sierra Leone are not known to provide hotel and restaurant services at home. We assume formal economy is 75% and informal is 25%.
Almost all vehicles operating as private, government, public, passenger and freight transport in Sierra Leone are registered. Most of the private commercial vehicles such taxis and poda-poda buses are owned by individuals who may operate it as a self employed or hired an informal sector worker as a driver or conductor. There are very few registered transport and storage establishments in Sierra Leone particularly in the sub industry of road and inland sea transports. Air transport is more regulated by the formal economy than sea and road transports respectively. Postal and courier services are completely formal. We assume that the formal economy is 56% and the informal economy is 44%.
We assume that most information and communication establishments are registered to produce publishing activities by newspapers and journals, television programming and radio broadcasting, telecommunication, computer programming and other information related services. Yet, there are some informality associated with the production of motion pictures, video programming, sound recording and music publishing activities. Therefore, we assume that the formal economy is 82% and the informal economy is 18%.
All banks, insurance companies, discount houses and foreign exchange bureaus operating in Sierra Leone are registered and their workers are formal private sector employees. But the output of black market and parallel foreign exchange activities belong to the informal economy. We assume formal economy is 91% and informal economy is 9% for the financial and insurance activities.
We assume that the formal economy is 59% and the informal is 41% for Real estate activities. NASSIT and other registered establishments have substantial investments in Real estate activities. Government is also involved in Real estate activities through the administration of Housing Corporation and Low Cost Housing Schemes.
We assume that Public administration and defence is 100% regulated by the formal economy and it is compiled from data prepared by the Budget Bureau and Accountant General Department of the Ministry of Finance and Economic Development (MoFED).
12
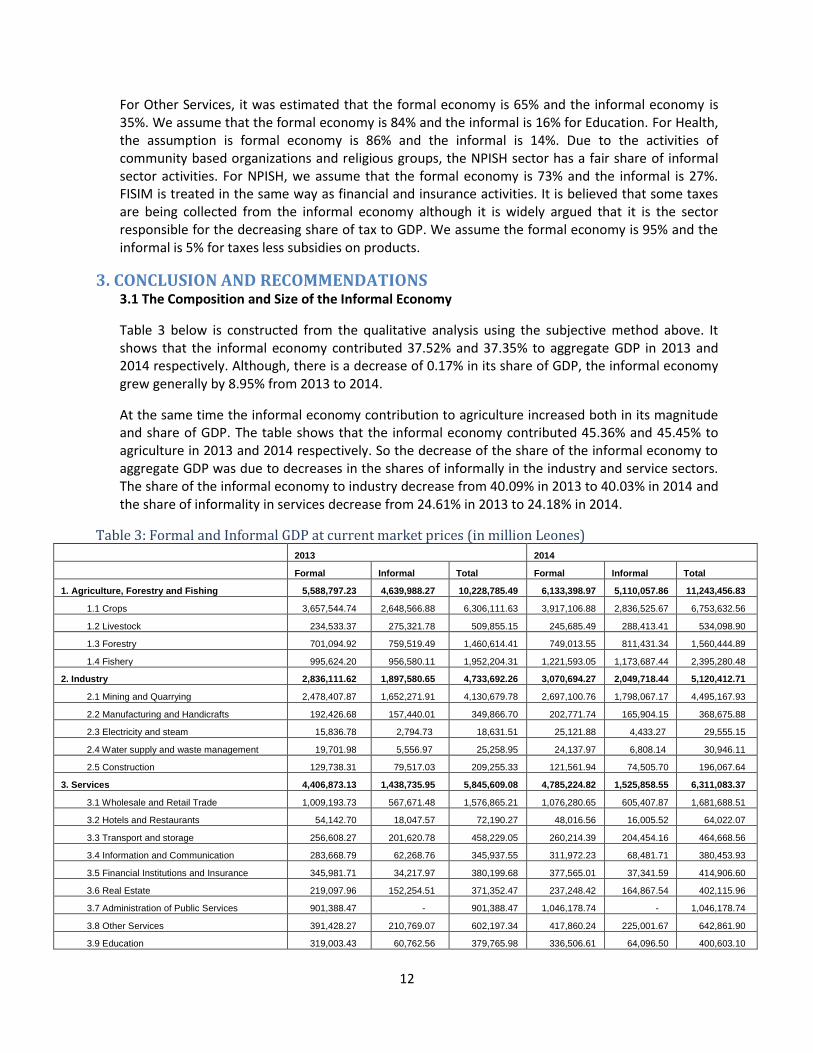
For Other Services, it was estimated that the formal economy is 65% and the informal economy is 35%. We assume that the formal economy is 84% and the informal is 16% for Education. For Health, the assumption is formal economy is 86% and the informal is 14%. Due to the activities of community based organizations and religious groups, the NPISH sector has a fair share of informal sector activities. For NPISH, we assume that the formal economy is 73% and the informal is 27%. FISIM is treated in the same way as financial and insurance activities. It is believed that some taxes are being collected from the informal economy although it is widely argued that it is the sector responsible for the decreasing share of tax to GDP. We assume the formal economy is 95% and the informal is 5% for taxes less subsidies on products.
3. CONCLUSION AND RECOMMENDATIONS 3.1 The Composition and Size of the Informal Economy
Table 3 below is constructed from the qualitative analysis using the subjective method above. It shows that the informal economy contributed 37.52% and 37.35% to aggregate GDP in 2013 and 2014 respectively. Although, there is a decrease of 0.17% in its share of GDP, the informal economy grew generally by 8.95% from 2013 to 2014.
At the same time the informal economy contribution to agriculture increased both in its magnitude and share of GDP. The table shows that the informal economy contributed 45.36% and 45.45% to agriculture in 2013 and 2014 respectively. So the decrease of the share of the informal economy to aggregate GDP was due to decreases in the shares of informally in the industry and service sectors. The share of the informal economy to industry decrease from 40.09% in 2013 to 40.03% in 2014 and the share of informality in services decrease from 24.61% in 2013 to 24.18% in 2014.
Table 3: Formal and Informal GDP at current market prices (in million Leones)
2013 2014
Formal Informal Total Formal Informal Total
1. Agriculture, Forestry and Fishing 5,588,797.23 4,639,988.27 10,228,785.49 6,133,398.97 5,110,057.86 11,243,456.83
1.1 Crops 3,657,544.74 2,648,566.88 6,306,111.63 3,917,106.88 2,836,525.67 6,753,632.56
1.2 Livestock 234,533.37 275,321.78 509,855.15 245,685.49 288,413.41 534,098.90
1.3 Forestry 701,094.92 759,519.49 1,460,614.41 749,013.55 811,431.34 1,560,444.89
1.4 Fishery 995,624.20 956,580.11 1,952,204.31 1,221,593.05 1,173,687.44 2,395,280.48
2. Industry 2,836,111.62 1,897,580.65 4,733,692.26 3,070,694.27 2,049,718.44 5,120,412.71
2.1 Mining and Quarrying 2,478,407.87 1,652,271.91 4,130,679.78 2,697,100.76 1,798,067.17 4,495,167.93
2.2 Manufacturing and Handicrafts 192,426.68 157,440.01 349,866.70 202,771.74 165,904.15 368,675.88
2.3 Electricity and steam 15,836.78 2,794.73 18,631.51 25,121.88 4,433.27 29,555.15
2.4 Water supply and waste management 19,701.98 5,556.97 25,258.95 24,137.97 6,808.14 30,946.11
2.5 Construction 129,738.31 79,517.03 209,255.33 121,561.94 74,505.70 196,067.64
3. Services 4,406,873.13 1,438,735.95 5,845,609.08 4,785,224.82 1,525,858.55 6,311,083.37
3.1 Wholesale and Retail Trade 1,009,193.73 567,671.48 1,576,865.21 1,076,280.65 605,407.87 1,681,688.51
3.2 Hotels and Restaurants 54,142.70 18,047.57 72,190.27 48,016.56 16,005.52 64,022.07
3.3 Transport and storage 256,608.27 201,620.78 458,229.05 260,214.39 204,454.16 464,668.56
3.4 Information and Communication 283,668.79 62,268.76 345,937.55 311,972.23 68,481.71 380,453.93
3.5 Financial Institutions and Insurance 345,981.71 34,217.97 380,199.68 377,565.01 37,341.59 414,906.60
3.6 Real Estate 219,097.96 152,254.51 371,352.47 237,248.42 164,867.54 402,115.96
3.7 Administration of Public Services 901,388.47 - 901,388.47 1,046,178.74 - 1,046,178.74
3.8 Other Services 391,428.27 210,769.07 602,197.34 417,860.24 225,001.67 642,861.90
3.9 Education 319,003.43 60,762.56 379,765.98 336,506.61 64,096.50 400,603.10
13
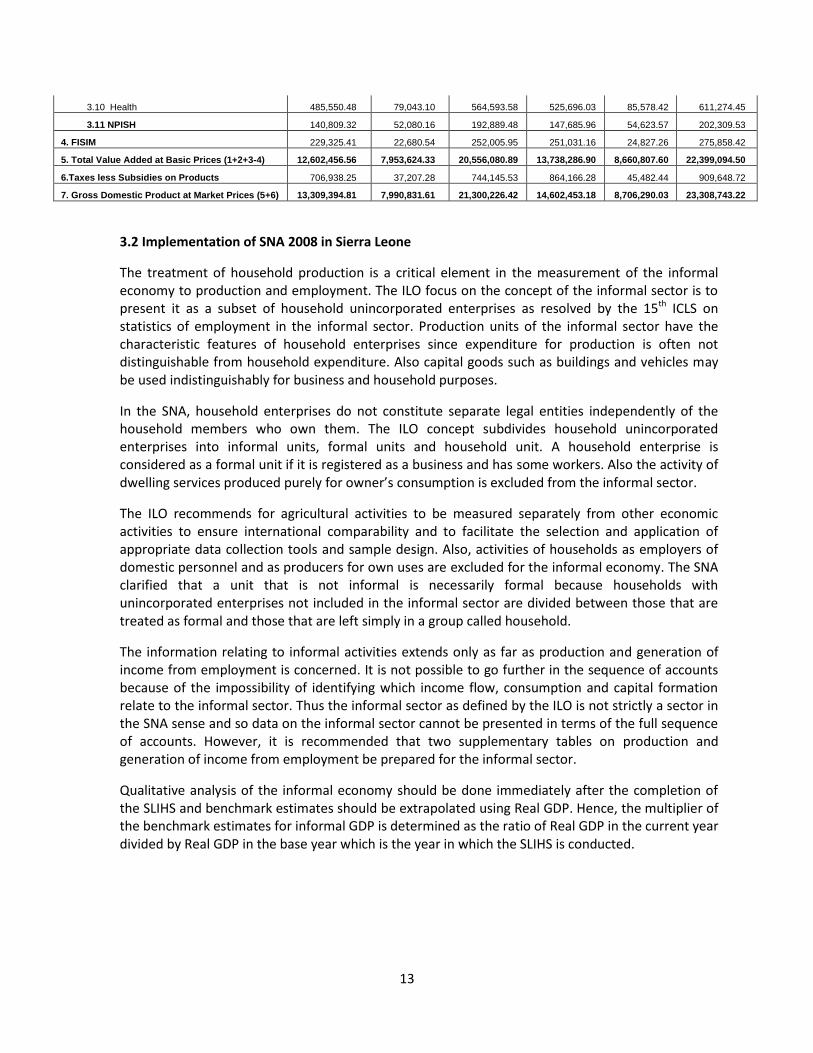
3.10 Health 485,550.48 79,043.10 564,593.58 525,696.03 85,578.42 611,274.45
3.11 NPISH 140,809.32 52,080.16 192,889.48 147,685.96 54,623.57 202,309.53
4. FISIM 229,325.41 22,680.54 252,005.95 251,031.16 24,827.26 275,858.42
5. Total Value Added at Basic Prices (1+2+3-4) 12,602,456.56 7,953,624.33 20,556,080.89 13,738,286.90 8,660,807.60 22,399,094.50
6.Taxes less Subsidies on Products 706,938.25 37,207.28 744,145.53 864,166.28 45,482.44 909,648.72
7. Gross Domestic Product at Market Prices (5+6) 13,309,394.81 7,990,831.61 21,300,226.42 14,602,453.18 8,706,290.03 23,308,743.22
3.2 Implementation of SNA 2008 in Sierra Leone
The treatment of household production is a critical element in the measurement of the informal economy to production and employment. The ILO focus on the concept of the informal sector is to present it as a subset of household unincorporated enterprises as resolved by the 15th ICLS on statistics of employment in the informal sector. Production units of the informal sector have the characteristic features of household enterprises since expenditure for production is often not distinguishable from household expenditure. Also capital goods such as buildings and vehicles may be used indistinguishably for business and household purposes.
In the SNA, household enterprises do not constitute separate legal entities independently of the household members who own them. The ILO concept subdivides household unincorporated enterprises into informal units, formal units and household unit. A household enterprise is considered as a formal unit if it is registered as a business and has some workers. Also the activity of dwelling services produced purely for owner’s consumption is excluded from the informal sector.
The ILO recommends for agricultural activities to be measured separately from other economic activities to ensure international comparability and to facilitate the selection and application of appropriate data collection tools and sample design. Also, activities of households as employers of domestic personnel and as producers for own uses are excluded for the informal economy. The SNA clarified that a unit that is not informal is necessarily formal because households with unincorporated enterprises not included in the informal sector are divided between those that are treated as formal and those that are left simply in a group called household.
The information relating to informal activities extends only as far as production and generation of income from employment is concerned. It is not possible to go further in the sequence of accounts because of the impossibility of identifying which income flow, consumption and capital formation relate to the informal sector. Thus the informal sector as defined by the ILO is not strictly a sector in the SNA sense and so data on the informal sector cannot be presented in terms of the full sequence of accounts. However, it is recommended that two supplementary tables on production and generation of income from employment be prepared for the informal sector.
Qualitative analysis of the informal economy should be done immediately after the completion of the SLIHS and benchmark estimates should be extrapolated using Real GDP. Hence, the multiplier of the benchmark estimates for informal GDP is determined as the ratio of Real GDP in the current year divided by Real GDP in the base year which is the year in which the SLIHS is conducted.