a report on all-ireland mortality data - institute of public...
TRANSCRIPT

A report on All-Ireland mortality DataA report on All-Ireland mortality Data


A report on All-Ireland mortality DataA report on All-Ireland mortality Data

2
Inequalities in Mortality
Published by The Institute of Public Health in Ireland.
© The Institute of Public Health in Ireland, 2001.
The Institute of Public Health has produced this
document as a resource for public health on the island.
It may be freely reproduced (with acknowledgement) but
is not for resale or for use in conjunction with
commercial purposes.
ISBN 0-9540010-2-8.
Design by Language.
For further copies of this report please contact:
The Institute of Public Health, 6 Kildare Street, Dublin
2, Ireland. Tel: + 353 1 662 9287 email: [email protected]
Also contactable at Belfast, Tel: + 44 28 9079 3050
The full report is also available on the Institute’s
website www.publichealth.ie.
May 2001
3
Acknowledgments
This report could not have been written without the assistance of the statisticalagencies and health departments in the North and South. In particular the authorswould like to thank:
• Máire Rodgers and Robert Beatty of the Northern Ireland Statistics and Research Agency
• Mary Heanue of the Central Statistics Office (Republic of Ireland)• Hugh Magee of the Department of Health and Children (Republic of Ireland)• Fergal Bradley of the Department of Health, Social Services and Public Safety
(Northern Ireland)
Without the people working behind the scenes, managing the mortality collectionsand the population censuses in the two jurisdictions, we could not have evencontemplated this report. The authors thank them for their help.
The authors would also like to thank the following people involved in theproduction of the report:
• Paul Walsh of the National Cancer Registry (Ireland) for his advice aboutpresentation of results
• Conor Teljeur of the Small Area Health Statistics Unit, Trinity College Dublin,who produced the maps
• Anne Spellman who collated the population data and assisted with thepresentation of results
Finally, a special word of thanks to Aisling Hayden and Úna Hearne for seeing thisreport to its final form.
Of course, the final responsibility for the content lies with the authors.
Acknowledgments

Acknowledgments . . . . . . . . . . . . . . . . . . . . 3
Introduction . . . . . . . . . . . . . . . . . . . . . . . . 7
Part OneSummary. . . . . . . . . . . . . . . . . . . . . . . . . . . 9
1 Summary . . . . . . . . . . . . . . . . . . . . . . . . . 10
1.1 Methods . . . . . . . . . . . . . . . . . . . . . . . . . . 10
1.2 Key Themes . . . . . . . . . . . . . . . . . . . . . . . 11
1.3 Areas for Future Action . . . . . . . . . . . . . . . 15
1.4 Summary Mortality Figures
and Tables . . . . . . . . . . . . . . . . . . . . . . . . 17
Part TwoMortality on the Island . . . . . . . . . . . . . . . . 32
2 The European Shortlist of
Cause of Death Categories . . . . . . . . . . . . 33
Explanatory Notes. . . . . . . . . . . . . . . . . . . 33
2.00 All causes of death . . . . . . . . . . . . . . . . . . 38
2.01 Infectious and parasitic diseases . . . . . . . . 40
2.02 Tuberculosis . . . . . . . . . . . . . . . . . . . . . . . 42
2.03 Meningococcal infection . . . . . . . . . . . . . 44
2.04 AIDS (HIV-disease) . . . . . . . . . . . . . . . . . . 46
2.05 Viral hepatitis . . . . . . . . . . . . . . . . . . . . . 48
2.06 Neoplasms . . . . . . . . . . . . . . . . . . . . . . . 50
2.07 Malignant neoplasms . . . . . . . . . . . . . . . . 52
2.08 Malignant neoplasms of the lip,
oral cavity, pharynx . . . . . . . . . . . . . . . . . 54
2.09 Malignant neoplasms of the oesophagus . . 56
2.10 Malignant neoplasms of the stomach . . . . . 58
2.11 Malignant neoplasms of the colon . . . . . . 60
2.12 Malignant neoplasms of the rectum
and anus . . . . . . . . . . . . . . . . . . . . . . . . . 62
2.13 Malignant neoplasms of the liver and the
intrahepatic bile ducts . . . . . . . . . . . . . . . 64
2.14 Malignant neoplasms of the pancreas. . . . . 66
2.15 Malignant neoplasms of the larynx and
trachea/bronchus/lung . . . . . . . . . . . . . . . 68
2.16 Malignant neoplasms of the skin . . . . . . . . 70
2.17 Malignant neoplasms of the (female) breast 72
2.18 Malignant neoplasms of the cervix uteri . . . 74
2.19 Malignant neoplasms of
other parts of uterus . . . . . . . . . . . . . . . . . 76
2.20 Malignant neoplasms of the ovary . . . . . . 78
2.21 Malignant neoplasms of the prostate . . . . . 80
2.22 Malignant neoplasms of the kidney . . . . . . 82
2.23 Malignant neoplasms of the bladder . . . . . 84
2.24 Malignant neoplasms of the
lymph/haematopoietic tissue . . . . . . . . . . 86
2.25 Diseases of the blood and blood-forming
organs, immunological disorders . . . . . . . . 88
2.26 Endocrine, nutritional
and metabolic diseases . . . . . . . . . . . . . . . 90
2.27 Diabetes mellitus . . . . . . . . . . . . . . . . . . . 92
2.28 Mental and behavioural disorders . . . . . . . 94
2.29 Alcohol abuse
(including alcoholic psychosis) . . . . . . . . . 96
2.30 Drug dependence, toxicomania . . . . . . . . . 98
2.31 Diseases of the nervous system
and the sense organs . . . . . . . . . . . . . . . . 100
2.32 Meningitis (other than
meningococcal infection) . . . . . . . . . . . . 102
2.33 Diseases of the circulatory system . . . . . . 104
2.34 Ischaemic heart disease. . . . . . . . . . . . . . 106
2.35 Other heart disease . . . . . . . . . . . . . . . . . 108
2.36 Cerebrovascular disease . . . . . . . . . . . . . 110
2.37 Diseases of the respiratory system . . . . . . 112
2.38 Influenza . . . . . . . . . . . . . . . . . . . . . . . . 114
2.39 Pneumonia . . . . . . . . . . . . . . . . . . . . . . . 116
2.40 Chronic lower respiratory disease. . . . . . . 118
2.41 Asthma. . . . . . . . . . . . . . . . . . . . . . . . . . 120
2.42 Diseases of the digestive system . . . . . . . 122
2.43 Ulcer of stomach, duodenum
and jejunum . . . . . . . . . . . . . . . . . . . . . 124
2.44 Chronic liver disease . . . . . . . . . . . . . . . 126
2.45 Diseases of the skin and
subcutaneous tissue . . . . . . . . . . . . . . . . 128
2.46 Diseases of the musculoskeletal
system/connective tissue . . . . . . . . . . . . . 130
2.47 Rheumatoid arthritis and osteoarthrosis . . 132
2.48 Diseases of the genito-urinary system . . . 134
2.49 Diseases of the kidney and ureter . . . . . . 136
2.50 Complications of pregnancy,
childbirth and puerperium. . . . . . . . . . . . 138
Contents
4
Inequalities in Mortality

5
Contents
2.51 Certain conditions originating in
the perinatal period. . . . . . . . . . . . . . . . . 140
2.52 Congenital malformations and
chromosomal abnormalities. . . . . . . . . . . 142
2.53 Congenital malformations of the
nervous system . . . . . . . . . . . . . . . . . . . . 144
2.54 Congenital malformations of the
circulatory system . . . . . . . . . . . . . . . . . 146
2.55 Symptoms, signs, abnormal findings,
ill-defined causes . . . . . . . . . . . . . . . . . . 148
2.56 Sudden infant death syndrome. . . . . . . . . 150
2.57 Unknown and unspecified causes . . . . . . 152
2.58 External causes of injury and poisoning . . 154
2.59 Accidents . . . . . . . . . . . . . . . . . . . . . . . . 156
2.60 Transport accidents . . . . . . . . . . . . . . . . . 158
2.61 Accidental falls . . . . . . . . . . . . . . . . . . . . 160
2.62 Accidental poisoning. . . . . . . . . . . . . . . . 162
2.63 Suicide and intentional self-harm. . . . . . . 164
2.64 Homicide/assault . . . . . . . . . . . . . . . . . . 166
2.65 Events of undetermined intent . . . . . . . . . 168
Part ThreeData Considerations. . . . . . . . . . . . . . . . . 171
3 Statistical Methods . . . . . . . . . . . . . . 1723.1 Overview . . . . . . . . . . . . . . . . . . . . 1723.2 Age Standardisation . . . . . . . . . . . . 1733.3 Statistical Significance and
Practical Importance . . . . . . . . . . . . 1743.4 Statistical Procedures . . . . . . . . . . . . 1743.5 Limitations . . . . . . . . . . . . . . . . . . . 175
4 Definitions and Conventions. . . . . . . 1764.1 Mortality Records . . . . . . . . . . . . . . 1764.2 Geography . . . . . . . . . . . . . . . . . . . 1764.3 Occupational Class . . . . . . . . . . . . . 1774.4 Population Estimates . . . . . . . . . . . . 179
5 Recommendations on Data Issues . . . 1805.1 Co-ordination . . . . . . . . . . . . . . . . . 1805.2 Data Items on the Death Records . . . 1805.3 Data Collection Protocols
and Procedures . . . . . . . . . . . . . . . . 1835.4 Population Estimates . . . . . . . . . . . . 1875.5 Analysis and Reporting . . . . . . . . . . 187
References. . . . . . . . . . . . . . . . . . . . . . . . 190
Appendices . . . . . . . . . . . . . . . . . . . . . . . 193
Appendix 1The European Shortlist of Cause of Death Categories . . . . . . . . . . . . 194
Appendix 2Population Estimates (1994) . . . . . . . . . . . 197
Appendix 3Occupational Class Profiles (1994) . . . . . . 202
Appendix 4WHO Standard European Population . . . . 207

From a letter to the Registrar General on the mortality in the registration of
districts of England during the years 1861-1870.
”…children, fathers, mothers, sisters, brothers, sons…each having left
memories not easily forgotten; and many having biographies full of
complicated incidents. Here, fortunately for this inquiry, they appear
divested of all colour, form, character, passion, and the infinite
individualities of life: by abstraction they are reduced to mere units
undergoing changes as purely physical as the setting stars of
astronomy or the decomposing atoms of chemistry; and as in those
sciences so in this, the analysis of the elementary facts observed in
their various relations to time and place will shed new light on the
more complicated phenomena of national life“ William Farr
Registrar General’s Decennial Supplement to the 35th Report, 1861 -1870.
General Register Office,1875.
6
Inequalities in Mortality

Introduction
7
2.07 Malignant neoplasms (ICD-9 140-239) 1989-1998
The Institute of Public Health in Ireland has been set up to promote co-operationfor public health between Northern Ireland and the Republic of Ireland. Its priorityis to reduce inequalities in health.
This report on mortality and mortality data has been produced by the Institute toadd to understanding and promote dialogue about what could be done to protectand promote health.
It is based on nearly half a million deaths which occurred on the island of Irelandduring 1989-1998. It describes mortality from sixty five causes of death for thewhole island, Northern Ireland and the Republic of Ireland, and draws comparisonswith the (combined) fifteen countries of the European Union. The report describesage, gender, region and occupational class variations in mortality.
The report is in three sections: Part One includes a brief outline of the key themesand areas for future action, as well as a summary of the methods used and results.Part Two presents, with the aid of figures, tables and maps, directly standardisedmortality rates and rate ratios for each of the sixty five causes of death. Part Threemakes recommendations about data issues.
This report shows that mortality rates in Ireland, North and South, compareunfavourably to those of our EU neighbours. It highlights profound inequalities inhealth that pervade the island. These are often overlooked in debate. By outliningcommon challenges to Public Health, the report makes the case for greater North-South co-operation.
There is a strong tradition of using mortality data to draw attention to the greatimpact which social and environmental conditions have on health. This reportbuilds on that tradition by presenting the first comprehensive All-Ireland study ofmortality for 80 years.

8
Inequalities in Mortality

Part One: Summary

1 Summary
10
Inequalities in Mortality
1.1 MethodsThe report describes mortality on the island of Ireland for the ten year period1989-1998. Mortality rates are presented for the whole island and the twojurisdictions, and comparisons are made with the (combined) EU-15 countries.
We look at age, gender, regional and occupational class variations in mortality onthe island. Regional analyses are based on the health (and social services) boardareas together with the major urban centres on the island. Occupational classanalyses focus on working age males using a Social Class scale in NorthernIreland and a Socio-economic Group scale in the Republic.
Results are presented for each of the sixty five cause of death categories in theEuropean Shortlist of Cause of Death Categories. For each cause of death category,the Northern Ireland Statistics and Research Agency and the Central StatisticsOffice in the Republic provided the number of deaths occurring in the period1989-1998 disaggregated by age, gender, region and occupational class. 1994population estimates corresponding to the midpoint of the study period were takenas denominators for mortality rates.
Direct standardisation is used to adjust for age differences. The results areexpressed as directly standardised (mortality) rates per 100,000 population (DSRs).The standard population was taken to be the World Health Organisation’sStandard European Population.
In order to compare the mortality experiences of two populations, we useddirectly standardised (mortality) rate ratios (DSRRs). These are ratios of directlystandardised rates, expressed as a percentage, where the denominator serves asthe base for the comparison. For regional analyses, regional DSRs were comparedto those for the whole island. For gender comparisons, males were compared tofemales. In comparisons of the two jurisdictions, the Republic of Ireland wascompared to Northern Ireland. In the case of occupational classes, each class wascompared to the highest occupational class. In Northern Ireland this was taken asSC 1-2 (‘Professionals’ and ‘Managerial and technical occupations’) while in theRepublic this was taken as SEG A (‘Higher professionals’ and ‘Lowerprofessionals’).
Confidence intervals for directly standardised rates and directly standardised rateratios were derived using standard formulae. The statistical significance of adifference between two directly standardised rates was assessed by an inspectionof the 99% confidence interval (adjusted for multiple comparisons) for thecorresponding directly standardised rate ratio.

11
Part One: Summary
More details about methods, and definitions and conventions are given in Chapter3 and Chapter 4.
1.2 Key ThemesOccupational Class DifferencesThe report establishes the pervasiveness and magnitude of occupational classinequalities on the island.
In both the North and the South the all causes mortality rate in the lowestoccupational class was 100%-200% higher than the rate in the highestoccupational class.
This was evident for nearly all the main causes of death:
• For circulatory diseases it was over 120% higher• For cancers it was over 100% higher• For respiratory diseases it was over 200% higher• For injuries and poisonings it was over 150% higher
As well as the huge gap in mortality between the poorest and the richest, for manydiseases there was a steep gradient running across all social groups. These clearoccupational class gradients in mortality were present for circulatory diseases,cancers, respiratory diseases, and injuries and poisonings. This was true in boththe North and the South.
Gender DifferencesOn the island, excess mortality amongst males represents a fundamental inequalityin health.
The all causes mortality rate for males was 54% higher than it was for females.
The mortality rates for the main causes of death were also substantially higher formales than they were for females:
• For cancers the rate was 45% higher• For respiratory diseases the rate was 48% higher• For circulatory diseases the rate was 61% higher• For injuries and poisonings the rate was 169% higher
The male excess in mortality was present in both jurisdictions.

12
Inequalities in Mortality
Deaths from Homicide/assault and Transport AccidentsTwo very different causes of death illustrate the fundamental role of occupationalclass and gender on the island.
Occupational class played a major role in deaths from homicide/assault andtransport accidents:
• In the North, the mortality rate for homicide/assault was 252% higher in thelowest occupational class than it was in the highest
• In the South, the mortality rate from transport accidents was 354% higher inthe lowest occupational class than it was in the highest
Both types of death occurred more frequently amongst males:
• The mortality rate for homicide/assault was 457% higher for males than it wasfor females
• The mortality rate from transport accidents was 193% higher for males
Young men from the lower occupational classes died most often from these causes.
The mortality rate for homicide/assault was 514% higher in the North than it wasin the South; the rate for transport accidents was 25% higher in the South.
European ComparisonsDuring the period 1989-1998 the island compared unfavourably to Europe.
After adjusting for age, the mortality rates from all causes and the main causes ofdeath including circulatory and respiratory diseases were greater on the islandthan they were for the (combined) EU-15 countries. This was true for both theNorth and the South.
For smaller cause of death categories such as injuries and poisonings, infectiousand parasitic diseases, and digestive diseases, the island compared favourably tothe (combined) EU-15 countries.
While mortality rates for the island were generally higher than the rates in the(combined) EU-15 countries, in such comparisons women tended to fare worsethan men: the all causes mortality rate on the island was 21% higher for femalesand 9% higher for males. The most striking example is cancer deaths: themortality rate for females on the island was 177 per 100,000 compared to 148 per100,000 for the (combined) EU-15 countries. For males, the mortality rate on theisland was 257 per 100,000 compared to 268 per 100,000 for the (combined)

13
Part One: Summary
EU-15 countries. Such phenomena mean that the gender differences on the islandwere not as large as they were in the (combined) EU-15 countries.
North-South ComparisonsThe all causes mortality rate in the Republic of Ireland was 6% higher than therate in Northern Ireland.
This higher mortality rate was observed in most of the main cause of deathcategories:
• For circulatory diseases it was 5% higher in the South• For cancers it was 5% higher in the South• For injuries and poisonings it was 6% higher in the South• However, for respiratory diseases it was 10% higher in the North
In other cause of death categories, the mortality rate was higher in the South:
• For infectious and parasitic diseases it was 82% higher in the South• For drug dependence it was 31% higher in the South• For suicide and intentional self-harm it was 41% higher in the South
In other cause of death categories the mortality rate was higher in the North:
• For alcohol abuse it was 32% higher in the North• For pneumonia it was 163% higher in the North• For accidental poisonings it was 138% higher in the North
The mortality collections in the two jurisdictions have much in common.However, there are known differences in data collection protocols, and there isevidence that these methodological differences may explain some of the North-South differences for many specific causes of death. However, they do not accountfor the 6% all causes mortality excess in the South.
When assessing North-South comparisons it is important to consider the verymany factors which influence mortality. These range from socio-economic andenvironmental factors to lifestyle factors and the provision of health and socialservices. Deaths in 1989-1998, particularly those from chronic diseases, reflect thefactors operating during the period and for a considerable time before.The decade 1989-1998 was a time of great political, social and economic change;these changes will only be partly reflected in the mortality statistics for this period.

14
Inequalities in Mortality
Other Regional VariationThere were complex patterns in the regional mortality rates on the island.
For most causes of death, North-South differences comprised only a small part ofthe regional variation in mortality on the island. For the main causes of death suchas circulatory diseases, cancers, respiratory diseases and injuries and poisonings,the overall regional variation tended to overshadow the difference between thetwo jurisdictions.
In some cases, the regional variation in mortality closely reflected North-Southdifferences. The clearest examples were deaths from diabetes mellitus,pneumonia, suicides and self-harm, and homicide/assault. In such cases there wasevidence that much of the North-South difference in mortality was the result ofsystematic differences in the data collection procedures and protocols used in thetwo jurisdictions.
There were often very clear urban-rural differences in both the North and theSouth. There were urban excesses in mortality from all causes and most maincauses of death. A rural excess in mortality was clearest in causes such asinfluenza and transport accidents.
For other causes of death there was no obvious pattern in the regional directlystandardised mortality rates.
Differences in Methodology in the Two JurisdictionsCaution is needed when interpreting North-South comparisons because of thedifferences in the data collection protocols and procedures used in the twojurisdictions.
As mentioned above, known differences in data collection protocols andprocedures may explain some of the North-South differences in mortality:
• Differences in death certification practices when the deceased is elderly mayexplain much of the North-South difference in mortality from pneumonia andchronic respiratory diseases
• Differences in the use of other information to establish external cause of deathmay explain much of the North-South difference in mortality from suicidesand self-harm, homicide/assault and accidental poisonings
• Differences in cause of death coding practices may explain much of theNorth-South difference in mortality rates from asthma and diabetes mellituss
15
Part One: Summary
The examples above deal with some known differences in methodology, otherimportant differences might surface if a systematic review of protocols andprocedures were undertaken.
These methodological differences may explain some of the North-Southdifferences for specific causes of death. They do not, however, account for the 6%excess in all causes mortality observed in the South.
1.3 Areas for Future ActionJoint Responses to Common ChallengesThe common challenges of high mortality rates and underlying occupational classand gender effects offer the opportunity for greater North-South co-operation inpublic health.
In order to explore these opportunities, a study of areas of potential North-Southco-operation should be carried out. It should include a systematic andcomprehensive analysis of what currently works well and what could be improved.The study should also look at mechanisms to support North-South co-operation.
Significant opportunities to develop joint work for public health on the island, andwith different countries in the British Isles and internationally should be explored.Diseases with particularly high mortality rates on the island such as circulatorydiseases and cancer offer the greatest opportunities for public health gain.
Strengthening Mortality Statistics on the IslandThe island’s mortality collections are valuable sources of information.
The collections within each jurisdiction need to be strengthened, and differencesin data collection protocols and procedures reduced, so that North-South data canbe combined and compared in a more meaningful way.
In order to enhance the contribution of the mortality collections on the island,North-South co-ordination should be strengthened, and adequate resourcesallocated to these important sources of information:
• An all Ireland group should be established to advise on the furtherdevelopment of the mortality collections on the island and to co-ordinatethese developments in order to maximise comparability. Promotion ofinternational standards would be an important element of the group’s work.Further improvements in data quality would follow if issues specific to theisland of Ireland were addressed. Attempts to achieve greater co-ordinationneed to recognise that the mortality collections operate within differentlegislative and administrative frameworks. The need for consistency between
16
Inequalities in Mortality
Northern Ireland collections and United Kingdom protocols is recognised.• Part Three of this report outlines a number of specific recommendations
concerning the data items on the death records, data collection protocols andprocedures, population estimates, and analysis and reporting that wouldgreatly increase the contribution of mortality statistics on the island.
The remarkable consistency of occupational class effects for many different causesof death, confirms the importance of occupation and occupational class data ondeath records and census files. The relatively poor quality of these data items onthe mortality, and other official statistics collections, is a fundamental impedimentto understanding socio-economic inequalities on the island.
The quality of occupation and occupational class data on the mortality collectionsshould be reviewed and strengthened. Particular focus should be placed onfemales, those outside the working ages and unemployed people.
Section 5.3 of Part Three outlines a number of specific recommendations thatwould greatly increase the quality and value of the occupation and occupationalclass data.
Greater Use of Mortality DataThe mortality collections on the island are under-utilised sources of information.
In order to facilitate international as well as North-South comparisons, thepublication of routine mortality reports in each jurisdiction should, as far aspractical, be based on standardised analysis and reporting procedures.
The scope of current analyses should be widened. These analyses should includestudies focussing on the island of Ireland, and also exploit internationalcomparisons.
Three all Ireland projects which should have high priority are:
• A more detailed analysis of occupational class differences in mortality in orderto increase understanding of the socio-economic inequalities on the island
• A comparative study of recent trends in mortality in order to explore theimpact of the social, political and economic changes experienced recently inthe two jurisdictions
• An in-depth investigation of variation in mortality on the island in order toplace the North-South differences into an appropriate context

17
Part One: Summary
International studies which should have high priority would be comparativestudies designed to exploit international understanding of socio-economicinequalities in mortality.
Learning About DifferencesThe all causes mortality rate in the South was 6% higher than it was in the North.For several specific causes of death there were important North-South differences.Better understanding of these differences may suggest ways to improve theprevention and treatment of underlying conditions.
Further mortality analyses will provide a clearer picture of the patterns of mortalityand provide some insight into possible causes. However, broader studies which gobeyond basic socio-demographic factors are needed to increase the understandingof the health inequalities on the island.
Broader public health research looking at a range of socio-economic andenvironmental factors that influence health and well being should be supported.Studies drawing on the expertise of different disciplines in the health and socialsciences would provide a valuable foundation for North-South collaboration inpublic health research. They should be co-ordinated with the health researchprogrammes of the two jurisdictions so that advances in new knowledge aretranslated into public health gains on both sides of the border.
Such research should include comparative studies within the island as well ascomparisons with different countries in the British Isles and Europe. Much can belearnt from comparing urban and non-urban areas on the island and fromcomparing the North and South. International studies which should have highpriority would be comparative studies which build on international successes intackling socio-economic inequalities in health.
1.4 Summary Mortality Figures and TablesMain Causes of Death (Figure 1.4.1)In both jurisdictions, the leading causes of death (in order of the number ofdeaths) were circulatory diseases (45%), malignant neoplasms (24%), respiratorydiseases (15%), and injuries and poisonings (4%).
The percentage of deaths due to diseases of the circulatory system in the North and the South were very similar. The same was true for deaths due to malignantneoplasms, and injury and poisonings. The percentage of all deaths in the Southdue to respiratory diseases was slightly higher in the North than it was in the South.

18
Inequalities in Mortality
Circulatory diseases. (Figure 1.4.2)In both jurisdictions, ischaemic heart disease was responsible for more than half ofall deaths from circulatory diseases. Ischaemic heart disease and cerebrovasulardisease were responsible for a higher percentage of the deaths from circulatorydiseases in the North, while other heart disease and other circulatory diseaseswere responsible for a higher percentage in the South.
FIGURE 1.4.1
MAIN CAUSES OF
DEATH ON THE
ISLAND OF
IRELAND, BY
JURISDICTION
(1989-1998)
FIGURE 1.4.2
PRINCIPAL
CATEGORIES OF
DEATHS FROM
CIRCULATORY
DISEASES ON THE
ISLAND OF
IRELAND, BY
JURISDICTION
(1989-1998)
50%
40
30%
20
10%
CAUSE OF DEATH
All other causes
Circulatory diseases
Malignant neoplasms
Respiratory diseases
Injury andpoisoning
All
NI
RoI
70%
60
50%
40
30%
20
10%
CAUSE OF DEATH
Ischaemic heart diseases
Cerebrovascular diseases
Other heart diseases
Other circulatory diseases
All
NI
RoI

19
Part One: Summary
Malignant neoplasms. (Figure 1.4.3)The largest percentage of fatal cancers occurred in thelarynx/trachea/bronchus/lung. They accounted for about one fifth of all cancerdeaths, with a slightly higher proportion in the North. This was followed by thecolon (9% of all cancer deaths), female breast (9% of all cancer deaths), thelymph/haematopoietic tissue (8%) and the male prostate (6% of all cancer deaths).
Respiratory diseases. (Figure 1.4.4)Over half of all deaths from respiratory diseases on the island were due topneumonia, with the percentage being much higher in the North than it was in theSouth. Chronic lower respiratory disease accounted for another third of such deaths,with the percentage in the South being much higher than it was in the North.
FIGURE 1.4.4
PRINCIPAL
CATEGORIES OF
DEATHS FROM
RESPIRATORY
DISEASES ON THE
ISLAND OF
IRELAND,BY
JURISIDICTION
(1989-1998)
FIGURE 1.4.3
PRINCIPAL SITES
OF FATAL
MALIGNANT
NEOPLASMS ON
THE ISLAND OF
IRELAND,BY
JURISDICTION
(1989-1998)
35%
30
25%
20
15%
10
05%
CAUSE OF DEATH
Larynx/trachea/bronchus/lungLarynx/trachea/bronchus/lung
Colon Breast(female)
Lymph/haemat/tissue
Prostate(male)
Stomach Oesophagus Rectum and anus
All other sites
70%
60
50%
40
30%
20
10%
CAUSE OF DEATH
Influenza Other respiratorydiseases
PneumoniaPneumonia Chronic lowerrespiratory diseases
Asthma
All
NI
RoI
20
Inequalities in Mortality
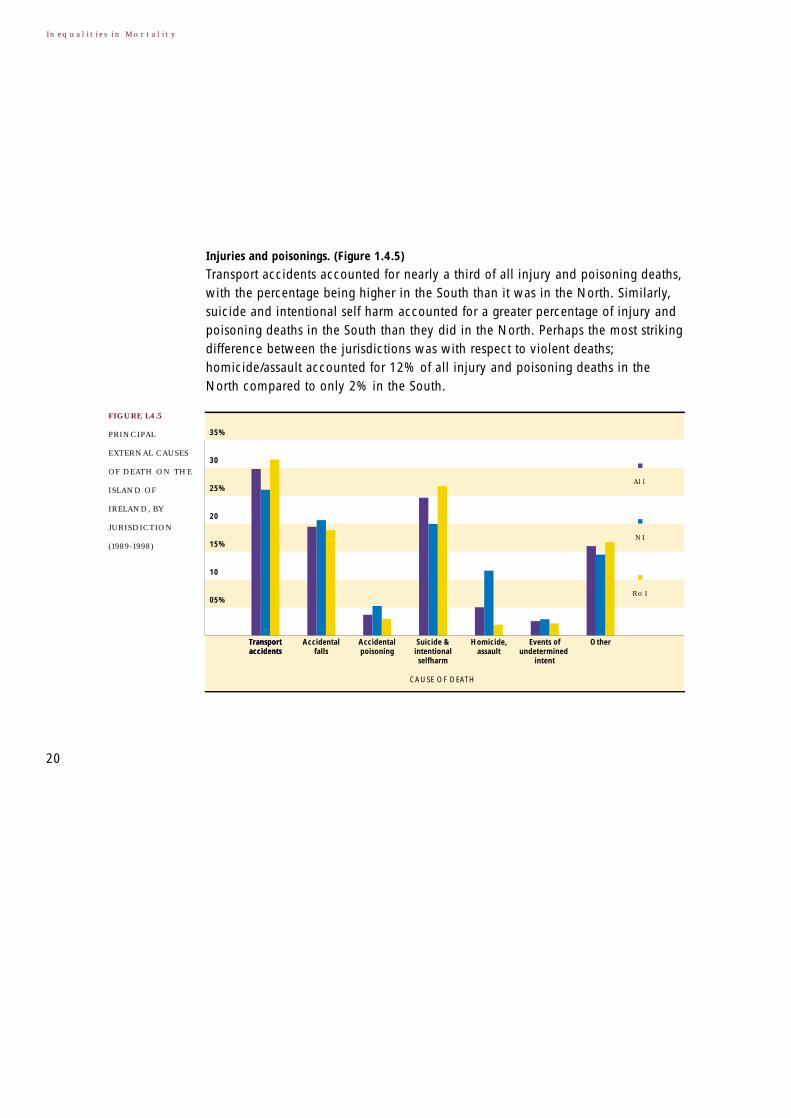
Injuries and poisonings. (Figure 1.4.5)
Transport accidents accounted for nearly a third of all injury and poisoning deaths,with the percentage being higher in the South than it was in the North. Similarly,suicide and intentional self harm accounted for a greater percentage of injury andpoisoning deaths in the South than they did in the North. Perhaps the most strikingdifference between the jurisdictions was with respect to violent deaths;homicide/assault accounted for 12% of all injury and poisoning deaths in theNorth compared to only 2% in the South.
35%
30
25%
20
15%
10
05%
CAUSE OF DEATH
Transport accidentsTransport accidents
Accidental falls
Accidental poisoning
Suicide & intentional selfharm
Homicide, assault
Events of undetermined
intent
Other
All
NI
RoI
FIGURE 1.4.5
PRINCIPAL
EXTERNAL CAUSES
OF DEATH ON THE
ISLAND OF
IRELAND, BY
JURISDICTION
(1989-1998)
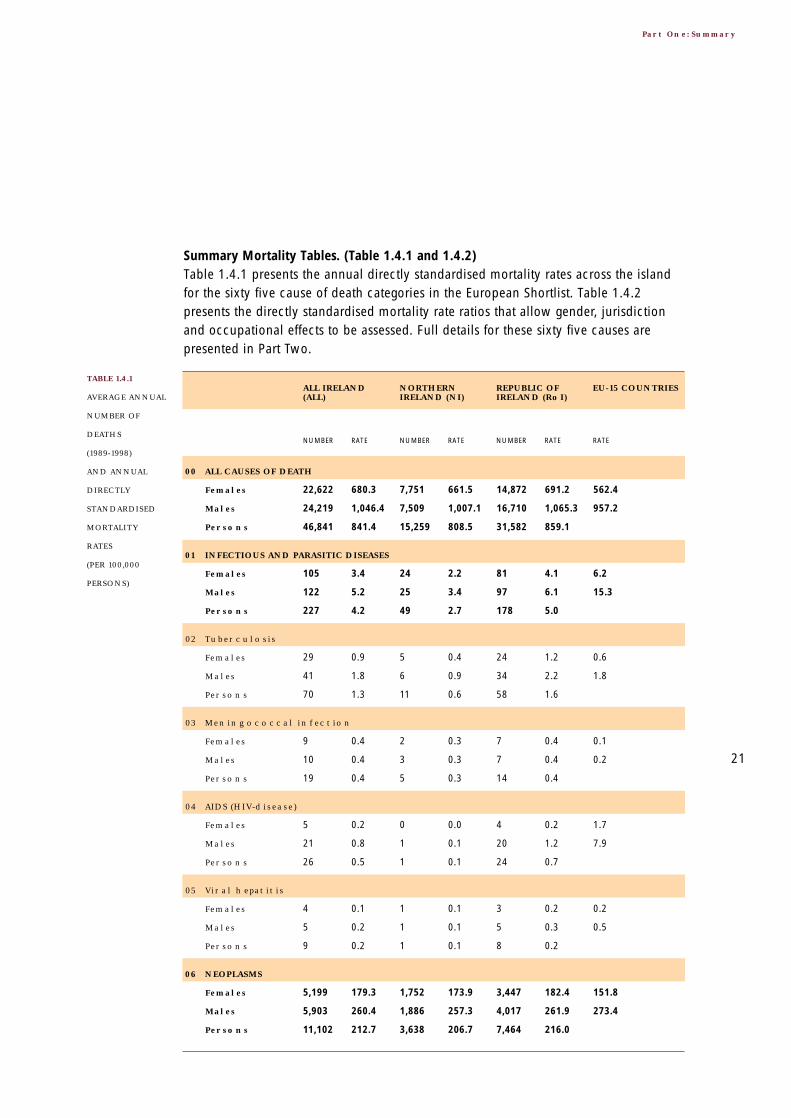
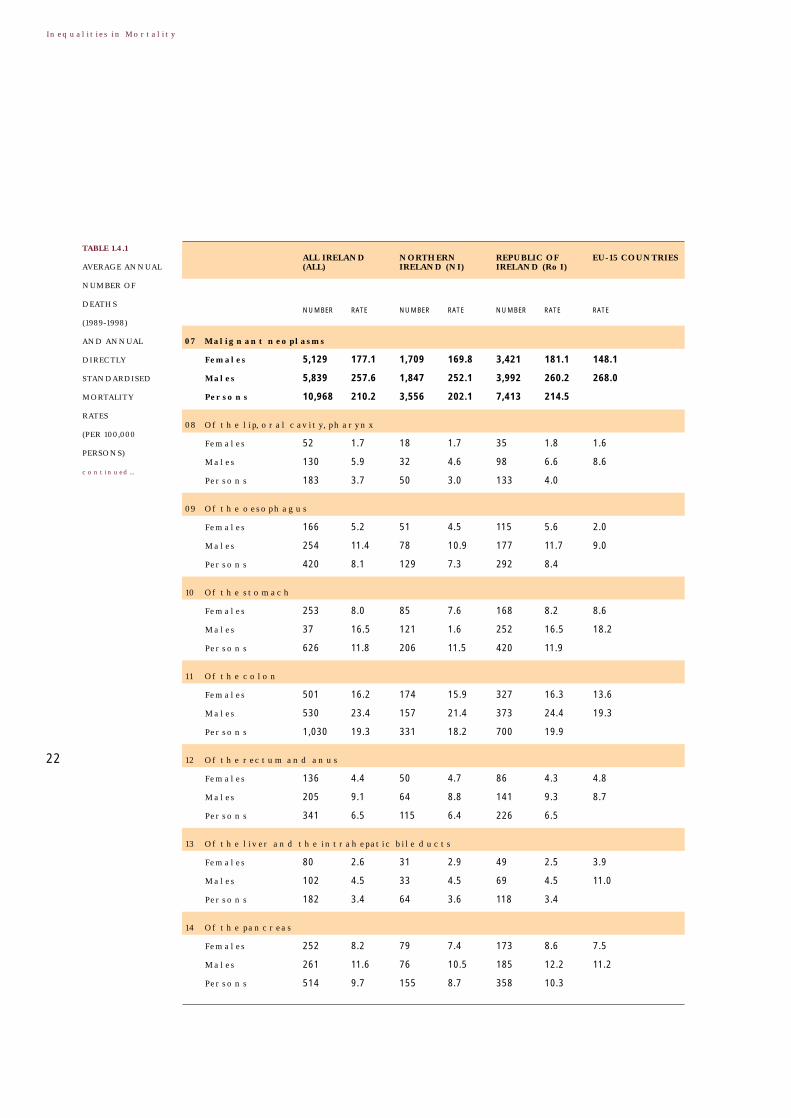
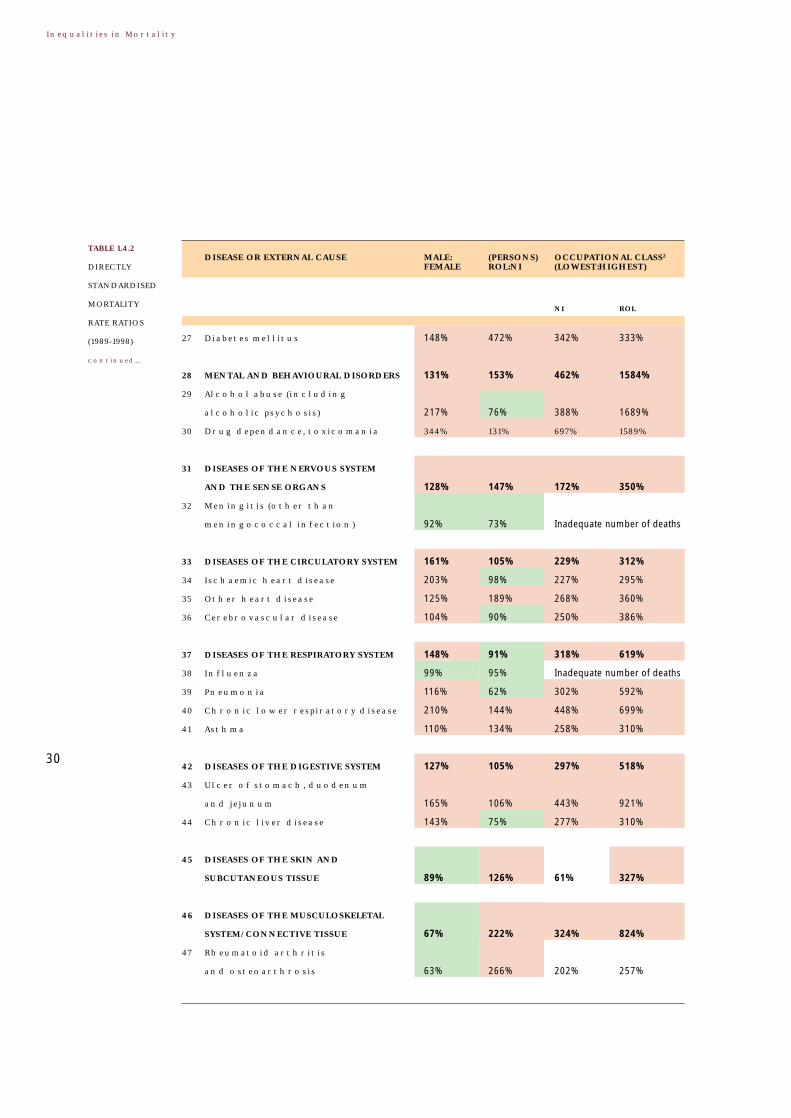
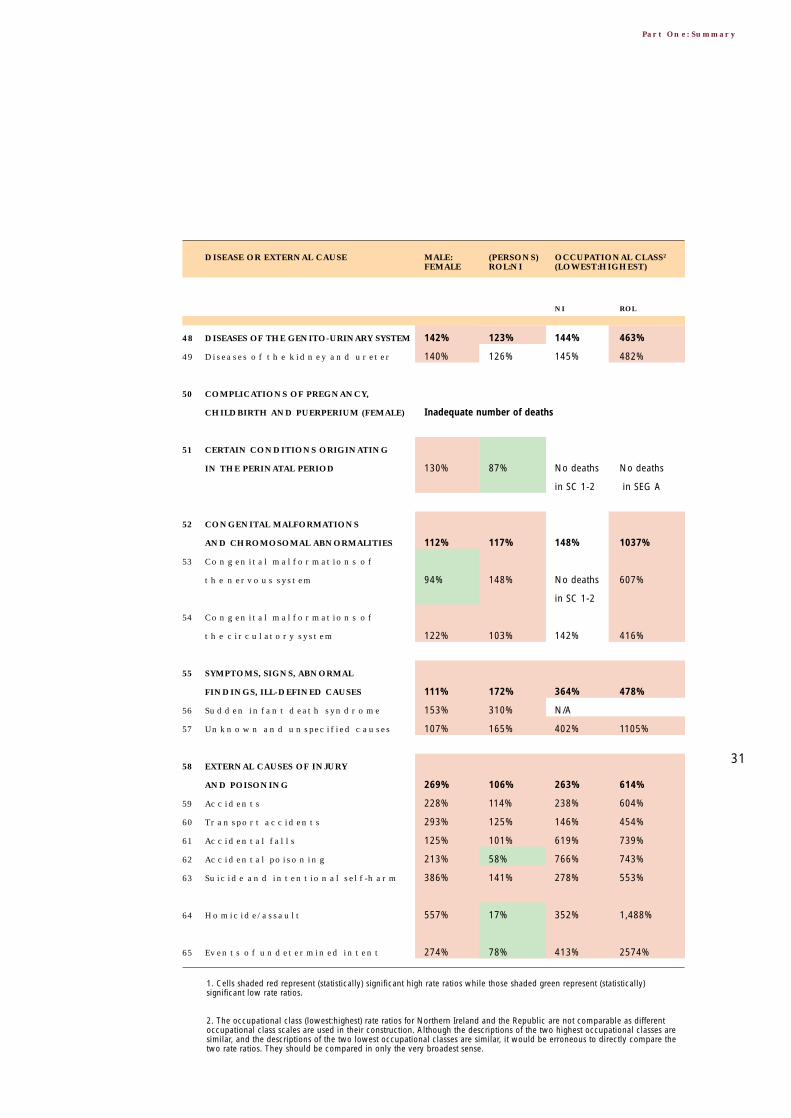
Summary Mortality Tables. (Table 1.4.1 and 1.4.2)Table 1.4.1 presents the annual directly standardised mortality rates across the islandfor the sixty five cause of death categories in the European Shortlist. Table 1.4.2presents the directly standardised mortality rate ratios that allow gender, jurisdictionand occupational effects to be assessed. Full details for these sixty five causes arepresented in Part Two.
21
Part One: Summary
22,622
24,219
46,841
680.3
1,046.4
841.4
7,751
7,509
15,259
661.5
1,007.1
808.5
14,872
16,710
31,582
691.2
1,065.3
859.1
562.4
957.2
105
122
227
3.4
5.2
4.2
24
25
49
2.2
3.4
2.7
81
97
178
4.1
6.1
5.0
6.2
15.3
01 INFECTIOUS AND PARASITIC DISEASES
00 ALL CAUSES OF DEATH
ALL IRELAND(ALL)
NORTHERNIRELAND (NI)
REPUBLIC OFIRELAND (RoI)
EU-15 COUNTRIES
NUMBER RATE NUMBER RATE NUMBER RATE RATE
Females
Males
Persons
29
41
70
0.9
1.8
1.3
5
6
11
0.4
0.9
0.6
24
34
58
1.2
2.2
1.6
0.6
1.8
02 Tuberculosis
Females
Males
Persons
9
10
19
0.4
0.4
0.4
2
3
5
0.3
0.3
0.3
7
7
14
0.4
0.4
0.4
0.1
0.2
03 Meningococcal infection
Females
Males
Persons
5
21
26
0.2
0.8
0.5
0
1
1
0.0
0.1
0.1
4
20
24
0.2
1.2
0.7
1.7
7.9
04 AIDS (HIV-disease)
Females
Males
Persons
4
5
9
0.1
0.2
0.2
1
1
1
0.1
0.1
0.1
3
5
8
0.2
0.3
0.2
0.2
0.5
05 Viral hepatitis
Females
Males
Persons
5,199
5,903
11,102
179.3
260.4
212.7
1,752
1,886
3,638
173.9
257.3
206.7
3,447
4,017
7,464
182.4
261.9
216.0
151.8
273.4
06 NEOPLASMS
Females
Males
Persons
Females
Males
Persons
TABLE 1.4.1
AVERAGE ANNUAL
NUMBER OF
DEATHS
(1989-1998)
AND ANNUAL
DIRECTLY
STANDARDISED
MORTALITY
RATES
(PER 100,000
PERSONS)
22
Inequalities in Mortality
5,129
5,839
10,968
177.1
257.6
210.2
1,709
1,847
3,556
169.8
252.1
202.1
3,421
3,992
7,413
181.1
260.2
214.5
148.1
268.0
52
130
183
1.7
5.9
3.7
18
32
50
1.7
4.6
3.0
35
98
133
1.8
6.6
4.0
1.6
8.6
08 Of the lip, oral cavity, pharynx
07 Malignant neoplasms
ALL IRELAND(ALL)
NORTHERNIRELAND (NI)
REPUBLIC OFIRELAND (RoI)
EU-15 COUNTRIES
NUMBER RATE NUMBER RATE NUMBER RATE RATE
Females
Males
Persons
166
254
420
5.2
11.4
8.1
51
78
129
4.5
10.9
7.3
115
177
292
5.6
11.7
8.4
2.0
9.0
09 Of the oesophagus
Females
Males
Persons
253
37
626
8.0
16.5
11.8
85
121
206
7.6
1.6
11.5
168
252
420
8.2
16.5
11.9
8.6
18.2
10 Of the stomach
Females
Males
Persons
501
530
1,030
16.2
23.4
19.3
174
157
331
15.9
21.4
18.2
327
373
700
16.3
24.4
19.9
13.6
19.3
11 Of the colon
Females
Males
Persons
136
205
341
4.4
9.1
6.5
50
64
115
4.7
8.8
6.4
86
141
226
4.3
9.3
6.5
4.8
8.7
12 Of the rectum and anus
Females
Males
Persons
80
102
182
2.6
4.5
3.4
31
33
64
2.9
4.5
3.6
49
69
118
2.5
4.5
3.4
3.9
11.0
13 Of the liver and the intrahepatic bile ducts
Females
Males
Persons
252
261
514
8.2
11.6
9.7
79
76
155
7.4
10.5
8.7
173
185
358
8.6
12.2
10.3
7.5
11.2
14 Of the pancreas
Females
Males
Persons
Females
Males
Persons
TABLE 1.4.1
AVERAGE ANNUAL
NUMBER OF
DEATHS
(1989-1998)
AND ANNUAL
DIRECTLY
STANDARDISED
MORTALITY
RATES
(PER 100,000
PERSONS)
continued...

23
Part One: Summary
790
1,606
2,396
27.4
71.6
46.7
265
545
810
26.9
75.0
46.9
525
1061
1586
27.7
70.0
46.6
15.0
78.3
49
38
86
1.7
1.7
1.7
15
12
27
1.5
1.6
1.5
34
26
60
1.9
1.7
1.8
1.7
2.3
16 Of the skin
15 Of the larynx and trachea/bronchus/lung
ALL IRELAND(ALL)
NORTHERNIRELAND (NI)
REPUBLIC OFIRELAND (RoI)
EU-15 COUNTRIES
NUMBER RATE NUMBER RATE NUMBER RATE RATE
Females
Males
Persons
954 36.6 311 34.5 643 37.2 30.5
17 Of the (female) breast
105 4.2 34 4.0 71 4.3 3.0
18 Of the cervix uteri
97 3.3 32 2.9 65 3.5 4.7
19 Of other parts of uterus
302 11.5 90 10.0 212 12.3 8.9
20 Of the ovary
689 29.2 198 26.0 491 30.8 27.8
21 Of the prostate
72
117
189
2.5
5.3
3.7
27
41
68
2.7
5.7
4.0
45
76
121
2.4
5.1
3.6
2.7
6.3
22 Of the kidney
Females
Males
Persons
81
170
252
2.4
7.4
4.5
30
59
90
2.6
7.9
4.7
51
111
162
2.4
7.1
4.4
2.5
11.5
23 Of the bladder
Females
Males
Persons
385
473
859
13.0
20.6
16.4
123
143
266
12.1
19.4
15.2
263
330
593
13.5
21.2
17.0
11.7
18.5
24 Of the lymph/haematopoietic tissue
Females
Males
Persons
Females
Males
Persons

24
Inequalities in Mortality
77
68
145
2.3
2.9
2.5
16
11
28
1.4
1.5
1.4
61
57
117
2.7
3.6
3.1
2.1
3.1
327
313
640
10.0
13.5
11.5
44
35
79
4.2
4.7
4.4
283
278
562
13.2
17.7
15.2
16.9
18.0
26 ENDOCRINE, NUTRITIONAL AND METABOLIC DISEASES
25 DISEASES OF THE BLOOD AND BLOOD-FORMING ORGANS, IMMUNOLOGICAL DISORDERS
ALL IRELAND(ALL)
NORTHERNIRELAND (NI)
REPUBLIC OFIRELAND (RoI)
EU-15 COUNTRIES
NUMBER RATE NUMBER RATE NUMBER RATE RATE
Females
Males
Persons
239
243
482
7.1
10.5
8.6
26
20
46
2.4
2.7
2.5
213
223
436
9.8
14.3
11.8
13.5
14.3
27 Diabetes mellitus
Females
Males
Persons
189
170
359
5.5
7.3
6.5
43
40
83
3.8
5.7
4.8
147
129
276
6.5
8.0
7.3
9.5
14.2
28 MENTAL AND BEHAVIOURAL DISORDERS
Females
Males
Persons
24
50
73
1.1
2.3
1.7
9
19
28
1.2
2.8
2.0
15
31
46
1.0
2.1
1.5
1.1
4.9
29 Alcohol abuse (including alcoholic psychosis)
Females
Males
Persons
11
38
49
0.4
1.5
1.0
3
8
12
0.1
1.2
0.8
7
30
37
0.4
1.7
1.1
0.4
1.7
30 Drug dependEnce, toxicomania
Females
Males
Persons
414
392
806
12.9
16.6
14.5
105
97
201
9.9
12.8
11.1
310
296
605
14.6
18.4
16.3
11.2
15.8
31 DISEASES OF THE NERVOUS SYSTEM AND THE SENSE ORGANS
Females
Males
Persons
10
8
18
0.4
0.3
0.3
4
3
7
0.5
0.4
0.4
5
5
11
0.3
0.3
0.3
0.3
0.4
32 Meningitis (other than meningococcal infection)
Females
Males
Persons
Females
Males
Persons
TABLE 1.4.1
AVERAGE ANNUAL
NUMBER OF
DEATHS
(1989-1998)
AND ANNUAL
DIRECTLY
STANDARDISED
MORTALITY
RATES
(PER 100,000
PERSONS)
continued...

25
Part One: Summary
10,281
10,732
21,013
290.8
467.3
370.1
3,564
3,357
6,921
285.3
452.9
358.2
6,716
7,375
14,092
294.2
474.2
376.7
236.3
371.2
5,106
6,817
11,922
147.3
299.7
215.4
1,873
2,241
4,114
153.2
304.9
218.5
3,233
4,576
7,808
144.3
297.2
214.0
81.7
170.0
34 Ischaemic heart disease
33 DISEASES OF THE CIRCULATORY SYSTEM
ALL IRELAND(ALL)
NORTHERNIRELAND (NI)
REPUBLIC OFIRELAND (RoI)
EU-15 COUNTRIES
NUMBER RATE NUMBER RATE NUMBER RATE RATE
Females
Males
Persons
1,331
1,044
2,375
35.8
44.6
39.9
312
204
516
23.6
27.0
25.2
1,019
840
1,859
42.6
53.0
47.6
47.4
64.4
35 Other heart disease
Females
Males
Persons
2,745
1,853
4,598
75.9
79.9
77.9
1,062
629
1,690
81.9
83.2
83.2
1,683
1,225
2,908
72.7
77.4
75.1
70.3
86.4
36 Cerebrovascular disease
Females
Males
Persons
3,658
3,530
7,188
101.0
149.9
0.9
1,461
1,183
2,643
112.2
155.5
29.0
2,197
2,347
4,544
94.8
147.3
116.6
39.1
84.0
37 DISEASES OF THE RESPIRATORY SYSTEM
Females
Males
Persons
26
16
43
0.7
0.7
0.7
9
6
15
0.7
0.7
0.7
17
11
28
0.7
0.7
0.7
0.4
0.5
38 Influenza
Females
Males
Persons
2,212
1,588
3,800
57.8
67.0
61.8
1,067
683
1,750
77.2
89.1
82.1
1,145
905
2,050
46.9
56.4
51.0
18.2
28.2
39 Pneumonia
Females
Males
Persons
1,054
1,577
2,631
32.1
67.3
46.1
283
395
678
25.7
52.5
35.7
771
1182
1953
35.6
74.4
51.6
14.4
42.7
40 Chronic lower respiratory disease
Females
Males
Persons
Females
Males
Persons

26
Inequalities in Mortality
89
79
169
3.1
3.5
3.3
27
18
45
2.9
2.5
2.7
63
61
124
3.3
3.9
3.6
2.4
3.3
711
620
1331
21.3
27.1
24.0
242
190
432
20.9
26.0
23.3
469
430
899
21.7
27.6
24.4
25.6
45.4
42 DISEASES OF THE DIGESTIVE SYSTEM
41 Asthma
ALL IRELAND(ALL)
NORTHERNIRELAND (NI)
REPUBLIC OFIRELAND (RoI)
EU-15 COUNTRIES
NUMBER RATE NUMBER RATE NUMBER RATE RATE
Females
Males
Persons
141
150
291
3.9
6.5
5.0
49
46
95
3.9
6.2
4.9
92
104
196
4.0
6.6
5.2
2.4
4.3
43 Ulcer of stomach, duodenum and jejunum
Females
Males
Persons
84
102
186
3.3
4.8
4.0
35
38
73
4.1
5.6
4.9
49
64
113
2.9
4.4
3.6
9.3
22.4
44 Chronic liver disease
Females
Males
Persons
65
38
102
1.8
1.6
1.7
21
10
30
1.6
1.3
1.5
44
28
72
1.9
1.8
1.9
1.3
1.0
45 DISEASES OF THE SKIN AND SUBCUTANEOUS TISSUE
Females
Males
Persons
151
70
221
4.5
3.0
3.9
29
12
42
2.4
1.7
2.1
122
58
180
5.6
3.7
4.8
3.4
2.3
46 DISEASES OF THE MUSCULOSKELETAL SYSTEM/CONNECTIVE TISSUE
Females
Males
Persons
80
34
114
2.3
1.5
2.0
14
5
19
1.1
0.7
0.9
66
29
95
3.0
1.8
2.5
1.2
0.6
47 Rheumatoid arthritis and osteoarthrosis
Females
Males
Persons
436
405
841
12.1
17.2
14.1
141
112
253
11.0
14.7
12.3
295
294
589
12.7
18.4
15.1
7.5
12.4
48 DISEASES OF THE GENITO-URINARY SYSTEM
Females
Males
Persons
Females
Males
Persons
TABLE 1.4.1
AVERAGE ANNUAL
NUMBER OF
DEATHS
(1989-1998)
AND ANNUAL
DIRECTLY
STANDARDISED
MORTALITY
RATES
(PER 100,000
PERSONS)
continued...

27
Part One: Summary
325
300
625
9.1
12.8
10.6
80
105
185
8.2
10.5
9.0
221
220
441
9.6
13.8
11.4
2 0.1 0 0.0 2 0.1 0.1
50 COMPLICATIONS OF PREGNANCY, CHILDBIRTH AND PUERPERIUM (FEMALE)
49 Diseases of the kidney and ureter
ALL IRELAND(ALL)
NORTHERNIRELAND (NI)
REPUBLIC OFIRELAND (RoI)
EU-15 COUNTRIES
NUMBER RATE NUMBER RATE NUMBER RATE RATE
80
110
191
3.4
4.4
3.9
30
40
69
3.8
4.8
4.3
51
71
122
3.2
4.2
3.7
3.5
4.6
51 CERTAIN CONDITIONS ORIGINATING IN THE PERINATAL PERIOD
Females
Males
Persons
135
154
289
5.5
6.1
5.8
37
47
84
4.6
5.8
5.2
98
107
204
5.9
6.3
6.1
3.7
4.3
52 CONGENITAL MALFORMATIONS AND CHROMOSOMAL ABNORMALITIES
Females
Males
Persons
28
27
55
1.1
1.0
1.1
7
6
14
0.9
0.7
0.8
21
20
41
1.2
1.2
1.2
0.5
0.5
53 Congenital malformations of the nervous system
Females
Males
Persons
44
56
100
1.8
2.2
2.0
13
19
32
1.7
2.3
2.0
31
37
69
1.9
2.2
2.0
1.6
2.0
54 Congenital malformations of the circulatory system
Females
Males
Persons
156
122
278
4.6
5.1
4.9
40
24
64
3.3
3.1
3.3
116
98
214
5.3
6.0
5.7
18.3
27.2
55 SYMPTOMS, SIGNS, ABNORMAL FINDINGS, ILL-DEFINED CAUSES
Females
Males
Persons
25
41
66
1.1
1.6
1.4
4
5
9
0.5
0.6
0.6
21
36
57
1.3
2.2
1.8
0.8
1.3
56 Sudden infant death syndrome
Females
Males
Persons
56
39
95
1.6
1.7
1.6
11
10
20
1.0
1.3
1.2
45
30
75
1.9
1.9
1.9
8.3
16.4
57 Unknown and unspecified causes
Females
Males
Persons
Females
Males
Persons

28
Inequalities in Mortality
633
1,450
2,083
21.6
58.0
39.6
203
441
644
20.8
56.0
38.1
430
1,009
1,439
22.1
59.0
40.4
25.8
64.9
498
919
1417
16.1
36.7
26.3
157
262
419
15.0
33.4
24.1
341
657
998
16.7
38.3
27.5
17.8
40.8
59 Accidents
58 EXTERNAL CAUSES OF INJURY AND POISONING
ALL IRELAND(ALL)
NORTHERNIRELAND (NI)
REPUBLIC OFIRELAND (RoI)
EU-15 COUNTRIES
NUMBER RATE NUMBER RATE NUMBER RATE RATE
Females
Males
Persons
161
454
616
5.9
17.2
11.4
46
121
167
5.1
14.6
9.8
115
333
449
6.2
18.4
12.3
6.1
19.1
60 Transport accidents
Females
Males
Persons
223
178
401
6.1
7.7
7.0
72
60
132
5.7
8.2
7.0
151
118
269
6.4
7.4
7.1
7.0
9.3
61 Accidental falls
Females
Males
Persons
24
52
76
1.0
2.1
1.5
12
22
33
1.4
2.9
2.1
13
30
42
0.8
1.7
1.2
0.9
1.8
62 Accidental poisoning
Females
Males
Persons
103
406
509
4.2
16.3
10.2
29
98
127
3.7
12.4
8.0
74
308
382
4.5
18.1
11.2
5.8
18.5
63 Suicide and intentional self-harm
Females
Males
Persons
16
85
101
0.6
3.3
2.0
10
64
74
1.1
8.0
4.6
6
21
27
0.4
1.2
0.8
0.7
1.7
64 Homicide/assault
Females
Males
Persons
14
36
50
0.5
1.5
1.0
6
13
19
0.7
1.7
1.2
8
23
31
0.5
1.4
0.9
1.3
3.5
65 Events of undetermined intent
Females
Males
Persons
Females
Males
Persons
TABLE 1.4.1
AVERAGE ANNUAL
NUMBER OF
DEATHS
(1989-1998)
AND ANNUAL
DIRECTLY
STANDARDISED
MORTALITY
RATES
(PER 100,000
PERSONS)
continued...

29
Part One: Summary
00 ALL CAUSES OF DEATH 154% 106% 235% 341%
01 INFECTIOUS AND PARASITIC DISEASES 152% 182% 163% 472%
02 Tuberculosis 192% 262% 402% 1204%
03 Meningococcal infection 103% 124% Inadequate number of deaths
04 AIDS (HIV-disease) 487% 851%
05 Viral hepatitis 192% 291%
06 NEOPLASMS 145% 105% 214% 224%
07 Malignant neoplasms 146% 106% 217% 223%
08 Of the lip, oral cavity, pharynx 341% 134% 273% 248%
09 Of the oesophagus 218% 115% 252% 238%
10 Of the stomach 207% 104% 218% 427%
11 Of the colon 145% 110% 164% 151%
12 Of the rectum and anus 206% 101% 163% 126%
13 Of the liver and the intrahepatic
bile ducts 172% 94% 159% 152%
14 Of the pancreas 142% 118% 207% 165%
15 Of the larynx and trachea/
bronchus/lung 262% 99% 387% 411%
16 Of the skin 96% 116% 70% 134%
17 Of the (female) breast N/A 108% N/A N/A
18 Of the cervix uteri N/A 106% N/A N/A
19 Of other parts of uterus N/A 118% N/A N/A
20 Of the ovary N/A 123% N/A N/A
21 Of the prostate N/A 119% 132% 117%
22 Of the kidney 214% 91% 168% 95%
23 Of the bladder 302% 94% 290% 164%
24 Of the lymph/haematopoietic tissue 158% 112% 152% 255%
25 DISEASES OF THE BLOOD AND BLOOD-
FORMING ORGANS, IMMUNOLOGICAL
DISORDERS 127% 248% 272% 205%
26 ENDOCRINE, NUTRITIONAL AND
METABOLIC DISEASES 135% 345% 122% 331%
NI ROL
DISEASE OR EXTERNAL CAUSE MALE: (PERSONS) OCCUPATIONAL CLASS2
FEMALE ROL:NI (LOWEST:HIGHEST)
TABLE 1.4.2
DIRECTLY
STANDARDISED
MORTALITY
RATE RATIOS
(1989-1998)
30
Inequalities in Mortality
27 Diabetes mellitus 148% 472% 342% 333%
28 MENTAL AND BEHAVIOURAL DISORDERS 131% 153% 462% 1584%
29 Alcohol abuse (including
alcoholic psychosis) 217% 76% 388% 1689%
30 Drug dependance, toxicomania 344% 131% 697% 1589%
31 DISEASES OF THE NERVOUS SYSTEM
AND THE SENSE ORGANS 128% 147% 172% 350%
32 Meningitis (other than
meningococcal infection) 92% 73% Inadequate number of deaths
33 DISEASES OF THE CIRCULATORY SYSTEM 161% 105% 229% 312%
34 Ischaemic heart disease 203% 98% 227% 295%
35 Other heart disease 125% 189% 268% 360%
36 Cerebrovascular disease 104% 90% 250% 386%
37 DISEASES OF THE RESPIRATORY SYSTEM 148% 91% 318% 619%
38 Influenza 99% 95% Inadequate number of deaths
39 Pneumonia 116% 62% 302% 592%
40 Chronic lower respiratory disease 210% 144% 448% 699%
41 Asthma 110% 134% 258% 310%
42 DISEASES OF THE DIGESTIVE SYSTEM 127% 105% 297% 518%
43 Ulcer of stomach, duodenum
and jejunum 165% 106% 443% 921%
44 Chronic liver disease 143% 75% 277% 310%
45 DISEASES OF THE SKIN AND
SUBCUTANEOUS TISSUE 89% 126% 61% 327%
46 DISEASES OF THE MUSCULOSKELETAL
SYSTEM/CONNECTIVE TISSUE 67% 222% 324% 824%
47 Rheumatoid arthritis
and osteoarthrosis 63% 266% 202% 257%
NI ROL
DISEASE OR EXTERNAL CAUSE MALE: (PERSONS) OCCUPATIONAL CLASS2
FEMALE ROL:NI (LOWEST:HIGHEST)
TABLE 1.4.2
DIRECTLY
STANDARDISED
MORTALITY
RATE RATIOS
(1989-1998)
continued...
31
Part One: Summary
48 DISEASES OF THE GENITO-URINARY SYSTEM 142% 123% 144% 463%
49 Diseases of the kidney and ureter 140% 126% 145% 482%
50 COMPLICATIONS OF PREGNANCY,
CHILDBIRTH AND PUERPERIUM (FEMALE) Inadequate number of deaths
51 CERTAIN CONDITIONS ORIGINATING
IN THE PERINATAL PERIOD 130% 87% No deaths No deaths
in SC 1-2 in SEG A
52 CONGENITAL MALFORMATIONS
AND CHROMOSOMAL ABNORMALITIES 112% 117% 148% 1037%
53 Congenital malformations of
the nervous system 94% 148% No deaths 607%
in SC 1-2
54 Congenital malformations of
the circulatory system 122% 103% 142% 416%
55 SYMPTOMS, SIGNS, ABNORMAL
FINDINGS, ILL-DEFINED CAUSES 111% 172% 364% 478%
56 Sudden infant death syndrome 153% 310% N/A
57 Unknown and unspecified causes 107% 165% 402% 1105%
58 EXTERNAL CAUSES OF INJURY
AND POISONING 269% 106% 263% 614%
59 Accidents 228% 114% 238% 604%
60 Transport accidents 293% 125% 146% 454%
61 Accidental falls 125% 101% 619% 739%
62 Accidental poisoning 213% 58% 766% 743%
63 Suicide and intentional self-harm 386% 141% 278% 553%
64 Homicide/assault 557% 17% 352% 1,488%
65 Events of undetermined intent 274% 78% 413% 2574%
NI ROL
DISEASE OR EXTERNAL CAUSE MALE: (PERSONS) OCCUPATIONAL CLASS2
FEMALE ROL:NI (LOWEST:HIGHEST)
1. Cells shaded red represent (statistically) significant high rate ratios while those shaded green represent (statistically)significant low rate ratios.
2. The occupational class (lowest:highest) rate ratios for Northern Ireland and the Republic are not comparable as differentoccupational class scales are used in their construction. Although the descriptions of the two highest occupational classes aresimilar, and the descriptions of the two lowest occupational classes are similar, it would be erroneous to directly compare thetwo rate ratios. They should be compared in only the very broadest sense.

Part Two: Mortality on the Island
2 The European Shortlist of Cause of Death Categories
33
Part Two: Mortality on the Island
Explanatory Notes1 The numbers of deaths reported in Table 2.00.1-Table 2.65.1 are annual numbers
of deaths. Calculations were based on the total numbers of deaths for the period1989-1998, these were ten times (10 x) the numbers in the tables.
2 All mortality rates are annual rates, expressed as number of deaths per 100,000population per year.
3 In all tables and figures, annual numbers of deaths have been rounded to thenearest unit and rates have been rounded to the first decimal place. Rate ratiosused in the text were based on the unrounded values of the two rates, and thenrounded to the nearest unit. These are summarised in Table 1.4.2.
4 When interpreting the results presented in Part Two it is important to distinguishbetween a ‘statistically significant’ difference and a difference that may be‘practically important’ or interesting. See Section 3.3 for further discussion.
5 All directly standardised rates (DSRs) are directly standardised to the WHO’sStandard European Population. This report uses five year age groups 0-4 years, ...,70-74 years with the last age group being 75+ years. See Appendix 4.
6 European rates presented in Table 2.00.1-Table 2.65.1 refer to the directlystandardised rates for the (combined) fifteen European countries for the year 1994,the midpoint of the study period 1989-1998. These fifteen countries are Austria,Belgium, Denmark, Finland, France, Germany, Greece, Ireland, Italy, Luxembourg,Netherlands, Portugal, Spain, Sweden, and the United Kingdom. Directlystandardised rates were provided by the European Commission (10).
7 In Table 2.00.1-Table 2.65.1, the ‘PERSONS’ entry in the NUMBER column maynot be the sum of the ‘FEMALES’ and ‘MALES’ entries because of rounding error.
8 Directly standardised rate ratios (DSRRs) presented in Figure 2.00.2-Figure 2.65.2are the ratio of the DSR for a region to the DSR for the whole island expressed asa percentage. Tests of significance are based on individual confidence intervals(adjusted for multiple comparisons). DSRRs significant at the 1% level are markedon the maps with a dot. The difference between the directly standardised rate for aregion shaded the darkest green and a region shaded the darkest red is at least40% of the rate for the whole island. A detailed map of the study regions in Figure2.00.2–Figure 2.65.2 is given in Figure 2.1.
9 In Figure 2.00.2-Figure 2.65.2, if a health (and social services) board area includesan urban centre then the results for the board include those for the centre. Forexample, the rate in the Eastern HSSB includes deaths that occurred in Belfast LGD.

34
Inequalities in Mortality
10 The occupational class results presented in Figure 2.00.3-Figure 2.65.3 are basedon Social Class in Northern Ireland and Socio-economic Group in the Republic.SC1-2 is the ‘highest’ social classes in Northern Ireland while SC 4-5 is the‘lowest’. SEG A is the ‘highest’ socio-economic group in the Republic while SEG Dis the ‘lowest’. Further details are given in Table 2.1 and Table 2.2.
Figure 2.1
STUDY REGIONS
North WesternHB
Derry LGD
Belfast LGD
Dublin CB
Waterford CB
Cork CB
Limerick CB
Galway CB
EasternHSSB
NorthernHSSB
WesternHSSB
SouthernHSSB
EasternHB
South EasternHB
SouthernHB
Mid WesternHB
Western HB
North EasternHB
MidlandHB
35
Part Two: Mortality on the Island
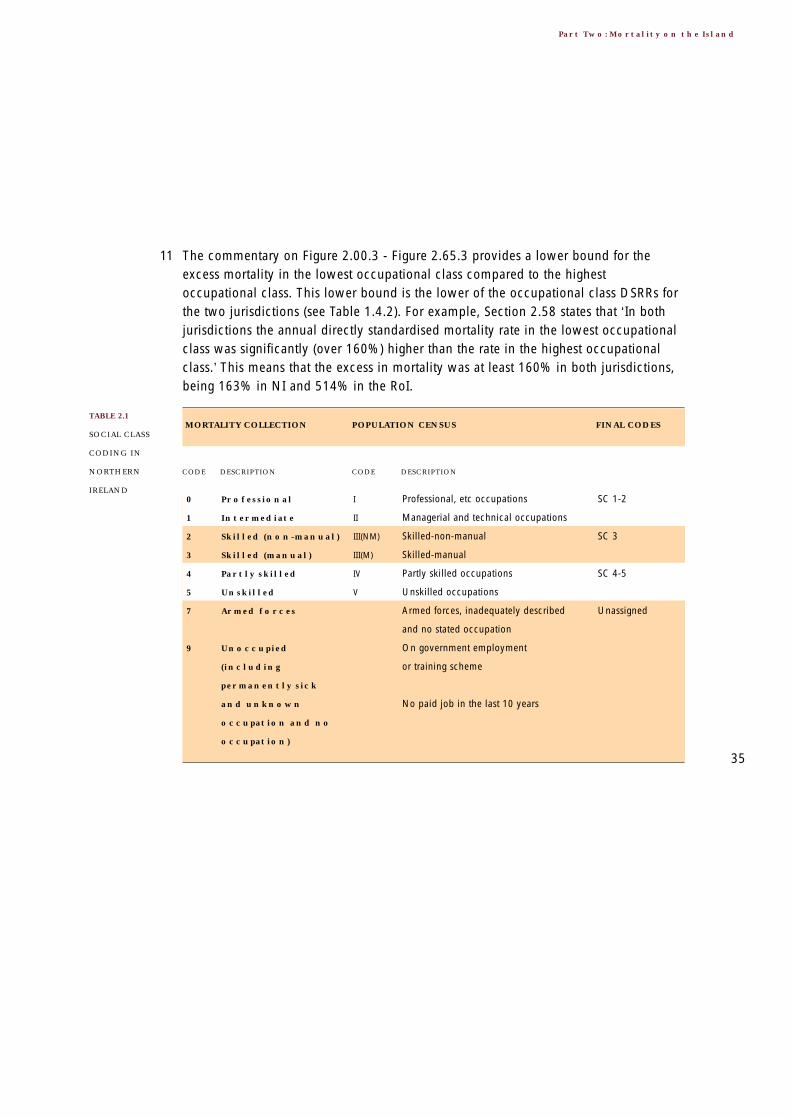
11 The commentary on Figure 2.00.3 - Figure 2.65.3 provides a lower bound for theexcess mortality in the lowest occupational class compared to the highestoccupational class. This lower bound is the lower of the occupational class DSRRs forthe two jurisdictions (see Table 1.4.2). For example, Section 2.58 states that ‘In bothjurisdictions the annual directly standardised mortality rate in the lowest occupationalclass was significantly (over 160%) higher than the rate in the highest occupationalclass.’ This means that the excess in mortality was at least 160% in both jurisdictions,being 163% in NI and 514% in the RoI.
0 Professional I
1 Intermediate II
2 Skilled (non-manual) III(NM)
3 Skilled (manual) III(M)
4 Partly skilled IV
5 Unskilled V
7 Armed forces
9 Unoccupied
(including
permanently sick
and unknown
occupation and no
occupation)
Professional, etc occupations
Managerial and technical occupations
Skilled-non-manual
Skilled-manual
Partly skilled occupations
Unskilled occupations
Armed forces, inadequately described
and no stated occupation
On government employment
or training scheme
No paid job in the last 10 years
SC 1-2
SC 3
SC 4-5
Unassigned
CODE DESCRIPTION CODE DESCRIPTION
MORTALITY COLLECTION POPULATION CENSUS FINAL CODES TABLE 2.1
SOCIAL CLASS
CODING IN
NORTHERN
IRELAND

36
Inequalities in Mortality
0 Farmers 0
1 Farm labourers 1
2 Higher professionals 2
3 Lower professionals 3
4 Employers and
managers 4
5 Salaried employees 5
6 Non-manual wage
earners 6
7 Other non-manual
wage earners 7
8 Skilled manual
workers 8
9 Semi-skilled manual
workers 9
X Unskilled manual
workers X
Y Unknown Y
Farmers, farmer’s relatives and farm
managers
Other agricultural occupations and
fishermen
Higher professionals
Lower professionals
Self employed (with employees) and
managers
Salaried employees
Intermediate non-manual earners
Other non-manual earners
Skilled manual workers
Semi-skilled manual workers
Unskilled manual workers
Unknown
Farmers
SEG D
SEG A
SEG B
SEG C
SEG D
Unknown
CODE DESCRIPTION CODE DESCRIPTION
MORTALITY COLLECTION POPULATION CENSUS FINAL CODES TABLE 2.2
SOCIO-
ECONOMIC
GROUP CODING
IN THE REPUBLIC
OF IRELAND

37
Part Two: Mortality on the Island
Explanatory Notes for these figures and tables are given on pages 33-36.
Figure 2.00.1
Annual
mortality rates
(per 100,000),
by Age
All causes of death (ICD-9 001-E999) 1989-19982.00
38
TABLE 2.00.1
Annual number
of deaths and
Directly
standardised
mortality rates
(per 100,000)
Inequalities in Mortality
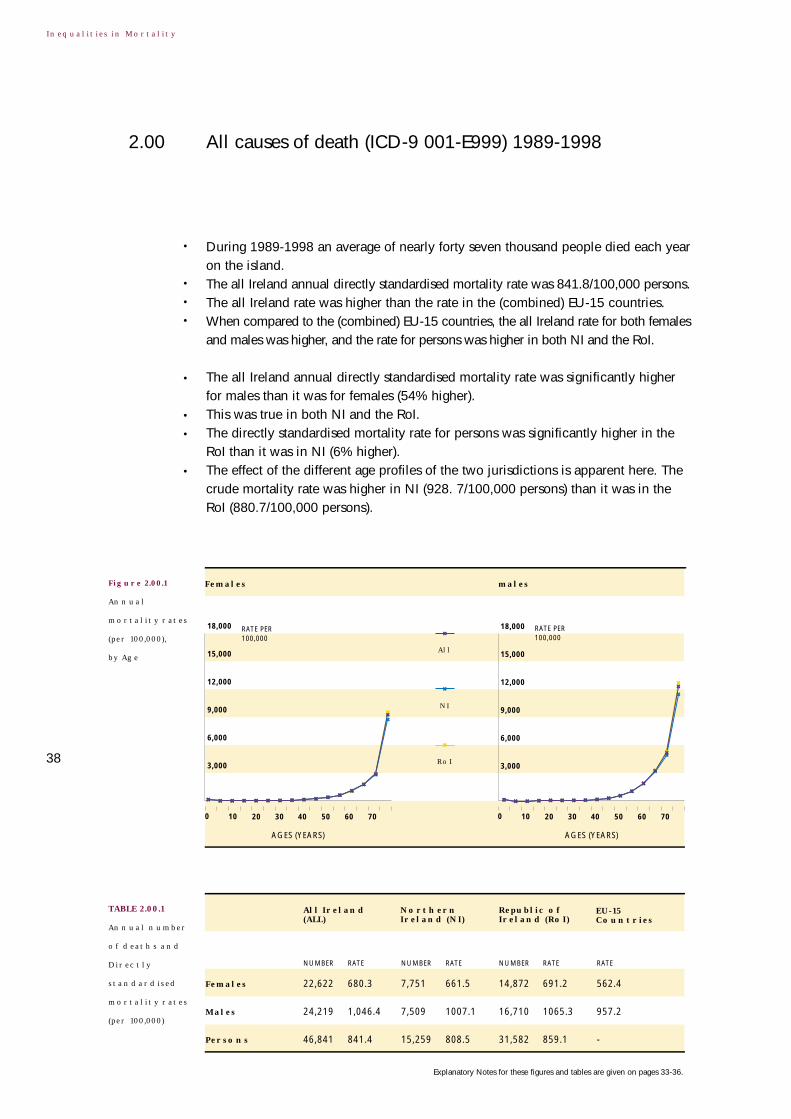
• During 1989-1998 an average of nearly forty seven thousand people died each yearon the island.
• The all Ireland annual directly standardised mortality rate was 841.8/100,000 persons.• The all Ireland rate was higher than the rate in the (combined) EU-15 countries.• When compared to the (combined) EU-15 countries, the all Ireland rate for both females
and males was higher, and the rate for persons was higher in both NI and the RoI.
• The all Ireland annual directly standardised mortality rate was significantly higherfor males than it was for females (54% higher).
• This was true in both NI and the RoI.• The directly standardised mortality rate for persons was significantly higher in the
RoI than it was in NI (6% higher).• The effect of the different age profiles of the two jurisdictions is apparent here. The
crude mortality rate was higher in NI (928. 7/100,000 persons) than it was in theRoI (880.7/100,000 persons).
Females
Males
Persons
Republic of Ireland (RoI)
Northern Ireland (NI)
All Ireland(ALL)
EU-15Countries
NUMBER RATE NUMBER RATE NUMBER RATE RATE
22,622 680.3 7,751 661.5 14,872 691.2 562.4
24,219 1,046.4 7,509 1007.1 16,710 1065.3 957.2
46,841 841.4 15,259 808.5 31,582 859.1 -
18,000
15,000
12,000
9,000
6,000
3,000
RATE PER 100,000
RATE PER 100,000
18,000
15,000
12,000
9,000
6,000
3,000
Females males
All
NI
RoI
0 10 20 30 40
AGES (YEARS) AGES (YEARS)
50 60 70 0 10 20 30 40 50 60 70

539.3
792.4
342.4309.4232.2
151.2
689.0
495.5
292.9
800
600
400
200
Northern Ireland
SOCIAL CLASS SOCIO-ECONOMIC GROUP
Farmers: 318.4
Republic of Ireland
SC1-2 SC3 SC4-5 SEG A SEG B SEG C SEG DUn-assigned
Un-known
RATE PER 100,000
RATE PER 100,000
800
600
400
200
39
2.00 All causes of death (ICD-9 001-E999) 1989-1998
Figure 2.00.2
directly
standardised
mortality rate
ratios, by Region
(All Ireland =
100%)
Figure 2.00.3
Annual Directly
standardised
mortality rates
(per 100,000) for
working age
males, by occupa-
tional class
> 120%
110% - 119%
100% - 109%
90% - 99%
80% - 89%
< 80%
Statistically significant
Females males
• Generally speaking, compared to the whole island the regional directly standardisedmortality rates for all causes tended to be higher in the RoI and lower in NI.
• The regional directly standardised mortality rate was significantly higher in mosturban centres than it was on the whole island.
• Notable exceptions were Galway CB where the mortality rate was significantlylower, and Waterford CB where there was no significant difference.
• In both NI and the RoI there were clear occupational class gradients in all causesmortality.
• In both jurisdictions, the annual directly standardised mortality rate in the lowestoccupational class was significantly (over 130%) higher than the rate in the highestoccupational class.
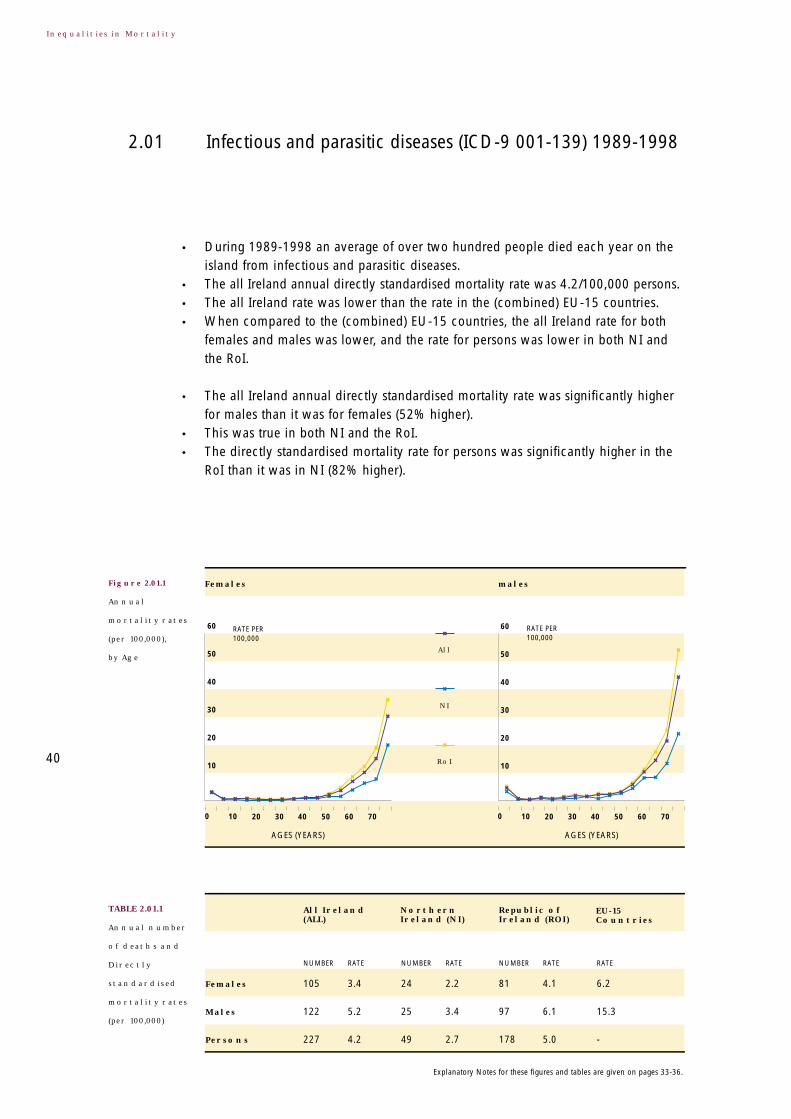
Figure 2.01.1
Annual
mortality rates
(per 100,000),
by Age
Infectious and parasitic diseases (ICD-9 001-139) 1989-19982.01
40
TABLE 2.01.1
Annual number
of deaths and
Directly
standardised
mortality rates
(per 100,000)
Inequalities in Mortality
• During 1989-1998 an average of over two hundred people died each year on theisland from infectious and parasitic diseases.
• The all Ireland annual directly standardised mortality rate was 4.2/100,000 persons.• The all Ireland rate was lower than the rate in the (combined) EU-15 countries.• When compared to the (combined) EU-15 countries, the all Ireland rate for both
females and males was lower, and the rate for persons was lower in both NI andthe RoI.
• The all Ireland annual directly standardised mortality rate was significantly higherfor males than it was for females (52% higher).
• This was true in both NI and the RoI.• The directly standardised mortality rate for persons was significantly higher in the
RoI than it was in NI (82% higher).
Females
Males
Persons
Republic of Ireland (ROI)
Northern Ireland (NI)
All Ireland(ALL)
EU-15Countries
NUMBER RATE NUMBER RATE NUMBER RATE RATE
105 3.4 24 2.2 81 4.1 6.2
122 5.2 25 3.4 97 6.1 15.3
227 4.2 49 2.7 178 5.0 -
60
50
40
30
20
10
RATE PER 100,000
RATE PER 100,000
60
50
40
30
20
10
Females males
All
NI
RoI
0 10 20 30 40
AGES (YEARS) AGES (YEARS)
50 60 70 0 10 20 30 40 50 60 70
Explanatory Notes for these figures and tables are given on pages 33-36.

1.8
9.5
2.01.72.02.2 2.2
3.6
1.7
10.0
7.5
5.0
2.5
Northern Ireland
SOCIAL CLASS SOCIO-ECONOMIC GROUP
Farmers: 2.1
Republic of Ireland
SC1-2 SC3 SC4-5 SEG A SEG B SEG C SEG DUn-assigned
Un-known
RATE PER 100,000
RATE PER 100,000
10.0
7.5
5.0
2.5
• Generally speaking, the regional directly standardised mortality rates for infectiousand parasitic diseases tended to be higher in the RoI than they were in NI.
• The regional directly standardised mortality rate was higher in nearly all urbancentres than it was on the whole island, although not always significantly.
• The exception was Belfast LGD where the mortality rate was significantly lower.
• In neither NI nor the RoI was there an occupational class gradient in mortalityfrom infectious and parasitic diseases.
• In the RoI, the annual directly standardised mortality rate in the lowest occupationalclass was significantly (over 370%) higher than the rate in the highest occupational class.
Coding practices can sometimes influence whether a particular death is attributedto a respiratory disease or an infectious or parasitic disease. Some of the RoI excessin mortality from infectious and parasitic diseases may simply reflect North-Southdifferences in coding practices. See Section 5.3 for further details.
41
2.01 Infectious and parasitic diseases (ICD-9 001-139) 1989-1998
Figure 2.01.2
directly
standardised
mortality rate
ratios, by Region
(All Ireland =
100%)
Figure 2.01.3
Annual Directly
standardised
mortality rates
(per 100,000) for
working age
males, by occupa-
tional class
> 120%
110% - 119%
100% - 109%
90% - 99%
80% - 89%
< 80%
Statistically significant
Females males

Figure 2.02.1
Annual
mortality rates
(per 100,000),
by Age
Tuberculosis (ICD-9 010-018,137) 1989-19982.02
42
TABLE 2.02.1
Annual number
of deaths and
Directly
standardised
mortality rates
(per 100,000)
Inequalities in Mortality
• During 1989-1998 an average of seventy people died each year on the island fromtuberculosis.
• The all Ireland annual directly standardised mortality rate was 1.3/100,000 persons.• The all Ireland rate was comparable to the rate in the (combined) EU-15 countries.• When compared to the (combined) EU-15 countries, the all Ireland rate for females
was slightly higher, and the rate for persons was lower in NI but higher in the RoI.
• The all Ireland annual directly standardised mortality rate was significantly higherfor males than it was for females (92% higher).
• This was true in both NI and the RoI.• The directly standardised mortality rate for persons was significantly higher in the
RoI than it was in NI (162% higher).
Females
Males
Persons
Republic of Ireland (ROI)
Northern Ireland (NI)
All Ireland(ALL)
EU-15Countries
NUMBER RATE NUMBER RATE NUMBER RATE RATE
29 0.9 5 0.4 24 1.2 0.6
41 1.8 6 0.9 34 2.2 1.8
70 1.3 11 0.6 58 1.6 -
24
20
16
12
8
4
RATE PER 100,000
RATE PER 100,000
24
20
16
12
8
4
Females males
All
NI
RoI
0 10 20 30 40
AGES (YEARS) AGES (YEARS)
50 60 70 0 10 20 30 40 50 60 70
Explanatory Notes for these figures and tables are given on pages 33-36.

0.7
2.8
0.50.30.20.2
0.6
1.0
0.0
4
3
2
1
Northern Ireland
SOCIAL CLASS SOCIO-ECONOMIC GROUP
Farmers: 0.6
Republic of Ireland
SC1-2 SC3 SC4-5 SEG A SEG B SEG C SEG DUn-assigned
Un-known
RATE PER 100,000
RATE PER 100,000
4
3
2
1
• Generally speaking, the regional directly standardised mortality rates fortuberculosis tended to be higher in the RoI and lower in NI.
• The regional directly standardised mortality rate was higher in most urban centresthan it was on the whole island, occasionally significantly so.
• Exceptions included Belfast LGD, Derry LGD, Galway CB and Waterford CBwhere the mortality rate tended to be lower than it was on the whole island.
• In both NI and the RoI there were occupational class gradients in mortality fromtuberculosis.
• In both jurisdictions, the annual directly standardised mortality rate in the lowestoccupational class was significantly (over 300%) higher than the rate in the highestoccupational class.
43
2.02 Tuberculosis (ICD-9 010-018,137) 1989-1998
Figure 2.02.2
directly
standardised
mortality rate
ratios, by Region
(All Ireland =
100%)
Figure 2.02.3
Annual Directly
standardised
mortality rates
(per 100,000) for
working age
males, by occupa-
tional class
> 120%
110% - 119%
100% - 109%
90% - 99%
80% - 89%
< 80%
Statistically significant
Females males

Figure 2.03.1
Annual
mortality rates
(per 100,000),
by Age
Meningococcal infection (ICD-9 036) 1989-19982.03
44
TABLE 2.03.1
Annual number
of deaths and
Directly
standardised
mortality rates
(per 100,000)
Inequalities in Mortality
Because of the small number of deaths involved, particular caution is needed wheninterpreting these results. In particular, no comments are made about the regional andoccupational class variation in mortality. The relatively small number of deaths mayalso add some 'noise' to the plots of age specific mortality rates in Figure 2.03.1.
• During 1989-1998 an average of twenty people died each year on the island frommeningococcal infection.
• The all Ireland annual directly standardised mortality rate was 0.4/100,000 persons.• The all Ireland rate was higher than the rate in the (combined) EU-15 countries.• When compared to the (combined) EU-15 countries, the all Ireland rate for both females
and males was higher, and the rate for persons was higher in both NI and the RoI.
Females
Males
Persons
Republic of Ireland (ROI)
Northern Ireland (NI)
All Ireland(ALL)
EU-15Countries
NUMBER RATE NUMBER RATE NUMBER RATE RATE
9 0.4 2 0.3 7 0.4 0.1
10 0.4 3 0.3 7 0.4 0.2
19 0.4 5 0.3 14 0.4 -
RATE PER 100,000
RATE PER 100,000
Females males
All
NI
RoI
0 10 20 30 40
AGES (YEARS) AGES (YEARS)
50 60 70 0 10 20 30 40 50 60 70
3.0
2.5
2.0
1.5
1.0
0.5
3.0
2.5
2.0
1.5
1.0
0.5
Explanatory Notes for these figures and tables are given on pages 33-36.

45
2.03 Meningococcal infection (ICD-9 036) 1989-1998
Figures presenting the directly standardised mortality rate ratios by region and theannual directly standardised mortality rates for working aged males have beenomitted because of the small number of deaths involved.

Figure 2.04.1
Annual
mortality rates
(per 100,000),
by Age
AIDS (HIV-disease) (ICD-9 042-044) 1989-19982.04
46
TABLE 2.04.1
Annual number
of deaths and
Directly
standardised
mortality rates
(per 100,000)
Inequalities in Mortality
Because of the small number of deaths involved, particular caution is neededwhen interpreting these results. In particular, no comments are made about theregional and occupational class variation in mortality. The relatively small numberof deaths may also add some 'noise' to the plots of age specific mortality rates inFigure 2.04.1.
• During 1989-1998 an average of twenty five people died each year on the islandfrom AIDS (HIV-disease).
• The all Ireland annual directly standardised mortality rate was 0.5/100,000 persons.• The all Ireland rate was lower than the rate in the (combined) EU-15 countries.• When compared to the (combined) EU-15 countries, the all Ireland rate for both
females and males was lower, and the rate for persons was lower in both NI andthe RoI.
Females
Males
Persons
Republic of Ireland (ROI)
Northern Ireland (NI)
All Ireland(ALL)
EU-15Countries
NUMBER RATE NUMBER RATE NUMBER RATE RATE
5 0.2 0 0.0 4 0.2 1.7
21 0.8 1 0.1 20 1.2 7.9
26 0.5 1 0.1 24 0.7 -
6
5
4
3
2
1
RATE PER 100,000
RATE PER 100,000
6
5
4
3
2
1
Females males
All
NI
RoI
0 10 20 30 40
AGES (YEARS) AGES (YEARS)
50 60 70 0 10 20 30 40 50 60 70
Explanatory Notes for these figures and tables are given on pages 33-36.

• The all Ireland annual directly standardised mortality rate was significantly higherfor males than it was for females (387% higher).
• This was true in both NI and the RoI. (No such female deaths were recorded in NIduring 1989-1998).
• The directly standardised mortality rate for persons was significantly higher in theRoI than it was in NI (751% higher).
Figures presenting the directly standardised mortality rate ratios by region and theannual directly standardised mortality rates for working aged males have beenomitted because of the small number of deaths involved.
47
2.04 Aids (HIV-disease) (ICD-9 042-044) 1989-1999

Figure 2.05.1
Annual
mortality rates
(per 100,000),
by Age
Viral hepatitis (ICD-9 070) 1989-19982.05
48
TABLE 2.05.1
Annual number
of deaths and
Directly
standardised
mortality rates
(per 100,000)
Inequalities in Mortality
Because of the small number of deaths involved, extreme caution is needed wheninterpreting these results. In particular, no comments are made about any variationin mortality on the island. The relatively small number of deaths may also addsome 'noise' to the plots of age specific mortality rates in Figure 2.05.1.
• During 1989-1998 an average of ten people died each year on the island fromviral hepatitis.
• The all Ireland annual directly standardised mortality rate was 0.2/100,000 persons.• The all Ireland rate was comparable to the rate in the (combined) EU-15 countries.
Females
Males
Persons
Republic of Ireland (ROI)
Northern Ireland (NI)
All Ireland(ALL)
EU-15Countries
NUMBER RATE NUMBER RATE NUMBER RATE RATE
4 0.1 1 0.1 3 0.2 0.2
5 0.2 1 0.1 5 0.3 0.5
9 0.2 1 0.1 8 0.2 -
1.2
1.0
0.8
0.6
0.4
0.2
RATE PER 100,000
RATE PER 100,000
1.2
1.0
0.8
0.6
0.4
0.2
Females males
All
NI
RoI
0 10 20 30 40
AGES (YEARS) AGES (YEARS)
50 60 70 0 10 20 30 40 50 60 70
Explanatory Notes for these figures and tables are given on pages 33-36.

49
2.05 Viral hepatitis (ICD-9 070) 1989-1998
Figures presenting the directly standardised mortality rate ratios by region and theannual directly standardised mortality rates for working aged males have beenomitted because of the small number of deaths involved.
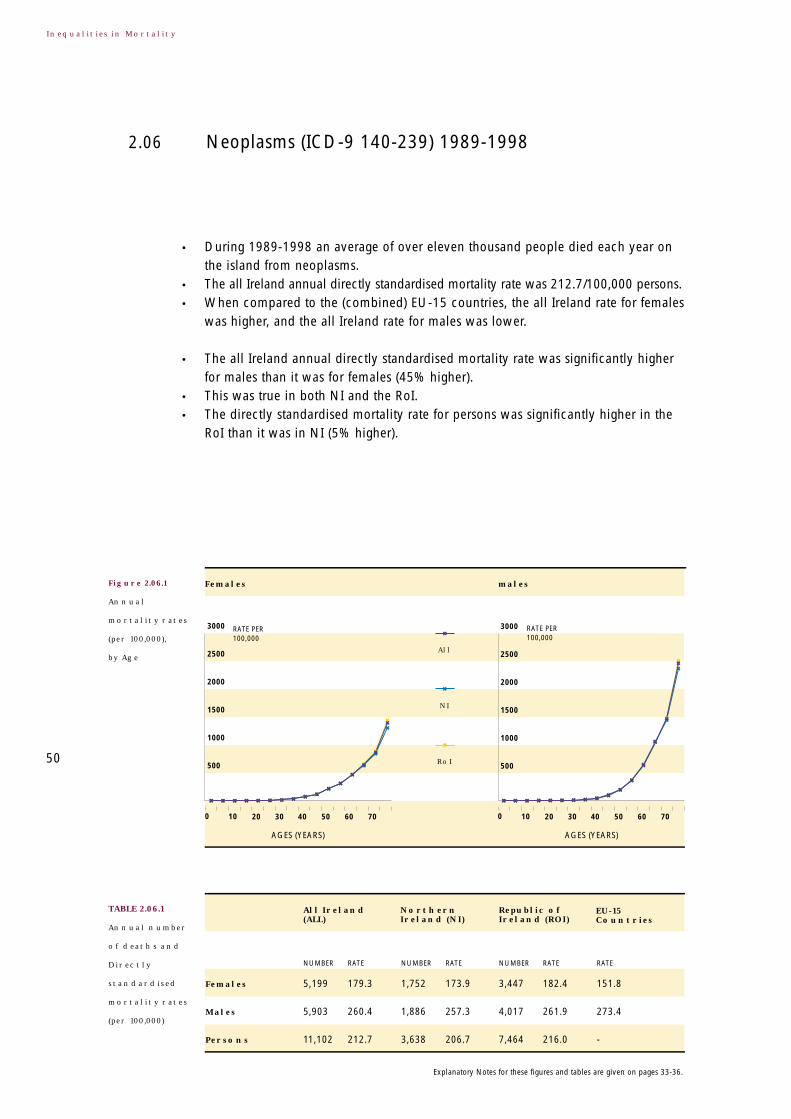
Figure 2.06.1
Annual
mortality rates
(per 100,000),
by Age
Neoplasms (ICD-9 140-239) 1989-19982.06
50
TABLE 2.06.1
Annual number
of deaths and
Directly
standardised
mortality rates
(per 100,000)
Inequalities in Mortality
• During 1989-1998 an average of over eleven thousand people died each year onthe island from neoplasms.
• The all Ireland annual directly standardised mortality rate was 212.7/100,000 persons.• When compared to the (combined) EU-15 countries, the all Ireland rate for females
was higher, and the all Ireland rate for males was lower.
• The all Ireland annual directly standardised mortality rate was significantly higherfor males than it was for females (45% higher).
• This was true in both NI and the RoI.• The directly standardised mortality rate for persons was significantly higher in the
RoI than it was in NI (5% higher).
Females
Males
Persons
Republic of Ireland (ROI)
Northern Ireland (NI)
All Ireland(ALL)
EU-15Countries
NUMBER RATE NUMBER RATE NUMBER RATE RATE
5,199 179.3 1,752 173.9 3,447 182.4 151.8
5,903 260.4 1,886 257.3 4,017 261.9 273.4
11,102 212.7 3,638 206.7 7,464 216.0 -
3000
2500
2000
1500
1000
500
RATE PER 100,000
RATE PER 100,000
3000
2500
2000
1500
1000
500
Females males
All
NI
RoI
0 10 20 30 40
AGES (YEARS) AGES (YEARS)
50 60 70 0 10 20 30 40 50 60 70
Explanatory Notes for these figures and tables are given on pages 33-36.

150.5
186.5
116.8108.4
83.6
20.2
189.8
158.2
88.5
200
150
100
50
Northern Ireland
SOCIAL CLASS SOCIO-ECONOMIC GROUP
Republic of Ireland
SC1-2 SC3 SC4-5 SEG A SEG B SEG C SEG DUn-assigned
Un-known
RATE PER 100,000
RATE PER 100,000
200
150
100
50
Farmers: 85.5
• The regional directly standardised mortality rate was significantly higher in mosturban centres than it was on the whole island.
• Notable exceptions were Galway CB where the mortality rate was significantlylower, and Waterford CB where there was no significant difference.
• These urban differences accounted for most of the regional variation in mortalityfrom neoplasms.
• In both NI and the RoI there were clear occupational class gradients in mortalityfrom neoplasms.
• In both jurisdictions, the annual directly standardised mortality rate in the lowestoccupational class was significantly (over 110%) higher than the rate in the highestoccupational class.
51
2.06 Neoplasms (ICD-9 140-239) 1989-1998
Figure 2.06.2
directly
standardised
mortality rate
ratios, by Region
(All Ireland =
100%)
Figure 2.06.3
Annual Directly
standardised
mortality rates
(per 100,000) for
working age
males, by occupa-
tional class
> 120%
110% - 119%
100% - 109%
90% - 99%
80% - 89%
< 80%
Statistically significant
Females males

Figure 2.07.1
Annual
mortality rates
(per 100,000),
by Age
Malignant neoplasms (ICD-9 140-208) 1989-19982.07
52
TABLE 2.07.1
Annual number
of deaths and
Directly
standardised
mortality rates
(per 100,000)
Inequalities in Mortality
Because nearly all mortality from neoplasms resulted from malignancies, theresults for malignant neoplasm almost exactly mirror those for all neoplasms (see Section 2.06).
• During 1989-1998 an average of nearly eleven thousand people died each year onthe island from malignant neoplasms.
• The all Ireland annual directly standardised mortality rate was 210.2/100,000 persons.• When compared to the (combined) EU-15 countries the all Ireland rate for females
was higher, and the all Ireland rate for males was lower.
• The all Ireland annual directly standardised mortality rate was significantly higherfor males than it was for females (46% higher).
• This was true in both NI and the RoI.
Females
Males
Persons
Republic of Ireland (ROI)
Northern Ireland (NI)
All Ireland(ALL)
EU-15Countries
NUMBER RATE NUMBER RATE NUMBER RATE RATE
5,129 177.1 1,709 169.8 3,421 181.1 148.1
5,839 257.6 1,847 252.1 3,992 260.2 268.0
10,968 210.2 3,556 202.1 7,413 214.5 -
3000
2500
2000
1500
1000
500
RATE PER 100,000
RATE PER 100,000
3000
2500
2000
1500
1000
500
Females males
All
NI
RoI
0 10 20 30 40
AGES (YEARS) AGES (YEARS)
50 60 70 0 10 20 30 40 50 60 70
Explanatory Notes for these figures and tables are given on pages 33-36.
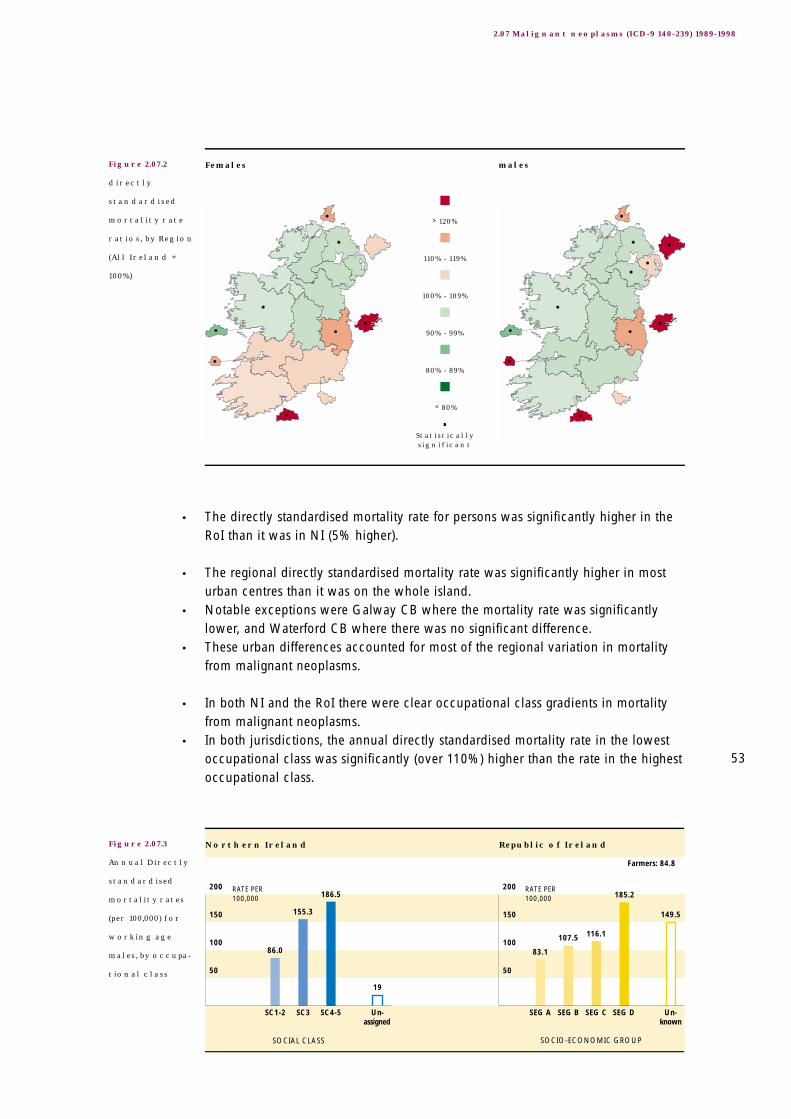
149.5
185.2
116.1107.5
83.1
19
186.5
155.3
86.0
200
150
100
50
Northern Ireland
SOCIAL CLASS SOCIO-ECONOMIC GROUP
Republic of Ireland
SC1-2 SC3 SC4-5 SEG A SEG B SEG C SEG DUn-assigned
Un-known
RATE PER 100,000
RATE PER 100,000
200
150
100
50
Farmers: 84.8
• The directly standardised mortality rate for persons was significantly higher in theRoI than it was in NI (5% higher).
• The regional directly standardised mortality rate was significantly higher in mosturban centres than it was on the whole island.
• Notable exceptions were Galway CB where the mortality rate was significantlylower, and Waterford CB where there was no significant difference.
• These urban differences accounted for most of the regional variation in mortalityfrom malignant neoplasms.
• In both NI and the RoI there were clear occupational class gradients in mortalityfrom malignant neoplasms.
• In both jurisdictions, the annual directly standardised mortality rate in the lowestoccupational class was significantly (over 110%) higher than the rate in the highestoccupational class.
53
2.07 Malignant neoplasms (ICD-9 140-239) 1989-1998
Figure 2.07.2
directly
standardised
mortality rate
ratios, by Region
(All Ireland =
100%)
Figure 2.07.3
Annual Directly
standardised
mortality rates
(per 100,000) for
working age
males, by occupa-
tional class
> 120%
110% - 119%
100% - 109%
90% - 99%
80% - 89%
< 80%
Statistically significant
Females males

Figure 2.08.1
Annual
mortality rates
(per 100,000),
by Age
Malignant neoplasms of the lip, oral cavity, pharynx
(ICD-9 140-149) 1989-1998
2.08
54
TABLE 2.08.1
Annual number
of deaths and
Directly
standardised
mortality rates
(per 100,000)
Inequalities in Mortality
• During 1989-1998 an average of nearly two hundred people died each year on theisland from malignant neoplasms of the lip, oral cavity, pharynx.
• The all Ireland annual directly standardised mortality rate was 3.7/100,000 persons.• When compared to the (combined) EU-15 countries, the all Ireland rate for females
was similar, and the all Ireland rate for males was lower.
• The all Ireland annual directly standardised mortality rate was significantly higherfor males than it was for females (241% higher).
• This was true in both NI and the RoI.• The directly standardised mortality rate for persons was significantly higher in the
RoI than it was in NI (34% higher).
Females
Males
Persons
Republic of Ireland (ROI)
Northern Ireland (NI)
All Ireland(ALL)
EU-15Countries
NUMBER RATE NUMBER RATE NUMBER RATE RATE
52 1.7 18 1.7 35 1.8 1.6
130 5.9 32 4.6 98 6.6 8.6
183 3.7 50 3.0 133 4.0 -
60
50
40
30
20
10
RATE PER 100,000
RATE PER 100,000
60
50
40
30
20
10
Females males
All
NI
RoI
0 10 20 30 40
AGES (YEARS) AGES (YEARS)
50 60 70 0 10 20 30 40 50 60 70
Explanatory Notes for these figures and tables are given on pages 33-36.
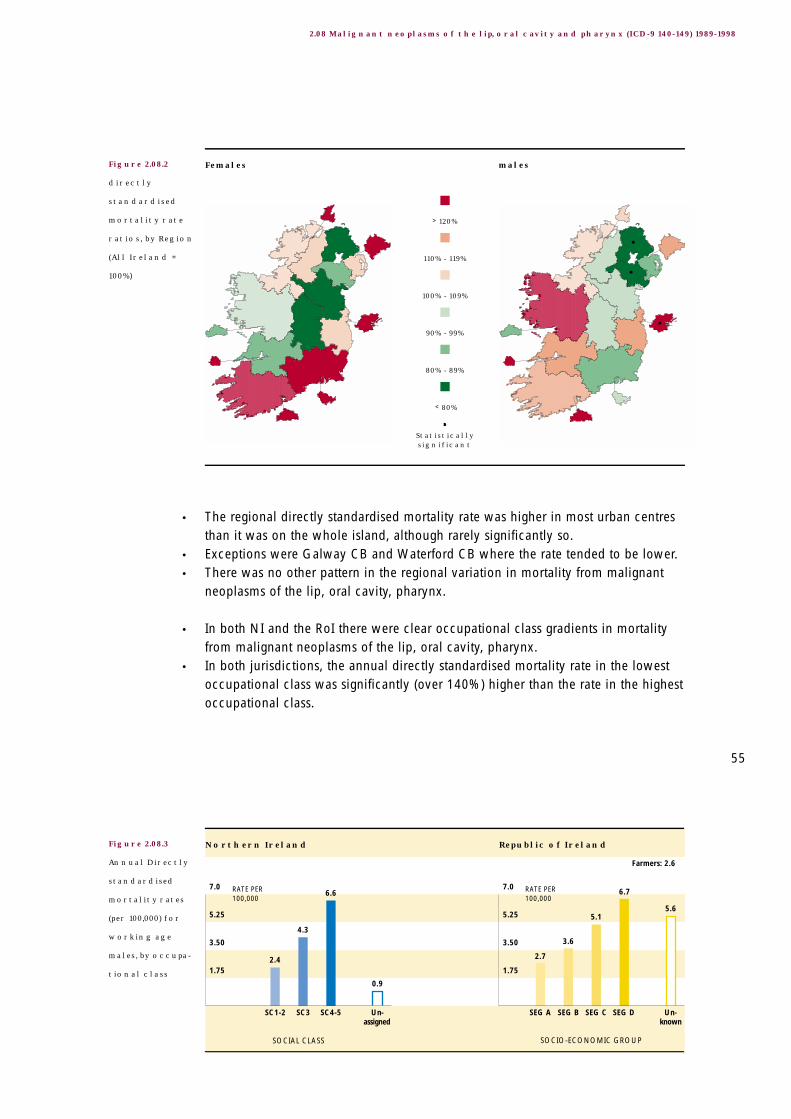
5.6
6.7
5.1
3.6
2.7
0.9
6.6
4.3
2.4
7.0
5.25
3.50
1.75
Northern Ireland
SOCIAL CLASS SOCIO-ECONOMIC GROUP
Republic of Ireland
SC1-2 SC3 SC4-5 SEG A SEG B SEG C SEG DUn-assigned
Un-known
RATE PER 100,000
RATE PER 100,000
7.0
5.25
3.50
1.75
Farmers: 2.6
• The regional directly standardised mortality rate was higher in most urban centresthan it was on the whole island, although rarely significantly so.
• Exceptions were Galway CB and Waterford CB where the rate tended to be lower.• There was no other pattern in the regional variation in mortality from malignant
neoplasms of the lip, oral cavity, pharynx.
• In both NI and the RoI there were clear occupational class gradients in mortalityfrom malignant neoplasms of the lip, oral cavity, pharynx.
• In both jurisdictions, the annual directly standardised mortality rate in the lowestoccupational class was significantly (over 140%) higher than the rate in the highestoccupational class.
55
2.08 Malignant neoplasms of the lip, oral cavity and pharynx (ICD-9 140-149) 1989-1998
Figure 2.08.2
directly
standardised
mortality rate
ratios, by Region
(All Ireland =
100%)
Figure 2.08.3
Annual Directly
standardised
mortality rates
(per 100,000) for
working age
males, by occupa-
tional class
> 120%
110% - 119%
100% - 109%
90% - 99%
80% - 89%
< 80%
Statistically significant
Females males

Figure 2.09.1
Annual
mortality rates
(per 100,000),
by Age
Malignant neoplasms of the oesophagus
(ICD-9 150) 1989-1998
2.09
56
TABLE 2.09.1
Annual number
of deaths and
Directly
standardised
mortality rates
(per 100,000)
Inequalities in Mortality
• During 1989-1998 an average of over four hundred people died each year on theisland from malignant neoplasms of the oesophagus.
• The all Ireland annual directly standardised mortality rate was 8.1/100,000 persons.• The all Ireland rate was higher than the rate in the (combined) EU-15 countries.• When compared to the (combined) EU-15 countries, the all Ireland rate for both
females and males was higher, and the rate for persons was higher in both NI andthe RoI.
• The all Ireland annual directly standardised mortality rate was significantly higherfor males than it was for females (118% higher).
• This was true in both NI and the RoI.• The directly standardised mortality rate for persons was significantly higher in the
RoI than it was in NI (15% higher).
Females
Males
Persons
Republic of Ireland (ROI)
Northern Ireland (NI)
All Ireland(ALL)
EU-15Countries
NUMBER RATE NUMBER RATE NUMBER RATE RATE
166 5.2 51 4.5 115 5.6 2.0
254 11.4 78 10.9 177 11.7 9.0
420 8.1 129 7.3 292 8.4 -
96
80
64
48
32
16
RATE PER 100,000
RATE PER 100,000
96
80
64
48
32
16
Females males
All
NI
RoI
0 10 20 30 40
AGES (YEARS) AGES (YEARS)
50 60 70 0 10 20 30 40 50 60 70
Explanatory Notes for these figures and tables are given on pages 33-36.

7.7
10.4
5.44.9
4.4
1.6
11.1
8.1
4.4
12
9
6
3
Northern Ireland
SOCIAL CLASS SOCIO-ECONOMIC GROUP
Republic of Ireland
SC1-2 SC3 SC4-5 SEG A SEG B SEG C SEG DUn-assigned
Un-known
RATE PER 100,000
RATE PER 100,000
12
9
6
3
Farmers: 84.8
• Generally speaking, the regional directly standardised mortality rates for malignantneoplasms of the oesophagus tended to be lower in NI and higher in the RoI.
• The rates also tended to be lower in the western part of the island than they were inthe eastern part, although rarely significantly so.
• Urban/non-urban differences were generally consistent with these two patterns.
• In both NI and the RoI there were clear occupational class gradients in mortalityfrom malignant neoplasms of the oesophagus.
• In both jurisdictions, the annual directly standardised mortality rate in the lowestoccupational class was significantly (over 230%) higher than the rate in the highestoccupational class.
57
2.09 Malignant neoplasms of the oesophagus (ICD-9 150) 1989-1998
Figure 2.09.2
directly
standardised
mortality rate
ratios, by Region
(All Ireland =
100%)
Figure 2.09.3
Annual Directly
standardised
mortality rates
(per 100,000) for
working age
males, by occupa-
tional class
> 120%
110% - 119%
100% - 109%
90% - 99%
80% - 89%
< 80%
Statistically significant
Females males

Figure 2.10.1
Annual
mortality rates
(per 100,000),
by Age
Malignant neoplasms of the stomach (ICD-9 151) 1989-19982.10
58
TABLE 2.10.1
Annual number
of deaths and
Directly
standardised
mortality rates
(per 100,000)
Inequalities in Mortality
• During 1989-1998 an average of over six hundred people died each year on theisland from malignant neoplasms of the stomach.
• The all Ireland annual directly standardised mortality rate was 11.8/100,000 persons.• The all Ireland rate was lower than the rate in the (combined) EU-15 countries.• When compared to the (combined) EU-15 countries, the all Ireland rate for both
females and males was lower, and the rate for persons was lower in both NI andthe RoI.
• The all Ireland annual directly standardised mortality rate was significantly higherfor males than it was for females (107% higher).
• This was true in both NI and the RoI.• The directly standardised mortality rate for persons was significantly higher in the
RoI than it was in NI (4% higher) although the difference was relatively small.
Females
Males
Persons
Republic of Ireland (ROI)
Northern Ireland (NI)
All Ireland(ALL)
EU-15Countries
NUMBER RATE NUMBER RATE NUMBER RATE RATE
253 8.0 85 7.6 168 8.2 8.6
373 16.5 121 16.6 252 16.5 18.2
626 11.8 206 11.5 420 11.9 -
162
132
108
81
54
27
RATE PER 100,000
RATE PER 100,000
162
132
108
81
54
27
Females males
All
NI
RoI
0 10 20 30 40
AGES (YEARS) AGES (YEARS)
50 60 70 0 10 20 30 40 50 60 70
Explanatory Notes for these figures and tables are given on pages 33-36.

9.3
11.2
7.57.0
2.61.9
12.5
10.0
5.7
14.0
10.5
7.0
3.5
Northern Ireland
SOCIAL CLASS SOCIO-ECONOMIC GROUP
Republic of Ireland
SC1-2 SC3 SC4-5 SEG A SEG B SEG C SEG DUn-assigned
Un-known
RATE PER 100,000
RATE PER 100,000
14.0
10.5
7.0
3.5
Farmers: 6.1
• There was no obvious pattern in the regional directly standardised mortality ratesfor malignant neoplasms of the stomach.
• The rate tended to be higher in urban centres than it was on the whole island,although it was only significantly so in Dublin CB.
• In both NI and the RoI there were clear occupational class gradients in mortalityfrom malignant neoplasms of the stomach.
• In both jurisdictions, the annual directly standardised mortality rate in the lowestoccupational class was significantly (over 110%) higher than the rate in the highestoccupational class.
59
2.10 Malignant neoplasms of the stomach (ICD-9 151) 1989-1998
Figure 2.10.2
directly
standardised
mortality rate
ratios, by Region
(All Ireland =
100%)
Figure 2.10.3
Annual Directly
standardised
mortality rates
(per 100,000) for
working age
males, by occupa-
tional class
> 120%
110% - 119%
100% - 109%
90% - 99%
80% - 89%
< 80%
Statistically significant
Females males
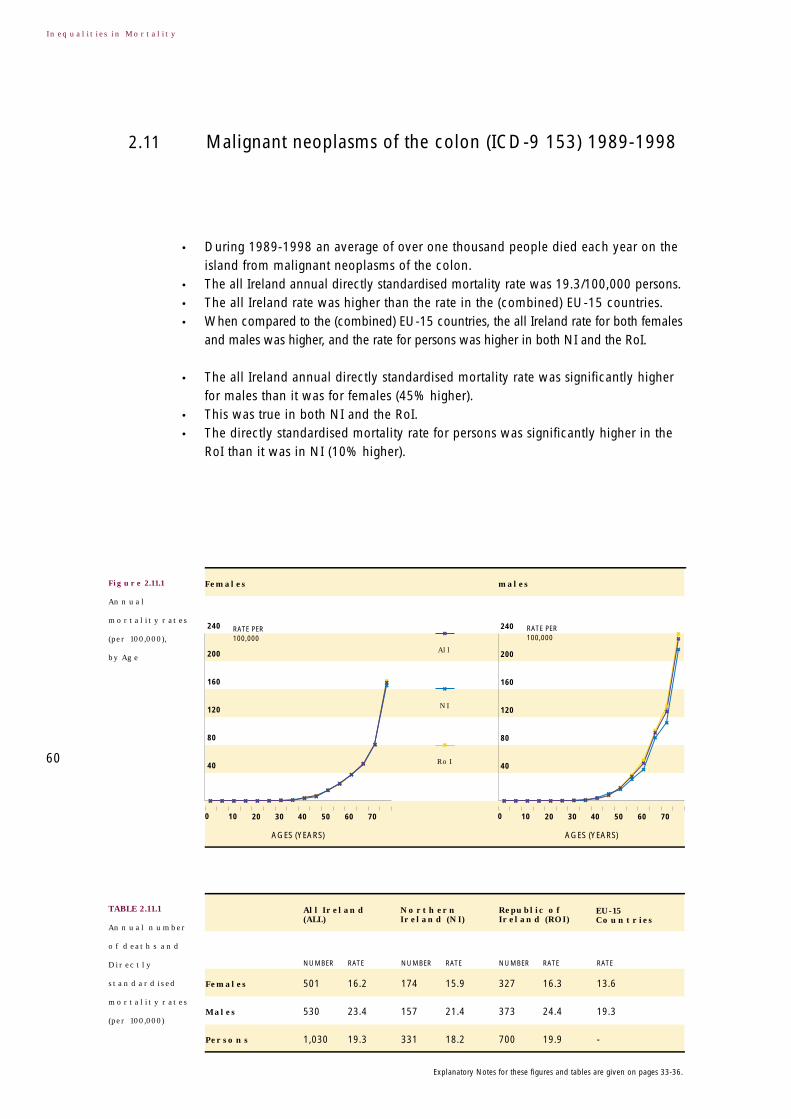
Figure 2.11.1
Annual
mortality rates
(per 100,000),
by Age
Malignant neoplasms of the colon (ICD-9 153) 1989-19982.11
60
TABLE 2.11.1
Annual number
of deaths and
Directly
standardised
mortality rates
(per 100,000)
Inequalities in Mortality
• During 1989-1998 an average of over one thousand people died each year on theisland from malignant neoplasms of the colon.
• The all Ireland annual directly standardised mortality rate was 19.3/100,000 persons.• The all Ireland rate was higher than the rate in the (combined) EU-15 countries.• When compared to the (combined) EU-15 countries, the all Ireland rate for both females
and males was higher, and the rate for persons was higher in both NI and the RoI.
• The all Ireland annual directly standardised mortality rate was significantly higherfor males than it was for females (45% higher).
• This was true in both NI and the RoI.• The directly standardised mortality rate for persons was significantly higher in the
RoI than it was in NI (10% higher).
Females
Males
Persons
Republic of Ireland (ROI)
Northern Ireland (NI)
All Ireland(ALL)
EU-15Countries
NUMBER RATE NUMBER RATE NUMBER RATE RATE
501 16.2 174 15.9 327 16.3 13.6
530 23.4 157 21.4 373 24.4 19.3
1,030 19.3 331 18.2 700 19.9 -
240
200
160
120
80
40
RATE PER 100,000
RATE PER 100,000
240
200
160
120
80
40
Females males
All
NI
RoI
0 10 20 30 40
AGES (YEARS) AGES (YEARS)
50 60 70 0 10 20 30 40 50 60 70
Explanatory Notes for these figures and tables are given on pages 33-36.
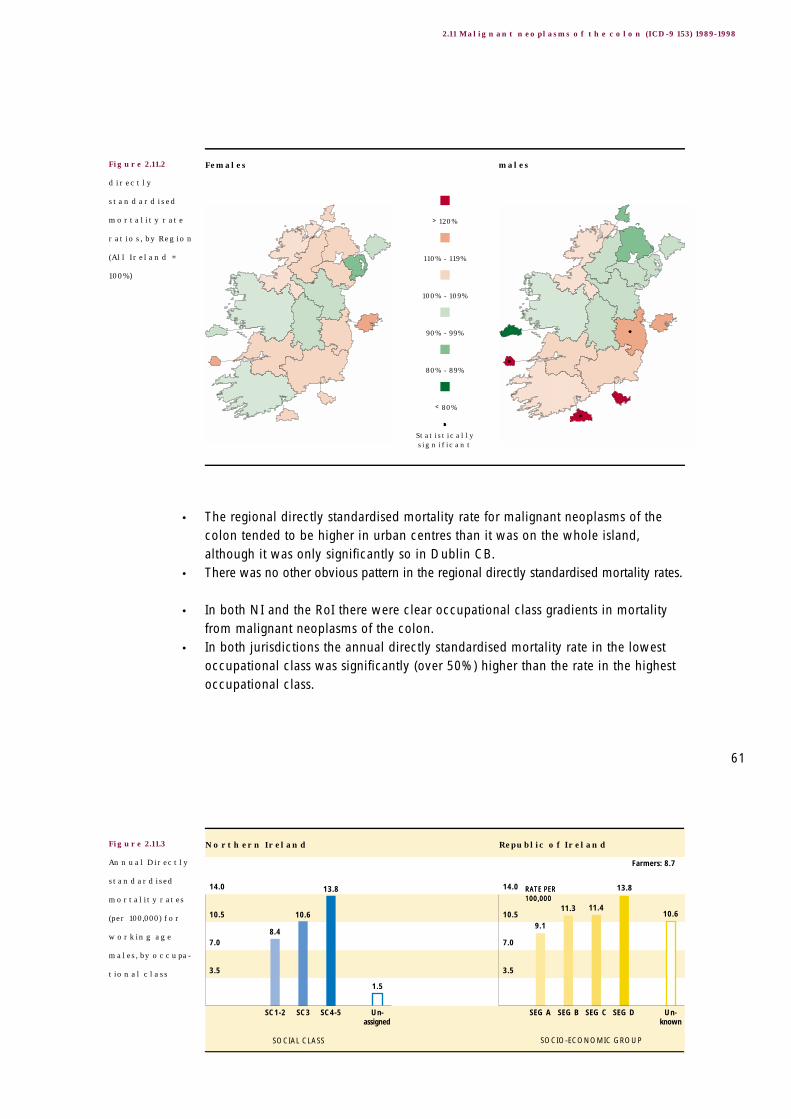
10.6
13.8
11.411.3
9.1
1.5
13.8
10.6
8.4
14.0
10.5
7.0
3.5
Northern Ireland
SOCIAL CLASS SOCIO-ECONOMIC GROUP
Republic of Ireland
SC1-2 SC3 SC4-5 SEG A SEG B SEG C SEG DUn-assigned
Un-known
RATE PER 100,000RATE PER 100,000
14.0
10.5
7.0
3.5
Farmers: 8.7
• The regional directly standardised mortality rate for malignant neoplasms of thecolon tended to be higher in urban centres than it was on the whole island,although it was only significantly so in Dublin CB.
• There was no other obvious pattern in the regional directly standardised mortality rates.
• In both NI and the RoI there were clear occupational class gradients in mortalityfrom malignant neoplasms of the colon.
• In both jurisdictions the annual directly standardised mortality rate in the lowestoccupational class was significantly (over 50%) higher than the rate in the highestoccupational class.
61
2.11 Malignant neoplasms of the colon (ICD-9 153) 1989-1998
Figure 2.11.2
directly
standardised
mortality rate
ratios, by Region
(All Ireland =
100%)
Figure 2.11.3
Annual Directly
standardised
mortality rates
(per 100,000) for
working age
males, by occupa-
tional class
> 120%
110% - 119%
100% - 109%
90% - 99%
80% - 89%
< 80%
Statistically significant
Females males

Figure 2.12.1
Annual
mortality rates
(per 100,000),
by Age
Malignant neoplasms of the rectum and anus
(ICD-9 154) 1989-1998
2.12
62
TABLE 2.12.1
Annual number
of deaths and
Directly
standardised
mortality rates
(per 100,000)
Inequalities in Mortality
• During 1989-1998 an average of nearly three hundred and fifty people died eachyear on the island from malignant neoplasms of the rectum and anus.
• The all Ireland annual directly standardised mortality rate was 6.5/100,000 persons.• The all Ireland rate was comparable to the rate in the (combined) EU-15 countries.• When compared to the (combined) EU-15 countries, the all Ireland rate was
similar for both females and males, and the rate for persons was similar for both NIand the RoI.
• The all Ireland annual directly standardised mortality rate was significantly higherfor males than it was for females (106% higher).
• This was true in both NI and the RoI.• The directly standardised mortality rate for persons was significantly higher in the
RoI than it was in NI (1% higher) although the difference was small.
Females
Males
Persons
Republic of Ireland (ROI)
Northern Ireland (NI)
All Ireland(ALL)
EU-15Countries
NUMBER RATE NUMBER RATE NUMBER RATE RATE
136 4.4 50 4.7 86 4.3 4.8
205 9.1 64 8.8 141 9.3 8.7
341 6.5 115 6.4 226 6.5 -
84
70
56
42
28
14
RATE PER 100,000
RATE PER 100,000
84
70
56
42
28
14
Females males
All
NI
RoI
0 10 20 30 40
AGES (YEARS) AGES (YEARS)
50 60 70 0 10 20 30 40 50 60 70
Explanatory Notes for these figures and tables are given on pages 33-36.

6.05.6
4.34.64.4
0.4
6.1
4.9
3.8
8
6
4
2
Northern Ireland
SOCIAL CLASS SOCIO-ECONOMIC GROUP
Republic of Ireland
SC1-2 SC3 SC4-5 SEG A SEG B SEG C SEG DUn-assigned
Un-known
RATE PER 100,000
RATE PER 100,000
8
6
4
2
Farmers: 3.8
• The regional directly standardised mortality rate for malignant neoplasms of therectum and anus tended to be higher in urban centres than it was on the wholeisland, although it was only significantly so in Dublin CB.
• There was no other obvious pattern in the regional directly standardised mortality rates.
• Only in NI was there a clear occupational class gradient in mortality frommalignant neoplasms of the rectum and anus.
• In NI the annual directly standardised mortality rate in the lowest occupational classwas significantly (over 60%) higher than the rate in the highest occupational class.
63
2.12 Malignant neoplasms of the rectum and anus (ICD-9 154) 1989-1998
Figure 2.12.2
directly
standardised
mortality rate
ratios, by Region
(All Ireland =
100%)
Figure 2.12.3
Annual Directly
standardised
mortality rates
(per 100,000) for
working age
males, by occupa-
tional class
> 120%
110% - 119%
100% - 109%
90% - 99%
80% - 89%
< 80%
Statistically significant
Females males

Figure 2.13.1
Annual
mortality rates
(per 100,000),
by Age
Malignant neoplasms of the liver and the intrahepatic bile
ducts (ICD-9 155) 1989-1998
2.13
64
TABLE 2.13.1
Annual number
of deaths and
Directly
standardised
mortality rates
(per 100,000)
Inequalities in Mortality
• During 1989-1998 an average of nearly two hundred people died each year on theisland from malignant neoplasms of the liver and intrahepatic bile ducts.
• The all Ireland annual directly standardised mortality rate was 3.4/100,000 persons.• The all Ireland rate was lower than the rate in the (combined) EU-15 countries.• When compared to the (combined) EU-15 countries, the all Ireland rate for both
females and males was lower, and the rate for persons was lower for both NI andthe RoI.
• The all Ireland annual directly standardised mortality rate was significantly higherfor males than it was for females (72% higher).
• This was true in both NI and the RoI.• The directly standardised mortality rate for persons was significantly lower in the
RoI than it was in NI (6% lower).
Females
Males
Persons
Republic of Ireland (ROI)
Northern Ireland (NI)
All Ireland(ALL)
EU-15Countries
NUMBER RATE NUMBER RATE NUMBER RATE RATE
80 2.6 31 2.9 49 2.5 3.9
102 4.5 33 4.5 69 4.5 11.0
182 3.4 64 3.6 118 3.4 -
42
35
28
21
14
7
RATE PER 100,000
RATE PER 100,000
42
35
28
21
14
7
Females males
All
NI
RoI
0 10 20 30 40
AGES (YEARS) AGES (YEARS)
50 60 70 0 10 20 30 40 50 60 70
Explanatory Notes for these figures and tables are given on pages 33-36.

3.5
2.8
2.0
2.8
1.9
0.3
3.12.7
1.9
4
3
2
1
Northern Ireland
SOCIAL CLASS SOCIO-ECONOMIC GROUP
Republic of Ireland
SC1-2 SC3 SC4-5 SEG A SEG B SEG C SEG DUn-assigned
Un-known
RATE PER 100,000
RATE PER 100,000
4
3
2
1
Farmers: 1.1
• There was little significant variation in the regional directly standardised mortalityrates for malignant neoplasms of the liver and intrahepatic bile ducts.
• The rate tended to be higher in urban centres than it was on the whole island.
• Only in NI was there a clear occupational class gradient in mortality frommalignant neoplasms of the liver and intrahepatic bile ducts.
• In both jurisdictions the annual directly standardised mortality rate in the lowestoccupational class was non significantly (over 50%) higher than the rate in thehighest occupational class.
65
2.13 Malignant neoplasms of the liver and the intrahepatic bile ducts (ICD-9 155) 1989-1998
Figure 2.13.2
directly
standardised
mortality rate
ratios, by Region
(All Ireland =
100%)
Figure 2.13.3
Annual Directly
standardised
mortality rates
(per 100,000) for
working age
males, by occupa-
tional class
> 120%
110% - 119%
100% - 109%
90% - 99%
80% - 89%
< 80%
Statistically significant
Females males

Figure 2.14.1
Annual
mortality rates
(per 100,000),
by Age
Malignant neoplasms of the pancreas
(ICD-9 157) 1989-1998
2.14
66
TABLE 2.14.1
Annual number
of deaths and
Directly
standardised
mortality rates
(per 100,000)
Inequalities in Mortality
• During 1989-1998 an average of five hundred people died each year on the islandfrom malignant neoplasms of the pancreas.
• The all Ireland annual directly standardised mortality rate was 9.7/100,000 persons.• The all Ireland rate was comparable to the rate in the (combined) EU-15 countries.• When compared to the (combined) EU-15 countries, the all Ireland rate was
similar for both females and males, and the rate for persons was similar in both NIand the RoI.
• The all Ireland annual directly standardised mortality rate was significantly higherfor males than it was for females (42% higher).
• This was true in both NI and the RoI.• The directly standardised mortality rate for persons was significantly higher in the
RoI than it was in NI (18% higher).
Females
Males
Persons
Republic of Ireland (ROI)
Northern Ireland (NI)
All Ireland(ALL)
EU-15Countries
NUMBER RATE NUMBER RATE NUMBER RATE RATE
252 8.2 79 7.4 173 8.6 7.5
261 11.6 76 10.5 185 12.2 11.2
514 9.7 155 8.7 358 10.3 -
120
100
80
60
40
20
RATE PER 100,000
RATE PER 100,000
120
100
80
60
40
20
Females males
All
NI
RoI
0 10 20 30 40
AGES (YEARS) AGES (YEARS)
50 60 70 0 10 20 30 40 50 60 70
Explanatory Notes for these figures and tables are given on pages 33-36.

5.5
8.1
6.1
7.7
4.9
0.3
8.0
6.9
3.9
10
7.5
5.0
2.5
Northern Ireland
SOCIAL CLASS SOCIO-ECONOMIC GROUP
Republic of Ireland
SC1-2 SC3 SC4-5 SEG A SEG B SEG C SEG DUn-assigned
Un-known
RATE PER 100,000
RATE PER 100,000
10
7.5
5.0
2.5
Farmers: 4.5
• The regional directly standardised mortality rates for malignant neoplasms of thepancreas tended to be lower in NI and higher in the RoI.
• The rate was generally higher in urban centres than it was on the whole island,although not significantly so.
• Only in NI was there a clear occupational class gradient in mortality frommalignant neoplasms of the pancreas.
• In both jurisdictions the annual directly standardised mortality rate in the lowestoccupational class was significantly (over 60%) higher than the rate in the highestoccupational class.
67
2.14 Malignant neoplasms of the pancreas (ICD-9 157) 1989-1998
Figure 2.14.2
directly
standardised
mortality rate
ratios, by Region
(All Ireland =
100%)
Figure 2.14.3
Annual Directly
standardised
mortality rates
(per 100,000) for
working age
males, by occupa-
tional class
> 120%
110% - 119%
100% - 109%
90% - 99%
80% - 89%
< 80%
Statistically significant
Females males

Figure 2.15.1
Annual
mortality rates
(per 100,000),
by Age
Malignant neoplasms of the larynx and
trachea/bronchus/lung (ICD-9 161-162) 1989-1998
2.15
68
TABLE 2.15.1
Annual number
of deaths and
Directly
standardised
mortality rates
(per 100,000)
Inequalities in Mortality
• During 1989-1998 an average of nearly two thousand four hundred people diedeach year on the island from malignant neoplasms of the larynx andtrachea/bronchus/ lung.
• The all Ireland annual directly standardised mortality rate was 46.7/100,000 persons.• When compared to the (combined) EU-15 countries, the all Ireland rate was higher
for females and lower for males.
• The all Ireland annual directly standardised mortality rate was significantly higherfor males than it was for females (162% higher).
• This was true in both NI and the RoI.• The directly standardised mortality rate for persons in the RoI was only slightly
(1%) lower than it was in NI, although this was significant because of the largenumber of deaths involved.
Females
Males
Persons
Republic of Ireland (ROI)
Northern Ireland (NI)
All Ireland(ALL)
EU-15Countries
NUMBER RATE NUMBER RATE NUMBER RATE RATE
790 27.4 265 26.9 525 27.7 15.0
1,606 71.6 545 75.0 1,061 70.0 78.3
2,396 46.7 810 46.9 1,586 46.6 -
600
500
400
300
200
100
RATE PER 100,000
RATE PER 100,000
600
500
400
300
200
100
Females males
All
NI
RoI
0 10 20 30 40
AGES (YEARS) AGES (YEARS)
50 60 70 0 10 20 30 40 50 60 70
Explanatory Notes for these figures and tables are given on pages 33-36.
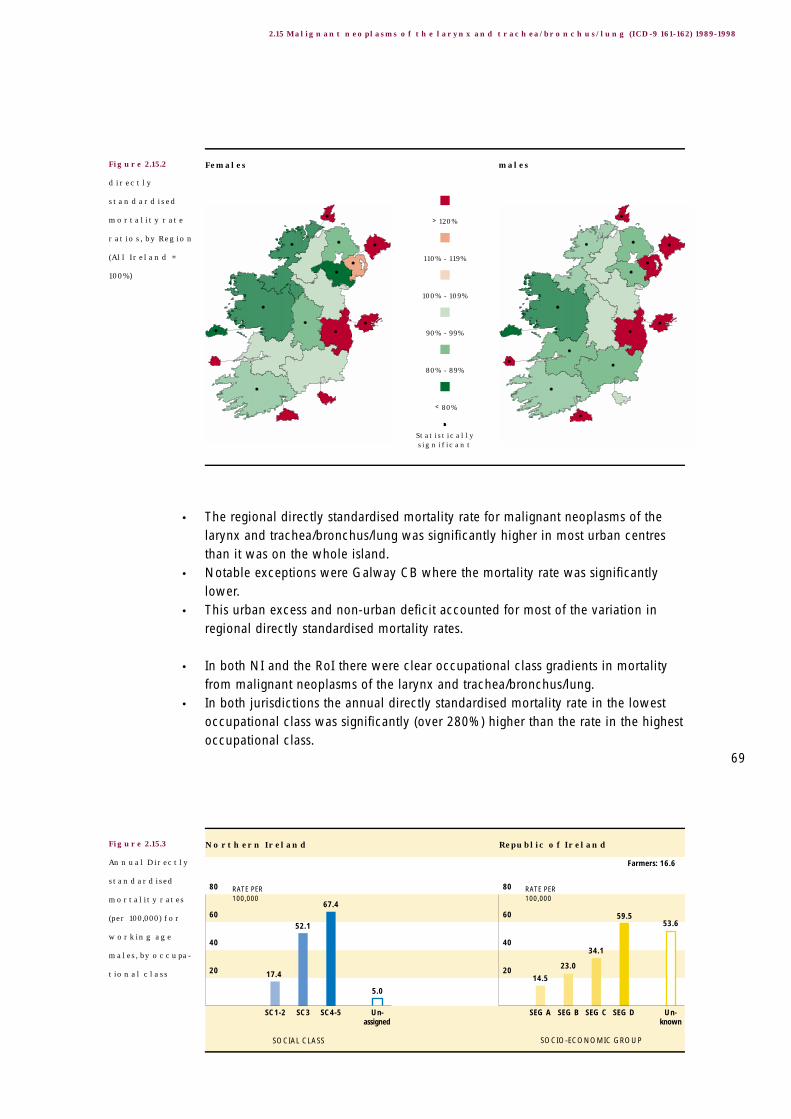
53.659.5
34.1
23.0
14.5
5.0
67.4
52.1
17.4
80
60
40
20
Northern Ireland
SOCIAL CLASS SOCIO-ECONOMIC GROUP
Republic of Ireland
SC1-2 SC3 SC4-5 SEG A SEG B SEG C SEG DUn-assigned
Un-known
RATE PER 100,000
RATE PER 100,000
80
60
40
20
Farmers: 16.6
• The regional directly standardised mortality rate for malignant neoplasms of thelarynx and trachea/bronchus/lung was significantly higher in most urban centresthan it was on the whole island.
• Notable exceptions were Galway CB where the mortality rate was significantlylower.
• This urban excess and non-urban deficit accounted for most of the variation inregional directly standardised mortality rates.
• In both NI and the RoI there were clear occupational class gradients in mortalityfrom malignant neoplasms of the larynx and trachea/bronchus/lung.
• In both jurisdictions the annual directly standardised mortality rate in the lowestoccupational class was significantly (over 280%) higher than the rate in the highestoccupational class.
69
2.15 Malignant neoplasms of the larynx and trachea/bronchus/lung (ICD-9 161-162) 1989-1998
Figure 2.15.2
directly
standardised
mortality rate
ratios, by Region
(All Ireland =
100%)
Figure 2.15.3
Annual Directly
standardised
mortality rates
(per 100,000) for
working age
males, by occupa-
tional class
> 120%
110% - 119%
100% - 109%
90% - 99%
80% - 89%
< 80%
Statistically significant
Females males

Figure 2.16.1
Annual
mortality rates
(per 100,000),
by Age
Malignant neoplasms of the skin (ICD-9 172) 1989-19982.16
70
TABLE 2.16.1
Annual number
of deaths and
Directly
standardised
mortality rates
(per 100,000)
Inequalities in Mortality
• During 1989-1998 an average of nearly one hundred people died each year on theisland from malignant neoplasms of the skin.
• The all Ireland annual directly standardised mortality rate was 1.7/100,000 persons.• The all Ireland rate was comparable to the rate in the (combined) EU-15 countries.• When compared to the (combined) EU-15 countries, the all Ireland rate was
similar for both females and males, and the rate for persons was similar in both NIand the RoI.
• The all Ireland annual directly standardised mortality rate was significantly loweramongst males (4% lower), although the difference was small.
• This was true only in the RoI.• The directly standardised mortality rates for persons in the RoI was significantly
higher than it was in NI (16% higher).
• There was no obvious pattern in the regional directly standardised mortality rates.
Females
Males
Persons
Republic of Ireland (ROI)
Northern Ireland (NI)
All Ireland(ALL)
EU-15Countries
NUMBER RATE NUMBER RATE NUMBER RATE RATE
49 1.7 15 1.5 34 1.9 1.7
38 1.7 12 1.6 26 1.7 2.3
86 1.7 27 1.5 60 1.8 -
18
15
12
9
6
3
RATE PER 100,000
RATE PER 100,000
18
15
12
9
6
3
Females males
All
NI
RoI
0 10 20 30 40
AGES (YEARS) AGES (YEARS)
50 60 70 0 10 20 30 40 50 60 70
Explanatory Notes for these figures and tables are given on pages 33-36.
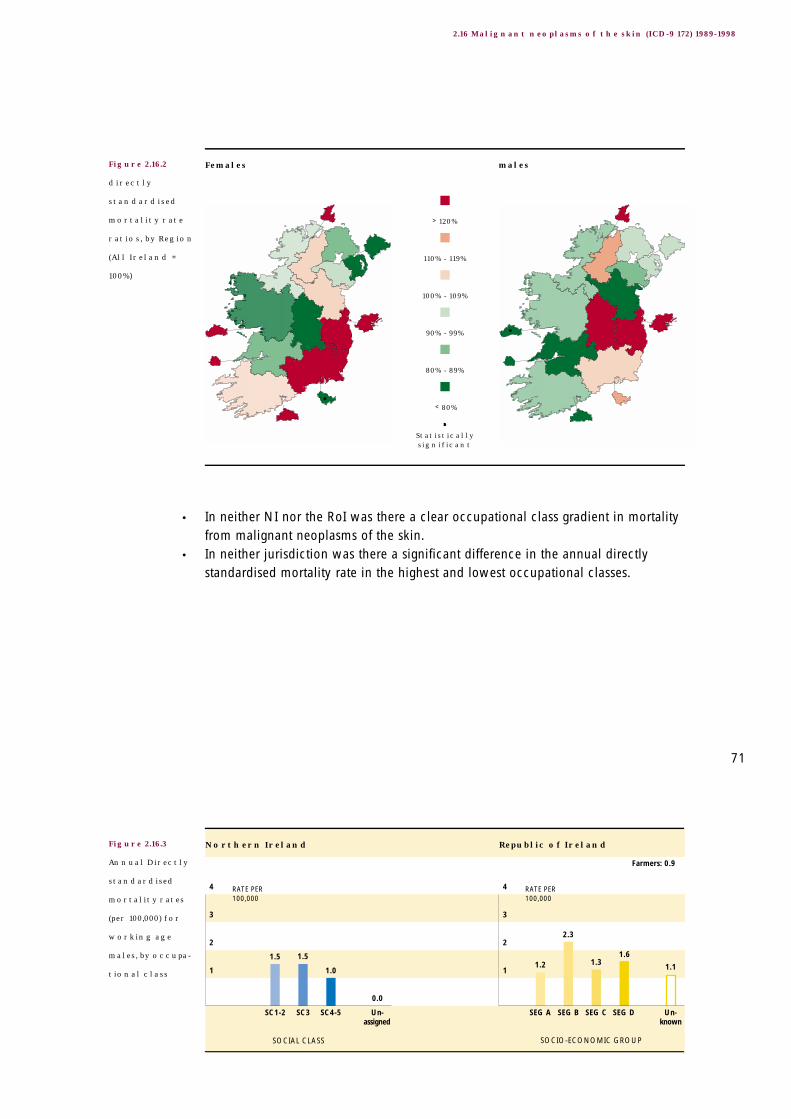
1.1
1.61.3
2.3
1.2
0.0
1.0
1.51.5
4
3
2
1
Northern Ireland
SOCIAL CLASS SOCIO-ECONOMIC GROUP
Republic of Ireland
SC1-2 SC3 SC4-5 SEG A SEG B SEG C SEG DUn-assigned
Un-known
RATE PER 100,000
RATE PER 100,000
4
3
2
1
Farmers: 0.9
• In neither NI nor the RoI was there a clear occupational class gradient in mortalityfrom malignant neoplasms of the skin.
• In neither jurisdiction was there a significant difference in the annual directlystandardised mortality rate in the highest and lowest occupational classes.
71
2.16 Malignant neoplasms of the skin (ICD-9 172) 1989-1998
Figure 2.16.2
directly
standardised
mortality rate
ratios, by Region
(All Ireland =
100%)
Figure 2.16.3
Annual Directly
standardised
mortality rates
(per 100,000) for
working age
males, by occupa-
tional class
> 120%
110% - 119%
100% - 109%
90% - 99%
80% - 89%
< 80%
Statistically significant
Females males

Figure 2.17.1
Annual
mortality rates
(per 100,000),
by Age
Malignant neoplasms of the (female) breast
(ICD-9 174) 1989-1998
2.17
72
TABLE 2.17.1
Annual number
of deaths and
Directly
standardised
mortality rates
(per 100,000)
Inequalities in Mortality
• During 1989-1998 an average of nearly one thousand women died each year onthe island from malignant neoplasms of the breast.
• The all Ireland annual directly standardised mortality rate was 36.6/100,000females.
• The all Ireland rate was higher than the rate in the (combined) EU-15 countries.• When compared to the (combined) EU-15 countries, the all Ireland rate was higher
in both NI and the RoI.
• The directly standardised mortality rate was significantly higher in the RoI than itwas in NI (8% higher).
Females
Republic of Ireland (ROI)
Northern Ireland (NI)
All Ireland(ALL)
EU-15Countries
NUMBER RATE NUMBER RATE NUMBER RATE RATE
954 36.3 311 34.5 643 37.2 30.5
198
165
132
99
66
33
RATE PER 100,000
Females
All
NI
RoI
0 10 20 30 40
AGES (YEARS)
50 60 70
Explanatory Notes for these figures and tables are given on pages 33-36.

• Generally speaking, when compared to the whole island the regional directlystandardised mortality rates tended to be higher in the RoI and lower in NI.
• There was, however, little significant regional variation.• The one exception was a significantly higher rate in Dublin CB.
Occupational class differences in mortality from malignant neoplasms of the(female) breast were not assessed because of general problems associated withoccupation coding for women. See Section 5.3 for further details.
The drop in the age specific mortality rate in the 65-69 years age group in NI isnoteworthy.
73
2.17 Malignant neoplasms of the (female) breast (ICD-9 174-175) 1989-1998
Figure 2.17.2
directly
standardised
mortality rate
ratios, by Region
(All Ireland =
100%)
> 120%
110% - 119%
100% - 109%
90% - 99%
80% - 89%
< 80%
Statistically significant
Females males

Figure 2.18.1
Annual
mortality rates
(per 100,000),
by Age
Malignant neoplasms of the cervix uteri
(ICD-9 180) 1989-1998
2.18
74
TABLE 2.18.1
Annual number
of deaths and
Directly
standardised
mortality rates
(per 100,000)
Inequalities in Mortality
• During 1989-1998 an average of one hundred women died each year on theisland from malignant neoplasms of the cervix uteri.
• The all Ireland annual directly standardised mortality rate was 4.2/100,000females.
• The all Ireland rate was higher than the rate in the (combined) EU-15 countries.• When compared to the (combined) EU-15 countries, the all Ireland rate was higher
in both NI and the RoI.
• The directly standardised mortality rate was significantly higher in the RoI than itwas in NI (6% higher).
Females
Republic of Ireland (ROI)
Northern Ireland (NI)
All Ireland(ALL)
EU-15Countries
NUMBER RATE NUMBER RATE NUMBER RATE RATE
105 4.2 34 4.0 71 4.3 3.0
18
15
12
9
6
3
RATE PER 100,000
Females
All
NI
RoI
0 10 20 30 40
AGES (YEARS)
50 60 70
Explanatory Notes for these figures and tables are given on pages 33-36.

• The regional directly standardised mortality rate for malignant neoplasms of thecervix uteri tended to be higher in urban centres than on the whole island,although not significantly.
• The exceptions were Galway CB and Cork CB where the rate was non-significantlylower than it was the whole island.
Occupational class differences in mortality from malignant neoplasms of the cervixuteri were not assessed because of general problems associated with occupationcoding for women. See Section 5.3 for further details.
75
2.18 Malignant neoplasms of the cervix uteri (ICD-9 180) 1989-1998
Figure 2.18.2
directly
standardised
mortality rate
ratios, by Region
(All Ireland =
100%)
> 120%
110% - 119%
100% - 109%
90% - 99%
80% - 89%
< 80%
Statistically significant
Females males
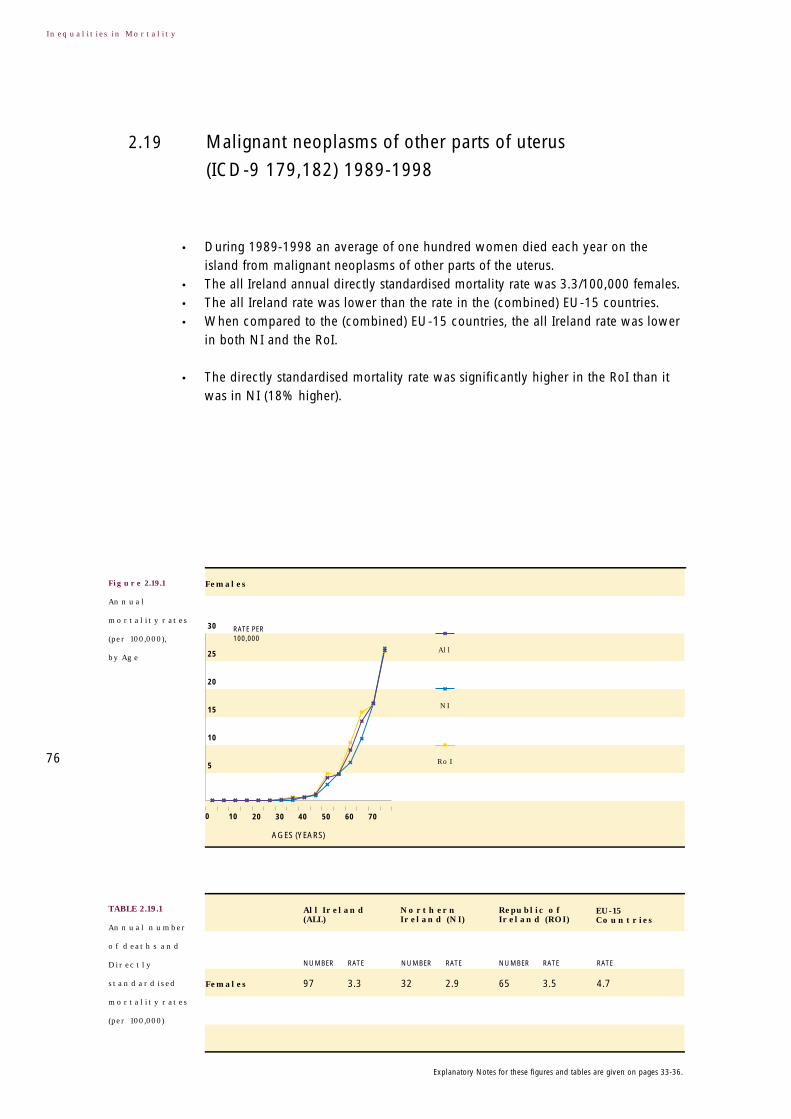
Figure 2.19.1
Annual
mortality rates
(per 100,000),
by Age
Malignant neoplasms of other parts of uterus
(ICD-9 179,182) 1989-1998
2.19
76
TABLE 2.19.1
Annual number
of deaths and
Directly
standardised
mortality rates
(per 100,000)
Inequalities in Mortality
• During 1989-1998 an average of one hundred women died each year on theisland from malignant neoplasms of other parts of the uterus.
• The all Ireland annual directly standardised mortality rate was 3.3/100,000 females.• The all Ireland rate was lower than the rate in the (combined) EU-15 countries.• When compared to the (combined) EU-15 countries, the all Ireland rate was lower
in both NI and the RoI.
• The directly standardised mortality rate was significantly higher in the RoI than itwas in NI (18% higher).
Females
Republic of Ireland (ROI)
Northern Ireland (NI)
All Ireland(ALL)
EU-15Countries
NUMBER RATE NUMBER RATE NUMBER RATE RATE
97 3.3 32 2.9 65 3.5 4.7
30
25
20
15
10
5
RATE PER 100,000
Females
All
NI
RoI
0 10 20 30 40
AGES (YEARS)
50 60 70
Explanatory Notes for these figures and tables are given on pages 33-36.

• The regional directly standardised mortality rate for malignant neoplasms of otherparts of the uterus tended to be higher in urban centres than on the whole island,although not significantly.
• The exceptions were Dublin CB and Derry LGD where the rate was non-significantlylower than the whole island.
Occupational class differences in mortality from malignant neoplasms of otherparts of the uterus were not assessed because of general problems associated withoccupation coding for women. See Section 5.3 for further details.
77
2.19 Malignant neoplasms of other parts of uterus (ICD-9 179,182) 1989-1998
Figure 2.19.2
directly
standardised
mortality rate
ratios, by Region
(All Ireland =
100%)
> 120%
110% - 119%
100% - 109%
90% - 99%
80% - 89%
< 80%
Statistically significant
Females males

Figure 2.20.1
Annual
mortality rates
(per 100,000),
by Age
Malignant neoplasms of the ovary
(ICD-9 183.0) 1989-1998
2.20
78
TABLE 2.20.1
Annual number
of deaths and
Directly
standardised
mortality rates
(per 100,000)
Inequalities in Mortality
• During 1989-1998 an average of three hundred women died each year on theisland from malignant neoplasms of the ovary.
• The all Ireland annual directly standardised mortality rate was 11.5/100,000females.
• The all Ireland rate was higher than the rate in the (combined) EU-15 countries.• When compared to the (combined) EU-15 countries, the all Ireland rate was higher
in both NI and the RoI.
• The directly standardised mortality rate was significantly higher in the RoI than itwas in NI (23% higher)
Females
Republic of Ireland (ROI)
Northern Ireland (NI)
All Ireland(ALL)
EU-15Countries
NUMBER RATE NUMBER RATE NUMBER RATE RATE
302 11.5 90 10.0 212 12.3 8.9
60
50
40
30
20
10
RATE PER 100,000
Females
All
NI
RoI
0 10 20 30 40
AGES (YEARS)
50 60 70
Explanatory Notes for these figures and tables are given on pages 33-36.

• When compared to the whole island, the regional directly standardised mortalityrate for malignant neoplasms of the ovary tended to be higher in the southern partof the island and lower in the northern part of the island. This variation was mostlynon-significant.
Occupational class differences in mortality from malignant neoplasms of the ovarywere not assessed because of general problems associated with occupation codingfor women. See Section 5.3 for further details.
79
2.20 Malignant neoplasms of the ovaries (ICD-9 183.0) 1989-1998
Figure 2.20.2
directly
standardised
mortality rate
ratios, by Region
(All Ireland =
100%)
> 120%
110% - 119%
100% - 109%
90% - 99%
80% - 89%
< 80%
Statistically significant
Females males

Figure 2.21.1
Annual
mortality rates
(per 100,000),
by Age
Malignant neoplasms of the prostate
(ICD-9 185) 1989-1998
2.21
80
TABLE 2.21.1
Annual number
of deaths and
Directly
standardised
mortality rates
(per 100,000)
Inequalities in Mortality
• During 1989-1998 an average of nearly seven hundred men died each year on theisland from malignant neoplasms of the prostate.
• The all Ireland annual directly standardised mortality rate was 29.2/100,000 males.• The all Ireland rate was slightly higher than the rate in the (combined) EU-15
countries.• When compared to the (combined) EU-15 countries, the all Ireland rate was lower
in NI but higher in the RoI.
• The directly standardised mortality rate was significantly higher in the RoI than itwas in NI (19% higher).
Males
Republic of Ireland (ROI)
Northern Ireland (NI)
All Ireland(ALL)
EU-15Countries
NUMBER RATE NUMBER RATE NUMBER RATE RATE
689 29.2 198 26.0 491 30.8 27.8
RATE PER 100,000
498
415
332
249
166
83
males
All
NI
RoI
AGES (YEARS)
0 10 20 30 40 50 60 70
Explanatory Notes for these figures and tables are given on pages 33-36.
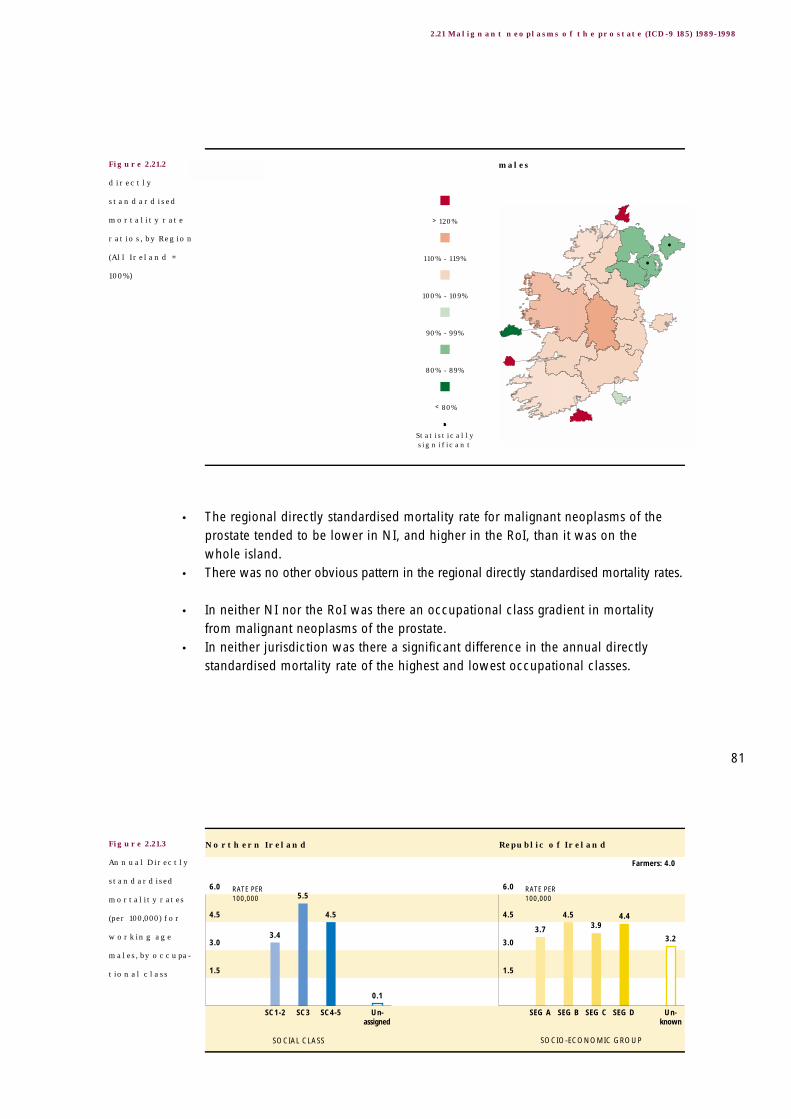
3.2
4.43.9
4.5
3.7
0.1
4.5
5.5
3.4
6.0
4.5
3.0
1.5
Northern Ireland
SOCIAL CLASS SOCIO-ECONOMIC GROUP
Republic of Ireland
SC1-2 SC3 SC4-5 SEG A SEG B SEG C SEG DUn-assigned
Un-known
RATE PER 100,000
RATE PER 100,000
6.0
4.5
3.0
1.5
Farmers: 4.0
• The regional directly standardised mortality rate for malignant neoplasms of theprostate tended to be lower in NI, and higher in the RoI, than it was on the whole island.
• There was no other obvious pattern in the regional directly standardised mortality rates.
• In neither NI nor the RoI was there an occupational class gradient in mortalityfrom malignant neoplasms of the prostate.
• In neither jurisdiction was there a significant difference in the annual directlystandardised mortality rate of the highest and lowest occupational classes.
81
2.21 Malignant neoplasms of the prostate (ICD-9 185) 1989-1998
Figure 2.21.2
directly
standardised
mortality rate
ratios, by Region
(All Ireland =
100%)
Figure 2.21.3
Annual Directly
standardised
mortality rates
(per 100,000) for
working age
males, by occupa-
tional class
> 120%
110% - 119%
100% - 109%
90% - 99%
80% - 89%
< 80%
Statistically significant
Females males

Figure 2.22.1
Annual
mortality rates
(per 100,000),
by Age
Malignant neoplasms of the kidney
(ICD-9 189.0) 1989-1998
2.22
82
TABLE 2.22.1
Annual number
of deaths and
Directly
standardised
mortality rates
(per 100,000)
Inequalities in Mortality
• During 1989-1998 an average of nearly two hundred people died each year on theisland from malignant neoplasms of the kidney.
• The all Ireland annual directly standardised mortality rate was 3.7/100,000 persons.• The all Ireland rate was lower than the rate in the (combined) EU-15 countries.• When compared to the (combined) EU-15 countries, the all Ireland rate for both
females and males was lower, and the rate for persons was lower in both NI andthe RoI.
• The all Ireland annual directly standardised mortality rate was significantly higherfor males than it was for females (114% higher).
• This was true in both NI and the RoI.• There was no significant difference in the directly standardised mortality rate for
persons in NI and the RoI.
Females
Males
Persons
Republic of Ireland (ROI)
Northern Ireland (NI)
All Ireland(ALL)
EU-15Countries
NUMBER RATE NUMBER RATE NUMBER RATE RATE
72 2.5 27 2.7 45 2.4 2.7
117 5.3 41 5.7 76 5.1 6.3
189 3.7 68 4.0 121 3.6 -
36
30
24
18
12
6
RATE PER 100,000
RATE PER 100,000
36
30
24
18
12
6
Females males
All
NI
RoI
0 10 20 30 40
AGES (YEARS) AGES (YEARS)
50 60 70 0 10 20 30 40 50 60 70
Explanatory Notes for these figures and tables are given on pages 33-36.
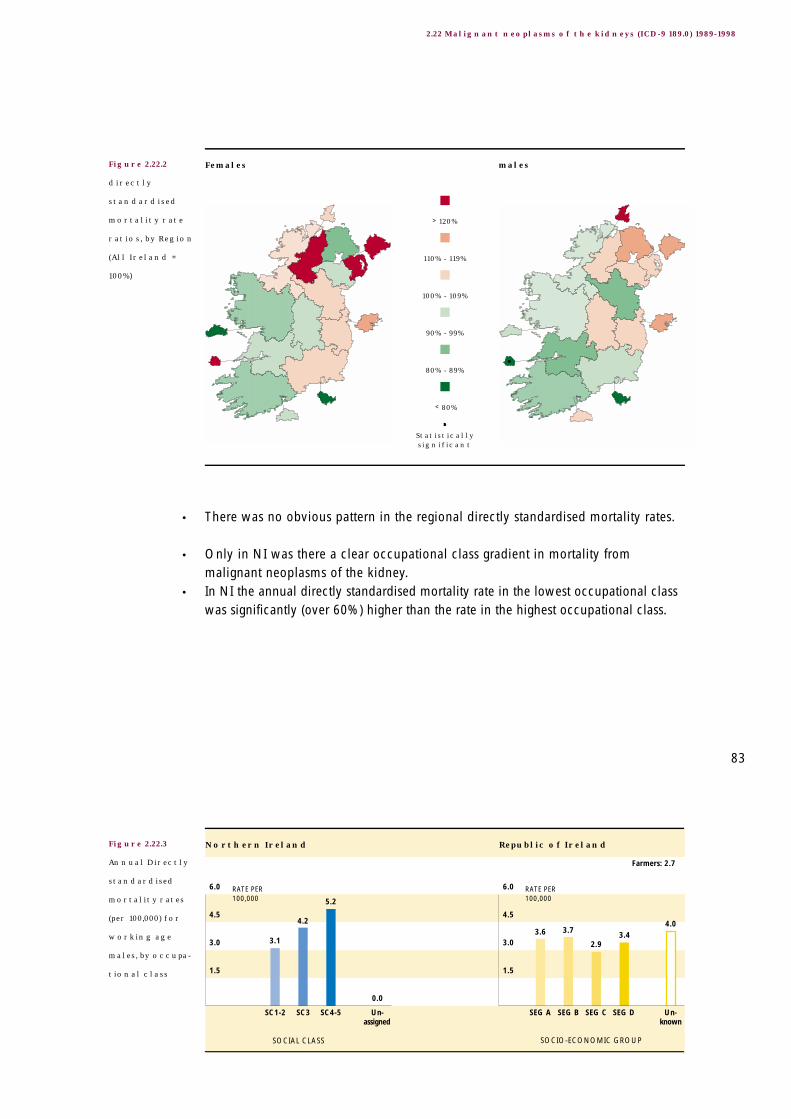
4.03.4
2.9
3.73.6
0.0
5.2
4.2
3.1
6.0
4.5
3.0
1.5
Northern Ireland
SOCIAL CLASS SOCIO-ECONOMIC GROUP
Republic of Ireland
SC1-2 SC3 SC4-5 SEG A SEG B SEG C SEG DUn-assigned
Un-known
RATE PER 100,000
RATE PER 100,000
6.0
4.5
3.0
1.5
Farmers: 2.7
• There was no obvious pattern in the regional directly standardised mortality rates.
• Only in NI was there a clear occupational class gradient in mortality frommalignant neoplasms of the kidney.
• In NI the annual directly standardised mortality rate in the lowest occupational classwas significantly (over 60%) higher than the rate in the highest occupational class.
83
2.22 Malignant neoplasms of the kidneys (ICD-9 189.0) 1989-1998
Figure 2.22.2
directly
standardised
mortality rate
ratios, by Region
(All Ireland =
100%)
Figure 2.22.3
Annual Directly
standardised
mortality rates
(per 100,000) for
working age
males, by occupa-
tional class
> 120%
110% - 119%
100% - 109%
90% - 99%
80% - 89%
< 80%
Statistically significant
Females males

Figure 2.23.1
Annual
mortality rates
(per 100,000),
by Age
Malignant neoplasms of the bladder
(ICD-9 188) 1989-1998
2.23
84
TABLE 2.23.1
Annual number
of deaths and
Directly
standardised
mortality rates
(per 100,000)
Inequalities in Mortality
• During 1989-1998 an average of two hundred and fifty people died each year onthe island from malignant neoplasms of the bladder.
• The all Ireland annual directly standardised mortality rate was 4.5/100,000 persons.• The all Ireland rate was lower than the rate in the (combined) EU-15 countries.• When compared to the (combined) EU-15 countries, the all Ireland rate for both
females and males was lower, and the rate for persons was lower in both NI andthe RoI.
• The all Ireland annual directly standardised mortality rate was significantly higherfor males than it was for females (202% higher).
• This was true in both NI and the RoI.• The directly standardised mortality rate for persons was significantly lower in the
RoI than it was in NI (6% lower).
Females
Males
Persons
Republic of Ireland (ROI)
Northern Ireland (NI)
All Ireland(ALL)
EU-15Countries
NUMBER RATE NUMBER RATE NUMBER RATE RATE
81 2.4 30 2.6 51 2.4 2.5
170 7.4 59 7.9 111 7.1 11.5
252 4.5 90 4.7 162 4.4 -
108
90
72
54
36
18
RATE PER 100,000
RATE PER 100,000
108
90
72
54
36
18
Females males
All
NI
RoI
0 10 20 30 40
AGES (YEARS) AGES (YEARS)
50 60 70 0 10 20 30 40 50 60 70
Explanatory Notes for these figures and tables are given on pages 33-36.

2.0
3.6
1.81.72.2
0.5
3.0
4.1
1.0
6.0
4.5
3.0
1.5
Northern Ireland
SOCIAL CLASS SOCIO-ECONOMIC GROUP
Republic of Ireland
SC1-2 SC3 SC4-5 SEG A SEG B SEG C SEG DUn-assigned
Un-known
RATE PER 100,000
RATE PER 100,000
6.0
4.5
3.0
1.5
Farmers: 0.7
• The regional directly standardised mortality rate for malignant neoplasms of thebladder tended to be higher in urban centres than it was on the whole island,although not significantly so.
• Exceptions were Galway CB and Waterford CB.• There was no other obvious pattern in the regional directly standardised mortality
rates.
• In neither NI nor the RoI was there a clear occupational class gradient in mortalityfrom malignant neoplasms of the bladder.
• In both jurisdictions the annual directly standardised mortality rate in the lowestoccupational class was significantly (over 60%) higher than the rate in the highestoccupational class.
85
2.23 Malignant neoplasms of the bladder (ICD-9 188) 1989-1998
Figure 2.23.2
directly
standardised
mortality rate
ratios, by Region
(All Ireland =
100%)
Figure 2.23.3
Annual Directly
standardised
mortality rates
(per 100,000) for
working age
males, by occupa-
tional class
> 120%
110% - 119%
100% - 109%
90% - 99%
80% - 89%
< 80%
Statistically significant
Females males

Figure 2.24.1
Annual
mortality rates
(per 100,000),
by Age
Malignant neoplasms of the lymph/haematopoietic tissue
(ICD-9 200-208) 1989-1998
2.24
86
TABLE 2.24.1
Annual number
of deaths and
Directly
standardised
mortality rates
(per 100,000)
Inequalities in Mortality
• During 1989-1998 an average of eight hundred and fifty people died each year onthe island from malignant neoplasms of the lymph/haematopoietic tissue.
• The all Ireland annual directly standardised mortality rate was 16.4/100,000 persons.• The all Ireland rate was higher than the rate in the (combined) EU-15 countries.• When compared to the (combined) EU-15 countries, the all Ireland rate for both
females and males was higher, and the rate for persons was higher in both NI andthe RoI.
• The all Ireland annual directly standardised mortality rate was significantly higherfor males than it was for females (58% higher).
• This was true in both NI and the RoI.• The directly standardised mortality rate for persons was significantly higher in the
RoI than it was in NI (12% higher).
Females
Males
Persons
Republic of Ireland (ROI)
Northern Ireland (NI)
All Ireland(ALL)
EU-15Countries
NUMBER RATE NUMBER RATE NUMBER RATE RATE
385 13.0 123 12.1 263 13.5 11.7
473 20.6 143 19.4 330 21.2 18.5
859 16.4 266 15.2 593 17.0 -
180
150
120
90
60
30
RATE PER 100,000
RATE PER 100,000
180
150
120
90
60
30
Females males
All
NI
RoI
0 10 20 30 40
AGES (YEARS) AGES (YEARS)
50 60 70 0 10 20 30 40 50 60 70
Explanatory Notes for these figures and tables are given on pages 33-36.

10.0
22.0
9.49.78.6
3.2
14.312.7
9.4
24
18
12
6
Northern Ireland
SOCIAL CLASS SOCIO-ECONOMIC GROUP
Republic of Ireland
SC1-2 SC3 SC4-5 SEG A SEG B SEG C SEG DUn-assigned
Un-known
RATE PER 100,000
RATE PER 100,000
24
18
12
6
Farmers: 11.4
• When compared to the whole island, the regional directly standardised mortalityrates for malignant neoplasms of the lymph/haematopoietic tissue tended to behigher in the southern parts of the island and lower in the northern parts. Only theexcess mortality in the Southern HB in the RoI was statistically significant.
• There was no other obvious pattern in the regional directly standardised mortalityrates.
• In neither NI nor the RoI was there a clear occupational class gradient in mortalityfrom malignant neoplasms of the lymph/haematopoietic tissue.
• In both jurisdictions the annual directly standardised mortality rate in the lowestoccupational class was significantly (over 50%) higher than the rate in the highestoccupational class.
87
2. 24 Malignant neoplasms of the lymph/haematopoietic tissue (ICD-9 200-208) 1989-1998
Figure 2.24.2
directly
standardised
mortality rate
ratios, by Region
(All Ireland =
100%)
Figure 2.24.3
Annual Directly
standardised
mortality rates
(per 100,000) for
working age
males, by occupa-
tional class
> 120%
110% - 119%
100% - 109%
90% - 99%
80% - 89%
< 80%
Statistically significant
Females males

Figure 2.25.1
Annual
mortality rates
(per 100,000),
by Age
Diseases of the blood and blood-forming organs,
immunological disorders (ICD-9 279-289) 1989-1998
2.25
88
TABLE 2.25.1
Annual number
of deaths and
Directly
standardised
mortality rates
(per 100,000)
Inequalities in Mortality
• During 1989-1998 an average of one hundred and fifty people died each year onthe island from diseases of the blood and blood-forming organs, immunologicaldisorders.
• The all Ireland annual directly standardised mortality rate was 2.5/100,000 persons.• The all Ireland rate was similar to the rate in the (combined) EU-15 countries.• When compared to the (combined) EU-15 countries, the all Ireland rate for both
females and males was similar, and the rate for persons was lower in NI and higherin the RoI.
• The all Ireland annual directly standardised mortality rate was significantly higherfor males than it was for females (27% higher).
• This was true in both NI and the RoI.• The directly standardised mortality rate for persons was significantly higher in the
RoI than it was in NI (148% higher).
Females
Males
Persons
Republic of Ireland (ROI)
Northern Ireland (NI)
All Ireland(ALL)
EU-15Countries
NUMBER RATE NUMBER RATE NUMBER RATE RATE
77 2.3 16 1.4 61 2.7 2.1
68 2.9 11 1.5 57 3.6 3.1
145 2.5 28 1.4 117 3.1 -
48
40
32
24
16
8
RATE PER 100,000
RATE PER 100,000
48
40
32
24
16
8
Females males
All
NI
RoI
0 10 20 30 40
AGES (YEARS) AGES (YEARS)
50 60 70 0 10 20 30 40 50 60 70
Explanatory Notes for these figures and tables are given on pages 33-36.

1.1
2.5
0.81.11.2
0.6
1.5
0.40.6
4
3
2
1
Northern Ireland
SOCIAL CLASS SOCIO-ECONOMIC GROUP
Republic of Ireland
SC1-2 SC3 SC4-5 SEG A SEG B SEG C SEG DUn-assigned
Un-known
RATE PER 100,000
RATE PER 100,000
4
3
2
1
Farmers: 0.6
• When compared to the whole island, the regional directly standardised mortalityrates for diseases of the blood and blood-forming organs, immunological disorderstended to be higher in the southern parts of the island and lower in the northernparts, sometimes significantly so.
• Mortality in urban centres tended to follow this pattern.
• In neither NI nor the RoI was there a clear occupational class gradient in mortalityfrom diseases of the blood and blood-forming organs, immunological disorders.
• In both jurisdictions, the annual directly standardised mortality rate in the lowestoccupational class was significantly (over 100%) higher than the rate in the highestoccupational class.
89
2.25 Diseases of the blood(-forming organs), immunological disorders (ICD-9 279-289) 1989-1998
Figure 2.25.2
directly
standardised
mortality rate
ratios, by Region
(All Ireland =
100%)
Figure 2.25.3
Annual Directly
standardised
mortality rates
(per 100,000) for
working age
males, by occupa-
tional class
> 120%
110% - 119%
100% - 109%
90% - 99%
80% - 89%
< 80%
Statistically significant
Females males

Figure 2.26.1
Annual
mortality rates
(per 100,000),
by Age
Endocrine, nutritional and metabolic diseases
(ICD-9 240-278) 1989-1998
2.26
90
TABLE 2.26.1
Annual number
of deaths and
Directly
standardised
mortality rates
(per 100,000)
Inequalities in Mortality
• During 1989-1998 an average of six hundred and forty people died each year onthe island from endocrine, nutritional and metabolic diseases.
• The all Ireland annual directly standardised mortality rate was 11.5/100,000 persons.• The all Ireland rate was lower than the rate in the (combined) EU-15 countries.• When compared to the (combined) EU-15 countries, the all Ireland rate for both females
and males was lower, and the rate for persons was lower in both NI and the RoI.
• The all Ireland annual directly standardised mortality rate was significantly higherfor males than it was for females (35% higher).
• This was true in both NI and the RoI.• The directly standardised mortality rate for persons was significantly higher in the
RoI than it was in NI (245% higher).
Females
Males
Persons
Republic of Ireland (ROI)
Northern Ireland (NI)
All Ireland(ALL)
EU-15Countries
NUMBER RATE NUMBER RATE NUMBER RATE RATE
327 10.1 44 4.2 283 13.2 16.9
313 13.5 35 4.7 278 17.7 18.0
640 11.5 79 4.4 562 15.2 -
222
185
148
111
74
37
RATE PER 100,000
RATE PER 100,000
222
185
148
111
74
37
Females males
All
NI
RoI
0 10 20 30 40
AGES (YEARS) AGES (YEARS)
50 60 70 0 10 20 30 40 50 60 70
Explanatory Notes for these figures and tables are given on pages 33-36.

7.0
11.4
4.8
6.3
3.5
1.6
3.52.92.9
12
9
6
3
Northern Ireland
SOCIAL CLASS SOCIO-ECONOMIC GROUP
Republic of Ireland
SC1-2 SC3 SC4-5 SEG A SEG B SEG C SEG DUn-assigned
Un-known
RATE PER 100,000
RATE PER 100,000
12
9
6
3
Farmers: 5.2
• When compared to the whole island, the regional directly standardised mortalityrates for endocrine, nutritional and metabolic diseases were significantly lower inNI and significantly higher in the RoI.
• Mortality rates in urban centres tended to follow this pattern. Exceptions wereGalway CB and Waterford CB.
• In neither NI or the RoI was there a clear occupational class gradient in mortalityfrom endocrine, nutritional and metabolic diseases.
• In the RoI the annual directly standardised mortality rate in the lowestoccupational class was significantly (over 230%) higher than the rate in the highestoccupational class.
The cautionary comments made in Section 2.27 about the effects of North-Southdifferences in data collection protocols and procedures on diabetes mellitusmortality, also apply to 'endocrine, nutritional and metabolic diseases'.
91
2.26 Edocrine, nutritional and metabolic diseases (ICD-9 240-278) 1989-1998
Figure 2.26.2
directly
standardised
mortality rate
ratios, by Region
(All Ireland =
100%)
Figure 2.26.3
Annual Directly
standardised
mortality rates
(per 100,000) for
working age
males, by occupa-
tional class
> 120%
110% - 119%
100% - 109%
90% - 99%
80% - 89%
< 80%
Statistically significant
Females males

Figure 2.27.1
Annual
mortality rates
(per 100,000),
by Age
Diabetes mellitus (ICD-9 250) 1989-19982.27
92
TABLE 2.27.1
Annual number
of deaths and
Directly
standardised
mortality rates
(per 100,000)
Inequalities in Mortality
• During 1989-1998 an average of four hundred and eighty people died each yearon the island from diabetes mellitus.
• The all Ireland annual directly standardised mortality rate was 8.6/100,000 persons.• The all Ireland rate was lower than the rate in the (combined) EU-15 countries.• When compared to the (combined) EU-15 countries, the all Ireland rate for both females
and males was lower, and the rate for persons was lower in both NI and the RoI.
• The all Ireland annual directly standardised mortality rate was significantly higherfor males than it was for females (48% higher).
• This was true in both NI and the RoI.• The directly standardised mortality rate for persons was significantly higher in the
RoI than it was in NI (372% higher).
• The difference between the jurisdictions was reflected at the regional level. Whencompared to the whole island, the regional directly standardised mortality rates
Females
Males
Persons
Republic of Ireland (ROI)
Northern Ireland (NI)
All Ireland(ALL)
EU-15Countries
NUMBER RATE NUMBER RATE NUMBER RATE RATE
239 7.1 26 2.4 213 9.8 13.5
243 10.5 20 2.7 223 14.3 14.3
482 8.6 46 2.5 436 11.8 -
180
150
120
90
60
30
RATE PER 100,000
RATE PER 100,000
180
150
120
90
60
30
Females males
All
NI
RoI
0 10 20 30 40
AGES (YEARS) AGES (YEARS)
50 60 70 0 10 20 30 40 50 60 70
Explanatory Notes for these figures and tables are given on pages 33-36.

5.5
7.0
3.6
5.3
2.1
0.6
2.21.7
0.7
8
6
4
2
Northern Ireland
SOCIAL CLASS SOCIO-ECONOMIC GROUP
Republic of Ireland
SC1-2 SC3 SC4-5 SEG A SEG B SEG C SEG DUn-assigned
Un-known
RATE PER 100,000
RATE PER 100,000
8
6
4
2
Farmers: 3.8
were lower in all regions in NI and higher in nearly all regions in the RoI. Most ofthese differences were statistically significant.
• The only exceptions were Galway CB where the rate was lower than on the wholeisland, and Waterford CB where it was lower amongst females.
• Only in NI was there a clear occupational class gradient in mortality from diabetes mellitus.
• In both jurisdictions the annual directly standardised mortality rate in the lowestoccupational class was significantly (over 230%) higher than the rate in the highest occupational class.
North-South differences in protocols used to identify diabetes mellitus as theprimary cause of death may account for much of the higher mortality rate observedin the RoI. See Section 5.3 for further details. 93
2.27 Diabetes mellitus (ICD-9 250) 1989-1998
Figure 2.27.2
directly
standardised
mortality rate
ratios, by Region
(All Ireland =
100%)
Figure 2.27.3
Annual Directly
standardised
mortality rates
(per 100,000) for
working age
males, by occupa-
tional class
> 120%
110% - 119%
100% - 109%
90% - 99%
80% - 89%
< 80%
Statistically significant
Females males

Figure 2.28.1
Annual
mortality rates
(per 100,000),
by Age
Mental and behavioural disorders
(ICD-9 290-319) 1989-1998
2.28
94
TABLE 2.28.1
Annual number
of deaths and
Directly
standardised
mortality rates
(per 100,000)
Inequalities in Mortality
• During 1989-1998 an average of three hundred and fifty people died each year onthe island from mental and behavioural disorders.
• The all Ireland annual directly standardised mortality rate was 6.5/100,000 persons.• The all Ireland rate was lower than the rate in the (combined) EU-15 countries.• When compared to the (combined) EU-15 countries, the all Ireland rate for both females
and males was lower, and the rate for persons was lower in both NI and the RoI.
• The all Ireland annual directly standardised mortality rate was significantly higherfor males than it was for females (31% higher).
• This was true in both NI and the RoI.• The directly standardised mortality rate for persons was significantly higher in the
RoI than it was in NI (53% higher).
• The regional directly standardised mortality rates for mental and behavioural disorderstended to be higher in the urban centres than they were on the whole island.
Females
Males
Persons
Republic of Ireland (ROI)
Northern Ireland (NI)
All Ireland(ALL)
EU-15Countries
NUMBER RATE NUMBER RATE NUMBER RATE RATE
189 5.5 43 3.8 147 6.5 9.5
170 7.3 40 5.7 129 8.0 14.2
359 6.5 83 4.8 276 7.3 -
120
100
80
60
40
20
RATE PER 100,000
RATE PER 100,000
120
100
80
60
40
20
Females males
All
NI
RoI
0 10 20 30 40
AGES (YEARS) AGES (YEARS)
50 60 70 0 10 20 30 40 50 60 70
Explanatory Notes for these figures and tables are given on pages 33-36.
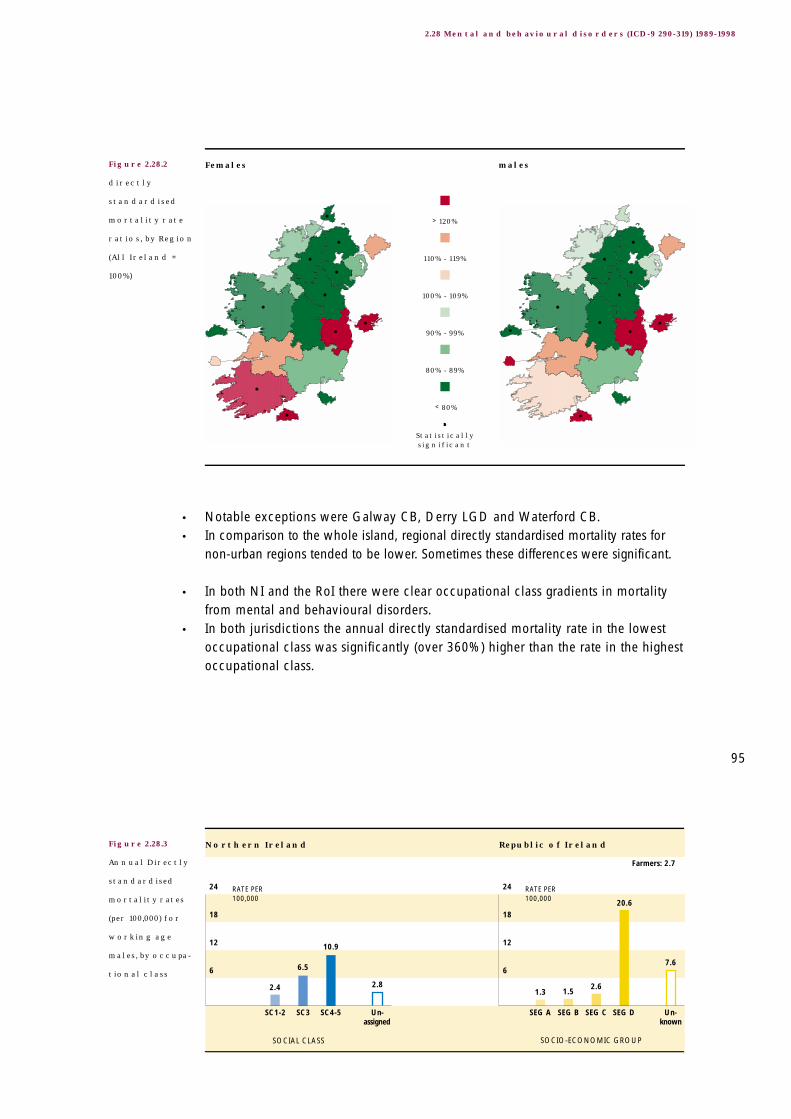
7.6
20.6
2.61.51.3
2.8
10.9
6.5
2.4
24
18
12
6
Northern Ireland
SOCIAL CLASS SOCIO-ECONOMIC GROUP
Republic of Ireland
SC1-2 SC3 SC4-5 SEG A SEG B SEG C SEG DUn-assigned
Un-known
RATE PER 100,000
RATE PER 100,000
24
18
12
6
Farmers: 2.7
• Notable exceptions were Galway CB, Derry LGD and Waterford CB.• In comparison to the whole island, regional directly standardised mortality rates for
non-urban regions tended to be lower. Sometimes these differences were significant.
• In both NI and the RoI there were clear occupational class gradients in mortalityfrom mental and behavioural disorders.
• In both jurisdictions the annual directly standardised mortality rate in the lowestoccupational class was significantly (over 360%) higher than the rate in the highestoccupational class.
95
2.28 Mental and behavioural disorders (ICD-9 290-319) 1989-1998
Figure 2.28.2
directly
standardised
mortality rate
ratios, by Region
(All Ireland =
100%)
Figure 2.28.3
Annual Directly
standardised
mortality rates
(per 100,000) for
working age
males, by occupa-
tional class
> 120%
110% - 119%
100% - 109%
90% - 99%
80% - 89%
< 80%
Statistically significant
Females males

Figure 2.29.1
Annual
mortality rates
(per 100,000),
by Age
Alcohol abuse (including alcoholic psychosis)
(ICD-9 291,303) 1989-1998
2.29
96
TABLE 2.29.1
Annual number
of deaths and
Directly
standardised
mortality rates
(per 100,000)
Inequalities in Mortality
• During 1989-1998 an average of approximately seventy people died each year onthe island from alcohol abuse (including alcoholic psychosis).
• The all Ireland annual directly standardised mortality rate was 1.7/100,000 persons.• When compared to the (combined) EU-15 countries, the all Ireland rate for females
was similar, and the all Ireland rate for males was lower.
• The all Ireland annual directly standardised mortality rate was significantly higherfor males than it was for females (117% higher).
• This was true in both NI and the RoI.• The directly standardised mortality rate for persons was significantly lower in the
RoI than it was in NI (24% lower).
Females
Males
Persons
Republic of Ireland (ROI)
Northern Ireland (NI)
All Ireland(ALL)
EU-15Countries
NUMBER RATE NUMBER RATE NUMBER RATE RATE
24 1.1 9 1.2 15 1.0 1.1
50 2.3 19 2.8 31 2.1 4.9
73 1.7 28 2.0 46 1.5 -
12
10
8
6
4
2
RATE PER 100,000
RATE PER 100,000
12
10
8
6
4
2
Females males
All
NI
RoI
0 10 20 30 40
AGES (YEARS) AGES (YEARS)
50 60 70 0 10 20 30 40 50 60 70
Explanatory Notes for these figures and tables are given on pages 33-36.
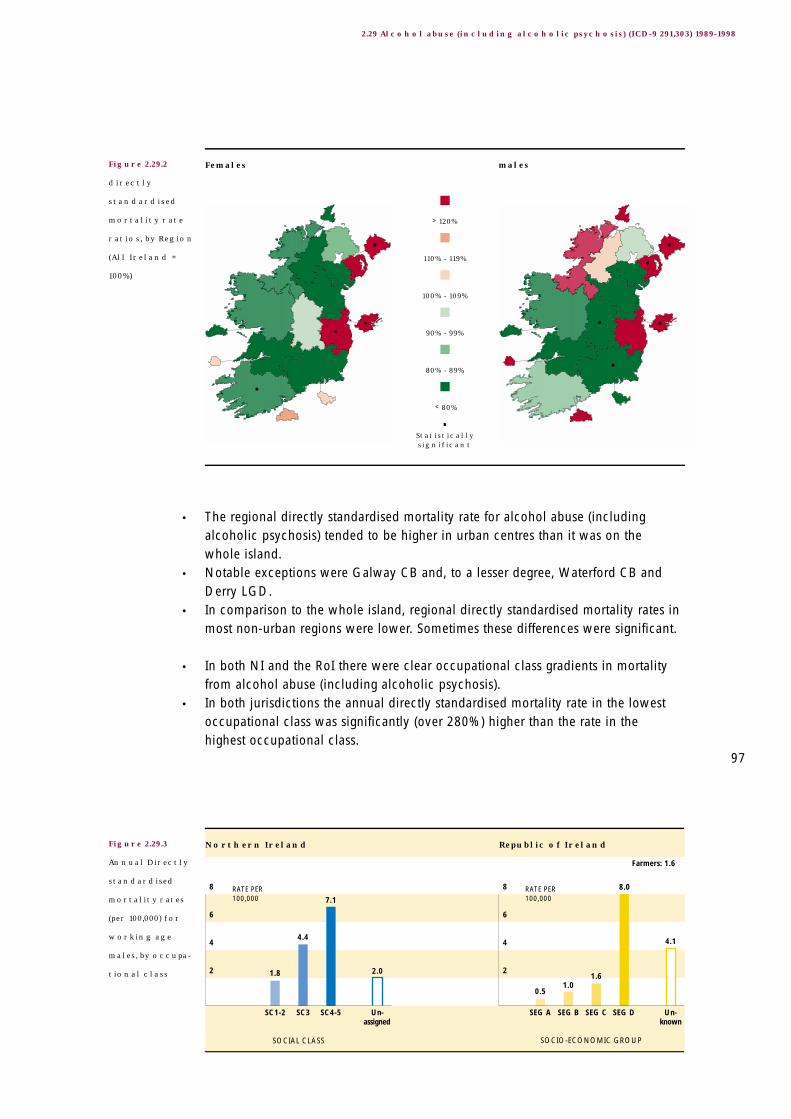
4.1
8.0
1.61.0
0.5
2.0
7.1
4.4
1.8
8
6
4
2
Northern Ireland
SOCIAL CLASS SOCIO-ECONOMIC GROUP
Republic of Ireland
SC1-2 SC3 SC4-5 SEG A SEG B SEG C SEG DUn-assigned
Un-known
RATE PER 100,000
RATE PER 100,000
8
6
4
2
Farmers: 1.6
• The regional directly standardised mortality rate for alcohol abuse (includingalcoholic psychosis) tended to be higher in urban centres than it was on the whole island.
• Notable exceptions were Galway CB and, to a lesser degree, Waterford CB andDerry LGD.
• In comparison to the whole island, regional directly standardised mortality rates inmost non-urban regions were lower. Sometimes these differences were significant.
• In both NI and the RoI there were clear occupational class gradients in mortalityfrom alcohol abuse (including alcoholic psychosis).
• In both jurisdictions the annual directly standardised mortality rate in the lowestoccupational class was significantly (over 280%) higher than the rate in the highest occupational class.
97
2.29 Alcohol abuse (including alcoholic psychosis) (ICD-9 291,303) 1989-1998
Figure 2.29.2
directly
standardised
mortality rate
ratios, by Region
(All Ireland =
100%)
Figure 2.29.3
Annual Directly
standardised
mortality rates
(per 100,000) for
working age
males, by occupa-
tional class
> 120%
110% - 119%
100% - 109%
90% - 99%
80% - 89%
< 80%
Statistically significant
Females males
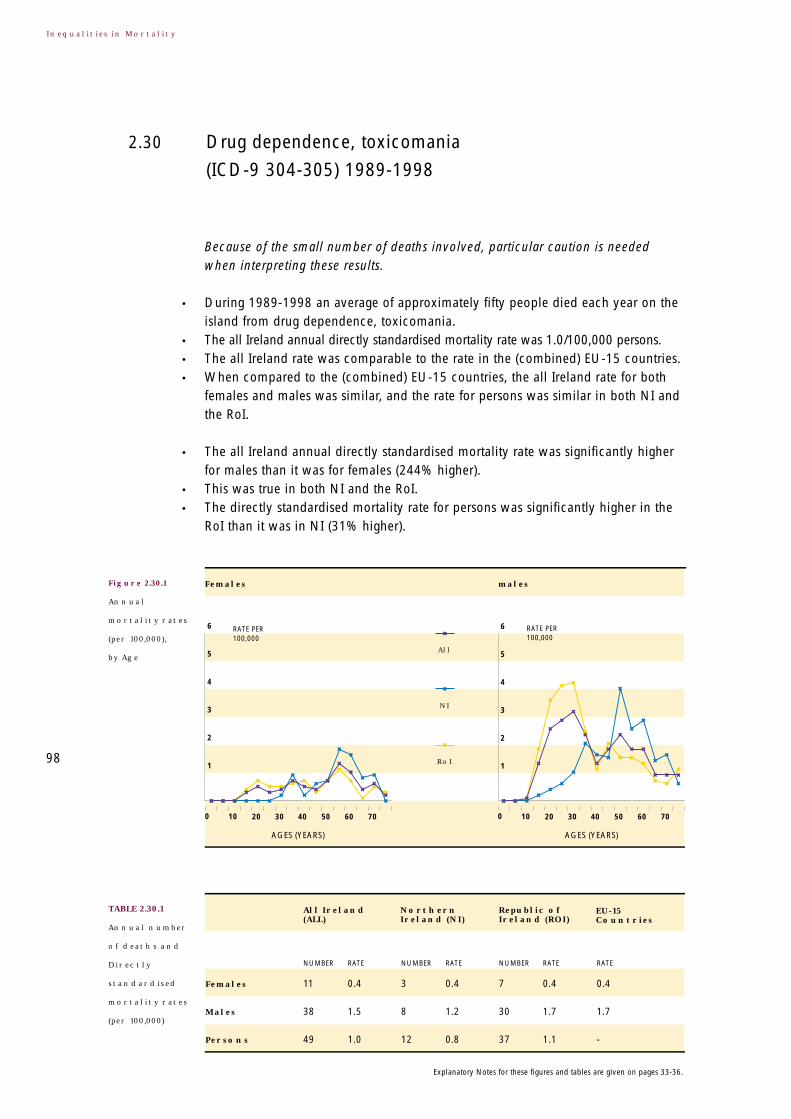
Figure 2.30.1
Annual
mortality rates
(per 100,000),
by Age
Drug dependence, toxicomania
(ICD-9 304-305) 1989-1998
2.30
98
TABLE 2.30.1
Annual number
of deaths and
Directly
standardised
mortality rates
(per 100,000)
Inequalities in Mortality
Because of the small number of deaths involved, particular caution is neededwhen interpreting these results.
• During 1989-1998 an average of approximately fifty people died each year on theisland from drug dependence, toxicomania.
• The all Ireland annual directly standardised mortality rate was 1.0/100,000 persons.• The all Ireland rate was comparable to the rate in the (combined) EU-15 countries.• When compared to the (combined) EU-15 countries, the all Ireland rate for both
females and males was similar, and the rate for persons was similar in both NI andthe RoI.
• The all Ireland annual directly standardised mortality rate was significantly higherfor males than it was for females (244% higher).
• This was true in both NI and the RoI.• The directly standardised mortality rate for persons was significantly higher in the
RoI than it was in NI (31% higher).
Females
Males
Persons
Republic of Ireland (ROI)
Northern Ireland (NI)
All Ireland(ALL)
EU-15Countries
NUMBER RATE NUMBER RATE NUMBER RATE RATE
11 0.4 3 0.4 7 0.4 0.4
38 1.5 8 1.2 30 1.7 1.7
49 1.0 12 0.8 37 1.1 -
6
5
4
3
2
1
RATE PER 100,000
RATE PER 100,000
6
5
4
3
2
1
Females males
All
NI
RoI
0 10 20 30 40
AGES (YEARS) AGES (YEARS)
50 60 70 0 10 20 30 40 50 60 70
Explanatory Notes for these figures and tables are given on pages 33-36.

2.8
11.6
0.70.40.70.7
3.7
1.9
0.5
12
9
6
3
Northern Ireland
SOCIAL CLASS SOCIO-ECONOMIC GROUP
Republic of Ireland
SC1-2 SC3 SC4-5 SEG A SEG B SEG C SEG DUn-assigned
Un-known
RATE PER 100,000
RATE PER 100,000
12
9
6
3
Farmers: 0.7
• In nearly all non-urban regions the regional directly standardised mortality rate for drugdependence, toxicomania was significantly lower than it was for the whole island.
• When compared to the whole island, the regional directly standardised mortalityrate was higher in both urban centres in NI and in Dublin CB. In the remainingurban centres it was lower than it was on the whole island.
• Only in NI was there a clear occupational class gradient in mortality from alcoholabuse, toxicomania.
• In both jurisdictions the annual directly standardised mortality rate in the lowestoccupational class was significantly (over 590%) higher than the rate in the highestoccupational class.
The plot of the age specific mortality rates for males shows a dramatic rise indeaths amongst males starting in the teenage years. 99
2.30 Drug dependence, toxicomania (ICD-9 304-305) 1989-1998
Figure 2.30.2
directly
standardised
mortality rate
ratios, by Region
(All Ireland =
100%)
Figure 2.30.3
Annual Directly
standardised
mortality rates
(per 100,000) for
working age
males, by occupa-
tional class
> 120%
110% - 119%
100% - 109%
90% - 99%
80% - 89%
< 80%
Statistically significant
Females males

Figure 2.31.1
Annual
mortality rates
(per 100,000),
by Age
Diseases of the nervous system and the sense organs
(ICD-9 320-389) 1989-1998
2.31
100
TABLE 2.31.1
Annual number
of deaths and
Directly
standardised
mortality rates
(per 100,000)
Inequalities in Mortality
• During 1989-1998 an average of eight hundred people died each year on theisland from diseases of the nervous system and the sense organs.
• The all Ireland annual directly standardised mortality rate was 14.5/100,000 persons.• The all Ireland rate was higher than the rate in the (combined) EU-15 countries.• When compared to the (combined) EU-15 countries, the all Ireland rate for females
and males was higher, and the rate for persons was lower in NI but higher in the RoI.
• The all Ireland annual directly standardised mortality rate was significantly higherfor males than it was for females (28% higher).
• This was true in both NI and the RoI.• The directly standardised mortality rate for persons was significantly higher in the
RoI than it was in NI (47% higher).
Females
Males
Persons
Republic of Ireland (ROI)
Northern Ireland (NI)
All Ireland(ALL)
EU-15Countries
NUMBER RATE NUMBER RATE NUMBER RATE RATE
414 12.9 105 9.9 310 14.6 11.2
392 16.6 97 12.8 296 18.4 15.8
806 14.5 201 11.1 605 16.3 -
222
185
148
111
74
37
RATE PER 100,000
RATE PER 100,000
222
185
148
111
74
37
Females males
All
NI
RoI
0 10 20 30 40
AGES (YEARS) AGES (YEARS)
50 60 70 0 10 20 30 40 50 60 70
Explanatory Notes for these figures and tables are given on pages 33-36.

7.4
19.1
5.23.4
5.5
11.310.7
6.66.2
20
15
10
5
Northern Ireland
SOCIAL CLASS SOCIO-ECONOMIC GROUP
Republic of Ireland
SC1-2 SC3 SC4-5 SEG A SEG B SEG C SEG DUn-assigned
Un-known
RATE PER 100,000
RATE PER 100,000
20
15
10
5
Farmers: 6.3
• When compared to the whole island, the regional directly standardised mortalityrates for diseases of the nervous system and the sense organs were lower in allregions in NI and generally higher in the regions in the RoI. Some of thesedifferences were statistically significant.
• Notable exceptions were Galway CB and Waterford CB.
• Only in NI was there an occupational class gradient in mortality from diseases ofthe nervous system and the sense organs.
• In both jurisdictions the annual directly standardised mortality rate in the lowestoccupational class was significantly (over 70%) higher than the rate in the highestoccupational class.
101
2.31 Diseases of the nervous system and the sense organs (ICD-9 320-389) 1989-1998
Figure 2.31.2
directly
standardised
mortality rate
ratios, by Region
(All Ireland =
100%)
Figure 2.31.3
Annual Directly
standardised
mortality rates
(per 100,000) for
working age
males, by occupa-
tional class
> 120%
110% - 119%
100% - 109%
90% - 99%
80% - 89%
< 80%
Statistically significant
Females males
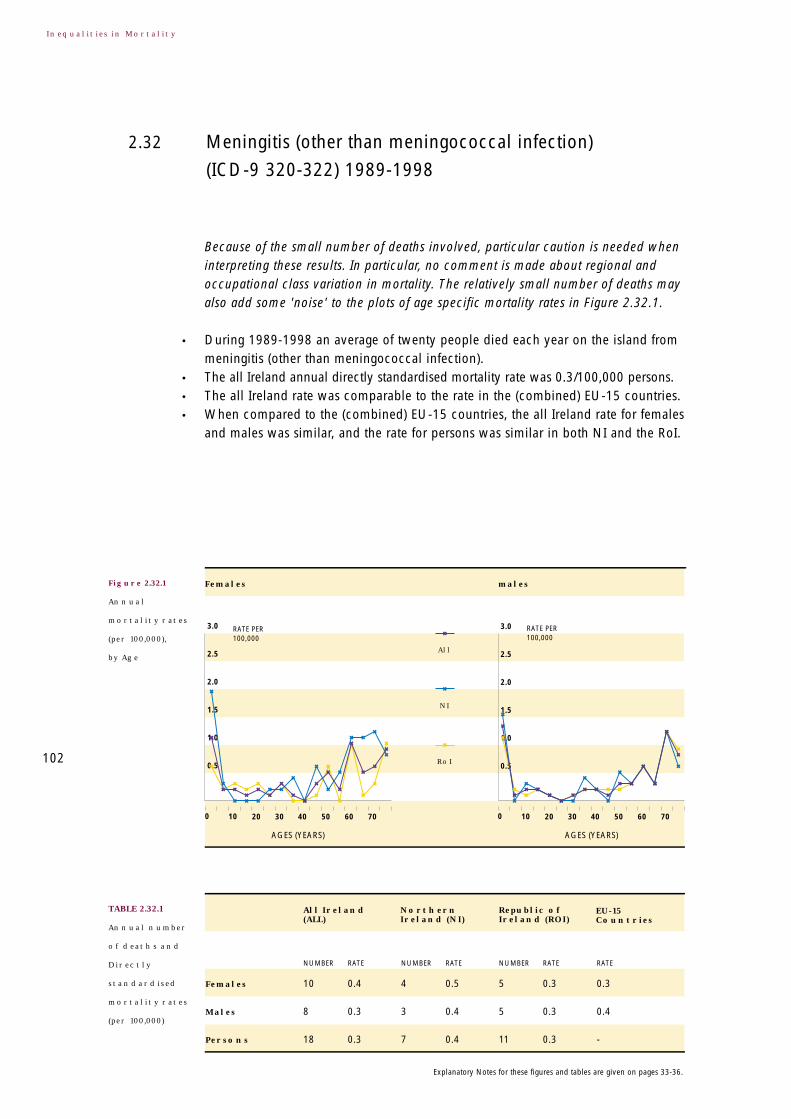
Figure 2.32.1
Annual
mortality rates
(per 100,000),
by Age
Meningitis (other than meningococcal infection)
(ICD-9 320-322) 1989-1998
2.32
102
TABLE 2.32.1
Annual number
of deaths and
Directly
standardised
mortality rates
(per 100,000)
Inequalities in Mortality
Because of the small number of deaths involved, particular caution is needed wheninterpreting these results. In particular, no comment is made about regional andoccupational class variation in mortality. The relatively small number of deaths mayalso add some 'noise' to the plots of age specific mortality rates in Figure 2.32.1.
• During 1989-1998 an average of twenty people died each year on the island frommeningitis (other than meningococcal infection).
• The all Ireland annual directly standardised mortality rate was 0.3/100,000 persons.• The all Ireland rate was comparable to the rate in the (combined) EU-15 countries.• When compared to the (combined) EU-15 countries, the all Ireland rate for females
and males was similar, and the rate for persons was similar in both NI and the RoI.
Females
Males
Persons
Republic of Ireland (ROI)
Northern Ireland (NI)
All Ireland(ALL)
EU-15Countries
NUMBER RATE NUMBER RATE NUMBER RATE RATE
10 0.4 4 0.5 5 0.3 0.3
8 0.3 3 0.4 5 0.3 0.4
18 0.3 7 0.4 11 0.3 -
3.0
2.5
2.0
1.5
1.0
0.5
RATE PER 100,000
RATE PER 100,000
3.0
2.5
2.0
1.5
1.0
0.5
Females males
All
NI
RoI
0 10 20 30 40
AGES (YEARS) AGES (YEARS)
50 60 70 0 10 20 30 40 50 60 70
Explanatory Notes for these figures and tables are given on pages 33-36.

• The all Ireland annual directly standardised mortality rate was lower for males thanit was for females (8% lower).
• This was true in both NI and the RoI.• The directly standardised mortality rate for persons was significantly lower in the
RoI than it was in NI (27% lower).
Figures presenting the directly standardised mortality rate ratios by region and theannual directly standardised mortality rates for working aged males have beenomitted because of the small number of deaths involved.
103
2.32 Meningitis (other than meningococcal infection) (ICD-9 320-322) 1989-1998

Figure 2.33.1
Annual
mortality rates
(per 100,000),
by Age
Diseases of the circulatory system
(ICD-9 390-459) 1989-1998
2.33
104
TABLE 2.33.1
Annual number
of deaths and
Directly
standardised
mortality rates
(per 100,000)
Inequalities in Mortality
• During 1989-1998 an average of twenty one thousand people died each year onthe island from diseases of the circulatory system.
• The all Ireland annual directly standardised mortality rate was 370.1/100,000 persons.• The all Ireland rate was higher than the rate in the (combined) EU-15 countries.• When compared to the (combined) EU-15 countries, the all Ireland rate for females
and males was higher, and the rate for persons was higher in both NI and the RoI.
• The all Ireland annual directly standardised mortality rate was significantly higherfor males than it was for females (61% higher).
• This was true in both NI and the RoI.• The directly standardised mortality rate for persons was significantly higher in the
RoI than it was in NI (5% higher).
Females
Males
Persons
Republic of Ireland (ROI)
Northern Ireland (NI)
All Ireland(ALL)
EU-15Countries
NUMBER RATE NUMBER RATE NUMBER RATE RATE
10,281 290.8 3,564 285.3 6,716 294.2 236.3
10,732 467.3 3,357 452.9 7,375 474.2 371.2
21,013 370.1 6,921 358.2 1,4092 376.7 -
6,000
5,000
4,000
3,000
2,000
1,000
RATE PER 100,000
RATE PER 100,000
6,000
5,000
4,000
3,000
2,000
1,000
Females males
All
NI
RoI
0 10 20 30 40
AGES (YEARS) AGES (YEARS)
50 60 70 0 10 20 30 40 50 60 70
Explanatory Notes for these figures and tables are given on pages 33-36.

208.3
279.2
137.5128.889.5
41.7
272.2
196.1
118.7
400
300
200
100
Northern Ireland
SOCIAL CLASS SOCIO-ECONOMIC GROUP
Republic of Ireland
SC1-2 SC3 SC4-5 SEG A SEG B SEG C SEG DUn-assigned
Un-known
RATE PER 100,000
RATE PER 100,000
400
300
200
100
Farmers: 133.7
• Although sometimes statistically significant, most regional directly standardisedmortality rates for diseases of the circulatory system were not largely different fromthe rate for the whole island.
• Notable exceptions were Galway CB where the mortality rate for both females andmales was significantly lower and Limerick CB, and Cork CB where the mortality ratefor both females and males was significantly higher.
• In both NI and the RoI there were occupational class gradients in mortality fromdiseases of the circulatory system.
• In both jurisdictions the annual directly standardised mortality rate in the lowestoccupational class was significantly (over 120%) higher than the rate in the highestoccupational class.
105
2.33 Diseases of the circulatory system (ICD-9 390-459) 1989-1998
Figure 2.33.2
directly
standardised
mortality rate
ratios, by Region
(All Ireland =
100%)
Figure 2.33.3
Annual Directly
standardised
mortality rates
(per 100,000) for
working age
males, by occupa-
tional class
> 120%
110% - 119%
100% - 109%
90% - 99%
80% - 89%
< 80%
Statistically significant
Females males

Figure 2.34.1
Annual
mortality rates
(per 100,000),
by Age
Ischaemic heart disease (ICD-9 410-414) 1989-19982.34
106
TABLE 2.34.1
Annual number
of deaths and
Directly
standardised
mortality rates
(per 100,000)
Inequalities in Mortality
• During 1989-1998 an average of nearly twelve thousand people died each year onthe island from ischaemic heart disease.
• The all Ireland annual directly standardised mortality rate was 215.4/100,000 persons.• The all Ireland rate was higher than the rate in the (combined) EU-15 countries.• When compared to the (combined) EU-15 countries, the all Ireland rate for females
and males was higher, and the rate for persons was higher in both NI and the RoI.
• The all Ireland annual directly standardised mortality rate was significantly higherfor males than it was for females (103% higher).
• This was true in both NI and the RoI.• The directly standardised mortality rate for persons was significantly lower in the
RoI than it was in NI (2% lower) although the difference was small.
Females
Males
Persons
Republic of Ireland (ROI)
Northern Ireland (NI)
All Ireland(ALL)
EU-15Countries
NUMBER RATE NUMBER RATE NUMBER RATE RATE
5,106 147.3 1,873 153.2 3,233 144.3 81.7
6,817 299.7 2,241 304.9 4,576 297.2 170.0
11,922 215.4 4,114 218.5 7,808 214.0 -
3,240
2,700
2,160
1,620
1,080
540
RATE PER 100,000
RATE PER 100,000
3,240
2,700
2,160
1,620
1,080
540
Females males
All
NI
RoI
0 10 20 30 40
AGES (YEARS) AGES (YEARS)
50 60 70 0 10 20 30 40 50 60 70
Explanatory Notes for these figures and tables are given on pages 33-36.

155.4
195.9
105.497.1
66.4
28.7
205.6
153.3
90.6
208
156
104
52
Northern Ireland
SOCIAL CLASS SOCIO-ECONOMIC GROUP
Republic of Ireland
SC1-2 SC3 SC4-5 SEG A SEG B SEG C SEG DUn-assigned
Un-known
RATE PER 100,000
RATE PER 100,000
208
156
104
52
Farmers: 96.2
• The regional directly standardised mortality rate for ischaemic heart disease tendedto be higher in urban centres than it was for the whole island. This was particularlythe case in Cork CB where the urban excess was also significant.
• Notable exceptions to this urban excess were Galway CB and Waterford CB wherethe mortality rate was significantly lower.
• There was no other obvious pattern in the regional directly standardised mortality rates.
• In both NI and the RoI there were clear occupational class gradients in mortalityfrom ischaemic heart disease.
• In both jurisdictions the annual directly standardised mortality rate in the lowestoccupational class was significantly (over 120%) higher than the rate in the highestoccupational class.
107
2.34 Ischaemic heart diseases (ICD-9 410-414) 1989-1998
Figure 2.34.2
directly
standardised
mortality rate
ratios, by Region
(All Ireland =
100%)
Figure 2.34.3
Annual Directly
standardised
mortality rates
(per 100,000) for
working age
males, by occupa-
tional class
> 120%
110% - 119%
100% - 109%
90% - 99%
80% - 89%
< 80%
Statistically significant
Females males
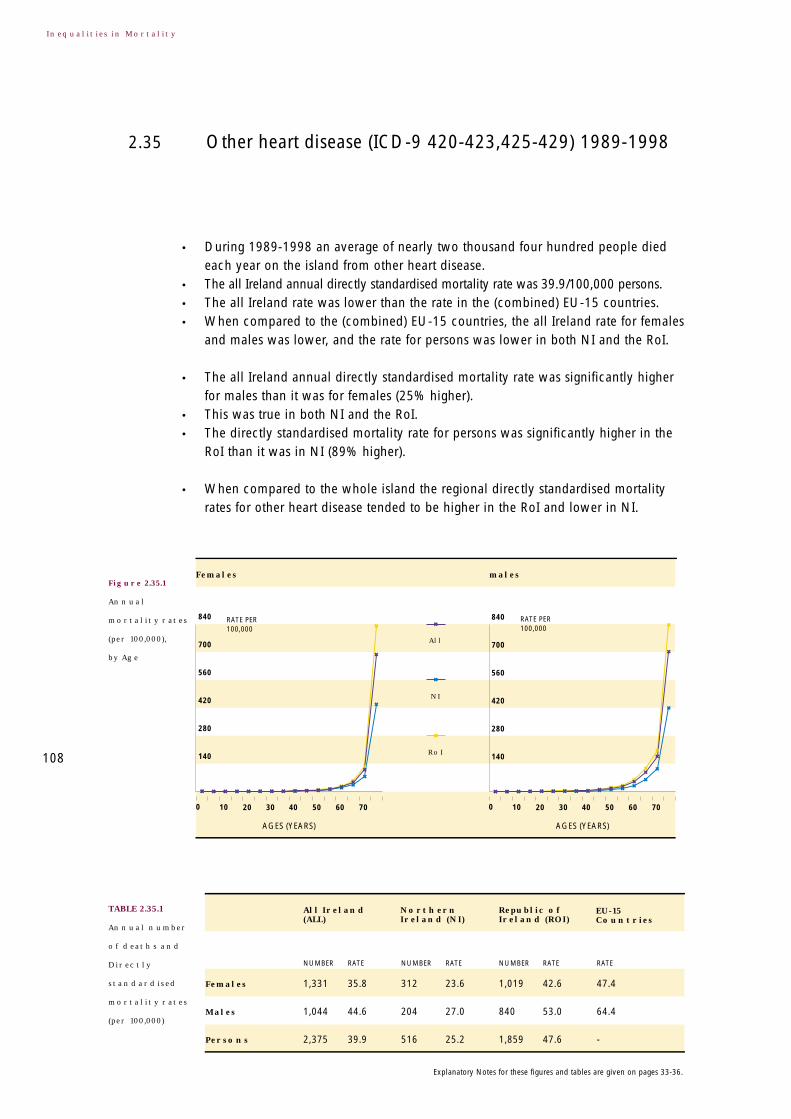
Figure 2.35.1
Annual
mortality rates
(per 100,000),
by Age
Other heart disease (ICD-9 420-423,425-429) 1989-19982.35
108
TABLE 2.35.1
Annual number
of deaths and
Directly
standardised
mortality rates
(per 100,000)
Inequalities in Mortality
• During 1989-1998 an average of nearly two thousand four hundred people diedeach year on the island from other heart disease.
• The all Ireland annual directly standardised mortality rate was 39.9/100,000 persons.• The all Ireland rate was lower than the rate in the (combined) EU-15 countries.• When compared to the (combined) EU-15 countries, the all Ireland rate for females
and males was lower, and the rate for persons was lower in both NI and the RoI.
• The all Ireland annual directly standardised mortality rate was significantly higherfor males than it was for females (25% higher).
• This was true in both NI and the RoI.• The directly standardised mortality rate for persons was significantly higher in the
RoI than it was in NI (89% higher).
• When compared to the whole island the regional directly standardised mortalityrates for other heart disease tended to be higher in the RoI and lower in NI.
Females
Males
Persons
Republic of Ireland (ROI)
Northern Ireland (NI)
All Ireland(ALL)
EU-15Countries
NUMBER RATE NUMBER RATE NUMBER RATE RATE
1,331 35.8 312 23.6 1,019 42.6 47.4
1,044 44.6 204 27.0 840 53.0 64.4
2,375 39.9 516 25.2 1,859 47.6 -
840
700
560
420
280
140
RATE PER 100,000
RATE PER 100,000
840
700
560
420
280
140
Females males
All
NI
RoI
0 10 20 30 40
AGES (YEARS) AGES (YEARS)
50 60 70 0 10 20 30 40 50 60 70
Explanatory Notes for these figures and tables are given on pages 33-36.

19.5
25.6
9.410.27.1
3.9
11.0
7.04.1
28
21
14
7
Northern Ireland
SOCIAL CLASS SOCIO-ECONOMIC GROUP
Republic of Ireland
SC1-2 SC3 SC4-5 SEG A SEG B SEG C SEG DUn-assigned
Un-known
RATE PER 100,000
RATE PER 100,000
28
21
14
7
Farmers: 12.8
• The regional directly standardised mortality rate tended to be lower in urbancentres than it was on the whole island.
• Notable exceptions were Limerick CB and Dublin CB where the mortality rateswere usually significantly higher.
• Only in NI was there a clear occupational class gradient in mortality from otherheart disease.
• In both jurisdictions the annual directly standardised mortality rate in the lowestoccupational class was significantly (over 160%) higher than the rate in the highestoccupational class.
When there is a strong North-South dimension to the regional patterns of mortality,differences in coding practices might explain some of the North-South differencesin mortality. For example, deaths in the RoI attributed to this cause may have beenattributed to a different type of circulatory disease had they occurred in NI.
109
2.35 Other heart diseases (ICD-9 420-423,425-429) 1989-1998
Figure 2.35.2
directly
standardised
mortality rate
ratios, by Region
(All Ireland =
100%)
Figure 2.35.3
Annual Directly
standardised
mortality rates
(per 100,000) for
working age
males, by occupa-
tional class
> 120%
110% - 119%
100% - 109%
90% - 99%
80% - 89%
< 80%
Statistically significant
Females males

Figure 2.36.1
Annual
mortality rates
(per 100,000),
by Age
Cerebrovascular disease (ICD-9 430-438) 1989-19982.36
110
TABLE 2.36.1
Annual number
of deaths and
Directly
standardised
mortality rates
(per 100,000)
Inequalities in Mortality
• During 1989-1998 an average of four thousand six hundred people died each yearon the island from cerebrovascular disease.
• The all Ireland annual directly standardised mortality rate was 77.9/100,000persons.
• When compared to the (combined) EU-15 countries, the all Ireland rate for femaleswas higher and the all Ireland rate for males was lower.
• The all Ireland annual directly standardised mortality rate was significantly higherfor males than it was for females (4% higher) although the difference was small.
• This was true in both NI and the RoI.• The directly standardised mortality rate for persons was significantly lower in the
RoI than it was in NI (10% lower).
Females
Males
Persons
Republic of Ireland (ROI)
Northern Ireland (NI)
All Ireland(ALL)
EU-15Countries
NUMBER RATE NUMBER RATE NUMBER RATE RATE
2,745 75.9 1,062 81.9 1,683 72.7 70.3
1,853 79.3 629 83.2 1,225 77.4 86.4
4,598 77.9 1,690 83.2 2,908 75.1 -
1,440
1,200
960
720
480
240
RATE PER 100,000
RATE PER 100,000
1,440
1,200
960
720
480
240
Females males
All
NI
RoI
0 10 20 30 40
AGES (YEARS) AGES (YEARS)
50 60 70 0 10 20 30 40 50 60 70
Explanatory Notes for these figures and tables are given on pages 33-36.
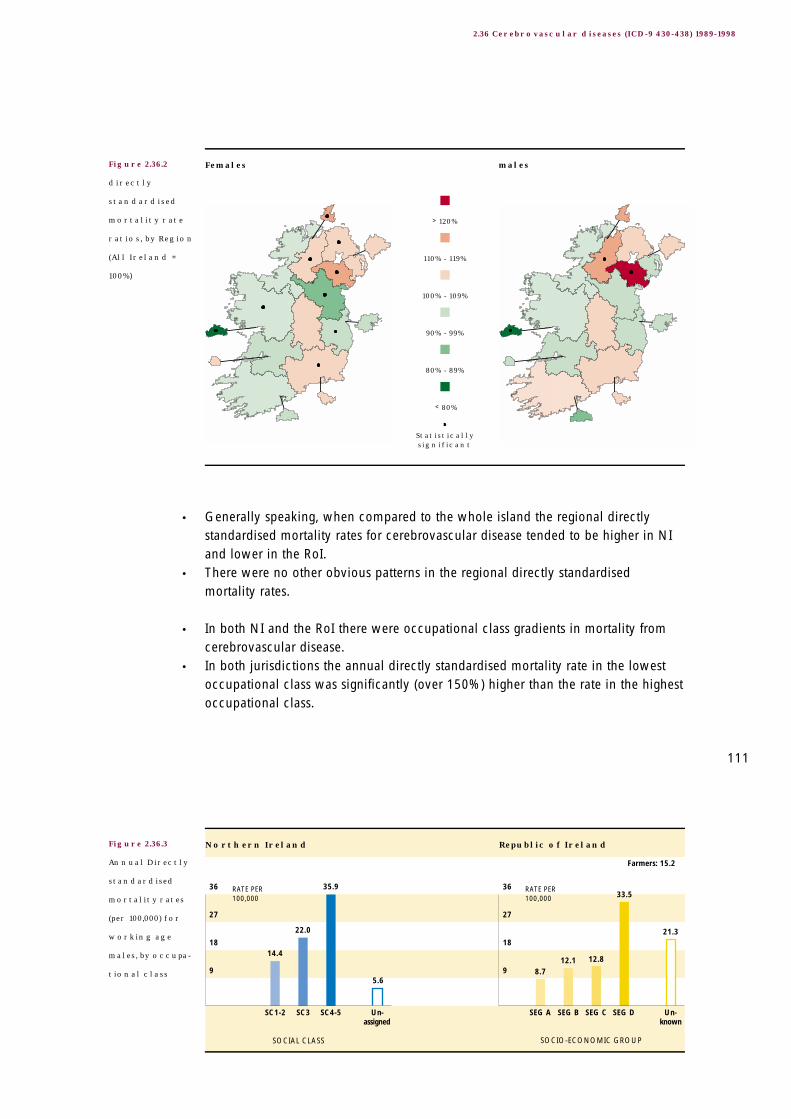
21.3
33.5
12.812.18.7
5.6
35.9
22.0
14.4
36
27
18
9
Northern Ireland
SOCIAL CLASS SOCIO-ECONOMIC GROUP
Republic of Ireland
SC1-2 SC3 SC4-5 SEG A SEG B SEG C SEG DUn-assigned
Un-known
RATE PER 100,000
RATE PER 100,000
36
27
18
9
Farmers: 15.2
• Generally speaking, when compared to the whole island the regional directlystandardised mortality rates for cerebrovascular disease tended to be higher in NIand lower in the RoI.
• There were no other obvious patterns in the regional directly standardisedmortality rates.
• In both NI and the RoI there were occupational class gradients in mortality fromcerebrovascular disease.
• In both jurisdictions the annual directly standardised mortality rate in the lowestoccupational class was significantly (over 150%) higher than the rate in the highestoccupational class.
111
2.36 Cerebrovascular diseases (ICD-9 430-438) 1989-1998
Figure 2.36.2
directly
standardised
mortality rate
ratios, by Region
(All Ireland =
100%)
Figure 2.36.3
Annual Directly
standardised
mortality rates
(per 100,000) for
working age
males, by occupa-
tional class
> 120%
110% - 119%
100% - 109%
90% - 99%
80% - 89%
< 80%
Statistically significant
Females males

Figure 2.37.1
Annual
mortality rates
(per 100,000),
by Age
Diseases of the respiratory system
(ICD-9 460-519) 1989-1998
2.37
112
TABLE 2.37.1
Annual number
of deaths and
Directly
standardised
mortality rates
(per 100,000)
Inequalities in Mortality
• During 1989-1998 an average of seven thousand two hundred people died eachyear on the island from diseases of the respiratory system.
• The all Ireland annual directly standardised mortality rate was 120.9/100,000 persons.• The all Ireland rate was higher than the rate in the (combined) EU-15 countries.• When compared to the (combined) EU-15 countries, the all Ireland rate for females
and males was higher, and the rate for persons was higher in both NI and the RoI.
• The all Ireland annual directly standardised mortality rate was significantly higherfor males than it was for females (48% higher).
• This was true in both NI and the RoI.• The directly standardised mortality rate for persons was significantly lower in the
RoI than it was in NI (9% lower).
• In general, there was no consistent urban/non-urban pattern in mortality fromdiseases of the respiratory system.
Females
Males
Persons
Republic of Ireland (ROI)
Northern Ireland (NI)
All Ireland(ALL)
EU-15Countries
NUMBER RATE NUMBER RATE NUMBER RATE RATE
3,658 101.0 1,461 112.2 2,197 94.8 39.1
3,530 149.9 1,183 155.5 2,347 147.3 84.0
7,188 120.9 2,643 129.0 4,544 116.6 -
3,000
2,500
2,000
1,500
1,000
500
RATE PER 100,000
RATE PER 100,000
3,000
2,500
2,000
1,500
1,000
500
Females males
All
NI
RoI
0 10 20 30 40
AGES (YEARS) AGES (YEARS)
50 60 70 0 10 20 30 40 50 60 70
Explanatory Notes for these figures and tables are given on pages 33-36.

29.9
57.1
15.510.39.2
22.0
49.8
28.8
15.6
60
45
30
15
Northern Ireland
SOCIAL CLASS SOCIO-ECONOMIC GROUP
Republic of Ireland
SC1-2 SC3 SC4-5 SEG A SEG B SEG C SEG DUn-assigned
Un-known
RATE PER 100,000
RATE PER 100,000
60
45
30
15
Farmers: 16.9
• In Galway CB the regional directly standardised mortality rate for both females andmales was significantly lower than it was on the whole island.
• In Belfast LGD the regional directly standardised mortality rate for both femalesand males was significantly higher than it was for the whole island.
• In both NI and the RoI there were clear occupational class gradients in mortalityfrom diseases of the respiratory system.
• In both jurisdictions, the annual directly standardised mortality rate in the lowestoccupational class was significantly (over 210%) higher than the rate in the highestoccupational class.
Coding practices may sometimes influence whether a particular death is attributedto a respiratory disease or an infectious or parasitic disease. Some of the NI excessin mortality from respiratory diseases may reflect North-South differences in codingpractices. See Section 5.3 for further details.
113
2.37 Diseases of the respiratory system (ICD-9 460-519) 1989-1998
Figure 2.37.2
directly
standardised
mortality rate
ratios, by Region
(All Ireland =
100%)
Figure 2.37.3
Annual Directly
standardised
mortality rates
(per 100,000) for
working age
males, by occupa-
tional class
> 120%
110% - 119%
100% - 109%
90% - 99%
80% - 89%
< 80%
Statistically significant
Females males
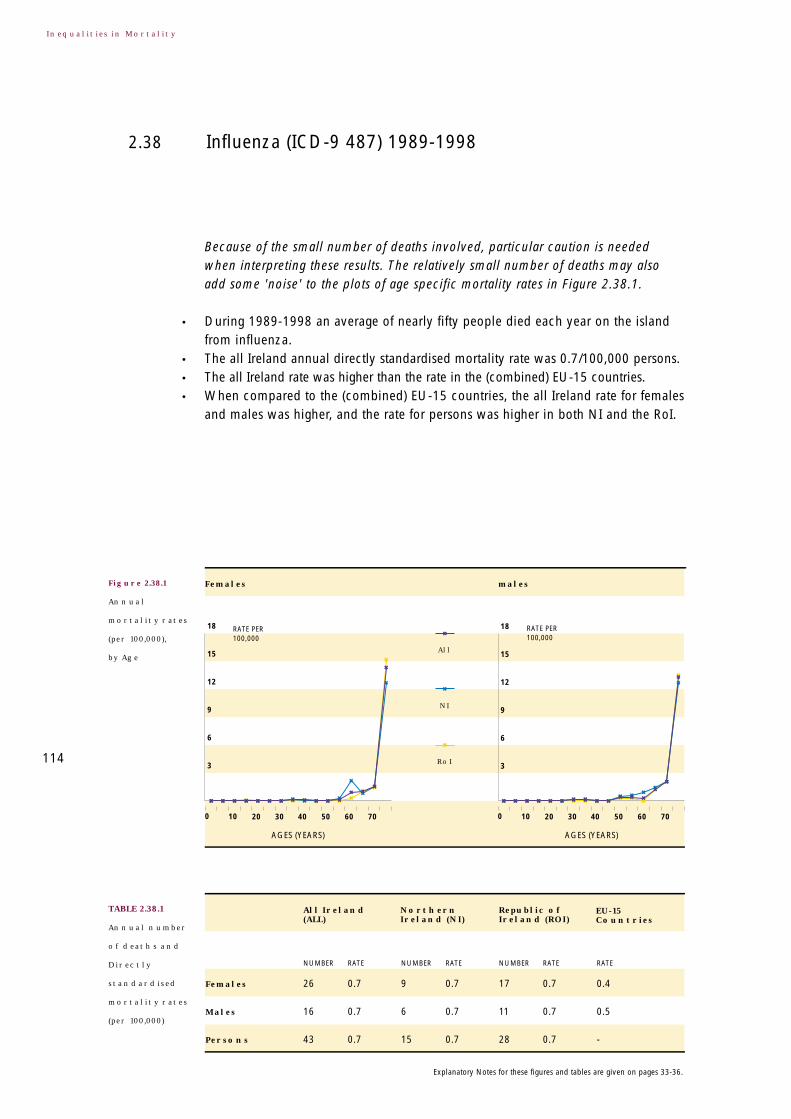
Figure 2.38.1
Annual
mortality rates
(per 100,000),
by Age
Influenza (ICD-9 487) 1989-19982.38
114
TABLE 2.38.1
Annual number
of deaths and
Directly
standardised
mortality rates
(per 100,000)
Inequalities in Mortality
Because of the small number of deaths involved, particular caution is neededwhen interpreting these results. The relatively small number of deaths may alsoadd some 'noise' to the plots of age specific mortality rates in Figure 2.38.1.
• During 1989-1998 an average of nearly fifty people died each year on the islandfrom influenza.
• The all Ireland annual directly standardised mortality rate was 0.7/100,000 persons.• The all Ireland rate was higher than the rate in the (combined) EU-15 countries.• When compared to the (combined) EU-15 countries, the all Ireland rate for females
and males was higher, and the rate for persons was higher in both NI and the RoI.
Females
Males
Persons
Republic of Ireland (ROI)
Northern Ireland (NI)
All Ireland(ALL)
EU-15Countries
NUMBER RATE NUMBER RATE NUMBER RATE RATE
26 0.7 9 0.7 17 0.7 0.4
16 0.7 6 0.7 11 0.7 0.5
43 0.7 15 0.7 28 0.7 -
18
15
12
9
6
3
RATE PER 100,000
RATE PER 100,000
18
15
12
9
6
3
Females males
All
NI
RoI
0 10 20 30 40
AGES (YEARS) AGES (YEARS)
50 60 70 0 10 20 30 40 50 60 70
Explanatory Notes for these figures and tables are given on pages 33-36.

0.5
0.00.00.0
0.10.2
0.30.3
0.1
0.60
0.45
0.30
0.15
Northern Ireland
SOCIAL CLASS SOCIO-ECONOMIC GROUP
Republic of Ireland
SC1-2 SC3 SC4-5 SEG A SEG B SEG C SEG DUn-assigned
Un-known
RATE PER 100,000
RATE PER 100,000
0.60
0.45
0.30
0.15
Farmers: 0.0
• There was little difference in the all Ireland annual directly standardised mortalityrate for females and males.
• This was true in both NI and the RoI.• The directly standardised mortality rate for persons was significantly lower in the
RoI than it was in NI (9% lower) although the difference was small.
• Generally speaking, when compared to the whole island the regional directlystandardised mortality rate for influenza tended to be lower in urban centres.
• An exception was Derry LGD where the mortality rate was higher although notsignificantly so.
• There was little occupational class variation in mortality from influenza.
115
2.38 Influenza (ICD-9 487) 1989-1998
Figure 2.38.2
directly
standardised
mortality rate
ratios, by Region
(All Ireland =
100%)
Figure 2.38.3
Annual Directly
standardised
mortality rates
(per 100,000) for
working age
males, by occupa-
tional class
> 120%
110% - 119%
100% - 109%
90% - 99%
80% - 89%
< 80%
Statistically significant
Females males

Figure 2.39.1
Annual
mortality rates
(per 100,000),
by Age
Pneumonia (ICD-9 480-486) 1989-19982.39
116
TABLE 2.39.1
Annual number
of deaths and
Directly
standardised
mortality rates
(per 100,000)
Inequalities in Mortality
• During 1989-1998 an average of three thousand eight hundred people died eachyear on the island from pneumonia.
• The all Ireland annual directly standardised mortality rate was 61.8/100,000 persons.• The all Ireland rate was higher than the rate in the (combined) EU-15 countries.• When compared to the (combined) EU-15 countries, the all Ireland rate for females
and males was higher, and the rate for persons was higher in both NI and the RoI.
• The all Ireland annual directly standardised mortality rate was significantly higherfor males than it was for females (16% higher).
• This was true in both NI and the RoI.• The directly standardised mortality rate for persons was significantly lower in the
RoI than it was in NI (38% lower).
• The difference between the jurisdictions was reflected at the regional level. Theregional directly standardised mortality rates for pneumonia tended to be higher in
Females
Males
Persons
Republic of Ireland (ROI)
Northern Ireland (NI)
All Ireland(ALL)
EU-15Countries
NUMBER RATE NUMBER RATE NUMBER RATE RATE
2,212 57.8 1,067 77.2 1,145 46.9 18.2
1,588 67.0 683 89.1 905 56.4 28.2
3,800 61.8 1,750 82.1 2,050 51.0 -
1,800
1,500
1,200
900
600
300
RATE PER 100,000
RATE PER 100,000
1,800
1,500
1,200
900
600
300
Females males
All
NI
RoI
0 10 20 30 40
AGES (YEARS) AGES (YEARS)
50 60 70 0 10 20 30 40 50 60 70
Explanatory Notes for these figures and tables are given on pages 33-36.

7.9
19.2
3.43.33.2
13.4
16.3
9.7
5.4
20
15
10
5
Northern Ireland
SOCIAL CLASS SOCIO-ECONOMIC GROUP
Republic of Ireland
SC1-2 SC3 SC4-5 SEG A SEG B SEG C SEG DUn-assigned
Un-known
RATE PER 100,000
RATE PER 100,000
20
15
10
5
Farmers: 3.5
NI and lower in the RoI. Most of these differences were significant.• An exception was the North Western HB in the RoI where, for both females and males,
the regional directly standardised mortality rate was higher (albeit non-significantly)than it was on the whole island.
• These differences accounted for the regional variation in the mortality rates.
• Only in NI was there a clear occupational class gradient in mortality from pneumonia.• In both jurisdictions the annual directly standardised mortality rate in the lowest
occupational class was significantly (over 200%) higher than the rate in the highestoccupational class.
Differences in the use of pneumonia as the primary cause of death amongst theelderly may explain much of the higher mortality rate in NI. Different codingpractices in relation to 'pneumonia' and 'chronic lower respiratory diseases' mayalso play a role. See Section 5.3 for further details.
117
2.39 Pneumonia (ICD-9 480-486) 1989-1998
Figure 2.39.2
directly
standardised
mortality rate
ratios, by Region
(All Ireland =
100%)
Figure 2.39.3
Annual Directly
standardised
mortality rates
(per 100,000) for
working age
males, by occupa-
tional class
> 120%
110% - 119%
100% - 109%
90% - 99%
80% - 89%
< 80%
Statistically significant
Females males

Figure 2.40.1
Annual
mortality rates
(per 100,000),
by Age
Chronic lower respiratory disease
(ICD-9 490-494,496) 1989-1998
2.40
118
TABLE 2.40.1
Annual number
of deaths and
Directly
standardised
mortality rates
(per 100,000)
Inequalities in Mortality
• During 1989-1998 an average of over two thousand six hundred people died eachyear on the island from chronic lower respiratory disease.
• The all Ireland annual directly standardised mortality rate was 46.1/100,000 persons.• The all Ireland rate was higher than the rate in the (combined) EU-15 countries.• When compared to the (combined) EU-15 countries, the all Ireland rate for females
and males was higher, and the rate for persons was higher in both NI and the RoI.
• The all Ireland annual directly standardised mortality rate was significantly higherfor males than it was for females (110% higher).
• This was true in both NI and the RoI.• The directly standardised mortality rate for persons was significantly higher in the
RoI than it was in NI (44% higher).
• The regional directly standardised mortality rates tended to be lower in NI andhigher in the RoI, and many of these differences were significant.
Females
Males
Persons
Republic of Ireland (ROI)
Northern Ireland (NI)
All Ireland(ALL)
EU-15Countries
NUMBER RATE NUMBER RATE NUMBER RATE RATE
1,054 32.1 283 25.7 771 35.6 14.4
1,577 67.3 395 52.5 1,182 74.4 42.7
2,631 46.1 678 35.7 1,953 51.6 -
1,200
1,000
800
600
400
200
RATE PER 100,000
RATE PER 100,000
1,200
1,000
800
600
400
200
Females males
All
NI
RoI
0 10 20 30 40
AGES (YEARS) AGES (YEARS)
50 60 70 0 10 20 30 40 50 60 70
Explanatory Notes for these figures and tables are given on pages 33-36.

18.5
28.9
9.8
5.04.16.1
27.2
14.6
6.2
32
24
16
8
Northern Ireland
SOCIAL CLASS SOCIO-ECONOMIC GROUP
Republic of Ireland
SC1-2 SC3 SC4-5 SEG A SEG B SEG C SEG DUn-assigned
Un-known
RATE PER 100,000
RATE PER 100,000
32
24
16
8
Farmers: 9.1
• Notable exceptions were the Western HSSB area in NI where the mortality ratewas significantly higher for males, and Galway CB and Western HB areas in theRoI where the mortality rate was lower for both females and males.
• These differences accounted for the variation in the regional directly standardisedmortality rates.
• In both NI and the RoI there were clear occupational class gradients in mortalityfrom chronic lower respiratory disease.
• In both jurisdictions the mortality rate in the lowest occupational class wassignificantly (over 340%) higher than the rate in the highest occupational class.
Differences in coding practices in relation to 'pneumonia' and 'chronic lowerrespiratory disease' may explain some of the North-South differences in mortalityfrom these causes. See Section 5.3 for further details. 119
2.40 Chronic lower respiratory diseases (ICD-9 490-494,496) 1989-1998
Figure 2.40.2
directly
standardised
mortality rate
ratios, by Region
(All Ireland =
100%)
Figure 2.40.3
Annual Directly
standardised
mortality rates
(per 100,000) for
working age
males, by occupa-
tional class
> 120%
110% - 119%
100% - 109%
90% - 99%
80% - 89%
< 80%
Statistically significant
Females males

Figure 2.41.1
Annual
mortality rates
(per 100,000),
by Age
Asthma (ICD-9 493) 1989-19982.41
120
TABLE 2.41.1
Annual number
of deaths and
Directly
standardised
mortality rates
(per 100,000)
Inequalities in Mortality
• During 1989-1998 an average of over one hundred and fifty people died each yearon the island from asthma.
• The all Ireland annual directly standardised mortality rate was 3.3/100,000 persons.• The all Ireland rate was higher than the rate in the (combined) EU-15 countries.• When compared to the (combined) EU-15 countries, the all Ireland rate for both
females and males was higher, and the rate for persons was higher in the RoI.
• The all Ireland annual directly standardised mortality rate was significantly higherfor males than it was for females (10% higher).
• This was true in the RoI but not in NI where the rate for males was lower than therate for females.
• The directly standardised mortality rate for persons was significantly higher in theRoI than it was in NI (34% higher).
Females
Males
Persons
Republic of Ireland (ROI)
Northern Ireland (NI)
All Ireland(ALL)
EU-15Countries
NUMBER RATE NUMBER RATE NUMBER RATE RATE
89 3.1 27 2.9 63 3.3 2.4
79 3.5 18 2.5 61 3.9 3.3
169 3.3 45 2.7 124 3.6 -
42
35
28
21
14
7
RATE PER 100,000
RATE PER 100,000
42
35
28
21
14
7
Females males
All
NI
RoI
0 10 20 30 40
AGES (YEARS) AGES (YEARS)
50 60 70 0 10 20 30 40 50 60 70
Explanatory Notes for these figures and tables are given on pages 33-36.

2.7
5.1
2.1
0.91.6
0.6
2.92.4
1.1
8
6
4
2
Northern Ireland
SOCIAL CLASS SOCIO-ECONOMIC GROUP
Republic of Ireland
SC1-2 SC3 SC4-5 SEG A SEG B SEG C SEG DUn-assigned
Un-known
RATE PER 100,000
RATE PER 100,000
8
6
4
2
Farmers: 1.8
• Generally speaking, the regional directly standardised mortality rates for asthmatended to be lower in NI and higher in the RoI, although few of these differenceswere significant.
• There was no other obvious pattern in the regional directly standardised mortality rates.
• Only in NI was there a clear occupational class gradient in mortality from asthma.• In both jurisdictions the annual directly standardised mortality rate in the lowest
occupational class was significantly (over 150%) higher than the rate in the highestoccupational class.
Differences in protocols used to identify asthma as the primary cause of death mayaccount for much of the North-South difference in mortality. See Section 5.3 forfurther details.
121
2.41 Asthma (ICD-9 493) 1989-1998
Figure 2.41.2
directly
standardised
mortality rate
ratios, by Region
(All Ireland =
100%)
Figure 2.41.3
Annual Directly
standardised
mortality rates
(per 100,000) for
working age
males, by occupa-
tional class
> 120%
110% - 119%
100% - 109%
90% - 99%
80% - 89%
< 80%
Statistically significant
Females males

Figure 2.42.1
Annual
mortality rates
(per 100,000),
by Age
Diseases of the digestive system
(ICD-9 520-579) 1989-1998
2.42
122
TABLE 2.42.1
Annual number
of deaths and
Directly
standardised
mortality rates
(per 100,000)
Inequalities in Mortality
• During 1989-1998 an average of one thousand three hundred people died eachyear on the island from diseases of the digestive system.
• The all Ireland annual directly standardised mortality rate was 24.0/100,000 persons.• The all Ireland rate was lower than the rate in the (combined) EU-15 countries.• When compared to the (combined) EU-15 countries, the all Ireland rate for both
females and males was lower, and the rate for persons was lower in both NI andthe RoI.
• The all Ireland annual directly standardised mortality rate was significantly higherfor males than it was for females (27% higher).
• This was true in both NI and the RoI.• The directly standardised mortality rate for persons was significantly higher in the
RoI than it was in NI (5% higher) although the difference was small.
Females
Males
Persons
Republic of Ireland (ROI)
Northern Ireland (NI)
All Ireland(ALL)
EU-15Countries
NUMBER RATE NUMBER RATE NUMBER RATE RATE
711 21.3 242 20.9 469 21.7 25.6
620 27.1 190 26.0 430 27.6 45.4
1,331 24.0 432 23.3 899 24.4 -
360
300
240
180
120
60
RATE PER 100,000
RATE PER 100,000
360
300
240
180
120
60
Females males
All
NI
RoI
0 10 20 30 40
AGES (YEARS) AGES (YEARS)
50 60 70 0 10 20 30 40 50 60 70
Explanatory Notes for these figures and tables are given on pages 33-36.

15.5
27.5
7.48.05.3
6.9
25.1
17.2
8.4
28
21
14
7
Northern Ireland
SOCIAL CLASS SOCIO-ECONOMIC GROUP
Republic of Ireland
SC1-2 SC3 SC4-5 SEG A SEG B SEG C SEG DUn-assigned
Un-known
RATE PER 100,000
RATE PER 100,000
28
21
14
7
Farmers: 6.3
• The regional directly standardised mortality rate for diseases of the digestive systemtended to be higher in urban centres than it was on the whole island.
• There was no other obvious pattern in the regional directly standardised mortalityrates.
• Only in NI was there a clear occupational class gradient in mortality from diseasesof the digestive system.
• In both jurisdictions the annual directly standardised mortality rate in the lowestoccupational class was significantly (over 190%) higher than the rate in the highestoccupational class.
123
2.42 Diseases of the digestive system (ICD-9 520-579) 1989-1998
Figure 2.42.2
directly
standardised
mortality rate
ratios, by Region
(All Ireland =
100%)
Figure 2.42.3
Annual Directly
standardised
mortality rates
(per 100,000) for
working age
males, by occupa-
tional class
> 120%
110% - 119%
100% - 109%
90% - 99%
80% - 89%
< 80%
Statistically significant
Females males

Figure 2.43.1
Annual
mortality rates
(per 100,000),
by Age
Ulcer of stomach, duodenum and jejunum
(ICD-9 531-534) 1989-1998
2.43
124
TABLE 2.43.1
Annual number
of deaths and
Directly
standardised
mortality rates
(per 100,000)
Inequalities in Mortality
• During 1989-1998 an average of nearly three hundred people died each year onthe island from ulcer of the stomach, duodenum and jejunum.
• The all Ireland annual directly standardised mortality rate was 5.0/100,000 persons.• The all Ireland rate was higher than the rate in the (combined) EU-15 countries.• When compared to the (combined) EU-15 countries, the all Ireland rate for both
females and males was higher, and the rate for persons was higher in both NI andthe RoI.
• The all Ireland annual directly standardised mortality rate was significantly higherfor males than it was for females (65% higher).
• This was true in both NI and the RoI.• The directly standardised mortality rate for persons was significantly higher in the
RoI than it was in NI (6% higher) although the difference was small.
Females
Males
Persons
Republic of Ireland (ROI)
Northern Ireland (NI)
All Ireland(ALL)
EU-15Countries
NUMBER RATE NUMBER RATE NUMBER RATE RATE
141 3.9 49 3.9 92 4.0 2.4
150 6.5 46 6.2 104 6.6 4.3
291 5.0 95 4.9 196 5.2 -
120
100
80
60
40
20
RATE PER 100,000
RATE PER 100,000
120
100
80
60
40
20
Females males
All
NI
RoI
0 10 20 30 40
AGES (YEARS) AGES (YEARS)
50 60 70 0 10 20 30 40 50 60 70
Explanatory Notes for these figures and tables are given on pages 33-36.

3.0
5.0
1.00.80.5
2.1
4.6
2.3
1.0
8
6
4
2
Northern Ireland
SOCIAL CLASS SOCIO-ECONOMIC GROUP
Republic of Ireland
SC1-2 SC3 SC4-5 SEG A SEG B SEG C SEG DUn-assigned
Un-known
RATE PER 100,000
RATE PER 100,000
8
6
4
2
Farmers: 1.0
• There was no obvious pattern in the regional directly standardised mortality rates.
• Only in NI was there a clear occupational class gradient in mortality from ulcer ofthe stomach, duodenum and jejunum.
• In both jurisdictions the annual directly standardised mortality rate in the lowestoccupational class was significantly (over 340%) higher than the rate in the highestoccupational class.
125
2.43 Ulcer of stomach, duodenum and jejunum (ICD-9 531-534) 1989-1998
Figure 2.43.2
directly
standardised
mortality rate
ratios, by Region
(All Ireland =
100%)
Figure 2.43.3
Annual Directly
standardised
mortality rates
(per 100,000) for
working age
males, by occupa-
tional class
> 120%
110% - 119%
100% - 109%
90% - 99%
80% - 89%
< 80%
Statistically significant
Females males

Figure 2.44.1
Annual
mortality rates
(per 100,000),
by Age
Chronic liver disease (ICD-9 571.0-571.9) 1989-19982.44
126
TABLE 2.44.1
Annual number
of deaths and
Directly
standardised
mortality rates
(per 100,000)
Inequalities in Mortality
• During 1989-1998 an average of nearly two hundred people died each year on theisland from chronic liver disease.
• The all Ireland annual directly standardised mortality rate was 4.0/100,000 persons.• The all Ireland rate was lower than the rate in the (combined) EU-15 countries.• When compared to the (combined) EU-15 countries, the all Ireland rate for both
females and males was lower, and the rate for persons was lower in both NI andthe RoI.
• The all Ireland annual directly standardised mortality rate was significantly higherfor males than it was for females (43% higher).
• This was true in both NI and the RoI.• The directly standardised mortality rate for persons was significantly lower in the
RoI than it was in NI (25% lower).
Females
Males
Persons
Republic of Ireland (ROI)
Northern Ireland (NI)
All Ireland(ALL)
EU-15Countries
NUMBER RATE NUMBER RATE NUMBER RATE RATE
84 3.3 35 4.1 49 2.9 9.3
102 4.8 38 5.6 64 4.4 22.4
186 4.0 73 4.9 113 3.6 -
24
20
16
12
8
4
RATE PER 100,000
RATE PER 100,000
24
20
16
12
8
4
Females males
All
NI
RoI
0 10 20 30 40
AGES (YEARS) AGES (YEARS)
50 60 70 0 10 20 30 40 50 60 70
Explanatory Notes for these figures and tables are given on pages 33-36.

6.4
9.3
3.13.9
3.01.7
10.5
8.4
3.8
12
9
6
3
Northern Ireland
SOCIAL CLASS SOCIO-ECONOMIC GROUP
Republic of Ireland
SC1-2 SC3 SC4-5 SEG A SEG B SEG C SEG DUn-assigned
Un-known
RATE PER 100,000
RATE PER 100,000
12
9
6
3
Farmers: 1.9
• Generally speaking, the regional directly standardised mortality rates for chronicliver disease tended to be lower in the RoI and higher in NI, and a number of thesedifferences were significant.
• The notable exceptions were an elevated mortality rate in Dublin CB and areduced rate in the Northern HSSB area in NI.
• Only in NI was there a clear occupational class gradient in mortality from chronicliver disease.
• In both jurisdictions the annual directly standardised mortality rate in the lowestoccupational class was significantly (over 170%) higher than the rate in the highestoccupational class.
127
2.44 Chronic liver disease (ICD-9 571.0-571.9) 1989-1998
Figure 2.44.2
directly
standardised
mortality rate
ratios, by Region
(All Ireland =
100%)
Figure 2.44.3
Annual Directly
standardised
mortality rates
(per 100,000) for
working age
males, by occupa-
tional class
> 120%
110% - 119%
100% - 109%
90% - 99%
80% - 89%
< 80%
Statistically significant
Females males
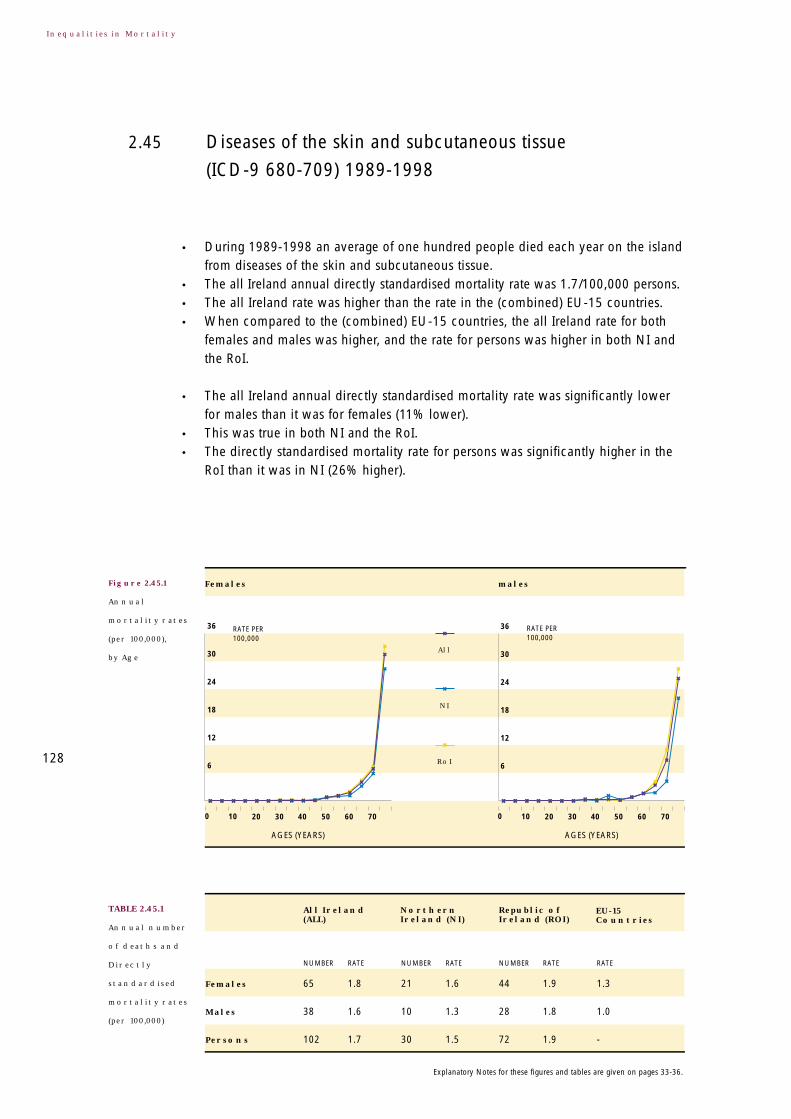
Figure 2.45.1
Annual
mortality rates
(per 100,000),
by Age
Diseases of the skin and subcutaneous tissue
(ICD-9 680-709) 1989-1998
2.45
128
TABLE 2.45.1
Annual number
of deaths and
Directly
standardised
mortality rates
(per 100,000)
Inequalities in Mortality
• During 1989-1998 an average of one hundred people died each year on the islandfrom diseases of the skin and subcutaneous tissue.
• The all Ireland annual directly standardised mortality rate was 1.7/100,000 persons.• The all Ireland rate was higher than the rate in the (combined) EU-15 countries.• When compared to the (combined) EU-15 countries, the all Ireland rate for both
females and males was higher, and the rate for persons was higher in both NI andthe RoI.
• The all Ireland annual directly standardised mortality rate was significantly lowerfor males than it was for females (11% lower).
• This was true in both NI and the RoI.• The directly standardised mortality rate for persons was significantly higher in the
RoI than it was in NI (26% higher).
Females
Males
Persons
Republic of Ireland (ROI)
Northern Ireland (NI)
All Ireland(ALL)
EU-15Countries
NUMBER RATE NUMBER RATE NUMBER RATE RATE
65 1.8 21 1.6 44 1.9 1.3
38 1.6 10 1.3 28 1.8 1.0
102 1.7 30 1.5 72 1.9 -
36
30
24
18
12
6
RATE PER 100,000
RATE PER 100,000
36
30
24
18
12
6
Females males
All
NI
RoI
0 10 20 30 40
AGES (YEARS) AGES (YEARS)
50 60 70 0 10 20 30 40 50 60 70
Explanatory Notes for these figures and tables are given on pages 33-36.

0.0
1.0
0.20.1
0.3
0.6
0.1
0.5
0.2
1.00
0.75
0.50
0.25
Northern Ireland
SOCIAL CLASS SOCIO-ECONOMIC GROUP
Republic of Ireland
SC1-2 SC3 SC4-5 SEG A SEG B SEG C SEG DUn-assigned
Un-known
RATE PER 100,000
RATE PER 100,000
1.00
0.75
0.50
0.25
Farmers: 0.2
• There was no obvious pattern in the regional directly standardised mortality rates.
• In neither NI nor the RoI was there any clear occupational class variation inmortality from diseases of the skin and subcutaneous tissue.
• In the RoI the annual directly standardised mortality rate in the lowestoccupational class was significantly (over 220%) higher than the rate in the highestoccupational class.
129
2.45 Diseases of the skin and subcutaneous tissue (ICD-9 680-709) 1989-1998
Figure 2.45.2
directly
standardised
mortality rate
ratios, by Region
(All Ireland =
100%)
Figure 2.45.3
Annual Directly
standardised
mortality rates
(per 100,000) for
working age
males, by occupa-
tional class
> 120%
110% - 119%
100% - 109%
90% - 99%
80% - 89%
< 80%
Statistically significant
Females males
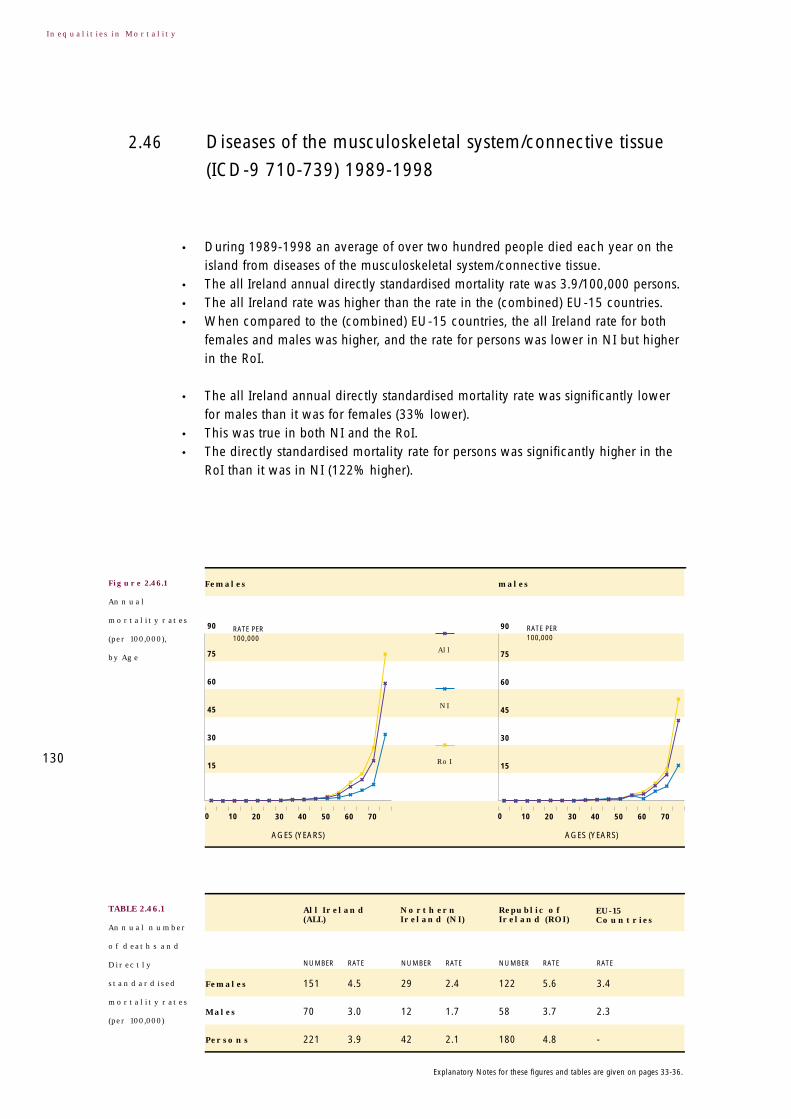
Figure 2.46.1
Annual
mortality rates
(per 100,000),
by Age
Diseases of the musculoskeletal system/connective tissue
(ICD-9 710-739) 1989-1998
2.46
130
TABLE 2.46.1
Annual number
of deaths and
Directly
standardised
mortality rates
(per 100,000)
Inequalities in Mortality
• During 1989-1998 an average of over two hundred people died each year on theisland from diseases of the musculoskeletal system/connective tissue.
• The all Ireland annual directly standardised mortality rate was 3.9/100,000 persons.• The all Ireland rate was higher than the rate in the (combined) EU-15 countries.• When compared to the (combined) EU-15 countries, the all Ireland rate for both
females and males was higher, and the rate for persons was lower in NI but higherin the RoI.
• The all Ireland annual directly standardised mortality rate was significantly lowerfor males than it was for females (33% lower).
• This was true in both NI and the RoI.• The directly standardised mortality rate for persons was significantly higher in the
RoI than it was in NI (122% higher).
Females
Males
Persons
Republic of Ireland (ROI)
Northern Ireland (NI)
All Ireland(ALL)
EU-15Countries
NUMBER RATE NUMBER RATE NUMBER RATE RATE
151 4.5 29 2.4 122 5.6 3.4
70 3.0 12 1.7 58 3.7 2.3
221 3.9 42 2.1 180 4.8 -
90
75
60
45
30
15
RATE PER 100,000
RATE PER 100,000
90
75
60
45
30
15
Females males
All
NI
RoI
0 10 20 30 40
AGES (YEARS) AGES (YEARS)
50 60 70 0 10 20 30 40 50 60 70
Explanatory Notes for these figures and tables are given on pages 33-36.

1.2
2.4
0.60.50.3
1.0
1.4
0.60.4
4
3
2
1
Northern Ireland
SOCIAL CLASS SOCIO-ECONOMIC GROUP
Republic of Ireland
SC1-2 SC3 SC4-5 SEG A SEG B SEG C SEG DUn-assigned
Un-known
RATE PER 100,000
RATE PER 100,000
4
3
2
1
Farmers: 1.1
• Generally speaking, when compared to the whole island, the regional directlystandardised mortality rates for diseases of the musculoskeletal system/connectivetissue tended to be higher in the RoI and lower in NI.
• The mortality rates in urban centres tended to conform to this pattern.
• In both NI and the RoI there were occupational class gradients in mortality fromdiseases of the musculoskeletal/connective tissue.
• In both jurisdictions the annual directly standardised mortality rate in the lowestoccupational class was significantly (over 220%) higher than the rate in the highestoccupational class.
131
2.46 Diseases of the musculoskeletal system/connective tissue (ICD-9 710-739) 1989-1998
Figure 2.46.2
directly
standardised
mortality rate
ratios, by Region
(All Ireland =
100%)
Figure 2.46.3
Annual Directly
standardised
mortality rates
(per 100,000) for
working age
males, by occupa-
tional class
> 120%
110% - 119%
100% - 109%
90% - 99%
80% - 89%
< 80%
Statistically significant
Females males

Figure 2.47.1
Annual
mortality rates
(per 100,000),
by Age
Rheumatoid arthritis and osteoarthrosis
(ICD-9 714-715) 1989-1998
2.47
132
TABLE 2.47.1
Annual number
of deaths and
Directly
standardised
mortality rates
(per 100,000)
Inequalities in Mortality
• During 1989-1998 an average of over a hundred people died each year on theisland from rheumatoid arthritis and osteoarthritis.
• The all Ireland annual directly standardised mortality rate was 2.0/100,000 persons.• The all Ireland rate was higher than the rate in the (combined) EU-15 countries.• When compared to the (combined) EU-15 countries, the all Ireland rate for both
females and males was higher, and the rate for persons was similar in NI buthigher in the RoI.
• The all Ireland annual directly standardised mortality rate was significantly lowerfor males than it was for females (37% lower).
• This was true in both NI and the RoI.• The directly standardised mortality rate for persons was significantly higher in the
RoI than it was in NI (166% higher).
Females
Males
Persons
Republic of Ireland (ROI)
Northern Ireland (NI)
All Ireland(ALL)
EU-15Countries
NUMBER RATE NUMBER RATE NUMBER RATE RATE
80 2.3 14 1.1 66 3.0 1.2
34 1.5 5 0.7 29 1.8 0.6
114 2.0 19 0.9 95 2.5 -
90
75
60
45
30
15
RATE PER 100,000
RATE PER 100,000
90
75
60
45
30
15
Females males
All
NI
RoI
0 10 20 30 40
AGES (YEARS) AGES (YEARS)
50 60 70 0 10 20 30 40 50 60 70
Explanatory Notes for these figures and tables are given on pages 33-36.

0.5
0.7
0.20.20.3
0.0
0.20.10.1
1.00
0.75
0.50
0.25
Northern Ireland
SOCIAL CLASS SOCIO-ECONOMIC GROUP
Republic of Ireland
SC1-2 SC3 SC4-5 SEG A SEG B SEG C SEG DUn-assigned
Un-known
RATE PER 100,000
RATE PER 100,000
1.00
0.75
0.50
0.25
Farmers: 0.4
• Generally speaking, when compared to the whole island, the regional directlystandardised mortality rates for rheumatoid arthritis and osteoarthritis tended to belower in NI and higher in the RoI.
• The mortality rates in urban centres tended to conform to this pattern.
• In neither NI nor the RoI was there any clear occupational class variation inmortality from rheumatoid arthritis and osteoarthritis.
133
2.47 Rheumatoid arthritis and osteoarthrosis (ICD-9 714-715) 1989-1998
Figure 2.47.2
directly
standardised
mortality rate
ratios, by Region
(All Ireland =
100%)
Figure 2.47.3
Annual Directly
standardised
mortality rates
(per 100,000) for
working age
males, by occupa-
tional class
> 120%
110% - 119%
100% - 109%
90% - 99%
80% - 89%
< 80%
Statistically significant
Females males

Figure 2.48.1
Annual
mortality rates
(per 100,000),
by Age
Diseases of the genito-urinary system
(ICD-9 580-629) 1989-1998
2.48
134
TABLE 2.48.1
Annual number
of deaths and
Directly
standardised
mortality rates
(per 100,000)
Inequalities in Mortality
• During 1989-1998 an average of nearly eight hundred and fifty people died eachyear on the island from diseases of the genito-urinary system.
• The all Ireland annual directly standardised mortality rate was 14.1/100,000 persons.• The all Ireland rate was higher than the rate in the (combined) EU-15 countries.• When compared to the (combined) EU-15 countries, the all Ireland rate for both
females and males was higher, and the rate for persons was higher in both NI andthe RoI.
• The all Ireland annual directly standardised mortality rate was significantly higherfor males than it was for females (42% higher).
• This was true in both NI and the RoI.• The effects of the differences in the age-specific mortality rates for females and
males is apparent here. The crude mortality rate was higher for females(16.5/100,000) than it was for males (15.7/100,000).
Females
Males
Persons
Republic of Ireland (ROI)
Northern Ireland (NI)
All Ireland(ALL)
EU-15Countries
NUMBER RATE NUMBER RATE NUMBER RATE RATE
436 12.1 141 11.0 295 12.7 7.5
405 17.2 112 14.7 294 18.4 12.4
841 14.1 253 12.3 589 15.1 -
330
275
220
165
110
55
RATE PER 100,000
RATE PER 100,000
330
275
220
165
110
55
Females males
All
NI
RoI
0 10 20 30 40
AGES (YEARS) AGES (YEARS)
50 60 70 0 10 20 30 40 50 60 70
Explanatory Notes for these figures and tables are given on pages 33-36.

3.6
6.9
2.01.81.5
2.42.62.11.8
8
6
4
2
Northern Ireland
SOCIAL CLASS SOCIO-ECONOMIC GROUP
Republic of Ireland
SC1-2 SC3 SC4-5 SEG A SEG B SEG C SEG DUn-assigned
Un-known
RATE PER 100,000
RATE PER 100,000
8
6
4
2
Farmers: 2.3
• The directly standardised mortality rate for persons was significantly higher in theRoI than it was in NI (23% higher).
• There was no obvious pattern in the regional directly standardised mortality rates.
• In both NI and the RoI there were occupational class gradients in mortality fromdiseases of the genito-urinary system.
• In the RoI the annual directly standardised mortality rate in the lowestoccupational class was significantly (over 360%) higher than the rate in the highestoccupational class.
135
2.48 Diseases of the genitourinary system (ICD-9 580-629) 1989-1998
Figure 2.48.2
directly
standardised
mortality rate
ratios, by Region
(All Ireland =
100%)
Figure 2.48.3
Annual Directly
standardised
mortality rates
(per 100,000) for
working age
males, by occupa-
tional class
> 120%
110% - 119%
100% - 109%
90% - 99%
80% - 89%
< 80%
Statistically significant
Females males

Figure 2.49.1
Annual
mortality rates
(per 100,000),
by Age
Diseases of the kidney and ureter
(ICD-9 580-594) 1989-1998
2.49
136
TABLE 2.49.1
Annual number
of deaths and
Directly
standardised
mortality rates
(per 100,000)
Inequalities in Mortality
• During 1989-1998 an average of over six hundred people died each year on theisland from diseases of the kidney and ureter.
• The all Ireland annual directly standardised mortality rate was 10.6/100,000 persons.
• The all Ireland annual directly standardised mortality rate was significantly higherfor males than it was for females (40% higher).
• This was true in both NI and the RoI.• The directly standardised mortality rates for persons in NI and the RoI were not
statistically different.
Females
Males
Persons
Republic of Ireland (ROI)
Northern Ireland (NI)
All Ireland(ALL)
EU-15Countries
NUMBER RATE NUMBER RATE NUMBER RATE RATE
325 9.1 105 8.2 221 9.6 -
300 12.8 80 10.5 220 13.8 -
625 10.6 185 9.0 441 11.4 -
300
250
200
150
100
50
RATE PER 100,000
RATE PER 100,000
300
250
200
150
100
50
Females males
All
NI
RoI
0 10 20 30 40
AGES (YEARS) AGES (YEARS)
50 60 70 0 10 20 30 40 50 60 70
Explanatory Notes for these figures and tables are given on pages 33-36.
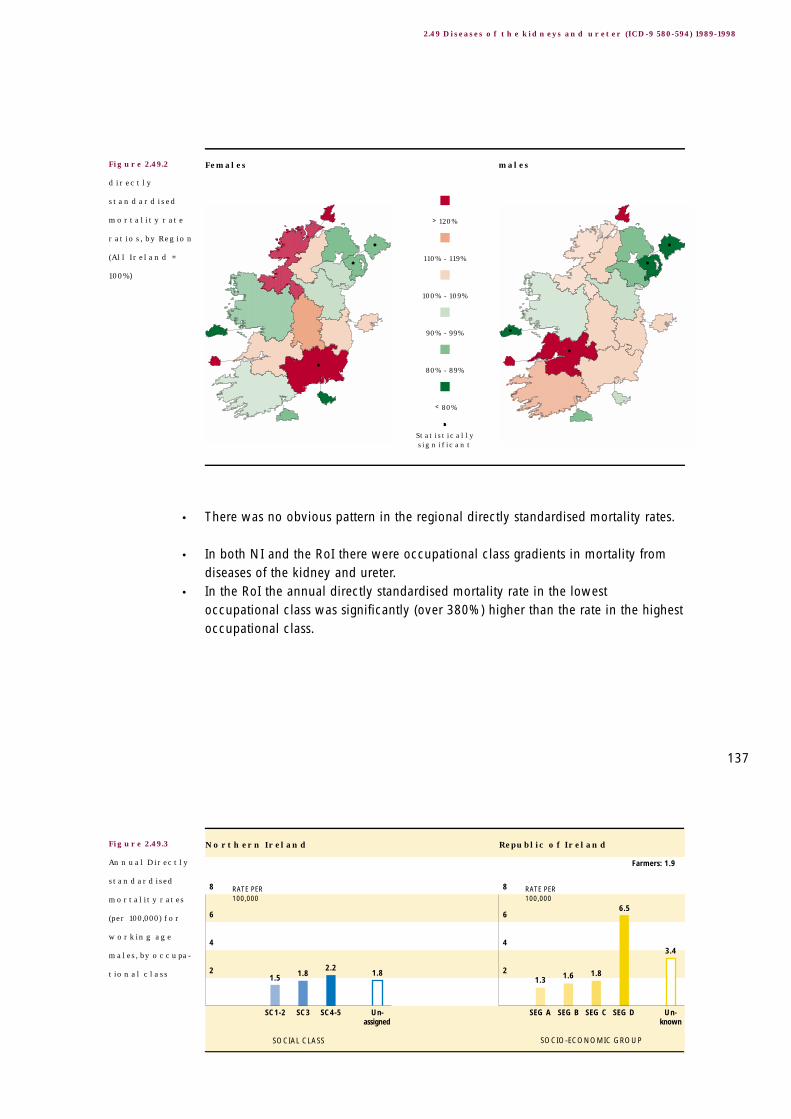
3.4
6.5
1.81.61.31.8
2.21.81.5
8
6
4
2
Northern Ireland
SOCIAL CLASS SOCIO-ECONOMIC GROUP
Republic of Ireland
SC1-2 SC3 SC4-5 SEG A SEG B SEG C SEG DUn-assigned
Un-known
RATE PER 100,000
RATE PER 100,000
8
6
4
2
Farmers: 1.9
• There was no obvious pattern in the regional directly standardised mortality rates.
• In both NI and the RoI there were occupational class gradients in mortality fromdiseases of the kidney and ureter.
• In the RoI the annual directly standardised mortality rate in the lowestoccupational class was significantly (over 380%) higher than the rate in the highestoccupational class.
137
2.49 Diseases of the kidneys and ureter (ICD-9 580-594) 1989-1998
Figure 2.49.2
directly
standardised
mortality rate
ratios, by Region
(All Ireland =
100%)
Figure 2.49.3
Annual Directly
standardised
mortality rates
(per 100,000) for
working age
males, by occupa-
tional class
> 120%
110% - 119%
100% - 109%
90% - 99%
80% - 89%
< 80%
Statistically significant
Females males

Figure 2.50.1
Annual
mortality rates
(per 100,000),
by Age
Complications of pregnancy, childbirth and puerperium
(ICD-9 630-676) 1989-1998
2.50
138
TABLE 2.50.1
Annual number
of deaths and
Directly
standardised
mortality rates
(per 100,000)
Inequalities in Mortality
Because of the very small number of deaths involved, no comment is made aboutany variation in mortality on the island. The relatively small number of deaths mayalso add some 'noise' to the plots of age specific mortality rates in Figure 2.50.1.
• During 1989-1998 an average of two women died each year on the island fromcomplications of pregnancy, childbirth and puerperium.
• The all Ireland directly standardised morality rate was 0.1/100,000 females.• This all Ireland mortality rate was similar to the rate in the (combined)
EU-15 countries.
Females
Republic of Ireland (ROI)
Northern Ireland (NI)
All Ireland(ALL)
EU-15Countries
NUMBER RATE NUMBER RATE NUMBER RATE RATE
2 0.1 0 0.0 2 0.1 0.1
0.6
0.5
0.4
0.3
0.2
0.1
RATE PER 100,000
Females
All
NI
RoI
0 10 20 30 40
AGES (YEARS)
50 60 70
Explanatory Notes for these figures and tables are given on pages 33-36.

Figures presenting the directly standardised mortality rate ratios by region and theannual directly standardised mortality rates for working aged males have beenomitted because of the small number of deaths involved.
Age standardisation using all ages is perhaps not appropriate for this cause ofdeath. The age specific annual mortality rate rose to 0.4/100,000 females in the30-34 years age group in the RoI, and 0.3/100,000 females in the 25-29 years agegroup in NI.
139
2.50 Complications of pregnancy, childbirth and puerperium (ICD-9 630-676) 1989-1998

Figure 2.51.1
Annual
mortality rates
(per 100,000),
by Age
Certain conditions originating in the perinatal period
(ICD-9 760-779) 1989-1998
2.51
140
TABLE 2.51.1
Annual number
of deaths and
Directly
standardised
mortality rates
(per 100,000)
Inequalities in Mortality
• During 1989-1998 an average of nearly two hundred people died each year on theisland from certain conditions originating in the perinatal period.
• The all Ireland annual directly standardised mortality rate was 3.9/100,000 persons.• The all Ireland rate was lower than the rate in the (combined) EU-15 countries.• When compared to the (combined) EU-15 countries, the all Ireland mortality rate
for both females and males was slightly lower, and the rate for persons was higherin NI and slightly lower in the RoI.
• The all Ireland annual directly standardised mortality rate was significantly higherfor males than it was for females (30% higher).
• This was true in both NI and the RoI.• The directly standardised mortality rate for persons was significantly lower in the
RoI than it was in NI (13% lower).
Females
Males
Persons
Republic of Ireland (ROI)
Northern Ireland (NI)
All Ireland(ALL)
EU-15Countries
NUMBER RATE NUMBER RATE NUMBER RATE RATE
80 3.4 30 3.8 51 3.2 3.5
110 4.4 40 4.8 71 4.2 4.6
191 3.9 69 4.3 122 3.7 -
RATE PER 100,000
RATE PER 100,000
Females males
All
NI
RoI
0 10 20 30 40
AGES (YEARS) AGES (YEARS)
50 60 70 0 10 20 30 40 50 60 70
66
55
44
33
22
11
66
55
44
33
22
11
Explanatory Notes for these figures and tables are given on pages 33-36.

• The regional directly standardised mortality rate for certain conditions originatingin the perinatal period tended to be higher in the urban centres than it was on thewhole island.
• Notable exceptions were Galway CB and Waterford CB (females only).• There was no other obvious pattern in the regional directly standardised mortality rates.
Nearly all of the deaths occurred before 5 years, precluding a standardoccupational class analysis. We note that a link with occupational class was presentbecause no death from this cause occurred in the highest occupational class.
Age standardisation using all age groups is clearly inappropriate for this cause ofdeath. The age specific annual mortality rate was 42.5/100,000 females, and55.1/100,000 males, in the 0-4 years age group.
141
2.51 Certain conditions originating in the perinatal period (ICD-9 760-779) 1989-1998
Figure 2.51.2
directly
standardised
mortality rate
ratios, by Region
(All Ireland =
100%)
> 120%
110% - 119%
100% - 109%
90% - 99%
80% - 89%
< 80%
Statistically significant
Females males
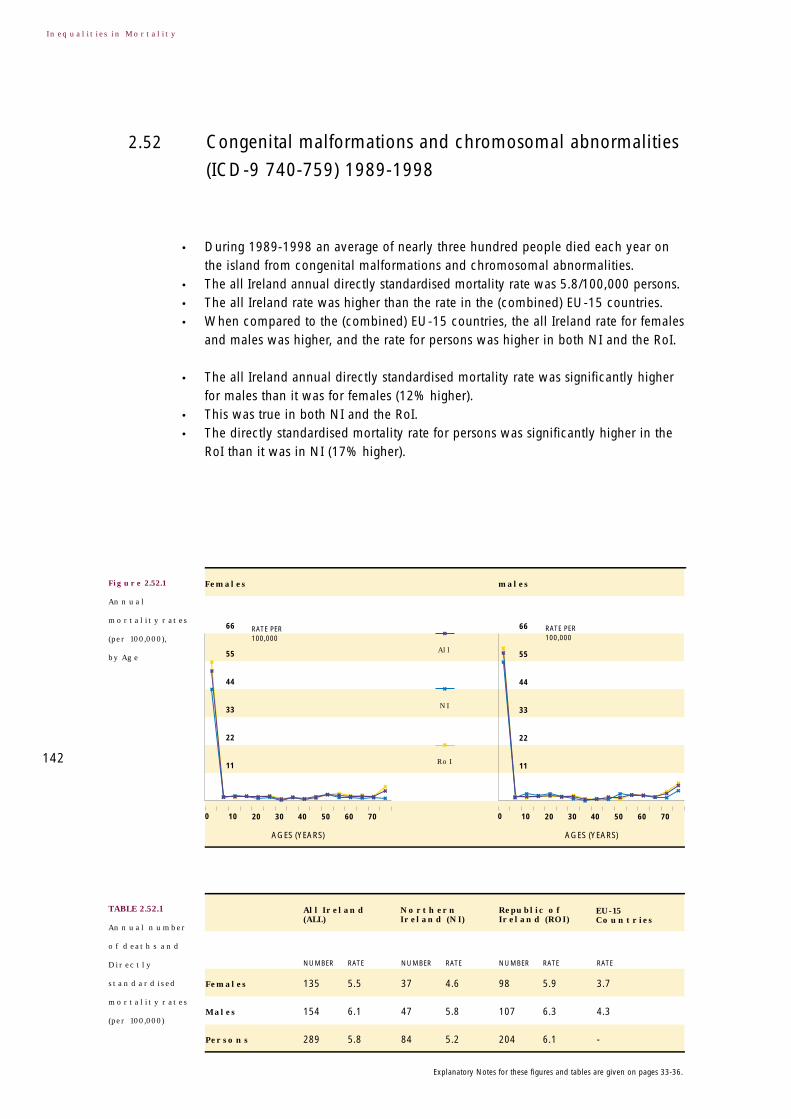
Figure 2.52.1
Annual
mortality rates
(per 100,000),
by Age
Congenital malformations and chromosomal abnormalities
(ICD-9 740-759) 1989-1998
2.52
142
TABLE 2.52.1
Annual number
of deaths and
Directly
standardised
mortality rates
(per 100,000)
Inequalities in Mortality
• During 1989-1998 an average of nearly three hundred people died each year onthe island from congenital malformations and chromosomal abnormalities.
• The all Ireland annual directly standardised mortality rate was 5.8/100,000 persons.• The all Ireland rate was higher than the rate in the (combined) EU-15 countries.• When compared to the (combined) EU-15 countries, the all Ireland rate for females
and males was higher, and the rate for persons was higher in both NI and the RoI.
• The all Ireland annual directly standardised mortality rate was significantly higherfor males than it was for females (12% higher).
• This was true in both NI and the RoI.• The directly standardised mortality rate for persons was significantly higher in the
RoI than it was in NI (17% higher).
Females
Males
Persons
Republic of Ireland (ROI)
Northern Ireland (NI)
All Ireland(ALL)
EU-15Countries
NUMBER RATE NUMBER RATE NUMBER RATE RATE
135 5.5 37 4.6 98 5.9 3.7
154 6.1 47 5.8 107 6.3 4.3
289 5.8 84 5.2 204 6.1 -
RATE PER 100,000
RATE PER 100,000
Females males
All
NI
RoI
0 10 20 30 40
AGES (YEARS) AGES (YEARS)
50 60 70 0 10 20 30 40 50 60 70
66
55
44
33
22
11
66
55
44
33
22
11
Explanatory Notes for these figures and tables are given on pages 33-36.
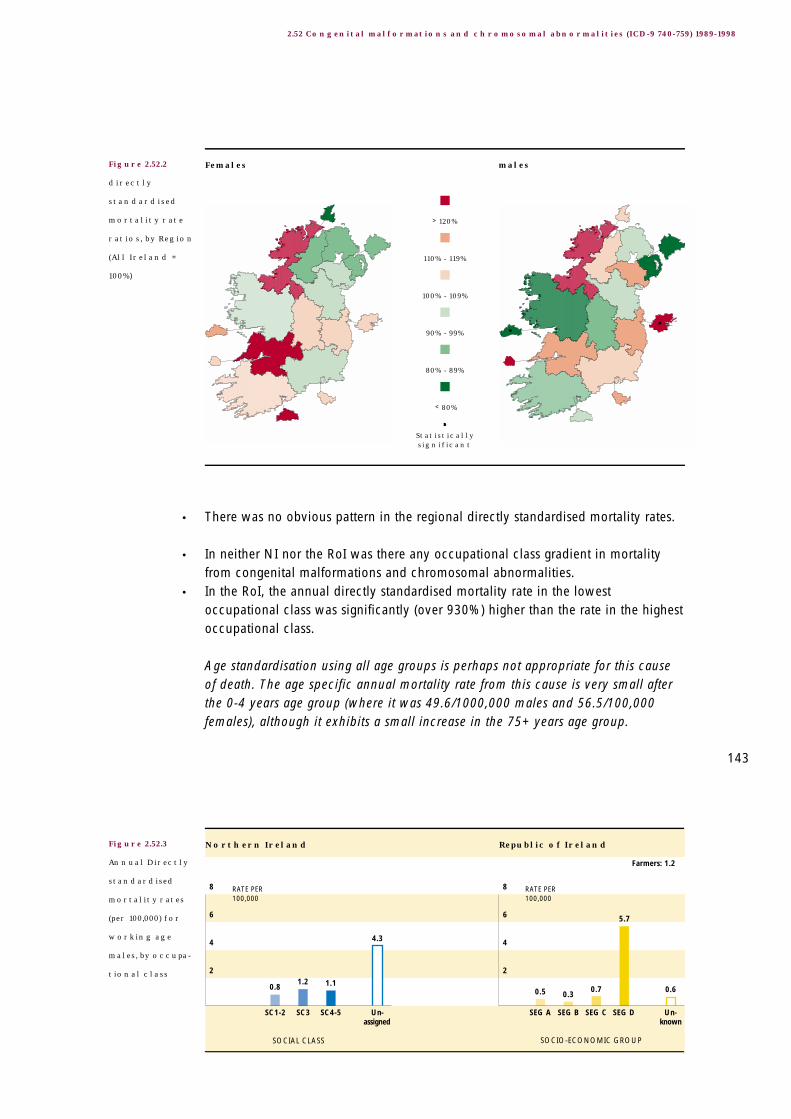
0.6
5.7
0.70.30.5
4.3
1.11.20.8
8
6
4
2
Northern Ireland
SOCIAL CLASS SOCIO-ECONOMIC GROUP
Republic of Ireland
SC1-2 SC3 SC4-5 SEG A SEG B SEG C SEG DUn-assigned
Un-known
RATE PER 100,000
RATE PER 100,000
8
6
4
2
Farmers: 1.2
• There was no obvious pattern in the regional directly standardised mortality rates.
• In neither NI nor the RoI was there any occupational class gradient in mortalityfrom congenital malformations and chromosomal abnormalities.
• In the RoI, the annual directly standardised mortality rate in the lowestoccupational class was significantly (over 930%) higher than the rate in the highestoccupational class.
Age standardisation using all age groups is perhaps not appropriate for this causeof death. The age specific annual mortality rate from this cause is very small afterthe 0-4 years age group (where it was 49.6/1000,000 males and 56.5/100,000females), although it exhibits a small increase in the 75+ years age group.
143
2.52 Congenital malformations and chromosomal abnormalities (ICD-9 740-759) 1989-1998
Figure 2.52.2
directly
standardised
mortality rate
ratios, by Region
(All Ireland =
100%)
Figure 2.52.3
Annual Directly
standardised
mortality rates
(per 100,000) for
working age
males, by occupa-
tional class
> 120%
110% - 119%
100% - 109%
90% - 99%
80% - 89%
< 80%
Statistically significant
Females males

Figure 2.53.1
Annual
mortality rates
(per 100,000),
by Age
Congenital malformations of the nervous system
(ICD-9 740-742) 1989-1998
2.53
144
TABLE 2.53.1
Annual number
of deaths and
Directly
standardised
mortality rates
(per 100,000)
Inequalities in Mortality
• During 1989-1998 an average of over fifty people died each year on the islandfrom congenital malformations of the nervous system.
• The all Ireland annual directly standardised mortality rate was 1.1/100,000 persons.• The all Ireland mortality rate was higher than the rate in the (combined) EU-15
countries.• When compared to the (combined) EU-15 countries, the all Ireland rate for females
and males was higher, and the rate for persons was higher in both NI and the RoI.
• The all Ireland annual directly standardised mortality rate was significantly lowerfor males than it was for females (6% lower).
• This was true in both NI and the RoI.• The directly standardised mortality rate for persons was significantly higher in the
RoI than it was in NI (48% higher).
Females
Males
Persons
Republic of Ireland (ROI)
Northern Ireland (NI)
All Ireland(ALL)
EU-15Countries
NUMBER RATE NUMBER RATE NUMBER RATE RATE
28 1.1 7 0.9 21 1.2 0.5
27 1.0 6 0.7 20 1.2 0.5
55 1.1 14 0.8 41 1.2 -
RATE PER 100,000
RATE PER 100,000
Females males
All
NI
RoI
0 10 20 30 40
AGES (YEARS) AGES (YEARS)
50 60 70 0 10 20 30 40 50 60 70
12
10
8
6
4
2
12
10
8
6
4
2
Explanatory Notes for these figures and tables are given on pages 33-36.

0.2
0.6
0.10.0
0.1
1.0
0.3
0.10.0
1.00
0.75
0.50
0.25
Northern Ireland
SOCIAL CLASS SOCIO-ECONOMIC GROUP
Republic of Ireland
SC1-2 SC3 SC4-5 SEG A SEG B SEG C SEG DUn-assigned
Un-known
RATE PER 100,000
RATE PER 100,000
1.00
0.75
0.50
0.25
Farmers: 0.0
• There was no obvious pattern in the regional directly standardised mortality rates.
• Only in NI was there a clear occupational class gradient in mortality fromcongenital malformations of the nervous system.
• In the RoI the annual directly standardised mortality rate in the lowestoccupational class was significantly (over 500%) higher than the rate in the highestoccupational class.
• In NI we note a link with occupational class was present because no deathoccurred in the highest occupational class.
Age standardisation using all age groups is perhaps not appropriate for this causeof death. The age specific annual mortality rate from this cause is small after the 0-4 years age group (where it was 9.9/1000,000 females and 9.1/100,000 males),although it exhibits an increase in the 75+ years age group. 145
2.53 Congenital malformations of the nervous system (ICD-9 740-742) 1989-1998
Figure 2.53.2
directly
standardised
mortality rate
ratios, by Region
(All Ireland =
100%)
Figure 2.53.3
Annual Directly
standardised
mortality rates
(per 100,000) for
working age
males, by occupa-
tional class
> 120%
110% - 119%
100% - 109%
90% - 99%
80% - 89%
< 80%
Statistically significant
Females males

Figure 2.54.1
Annual
mortality rates
(per 100,000),
by Age
Congenital malformations of the circulatory system
(ICD-9 745-747) 1989-1998
2.54
146
TABLE 2.54.1
Annual number
of deaths and
Directly
standardised
mortality rates
(per 100,000)
Inequalities in Mortality
• During 1989-1998 an average of one hundred people died each year on the islandfrom congenital malformations of the circulatory system.
• The all Ireland annual directly standardised mortality rate was 2.0/100,000 persons.• The all Ireland rate was higher than the rate in the (combined) EU-15 countries.• When compared to the (combined) EU-15 countries, the all Ireland rate for females
and males was higher, and the rate for persons was higher in both NI and the RoI.
• The all Ireland annual directly standardised mortality rate was significantly higherfor males than it was for females (22% higher).
• This was true in both NI and the RoI.• The directly standardised mortality rate for persons was significantly higher in the
RoI than it was in NI (3% higher) although the difference was very small.
Females
Males
Persons
Republic of Ireland (ROI)
Northern Ireland (NI)
All Ireland(ALL)
EU-15Countries
NUMBER RATE NUMBER RATE NUMBER RATE RATE
44 1.8 13 1.7 31 1.9 1.6
56 2.2 19 2.3 37 2.2 2.0
100 2.0 32 2.0 69 2.0 -
24
20
16
12
8
4
RATE PER 100,000
RATE PER 100,000
24
20
16
12
8
4
Females males
All
NI
RoI
0 10 20 30 40
AGES (YEARS) AGES (YEARS)
50 60 70 0 10 20 30 40 50 60 70
Explanatory Notes for these figures and tables are given on pages 33-36.

0.1
1.9
0.5
0.1
0.5
1.1
0.80.80.6
2.0
1.5
1.0
0.5
Northern Ireland
SOCIAL CLASS SOCIO-ECONOMIC GROUP
Republic of Ireland
SC1-2 SC3 SC4-5 SEG A SEG B SEG C SEG DUn-assigned
Un-known
RATE PER 100,000
RATE PER 100,000
2.0
1.5
1.0
0.5
Farmers: 0.8
• There was no obvious pattern in the regional directly standardised mortality rates.
• In neither NI nor the RoI was there an occupational class gradient in mortalityfrom congenital malformations of the circulatory system.
• In the RoI, the annual directly standardised mortality rate in the lowestoccupational class was significantly (over 310%) higher than the rate in the highestoccupational class.
Age standardisation using all age groups is perhaps not appropriate for this causeof death. The age specific annual mortality rate from this cause was small after the 0-4 years age group (where it was 15.5/1000,000 females and 20.0/100,000 males).
147
2.54 Congenital malformations of the circulatory system (ICD-9 745-747) 1989-1998
Figure 2.54.2
directly
standardised
mortality rate
ratios, by Region
(All Ireland =
100%)
Figure 2.54.3
Annual Directly
standardised
mortality rates
(per 100,000) for
working age
males, by occupa-
tional class
> 120%
110% - 119%
100% - 109%
90% - 99%
80% - 89%
< 80%
Statistically significant
Females males

Figure 2.55.1
Annual
mortality rates
(per 100,000),
by Age
Symptoms, signs, abnormal findings, ill-defined causes
(ICD-9 780-799) 1989-1998
2.55
148
TABLE 2.55.1
Annual number
of deaths and
Directly
standardised
mortality rates
(per 100,000)
Inequalities in Mortality
• During 1989-1998 an average of nearly three hundred people died each year onthe island from symptoms, signs, abnormal findings, ill-defined causes.
• The all Ireland directly standardised mortality rate was 4.9/100,000 persons.• The all Ireland rate was lower than the rate in the (combined) EU-15 countries.• When compared to the EU-15 countries, the all Ireland rate for both females and
males was lower, and the rate for persons was lower in both NI and the RoI.
• The all Ireland annual directly standardised mortality rate was significantly higherfor males than it was for females (11% higher).
• This was true in the RoI but not in NI.• The directly standardised mortality rate for persons was significantly higher in the
RoI than it was in NI (72% higher).
Females
Males
Persons
Republic of Ireland (ROI)
Northern Ireland (NI)
All Ireland(ALL)
EU-15Countries
NUMBER RATE NUMBER RATE NUMBER RATE RATE
156 4.6 40 3.3 116 5.3 18.3
122 5.1 24 3.1 98 6.0 27.2
278 4.9 64 3.3 214 5.7 -
90
75
60
45
30
15
RATE PER 100,000
RATE PER 100,000
90
75
60
45
30
15
Females males
All
NI
RoI
0 10 20 30 40
AGES (YEARS) AGES (YEARS)
50 60 70 0 10 20 30 40 50 60 70
Explanatory Notes for these figures and tables are given on pages 33-36.
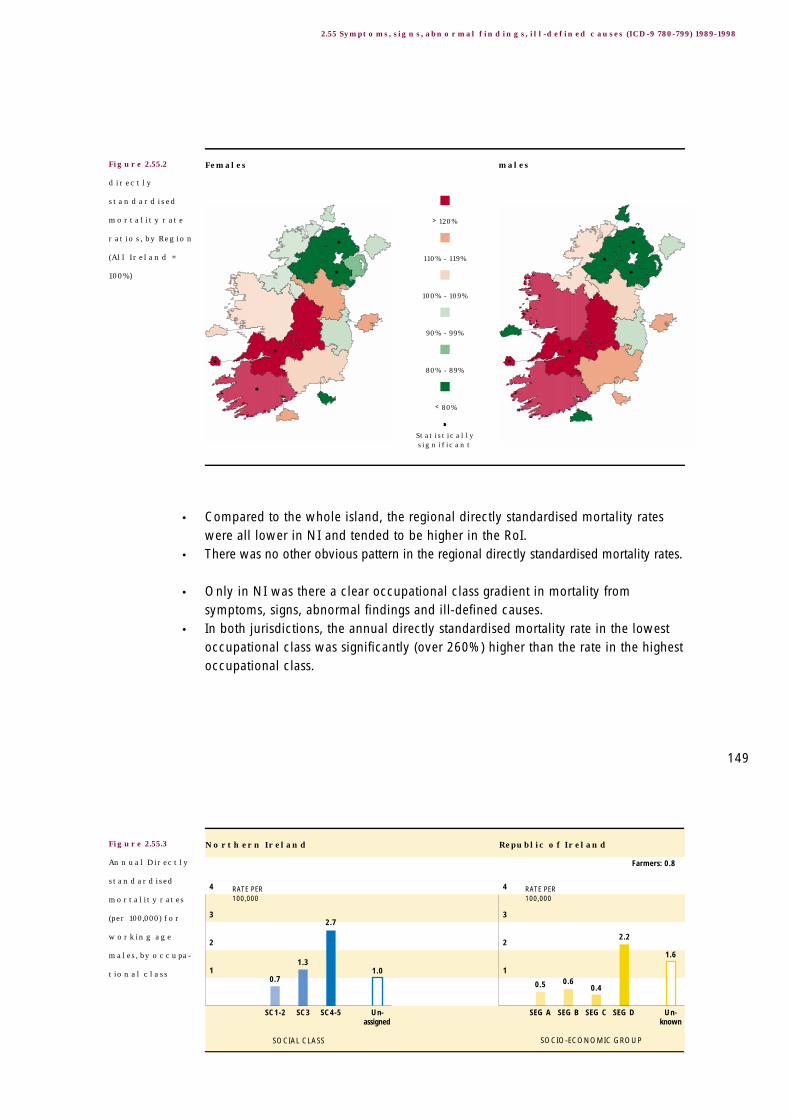
1.6
2.2
0.40.60.5
1.0
2.7
1.3
0.7
4
3
2
1
Northern Ireland
SOCIAL CLASS SOCIO-ECONOMIC GROUP
Republic of Ireland
SC1-2 SC3 SC4-5 SEG A SEG B SEG C SEG DUn-assigned
Un-known
RATE PER 100,000
RATE PER 100,000
4
3
2
1
Farmers: 0.8
• Compared to the whole island, the regional directly standardised mortality rateswere all lower in NI and tended to be higher in the RoI.
• There was no other obvious pattern in the regional directly standardised mortality rates.
• Only in NI was there a clear occupational class gradient in mortality fromsymptoms, signs, abnormal findings and ill-defined causes.
• In both jurisdictions, the annual directly standardised mortality rate in the lowestoccupational class was significantly (over 260%) higher than the rate in the highestoccupational class.
149
2.55 Symptoms, signs, abnormal findings, ill-defined causes (ICD-9 780-799) 1989-1998
Figure 2.55.2
directly
standardised
mortality rate
ratios, by Region
(All Ireland =
100%)
Figure 2.55.3
Annual Directly
standardised
mortality rates
(per 100,000) for
working age
males, by occupa-
tional class
> 120%
110% - 119%
100% - 109%
90% - 99%
80% - 89%
< 80%
Statistically significant
Females males

Figure 2.56.1
Annual
mortality rates
(per 100,000),
by Age
Sudden infant death syndrome (ICD-9 798.0) 1989-19982.56
150
TABLE 2.56.1
Annual number
of deaths and
Directly
standardised
mortality rates
(per 100,000)
Inequalities in Mortality
• During 1989-1998 an average of over sixty people died each year on the islandfrom sudden infant death syndrome.
• The all Ireland directly standardised mortality rate was 1.4/100,000 persons.• The all Ireland rate was higher than the rate in the (combined) EU-15 countries.• When compared to the (combined) EU-15 countries, the all Ireland rate for both
females and males was higher, and the rate for persons was lower in NI and higherin the RoI.
• The all Ireland annual directly standardised mortality rate was significantly higherfor males than it was for females (53% higher).
• This was true in the RoI but not in NI.• The directly standardised mortality rate for persons was significantly higher in the
RoI than it was in NI (210% higher).
Females
Males
Persons
Republic of Ireland (ROI)
Northern Ireland (NI)
All Ireland(ALL)
EU-15Countries
NUMBER RATE NUMBER RATE NUMBER RATE RATE
25 1.1 4 0.5 21 1.3 0.8
41 1.6 5 0.6 36 2.2 1.3
66 1.4 9 0.6 57 1.8 -
30
25
20
15
10
5
RATE PER 100,000
RATE PER 100,000
30
25
20
15
10
5
Females males
All
NI
RoI
0 10 20 30 40
AGES (YEARS) AGES (YEARS)
50 60 70 0 10 20 30 40 50 60 70
Explanatory Notes for these figures and tables are given on pages 33-36.

• Compared to the whole island, the regional directly standardised mortality rateswere lower in NI and tended to be higher in the RoI.
• There was no other obvious pattern in the regional directly standardised mortalityrates.
All deaths occurred before age 15 years precluding a standardised occupationalclass analysis. Age standardisation using all age groups is clearly inappropriate forthis cause of death. The age specific annual mortality rates were 13.4/100,000females and 20.5/100,000 males in the 0-4 years age group.
151
2.56 Sudden infant death syndrome (ICD-9 798.0) 1989-1998
Figure 2.56.2
directly
standardised
mortality rate
ratios, by Region
(All Ireland =
100%)
> 120%
110% - 119%
100% - 109%
90% - 99%
80% - 89%
< 80%
Statistically significant
Females males

Figure 2.57.1
Annual
mortality rates
(per 100,000),
by Age
Unknown and unspecified causes
(ICD-9 798.1-9,799) 1989-1998
2.57
152
TABLE 2.57.1
Annual number
of deaths and
Directly
standardised
mortality rates
(per 100,000)
Inequalities in Mortality
• During 1989-1998 an average of one hundred people died each year on the islandfrom unknown and unspecified causes.
• The all Ireland directly standardised mortality rate was 1.6/100,000 persons.• The all Ireland rate was lower than the rate in the (combined) EU-15 countries.• When compared to the (combined) EU-15 countries, the all Ireland rate for both
females and males was lower, and the rate for persons was lower in both NI andthe RoI.
• The all Ireland annual directly standardised mortality rate was significantly higherfor males than it was for females (7% higher).
• This was true in both NI and the RoI.• The directly standardised mortality rate for persons was significantly higher in the
RoI than it was in NI (65% higher).
Females
Males
Persons
Republic of Ireland (ROI)
Northern Ireland (NI)
All Ireland(ALL)
EU-15Countries
NUMBER RATE NUMBER RATE NUMBER RATE RATE
56 1.6 11 1.0 45 1.9 8.3
39 1.7 10 1.3 30 1.9 16.4
95 1.6 20 1.2 75 1.9 -
42
35
28
21
14
7
RATE PER 100,000
RATE PER 100,000
42
35
28
21
14
7
Females males
All
NI
RoI
0 10 20 30 40
AGES (YEARS) AGES (YEARS)
50 60 70 0 10 20 30 40 50 60 70
Explanatory Notes for these figures and tables are given on pages 33-36.

1.41.6
0.30.5
0.1
0.6
2.5
1.00.6
4
3
2
1
Northern Ireland
SOCIAL CLASS SOCIO-ECONOMIC GROUP
Republic of Ireland
SC1-2 SC3 SC4-5 SEG A SEG B SEG C SEG DUn-assigned
Un-known
RATE PER 100,000
RATE PER 100,000
4
3
2
1
Farmers: 0.4
• There was no obvious pattern in the regional directly standardised mortality rates.
• Only in NI was there a clear occupational class gradient in mortality fromunknown and unspecified causes.
• In both jurisdictions, the annual directly standardised mortality rate in the lowestoccupational class was significantly (over 300%) higher than the rate in the highestoccupational class.
These results stand in contrast to those for external 'uncertain' causes of death (seeSection 2.65). The use of the internal 'uncertain' cause of death codes here is farmore common amongst the oldest age group, particularly in the RoI. This might berelated to the difficulties associated with identifying a primary cause of deathamongst this age group. See Section 5.3 for further details.
153
2.57 Unknown and unspecified causes (ICD-9 798.1-9,799) 1989-1998
Figure 2.57.2
directly
standardised
mortality rate
ratios, by Region
(All Ireland =
100%)
Figure 2.57.3
Annual Directly
standardised
mortality rates
(per 100,000) for
working age
males, by occupa-
tional class
> 120%
110% - 119%
100% - 109%
90% - 99%
80% - 89%
< 80%
Statistically significant
Females males

Figure 2.58.1
Annual
mortality rates
(per 100,000),
by Age
External causes of injury and poisoning
(ICD-9 E800-E999) 1989-1998
2.58
154
TABLE 2.58.1
Annual number
of deaths and
Directly
standardised
mortality rates
(per 100,000)
Inequalities in Mortality
• During 1989-1998 an average of two thousand one hundred people died eachyear on the island from external causes of injury and poisoning.
• The all Ireland annual directly standardised mortality rate was 39.6/100,000 persons.• The all Ireland rate was lower than the rate in the (combined) EU-15 countries.• When compared to the (combined) EU-15 countries, the all Ireland rate for both females
and males was lower, and the rate for persons was lower in both NI and the RoI.
• The all Ireland annual directly standardised mortality rate was significantly higherfor males than it was for females (169% higher).
• This was true in both NI and the RoI.• The directly standardised mortality rate for persons was significantly higher in the
RoI than it was in NI (6% higher).
• The regional directly standardised mortality rate for external causes of injury andpoisoning tended to be lower in urban centres than it was on the whole island.
Females
Males
Persons
Republic of Ireland (ROI)
Northern Ireland (NI)
All Ireland(ALL)
EU-15Countries
NUMBER RATE NUMBER RATE NUMBER RATE RATE
633 21.6 203 20.8 430 22.1 25.8
1,450 58.0 441 56.0 1,009 59.0 64.9
2,083 39.6 644 38.1 1,439 40.4 -
210
175
140
105
70
35
RATE PER 100,000
RATE PER 100,000
210
175
140
105
70
35
Females males
All
NI
RoI
0 10 20 30 40
AGES (YEARS) AGES (YEARS)
50 60 70 0 10 20 30 40 50 60 70
Explanatory Notes for these figures and tables are given on pages 33-36.

100.9
156.1
44.635.1
25.433.1
114.0
70.9
43.4
160
120
80
40
Northern Ireland
SOCIAL CLASS SOCIO-ECONOMIC GROUP
Republic of Ireland
SC1-2 SC3 SC4-5 SEG A SEG B SEG C SEG DUn-assigned
Un-known
RATE PER 100,000
RATE PER 100,000
160
120
80
40
Farmers: 60.9
• A notable exception was Belfast LGD, where the rate was significantly higher forboth males and females.
• Outside urban centres, the regional directly standardised mortality rate wasgenerally higher than it was on the whole island, with the rates for males oftenbeing significantly so.
• In both NI and the RoI there were clear occupational class gradients in mortalityfrom external causes of injury and poisoning.
• In both jurisdictions the annual directly standardised mortality rate in the lowestoccupational class was significantly (over 160%) higher than the rate in the highestoccupational class.
The plot of the age specific mortality rates for males clearly shows a dramatic risestarting in the teenage years and continuing until the mid twenties. Thisphenomenon is not apparent in the plot for females.
155
2.58 External causes of injury and poisoning (ICD-9 E800-E999) 1989-1998
Figure 2.58.2
directly
standardised
mortality rate
ratios, by Region
(All Ireland =
100%)
Figure 2.58.3
Annual Directly
standardised
mortality rates
(per 100,000) for
working age
males, by occupa-
tional class
> 120%
110% - 119%
100% - 109%
90% - 99%
80% - 89%
< 80%
Statistically significant
Females males

Figure 2.59.1
Annual
mortality rates
(per 100,000),
by Age
Accidents (ICD-9 E800-E929) 1989-19982.59
156
TABLE 2.59.1
Annual number
of deaths and
Directly
standardised
mortality rates
(per 100,000)
Inequalities in Mortality
• During 1989-1998 an average of one thousand four hundred people died eachyear on the island from accidents.
• The all Ireland annual directly standardised mortality rate was 26.3/100,000 persons.• The all Ireland rate was lower than the rate in the (combined) EU-15 countries.• When compared to the (combined) EU-15 countries, the all Ireland rate for both
females and males was lower, and the rate for persons was lower in both NI andthe RoI.
• The all Ireland annual directly standardised mortality rate was significantly higherfor males than it was for females (128% higher).
• This was true in both NI and the RoI.• The directly standardised mortality rate for persons was significantly higher in the
RoI than it was in NI (14% higher).
Females
Males
Persons
Republic of Ireland (ROI)
Northern Ireland (NI)
All Ireland(ALL)
EU-15Countries
NUMBER RATE NUMBER RATE NUMBER RATE RATE
498 16.1 157 15.0 341 16.7 17.8
919 36.7 262 33.4 657 38.3 40.8
1,417 26.3 419 24.1 998 27.5 -
180
150
120
90
60
30
RATE PER 100,000
RATE PER 100,000
180
150
120
90
60
30
Females males
All
NI
RoI
0 10 20 30 40
AGES (YEARS) AGES (YEARS)
50 60 70 0 10 20 30 40 50 60 70
Explanatory Notes for these figures and tables are given on pages 33-36.

55.0
85.6
27.721.7
14.213.2
61.1
37.1
25.7
100
75
50
25
Northern Ireland
SOCIAL CLASS SOCIO-ECONOMIC GROUP
Republic of Ireland
SC1-2 SC3 SC4-5 SEG A SEG B SEG C SEG DUn-assigned
Un-known
RATE PER 100,000
RATE PER 100,000
100
75
50
25
Farmers: 32.1
• The regional directly standardised mortality rate for accidents tended to be lowerin urban centres than it was on the whole island.
• Outside the urban centres, the regional directly standardised mortality rates weregenerally higher than they were for the whole island, with the excess mortalityoften being significant for males.
• In both NI and the RoI there were clear occupational class gradients in mortalityfrom accidents.
• In both jurisdictions, the annual directly standardised mortality rate in the lowestoccupational class was significantly (over 130%) higher than the rate in the highestoccupational class.
157
2.59 Accidents (ICD-9 E800-E929) 1989-1998
Figure 2.59.2
directly
standardised
mortality rate
ratios, by Region
(All Ireland =
100%)
Figure 2.59.3
Annual Directly
standardised
mortality rates
(per 100,000) for
working age
males, by occupa-
tional class
> 120%
110% - 119%
100% - 109%
90% - 99%
80% - 89%
< 80%
Statistically significant
Females males

Figure 2.60.1
Annual
mortality rates
(per 100,000),
by Age
Transport accidents (ICD-9 E800-E848) 1989-19982.60
158
TABLE 2.60.1
Annual number
of deaths and
Directly
standardised
mortality rates
(per 100,000)
Inequalities in Mortality
• During 1989-1998 an average of six hundred people died each year on the islandfrom transport accidents.
• The all Ireland annual directly standardised mortality rate was 11.4/100,000 persons.• The all Ireland rate was lower than the rate in the (combined) EU-15 countries.• When compared to the (combined) EU-15 countries, the all Ireland rate for both
females and males was lower, and the rate for persons was lower in both NI andthe RoI.
• The all Ireland annual directly standardised mortality rate was significantly higher formales than it was for females (193% higher). This was true in both NI and the RoI.
• The directly standardised mortality rate for persons was significantly higher in theRoI than it was in NI (25% higher).
• The regional directly standardised mortality rate for transport accidents tended tobe lower in urban centres than it was on the whole island.
Females
Males
Persons
Republic of Ireland (ROI)
Northern Ireland (NI)
All Ireland(ALL)
EU-15Countries
NUMBER RATE NUMBER RATE NUMBER RATE RATE
161 5.9 46 5.1 115 6.2 6.1
454 17.2 121 14.6 333 18.4 19.1
616 11.4 167 9.8 449 12.3 -
48
40
32
24
16
8
RATE PER 100,000
RATE PER 100,000
48
40
32
24
16
8
Females males
All
NI
RoI
0 10 20 30 40
AGES (YEARS) AGES (YEARS)
50 60 70 0 10 20 30 40 50 60 70
Explanatory Notes for these figures and tables are given on pages 33-36.

29.0
40.7
1713.9
9.07.1
24.5
19.516.8
44
33
22
11
Northern Ireland
SOCIAL CLASS SOCIO-ECONOMIC GROUP
Republic of Ireland
SC1-2 SC3 SC4-5 SEG A SEG B SEG C SEG DUn-assigned
Un-known
RATE PER 100,000
RATE PER 100,000
44
33
22
11
Farmers: 15.5
• In regions without urban centres, the regional directly standardised mortality ratewas generally higher than it was on the whole island.
• These differences accounted for most of the variation in the regional directlystandardised mortality rates.
• In both NI and the RoI there were clear occupational class gradients in mortalityfrom transport accidents.
• In both jurisdictions the mortality rate in the lowest occupational class wassignificantly (over 40%) higher than the rate in the highest occupational class.
The plot of the age specific mortality rates for males clearly shows a dramatic risestarting in the teenage years and continuing until the mid twenties. Thisphenomenon is not apparent in the plot for females.
159
2.60 Transport accidents (ICD-9 E800-E848) 1989-1998
Figure 2.60.2
directly
standardised
mortality rate
ratios, by Region
(All Ireland =
100%)
Figure 2.60.3
Annual Directly
standardised
mortality rates
(per 100,000) for
working age
males, by occupa-
tional class
> 120%
110% - 119%
100% - 109%
90% - 99%
80% - 89%
< 80%
Statistically significant
Females males

Figure 2.61.1
Annual
mortality rates
(per 100,000),
by Age
Accidental falls (ICD-9 E880-E888) 1989-19982.61
160
TABLE 2.61.1
Annual number
of deaths and
Directly
standardised
mortality rates
(per 100,000)
Inequalities in Mortality
• During 1989-1998 an average of four hundred people died each year on the islandfrom accidental falls.
• The all Ireland annual directly standardised mortality rate was 7.0/100,000 persons.• The all Ireland rate was lower than the rate in the (combined) EU-15 countries.• When compared to the (combined) EU-15 countries, the all Ireland rate for both
females and males was lower, and the rate for persons was lower in both NI andthe RoI.
• The all Ireland annual directly standardised mortality rate was significantly higherfor males than it was for females (25% higher).
• This was true in both NI and the RoI.• The directly standardised mortality rate for persons was significantly higher in the
RoI than it was in NI (1% higher) although the excess was very small.
Females
Males
Persons
Republic of Ireland (ROI)
Northern Ireland (NI)
All Ireland(ALL)
EU-15Countries
NUMBER RATE NUMBER RATE NUMBER RATE RATE
223 6.1 72 5.7 151 6.4 7.0
178 7.7 60 8.2 118 7.4 9.3
401 7.0 132 7.0 269 7.1 -
132
110
88
66
44
22
RATE PER 100,000
RATE PER 100,000
132
110
88
66
44
22
Females males
All
NI
RoI
0 10 20 30 40
AGES (YEARS) AGES (YEARS)
50 60 70 0 10 20 30 40 50 60 70
Explanatory Notes for these figures and tables are given on pages 33-36.

6.8
10.3
3.12.51.40.9
13.3
6.4
2.1
16
12
8
4
Northern Ireland
SOCIAL CLASS SOCIO-ECONOMIC GROUP
Republic of Ireland
SC1-2 SC3 SC4-5 SEG A SEG B SEG C SEG DUn-assigned
Un-known
RATE PER 100,000
RATE PER 100,000
16
12
8
4
Farmers: 3.1
• There was no obvious pattern in the regional directly standardised mortality rates.
• In both NI and the RoI there were clear occupational class gradients in mortalityfrom accidental falls.
• In both jurisdictions, the annual directly standardised mortality rate in the lowestoccupational class was significantly (over 510%) higher than the rate in the highestoccupational class.
161
2.61 Accidental falls (ICD-9 E880-E888) 1989-1998
Figure 2.61.2
directly
standardised
mortality rate
ratios, by Region
(All Ireland =
100%)
Figure 2.61.3
Annual Directly
standardised
mortality rates
(per 100,000) for
working age
males, by occupa-
tional class
> 120%
110% - 119%
100% - 109%
90% - 99%
80% - 89%
< 80%
Statistically significant
Females males

Figure 2.62.1
Annual
mortality rates
(per 100,000),
by Age
Accidental poisoning (ICD-9 E850-E869) 1989-19982.62
162
TABLE 2.62.1
Annual number
of deaths and
Directly
standardised
mortality rates
(per 100,000)
Inequalities in Mortality
• During 1989-1998 an average of seventy five people died each year on the islandfrom accidental poisoning.
• The all Ireland annual directly standardised mortality rate was 1.5/100,000 persons.• The all Ireland rate was higher than the rate in the (combined) EU-15 countries.• When compared to the (combined) EU-15 countries, the all Ireland rate for both
females and males was higher, and the rate for persons was higher in NI and lowerin the RoI.
• The all Ireland annual directly standardised mortality rate was significantly higherfor males than it was for females (113% higher).
• This was true in both NI and the RoI.• The directly standardised mortality rate for persons was significantly lower in the
RoI than it was in NI (42% lower).
Females
Males
Persons
Republic of Ireland (ROI)
Northern Ireland (NI)
All Ireland(ALL)
EU-15Countries
NUMBER RATE NUMBER RATE NUMBER RATE RATE
24 1.0 12 1.4 13 0.8 0.9
52 2.1 22 2.9 30 1.7 1.8
76 1.5 33 2.1 42 1.2 -
6
5
4
3
2
1
RATE PER 100,000
RATE PER 100,000
6
5
4
3
2
1
Females males
All
NI
RoI
0 10 20 30 40
AGES (YEARS) AGES (YEARS)
50 60 70 0 10 20 30 40 50 60 70
Explanatory Notes for these figures and tables are given on pages 33-36.

2.9
7.4
1.21.01.01.9
8.2
4.0
1.1
10
7.5
5.0
2.5
Northern Ireland
SOCIAL CLASS SOCIO-ECONOMIC GROUP
Republic of Ireland
SC1-2 SC3 SC4-5 SEG A SEG B SEG C SEG DUn-assigned
Un-known
RATE PER 100,000
RATE PER 100,000
10
7.5
5.0
2.5
Farmers: 1.4
• Compared to the whole island, the regional directly standardised mortality rate foraccidental poisonings was higher in the northern parts of the island and lower inthe southern parts.
• Exceptions were Dublin CB and the South Eastern HB area, where the rate tendedto be higher than it was on the whole island.
• Only in NI was there a clear occupational class gradient in mortality fromaccidental poisoning.
• In both jurisdictions, the annual directly standardised mortality rate in the lowestoccupational class was significantly (over 640%) higher than the rate in the highestoccupational class.
North-South differences in the use of other information in cases where the deathcertificate is unclear may account for some of the North-South difference inmortality observed here. See Section 5.3 for further details.
163
2.62 Accidental poisoning (ICD-9 E850-E869) 1989-1998
Figure 2.62.2
directly
standardised
mortality rate
ratios, by Region
(All Ireland =
100%)
Figure 2.62.3
Annual Directly
standardised
mortality rates
(per 100,000) for
working age
males, by occupa-
tional class
> 120%
110% - 119%
100% - 109%
90% - 99%
80% - 89%
< 80%
Statistically significant
Females males

Figure 2.63.1
Annual
mortality rates
(per 100,000),
by Age
Suicide and intentional self-harm
(ICD-9 E950-E959) 1989-1998
2.63
164
TABLE 2.63.1
Annual number
of deaths and
Directly
standardised
mortality rates
(per 100,000)
Inequalities in Mortality
• During 1989-1998 an average of over five hundred people died each year on theisland from suicide and intentional self-harm.
• The all Ireland annual directly standardised mortality rate was 10.2/100,000 persons.• The all Ireland rate was slightly lower than the rate in the (combined) EU-15
countries.• When compared to the (combined) EU-15 countries, the all Ireland rate for both
females and males was slightly lower, and the rate for persons was lower in bothNI and the RoI.
• The all Ireland annual directly standardised mortality rate was significantly higherfor males than it was for females (286% higher).
• This was true in both NI and the RoI.• The directly standardised mortality rate for persons was significantly higher in the
RoI than it was in NI (41% higher).
Females
Males
Persons
Republic of Ireland (ROI)
Northern Ireland (NI)
All Ireland(ALL)
EU-15Countries
NUMBER RATE NUMBER RATE NUMBER RATE RATE
103 4.2 29 3.7 74 4.5 5.8
406 16.3 98 12.4 308 18.1 18.5
509 10.2 127 8.0 382 11.2 -
36
30
24
18
12
6
RATE PER 100,000
RATE PER 100,000
36
30
24
18
12
6
Females males
All
NI
RoI
0 10 20 30 40
AGES (YEARS) AGES (YEARS)
50 60 70 0 10 20 30 40 50 60 70
Explanatory Notes for these figures and tables are given on pages 33-36.
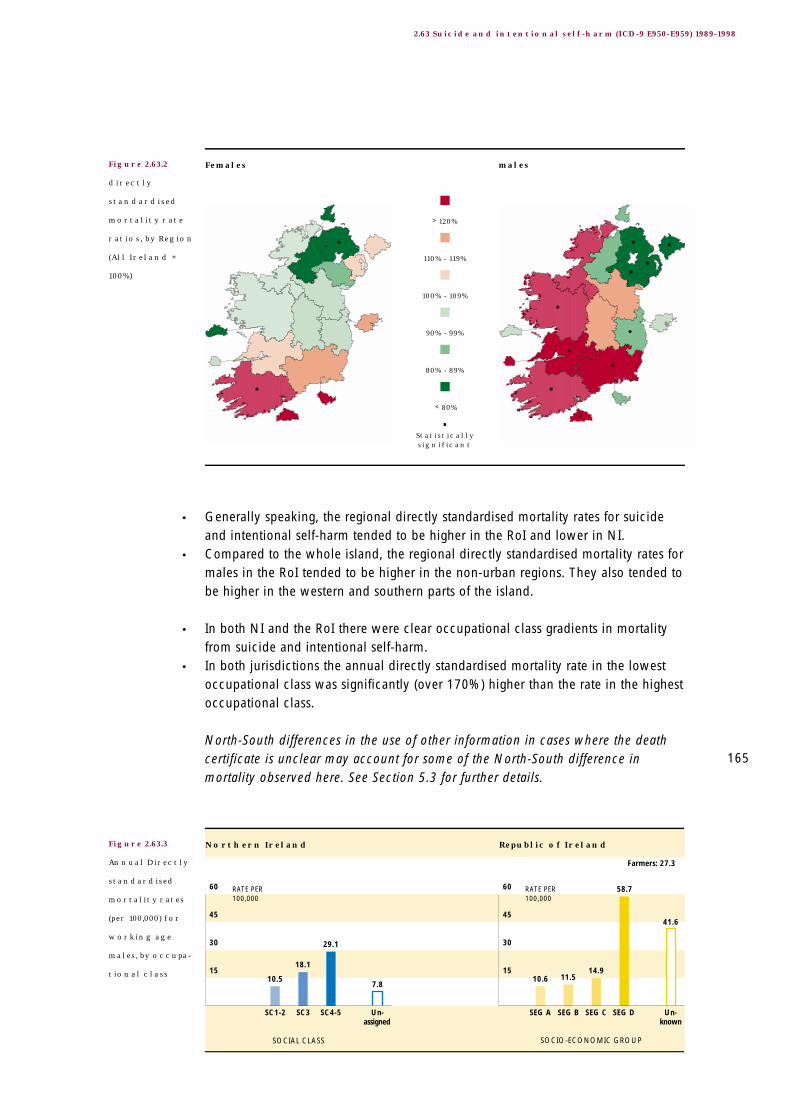
41.6
58.7
14.911.510.6
7.8
29.1
18.1
10.5
60
45
30
15
Northern Ireland
SOCIAL CLASS SOCIO-ECONOMIC GROUP
Republic of Ireland
SC1-2 SC3 SC4-5 SEG A SEG B SEG C SEG DUn-assigned
Un-known
RATE PER 100,000
RATE PER 100,000
60
45
30
15
Farmers: 27.3
• Generally speaking, the regional directly standardised mortality rates for suicideand intentional self-harm tended to be higher in the RoI and lower in NI.
• Compared to the whole island, the regional directly standardised mortality rates formales in the RoI tended to be higher in the non-urban regions. They also tended tobe higher in the western and southern parts of the island.
• In both NI and the RoI there were clear occupational class gradients in mortalityfrom suicide and intentional self-harm.
• In both jurisdictions the annual directly standardised mortality rate in the lowestoccupational class was significantly (over 170%) higher than the rate in the highestoccupational class.
North-South differences in the use of other information in cases where the deathcertificate is unclear may account for some of the North-South difference inmortality observed here. See Section 5.3 for further details.
165
2.63 Suicide and intentional self-harm (ICD-9 E950-E959) 1989-1998
Figure 2.63.2
directly
standardised
mortality rate
ratios, by Region
(All Ireland =
100%)
Figure 2.63.3
Annual Directly
standardised
mortality rates
(per 100,000) for
working age
males, by occupa-
tional class
> 120%
110% - 119%
100% - 109%
90% - 99%
80% - 89%
< 80%
Statistically significant
Females males

Figure 2.64.1
Annual
mortality rates
(per 100,000),
by Age
Homicide/assault (ICD-9 E960-E969) 1989-19982.64
166
TABLE 2.64.1
Annual number
of deaths and
Directly
standardised
mortality rates
(per 100,000)
Inequalities in Mortality
• During 1989-1998 an average of one hundred people died each year on the islandfrom homicide/assault.
• The all Ireland annual directly standardised mortality rate was 2.0/100,000 persons.• When compared to the (combined) EU-15 countries, the all Ireland rate for females
was lower and the all Ireland rate for males was higher.
• The all Ireland annual directly standardised mortality rate was significantly higherfor males than it was for females (457% higher).
• This was true in both NI and the RoI.• The directly standardised mortality rate for persons was significantly lower in the
RoI than it was in NI (83% lower).
• The difference between the jurisdictions was reflected at the regional level. Almostuniversally, the regional directly standardised mortality rates for homicide/assault
Females
Males
Persons
Republic of Ireland (ROI)
Northern Ireland (NI)
All Ireland(ALL)
EU-15Countries
NUMBER RATE NUMBER RATE NUMBER RATE RATE
16 0.6 10 1.1 6 0.4 0.7
85 3.3 64 8.0 21 1.2 1.7
101 2.0 74 4.6 27 0.8 -
18
15
12
9
6
3
RATE PER 100,000
RATE PER 100,000
18
15
12
9
6
3
Females males
All
NI
RoI
0 10 20 30 40
AGES (YEARS) AGES (YEARS)
50 60 70 0 10 20 30 40 50 60 70
Explanatory Notes for these figures and tables are given on pages 33-36.

1.8
5.9
0.90.90.4
10.1
18.7
12.8
5.3
20
15
10
5
Northern Ireland
SOCIAL CLASS SOCIO-ECONOMIC GROUP
Republic of Ireland
SC1-2 SC3 SC4-5 SEG A SEG B SEG C SEG DUn-assigned
Un-known
RATE PER 100,000
RATE PER 100,000
20
15
10
5
Farmers: 0.3
tended to be lower in the RoI and higher in NI. For males, these differences wereoften statistically significant.
• The only exceptions were mortality rates in Dublin CB (females) and Limerick CB(both females and males).
• Only in NI was there a clear occupational class gradient in mortality fromhomicide/assault.
• In both jurisdictions, the annual directly standardised mortality rate in the lowestoccupational class was significantly (over 250%) higher than the rate in the highestoccupational class.
These results reflect some of the burden experienced by people in Northern Irelandbecause of the Troubles. North-South differences in the use of other information incases where the death certificate is unclear may account for some of the North-South difference in mortality observed here. See Section 5.3 for further details.
167
2.64 Homicide, assault (ICD-9 E960-E969) 1989-1998
Figure 2.64.2
directly
standardised
mortality rate
ratios, by Region
(All Ireland =
100%)
Figure 2.64.3
Annual Directly
standardised
mortality rates
(per 100,000) for
working age
males, by occupa-
tional class
> 120%
110% - 119%
100% - 109%
90% - 99%
80% - 89%
< 80%
Statistically significant
Females males

Figure 2.65.1
Annual
mortality rates
(per 100,000),
by Age
Events of undetermined intent
(ICD-9 E980-E989) 1989-1998
2.65
168
TABLE 2.65.1
Annual number
of deaths and
Directly
standardised
mortality rates
(per 100,000)
Inequalities in Mortality
• During 1989-1998 an average of fifty people died each year on the island fromevents of undetermined intent.
• The all Ireland directly standardised mortality rate was 1.0/100,000 persons.• The all Ireland rate was lower than the rate in the (combined) EU-15 countries.• When compared to the (combined) EU-15 countries, the all Ireland rate for both
females and males was lower, and the rate for persons was lower in both NI andthe RoI.
• The all Ireland annual directly standardised mortality rate was significantly higherfor males than it was for females (174% higher).
• This was true in both NI and the RoI.• The directly standardised mortality rate for persons was significantly lower in the
RoI than it was in NI (22% lower).
Females
Males
Persons
Republic of Ireland (ROI)
Northern Ireland (NI)
All Ireland(ALL)
EU-15Countries
NUMBER RATE NUMBER RATE NUMBER RATE RATE
14 0.5 6 0.7 8 0.5 1.3
36 1.5 13 1.7 23 1.4 3.5
50 1.0 19 1.2 31 0.9 -
6
5
4
3
2
1
RATE PER 100,000
RATE PER 100,000
6
5
4
3
2
1
Females males
All
NI
RoI
0 10 20 30 40
AGES (YEARS) AGES (YEARS)
50 60 70 0 10 20 30 40 50 60 70
Explanatory Notes for these figures and tables are given on pages 33-36.

2.4
6.0
1.11.00.2
1.8
4.0
2.2
1.0
8
6
4
2
Northern Ireland
SOCIAL CLASS SOCIO-ECONOMIC GROUP
Republic of Ireland
SC1-2 SC3 SC4-5 SEG A SEG B SEG C SEG DUn-assigned
Un-known
RATE PER 100,000
RATE PER 100,000
8
6
4
2
Farmers: 1.3
• There was no obvious pattern in the regional directly standardised mortality rates.
• In neither NI nor the RoI was there a clear occupational class gradient in mortalityfor events of undetermined intent.
• In both jurisdictions the annual directly standardised mortality rate in the lowestoccupational class was significantly (over 310%) higher than the rate in the highestoccupational class.
These results stand in contrast to those for internal 'uncertain' causes of death (see Section 2.57). The use of the external 'uncertain' cause of death codes here ismore common amongst younger age males. This might be related to North-Southdifferences in the use other of information in cases where the death certificate is unclear.
169
2.65 Events of undetermined intent (ICD-9 E980-E989) 1989-1998
Figure 2.65.2
directly
standardised
mortality rate
ratios, by Region
(All Ireland =
100%)
Figure 2.65.3
Annual Directly
standardised
mortality rates
(per 100,000) for
working age
males, by occupa-
tional class
> 120%
110% - 119%
100% - 109%
90% - 99%
80% - 89%
< 80%
Statistically significant
Females males

170
Inequalities in Mortality

Part Three: Data Considerations
172
Inequalities in Mortality
3 Statistical Methods
3.1 OverviewIn Northern Ireland, the Northern Ireland Statistics and Research Agency (NISRA)manages the mortality collection and undertakes the principal analyses for theDepartment of Health, Social Services and Public Safety. A population census isundertaken by NISRA every ten years, the last one was conducted in 2001.
In the Republic, the Central Statistics Office (CSO) manages the mortalitycollection and undertakes the principal analyses for the Department of Health andChildren. The Department also holds all raw data from 1980 and undertakesfurther analyses. A population census is undertaken by the CSO every five years.
The European Shortlist of Cause of Death Categories (1), comprising sixty fivecauses of death categories, forms the basis of this report. These are the cause ofdeath categories adopted by Eurostat to facilitate comparisons between themember states of the European Union, and each jurisdiction provides data toEurostat on this basis. Further details are given in Appendix 1.
Deaths for the calendar period 1989-1998 were analysed. The year 1998 was thelatest year for which data were available when the request was made. Theinclusion of ten years of statistics allowed regional directly standardised mortalityrates to be calculated with some confidence, for males and females and for eachof the sixty five cause of death categories.
Regional analyses were based on Health and Social Services Board areas (HSSBs)in the North and Health Board areas (HBs) in the South, together with the majorurban centres in the two jurisdictions. These centres are, the Belfast and DerryLocal Government Districts (LGDs) in Northern Ireland, and the five CountyBoroughs (CBs) in the Republic (Cork, Dublin, Galway, Limerick and Waterford).These regions were chosen to provide relevant data to the health authorities andto facilitate broad urban-rural comparisons. Further details are given in Figure 2.1and Section 4.2.
Occupational class analyses focus on working age males (aged 16-64 years inNorthern Ireland and 15-64 years in the Republic). Occupation data for workingage males is more complete and may be more useful than it is for females,children or retired people. Occupational class is represented differently in the twojurisdictions. In Northern Ireland occupational class is measured by a Social Classscale, in the Republic it is measured by a Socio-economic Group scale. It was notpossible to identify a single scale on death records and population census files inboth jurisdictions that could be used confidently in an all Ireland occupationalclass analysis. Further details are given in Table 2.1 and Table 2.2 and Section 4.3.

173
Part Three: Data Considerations
For each of the sixty five cause of death categories, the Northern Ireland Statisticsand Research Agency and the Central Statistics Office in the Republic providedthe total number of deaths occurring in the period 1989-1998 disaggregated byage, gender, region and occupational class (2,3).
1994 population estimates, corresponding to the midpoint of the study period, weretaken as denominators for mortality rates. Further details are given in Section 4.4.
3.2 Age StandardisationA simple comparison of two crude mortality rates can be misleading if the agestructures of the two populations are different and mortality varies with age.
In this report procedures to adjust for age differences are based on the directmethod of standardisation. With this type of standardisation the observed agespecific mortality rates are applied to some standard (possibly theoretical)population. The results are expressed as directly standardised (mortality) rates per100,000 population (DSRs) (6). In this report we calculate a directly standardisedrate for each gender, region and occupational class. The standard population istaken to be the World Health Organisation’s Standard European Population (7)(see Appendix 4). Directly standardised mortality rates are presented in Table2.00.1-Table 2.65.1 and Figure 2.00.3-Figure 2.65.3.
In order to compare the mortality experiences of two genders, two regions, or twooccupational classes, directly standardised (mortality) rate ratios (DSRRs) are used(6). These are simply ratios of two directly standardised rates, expressed as apercentage, where the denominator serves as the base for the comparison. Forexample, the DSRR for any region of the island is the ratio of that region’s directlystandardised (mortality) rate to the rate for the whole island, expressed as apercentage. If it is 125% (say) this means that, after adjusting for age differences,the mortality rate observed in the region was 25% higher than the rate for thewhole island. Directly standardised mortality rate ratios are presented in Figure2.00.2-Figure 2.65.2.
For gender comparisons, females are used as the base. In comparisons of the twojurisdictions Northern Ireland is used as the base. In the case of occupationalclasses, each class was compared to the highest occupational class category. InNorthern Ireland this was SC 1-2 (‘Professionals’ and ‘Managerial and technicaloccupations’) while in the Republic it was SEG A (‘Higher professionals’ and‘Lower professionals’).

174
Inequalities in Mortality
3.3 Statistical Significance and Practical ImportanceWhen interpreting the results presented in Part Two it is important to distinguishbetween a ‘statistically significant’ difference and a difference that may be‘practically important’ or interesting. This distinction was a key factor indetermining the presentation of the regional variation in mortality. For example,suppose the directly standardised mortality rate for a region is 3% higher than therate for the whole island. If cell sizes (reflecting the numbers of deaths andpopulation sizes) were large, as was often the case here, then this excess mortalitycould well be statistically significant. This excess mortality may or may not be ofpractical importance or interest. This assessment is affected by many other factors,and in mapping these rate ratios somewhat arbitrary conventions had to beadopted. In Figure 2.00.2-Figure 2.65.2, DSRRs have been grouped into sixcategories then represented by colour coding. Categories were based on tenpercentage point excesses and ten percentage points deficits in mortality. Thesecategories reflect a broad subjective assessment of differences which may be ofpractical importance or interest. A dot is used to indicate a statistically significantexcess or deficit.
3.4 Statistical ProceduresThe number of deaths reported in Table 2.00.1-Table 2.65.1 are annual number ofdeaths. Calculations were based on the total number of deaths for the period1989-1998, these are ten times (10 x) the annual numbers reported in the tables.
Confidence intervals for directly standardised rates and directly standardised rateratios were derived using standard formulae (6). The statistical significance of adirectly standardised rate ratio was based on an inspection of its 99% confidenceinterval.
The appearance of spuriously significant results is a statistical problem commonlyassociated with studies which include a large number of hypothesis tests. In suchstudies there is a high likelihood that some differences will be labelled ‘statisticallysignificant’ when in fact they are simply due to chance variation. There arenumerous methods for dealing with this problem, none of which are completelysatisfactory. In this report we attempted to control the overall error rate byadjusting the Z score used in the construction of confidence intervals (8).
Statistical analyses were undertaken at the Institute of Public Health using thestatistical programming package SAS (9).
175
Part Three: Data Considerations
3.5 LimitationsUnderlying limitations in the data used have certainly affected death counts andmortality rates. Until the methodological issues described in Part Three are betterunderstood, some of the results presented here are best interpreted cautiously.The decade 1989-1998 was a period of great social, political and economicchange throughout the island. The pooling of ten years data, while increasing thenumber of deaths involved, means that any temporal trends in mortality areignored. The choice of health (and social services) board areas and urban centresfor regional analyses means that variation within these regions is not reflected inthe results. Small area analysis of mortality statistics is not considered and nothingis reported about special groups such as Travellers and minority ethnic groups.
Finally, we should recognise that patterns in mortality reflect not only underlyingdisease and disability in a population, but also the care seeking behaviours of itsmembers, the way it locates and operates its health care services, the practices ofits health care workers, its methods of death registration, and patterns of internalmigration. Consideration of these and other issues is required when interpreting,for example, regional differences in mortality.

176
Inequalities in Mortality
4 Definitions and Conventions
4.1 Mortality RecordsIn Northern Ireland and in the Republic, a death registration is completed by theRegistrar using details supplied by an ‘informant’, and the medical certificate ofcause of death or Coroner’s certificate.
Stillbirths are not included in this report. Mortality data includes deaths of non-residents while deaths of usual residents occurring outside a jurisdiction areexcluded. The Ninth Revision of the International Classification of Diseases (11)was used to classify deaths in both Northern Ireland and the Republic during thewhole period 1989-1998. Mortality data used here is based on date of registrationin Northern Ireland and date of death in the Republic. In both jurisdictions,regional analyses are based on place of usual residence except for deaths of non-residents in which case place of death is used.
4.2 GeographyIn Northern Ireland there are four Health and Social Services Boards (HSSBs)comprising 26 Local Government Districts (LGDs). LGDs aggregate to HSSBs andare key administrative regions. In the Republic there are eight Health Boards (HBs)comprising 25 complete counties and two sections of Co Tipperary. Theseaggregate to HBs and are key administrative regions. There are five major urbancentres in the Republic corresponding to the five County Boroughs (CBs): Cork,Dublin, Galway, Limerick, and Waterford. The two major urban centres inNorthern Ireland are both LGDs: Belfast and Derry.
Regional analyses are based on the nineteen regions (four health and socialservices boards, eight health boards and seven urban centres) described in Table4.2.1 below and Figure 2.1 in Part Two.
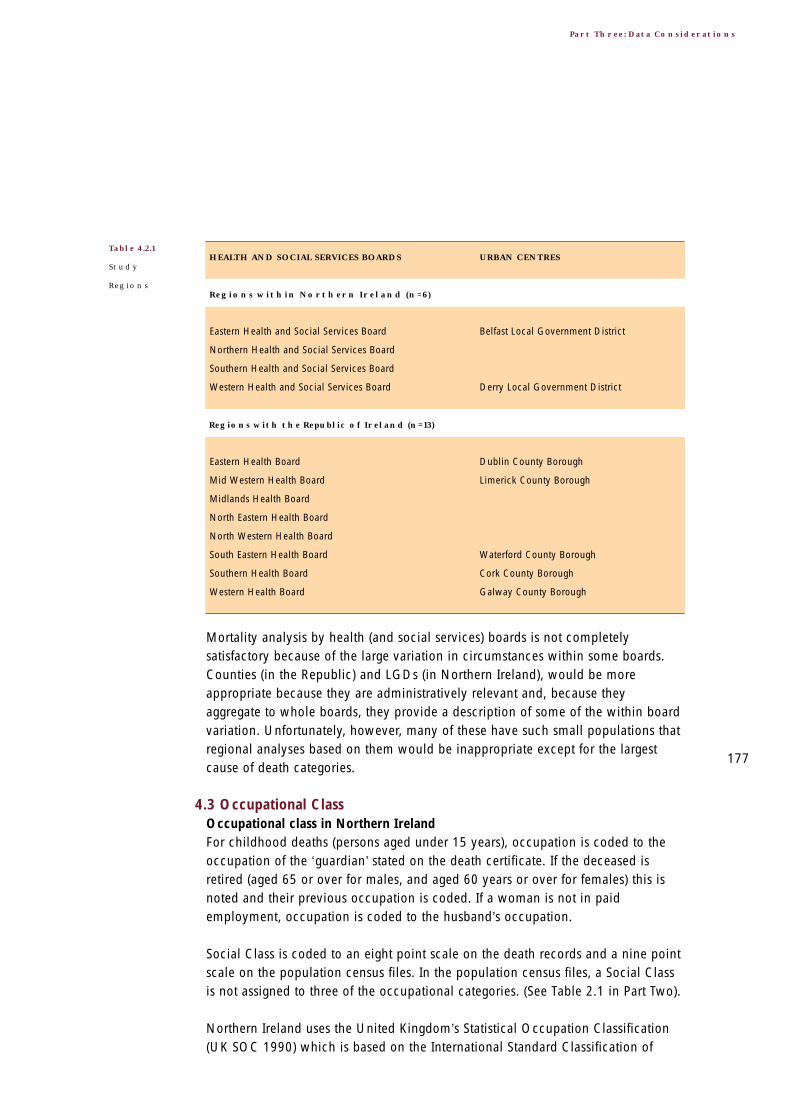
177
Part Three: Data Considerations
Mortality analysis by health (and social services) boards is not completelysatisfactory because of the large variation in circumstances within some boards.Counties (in the Republic) and LGDs (in Northern Ireland), would be moreappropriate because they are administratively relevant and, because theyaggregate to whole boards, they provide a description of some of the within boardvariation. Unfortunately, however, many of these have such small populations thatregional analyses based on them would be inappropriate except for the largestcause of death categories.
4.3 Occupational ClassOccupational class in Northern IrelandFor childhood deaths (persons aged under 15 years), occupation is coded to theoccupation of the ‘guardian’ stated on the death certificate. If the deceased isretired (aged 65 or over for males, and aged 60 years or over for females) this isnoted and their previous occupation is coded. If a woman is not in paidemployment, occupation is coded to the husband’s occupation.
Social Class is coded to an eight point scale on the death records and a nine pointscale on the population census files. In the population census files, a Social Classis not assigned to three of the occupational categories. (See Table 2.1 in Part Two).
Northern Ireland uses the United Kingdom’s Statistical Occupation Classification(UK SOC 1990) which is based on the International Standard Classification of
HEALTH AND SOCIAL SERVICES BOARDS
Regions within Northern Ireland (n=6)
Eastern Health and Social Services Board
Northern Health and Social Services Board
Southern Health and Social Services Board
Western Health and Social Services Board
Regions with the Republic of Ireland (n=13)
Eastern Health Board
Mid Western Health Board
Midlands Health Board
North Eastern Health Board
North Western Health Board
South Eastern Health Board
Southern Health Board
Western Health Board
URBAN CENTRES
Belfast Local Government District
Derry Local Government District
Dublin County Borough
Limerick County Borough
Waterford County Borough
Cork County Borough
Galway County Borough
Table 4.2.1
Study
Regions

178
Inequalities in Mortality
Occupations (European variant) (ISCO 88 COM) to code occupation (12). Thedeath certificate in Northern Ireland includes a description of the occupation andemployment status of the deceased. A 3-digit UK SOC code and an EmploymentStatus code are stored on the death record. Both these codes are needed to assigna Social Class code, which is also stored on the death record. UK SOC 1990 wasrecently updated to UK SOC 2000 and the United Kingdom recently published theNational Statistics Socio-economic Classification (NS-SEC). Both the UK SOC1990 and UK SOC 2000 can be mapped onto ISCO 88COM.
In Northern Ireland the Social Class codes and coding practices in the mortalitycollection and the population census are identical.
Occupational class in the RepublicFor childhood deaths (persons aged under 16 years), occupation is coded to theoccupation of the ‘guardian’ stated on the death certificate. If the deceased wasretired (aged 65 or over for males, and aged 60 years or over for females) this isnoted and their previous occupation is coded. If the deceased was a ‘married,widowed or separated woman, not gainfully employed’, occupation is coded tothe husband’s occupation.Socio-Economic Group is coded on a twelve point scale on both the death recordsand population census files. (See Table 2.2 in Part Two).
The population census in the Republic uses an adaptation of the UK SOC 1990system to code occupation. Irish classifications for Socio-economic Group are basedon these codes and employment status. An Occupation code and EmploymentStatus code, available in the population census files, are needed to code Socio-economic Group. However, only the description of the occupation of the deceasedprovided by the informant is included on the death certificate. In the mortalitycollection, this description alone is directly coded to a one digit Socio-EconomicGroup code. This code, but no Occupation code, is stored on the death record.
Farmers have been excluded from the occupational class analyses presented inFigure 2.00.3-2.65.3. This is because the questions in the 1991 Census did nottake into account either the size or value of the farm, the nature of the farmingactivity, or the income generated by the farm. Consequently, ‘Farmers’ is a veryheterogeneous category and its inclusion in the occupational class analysis wouldhave greatly distorted occupational class patterns in the Republic. These 1991Census questions were changed for the 1996 Census but remained in use in themortality collection for the whole of the period 1989-1998.

179
Part Three: Data Considerations
In the Republic, Socio-economic Group codes in the mortality collection and thepopulation census are identical. However, the coding practices are very different.
Occupation class coding used in this reportA single coding suitable for the whole island was not identified. Social Class wasused in Northern Ireland and Socio-economic Group in the Republic. The finalcodes for Northern Ireland are given in Table 2.1 and for the Republic they aregiven in Table 2.2 in Part Two.
4.4 Population EstimatesPopulation estimates for the age, gender, and regional analyses refer to 1994, theapproximate mid-point of the period 1989-1998. These estimates were derivedfrom official population estimates provided by the Northern Ireland Statistics andResearch Agency (4) and the Central Statistics Office in the Republic (5). ForNorthern Ireland, they were taken as the average of the official 30 June 1993 and30 June 1994 population estimates. These correspond to 1 January 1994 – theexact midpoint of the 1989-1998 calendar period. For Health Board areas in theRepublic, population estimates for 1994 were taken from the Department of Healthand Children’s Public Health Information System (PHIS). These are obtained fromlinear interpolation of 1991 Census and 1994 Census estimates with a pro-rataadjustment to ensure that national totals by age group and gender agree withofficial intercensal estimates. Population estimates for County Boroughs in theRepublic were interpolated from the 1991 Census and 1996 Census estimates.These correspond to 30 April 1994. See Appendix 2 for full population estimates.
The population estimates used in the occupational class analyses were obtainedby applying the occupational class profiles observed in the 1991 Census (13,14) tothe region-sex-age counts described above. It was not possible to use the 1996Census in the calculations for the Republic because the questions relating tooccupation were changed for that Census (see Section 4.3). See Appendix 3 forfull occupational class profile estimates.
The statistical agencies in the two jurisdictions do not produce the populationestimates required for this report. The 1994 population estimates used here,disaggregated by gender, region and occupational class are not official estimatesof the respective statistical agencies.

180
Inequalities in Mortality
5 Recommendations on Data Issues
5.1 Co-ordinationThe island’s mortality collections are valuable sources of information. While eachjurisdiction participates in international efforts to improve the quality of mortalitystatistics, there are few all Ireland initiatives to strengthen such efforts. Theseinitiatives would address factors affecting data quality, specific to the island.
RecommendationsIn order to enhance the contribution of mortality statistics on the island,appropriate management structures should be put in place for, and adequateresources allocated to, these important sources of information. An all Irelandgroup should be established to advise on the further development of the mortalitycollections on the island and to co-ordinate these developments in order tomaximise comparability. Promotion of international standards would be animportant element of the group’s work. Further improvements in data qualitywould also follow if other issues, specific to the island of Ireland, were alsoaddressed. Attempts to achieve greater co-ordination need to recognise thatNorthern Ireland collections have to take cognizance of United Kingdomprotocols
The group’s Terms of Reference should address:
• A common set of core data items to be included on death records• Co-ordination of data collection protocols and procedures• Analysis of mortality data• Dissemination of the results of such analyses
The specific recommendations below would provide a useful basis for thedevelopment of a work plan for the group.
5.2 Data Items on the Death RecordsDeaths includedOverseas deaths and deaths of non-residentsIn both Northern Ireland and the Republic, the death of a resident that occursoutside their jurisdiction is not included in the mortality collection. Deaths of non-residents that occur in a jurisdiction, however, are included in thatjurisdiction’s death counts.
The approach adopted to these deaths varies. For example, the Swedish mortalitycollection only includes Swedish residents, whether the death occurs in Swedenor abroad. The same is true for the other Nordic countries (Finland, Iceland andNorway) except for Denmark. Denmark’s mortality collection includes only thosedeaths of Danish residents that occur in Denmark. This means, for example, that a

181
Part Three: Data Considerations
Swedish resident who dies on the island of Ireland is counted in the island’s aswell as the Swedish mortality statistics. A resident of the island who dies inSweden, however, is not included in either mortality statistics.
Unfortunately, obtaining comprehensive data on the deaths of residents on theisland who die overseas is difficult, and coverage may be incomplete. In theAnnual Report of the Registrar General in Northern Ireland some details are givenin the Summary (Tables 1.4, 1.6 and 1.7) (2). In 1998, for example, 0.7%(100/14,993) of all deaths registered in Northern Ireland involved non-residents.Both jurisdictions make the assumption that the under and over recording canceleach other out. This is common practice and similar assumptions are made forexample, in Scotland, Wales and England.
StillbirthsThere are differences, relating mainly to birth weight and gestation, in thedefinitions of ‘stillbirth’ used in the two jurisdictions. Prior to 1 October 1992, theterm ‘stillbirth’ in Northern Ireland only related to events occurring after the 28thweek of pregnancy. The Stillbirth (Definition) Act 1992 then redefined a stillbirth(from 1 October 1992) as a child which had issued forth from its mother after the24th week of pregnancy and which did not breathe or show any other sign of life.In the Republic, prior to 1995 ‘stillbirths’ were not registered. Since 1995,however, ‘stillbirth’ refers to the death of a foetus weighing 500 grams or more, orat a gestational age of 24 weeks or more.
While not directly affecting this report which deals with selected causes of deathrather than deaths in selected age groups, these definitional differences mean thatthe calculation of numerators and denominators for stillbirth and perinatalmortality rates in the North and the South are not strictly comparable.
Late death registrations and inquestsIn Northern Ireland deaths have to be registered within seven days; in theRepublic they have to be registered within a year. In the Republic, deaths whereno inquest has been held which have not been registered within one year of theiroccurrence can be registered only on the authority of the Registrar General. Theseare excluded from official death counts. In Northern Ireland late deathregistrations are included in the official death counts for the year they wereregistered.

182
Inequalities in Mortality
Date and placeDate and place can refer to either the death itself or the registration of the death.In the case of place, the deceased’s place of usual residence is another possibility.The actual date or place used for an analysis depends on its purpose. It might bequite important, for example, in investigations of seasonal patterns in mortality touse date of death rather than date of registration. The manner in which thecorresponding population estimates are calculated also plays a role.
AgeFull date of birth is included on the death records in Northern Ireland. On thedeath records in the Republic only age at death, and not full date of birth, isrecorded. This could be a significant limitation in any studies that required datalinkages with other information.
RecommendationsThe inclusion criterion for the mortality collections of Northern Ireland and theRepublic should be reviewed and, if necessary, revised in order to maximisecomparability between the jurisdictions. In particular, the review should consider:
• Mechanisms to identify deaths of usual residents that occur outside theirjurisdiction (at least those that occur on the island)
• Mechanisms to identify deaths of non-residents (at least those of the otherjurisdiction on the island)
• Procedures for dealing with these deaths• The definition of a stillbirth• The definition of and procedures for handling ‘late registrations’
In order to facilitate a wider range of mortality analyses, the availability in bothjurisdictions of a common set of core data items on the death records should beconsidered. The discussion above suggests that the set should include:
• Date of death and date of registration• Place of death and place of usual residence• Full date of birth (for inclusion in the Republic)
Later discussion in this chapter also suggests the common set of data items shouldinclude:
• Secondary as well as primary causes of death (for inclusion in the Republic)• Occupation code and employment status code• Selected occupational class codes• Other items such as ethnicity or country of origin• Basis of coding cause of death

183
Part Three: Data Considerations
5.3 Data Collection Protocols and ProceduresCause of deathInvestigations for coding external causesBoth the General Registrar’s Office in Northern Ireland and the Central StatisticsOffice in the Republic deal directly with the Registrars or Coroners who completedeath registration forms. In the Republic further information (such as Garda notes)is sought for coding in cases of unclear death certificates. It is estimated that thisoccurs for approximately 30% of all certificates. In Northern Ireland, however,only information on the death certificate or the Coroner’s forms is coded. Codingof external causes of death in the North and South may therefore differ becausethe amount of information available varies. In particular, mortality rates for eventsof undetermined intent would be inflated in the North or deflated in the South,and mortality rates for other external causes such as suicide and self-harm,accidental poisonings and transport accidents would be similarly affected.
Cause of death amongst the elderlyThe concept of a ‘primary cause of death’ may not be totally appropriate for olderpeople. Until the mid 1950s, ‘old age’ was an allowable cause of death. In recentyears, if ‘old age’ is given as cause of death on a death certificate, and the personis aged over 80 years in the North (or over 85 years in the South), then it is codedas ICD 797 ‘Senility without mention of psychosis’. If the deceased is aged over80 years in the North (or over 85 years in the South), no further details are sought.If the deceased is aged below these respective cut-offs then, in both jurisdictions,an effort is made to gather further details.
It has been suggested that, in the North, doctors tend to give ‘bronchialpneumonia’ as the cause of death when the deceased is elderly and there is someuncertainty about the primary cause. This would lead to an inflation of themortality rate from pneumonia in the North. Differences in coding practicesregarding ‘pneumonia’ and ‘chronic lower respiratory disease’ may also play arole, and be related to the excess mortality from chronic lower respiratory diseasesin the South and pneumonia in the North.
Secondary causes of deathBoth the primary cause of death and up to four secondary causes of death are codedto ICD-9 and included on Northern Ireland death records. In the Republic only theprimary cause of death is coded to ICD-9 and stored on the death record. Nosecondary causes of death are coded even though up to three can be recorded onthe death certificate. The absence of secondary causes in the Republic can seriouslylimit investigation of certain causes of death and the role of co-morbidities.

184
Inequalities in Mortality
Selection of the primary causeProtocols for identifying the primary cause of death in the two jurisdictionsoccasionally differ. For example, in the Republic diabetes mellitus, cancers andasthma can be coded as the primary cause of death when they occur in Part 2 ofthe death certificate and certain circulatory disease are alone in Part 1. This mayexplain some of the North-South differences in mortality from these causes.
Occupation and occupational classNorthern Ireland uses the United Kingdom’s Statistical Occupation Classification(UK SOC 1990) which is based on the International Standard Classification ofOccupations (European variant) (ISCO 88 COM) to code occupation (11). TheRepublic uses an adaptation of the UK SOC 1990 system as the basis of its Socio-economic Group coding.
In Northern Ireland the Social Class scale used in the mortality collection, and theinformation available on the death certificate for coding, exactly match that usedin the jurisdiction’s Census. The Socio-economic Group scale used in the mortalitycollection of the Republic exactly matches the scale used in the jurisdiction’sCensus. However, only some of the information needed to do the coding isavailable in the mortality collection: employment status is missing from the deathcertificate. This has a particular effect on the Socio-economic Group codes 0 and4 (see Table 2.2 in Part Two). The Census in the Republic uses a Social Class scalesimilar to the one used in the Northern Ireland Census.
In Northern Ireland occupation is first assigned a three digit UK SOC 1990 codeand then, on the basis of this code and the deceased’s employment status,allocated to a Social Class category using the same methods used in the Census.In the Republic, however, the description on the death certificate alone is codeddirectly to a Socio-economic Group code.
The mortality collections in the two jurisdictions also differ in the procedures usedto allocate occupation codes or occupational class codes to particular populationsubgroups:
• In Northern Ireland the working years are assumed to start at age 16 yearswhile in the Republic they are assumed to start at age 15 years
• People currently not employed are assigned an ‘Unoccupied’ Social classcode in Northern Ireland. In the Republic they are coded on the basis of theirprevious occupation. In each case, the code they are assigned to includessome who are employed, making it difficult to look at the unemployed as aseparate group
• In Northern Ireland, the Social Class code ‘On government employment ortraining scheme’ is used in the Census but not in the mortality collection. In

185
Part Three: Data Considerations
the mortality collection, if sufficient extra details are provided the occupationcode for the future profession is used. Otherwise the death is allocated the‘Unoccupied’ code
• In Northern Ireland, the Social class code assigned to a male aged 65 years orover (or a female aged 60 years or over) on population census files dependson the time since they were last in paid employment. If they were in paidemployment in the last 10 years that last occupation is used. If not, they areassigned a ‘No job in last 10 years’ code. In the mortality collection theirprevious occupation is used
• In the Republic the ‘Farmers’ category in the Census did not take into accounteither the size or value of the farm, the nature of the farming activity, or theincome generated by the farm. An attempt was made to rectify this in the1996 Census
The percentage of death records in the Republic with a Socio-economic Groupcode ‘Unknown’ is quite large. This difficulty has been noted by other researchersattempting to interpret socio-economic patterns of mortality (14,15). While thepercentage of death records in Northern Ireland with Social Class coded as‘Unoccupied’ is small, the total percentage of records in the mortality collectionand population census files which are not allocated a Social Class code isconsiderably larger. They include ‘Armed forces, inadequately described or nostated occupation’, ‘On a government employment or training scheme’ and ‘Nopaid job in the last 10 years’. (See Table 2.1 in Part Two). They cannot beincorporated into occupational class analyses.
Only in Northern Ireland is the occupation code included on the death record.
In conclusion, the poor quality of occupation data on death records on the island,particularly amongst people outside the working years and amongst females,severely limits our ability to explore the relationship between socio-economiccircumstances and mortality. The absence of other data items such as ethnicityand country of origin imposes further limitations.
Data validation proceduresRoutine quality control procedures are essential if the conclusions of mortalityanalyses are to be valid. Each mortality collection has in place procedures toensure that information recorded on a death certificate is accurately transferred tothe official death record. Of course, these need to be continually reviewed.Procedures to ensure that the circumstances of the death and the deceased areaccurately recorded on the death certificate also make a vital contribution to thevalidity of mortality data. The introduction of automatic ICD-10 coding into themortality collections will focus attention on these procedures.
186
Inequalities in Mortality
RecommendationsIn order to maximise comparability between Northern Ireland and the Republic,procedures to ascertain and code the causes of death should be reviewed and, ifnecessary, revised. In particular, the review should consider:
• Practices of certifying doctors when recording cause of death on the deathcertificate
• Appropriate training for these doctors to standardise certifying practices• The use of other information such as police notes to establish external cause
of death• Procedures to ascertain cause of death amongst the elderly, particularly the
use of ‘pneumonia’ and ‘lower chronic respiratory diseases’• Appropriate training for coders to standardise coding practices• The inclusion of secondary causes of death on the death records in the Republic
No recommendations have been made regarding the coding of specific causes ofdeath. In these cases, advice should be sought from relevant national andinternational experts.
Occupation data on death records should be reviewed. In particular, attentionshould focus on:
• A common shared classification system for occupation• A common set of occupational class scales, based on the occupation codes• The information required on the death certificate to undertake associated
occupation coding (including employment status in the Republic)• Appropriate procedures and support for those who capture the information on
the death certificate are needed. The role of ‘informants’ requires particularattention in both jurisdictions
• Inclusion of occupation and employment status codes on death records (inthe Republic)
• Occupation data for deaths of females and people outside the working ages• The comparability of occupation data on death records and population
census files
While no explicit recommendations are made with regard to data validationprocedures, the vital role of adequate procedures cannot be overstated.
187
Part Three: Data Considerations
5.4 Population EstimatesPopulation estimates provide the denominators for rate calculations. As such theyneed to be constructed in a manner that is consistent with the way that deathcounts, which provide the numerators, are calculated.
Two broad types of population estimates can be calculated. Census counts(‘defacto’ population estimates) tend to be more appropriate in studies of certaintypes of accidental causes of death while place of usual residence estimates(‘dejour’ population estimates) tend to be useful in studies of the health effects oflong term exposures to environmental hazards. The different estimates arise, to alarge degree, from the way that absent residents and visitors on Census night arehandled. These correspond to the way that the death of a resident that occursoutside a jurisdiction, and the death of a non-resident that occurs in thejurisdiction, are handled in the death counts.
Northern Ireland principally uses a place of usual residence approach, while theRepublic principally uses a census counts approach. In Northern Irelandadjustment is also made for underestimation, this is not done in the Republic. Bothjurisdictions, however, include non-residents in death counts and exclude deathsof usual residents that occur outside their jurisdiction.
RecommendationsThe impact of the different types of population estimates on mortality rates, in theNorth and South, should be assessed. The assessment should consider maincauses of deaths and the impact on temporal and regional patterns in mortality.
If the impact appears significant, then population estimates calculated using theappropriate method should be incorporated into routine mortality analyses.
5.5 Analysis and ReportingThe extent and nature of the analysis of mortality data is largely determined by thedemand expressed for such analyses and the resources available to undertake them.
Extent of reportingFrequency and timelinessIn routine publications in Northern Ireland, date of registration data is used. In theroutine publications of the Republic, annual reports are based on date of deathdata while quarterly reports are based on date of registration. In Northern Ireland,the 1999 annual report (based on date of registration) was published in November2000. At the beginning of April 2001, the most recent annual report (based ondate of death) available in the Republic was for 1997, with 1998 soon to bepublished. The report for the third quarter in 2000 (based on date of registrationdata) was also available.
188
Inequalities in Mortality
Breadth of analysis undertakenIn both jurisdictions, routine reports present standard analyses such as deathcounts and directly standardised mortality rates, disaggregated by region andgender. A far wider investigation of mortality analyses would contribute greatly topolicy and service development, and research.
Age standardisation proceduresThe NISRA recently held a seminar on standardisation methods used throughoutNorthern Ireland and concluded that different methods were appropriate indifferent circumstances. As noted for particular causes of death, the use of ‘allages’ is sometimes not appropriate.
Standard populations for (directly) standardised mortality ratesIn Northern Ireland and the Republic, the government statistical agencies use thecurrent population of their jurisdiction for directly standardised mortality rates.This confounds the interpretation of temporal trends in mortality in a givenjurisdiction if that jurisdiction’s population is changing. Moreover, it precludescomparisons of Northern Ireland and the Republic, and other internationalcomparisons. In Northern Ireland, the WHO Standard European Population isused in mortality reports for the HSSBs. In the Republic it is used in the PublicHealth Information System (PHIS).
Reference mortality experience for (indirectly) standardised mortality ratios (SMRs)In Northern Ireland and the Republic, the current mortality experience of the totalpopulation of the jurisdiction is taken as the reference mortality experience forSMRs. Such SMRs from different jurisdictions cannot be compared. Moreover, theymake the interpretation of temporal trends in SMRs within a jurisdiction difficult.
Sparse dataMissing dataIf the date of birth is missing from a death certificate in Northern Ireland, the age of the deceased is estimated and a matching date of birth is entered onto thedeath record.
Small cell sizesOn occasion, 15-year age groups are used in standardisation procedures if cellsizes are small or if analyses are restricted to particular causes or particular regions.There are legislative guidelines, North and South, to deal with these issues.

189
Part Three: Data Considerations
RecommendationsIn both jurisdictions, resources should be allocated to enable the timely publicationof both routine and special analyses of patterns of mortality on the island.Procedures and conventions used in the routine mortality publications of the twojurisdictions should be reviewed and, if necessary, revised. In particular the reviewshould consider:
• A common core set of cause of death categories (the European Shortlist is acandidate)
• Agreed age standardisation procedures including the age range and agegroups used, the standard populations used for directly standardised rates,and the reference mortality experience for SMRs
• Protocols for handling sparse data (missing data and small cell sizes)• Use of both date of registration and date of death as the basis for reporting
The use of such standardised procedures does not, of course, preclude theconduct of other analyses for different purposes.
The scope of current analyses should be expanded substantially for the fullpotential of the mortality collections to be realised. Three particular projectsshould have high priority:
• A more detailed analysis of occupational class differences in mortality toincrease understanding of socio-economic inequalities in mortality on theisland
• A comparative study of recent trends in mortality to explore the impact of thesocial, political and economic changes experienced recently in the twojurisdictions
• An in-depth investigation of variation in mortality on the island in order toplace the North-South differences into an appropriate context
By their very nature these are multi-disciplinary projects and it would be useful toidentify key areas of responsibility and develop the necessary collaborativepartnerships.

References
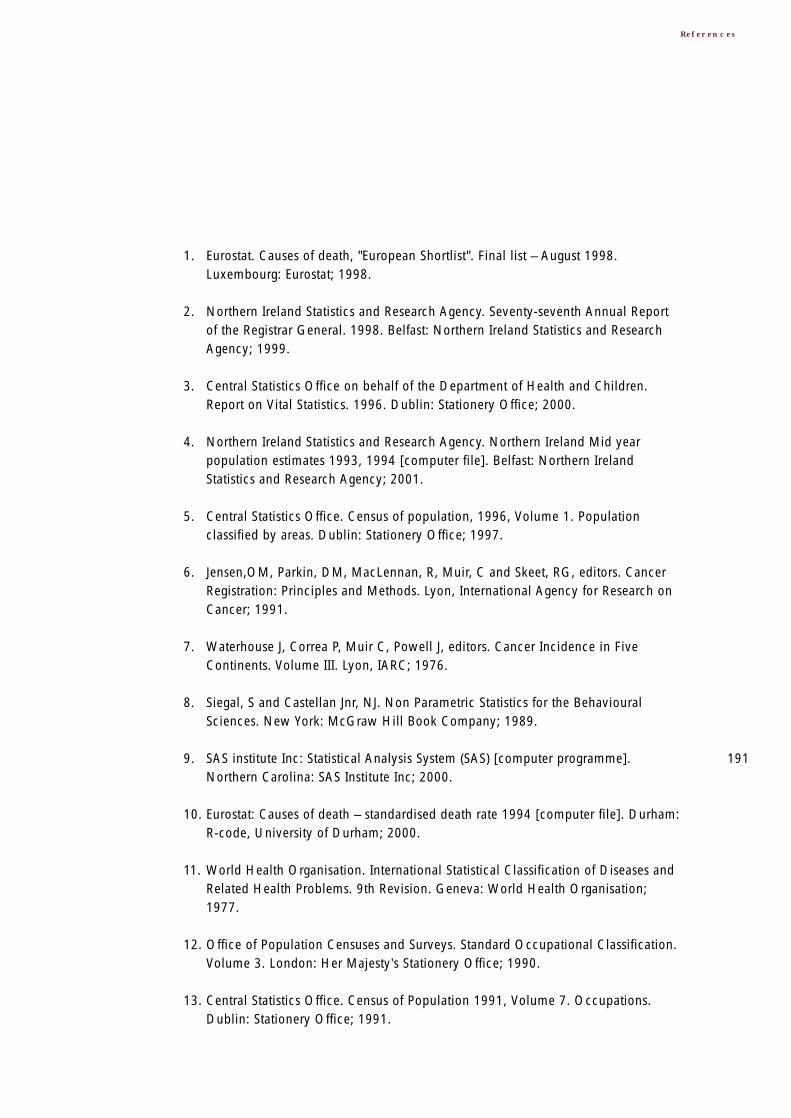
191
References
1. Eurostat. Causes of death, "European Shortlist". Final list – August 1998.Luxembourg: Eurostat; 1998.
2. Northern Ireland Statistics and Research Agency. Seventy-seventh Annual Reportof the Registrar General. 1998. Belfast: Northern Ireland Statistics and ResearchAgency; 1999.
3. Central Statistics Office on behalf of the Department of Health and Children.Report on Vital Statistics. 1996. Dublin: Stationery Office; 2000.
4. Northern Ireland Statistics and Research Agency. Northern Ireland Mid yearpopulation estimates 1993, 1994 [computer file]. Belfast: Northern IrelandStatistics and Research Agency; 2001.
5. Central Statistics Office. Census of population, 1996, Volume 1. Populationclassified by areas. Dublin: Stationery Office; 1997.
6. Jensen,OM, Parkin, DM, MacLennan, R, Muir, C and Skeet, RG, editors. CancerRegistration: Principles and Methods. Lyon, International Agency for Research onCancer; 1991.
7. Waterhouse J, Correa P, Muir C, Powell J, editors. Cancer Incidence in FiveContinents. Volume III. Lyon, IARC; 1976.
8. Siegal, S and Castellan Jnr, NJ. Non Parametric Statistics for the BehaviouralSciences. New York: McGraw Hill Book Company; 1989.
9. SAS institute Inc: Statistical Analysis System (SAS) [computer programme].Northern Carolina: SAS Institute Inc; 2000.
10. Eurostat: Causes of death – standardised death rate 1994 [computer file]. Durham:R-code, University of Durham; 2000.
11. World Health Organisation. International Statistical Classification of Diseases andRelated Health Problems. 9th Revision. Geneva: World Health Organisation;1977.
12. Office of Population Censuses and Surveys. Standard Occupational Classification.Volume 3. London: Her Majesty’s Stationery Office; 1990.
13. Central Statistics Office. Census of Population 1991, Volume 7. Occupations.Dublin: Stationery Office; 1991.

192
Inequalities in Mortality
14. Northern Ireland Statistics and Research Agency. Census Office Northern Ireland.1991 Economic Activity Report. Belfast: The Stationery Office; 1991.
15. Nolan, B. Socio-economic mortality differentials in Ireland. Economic and SocialReview. 1990; 21 (2): 193-208.
16. O’Shea, O. Male mortality differentials by socio-economic group in Ireland. SocialScience in Medicine. 1997; 45 (6): 803-809.

Appendices

Appendix 1
The European Shortlist of Cause of Death Categories
194
Inequalities in Mortality
NO DISEASE OR EXTERNAL CAUSE ICD-9 CODES
00 ALL CAUSES OF DEATH 001-E999
01 INFECTIOUS AND PARASITIC DISEASES 001-139
02 Tuberculosis 010-018,137
03 Meningococcal infection 036
04 AIDS (HIV-disease) 042-044
05 Viral hepatitis 070
06 NEOPLASMS 140-239
07 Malignant neoplasms 140-208
08 Malignant neoplasms of the lip, oral cavity, pharynx 140-149
09 Malignant neoplasms of the oesophagus 150
10 Malignant neoplasms of the stomach 151
11 Malignant neoplasms of the colon 153
12 Malignant neoplasms of the rectum and anus 154
13 Malignant neoplasms of the liver and the
intrahepatic bile ducts 155
14 Malignant neoplasms of the pancreas 157
15 Malignant neoplasms of the larynx and
trachea/bronchus/lung 161-162
16 Malignant neoplasms of the skin 172
17 Malignant neoplasms of the (female) breast 174
18 Malignant neoplasms of the cervix uteri 180
19 Malignant neoplasms of other parts of uterus 179,182
20 Malignant neoplasms of the ovary 183.0
21 Malignant neoplasms of the prostate 185
22 Malignant neoplasms of the kidney 189.0
23 Malignant neoplasms of the bladder 188
24 Malignant neoplasms of the
lymph/haematopoietic tissue 200-208
25 DISEASES OF THE BLOOD AND BLOOD-FORMING ORGANS,
IMMUNOLOGICAL DISORDERS 279-289
26 ENDOCRINE, NUTRITIONAL AND METABOLIC DISEASES 240-278
27 Diabetes mellitus 250
28 MENTAL AND BEHAVIOURAL DISORDERS 290-319
29 Alcohol abuse (including alcoholic psychosis) 291,303
30 Drug dependence, toxicomania 304-305
THE EUROPEAN
SHORTLIST OF
CAUSE OF DEATH
CATEGORIES

195
Appendix 1: The European Shortlist of Cause of Death Categories
NO DISEASE OR EXTERNAL CAUSE ICD-9 CODES
31 DISEASES OF THE NERVOUS SYSTEM AND THE SENSE ORGANS 320-389
32 Meningitis (other than meningococcal infection) 320-322
33 DISEASES OF THE CIRCULATORY SYSTEM 390-459
34 Ischaemic heart disease 410-414
35 Other heart disease 420-423,425-429
36 Cerebrovascular disease 430-438
37 DISEASES OF THE RESPIRATORY SYSTEM 460-519
38 Influenza 487
39 Pneumonia 480-486
40 Chronic lower respiratory disease 490-494,496
41 Asthma 493
42 DISEASES OF THE DIGESTIVE SYSTEM 520-579
43 Ulcer of stomach, duodenum and jejunum 531-534
44 Chronic liver disease 571.0-571.9
45 DISEASES OF THE SKIN AND SUBCUTANEOUS TISSUE 680-709
46 DISEASES OF THE MUSCULOSKELETAL
SYSTEM/CONNECTIVE TISSUE 710-739
47 Rheumatoid arthritis and osteoarthrosis 714-715
48 DISEASES OF THE GENITO-URINARY SYSTEM 580-629
49 Diseases of the kidney and ureter 580-594
50 COMPLICATIONS OF PREGNANCY, CHILDBIRTH
AND PUERPERIUM (FEMALE) 630-676
51 CERTAIN CONDITIONS ORIGINATING IN THE
PERINATAL PERIOD 760-779
52 CONGENITAL MALFORMATIONS AND CHROMOSOMAL
ABNORMALITIES 740-759
53 Congenital malformations of the nervous system 740-742
54 Congenital malformations of the circulatory system 745-747

196
Inequalities in Mortality
NO DISEASE OR EXTERNAL CAUSE ICD-9 CODES
55 SYMPTOMS, SIGNS, ABNORMAL FINDINGS, ILL-DEFINED CAUSES 780-799
56 Sudden infant death syndrome 798.0
57 Unknown and unspecified causes 798.1-9,799
58 EXTERNAL CAUSES OF INJURY AND POISONING E800-E999
59 Accidents E800-E929
60 Transport accidents E800-E848
61 Accidental falls E880-E888
62 Accidental poisoning E850-E869
63 Suicide and intentional self-harm E950-E959
64 Homicide/assault E960-E969
65 Events of undetermined intent E980-E989
THE EUROPEAN
SHORTLIST OF
CAUSE OF DEATH
CATEGORIES
Continued...

Appendix 2
Population Estimates (1994)
197
Appendix 2: Population Estimates (1994)
Estimated Population by sex, quinary age group and region were derived from theNorthern Ireland Statistics and Research Agency (4) and the Central StatisticsOffice in the Republic (5). (See Section 4.4).
It is estimated there were over one and a half million (1,643,000) persons living inNorthern Ireland and over three and half million (3,586,000) in the Republic of Irelandduring 1994, giving a total population of over five and a quarter million (5,229,000).
The island’s population was relatively young with just under half the (male andfemale) population aged under 30 years and less than ten percent aged 70 years orover.
While the two jurisdictions had similar percentages of people in the youngest agegroups, Northern Ireland had relatively more people in the oldest age groups. Thisaffirmed the need to consider directly standardised, rather than crude, mortalityrates. On the island, and in both jurisdictions, the male age profile was relativelyyounger than the female age profile.
In 1994, the four Health and Social Services Boards in Northern Ireland hadpopulations that ranged in size from just over a quarter of a million persons(Western HSSB) to nearly three quarters of a million persons (Eastern HSSB). In theRepublic, the North Western HB and Midlands HB had the smallest populations(around two hundred thousand persons) while the former Eastern HB had thelargest population (over one and a quarter million persons).

198
Inequalities in Mortality
BELFAST LGD Female 10,891 10,931 9,866 10,278 12,637 12,398 11,648
Male 11,277 11,271 10,363 10,105 12,362 11,627 10,246
ALL OF Female 24,231 24,544 23,395 22,752 24,889 26,649 26,193
EASTERN HSSB Male 25,177 25,636 24,721 23,506 26,358 25,905 24,460
NORTHERN Female 15,018 15,654 15,664 15,454 16,097 16,103 15,285
HSSB Male 15,817 16,692 16,341 16,241 17,063 16,132 15,196
SOUTHERN HSSB Female 12,034 12,591 12,861 11,316 10,729 11,290 10,946
Male 12,940 13,210 13,255 12,310 12,230 11,946 11,150
DERRY LGD Female 4,645 4,789 4,802 4,370 4100 4,119 3,986
Male 4742 5,171 4,974 4,686 4,452 3,990 3,684
ALL OF Female 11,342 12,179 12,579 11,383 10,241 10,083 9,849
WESTERN HSSB Male 11,911 13,073 12,959 12,131 11,700 10,520 9,781
NORTHERN Female 62,624 64,967 64,498 60,905 61,954 64,124 62,272
IRELAND Total Male 65,844 68,611 67,275 64,187 67,351 64,503 60,586
All Ireland Female 188,823 207,966 231,698 222,703 203,154 188,325 194,071
Total Male 199,845 219,111 245,073 233,388 216,252 187,602 186,389
All Ireland
NORTHERN IRELAND
REGION GENDER AGE (IN YEARS)
0-4 5-9 10-14 15-19 20-24 25-29 30-34
Populations
Estimates (1994)

199
Appendix 2: Population Estimates (1994)
179,330 165,814 155,157 126,126 111,832 106,148 103,155 96,009 162,382 2,642,689
176,354 166,635 157,043 127,887 110,441 100,305 88,894 75,533 95,560 2,586,308
9,462 7,728 7,698 7,268 7,352 7,692 7,688 7,424 13,793 154,751
8,677 7,546 7,226 6,720 6,400 6,352 5,839 4,998 6,168 137,172
22,469 19,728 20,053 17,590 16,226 16,482 16,293 15,369 28,345 345,204
21,513 19,370 19,211 16,717 14,825 13,763 12,752 10,951 13,370 318,231
13,816 12,752 12,732 11,220 9,863 9,334 8,622 7,878 13,986 209,474
13,679 12,767 12,328 10,943 9,442 8,309 7,431 6,058 7,587 202,023
9,568 8,818 8,661 7,417 6,745 6,335 5,950 5,431 9,281 149,969
9,805 8,883 8,492 7,231 6,417 5,603 4,999 4,039 5,190 147,696
3,361 2,982 2,631 22,79 1,962 1,853 1,687 1,489 2,408 51,459
3,129 2,868 2,614 2,169 1,931 1,612 1,347 993 1,200 49,557
8,778 8,014 7,413 6,200 5,400 5,099 4,,890 4,431 7,567 135,444
8,757 8,116 7,512 6,099 5,357 4,730 4,213 3,486 4,713 135,054
54,630 49,311 48,857 42,427 38,234 37,250 35,754 33,108 59,179 840,090
53,753 49,135 47,542 40,989 36,041 32,404 29,394 24,533 30,859 803,003
All Ireland
NORTHERN IRELAND
AGE (IN YEARS)
35-39 40-44 45-49 50-54 55-59 60-64 65-69 70-74 75 All Ages

200
Inequalities in Mortality
NORTH EASTERN Female 11,173 13,216 15,385 13,644 9,962 9,408 10,699
HB Male 11,820 13,814 16,363 14,682 11,533 9,750 10,389
DUBLIN CB Female 14,320 14,371 15,559 20,578 28,739 24,002 18,807
Male 14,935 15,051 16,536 19,811 25,639 22,651 17,877
ALL Female 44,813 48,279 54,827 57,636 61,164 52,867 52,341
EASTERN HB Male 47,876 50,710 58,774 58,939 59,253 49,489 47,774
WATERFORD CB Female 1,518 1,569 1,743 2,076 1,998 1,718 1,586
Male 1,555 1,655 1,814 2,109 1,942 1,664 1,523
ALL SOUTH Female 13,969 16,050 18,915 17,334 12,994 12,422 13,695
EASTERN HB Male 14,714 16,875 20,126 18,675 14,971 12,772 13,462
CORK Female 3,882 4,317 4,936 6,377 7,169 5,242 4,566
COUNTY CB Male 4,170 4,563 5,178 6,241 6,691 5,058 4,296
ALL Female 18,518 21,223 25,313 24,095 20,209 17,738 19,172
SOUTHERN HB Male 19,642 22,348 26,610 25,373 22,032 18,145 18,949
LIMERICK CB Female 1,759 1,853 2,132 2,657 2,687 2,122 1,808
Male 1,854 1,915 2,181 2,580 2,524 2,074 1,795
ALL MID- Female 10,950 12,610 15,252 14,525 11,482 9,716 10,778
WESTERN HB Male 11,614 13,351 16,029 15,236 12,973 10,107 10,714
MIDLANDS HB Female 7,481 8,736 10,436 9,276 6,527 6,158 6,976
Male 7,850 9,140 11,077 10,117 7,675 6,543 7,077
GALWAY CB Female 1,806 1,903 2,115 3,124 4,068 2,538 2,214
Male 1,927 2,051 2,232 2,827 3,327 2,234 1,931
ALL WESTERN HB Female 11,860 14,123 16,831 15,812 12,025 9,879 11,364
Male 12,570 14,980 17,904 16,434 12,970 10,158 10,943
NORTH Female 7,435 8,762 10,241 9,476 6,837 6,013 6,774
WESTERN HB Male 7,915 9,282 10,915 9,745 7,494 6,135 6,495
Republic of Female 126,199 142,999 167,200 161,798 141,200 124,201 131,799
Ireland Total Male 134,001 150,500 177,798 169,201 148,901 123,099 125,803
Republic of IRELAND
REGION GENDER AGE (IN YEARS)
0-4 5-9 10-14 15-19 20-24 25-29 30-34
Populations
Estimates (1994)
Continued...

201
Appendix 2: Population Estimates (1994)
10,544 9,854 9,009 6,822 5,842 5,533 5,547 5,320 8,371 150,329
10,674 10,397 9,577 7,445 6,121 5,664 5,142 4,558 5,539 153,468
15,369 13,715 12,803 12,082 11,981 11,920 11,642 10,087 17,126 253,100
14,636 12,967 12,107 11,131 10,643 9,946 8,803 6,704 7,932 227,368
46,857 42,954 39,027 30,833 26,910 24,180 22,437 19,799 32,202 657,126
43,822 40,604 37,554 29,653 24,915 21,601 17,571 13,857 16,031 618,423
1,368 1,239 1,147 1,035 934 846 759 656 1,102 21,294
1,298 1,245 1,160 1,040 924 783 612 467 570 20,361
13,095 12,193 11,272 9,062 8,010 7,636 7,449 7,060 11,075 192,231
13,278 12,863 12,014 9,721 8,429 7,834 7,028 5,951 7,227 195,940
3,951 3,629 3,452 3,290 3,155 2,884 2,695 2,395 3,983 65,923
3,828 3,536 3,334 3,153 2,944 2,626 2,197 1,622 1,854 61,291
18,385 17,345 15,996 12,743 11,405 10,744 10,604 10,002 16,753 270,245
18,546 17,939 16,855 13,459 11,680 10,710 9,439 8,215 10,696 270,638
1,591 1,526 1,450 1,320 1,228 1,174 1,116 942 1,510 26,874
1,562 1,495 1,384 1,252 1,199 1,076 893 673 726 25,182
10,531 10,227 9,455 7,377 6,298 5,942 6,000 5,618 9,129 155,890
10,863 10,599 9,968 7,873 6,749 6,263 5,531 4,750 6,060 158,680
6,857 6,417 5,714 4,524 4,046 3,979 4,009 3,762 5,654 10,552
7,079 6,711 6,096 4,826 4,308 4,151 3,795 3,426 4,104 103,975
1,950 1,697 1,470 1,210 967 870 828 726 1,302 28,790
1,735 1,539 1,351 1,170 931 771 631 521 717 25,896
11,666 10,965 9,844 7,663 6,841 6,852 7,127 7,079 12,495 172,426
11,621 11,603 1,0856 8,630 7,625 7,302 6,849 6,369 9,377 176,191
6,765 6,548 5,983 4,675 4,246 4,032 4,228 4,261 7,524 103,800
6,718 6,784 6,581 5,291 4,573 4,376 4,145 3,874 5,667 105,990
124,700 116,503 106,300 83,699 73,598 68,898 67,401 62,901 103,203 1,802,599
122,601 117,500 109,501 86,898 74,400 67,901 59,500 51,000 6,4701 1,783,305
Republic of IRELAND
AGE (IN YEARS)
35-39 40-44 45-49 50-54 55-59 60-64 65-69 70-74 75 ALL Ages
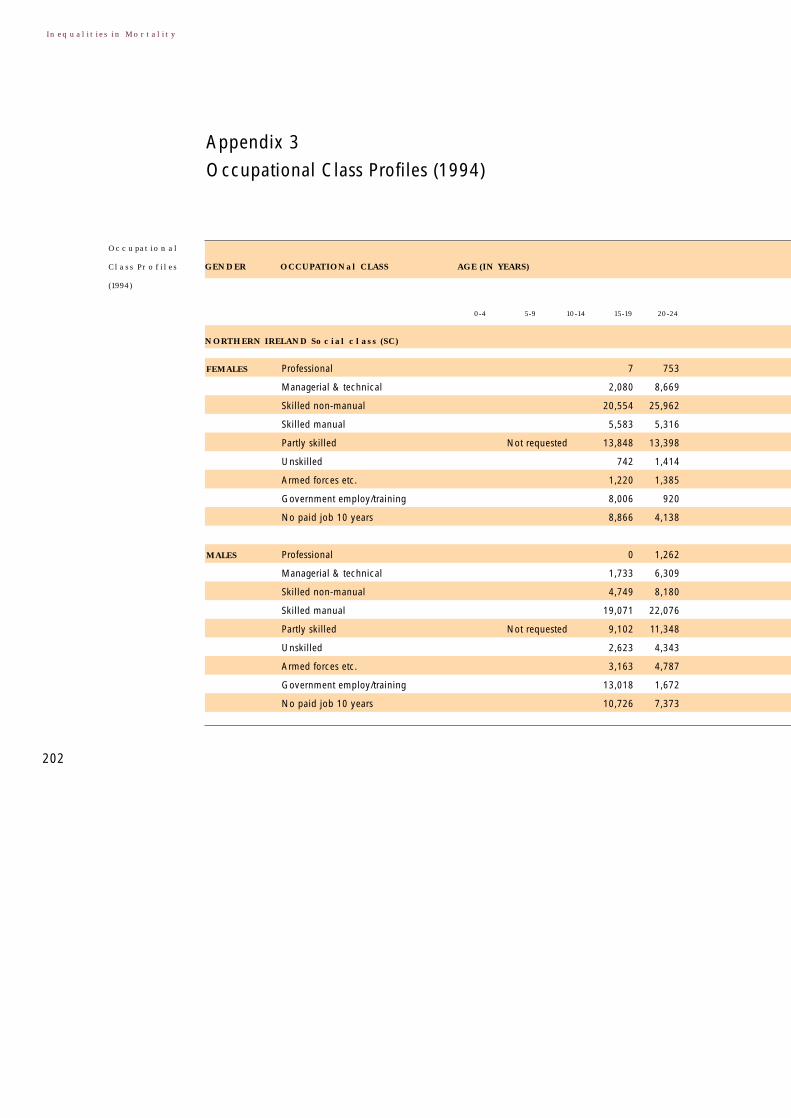
202
Inequalities in Mortality
Appendix 3
Occupational Class Profiles (1994)
FEMALES Professional 7 753
Managerial & technical 2,080 8,669
Skilled non-manual 20,554 25,962
Skilled manual 5,583 5,316
Partly skilled Not requested 13,848 13,398
Unskilled 742 1,414
Armed forces etc. 1,220 1,385
Government employ/training 8,006 920
No paid job 10 years 8,866 4,138
MALES Professional 0 1,262
Managerial & technical 1,733 6,309
Skilled non-manual 4,749 8,180
Skilled manual 19,071 22,076
Partly skilled Not requested 9,102 11,348
Unskilled 2,623 4,343
Armed forces etc. 3,163 4,787
Government employ/training 13,018 1,672
No paid job 10 years 10,726 7,373
NORTHERN IRELAND Social class (SC)
GENDER OCCUPATIONal CLASS AGE (IN YEARS)
0-4 5-9 10-14 15-19 20-24
Occupational
Class Profiles
(1994)

203
Appendix 3: Occupational Class Profiles (1994)
2,932 3,028 3,011 2,634 2,310 1,857 1,735 1,466 1,027 594 307 22,162
10,601 12,960 14,119 13,627 13,253 11,174 9,507 8,309 5,442 3,270 1,199 111,503
8,128 7,039 5,247 4,438 4,163 3,550 3,098 2,711 1,921 1,164 405 54,791
20,460 19,750 16,689 14,973 14,171 11,759 9,616 7,437 5,397 2,716 483 164,597
9,423 7,360 6,114 5,502 5,973 5,717 5,261 4,773 3,777 2,475 743 77,569
4,013 3,323 2,524 2,266 2,342 2,339 2,163 2,078 1,628 844 172 30,658
3,268 2,363 1,679 1,222 1,052 801 622 477 346 184 64 20,028
673 432 310 250 217 137 98 54 6 1 5 16,873
5,007 4,331 4,060 4,224 4,061 3,655 3,942 5,100 9,849 13,284 27,481 103,093
1,853 1,550 1,101 671 506 379 336 207 161 59 33 7,615
16,883 19,032 18,035 14,435 12,936 10,901 8,568 5,264 3,139 1,247 451 121,638
24,617 21,935 16,596 14,248 13,350 10,563 9,189 6,508 4,182 1,367 448 169,519
4,319 3,174 2,725 2,745 3,171 2,884 2,717 1,940 1,361 524 194 36,655
9,855 8,722 7,782 7,915 8,413 7,389 6,497 4,794 2,788 932 308 92,638
2,202 3,891 5,128 6,135 7,355 7,259 6,387 4,727 2,652 840 239 48,969
855 782 579 577 535 485 415 299 124 49 27 7,332
613 527 460 374 271 224 129 27 6 2 3 11,560
2,928 2,658 2,225 2,210 2,320 2,343 3,997 13,486 21,340 28,090 57,476 152,077
25-29 30-34 35-39 40-44 45-49 50-54 55-59 60-64 65-69 70-74 75 ALL Ages
AGE (YEARS)
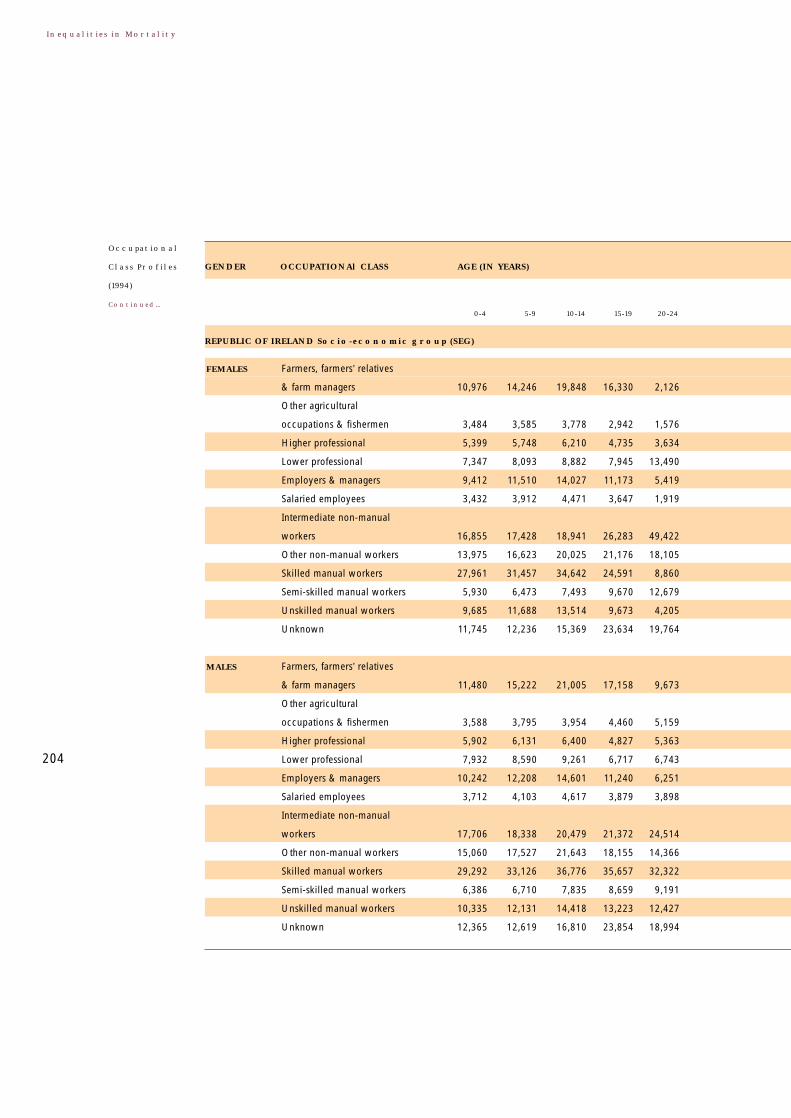
204
Inequalities in Mortality
FEMALES Farmers, farmers’ relatives
& farm managers 10,976 14,246 19,848 16,330 2,126
Other agricultural
occupations & fishermen 3,484 3,585 3,778 2,942 1,576
Higher professional 5,399 5,748 6,210 4,735 3,634
Lower professional 7,347 8,093 8,882 7,945 13,490
Employers & managers 9,412 11,510 14,027 11,173 5,419
Salaried employees 3,432 3,912 4,471 3,647 1,919
Intermediate non-manual
workers 16,855 17,428 18,941 26,283 49,422
Other non-manual workers 13,975 16,623 20,025 21,176 18,105
Skilled manual workers 27,961 31,457 34,642 24,591 8,860
Semi-skilled manual workers 5,930 6,473 7,493 9,670 12,679
Unskilled manual workers 9,685 11,688 13,514 9,673 4,205
Unknown 11,745 12,236 15,369 23,634 19,764
MALES Farmers, farmers’ relatives
& farm managers 11,480 15,222 21,005 17,158 9,673
Other agricultural
occupations & fishermen 3,588 3,795 3,954 4,460 5,159
Higher professional 5,902 6,131 6,400 4,827 5,363
Lower professional 7,932 8,590 9,261 6,717 6,743
Employers & managers 10,242 12,208 14,601 11,240 6,251
Salaried employees 3,712 4,103 4,617 3,879 3,898
Intermediate non-manual
workers 17,706 18,338 20,479 21,372 24,514
Other non-manual workers 15,060 17,527 21,643 18,155 14,366
Skilled manual workers 29,292 33,126 36,776 35,657 32,322
Semi-skilled manual workers 6,386 6,710 7,835 8,659 9,191
Unskilled manual workers 10,335 12,131 14,418 13,223 12,427
Unknown 12,365 12,619 16,810 23,854 18,994
REPUBLIC OF IRELAND Socio-economic group (SEG)
GENDER OCCUPATIONAl CLASS AGE (IN YEARS)
0-4 5-9 10-14 15-19 20-24
Occupational
Class Profiles
(1994)
Continued...

205
Appendix 3: Occupational Class Profiles (1994)
8,969 9,948 11,005 13,040 14,168 13,755 14,435 15,532 15,211 14,453 20,219 225,272
4,242 3,914 3,382 3,191 2,830 2,466 2,246 2,269 2,913 3,048 4,388 55,843
5,998 6,408 6,800 6,149 5,646 3,956 3,329 2,687 2,183 1,891 1,962 75,631
6,973 7,426 7,628 6,946 5,733 3,860 2,933 2,323 1,431 1,167 1,540 87,202
7,286 10,144 11,173 11,081 11,155 7,643 5,742 4,519 3,314 2,566 2,684 131,848
4,100 4,199 3,798 3,473 3,507 2,611 2,185 1,720 1,530 1,192 1,266 49,787
19,411 17,817 15,559 12,679 11,318 8,653 7,379 6,220 5,033 4,030 4,982 215,490
13,510 14,800 14,101 13,849 14,718 11,315 8,684 6,939 5,832 4,227 4,337 199,062
29,195 29,463 28,374 25,807 21,357 15,454 12,244 9,854 8,913 7,454 8,071 363,358
6,271 5,562 4,948 4,751 4,247 3,589 2,813 2,411 1,686 1,206 1,183 77,447
10,147 10,721 10,611 10,782 9,247 7,746 6,368 6,028 6,599 5,624 6,757 153,164
6,998 5,403 5,222 5,754 5,576 5,850 6,043 7,401 4,856 4,142 7,316 149,201
2,468 4,950 7,575 9,796 10,967 10,775 11,145 11,096 10,458 9,149 13,268 165,174
1,803 2,090 2,004 1,940 1,754 1,418 1,338 1,458 1,599 1,351 1,541 33,660
3,845 4,487 4,866 4,640 4,373 3,279 2,781 2,329 2,177 1,966 2,917 63,385
16,137 17,280 15,979 12,780 10,701 7,998 5,958 4,647 4,046 3,609 6,077 150,967
6,459 8,560 9,506 9,589 9,015 6,147 4,857 3,697 2,863 2,118 2,648 116,998
1,980 2,465 2,524 2,625 2,461 1,907 1,613 1,285 980 747 793 36,759
41,621 35,304 25,521 19,847 17,363 12,729 10,951 9,897 8,821 7,318 9,976 328,275
14,129 14,661 14,016 14,907 14,328 10,820 8,731 7,312 6,482 5,063 7,532 207,882
11,725 17,406 18,743 17,568 14,771 10,843 8,845 7,409 6,241 4,823 5,622 251,507
10,111 8,703 7,444 7,066 6,250 4,929 3,908 3,332 2,796 2,268 2,691 101,741
4,694 6,109 6,664 6,560 5,783 4,775 4,431 4,408 4,412 3,546 3,933 104,080
9,231 9,784 9,860 9,186 8,536 8,080 9,040 12,030 16,528 20,943 46,205 242,171
25-29 30-34 35-39 40-44 45-49 50-54 55-59 60-64 65-69 70-74 75 ALL Ages
AGE (YEARS)

206
Inequalities in Mortality
In Northern Ireland 17.2% of all working age males were in the ‘Unassigned’Social Class category, comprising 3.8% in the Armed forces, 3.3% in Governmentemployment and training, and 10.2% in ‘No paid job in the last ten years’category. In the Republic of Ireland, 11.1% were assigned to the ‘Unknown’Socio-economic Group category.
In Northern Ireland Social Class was grouped into three categories, in theRepublic four categories were used for Socio-economic Groups. These arose fromattempts to use analogous categorizations in the two jurisdictions although theirsizes were highly skewed.

Appendix 4
Who Standard European Population
207
Appendix 4: Who Standard European Population
0-4
5-9
10-14
15-19
20-24
25-29
30-34
35-39
40-44
45-49
50-54
55-59
60-64
65-69
70-74
75+
Total
8,000
7,000
7,000
7,000
7,000
7,000
7,000
7,000
7,000
7,000
7,000
6,000
5,000
4,000
3,000
4,000
100,000
Age
(in years)
European standard population

208
Inequalities in Mortality

