a report on the socio-economic health of the greater ... · pdf filea report on the...
TRANSCRIPT

04
The State of the CommunityA Report on the Socio-Economic Health
of the Greater Cincinnati Region
Novem
ber 2004
Together We’re Improving Lives & Community

Table of Contents
Introduction . . . . . . . . . . . . . . . . . . . . . . . . . . . . . . . . . . . . . . . . . . . . . . . . . . . . . . . . . . . . . 2
United Way Research Council . . . . . . . . . . . . . . . . . . . . . . . . . . . . . . . . . . . . . . . . . . . . . . 4
Executive Summary . . . . . . . . . . . . . . . . . . . . . . . . . . . . . . . . . . . . . . . . . . . . . . . . . . . . . . . 5
Co-Sponsors of the Report . . . . . . . . . . . . . . . . . . . . . . . . . . . . . . . . . . . . . . . . . . . . . . . 12
Criteria for Selecting Indicators . . . . . . . . . . . . . . . . . . . . . . . . . . . . . . . . . . . . . . . . . . . . 13
How to Read The State of the Community . . . . . . . . . . . . . . . . . . . . . . . . . . . . . . . . . . . . . 14
Population Indicator . . . . . . . . . . . . . . . . . . . . . . . . . . . . . . . . . . . . . . . . . . . . . . . . . . . . . 16
Children & Youth Indicators . . . . . . . . . . . . . . . . . . . . . . . . . . . . . . . . . . . . . . . . . . . . . . . 17
Educational Attainment Indicators . . . . . . . . . . . . . . . . . . . . . . . . . . . . . . . . . . . . . . . . . . 22
Health Indicators . . . . . . . . . . . . . . . . . . . . . . . . . . . . . . . . . . . . . . . . . . . . . . . . . . . . . . . . 25
Economy Indicators . . . . . . . . . . . . . . . . . . . . . . . . . . . . . . . . . . . . . . . . . . . . . . . . . . . . . . 32
Social Relations Indicators. . . . . . . . . . . . . . . . . . . . . . . . . . . . . . . . . . . . . . . . . . . . . . . . . 39
Appendices
Additional Regional Indicator Reports . . . . . . . . . . . . . . . . . . . . . . . . . . . . . . . . . . . . . 47
Data Sources . . . . . . . . . . . . . . . . . . . . . . . . . . . . . . . . . . . . . . . . . . . . . . . . . . . . . . . . . 49
The State of the Com
munity 2004/Page 1
04
T h e S t a t e o f t h e C o m m u n i t y R e p o r t
Cincinnati cover photo courtesy of the Greater Cincinnati Chamber of Commerce.
Pages 1-3 Cincinnati photo courtesy of the Greater Cincinnati Chamber of Commerce; Photo Credit: Robert Flischel

The State of the Com
munity 2004/Page 2
I n t r o d u c t i o n
Our region is at a critical juncture. Though we have significant assets and a future rich with possibilities, we also face significant social,
educational, economic, environmental, and governance issues. We must understand and confront these issues if we are to assure that
residents of all the communities making up our region enjoy the highest possible quality of life and guarantee that we are competitive vis-à-vis
other regions. Our ability to make steady progress toward solving our problems and building on our strengths will be enhanced if we have a
mechanism that identifies key indicators of the region’s social and economic health and tracks those indicators over many years. This will
help us understand whether the quality of life in the region is improving or not – and whether our strategic interventions are making a
difference.
For this reason, the United Way of Greater Cincinnati has joined with other regional organizations to develop this report, The State of the
Community. This is not a one-time,“snapshot” study of our region’s socio-economic health. Rather, it is an ongoing project through which we
will regularly measure change in the region’s well-being as measured by a set of valid and reliable indicators. This first report is designed to
be as accessible and useful as possible.
• It includes 26 high-quality, key indicators of Greater Cincinnati’s overall socio-economic health: economic, social, health, and environmental
measures. Where possible, the supporting data are extended to sub-regions, generally counties, that make up our 13-county region.
• Each indicator in the report has “stand-alone” value – and the set of indicators, taken together, represents the overall socio-economic
health of the region.
• The indicators have strong policy relevance for public and private sector groups concerned about and working on community improvement.
• Each indicator is accompanied by a brief narrative section explaining its relevance and what the supporting data mean for the region and,
where possible, its sub-regions.
• The report draws attention to five other key measures of our region’s socio-economic health that we need to have to understand how
we’re doing, but which still need to be developed (“placeholder” indicators). They appear throughout the report.
04

I n t r o d u c t i o nThe State of the C
omm
unity 2004/Page 3
04
Since the United Way is a volunteer-driven organization, we turned to a group of outstanding volunteers to design and construct this report.Some of the region’s most skillful social researchers came together as a Research Council, chaired by Dr. Al Tuchfarber of the University ofCincinnati, to get this job done. They contributed countless hours to the tasks of selecting indicators and finding and interpreting the supportingdata. Their names are at the end of this Introduction and we owe them strong words of thanks. They have readily accepted the challenge ofbringing out future editions of The State of the Community. We are especially indebted to Research Council representatives from the UCInstitute for Policy Research, The Health Foundation of Greater Cincinnati, Hamilton County Regional Planning Commission, and Ohio-Kentucky-Indiana Regional Council of Governments who did the bulk of the “data mining” to support the indicators in the report.We alsoexpress our great appreciation to Terry Grundy for his staff leadership and Carol Aquino for her marketing leadership in the creation of thisreport.
Other civic, philanthropic, health, and human service organizations in the region – along with some units of local government – have produced studies which were helpful to the Research Council as it sought relevant and powerful data. Several of those studies are listed inthe first appendix that follows the indicators. Where possible we have provided contact information for members of the group that producedthe study so readers interested in going deeper in a topic area can gain additional information.
The United Way intends to make the contents of this and future reports, along with any additional data such as demographic breakouts,available to the public through an easy-to-use Web site which will be maintained by The Community Research Collaborative, a partnership ofthe United Way of Greater Cincinnati and the University of Cincinnati through UC’s Institute for Policy Research. It is our hope that thisWeb-based version of The State of the Community will be available by the end of 2004 and will become an important resource for government,charitable sector and other groups involved in the work of community transformation.
Of course, a regional status study like The State of the Community is valuable only if private and public sector groups use it to decide where toput their community improvement efforts, separately and together. The co-sponsoring organizations listed after this Introduction have pledgedto do exactly that. United Way is pleased that they have chosen to join as co-sponsors of the report. We look forward to working with themand other groups in an ongoing effort to understand our changing region and to make the Greater Cincinnati region one of America’s premierareas in which to live, work, play, and raise a family.
L. Ross Love Robert C. ReifsnyderChair PresidentUnited Way of Greater Cincinnati Board of Directors United Way of Greater Cincinnati

The State of the Com
munity 2004/Page 4
U n i t e d W a y R e s e a r c h C o u n c i l
04
Dr. Al Tuchfarber, Research Council Chair
UC Department of Political Science
Mr. Eric P. Avner
Cincinnati Business Committee
Dr. Carole Beere
Northern Kentucky University
Mr. Craig Brammer
UC Institute for Health Policy and Health Services Research
Ms. Elizabeth Brown
U.S. Department of Housing & Urban Development
Mr. Mark Carrozza
UC Institute for Policy Research
Mr. Kevin Costello
Boone County Planning Commission
Dr. David Edelman
UC School of Planning
Ms. Janet Metzelaar
Beyond Data, Inc.
Mr. Ron Miller
Hamilton County Regional Planning
Dr. Julie Olberding
Citizens for Civic Renewal (previously) & Northern Kentucky University
Dr. Gary W. “Pete” Peterson
Miami University – Oxford
Dr. Robert Seufert
Miami University – Middletown
Mr. David Shuey
OKI Regional Council of Governments
Mr. Marshall Slagle
Northern Kentucky Area Planning Commission (retired)
Ms. Shiloh Turner
The Health Foundation of Greater Cincinnati
United Way Staff Leader: Mr. Terry Grundy
Director,Vibrant Neighborhoods & Communities
Vision Council
Mr. Dave Kroger, United Way Consultant
Organizational affiliation for identification purposes only

E x e c u t i v e S u m m a r y
The State of the Community. It’s a solemn title that no doubt unleashes a diversity of immediate impressions to an equally diverse community of
people and organizations that live and work in the Greater Cincinnati region. We can look at aspects of our community in many ways other than
the ones measured in this report, such things as:
• Our arts, museums, parks, entertainment, and sports.
• Our community’s generosity, as reflected in high per capita and gross dollar giving.
• Our rivers, our hills, our skyline.
• Our rich history.
These are some of the qualities and attractions that bring and keep us here, but they don’t tell us everything we need to know about our region.
To make an informed collective assessment, we must add to the picture key measures that help us understand our strengths and weaknesses. And
we must identify other indicators for which there aren’t yet sufficient measures but which are key to learning about additional areas of community
strength and improvement.
With all of this before us, we must challenge ourselves to improve on our weaknesses, and we must equally celebrate and build on our numerous
strengths.
What is the state of our Greater Cincinnati community? Thirty-one indicators (including five “placeholders” for which data aren’t available) met
the Research Council’s strict criteria for inclusion in the report. The evidence of 26 indicators for which there are trend lines and 21 for which
there are national comparisons is clear: we are generally strong and moving in the right direction.
Of these 21 national comparisons, the Greater Cincinnati region is at or above national averages in 14, or 67 percent. Our region is
particularly strong compared to national averages in the following areas:
The State of the Com
munity 2004/Page 5
04
1. Percent of College-Age Persons Attending College
2. Percent of Area Residents with a Bachelor’s Degree
or Higher
3. Per Capita Income (especially in Hamilton County)
4. Unemployment Rate — though the rate has been rising in our
region recently
5. Percent of Population in Poverty — though the gap is
narrowing compared to U.S.
6. Housing Affordability Ratio
7. Commuting Time
8. Murder Rate
9. Voting

The State of the Com
munity 2004/Page 6
E x e c u t i v e S u m m a r y
And our region’s trend is positive for 16 of the 26 (62 percent) indicators for which local data are available, with two additional indicators showing
no change. Reviewing the list of measurements provides an important overview:
04
Category & Indicator
Population:
• Percent Population Change
Children & Youth:
• Infant Mortality Rate
• Low Birth Weight
• Early Childhood School Readiness
• Grade-Level Assessment Tests
• High School Graduation Rates
Educational Attainment:
• Percent of College-Age Persons
Attending College
• Enrollment Count of Local Colleges
& Universities
• Years of Education for Persons 25+
How Our Region Comparesto National Averages
About average
Worse
At national average
Placeholder
Placeholder
Placeholder
Better
No national data
Slightly better
Our Region’s Trend
Somewhat positive
Negative
Negative
Placeholder
Placeholder
Placeholder
Positive
Positive
Positive

E x e c u t i v e S u m m a r yThe State of the C
omm
unity 2004/Page 7
04
Category & Indicator
Health:
• Health Status Index (SF-12)
• Underage Substance Abuse
• Percent of Adults Smoking
• Air Quality
• Obesity
• Percent Uninsured
• Lack of Access to Regular Health
Care Provider
Economy:
• Business Starts
• Percent of Job Gain or Loss
• Percent of Workforce 20-35 Years Old
• Per Capita Income
• Unemployment Rate
• Percent of Population in Poverty
• Housing Affordability Ratio
How Our Region Comparesto National Averages
Mental: Average Physical: Average
No national data
Worse
No national data
Worse
Incomplete national data
At national average
No national data
Worse
Worse
Better
Better
Better
Better
Our Region’s Trend
No change
Positive
Positive
Positive
Negative
Positive
Positive
Positive
Negative
Negative
Positive
Negative
Positive
Negative

Acknowledging Greater Cincinnati’s strong overall performance, we continue to have much work to do as a community. We are worse than the
national average on seven of 21 indicators (33 percent) for which there are comparable local and national data:
• Infant Mortality Rate
• Percent of Adults Smoking
• Obesity
• Percent of Job Gain or Loss
• Percent of Workforce 20-35 Years Old
• Residential Segregation
• Non-violent Crime
The State of the Com
munity 2004/Page 8
E x e c u t i v e S u m m a r y
04
Category & Indicator
Social Relations:
• Average Commuting Time
• Residential Segregation
• Race Relations
• Violent Crime
• Non-violent Crime
• Murder Rate
• Juvenile Crime
• Voting
How Our Region Comparesto National Averages
Better
Worse
Placeholder
Slightly better
Slightly worse
Better
Placeholder
Better
Our Region’s Trend
Negative
Positive
Placeholder
Slightly positive
Positive
Positive
Placeholder
No change

E x e c u t i v e S u m m a r y
The trend line is going in the wrong direction on eight of 26 indicators (31percent):
• Infant Mortality Rate
• Low Birth Weight
• Obesity
• Percent of Job Gain or Loss
• Percent of Workforce 20-35 Years Old
• Unemployment Rate
• Housing Affordability Ratio
• Average Commuting Time
And, like most metropolitan areas, our region’s urban core lags behind the region in many indicators for which City of Cincinnati data are available.
Recognizing that the report is a “market basket” of indicators which, taken together, measure the general socio-economic health of our region, how
can we make sense of the rich data within? How do we begin to draw conclusions from what seems like an overwhelming amount of information?
How do we, as a community, reach into the 31 indicators and begin to focus on a “critical few”? Can we choose a few measurements which, if
moved in the desired direction, will make substantive improvements in the life of our community?
While answering these questions and selecting the “critical few” are beyond the scope of this report, the United Way Research Council which
developed it drew some important conclusions from the data:
Population
While population growth can be a mixed blessing, a region that loses population or that gains at a lesser rate than “competitor” regions is a region
losing political influence and economic opportunities. While our region continues to grow, its rate of growth is at best average. This
means that we are not seen as a region of choice by many people when they seek a new home. This is particularly challenging when you consider
that our region is losing 20-35-year-old workers at a greater rate than the U.S. as a whole. Finally, our region’s core county and
city are losing population at a very disturbing rate, weakening the region’s health and competitiveness.
The State of the Com
munity 2004/Page 9
04

The State of the Com
munity 2004/Page 10
E x e c u t i v e S u m m a r y
Children and YouthIt is striking that we have no reliable, readily-available data to measure our children’s preparedness for school or their graduationfrom high school and no consistent state-to-state data about their achievement in school. We must develop these measurements quickly and track them over time to guarantee that our children reach their fullest potential.
Educational AttainmentOne of our region’s strengths is its relatively well-educated population. We need to continue to make access to higher education available to anyone who desires and is ready for it and help our colleges and universities attract students from all over the U.S. and the world. Atthe same time, we should be concerned about the continuously high percentage of adults with less than a full high school education.
HealthWe are at national norms on physical and mental health. We need to be concerned about the high percent of adults in ourregion who smoke and the high percent of people who are obese. These are significant threats to our population’s health and the increasein obesity can, without too much exaggeration, be called a health crisis.
EconomyThe regional economy continues to be healthy and to benefit from its diversity. While we don’t have comparable data for Indiana andKentucky, we can take satisfaction in the fact that the Cincinnati region accounts for a rising share of new business starts in Ohio.Growth in income, too, tracks and even slightly exceeds that of the nation as a whole. At issue is our lagging job growth, withboth the region and Hamilton County behind that of the nation, and the increase in our unemployment rate, though we are still doingbetter than the country as a whole. Our poverty rate is better than the national average; yet it, too, remains persistently high inour urban core and some rural counties.
Social RelationsIt is difficult to form a clear picture of social relations in our region and sub-regions from the data available. Given emphasis on crime in the news,it may be surprising that our crime rates are generally below national averages. Our average commuting time is better than thenational average, a positive factor in metropolitan livability. Clearly, we are a community troubled by race relations and it isstriking that there is no valid, reliable and commonly agreed upon measure of race relations in our community. We must develop ameasure quickly and track it over time to understand how we are doing in this very important area. The fact that our region’s housing patterns show us to be more racially segregated than the country as a whole is a concern. The dramatic growth in many of oursuburban counties with the concurrent loss of population in our urban core (and the concentration of poverty in the core) is adifficult question for our community and our many peer cities.
04

E x e c u t i v e S u m m a r yThe State of the C
omm
unity 2004/Page 11
04
The Opportunity AheadIt is important to note that a diverse group of leadership organizations has formed collaboratives and partnerships to confront many of the issues
highlighted by the indicators in this report. No single organization can “move the needle” on an indicator; it requires the collective will of many
organizations working together. Just as clearly, no single organization can be held accountable for the entire set of indicators.
Within this context, United Way is committed to collaborating with others to address selected issues highlighted by indicators affecting Children
and Youth, Health, the Economy, and Social Relations. Strategic partnerships like Success By 6®, Success In Schools and the Alliance for Building
Communities will work to improve key measurements over time. Other organizations have taken and will take leadership roles in driving progress
on other issues.
The State of the Community has little value in its own right. It acquires value only when leaders from the business community, government, education,
health care, and many other community organizations come together to interpret its meaning and use it to develop and continually refine a
community agenda for improvement. It is hoped that The State of the Community will serve as the stimulus for just such a coming together.

The State of the Com
munity 2004/Page 12
C o - S p o n s o r s o f T h e S t a t e o f t h e C o m m u n i t y R e p o r t
Regional Partners
04
• Cincinnati Business Committee
• Greater Cincinnati Chamber of Commerce
• The Greater Cincinnati Foundation
• Northern Kentucky University
• The Ohio-Kentucky-Indiana Regional Council of Governments
• Sustainable Cincinnati
• University of Cincinnati
• Xavier University
Community Co-Sponsors
• Chamber of Commerce of Northern Kentucky
• Children, Inc.
• Cincinnati-Hamilton County Community Action Agency
• Cincinnati Health Department
• Cincinnati Public Schools
• The Cincinnatus Association
• Citizens for Civic Renewal
• City of Cincinnati
• Clermont County Mental Health & Recovery Board
• Council on Aging of Southwestern Ohio
• Downtown Cincinnati Inc.
• Fine Arts Fund
• Forward Quest
• Greater Cincinnati Health Council
• Greater Cincinnati Northern Kentucky African American Chamber
of Commerce
• Hamilton County Board of County Commissioners
• Hamilton County Board of MR/DD
• The Health Foundation of Greater Cincinnati
• Health Improvement Collaborative of Greater Cincinnati
• Hispanic Chamber of Commerce of Greater Cincinnati
• Northern Kentucky Independent District Health Department
• Urban Appalachian Council
• Urban League of Greater Cincinnati

C r i t e r i a f o r S e l e c t i n g I n d i c a t o r s
The United Way Research Council used rigorous criteria for selecting statistical indicators to be used in The State of the Community. As far as
possible, each indicator must:
• Have local policy relevance
• Be valid
• Be reliable
• Be easily understood
• Be frequently updated
• Be likely to be produced over the next decade
• Be available/consistent across the region and over time
• Be inexpensive to gather and report
• Come from a reliable source
• Have a clear interpretation
• Have a comparable national benchmark
As mentioned in the Introduction, the report includes a limited number of “placeholder” indicators. These are indicators of regional and
community health and well-being which must be included in future editions of The State of the Community but for which data are not available
currently or for which there is no commonly agreed upon methodology at this time.
The State of the Com
munity 2004/Page 13
04

The State of the Com
munity 2004/Page 14
H o w t o R e a d T h e S t a t e o f t h e C o m m u n i t y
The State of the Community will read much more easily if you keep the following in mind:
• Each of the indicators that make up the report is reported on its own page. On the left side, below the title bar, is a graph depicting the regional
trend in the data (often compared to national trends); on the right side is a table containing the data (generally sub-geographic breakouts). Below
the graph and table is commentary which includes a definition of the indicator (labeled “What it is”), a brief statement of what the indicator
contributes to the overall report (labeled “Why it matters”) and brief comments interpreting the significance of the indicator and its data for
the community (labeled “What it tells us”).
• In the upper right-hand corner of each indicator page is a pair of arrows. The left-hand arrow indicates the direction that most members of the
community would agree is the direction in which the indicator “should” be moving. This is emphasized by the green color of the arrow. The
right-hand arrow indicates the direction and degree (slightly, moderately or strongly) in which the indicator has been moving overall, during the
years shown on the graph. The color of the arrow reinforces whether the indicator is moving as it should (green) or needs attention (red). For
example:
This pair of arrows shows that the indicator should be moving downward and that its trend is, in fact, moving slightly downward.
This pair, on the other hand, shows that, while the desired direction for the indicator to move is down, it actually has a moderately upward trend,
contrary to desire.
The movement of some indicators is characterized by an orange circle labeled “no change.” This indicates either that the indicator has shown no
real change over time or that the change is considered statistically insignificant by professional researchers.
04
desirable actual
nochange
desirable actual
desirable actual

H o w t o R e a d T h e S t a t e o f t h e C o m m u n i t y
• Certain items relating to health refer to a benchmark called the ”Healthy People 2010 Goal.” These benchmarks were established by the
U.S. Department of Health and Human Services. Additional information is available at www.healthypeople.gov.
• The initials CMSA and PMSA are used on several of the charts. CMSA stands for Consolidated Metropolitan Statistical Area and is a term used by
the U.S. Census Bureau and other government agencies to mean a large, multi-county metropolitan area made up of a cluster of PMSAs (Primary
Metropolitan Statistical Areas). The Cincinnati-Hamilton, Ohio-Kentucky-Indiana CMSA is made up of two PMSAs:
• The Cincinnati, OH-KY-IN PMSA made up of Brown, Clermont, Hamilton, and Warren Counties in Ohio; Boone, Campbell, Gallatin, Grant,
Kenton, and Pendleton Counties in Kentucky, and Dearborn and Ohio Counties in Indiana.
• The Hamilton-Middletown, OH PMSA made up of Butler County, Ohio.
• Some indicators are labeled as “placeholder” indicators, meaning that, while those measures are considered important to the community, reliable
and/or valid data measurements are not yet available for them. For placeholder indicators, the chart, data table, definition, and interpretation are
replaced with a statement, often prepared by a community expert in the area, outlining what the indicator means to the community and why it is
important to develop a meaningful source of data for it.
• For each indicator presenting representative data, the source of the data is listed at the bottom of the page.
The State of the Com
munity 2004/Page 15
04

P o p u l a t i o n : P o p u l a t i o n C h a n g e desirable actual
The State of the Com
munity 2004/Page 16
Regional Performance Local Differences
What it is: This indicator shows the population for a given year divided by the population for the immediately preceding year.
Why it matters: Population change reflects the economic and social capital growth and health of the community. Regions with growing
populations often can attract more federal and state revenues and often have stronger labor and retail markets and greater local tax revenues.
What it tells us: The Cincinnati region is growing slightly slower than the national average. Regional growth is healthy, but uneven. The
City of Cincinnati is experiencing dramatic population loss (approximately 3,000 citizens per year). Hamilton County is also losing population
because of losses in Cincinnati and older Hamilton County suburbs, and Boone County and Warren County are experiencing explosive
growth. The upcoming Web-based version of The State of the Community will show that the region’s Hispanic/Latino population is growing
rapidly, but from a very, small base (<2%).
04
Data Source: Population Estimates Program, Population Division, U.S. Census Bureau2000 data reflects variation for actual vs. estimated figures.
1995 1996 1997 1998 1999 2000 2001 2002United States 0.9 1.0 0.9 0.9 3.5 1.0 1.0
Cincinnati CMSA 0.6 0.8 0.7 0.6 -1.5 0.7 0.6
Brown County, OH 1.7 1.9 1.7 1.9 2.4 0.6 1.5Butler County, OH 1.3 1.1 1.0 0.8 0.1 1.0 1.0Clermont County, OH 1.7 1.9 1.7 1.7 -0.1 1.2 1.4Hamilton County, OH -0.6 -0.5 -0.5 -0.8 0.4 -0.5 -0.8Warren County, OH 3.0 3.8 4.3 5.0 4.9 4.2 4.6Boone County, KY 4.1 4.5 4.8 4.5 4.4 3.5 3.6Campbell County, KY 0.1 0.5 -0.2 -0.1 1.7 0.0 0.0Gallatin County, KY 4.3 5.6 5.8 3.6 5.7 1.0 -1.2Grant County, KY 3.4 2.4 2.6 2.4 8.4 2.8 1.9Kenton County, KY 0.0 0.7 0.4 0.3 3.0 0.2 0.1Pendleton County, KY 2.3 0.9 -0.8 1.6 3.9 1.0 1.2Dearborn County, IN 2.1 2.5 1.7 1.8 -3.5 1.1 1.0Ohio County, IN 0.3 -0.2 0.2 0.2 3.4 0.9 1.9
City of Cincinnati
-5.0
-4.0
-3.0
-2.0
-1.0
0.0
1.0
2.0
3.0
4.0
5.0
1996
1997
1998
1998
1999
2000
2001
2002
Per
cent
Cha
nge
Cincinnati CMSA
Hamilton County
United States

What it is: This indicator shows the number of deaths in a year of children less than one year of age, per 1,000 live births. Indiana counties are
not included.
Why it matters: Infant mortality is a crucial measure of community physical and socio-economic health. It correlates with the performance of
the region’s health care intervention system and social support system for childbearing women.
What it tells us: Our region is performing slightly worse than the national average, with Hamilton County doing worse than the regional average.
We are far from the Healthy People 2010 goal.The highest infant mortality rates are concentrated in our core urban and some rural areas, which
have higher concentrations of minorities and/or poor people. There is wide variation among the smaller population counties, while the more
affluent suburban counties have low rates. Data are not available for Indiana counties. The upcoming Web-based version of The State of the
Community will explore infant mortality rates among minorities and poor people, who appear to be at greater risk.
The State of the Com
munity 2004/Page 17
04
Data Source: Center for Disease Control and Prevention, National Center for Health Statistics Healthy People 2010 Goal is from U.S. Dept. of Health & Human Services report that targets multiple national health goals in several areas.
Regional Performance Local Differences
desirable actual C h i l d r e n & Y o u t h : I n f a n t M o r t a l i t y
1995 1996 1997 1998 1999 2000 2001 2002United States 7.2 7.2 7.0 6.9 6.8
Cincinnati CMSA 7.5 8.8 9.2 7.0 8.0
Brown County, OH 5.8 12.8 10.1 11.9 9.2Butler County, OH 7.8 8.7 10.1 6.7 8.5Clermont County, OH 7.2 9.6 8.3 6.1 4.1Hamilton County, OH 9.4 9.9 10.8 9.9 10.5Warren County, OH 4.4 4.0 6.4 3.6 4.4Boone County, KY 3.4 6.2 8.1 2.1 2.9Campbell County, KY 5.3 6.1 6.0 4.0 5.4Gallatin County, KY 0.0 17.4 0.0 8.8 0.0Grant County, KY 2.8 11.8 2.5 0.0 10.9Kenton County, KY 4.4 6.5 7.2 2.9 6.2Pendleton County, KY 5.7 20.6 0.0 0.0 9.1Dearborn County, INOhio County, IN
City of Cincinnati
5.0
7.0
9.0
11.0
13.0
15.0
1997
1998
1999
2000
2001
Dea
ths
per
1,00
0 L
ive
Bir
ths
Cincinnati CMSA
Hamilton County
United States
Healthy People 2010 Goal

The State of the Com
munity 2004/Page 18
Regional Performance Local Differences
What it is: This indicator shows the percentage of children weighing less than 2,500 grams (88 ounces) at birth in a population.
Why it matters: Low birth weight is an important overall health measure and is a strong predictor of an infant’s chances to survive and
thrive. High rates correlate with high health care costs.
What it tells us: The region’s low birth weight rate closely tracks the national average and shows slight improvement since 1999, though
the region still has not returned to its historic lows. Hamilton County’s rate is higher than the region’s and the nation’s, though it is con-
verging with them. Experience shows that disadvantaged populations experience higher rates and Hamilton and Gallatin counties, with the
highest concentrations of disadvantaged people, have the highest rates. Most researchers agree that smoking, drug abuse and alcohol abuse
are among causes. Fertility treatments causing multiple births are also cited as a cause by some experts, though research is not conclusive.
04
Data Source: Center for Disease Control and Prevention, National Center for Health Statistics Does not include Indiana counties in regional rate.
C h i l d r e n & Y o u t h : L o w B i r t h W e i g h t desirable actual
1995 1996 1997 1998 1999 2000 2001 2002United States 7.5 7.6 7.6 7.6 7.7 7.8
Cincinnati CMSA 7.5 7.9 8.2 7.7 7.7
Brown County, OH 5.6 8.4 6.8 6.6 6.5 6.0Butler County, OH 6.7 7.3 7.2 8.2 6.8 7.2Clermont County, OH 7.3 6.7 6.7 7.0 6.1 6.9Hamilton County, OH 8.6 8.8 9.4 8.5 9.0 8.2Warren County, OH 6.7 5.9 7.3 6.1 7.0 6.0Boone County, KY 5.8 6.5 6.9 5.7 5.9Campbell County, KY 6.1 7.5 6.8 7.6 6.3Gallatin County, KY 8.8 15.7 7.8 7.9 9.5Grant County, KY 7.4 6.5 6.9 7.7 7.4Kenton County, KY 6.2 8.0 8.1 6.6 7.3Pendleton County, KY 7.5 7.7 8.3 8.4 7.7Dearborn County, INOhio County, IN
City of Cincinnati
3.0
5.0
7.0
9.0
11.0
13.0
15.0
1997
1998
1999
2000
2001
Per
cent
2002
Cincinnati CMSA
Hamilton County
United States

Why it matters: Countless studies and brain scan research indicate the importance of cognitive, physical, emotional, and social development in the first years of life.
Federal No Child Left Behind legislation requires measuring students’ progress in core academic content areas — so states and local communities need to define and
measure children’s readiness for kindergarten.
The three states of our region take different approaches to measuring school readiness.
We need a common measure that includes cognitive and general knowledge, language skills, learning approaches, social and emotional development, and physicalhealth.
Dr. Terry B. Joyner, Cincinnati Public Schools
The State of the Com
munity 2004/Page 19
04
Regional Performance Local Differences
desirable C h i l d r e n & Y o u t h : E a r l y C h i l d S c h o o l R e a d i n e s s ( P l a c e h o l d e r )
1995 1996 1997 1998 1999 2000 2001 2002United States
Cincinnati CMSA
Brown County, OHButler County, OHClermont County, OHHamilton County, OHWarren County, OHBoone County, KYCampbell County, KYGallatin County, KYGrant County, KYKenton County, KYPendleton County, KYDearborn County, INOhio County, IN
City of Cincinnati
No Regional Data Available No Small-Area Data Available

The State of the Com
munity 2004/Page 20
Regional Performance Local Differences
Why it matters: It is essential to track the development of children in core academic areas at key points during their elementary andsecondary school years – to understand their needs and thus ensure continuous growth and development and to arm stakeholders withthe information they need to evaluate the effectiveness of schools.
Ohio, Kentucky and Indiana have required grade-level assessment tests for years. However, federal No Child Left Behind legislation requiresstate and local administrators to reevaluate schools’ measurement and assessment procedures – generating changes in academic standardsand indicators at the state and district levels.
Experts are working to better align grade-level proficiency tests with revised academic content standards established by the state departments of education. Future editions of The State of the Community must feature the results of the new grade-level assessment procedures and establish trend lines based on the data reported.
Ernescia Richardson, Ed.D., Success In Schools
04
C h i l d r e n & Y o u t h : G r a d e L e v e l A s s e s s m e n t T e s t s ( P l a c e h o l d e r )
1995 1996 1997 1998 1999 2000 2001 2002United States
Cincinnati CMSA
Brown County, OHButler County, OHClermont County, OHHamilton County, OHWarren County, OHBoone County, KYCampbell County, KYGallatin County, KYGrant County, KYKenton County, KYPendleton County, KYDearborn County, INOhio County, IN
City of Cincinnati
No Regional Data Available No Small-Area Data Available
desirable

Why it matters: High school graduation rates are a key indicator of educational delivery and attainment and must be included in the next edition of
The State of the Community.
Data in many U.S. communities, including ours, don’t meet strict criteria for validity and reliability.
School districts use different methods for calculating high school graduation rates, with the result that there is no standard methodology or consistency.
Many students move between high schools within or between districts, making accurate calculation difficult and expensive.
United Way Research Council
The State of the Com
munity 2004/Page 21
04
Regional Performance Local Differences
C h i l d r e n & Y o u t h : H i g h S c h o o l G r a d u a t i o n ( P l a c e h o l d e r )
No Regional Data Available
1995 1996 1997 1998 1999 2000 2001 2002United States
Cincinnati CMSA
Brown County, OHButler County, OHClermont County, OHHamilton County, OHWarren County, OHBoone County, KYCampbell County, KYGallatin County, KYGrant County, KYKenton County, KYPendleton County, KYDearborn County, INOhio County, IN
City of Cincinnati
No Small-Area Data Available
desirable

The State of the Com
munity 2004/Page 22
Regional Performance Local Differences
What it is: This indicator shows the number of persons of college age divided by the number actually attending college.
Why it matters: The rate of residents seeking to improve their educational status is a crucial measure of socio-economic progress and of work-
force quality. A region with high educational attainment (especially postsecondary) is more able to retain and attract high-value jobs and is thus
more competitive.
What it tells us: The Cincinnati region is doing well and fairly consistently outperforms the national average (though we do not have data for
Indiana counties). Greater Cincinnati’s rate appears to be increasing and accelerating. Sub-geographic (county) data are not available.
04
Data Source: U.S. Bureau of the Census: Current Population Survey *Does not include Indiana counties in regional rate.
E d u c a t i o n a l A t t a i n m e n t : C o l l e g e - A g e P e r s o n s A t t e n d i n g C o l l e g e desirable actual
1995 1996 1997 1998 1999 2000 2001 2002United States 23.6 25.2 25.1 25.5 25.6 25.2 26.0 26.3
Cincinnati CMSA* 21.7 22.4 28.3 26.5 23.6 26.0 29.1 36.0
0
10
20
30
40
50
60
1996
1997
1998
1999
2000
2001
2002
Per
cent
1995
Cincinnati CMSA
United States

What it is: This indicator depicts the number of students attending Cincinnati State Technical & Community College, College of Mount St. Joseph,
Miami University – Oxford, Miami University – Hamilton, Northern Kentucky University, Southern State Community College, Thomas More College,
University of Cincinnati, and Xavier University. Hebrew Union College did not provide data.
Why it matters: College enrollment is a crucial measure of workforce quality and quantity. It also serves as a measure of local education and
workforce development infrastructure.
What it tells us: Since 1995, the Cincinnati region has witnessed steady growth in college enrollments, reflecting the attractiveness of the area’s
higher educational infrastructure to local, national and global students. Based on year-to-year data provided to the Research Council, it appears that
Miami University and Cincinnati State are leading the progress. Local (county) data are not relevant for this indicator.
The State of the Com
munity 2004/Page 23
04
Data Source: Data provided by CSTCC, MSJ, MUO, MUH, NKU, SSCC,TMC, UC, and XU
Regional Performance Local Differences
E d u c a t i o n a l A t t a i n m e n t : E n r o l l m e n t C o u n t o f L o c a l C o l l e g e s a n d U n i v e r s i t i e sdesirable actual
1995 1996 1997 1998 1999 2000 2001 2002United States
Cincinnati CMSA
Brown County, OHButler County, OHClermont County, OHHamilton County, OHWarren County, OHBoone County, KYCampbell County, KYGallatin County, KYGrant County, KYKenton County, KYPendleton County, KYDearborn County, INOhio County, IN
City of Cincinnati
No Small-Area Data Available
77,000
82,000
87,000
92,000
97,000
1996
1994
1992
1998
1990
2001
2002
Enr
ollm
ent
Cincinnati Area

The State of the Com
munity 2004/Page 24
Regional Performance Local Differences
What it is: This indicator shows the highest level of education attained by individuals age 25 and over, expressed as a percentage of that age
group.
Why it matters: Years of education for those 25 and over is considered by the Research Council to be the best measure of a population’s
educational attainment. It is a crucial measure of socio-economic progress because it correlates strongly with income and job status. It is a good
measure of workforce quality as well.
What it tells us: Greater Cincinnati is improving, especially with respect to those achieving a bachelor’s degree or higher, although the progress
is slow. The recent drop in percent of individuals stopping their education at high school graduation is expected when the levels of those stopping
at 9th grade or with a BA or above are growing. Local (county) data are not available.
04
Data Source: U.S. Bureau of the Census: Current Population Survey Cincinnati CMSA data only
E d u c a t i o n a l A t t a i n m e n t : Y e a r s o f E d u c a t i o n f o r P e r s o n s A g e 2 5 +
1995 1996 1997 1998 1999 2000 2001 2002 2003<= 9th GradeUnited States 10.8 10.5 10.2 9.7 9.2 9.1 8.8 9.0 9.9Cincinnati CMSA 8.4 8.8 8.1 7.0 6.0 5.1 5.1 8.5 9.8
High School GradUnited States 33.9 33.6 33.8 33.8 33.3 33.1 32.6 32.1 30.4Cincinnati CMSA 35.0 33.8 36.1 39.1 35.1 38.0 40.6 33.6 31.9
Bachelor's +United States 23.0 23.6 23.9 24.4 25.2 25.6 26.1 26.7 23.7Cincinnati CMSA 25.1 29.6 26.9 23.9 30.3 28.3 26.8 30.5 25.9
desirable actual
0
10
20
30
40
50
60
1995
1996
1997
1998
1999
2000
2001
2002
Per
cent
2003
<=9th Grade
HS Grad
BA+

What it is: The SF-12 is a 12-question index, developed by Medical Outcomes Trust, which is included in general population surveys like the local
Community Health Status Survey. It is made up of questions that measure physical and mental health status.
Why it matters: The composite score, based on a weighting formula, permits comparison to national physical and mental health norms.
What it tells us: Greater Cincinnati is close to the national norm in both physical and mental health. Variations in samples are more likely to
yield more interesting comparisons than those provided by geographic breakout. There is little variation by county or sub-region.
The State of the Com
munity 2004/Page 25
04
Data Source(s): 1999 & 2002 Greater Cincinnati Community Health Status Survey
Regional Performance Local Differences
H e a l t h : H e a l t h S t a t u s I n d e x S F - 1 2desirable actual
nochange
Physical MentalScore Score
1999 2002 1999 2002United States 50.0 50.0 50.0 50.0
Cincinnati CMSA 48.8 49.6 51.0 52.0
Hamilton County Suburbs 50.1 50.4 52.0 51.8Butler/Clinton/Warren 50.3 51.1 52.2 52.7Adams/Brown/ Clermont/Highland 46.1 48.5 51.0 53.4Boone/Campbell/ Grant/Kenton 46.8 48.8 50.0 50.9Bracken/Gallatin/ Pendleton 45.9 47.4 52.1 50.4Dearborn/Franklin/ Ohio/ Ripley/ 48.4 49.4 50.8 51.1SwitzerlandCity of Cincinnati 48.8 49.0 50.0 51.745
46
47
48
49
50
51
52
53
54
55
2002
1999
No
rmed
Co
mpo
site
Sco
re
National Norm
Cincinnati CMSA - Physical
Cincinnati CMSA - Mental

The State of the Com
munity 2004/Page 26
Regional Performance Local Differences
What it is: This indicator shows the percent of those under 18 years of age reporting monthly or more frequent use of cigarettes, beer,
wine coolers, or marijuana.
Why it matters: Underage substance abuse correlates strongly with poor school performance and delayed personal development.
What it tells us: The Cincinnati region shows a desirable decline in underage substance abuse from 2000 to 2002. Local (county) data are
not available.
04
Data Source: Coalition for a Drug-Free Greater Cincinnati: Personal Drug Use Survey, 2000 & 2002
H e a l t h : U n d e r a g e S u b s t a n c e A b u s e
1995 1996 1997 1998 1999 2000 2001 2002United States
Cincinnati CMSA
Brown County, OHButler County, OHClermont County, OHHamilton County, OHWarren County, OHBoone County, KYCampbell County, KYGallatin County, KYGrant County, KYKenton County, KYPendleton County, KYDearborn County, INOhio County, IN
City of Cincinnati
No Small-Area Data Available
10
15
20
25
30
35
2000
2002
Per
cent
desirable actual
Cigarettes
Beer
Wine Coolers
Marijuana

What it is: This indicator shows the number of adults who report smoking as a percent of the total survey sample.
Why it matters: Smoking is a proven cause of cancer and other illnesses, and second-hand smoke is considered a major public health threat.
What it tells us: Greater Cincinnati’s rates are improving somewhat, but the region still rates above the national average and well above the
Healthy People 2010 goal. Health professionals believe that this is partly attributable to Cincinnati’s location in the “tobacco growing belt.” Rates
for the City of Cincinnati and local rural areas are higher than those for the suburbs.
The State of the Com
munity 2004/Page 27
04
Data Source(s): 1999 & 2002 Greater Cincinnati Community Health Status Survey, 1999 & 2002 Behavior Risk Factor Surveillance SystemHealthy People 2010 Goal is from U.S. Dept. of Health & Human Services report that targets multiple national health goals in several areas.
Regional Performance Local Differences
desirable actual H e a l t h : A d u l t s S m o k i n g
1995 1996 1997 1998 1999 2000 2001 2002United States 23.2 23.0
Cincinnati CMSA 34.5 32.0
Hamilton County Suburbs 27.5 24.9Butler/Clinton/Warren 34.8 34.2Adams/Brown/ Clermont/Highland 47.9 35.7
Boone/Campbell/ Grant/Kenton 29.6 35.2
Bracken/Gallatin/Pendleton 44.7 36.7
Dearborn/Franklin/Ohio/ Ripley/ Switzerland 31.2 34.7
City of Cincinnati 38.8 32.3
0.0
5.0
10.0
15.0
20.0
25.0
30.0
35.0
40.0
2002
Per
cent
1999
Cincinnati CMSA
United States
Healthy People 2010 Goal

The State of the Com
munity 2004/Page 28
Regional Performance Local Differences
What it is: This indicator reports the number of days measuring “good” on the Environmental Protection Agency’s Air Quality Index, as a
percentage of total days monitored in the given year.
Why it matters: Air quality has direct public health effects, both short-term and longer-term. Individuals with asthma, emphysema and
other respiratory ailments are particularly sensitive to air quality. Air quality also affects the region’s potential for industrial development.
What it tells us: The trend has been slightly positive, although 2003 saw a slight decline for Hamilton County from 2002. Data for other
counties of the region are not available.
04
Data Source: U.S. Environmental Protection Agency
H e a l t h : A i r Q u a l i t y
1995 1996 1997 1998 1999 2000 2001 2002United States
Cincinnati CMSA
Brown County, OHButler County, OHClermont County, OHHamilton County, OHWarren County, OHBoone County, KYCampbell County, KYGallatin County, KYGrant County, KYKenton County, KYPendleton County, KYDearborn County, IN
Ohio County, IN
City of Cincinnati
No Small-Area Data Available
desirable actual
0
10
20
30
40
50
60
70
80
90
100
1999
Per
cent
2000
2001
2002
2003
Hamilton CountyEight-County Average

What it is: This indicator depicts the percentage of individuals whose reported height and weight create a Body Mass Index (BMI) indicating
obesity.
Why it matters: Obesity is considered by many to be the largest emerging threat to population health, since it correlates with a wide range of
life-threatening diseases such as high blood pressure, stroke, heart attack, and diabetes. Obesity is a national and global problem, affecting both
children and adults.
What it tells us: The problem is moderately worse in Greater Cincinnati than nationwide. Both the regional and national populations are getting
worse relative to the Healthy People 2010 goal. There were no major geographic variations in the 2002 measurements.
The State of the Com
munity 2004/Page 29
04
Data Source(s): 1999 & 2002 Greater Cincinnati Community Health Status Survey, 1999 & 2002 Behavior Risk Factor Surveillance SystemHealthy People 2010 Goal is from U.S. Dept. of Health & Human Services report that targets multiple national health goals in several areas.
Regional Performance Local Differences
desirable actual H e a l t h : O b e s i t y
1995 1996 1997 1998 1999 2000 2001 2002United States 53.3 55.6
Cincinnati CMSA 55.1 59.3
Hamilton County Suburbs 57.3 55.7Butler/Clinton/Warren 54.8 62.4Adams/Brown/Clermont/Highland 50.1 55.3Boone/Campbell/ Grant/Kenton 57.9 57.6Bracken/Gallatin/Pendleton 63.5 63.5Dearborn/Franklin/ Ohio/ Ripley/ Switzerland 64.9 63.0
City of Cincinnati 50.8 63.1
0
10
20
30
40
50
60
2002
Per
cent
1999
Cincinnati CMSA
United States
Healthy People 2010 Goal

The State of the Com
munity 2004/Page 30
Regional Performance Local Differences
What it is: This indicator reports the percentage of persons saying they lacked health insurance or coverage at any time during the past
12 months.
Why it matters: Lack of medical insurance correlates strongly with poor health status and stress on the health care system.
Roughly 18,000 unnecessary deaths each year in the United States are attributable to lack of health insurance (Institute of Medicine).
What it tells us: The Cincinnati region is improving, but we are still far from reaching the Healthy People 2010 goal. Suburban counties
and the Hamilton County suburbs have the lowest rates while the urban core and poorer rural counties have higher rates.
04
Data Source(s): 1999 & 2002 Greater Cincinnati Community Health Status Survey, 1999 & 2002 Behavior Risk Factor Surveillance SystemHealthy People 2010 Goal is from U.S. Dept. of Health & Human Services report that targets multiple national health goals in several areas.
H e a l t h : P e r s o n s L a c k i n g H e a l t h I n s u r a n c e desirable actual
1995 1996 1997 1998 1999 2000 2001 2002United States
Cincinnati CMSA 17.2 15.3
Hamilton County Suburbs 13.7 11.4Butler/Clinton/Warren 15.7 12.0Adams/Brown/Clermont/Highland 26.2 18.9Boone/Campbell/ Grant/Kenton 13.2 14.7Bracken/Gallatin/ Pendleton 23.8 20.2Dearborn/Franklin/ Ohio/ Ripley/ Switzerland 13.7 16.0
City of Cincinnati 21.1 23.2
0
5
10
15
20
1999
Per
cent
2002
Cincinnati CMSAHealthy People 2010 Goal

What it is: This indicator shows the percent of the adult population who report that they do not have a regular health care provider.
Why it matters: Access to a regular health care provider is important for prevention of disease and for reducing the burden on hospital
emergency rooms. It is also indicative of overall health care access.
What it tells us: Greater Cincinnati is at the national average and is showing improvement. While the highest rates occur in rural Ohio
counties, the largest concentration of people without a regular health care provider occurs in the urban core.
The State of the Com
munity 2004/Page 31
04
Data Source(s): 1999 & 2002 Greater Cincinnati Community Health Status Survey, 1999 & 2002 Behavior Risk Factor Surveillance SystemHealthy People 2010 Goal is from U.S. Dept. of Health & Human Services report that targets multiple national health goals in several areas.
Regional Performance Local Differences
H e a l t h : L a c k o f a R e g u l a r H e a l t h C a r e P r o v i d e rdesirable actual
1995 1996 1997 1998 1999 2000 2001 2002United States 12.6 13.6
Cincinnati CMSA 15.7 13.5
Hamilton County Suburbs 12.6 12.1Butler/Clinton/Warren 19.1 16.3Adams/Brown/Clermont/Highland 18.2 16.5Boone/Campbell/ Grant/Kenton 11.0 10.8Bracken/Gallatin/Pendleton 10.4 12.3Dearborn/Franklin/Ohio/ Ripley/ Switzerland 16.7 10.7
City of Cincinnati 17.8 12.4
2468
101214161820
2002
Per
cent
1999
Cincinnati CMSA
United States
Healthy People 2010 Goal

The State of the Com
munity 2004/Page 32
Regional Performance Local Differences
What it is: This indicator shows the percent of new business starts for the State of Ohio (based on the total number of for-profit businesses
with at least one employee active in July or August of each year) attributable to the Ohio counties of the metro region. Indiana and
Kentucky do not use the methodology.
Why it matters: Business starts are a good indicator of the vitality of the local economy. While not all start-ups are successful, those that
are bring economic security to their owners and provide jobs to area residents.
What it tells us: The Ohio counties of the region show growth in business starts, making up a slightly increasing percentage of all business
starts in the state. There is measurable growth in Brown, Butler, Clermont, and Warren counties, while Hamilton County has sustained a
high rate of business starts.
04
Data Source: Office of Strategic Research, Ohio Department of Development: Ohio County Indicators
E c o n o m y : B u s i n e s s S t a r t s desirable actual
1995 1996 1997 1998 1999 2000 2001 2002United States
Cincinnati CMSA (Ohio Part Only) 14.3 13.9 13.4 14.8 15.6 15.3 15.1 16.1
Brown County, OH 0.3 0.3 0.4 0.5 0.5 0.5 0.4 0.5Butler County, OH 2.8 2.5 2.4 2.7 3.3 3.1 3.1 3.5Clermont County, OH 1.3 1.3 1.2 1.3 1.4 1.3 1.5 1.7Hamilton County, OH 8.6 8.7 8.1 8.9 9.0 8.9 8.6 8.8Warren County, OH 1.2 1.1 1.3 1.4 1.5 1.5 1.5 1.6Boone County, KYCampbell County, KYGallatin County, KYGrant County, KYKenton County, KYPendleton County, KYDearborn County, INOhio County, IN
City of Cincinnati
0
2
4
6
8
10
12
14
16
18
Per
cent
1995
1999
1998
1997
1996
2001
2000
2002
Cincinnati CMSA (Ohio Part Only)

What it is: This indicator shows the percent increase or decrease in jobs in our region and its counties, year-to-year.
Why it matters: A growing job base is essential to provide employment to a region’s growing population and to make it an attractive area for
in-migration. Job growth is also a strong proxy for regional economic performance.
What it tells us: Job growth has slowed in our region, even somewhat more than in the U.S. as a whole. Job loss was most pronounced in 2001,
with the loss slowing in the overall region between 2001 and 2002. Job growth was weak in Hamilton County, strong in Dearborn County. Many
economists attribute the slowdown in job creation in Ohio and the U.S. to productivity improvement (fewer people needed to produce more
output), employer caution and the costs of providing benefits, especially health insurance.
The State of the Com
munity 2004/Page 33
04
Data Source: Bureau of Economic Analysis/Regional Economic Information System
Regional Performance Local Differences
desirable actual E c o n o m y : J o b s
-8
-6
-4
-2
0
2
4
6
819
96
Per
cent
2002
2001
2000
1999
1998
1997
1995 1996 1997 1998 1999 2000 2001 2002United States 2.2 2.4 2.6 1.9 2.4 0.2 0.1
Cincinnati CMSA 2.8 2.1 2.9 1.3 1.3 -0.9 -0.1
Brown County, OH -0.5 4.6 17.1 3.3 2.0 0.7 1.8Butler County, OH 1.9 5.3 4.4 3.8 3.0 0.7 0.2Clermont County, OH 2.5 2.9 9.5 4.8 3.3 1.6 3.0Hamilton County, OH 1.9 1.1 1.4 -0.8 0.5 -1.7 -2.0Warren County, OH 6.6 5.5 4.9 7.0 2.7 -0.1 2.7Boone County, KY 6.7 6.3 6.3 7.3 3.8 -0.4 2.1Campbell County, KY 3.2 1.3 2.4 4.3 1.6 -1.9 3.5Gallatin County, KY 11.2 6.6 1.5 7.5 6.8 -1.5 -5.1Grant County, KY 3.3 4.8 1.4 8.2 4.6 -2.2 1.8Kenton County, KY 4.0 0.9 1.8 3.4 1.8 1.0 -0.1Pendleton County, KY -0.5 -3.4 -4.5 2.9 3.4 -0.9 0.2Dearborn County, IN 4.3 9.1 11.8 0.9 2.7 3.7 0.8Ohio County, IN 32.4 62.4 5.2 -4.4 -1.8 -2.6 -0.5
City of Cincinnati
Cincinnati CMSA
Hamilton County
United States

The State of the Com
munity 2004/Page 34
Regional Performance Local Differences
What it is: This indicator shows the percent of our local working-age population age 20-35.
Why it matters: Many demographers and economists believe that persons in the 20-35 age group constitute the most “creative” or
entrepreneurial people in a workforce, contributing a high degree of vigor, productivity and creativity. Workforces deficient in this age group often
underperform compared to those with higher percentages. This has significant implications for our regional economy and its performance.
What it tells us: Data show that the overall U.S. population is aging and that 20-35-year-olds make up a shrinking part of it. Unfortunately, that
trend is more pronounced in Greater Cincinnati than in the U.S. taken as a whole, and the gap appears to be increasing.
04
Data Source: U.S. Bureau of the Census: Current Population Survey
desirable actualE c o n o m y : W o r k f o r c e 2 0 - 3 5 Y e a r s O l d
1995 1996 1997 1998 1999 2000 2001 2002 2003United States 39.4 38.6 37.4 36.7 36.1 35.3 34.8 34.7 33.9
Cincinnati CMSA 41.8 42.0 40.4 35.8 36.3 33.7 35.7 33.6 31.4
26
31
36
41
46P
erce
nt
2002
1995
1996
1997
1998
1999
2000
2001
2003
Cincinnati CMSA
United States

What it is: Per capita income is the mean income computed for every person in a particular group and is derived by dividing the total income of
the group by its total population.
Why it matters: Per capita income is considered a key measure of the economic well-being of individuals and is a good gauge of the region’s
economic performance.
What it tells us: Greater Cincinnati and Hamilton County continue to do well compared to the U.S. and Ohio. Hamilton County continues to
have the highest per capita income in the region while per capita incomes in Butler, Clermont,Warren, Dearborn, and Boone counties are increasing
rapidly. In general, rural counties have much lower per capita incomes. Data in the upcoming Web-based version of The State of the Community will
show that disadvantaged minorities such as African Americans, Hispanics and urban Appalachians lag behind.
The State of the Com
munity 2004/Page 35
04
Data Source: Bureau of Economic Analysis: Regional Economic Information System
Regional Performance Local Differences
E c o n o m y : P e r C a p i t a I n c o m e
1995 1996 1997 1998 1999 2000 2001 2002United States 23,255 24,270 25,412 26,893 27,880 29,760 30,413 30,906
Cincinnati CMSA 24,321 25,530 26,988 28,582 29,561 31,040 31,967 31,804
Brown County, OH 16,881 17,575 19,324 19,803 20,383 21,492 22,307 22,815Butler County, OH 21,915 22,721 24,224 25,580 26,961 28,184 28,718 29,415Clermont County, OH 20,491 21,405 23,656 24,905 27,157 28,984 29,899 29,638Hamilton County, OH 27,345 28,695 30,093 32,084 32,962 34,359 35,453 35,883Warren County, OH 22,634 23,784 25,797 27,108 28,139 29,439 30,673 30,955Boone County, KY 22,005 23,308 24,662 26,013 27,291 29,295 30,004 29,703Campbell County, KY 19,807 20,818 21,912 23,249 24,253 25,895 26,573 28,049Gallatin County, KY 15,091 15,507 16,029 16,108 16,491 18,046 17,492 20,828Grant County, KY 15,509 16,149 17,309 17,607 18,206 19,852 19,847 21,195Kenton County, KY 22,032 23,537 24,564 25,831 26,519 28,340 28,970 30,332Pendleton County, KY 15,076 15,729 16,847 17,559 17,990 19,385 19,020 20,445Dearborn County, IN 19,819 21,150 22,859 24,608 25,333 27,050 28,113 28,438Ohio County, IN 17,739 18,828 20,586 21,654 21,820 23,017 23,449 24,661
City of Cincinnati
desirable actual
12,000
17,000
22,000
27,000
32,000
37,000
42,000
47,000
1996
Per
cent
2002
2001
2000
1999
1998
1997
1995
Cincinnati CMSA
Hamilton County
United States

The State of the Com
munity 2004/Page 36
Regional Performance Local Differences
What it is: This indicator shows the percent of employable people actively seeking work, divided by the total number of employable people.
Why it matters: The inability to find employment is devastating to individuals and families. Unemployment rates also are a critical measure
of the performance of a region’s economy.
What it tells us: Greater Cincinnati’s unemployment rate is consistently lower than the national average – usually by about one percent.
Rates increased in 2001 and 2002 due to the recession but new data are expected to show national and Greater Cincinnati rates heading
down. Northern Kentucky counties’ rates are at or below regional averages. Dearborn County’s rate is lower than the region’s and Warren
County’s is especially low. Brown County has a rate notably higher than the region’s. The upcoming Web-based version of The State of the
Community will show that African Americans experience unemployment rates approximately double the general rate and that unemployment
among African American teenagers is especially high.
04
Data Source: U.S. Bureau of Labor Statistics: Local Unemployment Statistics
E c o n o m y : U n e m p l o y m e n t desirable actual
1995 1996 1997 1998 1999 2000 2001 2002United States 5.6 5.4 4.9 4.5 4.2 4.0 4.7 5.8
Cincinnati PMSA 4.2 4.2 3.8 3.4 3.5 3.4 3.9 4.8
Brown County, OH 5.8 5.9 5.5 5.0 5.4 5.9 6.2 7.1Butler County, OH 4.0 4.1 3.5 3.3 3.2 2.9 3.2 4.4Clermont County, OH 4.3 4.4 4.1 3.5 3.7 3.6 3.8 5.3Hamilton County, OH 4.1 4.1 3.6 3.5 3.6 3.5 3.7 5.1Warren County, OH 4.1 4.0 3.5 2.9 2.7 2.7 4.1 3.6Boone County, KY 4.5 4.5 4.0 3.5 3.3 3.3 4.9 3.8Campbell County, KY 5.8 5.7 5.6 3.9 3.5 4.1 5.1 5.2Gallatin County, KY 5.2 5.9 5.3 4.5 3.9 4.2 6.2 5.4Grant County, KY 4.2 4.2 3.8 3.3 3.2 3.3 4.9 3.9Kenton County, KY 4.7 5.2 6.9 3.8 3.8 3.5 5.3 4.5Pendleton County, KY 6.6 5.2 3.8 3.3 3.2 3.2 3.9 4.6Dearborn County, IN 5.9 5.3 3.6 3.3 3.2 3.4 3.1 3.5Ohio County, IN
City of Cincinnati
0
1
2
3
4
5
6
7
8
9
1996
Per
cent
2002
2001
2000
1999
1998
1997
1995
Cincinnati PMSA
Hamilton County
United States

What it is: This indicator shows the percent of residents in the region’s counties whose incomes fall below the federally-defined poverty
level.
Why it matters: The percentage of the population living in poverty is a crucial socio-economic measure that strongly correlates with
other social problems, including health, educational outcomes, crime, safety, and others.
What it tells us: Our region is doing relatively well, with local poverty rates heading lower along with the U.S. rate. Our suburban counties
and the suburban areas of central counties have relatively few people living in poverty. In our region, poverty is concentrated in rural and
urban pockets: central and western City of Cincinnati and Brown, Gallatin, Grant, and Pendleton counties. The upcoming Web-based version
of The State of the Community will show that minorities are more likely to live in poverty than others.
The State of the Com
munity 2004/Page 37
04
Data Source: Census Bureau: Housing and Household Economics Statistics, Small Area Estimates Branch
Regional Performance Local Differences
desirable actual E c o n o m y : P o v e r t y
1995 1996 1997 1998 1999 2000 2001 2002United States 13.8 13.7 13.3 12.7 11.9 11.3
Cincinnati CMSA
Brown County, OH 12.1 12.0 11.1 11.2 10.4Butler County, OH 8.0 8.1 7.7 8.3 7.2Clermont County, OH 7.1 6.7 6.8 7.5 6.5Hamilton County, OH 11.7 11.4 11.3 11.9 10.3Warren County, OH 5.4 5.6 5.2 5.2 4.7Boone County, KY 7.1 6.3 6.2 6.1 5.5Campbell County, KY 13.3 10.0 9.6 9.3 8.6Gallatin County, KY 16.3 15.9 13.7 13.1 14.1Grant County, KY 14.8 13.1 13.3 11.8 11.2Kenton County, KY 11.2 10.1 9.6 9.1 8.6Pendleton County, KY 15.5 14.4 13.7 12.1 11.1Dearborn County, IN 7.4 7.1 7.2 6.6 6.3Ohio County, IN 6.8 6.5 7.0 6.4 6.7
City of Cincinnati
6.0
8.0
10.0
12.0
14.0
16.0
18.0
1996
Per
cent
2000
1999
1998
1997
1995
Hamilton County
United States

The State of the Com
munity 2004/Page 38
Regional Performance Local Differences
30.0
35.0
40.0
45.0
50.0
55.0
60.0
2000
1990
Per
cent
What it is: This indicator uses median family income divided by median home value as a proxy to measure housing affordability with the
higher number indicating higher levels of affordability.
Why it matters: Higher costs of home ownership tighten competition in the rental market, driving up rental prices. Lack of affordable
rental housing often leads to overcrowded or unsafe housing conditions and seriously impacts the ability of low- to moderate-income families
to meet other basic needs. The housing shortage leads to longer and more congested commutes, more air pollution, diminished productivity,
and less family time. Comparatively affordable housing also confers economic competitiveness on a region because it helps to attract new
residents.
What it tells us: While housing prices in Greater Cincinnati are still relatively low compared to many other regions in the U.S., local
housing prices have been rising rapidly recently. Rural counties in all three states with new suburban development have lower housing
affordability for existing residents. Suburban counties also are becoming less affordable for current residents.
04
Data Source: U.S. Bureau of the Census: 1990 and 2000 Census of Population and Housing
E c o n o m y : H o u s i n g A f f o r d a b i l i t y desirable actual
1990 2000United States 44.9 41.8
Cincinnati CMSA 52.8 47.4
Brown County, OH 58.9 47.9Butler County, OH 53.3 46.7Clermont County, OH 51.2 46.4Hamilton County, OH 52.0 48.0Warren County, OH 52.4 45.5Boone County, KY 52.5 46.4Campbell County, KY 56.6 51.0Gallatin County, KY 58.3 47.2Grant County, KY 58.1 45.8Kenton County, KY 56.0 50.1Pendleton County, KY 62.7 54.8Dearborn County, IN 59.7 45.4Ohio County, IN 67.4 50.3
City of Cincinnati
Cincinnati CMSA
Hamilton County
United States

What it is: Average commute time is reported as the Travel Time Index, a measure of the additional time required to make a
trip because of congestion on roadways. For example, an index value of 1.25 indicates that it takes 25 percent more time to make a trip
during peak periods than at normal (“free-flow”) times.
Why it matters: Commute time is an indicator of economic, social and physical health. Greater commute time correlates negatively with
civic participation and good health outcomes. Commute time has been related to stress and road rage.
What it tells us: Greater Cincinnati’s commute index is lower than the national average, giving Greater Cincinnati a comparative advantage
over other urban areas, although both the national and local figures are trending toward longer commute times. Local (county) data are not
available.
The State of the Com
munity 2004/Page 39
04
Data Source: Texas Transportation Institute: 2003 Urban Mobility Report
Regional Performance Local Differences
0.0
0.2
0.4
0.6
0.8
1.0
1.2
1.4
1.6
1.8
2.0
1990
Tra
vel T
ime
Inde
x
1991
1992
1993
1994
1995
1996
1997
1998
1999
2000
2001
S o c i a l R e l a t i o n s : C o m m u t i n g T i m edesirable actual
1995 1996 1997 1998 1999 2000 2001 2002United States
Cincinnati CMSA
Brown County, OHButler County, OHClermont County, OHHamilton County, OHWarren County, OHBoone County, KYCampbell County, KYGallatin County, KYGrant County, KYKenton County, KYPendleton County, KYDearborn County, INOhio County, IN
City of Cincinnati
No Small-Area Data Available
To 75 Urban Areas
Cincinnati Urban Area

The State of the Com
munity 2004/Page 40
Regional Performance Local Differences
What it is: This indicator is based on the Tauber Index of Dissimilarity, a commonly-used measure of residential segregation based on U.S.
Census data. Looking at housing patterns, it measures segregation on a 0-to-1 scale, with the higher number indicating higher levels of
segregation between two groups – in this case Caucasians and African Americans. The indicator does not measure intergroup relations per
se.
Why it matters: Highly segregated housing patterns correlate with racial tensions in a community. Also, members of minority groups
often have fewer educational and economic opportunities in communities with segregated housing patterns.
What it tells us: The data show that racial integration in Greater Cincinnati is improving, though not so quickly as in the U.S. as a whole.
Between 1990 and 2000, residential integration improved in nearly all counties in our region.
04
Data Source: U.S. Bureau of the Census: 1980, 1990 & 2000 Census of Population and Housing
S o c i a l R e l a t i o n s : R e s i d e n t i a l S e g r e g a t i o n desirable actual
1980 1990 2000United States 0.727 0.678 0.640
Cincinnati PMSA 0.781 0.761 0.739
Brown County, OH 0.438 0.407Butler County, OH 0.590 0.481Clermont County, OH 0.305 0.261Hamilton County, OH 0.710 0.681Warren County, OH 0.645 0.545Boone County, KY 0.213 0.246Campbell County, KY 0.704 0.572Gallatin County, KY 0.395 0.345Grant County, KY 0.423 0.206Kenton County, KY 0.669 0.622Pendleton County, KY 0.569 0.315Dearborn County, IN 0.705 0.607Ohio County, IN 0.400 0.276
City of Cincinnati 0.667 0.602
0.0
0.2
0.4
0.6
0.8
1.0
1980
Tau
ber
Inde
x
1990
2000
Top 75 Urban AreasCincinnati Urban Area

Why it matters: Healthy relations between racial groups are essential to the future of the Cincinnati region.
Recent events underscore how strained race relations are and how much improvement is needed.
It is essential that future editions of The State of the Community report include a measure of race relations.
The Research Council continues to search for a valid, reliable, high-quality measure. Unfortunately, no national methodology or benchmarks are
available.
Regular major, local studies will have to be undertaken – which will require funding.
United Way Research Council
The State of the Com
munity 2004/Page 41
04
Regional Performance Local Differences
desirable S o c i a l R e l a t i o n s : R a c e R e l a t i o n s ( P l a c e h o l d e r )
1995 1996 1997 1998 1999 2000 2001 2002United States
Cincinnati CMSA
Brown County, OHButler County, OHClermont County, OHHamilton County, OHWarren County, OHBoone County, KYCampbell County, KYGallatin County, KYGrant County, KYKenton County, KYPendleton County, KYDearborn County, INOhio County, IN
City of Cincinnati
No Small-Area Data AvailableNo Regional Data Available

The State of the Com
munity 2004/Page 42
Regional Performance Local Differences
What it is: This indicator shows the number of arrests for violent crime per 100,000 population in a given year.
Why it matters: The reality and perception of safety are important elements in people’s decisions about where to live, with high crime rates
acting as a strong disincentive to in-migration. Crime of all kinds has significant economic costs – to businesses and to government – and puts
significant burdens on taxpayers. Crime also acts as a deterrent to civic participation.
What it tells us: Greater Cincinnati has stayed about average compared to the national trend and has been experiencing lower violent crime
rates. Hamilton, Boone, Butler, Gallatin, Grant, and Pendleton counties have been doing slightly less well than the region and the U.S. since 1997.
In 2001, two suburban and three rural counties had a higher violent crime rate than the central county. Extreme variation at the county level
makes interpretation difficult.
04
Data Source: Federal Bureau of Investigation: Uniform Crime Reporting Program Data – All Arrest Statistics
S o c i a l R e l a t i o n s : V i o l e n t C r i m e desirable actual
1995 1996 1997 1998 1999 2000 2001 2002United States 280.4 246.5 242.9 225.5 209.2 197.2 195.9
Cincinnati CMSA 262.8 279.4 295.0 244.1 239.2 177.9 180.7
Brown County, OH 85.2 83.8 84.7 80.9 72.2 72.8 51.4Butler County, OH 158.2 141.0 150.7 122.4 102.6 152.2 239.7Clermont County, OH 103.2 142.8 118.0 103.0 110.8 108.6 85.7Hamilton County, OH 266.4 231.3 314.3 292.1 259.5 219.0 207.0Warren County, OH 81.7 71.9 85.0 63.7 30.0 54.1 35.8Boone County, KY 145.7 406.4 459.8 426.3 211.1 194.3 244.3Campbell County, KY 641.6 809.5 626.2 433.0 628.4 222.2 194.1Gallatin County, KY 308.2 404.4 309.4 278.5 295.8 178.1 226.8Grant County, KY 395.5 496.4 388.9 315.1 365.3 181.8 215.8Kenton County, KY 737.6 926.7 710.9 479.8 677.9 233.5 205.9Pendleton County, KY 328.1 422.7 339.4 291.2 300.9 172.4 225.3Dearborn County, IN 56.4 39.8 181.1 36.0 54.2 114.4 32.0Ohio County, IN 147.3 165.3 220.8 110.2 91.6 124.1 87.8
City of Cincinnati
0
100
200
300
400
500
1995N
umbe
r o
f Vio
lent
Cri
me
Arr
ests
Per
100
,000
Po
pula
tio
n
1996
1997
1998
1999
2000
2001
Cincinnati CMSA
Hamilton County
United States
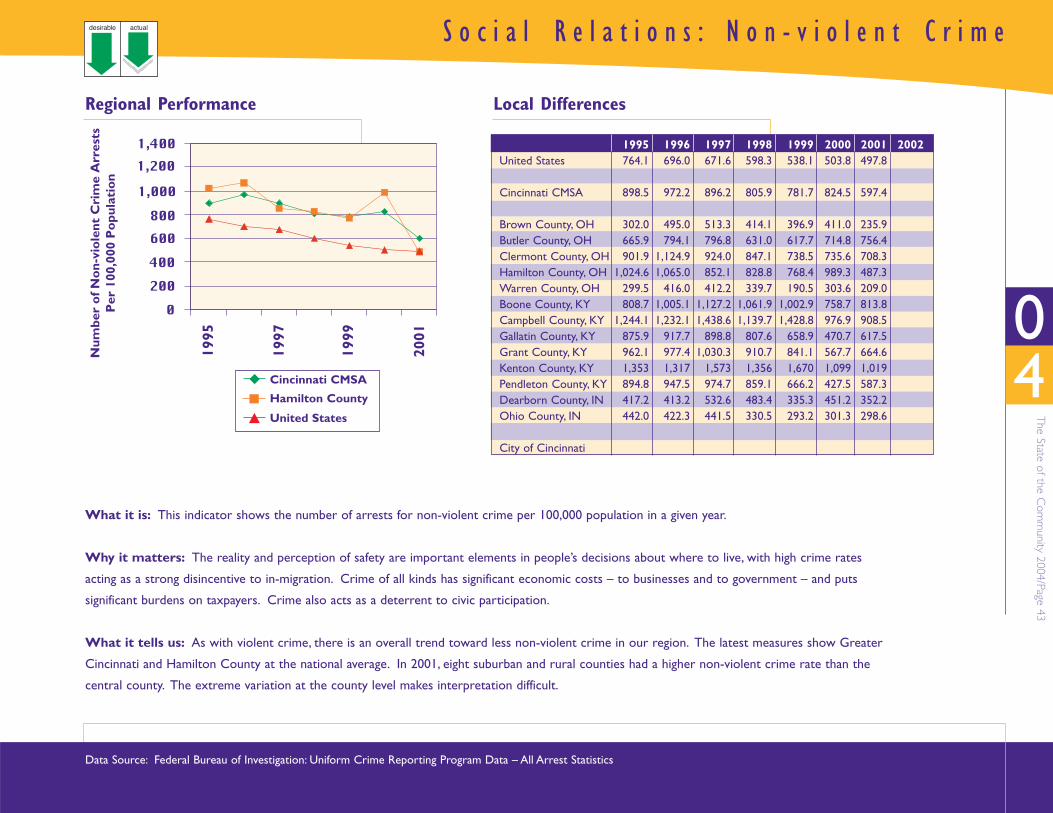
What it is: This indicator shows the number of arrests for non-violent crime per 100,000 population in a given year.
Why it matters: The reality and perception of safety are important elements in people’s decisions about where to live, with high crime rates
acting as a strong disincentive to in-migration. Crime of all kinds has significant economic costs – to businesses and to government – and puts
significant burdens on taxpayers. Crime also acts as a deterrent to civic participation.
What it tells us: As with violent crime, there is an overall trend toward less non-violent crime in our region. The latest measures show Greater
Cincinnati and Hamilton County at the national average. In 2001, eight suburban and rural counties had a higher non-violent crime rate than the
central county. The extreme variation at the county level makes interpretation difficult.
The State of the Com
munity 2004/Page 43
04
Data Source: Federal Bureau of Investigation: Uniform Crime Reporting Program Data – All Arrest Statistics
Regional Performance Local Differences
S o c i a l R e l a t i o n s : N o n - v i o l e n t C r i m edesirable actual
1995 1996 1997 1998 1999 2000 2001 2002United States 764.1 696.0 671.6 598.3 538.1 503.8 497.8
Cincinnati CMSA 898.5 972.2 896.2 805.9 781.7 824.5 597.4
Brown County, OH 302.0 495.0 513.3 414.1 396.9 411.0 235.9Butler County, OH 665.9 794.1 796.8 631.0 617.7 714.8 756.4Clermont County, OH 901.9 1,124.9 924.0 847.1 738.5 735.6 708.3Hamilton County, OH 1,024.6 1,065.0 852.1 828.8 768.4 989.3 487.3Warren County, OH 299.5 416.0 412.2 339.7 190.5 303.6 209.0Boone County, KY 808.7 1,005.1 1,127.2 1,061.9 1,002.9 758.7 813.8Campbell County, KY 1,244.1 1,232.1 1,438.6 1,139.7 1,428.8 976.9 908.5Gallatin County, KY 875.9 917.7 898.8 807.6 658.9 470.7 617.5Grant County, KY 962.1 977.4 1,030.3 910.7 841.1 567.7 664.6Kenton County, KY 1,353 1,317 1,573 1,356 1,670 1,099 1,019Pendleton County, KY 894.8 947.5 974.7 859.1 666.2 427.5 587.3Dearborn County, IN 417.2 413.2 532.6 483.4 335.3 451.2 352.2Ohio County, IN 442.0 422.3 441.5 330.5 293.2 301.3 298.6
City of Cincinnati
0200400
600800
1,000
1,2001,400
Num
ber
of N
on-
vio
lent
Cri
me
Arr
ests
Per
100
,000
Po
pula
tio
n
1995
1997
1999
2001
Cincinnati CMSA
Hamilton County
United States

The State of the Com
munity 2004/Page 44
Regional Performance Local Differences
What it is: This indicator shows the number of murders per 100,000 population in a given year.
Why it matters: The reality and perception of personal and family safety are important elements in people’s decisions about where to live, with
high crime rates acting as a strong disincentive to in-migration. Crime of all kinds has significant economic costs – to businesses and to
government – and puts significant burdens on taxpayers. Fear of crime also acts as a deterrent to civic participation.
What it tells us: Both national and local trends are improving, with Greater Cincinnati’s and Hamilton County’s rates lower than the national
average. In 2001, Clermont and Butler counties had higher murder rates than the central county. The very small numbers of murders make
county-level interpretation for small and medium-sized counties difficult.
04
Data Source: Federal Bureau of Investigation: Uniform Crime Reporting Program Data – All Arrest Statistics
S o c i a l R e l a t i o n s : M u r d e r R a t e desirable actual
1995 1996 1997 1998 1999 2000 2001 2002United States 7.9 6.5 6.1 5.7 5.1 4.7 4.7
Cincinnati CMSA 5.5 3.1 4.1 3.5 3.4 3.7 2.5
Brown County, OH 2.6 2.5 2.5 2.5 2.4 2.3 2.3Butler County, OH 3.1 2.2 3.4 2.4 1.5 3.0 3.6Clermont County, OH 1.8 3.5 2.3 1.1 4.5 6.2 4.4Hamilton County, OH 6.9 4.1 5.5 4.2 4.3 4.1 2.7Warren County, OH 3.8 1.5 4.3 1.4 0.0 1.9 0.0Boone County, KY 0.0 1.4 1.3 6.3 1.2 3.4 0.0Campbell County, KY 9.2 2.3 3.4 4.6 5.7 3.4 1.1Gallatin County, KY 0.0 0.0 0.0 0.0 0.0 0.0 0.0Grant County, KY 5.3 5.2 5.1 4.9 4.8 0.0 0.0Kenton County, KY 9.6 2.8 2.7 6.1 6.1 4.6 1.3Pendleton County, KY 7.5 0.0 7.2 7.3 0.0 0.0 0.0Dearborn County, IN 4.5 0.0 2.2 0.0 0.0 2.2 6.4Ohio County, IN 0.0 0.0 0.0 0.0 0.0 0.0 0.0
City of Cincinnati
0
1
2
3
4
5
6
7
8
9
1995
Num
ber
of M
urde
rs
Per
100
,000
Po
pula
tio
n
1996
1997
1998
1999
2000
2001
Cincinnati CMSA
Hamilton County
United States

Why it matters: FBI and other national reporting systems have limited data on juvenile crime or cover only some communities or are being
implemented slowly.
Many juveniles enter the court system because of private complaints or school reports – not by arrest.
Juvenile courts of Ohio, Kentucky and Indiana use different approaches to recording juvenile intake and case dispositions.
We need a common approach that includes crime, arrest and clearance data, as well as court intake and disposition.
Kim Brooks Tandy, Esq., Children’s Law Center
The State of the Com
munity 2004/Page 45
04
Regional Performance Local Differences
S o c i a l R e l a t i o n s : J u v e n i l e C r i m e ( P l a c e h o l d e r )desirable
1995 1996 1997 1998 1999 2000 2001 2002United States
Cincinnati CMSA
Brown County, OHButler County, OHClermont County, OHHamilton County, OHWarren County, OHBoone County, KYCampbell County, KYGallatin County, KYGrant County, KYKenton County, KYPendleton County, KYDearborn County, INOhio County, IN
City of Cincinnati
No Small-Area Data AvailableNo Regional Data Available

The State of the Com
munity 2004/Page 46
Regional Performance Local Differences
What it is: This indicator shows the percent of voting-age persons who actually voted in presidential elections.
Why it matters: Voter turnout is a strong measure of social capital/civic participation, and high turnout often allows elected officials to
advance policies supported by a strong citizen mandate.
What it tells us: Both Greater Cincinnati and Hamilton County vote at higher rates than the national average. All local counties except
Gallatin, Grant and Pendleton counties in Kentucky vote at higher rates than the national average and Hamilton, Warren and Ohio counties
vote at substantially above the national rate and the local average.
04
Data Source: Indiana Secretary of State, Kentucky Secretary of State, Ohio Secretary of State
S o c i a l R e l a t i o n s : V o t i n g
1992 1996 2000United States 55.2 49.1 51.3
Cincinnati CMSA 60.0 55.0 56.0
Brown County, OH 58.5 54.5 53.4Butler County, OH 58.1 50.9 54.8Clermont County, OH 57.5 53.2 53.8Hamilton County, OH 63.0 58.0 60.0Warren County, OH 71.7 55.6 59.6Boone County, KY 53.8 49.9 52.8Campbell County, KY 53.3 50.0 52.6Gallatin County, KY 57.9 50.0 43.1Grant County, KY 46.8 44.5 46.0Kenton County, KY 52.3 50.2 51.3Pendleton County, KY 52.0 47.2 47.3Dearborn County, IN 54.0 51.7 54.2Ohio County, IN 65.0 62.4 60.6
City of Cincinnati
desirable actual
nochange
0
10
20
30
40
50
60
70
80
90
100
1992
1996
2000
Per
cent
Hamilton County
Cincinnati CMSA
National

A d d i t i o n a l R e g i o n a l I n d i c a t o r R e p o r t s
Air Quality Data and Progress Report2003Hamilton County Air Quality Management Division(serving Butler, Clermont, Hamilton, and Warren Counties)513-946-7747www.hcdoes.org
Benchmarks for Progress, Hamilton County, Ohio1996, 1998, 2000, 2002Hamilton County Regional Planning Commission807 County Administration Building138 East Court StreetCincinnati, Oh 45202-1215513-946-4500http://www.hamilton-co.org/hcrpc/data/reports.asp
Cincinnati Metropatterns:A Regional Agenda for Community and Stability in the Cincinnati Region2001Myron Orfield and Thomas LuceMetropolitan Area Research Corporation612-379-3926www.metroresearch.org
Cincinnati NIP (Neighborhood Indicator Project for Redevelopment)Local Initiatives Support Corporation (LISC)http://www.merusipartners.com/index.html
Community COMPASS State of the County Reports2004Hamilton County Regional Planning Commission807 County Administration Building138 East Court StreetCincinnati, Oh 45202-1215513-946-4500www.communitycompass.org/products
Community Health Status Report Cards 2003Boone, Campbell, Grant, and Kenton CountiesNorthern Kentucky Independent District Health Department (NKIDHD)610 Medical Village DriveEdgewood, KY 41017-3416859-341-4264www.nkyhealth.org
Greater Cincinnati Metro Region Resource Book1999Michael Gallis & AssociatesGreater Cincinnati Chamber of Commerce513-579-3121
Indicators of Healthy Communities for Greater Cincinnati2003Health Improvement Collaborative of Greater Cincinnati2100 Sherman Avenue, Suite 100Cincinnati, Ohio 45212-2775513-531-0267www.the-collaborative.org
The State of the Com
munity 2004/Page 47
04

The State of the Com
munity 2004/Page 48
A d d i t i o n a l R e g i o n a l I n d i c a t o r R e p o r t s
Mortality Public Health Report2000Hamilton County General Health DistrictDivision of Community Health Information Services250 William Howard Taft Road, 2nd FloorCincinnati, Ohio 45219-2612513-946-7800www.hamilton-co.org/boh
Ohio Metro Metropatterns: A Regional Agenda for Community and Stability2002Myron Orfield and Thomas LuceAmeregis/Metropolitan Area Research Corporation612-379-3926www.ameregis.org
The Social Areas of Cincinnati: An Analysis of Social Needs 1997, 2004Michael E. Maloney and Janet R. BuelowUrban University Program of the State of OhioUniversity of Cincinnati, School of PlanningMichael Maloney and Associates134 Kinsey AvenueCincinnati, Ohio [email protected]
Sourcebook on Alcohol and Drug Abuse Trends In Hamilton CountyHamilton County Alcohol and Drug Addiction Services Board June, 2004 http://www.hamilton-co.org/adas/Needs.htm
The State of Our Children: A Report on the Well-Being of Children in the Tristate Region (Ohio – Kentucky – Indiana),Volume III, 2002Child Research Policy CenterCincinnati Children’s Hospital Medical Center3333 Burnet Avenue, ML-7014Cincinnati, Ohio 45229-3039513-636-0180www.cprc-chmc.uc.edu
Sustainable Cincinnati2002Hamilton County Regional Planning Commission807 County Administration Building138 East Court StreetCincinnati, Oh 45202-1215513-946-4500www.sustainablecincinnati.org
White Paper on Poverty in Northern Kentucky2004Northern Kentucky Community Action Commission, Inc.20 W. Pike Street, Suite 200P.O. Box 931Covington, Kentucky [email protected]
04

D a t a S o u r c e s
Center for Disease Control and Prevention, Behavior Risk Factor Surveillance System.
Center for Disease Control and Prevention, National Center for Health Statistics.
Coalition for a Drug-Free Greater Cincinnati: Personal Drug Use Survey, 2000 & 2002.
Enrollment of Local Colleges & Universities Data provided by Cincinnati State Technical & Community College, College of Mount St. Joseph, Miami
University — Oxford, Miami University — Hamilton, Northern Kentucky University, Southern State Community College, Thomas More College,
University of Cincinnati, and Xavier University.
The Health Foundation of Greater Cincinnati and The Health Improvement Collaborative of Greater Cincinnati, 2003. The Greater Cincinnati
Community Health Status Survey 2002. Cincinnati, OH: Authors.
The Health Foundation of Greater Cincinnati and The Health Improvement Collaborative of Greater Cincinnati, 2000. The Greater Cincinnati
Community Health Status Survey 1999. Cincinnati, OH: Authors.
Ohio Department of Development: Office of Strategic Research, Ohio County Indicators.
Texas Transportation Institute: 2003 Urban Mobility Report.
U.S. Bureau of the Census: 1990 and 2000 Census of Population and Housing.
U.S. Bureau of the Census: Current Population Survey.
U.S. Bureau of the Census: Housing and Household Economic Statistics, Small Area Estimates Branch.
U.S. Bureau of the Census: Population Estimates Program, Population Division.
U.S. Bureau of Economic Analysis/Regional Economic Information System.
U.S. Federal Bureau of Investigation: Uniform Crime Reporting Program Data.
U.S. Bureau of Labor Statistics: Local Unemployment Statistics.
U.S. Department of Health and Human Services.Tracking Healthy People 2010.Washington, DC. U.S. Government Printing Office, November 2000.
U.S. Environmental Protection Agency.
Voting Data provided by the Indiana Secretary of State, the Kentucky Secretary of State and the Ohio Secretary of State.
The State of the Com
munity 2004/Page 49
04

United Way of Greater Cincinnati2400 Reading Road
Cincinnati, OH 45202-1478513-762-7100
Area Centers:
Eastern Area2085-A Front Wheel DriveBatavia, OH 45103-3256
513-536-3000
Middletown Area1131 Manchester Avenue
Middletown, OH 45042-1925513-705-1160
Northern Kentucky11 Shelby Street
Florence, KY 41042-1612859-525-2600
Visit our Web site: www.uwgc.org