a research into the thermodynamics of methanol to ... · original article a research into the...
TRANSCRIPT

ORIGINAL ARTICLE
A research into the thermodynamics of methanol to hydrocarbon(MTH): conflictions between simulated product distributionand experimental results
B. Liu1,2 • B. Yao2 • S. Gonzalez-Cortes2 • V. L. Kuznetsov2 • M. AlKinany3 •
S. A. Aldrees3 • Tiancun Xiao2 • Peter P. Edwards2
Received: 27 March 2017 / Accepted: 24 April 2017 / Published online: 11 May 2017
� The Author(s) 2017. This article is an open access publication
Abstract Thermodynamic calculations and analysis were
carried out for a rational understanding of the results from
selected laboratory MTH reactions. Simulations without
solid carbons (coke), CO, CO2 and light alkanes target on
the yield of olefin and aromatic products, which has been
found better referenced to the real experimental observa-
tions that occur in time-on-stream (TOS). The confliction
between simulated data and real experimental results is
presumably ascribed to the limited dwelling time of prod-
ucts in the reaction system. Hydrocarbon pool based
reactions donate olefins and methyl-benzenes as primary
products in a continuous-flow MTH reaction; when the
dwelling time of product extends intra-conversions (H2
transfers) between products would further adjust the com-
position of MTH yield, in which case alkanes and aromatic
products (cokes precursors) increase. In the case of intra-
conversions are ignored due to limited product dwelling
time, thermodynamic calculation on Gibbs free energy
change of selected sub reactions shows fairly close results
to the real experimental data, which well supports the
above explanations. This work highlights the importance of
proper choosing target products and/or sub reactions for a
rational thermodynamic prediction of MTH product dis-
tribution obtained in time-on-stream.
Keywords Methanol to hydrocarbon � Hydrocarbon pool
mechanism � Thermodynamic � Intra-conversion � Dwellingtime
Introduction
At present, the pathways of methanol to hydrocarbon
reaction especially the formation of first C–C bond are still
in debate. The most acceptable hypothesis by far relies on
the mechanism based on a ‘hydrocarbon pool’ [1]. In this
theory, limited trace amount of hydrocarbons introduced as
impurities in the methanol feedstock formed the initial
aromatics (some benzene ring structures), which play a key
role as the ‘scaffold’ in later process [2]. Methyl groups are
added onto the hydrocarbon pool molecules in alkylation
steps and light olefins are subsequently formed by the
corresponding de-alkylation steps. The initial olefins can be
converted into alkanes by occupying H2, whereas contin-
uous loss of H2, followed by the cyclization steps forms
more aromatics [3–5]. In a mature MTH system, series of
the above reactions proceed in a parallel way and, there-
fore, bring in a complexity to the products and orders of
their formation; however, thermodynamics always say
coke (extremely dehydrogenated products, or solid car-
bons) is the dominating product in MTH and most other
hydrocarbon transformations [6]. Before the reaction
reaches a final format of solid carbons [C(s)],
Electronic supplementary material The online version of thisarticle (doi:10.1007/s13203-017-0178-1) contains supplementarymaterial, which is available to authorized users.
& Peter P. Edwards
Tiancun Xiao
1 State Key Laboratory of Heavy Oil Processing, China
University of Petroleum (Beijing), 18 Fuxue Road, Beijing,
China
2 Inorganic Chemistry Laboratory, Department of Chemistry,
KACST-Oxford Petrochemical Research Centre (KOPRC),
University of Oxford, Oxford, UK
3 Petrochemical Research Institute, King Abdulaziz City for
Science and Technology, P. O. Box 6086, Riyadh 11442,
Kingdom of Saudi Arabia
123
Appl Petrochem Res (2017) 7:55–66
DOI 10.1007/s13203-017-0178-1

dehydrogenation and polymerization are predominant in
the system and extremely favoured by the thermodynamics
[7–9]. The purpose of thermodynamic investigation is to
predict a useful product distribution when the reactions
reach to an equilibrium state, so researchers should make a
choice on the reactions related in the system. In an attempt
to take thermostable products, including cokes, CO and
CO2, into the thermodynamic calculations, previous studies
embodied extremely limited gas olefins and aromatics in
product yields [9]. In a similar system of methane aroma-
tization, it was also found benzene yield closing to real
experimental results could only be calculated when solid
carbons are not included [10]. Hence, one critical issue
should be highlighted before the thermodynamic calcula-
tion is ‘‘how we could adjust the simulation/calculation to
explain/predict our results’’.
The thermodynamic investigation in this study was
originally designed for a rational understanding of results
from our previous MTH lab experiments, including a 6 bar
pressure, catalyst loading amplified (20 g) reaction, and
two atmosphere reactions for nano H-ZSM-5 deactivation
(8 h-1 Weight Hourly Space Velocity, WHSV) and
industrial H-ZSM-5 performance tests, respectively. Like
other researches, in our experiments methanol conversion
mainly yield large portion of gas alkanes, gas olefins, as
well as aromatics [4, 5, 11]. This is owing to the continuous
flow of methanol feedstock and the non-stop transportation
of previous formed products to the outside of the system
(before the catalyst deactivates); in other words, the reac-
tion happens in an opening system, which greatly reduces
the chances of coke formation.
Strangely, even adjustments were made to selectively
remove coke, CO, and CO2 from the calculation, the pre-
dicted product distributions from thermodynamic calcula-
tion are still quite different from the practical experimental
observations; gas olefins are still in very poor portions in
strong comparison to the alkanes. The founded problems
also occurred in previous studies [9, 10]. Therefore, for a
more accurate prediction on olefin formation, we have
focused more on the simulations employing olefins (C2–
C4) and/or aromatics (C6–C9) as the target products.
According to the hydrocarbon pool theory, olefins are
earlier formed in the system where aromatics (some of
them are also formed in an early time as the hydrocarbon
pools) and alkanes can be obtained in later H2 transfers
(intra-conversion between products, via H2 loss/addition)
[12]. It seems that the longer the olefins stay in the system,
the more they are consumed. Hence, great interests and
attentions should be made on the reaction dwelling time of
products in a real non-stopping reaction system, which may
play a key role in understanding the difference between
ideal thermodynamic results and real MTH yields.
Initial work–thermodynamic calculations
on selected sub reactions
Changes of reactions in Gibbs free energy (DrGhm) and
products equilibrium constants (Kh) of selected 25 sub
reactions are calculated in the temperature range of
200–1000 �C. Although the MTH mechanism is in a great
complexity, thermodynamics are not affected by the reac-
tion routes. The selected 25 reactions have covered all the
directions from methanol to the major MTH products (C1–
C9) with essential product intra-conversions, and are sup-
posed to happen in a real MTH system proceeding in time-
on-stream [11, 12]. Particularly, we have further separated
the isomers of xylene and tri-methylbenzene, for a more
comprehensive study than the previous works, and a con-
sideration that para-xylene might be the most favourable
product in the methanol to aromatics process via H-ZSM-5
zeolite [4, 8, 9]. The intra-conversions between different
xylenes and the reactions of toluene to benzene and xylenes
are specially considered, highlighting the importance of
BTX products (benzene, toluene and xylenes) in the total
aromatics. The selected 25 sub-reactions are listed in
below:
• The Gibbs free energy changes (DrGhm) for each sub-
reaction in the temperature range of 200–1000 �C were
calculated as following (1)–(5):
DrHhmð298:15 KÞ ¼
XDf H
hmð298:15 KÞP
�X
Df Hhmð298:15 KÞR ð1Þ
DrHhmðTÞ ¼ DrH
hmð298:15 KÞ
þZ T
298:15
XCp;m
� �P�X
Cp;m
� �R
h idT ð2Þ
DrShmð298:15K) ¼
XShmð298:15K)P �
XShmð298:15K)R
ð3Þ
DrShmðTÞ ¼ DrS
hmð298:15K)þ
Z T
298:15
Cp;m
T
� �dT ð4Þ
DrGhmðTÞ ¼ DrH
hmðTÞ � TDrS
hmðTÞ ð5Þ
• The standard equilibrium constant (Kh) of each reaction
at a particular temperature (T) was calculated by
Eq. (6):
KhðTÞ ¼ exp½�DrGhmðTÞ=RT � ð6Þ
In the calculations above, Df Hhm represents the standard
molar enthalpy of formation, Shm stands for the standard
molar entropy, while Cp;m is the parameter of molar heat
capacity at constant pressure. The input information for
each chemical involved are listed in the following Table 1.
DrGhm of each reactions are calculated from DrH
hm and DrS
hm
56 Appl Petrochem Res (2017) 7:55–66
123

at the target temperature. Subscripts (P and R) are used
for ‘product’ and ‘reactant’, respectively. The functions
are based on previous studies in this area [7, 13]. and
have been adjusted to the current study. The calculated
DrHhm, DrG
hm and Kh data are included in the supporting
documents.
The calculations on the thermodynamics of individual
sub reaction are included as the basis work of, and part of
the essential studies referring to the later analysis. For such
calculations, one disadvantage that may concern in the
prediction of real experimental results is that assumptions
have been made that each sub reaction proceeds without
the influence of others, although they may be in a great
certain to proceed in a parallel way in a real MTH system.
At this point, previous studies recalled computer aided
simulations which have integrated all the possible sub
reactions and, therefore, might give a more comprehensive
result [8, 9]. In this work, we have achieved a more com-
prehensive computer-aided (CA) simulation from which
the results have integrated all the possible influences
between different sub reactions, and, therefore, might give
a more indicative result for real industrial applications.
Advantages of such a method base on the ability to solve
chemical system (i.e. MTH system) proceeding in ‘‘black-
box’’ of uncertainty. Notably, in reality it is impossible to
have the MTH reaction finish completely into the form of
cokes; on the contrary, similar to the lab experiments, any
MTH reaction in an industry-scale reactor or pilot instru-
ment would be a non-stopping, products-continuously
being-removed process, and particularly when the product
selectivity obtained by the employed porous zeolites (e.g.
H-ZSM-5) works to affect the yields, the calculations on
single sub reaction do denote important implications for the
product compositions achieved in various conditions.1
Table 1 Standard thermochemical properties of concerned substances, the relevant data are from classic physical chemistry hand books [14–16]
Substance Df Hhmð298:15KÞ
KJ/mol
Shmð298:15K)KJ/mol
Cm,p/R = A ? BT ? CT2 ? DT3 ? ET4
A B 9 103 C 9 105 D 9 108 E 9 1011
CH3OH -200.10 126.8 4.714 -6.986 4.211 -4.443 1.535
H2 0 130.680 2.883 3.681 -0.772 0.692 -0.213
CH4 -74.6 186.3 4.568 -8.975 3.631 -3.407 1.091
C2H4 52.5 219.3 4.221 -8.782 5.795 -6.729 2.511
C2H6 -84.0 229.1 4.178 -4.427 5.660 -6.651 2.487
C3H6 20 266.6 3.834 3.893 4.688 -6.013 2.283
C3H8 -103.8 270.2 3.847 5.131 6.011 -7.893 3.079
1-C4H8 0.1 305.6 4.389 7.984 6.143 -8.197 3.165
C4H10 butane -125.6 310.1 5.547 5.536 8.057 -10.571 4.134
Benzene 82.6 269.2 3.551 -6.184 14.365 -19.807 8.234
C7H8 50.4 320.7 3.866 3.558 13.356 -18.659 7.690
PX 18.00 352.4 4.113 14.909 11.810 -16.724 6.736
MX 17.3 357.7 4.002 17.537 10.590 -15.037 6.008
OX 19.1 352.8 3.289 34.144 4.989 -8.335 3.338
Ethylbenzene 29.90 360.5 4.544 10.578 13.644 -19.276 7.885
C9-123 -9.50 381.890 4.042 31.152 10.185 -16.262 6.922
C9-124 -13.81 390.158 5.319 20.074 12.034 -16.873 10.465
C9-135 -15.90 377.761 5.305 20.039 11.606 -16.317 6.852
All data refer to 298.15 K and 1 bar pressure. R is ideal gas constant [8.314472 J/(K mol)]
1 We note other researchers may question on how the thermodynamic
calculations on single sub reactions could be more illustrative to a real
situation in a pilot plant or in an industry scale reactor where parallel
reactions do happen and interactions between different reactions are
unavoidable. Despite those interactions between sub reactions are
neglected in such calculation on single sub reaction, the results,
without the interference from others, do better illustrate the intrinsic
chemistry of a sub reaction. The data may be obtained more
theoretically; however, they are still very allusive for the real MTH
applications in industry, where we will observe a non-stopping,
hydrocarbons (i.e. gas olefins, and liquid aromatics) rich product yield
rather than the only coke formation which is the final result of
unadjusted computer-aided simulations (these simulations do have
considered all the possible sub reactions, or, as they base on the Gibbs
energy minimization the concerns on interactions between sub
reactions are no longer a problem). Here we comment that all the
thermodynamic methods are employed to reference to the real
observations, and their utility should be based on the observations
from real reactions, no matter in laboratory or industrial scale, there
are non-stopping, coking avoiding processes, where the focus on
single, undisturbed sub reaction, e.g. methanol ? C2, is very
indicative.
Appl Petrochem Res (2017) 7:55–66 57
123

Computer-aided simulations for three reactions
of different conditions
Equilibrium compositions of product mixture in the tem-
perature range of 200–1000 �C are simulated for reactions
under different reaction conditions for comparison with the
lab test results. The simulations were employed by ASPEN
Plus process simulation with the RGibbs model. The
computer-aided simulation possesses many advantages
when applied to a complex system in which multiple
reactions processing in a parallel way, and the minimum
reaction Gibbs free energy calculation has overcome the
difficulty caused by the un-certained reaction routes and
the interferences between different sub reactions [9, 10].
One unique important difference between the results of
computer-aided (CA) simulation and the real lab-experi-
ments is the extent of reaction process that might be taken
into the calculation. Beyond all doubts, the CA simulation
has been based on the assumption that the reaction has
finally reached to the ‘extreme’ equilibrium; for instance,
the methanol conversion happens in a close system for a
termless period, thus, the layout of the results somehow
reflect an ‘ideal’ product distribution which may never
occur in reality. On the contrary, the lab tested results and
even the real industrial plant outputs are obtained from a
‘non-stoping’, and continuos flow system. It is nearly
impossible to have the whole system to reach a ‘final’
status (all cokes in this case), although some coking posi-
tions might have reached a close status. In our study, coke
formation was not involved for results close to a ‘pro-
cessing’ product output; however, it was found even CO,
CO2 were predominant in the simulated product composi-
tion, and this is similar to the case that coke is involved
(Fig. S1). Obviously, the selectivity of our catalysts and the
limited dwell time of primary products in the catalyst
system gives a very small chance for CO and CO2 to occur
in the final product yield. The process simulation results
without CO and CO2 show closer to the real lab observa-
tions (Fig. S2), but the product distribution is limited to
aromatics mainly. These problems in thermodynamic
analysis, caused by extremely thermostable, but un-desir-
able products occurred in previous studies, and a rational
solution normally prefer to ignore them in the calculations,
for results better referenced to real lab observations [9, 10].
Our optimized simulation targets on the yield of major
gas olefinic products (MTO) and aromatics (MTA) from
MTH reactions in a ZSM-5 catalyst system. Former study
obtained results closer to real experimental data when
employed analogous methods [9]. However, our assump-
tion is based on the ‘hydrocarbon-pool’ cycle, which has
been considered as the origin of series of MTH reactions
and gives C2–C4 olefins and methyl-aromatics as the pri-
mary products [4]. Further consideration is given to the fact
that latter stage hydrogen transfer may convert these pri-
mary products into either saturated hydrocarbons (alkanes)
or graphite species (deeply dehydrogenated cokes), and
these intra-conversions indeed play an important role in
deciding the following catalytic process, and the final
product yields [3, 4, 11, 12]. This simulation also takes the
advantage that all of these ‘hydrocarbon-pool’ primary
products (C2–C4 olefins and C6–C9 aromatics) take a large
portion in the product yield of short time (a few minutes to
several hours) lab reactions and industrial applications
[4, 5].
In the present research, we have simulated 3 individual
MTH reactions of different conditions in a wide tempera-
ture range of 200–1000 �C, and matched them with data
from corresponding lab experiments (at single temperature
points). Figure 1 shows the overall temperature dependent
product distributions of a selected reaction (6 bar pressure,
methanol/N2 = 1:2 in mole), and results of other two
reactions are included in the supplementary (for the three
reactions, simulations with gas alkanes, and CO as well as
CO2 are also included, see Figs. S3–S8).2
The simulated product distributions of different reac-
tions are quite similar, showing a general trend of
increasing selectivity to aromatics as the reaction temper-
ature goes up. The single benzene ring aromatics always
take the largest portion in the product, and methyl-ben-
zenes (Toluene, xylenes and tri-methyl benzenes) reached a
maximum selectivity in the temperature section of
300–400 �C, whereas benzene become predominant in the
product distribution at temperatures of 400 �C and above.
The Fig. 2a–c show part of the products distributions
without data of benzene and toluene, in the most widely
applied methanol conversion temperatures (200–550 �C).It was found methanol concentration in feedstock (reflected
by the ratio to N2) only has limited impacts on the simu-
lation data. The two reactions under atmosphere pressure
exhibit quite close results with tiny difference (Fig. 2b, c).
Notably, higher pressure caused observable shift of maxi-
mum product selectivity from the higher temperature zone
to lower temperatures. An apparent evidence is the maxi-
mum M-xylene (MX) selectivity under 6 bar pressure,
occurs at below 250 �C (Fig. 2a), whereas the corre-
sponding maximum (as reflected by the peak centre in the
figures) under atmosphere pressure occurs at about 275 �C(Fig. 2b, c). Our simulation well supports the real experi-
mental observations that higher pressure and a lower
2 Here the N2 in system do affect the calculations, but, with only the
influence on the system pressures. For the reason to give a more real
simulation to the lab/industrial reactions (the protective and inert
gases are routinely used for pressure-supplier and flow carrier), we
have employed the N2 as an inert content to adjust/balance the system
pressures employed by our CA simulations, notably, N2 will not enter
any chemistry in MTH reaction.
58 Appl Petrochem Res (2017) 7:55–66
123

temperature may benefit the yield of aromatics
[2, 11, 17, 18].
Inhibition of light olefin products has been reflected in the
results (Fig. 3a–c) obtained in each reaction, showing forma-
tion of olefins is not thermodynamically favoured under the
applied conditions. In the temperature range of 300–500 �C,whichwas indicated todonate largeportions ofC2–C4olefins in
the previous researches, [3, 5, 12, 19], ethylene selectivity is
higher than other two olefin types, and shows a gradually
increasing trend. It seems C4H8 (1-butene) is greatly supressed
in each case, as reflected by the observed data. Propylene
selectivity experiencedapeakat about 300 �C,which is slightlyhigher under lower pressure conditions. Notably, all C2–C4
olefins are further suppressed by 6 bar pressure (Fig. 3 a).
Conflictions between the simulated data and real
experimental results
For rational explanations on results from some of our
previous works, a group data showing the product distri-
butions (selectivity) at selected single temperature points
(e.g. 450 �C) were extracted from the simulated results and
listed in the Table 2. Correspondingly, in the Table 3, we
have listed selected data (product yields) from experiments
employing the same thermodynamic conditions as the
simulation. Due to the limitation of equipment, it is hard to
record the time on stream aromatics yield (full line heating
between the reactor and GC helps in previous study, but
has not been applied in this study) [12]; instead, 5 h total
Fig. 1 Distribution of different products, only olefins are included as the C1–C4 product in the simulation (200–1000 �C); 6 bar pressure,
methanol (mol)/N2 (mol) = 1:2, 1-butene, and n-butane
Fig. 2 Product distribution of different products, only olefins are
included as the C1–C4 product in the simulation, benzene and toluene
data (200–500 �C) are not shown; reaction conditions: a 450 �C,6 bar pressure, methanol (mol)/N2 (mol) = 1:2, 1-butene, and n-
butane; b 450 �C atm pressure, methanol (mol)/N2 (mol) = 50:1,
1-butene, and n-butane; c 400 �C atm pressure, methanol (mol)/N2
(mol) = 3:1, 1-butene, and n-butane
Appl Petrochem Res (2017) 7:55–66 59
123

aromatics yields were measured. The major gas product
yields always change in time on stream, therefore, the data
were chosen from the 5 h single time point. In most cases
of our experiments, the amount of major gas products
finally reached a stable and highest level by the end of the
5 h reaction time, thus reflect the best olefin and alkane
yields (see Figs. S9–11).
Simulation in this study was originally designed for the
prediction of experiments and later explanations. Interest-
ingly, the CA simulated results are quite different from the
real experimental data. In each case, aromatics are always
dominant in the simulated product distributions, especially
benzene, reaches up to *70 mol% in the case of 6 bar
pressure, and 450 �C reaction temperature with a methanol
to N2 molar ratio of 1:2. Simulation shows higher pressure
and smaller methanol to N2 ratio both contribute to higher
benzene selectivity, and thus possess hindrance on other
aromatic products and olefins. Toluene is also a favourable
product type by the thermodynamic and takes a large
portion in the simulated data. It seems that methyl groups
on the aromatic ring structure have increased the reaction
difficulty thermodynamically, as product selectivity
decreases apparently from benzene to tri-methyl benzenes;
this exists in the simulated data of all the three reactions.
Another important information from the above simu-
lated data is the extremely poor olefin selectivity (less than
1 mol%) in strong comparison to the aromatics. However,
for the selected three different MTH reactions, gas products
always take a large portion in the real product distribution.
In the reaction under 6 bar, and with a lower methanol
conversion duty (WHSV = 1.5 h-1), aromatics yield has
been promoted, but gas olefins and alkanes are still the
major products. Observed yields of ethylene and propylene
lie on a relatively low level, but still contribute to a total
3.77 mol% in the product distribution. Reactions under
atmosphere pressure donate much higher level of olefins,
although other conditions are different in the selected two
reactions. Notably, higher methanol to carrier gas (N2)
ratio may also contribute to the improved olefins yield, as
shown in the simulated results of two atmosphere pressure
reactions, with methanol to N2 ratio of 50:1 and 3:1,
respectively. It is supposed that pressure is still the main
reason for the totally different aromatic and olefin product
distributions in each case, which is also supported by series
of previous studies [1, 3–5, 19].
Simulations and calculations vs. limited dwelling
time
Questions come from the huge difference in selectivity to
gas olefins and aromatics between the simulated data and
results from real MTH experiments. Obviously, the ther-
modynamic data are based on a perfect equilibrium status
which may require an extremely long term reaction. Nev-
ertheless, such a termless reaction, processing automati-
cally, never occurs in both lab experiments and industrial
applications, and it is nearly impossible to let MTH reaction
be completely finished in a perfect status. The real reaction
normally employs catalysts to promote certain steps, or
some sub-directions of the whole reaction. Despite that the
Fig. 3 Mole fractions of major olefin products, only olefins are
included as the C1–C4 product in the simulation (300–500 �C);reaction conditions: a 450 �C, 6 bar pressure, methanol (mol)/N2
(mol) = 1:2, 1-butene, and n-butane; b 450 �C atm pressure,
methanol (mol)/N2 (mol) = 50:1, 1-butene, and n-butane; c 400 �Catm pressure, methanol (mol)/N2 (mol) = 3:1, 1-butene, and n-butane
Table 2 Major products yield (mol%) of various conditions, only aromatics and gas olefins are considered in the products
Conditions Benzene C7H8 PX MX OX EB C9123 C9124 C9135 C2H4 C3H6 C4H8
6 bar, 450 �C, 1:2 69.51 26.17 0.75 1.86 0.90 0.33 0.01 0.11 0.04 0.26 0.07 0.001
Atm, 450 �C, 50:1 53.33 36.10 1.86 4.60 2.20 0.78 0.04 0.48 0.17 0.28 0.14 0.004
Atm, 400 �C, 3:1 43.09 40.60 2.89 7.20 3.34 1.07 0.08 1.02 0.36 0.20 0.14 0.005
60 Appl Petrochem Res (2017) 7:55–66
123

final equilibrium will never be disrupted by the catalyst, the
reaction routes can be changed, and the product distribution
in output are, therefore, totally different from the thermo-
dynamic favoured answer, especially when the reaction
time is limited. Here the limited reaction time means a short
dwelling time of the processing products in the system,
which cannot be converted to the final form before being
transported to the outside environment. This is the reason
why benzene is not allowed to be dominant in the real
reaction products, although it is greatly thermodynamically
favoured by the equilibrium. It also helps in understanding
of the much higher olefin yields, which may not be chosen
by the thermodynamic conditions, but play an important
role as intermediate products. Conflictions lying between
the simulation data and experimental records, therefore,
have highlighted the importance of reaction routes which
decide the product yield from the system in a parallel way
with the thermodynamics in the case that the reaction can-
not be ‘completely finished’ thermodynamically, and actu-
ally, they indeed have some more influences on product
selectivity when the reaction time is limited.3
In the hydrocarbon pool mechanism, if alkylation steps
on benzene ring are considered as the ‘starting point’ of
series reactions, the following steps would be the corre-
sponding ‘de-alkylation’ during which the alkyl groups on
the benzene ring structure are eliminated, released to the
reaction system in terms of the primary light olefins [12].
These light olefins may be converted into alkanes, or form
more aromatics via the aromatization steps in the later
stages. It is supposed that in practical laboratory tests and
industrial manufactures, olefin products are transported
quickly to the outside environment, and present in the
yields, thus have limited chance to be converted into aro-
matics. On the other hand, some portions of the primary
olefins are converted into aromatics, with higher pressure
putting a positive effect on this process. The thermody-
namic simulation is closer to the case that the system is
isolated with endless reaction time towards a perfect
equilibrium. In the case that coke formation is selectively
ignored (the formed aromatics are not further converted
into the graphitic cokes), the alkylation step is first forced
to be interrupted, as no methyl group from methanol is
supplied. However, de-alkylation may not stop immedi-
ately, and more light olefins are released from the alkyl
benzenes, then, converted into more aromatics in the later
stage. As no methyl group is supplied from outside of the
system, the aromatization of light hydrocarbons would stop
at the benzene ring structure. As a result, benzene finally
becomes predominant in the system and methyl aromatics
have less methyl groups have more chances to exist in the
final product. When the hydrocarbon pool mechanism is
introduced for explanations on reaction route, the thermo-
dynamic simulation data and real experimental results
could be better matched.
Table 3 Major product yields (mol %) from selected MTH experiments, aromatics were collected after 5 h reaction showing the total yield of
the reaction period, gas product yields were measured at the 5 h time point on stream, conditions of each reaction were listed in the table
Reactions and conditions Benzene C7H8 PX and
MX
OX EB C9 C2H4 C2H6 C3H6 C3H8
6 bar, 450 �C, 1:2, nano H-ZSM-5 (Si/Al = 60),
WHSV = 1.5 h-13.36 14.42 16.16 4.40 2.35 7.13 1.28 2.82 2.49 17.50
Atm, 450 �C, 50:1, nano H-ZSM-5, (Si/Al = 60),
WHSV = 8 h-11.39 9.54 13.57 4.00 0.82 2.73 29.81 2.21 16.54 44.62
Atm, 400 �C, 3:1, industrial H-ZSM-5, (Si/Al = 25),
WHSV = 2 h-11.50 4.24 6.26 1.86 1.067 3.25 9.78 6.94 15.71 7.81
3 Here the reaction time, in terms of product dwelling time in the
system is highlighted. Questions may come from that the changes of
reaction flowrate or product shape selectivity (this affect the mass-
transfer in reaction therefore will change the efficiency of transporta-
tion for different products) could affect the product yields, thus, how
the thermodynamic simulations be more indicative in such cases. Our
comments are based on series of observed MTH reaction results
obtained over different zeoltypes. The flowrate does affect the
reaction time, and an over-accelerated methanol injection rate will
definitely lead to a rapid coking of the catalyst, where the ideal
thermodynamics could be achieved when all the chemicals in the
MTH system (catalysts are not included) are converted into the cokes.
In our simulation we have considered the domination of coking, and
have selectively neglected this pathway for a better, closer results to
real non-stopping reactions. One limitation would be lacking of the
difference between different flowrates applied to a MTH system; in
this case, as the product types are confirmed, the flowrate will no
longer work on the product yields (the dwelling time will only decide
the potential product types, e.g. the endless reaction will result in
cokes only), as the thermodynamics are not affected.
As the MTH proceeds over zeolites of selective porous properties,
the variation in zeotypes do affect the real product yields by
influences on product/intermediate mass transfers. A good example is
Footnote 3 continued
routinely product with larger than zeolite pore sizes are impossible to
be formed. However, such influence will not affect the results in
thermodynamic simulations of selected products.
In fact, ahead of deciding the target products for simulations, the
flowrate and shape selectivity issues, which affect the selection of
products for research, have been considered already.
Appl Petrochem Res (2017) 7:55–66 61
123

On the other hand, the limited dwelling time further
reduces the chance of the intra-conversions (H2 transfers)
between the primary products which have been considered
to possess unique impacts on the final product distributions
[3, 4]. Accordingly, the selectivity to a single product may
more depend on a ‘straight reaction route’. Our initial
calculations on Gibbs free energy change indicate the
thermodynamic barrier for different individual product
formations directly from methanol (Fig. 4). These calcu-
lations have simplified the reaction by supposing only one
target product is formed with only methanol and ignored
product interactions. All the DrGhm of different reactions are
less than 0 in the temperature range from 200 to 600 �C,which indicate that all the reactions are spontaneously in
these temperature. The process simulation has considered
all the reaction types including the interactions between
different products (e.g. the transformation between differ-
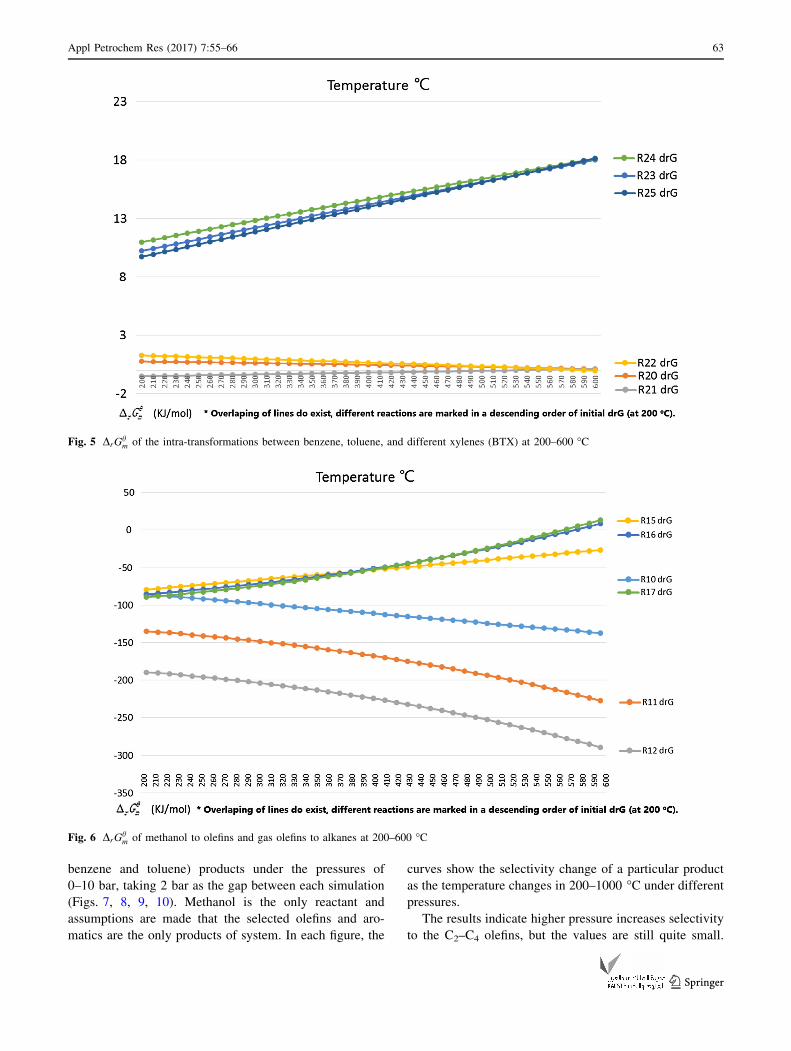
ent aromatics in Fig. 5).
The shape selectivity of different porous catalysts
should also be considered. In a real MTH reaction over
zeolite catalyst, e.g. H-ZSM-5, the product yield pos-
sesses large portion of gas olefins and alkanes, although
they are greatly suppressed in the thermodynamic sim-
ulations. The channel diameter of ZSM-5 zeolite is close
to the molecule size of single benzene ring aromatics,
[4], thus limits the formation of larger aromatics. This
also gives more opportunities for light molecules such as
C2–C4 olefins to escape from the system in priority, and
reduces the chance to be converted into aromatics. Gibbs
free energy calculations on individual sub reactions
show that methanol to olefins is thermodynamically
favoured when each of the 25 sub reactions is isolated,
in which case propylene and butane are easier to be
formed than ethylene. When each sub reaction is iso-
lated, the transformation of olefins to corresponding
alkanes is also thermodynamically promoted, but grad-
ually becomes inhibited at higher temperatures.
Assumptions are made that the shape selectivity of
zeolite allows selected reactions (e.g. methanol to ole-
fins) to be more isolated. The related results are shown
in the Fig. 6.
Reaction pressure vs. product selectivity
In the above discussions, all reactions employed a fixed
pressure. By comparing simulations under 6 bar and
atmosphere pressure (Figs. 2, 3) we noted higher pressure
may benefit to the formation of aromatics while put sup-
pressions on the olefins generation. When the reaction
temperature is fixed, the influence of reaction pressure
becomes more apparent, in both simulation data (Table 2)
and experimental results (Table 3). Therefore, we have
simulated the MTH reaction equilibrium selectivities of
important olefins (ethylene, propylene and butylene) and
aromatics (PX, MX, and OX; 123-trimethyl-benzene,
124-trimethyl-benzene and 135-trimethyl-benzene:
Fig. 4 DrGhm of methanol to benzene, toluene, ethyl-benzene, different xylenes and tri-methylbenzenes at 200–600 �C
62 Appl Petrochem Res (2017) 7:55–66
123
benzene and toluene) products under the pressures of
0–10 bar, taking 2 bar as the gap between each simulation
(Figs. 7, 8, 9, 10). Methanol is the only reactant and
assumptions are made that the selected olefins and aro-
matics are the only products of system. In each figure, the
curves show the selectivity change of a particular product
as the temperature changes in 200–1000 �C under different
pressures.
The results indicate higher pressure increases selectivity
to the C2–C4 olefins, but the values are still quite small.
Fig. 5 DrGhm of the intra-transformations between benzene, toluene, and different xylenes (BTX) at 200–600 �C
Fig. 6 DrGhm of methanol to olefins and gas olefins to alkanes at 200–600 �C
Appl Petrochem Res (2017) 7:55–66 63
123

Fig. 7 Simulated equilibrium selectivity (mole fractions) of ethylene (a), propylene (b) and butylene (c) at varies pressures (200–1000 �C), inthe case that only olefins are included in major gas hydrocarbons, only methanol is injected into the system, without N2
Fig. 8 Simulated equilibrium selectivity (mole fractions) of P-xylene (a), M-xylene (b) and O xylene (c) at varies pressures (200–1000 �C), inthe case that only olefins are included in major gas hydrocarbons, only methanol is injected into the system, without N2
Fig. 9 Simulated equilibrium selectivity (mole fractions) of 1,2,3-
trimethyl-benzene (a), 124-trimethyl-benzene (b) and 135-trimethyl-
benzene (c) at varies pressures (200–1000 �C), in the case that only
olefins are included in major gas hydrocarbons, only methanol is
injected into the system, without N2
Fig. 10 Simulated equilibrium
selectivity (mole fractions) of
benzene (a) and toluene (b) atvaries pressures (200–1000 �C),in the case that only olefins are
included in major gas
hydrocarbons, only methanol is
injected into the system, without
N2
64 Appl Petrochem Res (2017) 7:55–66
123

Under each pressure, ethylene selectivity goes up with the
temperature while butylene drops in a dramatic trend and
nearly disappears at temperatures of 600 �C and higher. On
the other hand, propylene selectivity experienced a maxi-
mum at 300-500 �C, and higher pressure obviously shifts
this maximum from lower temperatures to higher. For
xylenes, their selectivity also experienced a maximum as
shown by the peak in the temperature range of 200–450 �C.Interestingly, higher pressure does not promote higher
selectivity to them, but just shift the maximum selectivity
to higher temperatures. This is also the case for toluene.
For tri-methyl benzenes, they do have higher selectivity
when pressure goes up, but the general trend is, the
selectivity drops rapidly as the temperature increases under
a particular pressure. Similar to the early simulations,
benzene always takes the largest portion in the product, its
selectivity increases dramatically with the temperature,
higher pressure just makes the maximum present earlier.
The above simulation results are closer to the real MTH
reactions proceeding in time-on-stream, although the olefin
selectivity is still tiny. Simulations considered alkanes, as
well as CO and CO2 are also included in the supplementary
data. Again, the results show either only aromatics or CO
and CO2 are predominant in the products.
Conclusions
In this work, we started with the discussions on MTH
mechanism. Then, 25 sub reactions were selected to
represent the complex reaction system, and employed in
the calculation of DrHhm,DrG
hm and Kh, taking the
assumptions that each sub reaction proceeds individually.
Considering that in real experiments all sub reactions
(including the un-predicted pathways) are in a great cer-
tain to proceed in a parallel way where the interactions
between different products cannot be ignored, process
simulations with Aspen Plus were applied. To make a
comparison, 3 real experiments were employed. The
confliction between thermodynamic simulations and real
experiment results are ascribed to the limited dwelling
time of products in the MTH system, which is the truth in
laboratory experiments and industrial applications. The
thermodynamically favoured, more stable products, e.g.
cokes, require termless reaction time, which is not
achievable in time-on-stream. It has been noted that when
cokes, CO, CO2 and gas alkanes are ignored, the simu-
lated results are closer to what have been observed in a
real time-on-stream MTH reaction. In the selected three
examples, it was found pressure possess important influ-
ences on the selectivity to major MTH products. Later
simulations have examined the MTH product equilibrium
selectivity at different temperatures (200–1000 �C) under
a variety of pressures (0–10 bar, with 2 bar as gap).
Again, when selected olefins and aromatics are employed
as the only MTH products, the simulations could be better
referenced to the real experimental observations, with
higher pressures were found to promote the aromatic
formation. Interestingly, we note thermodynamic calcu-
lations (calculated DrGhm) on single sub reactions also help
on the understanding of MTH product selectivity, partic-
ularly when the zeolite shape selectivity works in the
reactions.
MTH process lies on a complexity of multiple (more
than 20) sub reactions, yet the mechanism has not been
completely confirmed. In this work, selective simplifying
reaction product by focusing on olefins and aromatics was
noted to better help on the prediction of real time-on-
stream observations. This is an optimized solution when
considering the limited product dwelling time. Both ther-
modynamic calculations on single sub reactions and inte-
grated simulations, when compared with real experimental
data, have supported our suggestions.
Our discussions have focused on the major olefin and
aromatic products in MTH reaction as part of the onerous
simulations.
Experimental
Zeolite catalysts are imported from Lianxin Chemical Co.
Ltd (CN), the nano H-ZSM-5 zeolites are in rod shape,
with diameters of 100–300 nm. The industrial ZSM-5
sample is in micro size, and of 1–2.5 lm in particle size.
The conditions of each experiment are listed in the Table 2.
In reaction 1, 20 g of catalysts were loaded for an amplified
lab experiment. The reactions 2 and 3 employed 1 g cat-
alyst each time. The catalyst tests employed a fixed bed
reactor system, connected with gas chromatography system
(online GC, off line GC/MS). Catalyst sample powders
were loaded in the middle of the tubular reactor, supported
by silica sand (Fisher, 24 grit). Methanol (Sigma, reagent
standard) was injected by a HPLC pump, and preheated in
the preheater at 150 �C to fully vaporize into gas phase. N2
was used as carrier gas to bring the vaporized methanol
into reactor. The gas and liquid products were well sepa-
rated at the end of the system (cool water condenser used).
Gas products were analysed with Shimadzu GC-2010SE
GC system (RESTEK MXT-1HT column). The data were
obtained from thermal conductivity detector (TCD) for
non-hydrocarbons and flame ionized detector (FID) for
hydrocarbons every 30 min after the methanol injection
started. Liquid products were collected after the reaction
and separated into water and oil phases. Each phase was
analysed with Shimadzu GCMS-QP2010 Ultra High-end
GC–MS system (SHIM-5MS column, Flame Ionized
Appl Petrochem Res (2017) 7:55–66 65
123
Detector).The catalyst testing system, and the tubular
design are shown in the Fig. S12. The methanol conversion
was determined by the amount of methanol remaining in
the liquid product (both oil and water phases). Upon the
current instrumental efficiency, and a requirement on
continuous analysis of gas output every 30 min, our
research focuses on the TOS yield of major gas products
including methane, ethane, ethylene, propane, propylene
and a total C4. The value (mol%) was calculated by com-
paring the instantaneous gas production with methanol
injection rate. The corresponding yield to major liquid
aromatics obtained after 5 h reaction, including benzene,
toluene, and xylenes (BTX) as well as tri-methyl benzene
was calculated from methanol consumption of selected
products and total methanol injected. The definitions below
are based on previous researches and modified to this
research [19, 20].
Acknowledgements The authors would like to sincerely thank to
other members of the PPE group at Oxford, and our colleagues of
KACST at Saudi. For the excellent scalling-up design, we would like
to give our applause to the Lianxin Chemistry Co. Ltd, and their
consultancy in industrial implementations.
Open Access This article is distributed under the terms of the
Creative Commons Attribution 4.0 International License (http://
creativecommons.org/licenses/by/4.0/), which permits unrestricted
use, distribution, and reproduction in any medium, provided you give
appropriate credit to the original author(s) and the source, provide a
link to the Creative Commons license, and indicate if changes were
made.
References
1. Dahl IM, Kolboe S (1994) On the reaction-mechanism for
hydrocarbon formation from methanol over sapo-34.1. Isotopic
labeling studies of the co-reaction of ethene and methanol. J Catal
149(2):458–464
2. Arstad B, Nicholas JB, Haw JF (2004) Theoretical study of the
methylbenzene side-chain hydrocarbon pool mechanism in
methanol to olefin catalysis. J Am Chem Soc 126(9):2991–3001
3. Ilias S, Bhan A (2013) Mechanism of the catalytic conversion of
methanol to hydrocarbons. ACS Catalysis 3(1):18–31
4. Olsbye U et al (2012) Conversion of methanol to hydrocarbons:
how zeolite cavity and pore size controls product selectivity.
Angew Chem Int Ed. 51(Copyright (C) 2013 American Chemical
Society (ACS). All Rights Reserved), pp 5810–5831
5. Stocker M (1999) Methanol-to-hydrocarbons: catalytic materials
and their behavior. Microporous Mesoporous Mater
29(1–2):3–48
6. Guisnet M, Ribeiro RF (2011) Deactivation and regeneration of
zeolite catalysts. Catalytic Science Series, ed. H.G. J., vol 9.
Imperial College Press, London, p 340
7. Zhang G et al (2013) Aromatization of methanol I. Reaction
thermodynamics. Shiyou Huagong 42(2):141–145
8. Zhang B-Z et al (2012) Thermodynamic study on methanol
conversion to hydrocarbons (MTH). Fenzi Cuihua 26(6):546–553
9. Gunawardena DA, Fernando SD (2012) Thermodynamic equi-
librium analysis of methanol conversion to hydrocarbons using
Cantera methodology. J Thermodyn 125460:7
10. Spivey JJ, Hutchings G (2014) Catalytic aromatization of
methane. Chem Soc Rev 43(3):792–803
11. Haw JF et al (2003) The mechanism of methanol to hydrocarbon
catalysis. Acc Chem Res 36(5):317–326
12. Bjorgen M et al (2007) Conversion of methanol to hydrocarbons
over zeolite H-ZSM-5: on the origin of the olefinic species.
J Catal 249(2):195–207
13. Du X et al (2015) FDCDU15—catalytic dehydrogenation of
propane by carbon dioxide : a medium-temperature thermo-
chemical process for carbon dioxide utilisation. Faraday
Discussions
14. Bruce E, Poling, JM (2000) The properties of gases and liquids.
5th edn. McGraw Hill, New York
15. Michael Frenkel GJK, Marsh KN, Roganov GN, Wilhoit RC
(1994) Thermodynamics of organic compounds in the gas state,
vol I. Thermodynamics Research Center (TRC), Texas USA
16. Speight JG (2005) Lange’s handbook of chemistry. 70th
Anniversary Edition ed. Mc-Graw Hill, New York, p 4192
17. Novakova J et al (1984) Catalytic activity of dealuminated Y and
HZSM-5 zeolites measured by the temperature-programmed
desorption of small amounts of preadsorbed methanol and by the
low-pressure flow reaction of methanol. J Chem Soc Faraday
Trans 1 Phys Chem Condens Phases 80(6):1457–1465
18. Chang C, Lang W, Smith R (1979) The conversion of methanol
and other O-compounds to hydrocarbons over zeolite catalysts:
II. Pressure effects. J Catal 56(2):169–173
19. Hereijgers BPC et al (2009) Product shape selectivity dominates
the Methanol-to-Olefins (MTO) reaction over H-SAPO-34 cata-
lysts. J Catal 264(1):77–87
20. Mei C et al (2008) Selective production of propylene from
methanol: mesoporosity development in high silica HZSM-5.
J Catal 258(1):243–249
66 Appl Petrochem Res (2017) 7:55–66
123