a retail real estate company - ggp investor...
TRANSCRIPT

INVESTOR PRESENTATIONMARCH 2017
A R E T A I L R E A L E S T A T E C O M P A N Y
GLENDALE GALLERIA ALA MOANA CENTER
FASHION SHOWSOUTHWEST PLAZA WILLOWBROOK (NJ)

2
OVERVIEW
a) As of December 31, 2016.
MISSION STATEMENTOwn and operate best-in-class retail properties that provide an outstanding environment and
experience for our Communities, Retailers, Employees, Consumers and Shareholders.
CORE VALUES
• H – Humility
• A – Attitude
• D – Do The Right Thing
• T – Together
• O – Own It
Picture
S&P 500 REAL ESTATE INVESTMENT TRUST (a)
Headquarters Chicago
Retail Properties 127
States 40
Inline & Freestanding GLATotal Retail GLA
56 million121 million
Equity Market CapEnterprise Value
$22 billion$40 billion
WATER TOWER PLACE PIONEER PLACE PARK MEADOWS OAKBROOK CENTER

Sandeep Mathrani, Chief Executive Officer
Michael Berman, Executive Vice President and Chief Financial Officer
Shobi Khan, President and Chief Operating Officer
Alan Barocas, Senior Executive Vice President, Leasing
Richard Pesin, Executive Vice President, Anchors, Development and Construction
Marvin Levine, Executive Vice President and Chief Legal Officer
Brian McCarthyExecutive Vice President, Asset Management
Julie Knudson, Senior Vice President and Chief Human Resources Officer
EXECUTIVE TEAM
Tara Marszewski, Senior Vice President, Chief Accounting Officer
3

IRREPLACEABLE RETAIL REAL ESTATE IN THE U.S.
4a) Retail properties ranked by trailing 12 months NOI ending December 31, 2016. Table excludes Christiana Mall. b) Sales per square foot for trailing 12 months ended December 31, 2016 for comparable tenants occupying space less than 10,000 square feet.c) Company NOI for 2016
Sales and NOI Contribution(a)
Top Retail Properties Sales PSF <10K SF(b) % of Company NOI(c)
Top 10 $835 24%
Top 30 $737 51%
Top 50 $664 69%
Top 100 $582 96%
GGP owns 100 of the top 500 regional shopping centers in the U.S.

Mid to Low QualityRetail Real Estate6.3 Billion SF19.7 SF Per Capita
High Quality Retail Real Estate1.2 Billion SF3.9 SF Per Capita
High QualityOpen-Air Centers
High QualityRegional
Shopping Centers
a) “High Quality” represents malls rated B+ or better by Green Street Advisors.b) “High Quality” represents strip centers rated with a Trade Area Power score of 75-100 by Green Street Advisors.
GLA (in millions) SF Per Capita % of Total
High Quality GLA
High Quality(a) Regional Shopping Centers 495 1.6 40%
High Quality(b) Open-Air Centers 732 2.3 60%
Total 1,227 3.9 100%
Type Quality
HIGH QUALITY RETAIL PROPERTIES TOTAL U.S. RETAIL REAL ESTATE GLA
GGP controls 8.2% of all High Quality
Retail Real Estate
Open-Air Centers6.4 Billion SF
20.2 SF Per Capita
Regional Shopping Centers
1.1 Billion SF3.4 SF Per Capita
5

THE U.S. IS OVER RETAILED
6a) ICSC Country Fact Sheets.b) At Current” is the average center sales per square foot data from Green Street Advisors, while “Assuming Reduction of GLA by 25%” removes 25% of lowest quality centers by
productivity and redistributes sales to remaining centers.
U.S. has the highest GLA per capita by far among all developed countries
24
16
11
5 4 3 2
$14,614
$10,953
$9,239
$6,495
$8,437
$3,282
$6,323
0
5
10
15
20
25
30
U.S. Canada Australia U.K. France China Germany$0
$2,000
$4,000
$6,000
$8,000
$10,000
$12,000
$14,000
$16,000
RETAIL REAL ESTATE GLA AND SALES PER CAPITA
Retail SF per Capita Retail Sales per Capita (in U.S. Dollars)
RET
AIL
SF
PER
CA
PITA
RET
AIL
SA
LES
PER
CA
PITA
Average Center Sales/SF
At Current $493
Assuming Reduction of GLA by 25% $602
U.S. Regional Shopping Center Productivity
(a)
(b)

CHANGING THE VOCABULARYRETAIL REAL ESTATE
RETAIL REAL
ESTATE
Restaurants
Entertainment
Sources of Demand
Services
Grocery
7
Retailers, restaurants and entertainment venues are property type agnostic and want to be in high quality retail locations that attract heavy traffic.

CHANGING THE VOCABULARY RETAIL REAL ESTATE
8
57%55%
49%
54%
Bowling Alley Spa Grocery Store Brewery
% OF CUSTOMERS WHO WOULD LIKE TO SEERETAIL TYPE IN A REGIONAL SHOPPING CENTER
Source: GGP Strategy & Analytics, 2017. Sample Size= 14,000
GGP is adding these new uses to centers
Shoppers want to see new uses at regional shopping centers

HIGH QUALITY CENTERS DRAW MORE TRAFFIC
Sources: GGP proprietary traffic cameras installed in 95 properties.
AVERAGE WEEKLY TRAFFIC BY MALL GRADEBLACK FRIDAY 2016 – JANUARY 2017
GGP began tracking property-level traffic during the 2016 holiday shopping season.
Within the GGP portfolio, A properties draw 1.6X more shoppers than B+ properties and 2.1X more shoppers than B properties.
9
Average Weekly Traffic by Center GradeBlack Friday 2016- January 2017

24 81 84 48 62 72NUMBER OF
CENTERS
REGIONAL SHOPPING CENTERS DRAW BETWEEN 50% AND 150% MORE MARKET RESIDENTS
(a) Source for visits data is Nielsen Local 2014, 2015Notes: DMAs Used: Atlanta, Boston, Chicago, Dallas, Houston, Los Angeles, New York City, Philadelphia, San Francisco/San Jose, Washington, DC. Excludes Mills and outlet properties
AVERAGE VISITS TO CENTER PER QUARTER (a)
BASED ON RESIDENTS AGE 18+ IN TOP 10 DMAS; CENTER GRADE BY GREEN STREET
Analysis of 371 retail centers covered in Nielsen Local data within the 10 most-populated DMAs in the United States reveals that residents (age 18+) shop regional shopping centers nearly 2 times more often than lifestyle centers or strip centers, depending on the grade of center as determined by Green Street Advisors.
GGP centers within these markets draw approximately 2.5 times the number of residents compared to lifestyle or strip centers on a quarterly basis.
REGIONAL SHOPPING CENTERS OTHER TYPES
LIFESTYLE CENTERS
STRIP CENTERS
C OR LOWERCENTERS
B CENTERSA CENTERSGGP CENTERS
613K
376K
265K 276K238K
695K
GGP
Within the largest U.S. markets, regional shopping centers consistently draw more market residents than other retail property types.
10

11
RETAIL CATEGORY SHARE OF GLA
Cistri/Urbis. Regional data represents centers larger than 300,000 sf.
46%
13%
8%
29%
6%
27%
13%11%
47%
10%
23%
15%13%
36%
6%
17% 17%
11%
45%
15%15%
21%
16%
40%
8%
0%
10%
20%
30%
40%
50%
Department Store Mini Major/Big Box Entertainment &Non-Retail
Specialty Food & Beverage
Retail Category Share of Total GLA
USA UK Australia Asia Middle East
U.S. retail is over-indexed in department stores and under-indexed in entertainment, food & beverage, and big box compared to other regions

CURATION IS KEY TO PERFORMANCE
12
RESTAURANTS PERSONAL CARE
HOME FURNISHINGS
APPAREL
ELECTRONICS
BIG BOX
GROCERY
ENTERTAINMENT
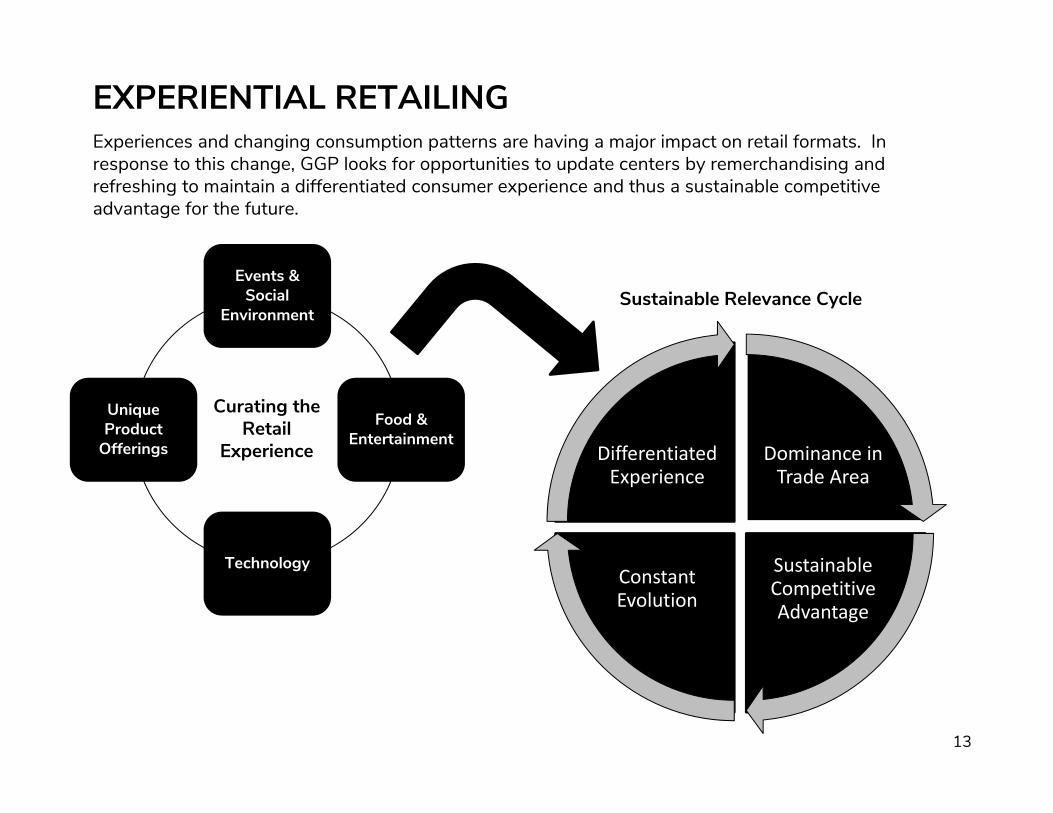
EXPERIENTIAL RETAILING
13
Experiences and changing consumption patterns are having a major impact on retail formats. In response to this change, GGP looks for opportunities to update centers by remerchandising and refreshing to maintain a differentiated consumer experience and thus a sustainable competitive advantage for the future.
Events & Social
Environment
Food & Entertainment
Technology
Unique Product
Offerings
Curating the Retail
Experience Dominance in Trade Area
Sustainable Competitive Advantage
Constant Evolution
Differentiated Experience
Sustainable Relevance Cycle

OAKBROOK CENTER DEVELOPMENT CASE STUDY
Master Renovation (2012 & 2013 & 2014)• Full mall common area space cosmetic update• Construction of three glass box pavilions ideal for
incubating newer retail concepts• Installation of a video screen in the common area for
community events
Building H (2013)• Redevelop Bloomingdale's Home into The Container Store, Pirch,
and inline GLA. • Development Cost: $13.8M• Yield: 11%
Development 2011-2016 Development Results Development Pipeline
14

Neiman Marcus Restaurant Development (2013)• Convert lower level of Neiman Marcus into 2 restaurants,
followed by multi-million dollar interior renovation of Neiman Marcus store.
Hotel (2014)• Ground lease of existing hotel site to new operator for remodel.
Development 2011-2016 Development Results Development Pipeline
OAKBROOK CENTER DEVELOPMENT CASE STUDY
15

Parking Improvements (2016)• Enhance customer experience and path-to-purchase through
parking improvements (aesthetic, architectural, and technological elements).
Theater (2016)• Addition of new theater and food hall along with Building G
common area renovation.
Development 2011-2016 Development Results Development Pipeline
OAKBROOK CENTER DEVELOPMENT CASE STUDY
16

Net value creation of $470M assuming a 3.75% cap rate on incremental NOI
Development 2011-2016 Development Results Development Pipeline
OAKBROOK CENTER DEVELOPMENT CASE STUDY
17
2011 2017 Forecast Total Change % Change
Total Sales $349M $479M $130M 37%
Sales PSF <10K SF $694 $992 $298 43%

Continuing the Evolution of Oakbrook
Sears + Edutainment Provider + Fitness CenterRedevelop Sears box into downsized Sears, inline GLA, and an edutainment provider.
Fitness center concept to replace Sears Auto Center footprint.
Development 2011-2016 Development Results Development Pipeline
OAKBROOK CENTER DEVELOPMENT CASE STUDY
rendering subject to change
18
19
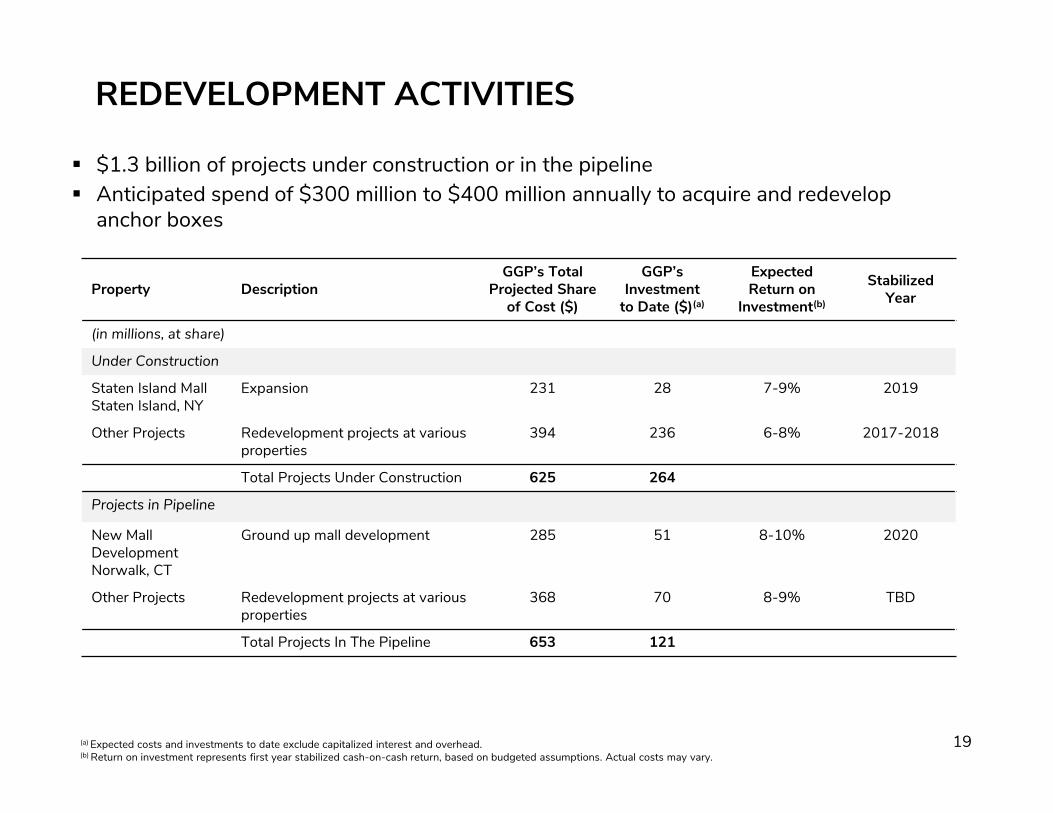
� $1.3 billion of projects under construction or in the pipeline� Anticipated spend of $300 million to $400 million annually to acquire and redevelop
anchor boxes
REDEVELOPMENT ACTIVITIES
(a) Expected costs and investments to date exclude capitalized interest and overhead.(b) Return on investment represents first year stabilized cash-on-cash return, based on budgeted assumptions. Actual costs may vary.
Property DescriptionGGP’s Total
Projected Share of Cost ($)
GGP’s Investment
to Date ($)(a)
Expected Return on
Investment(b)
Stabilized Year
(in millions, at share)
Under Construction
Staten Island MallStaten Island, NY
Expansion 231 28 7-9% 2019
Other Projects Redevelopment projects at various properties
394 236 6-8% 2017-2018
Total Projects Under Construction 625 264
Projects in Pipeline
New Mall DevelopmentNorwalk, CT
Ground up mall development 285 51 8-10% 2020
Other Projects Redevelopment projects at various properties
368 70 8-9% TBD
Total Projects In The Pipeline 653 121
20
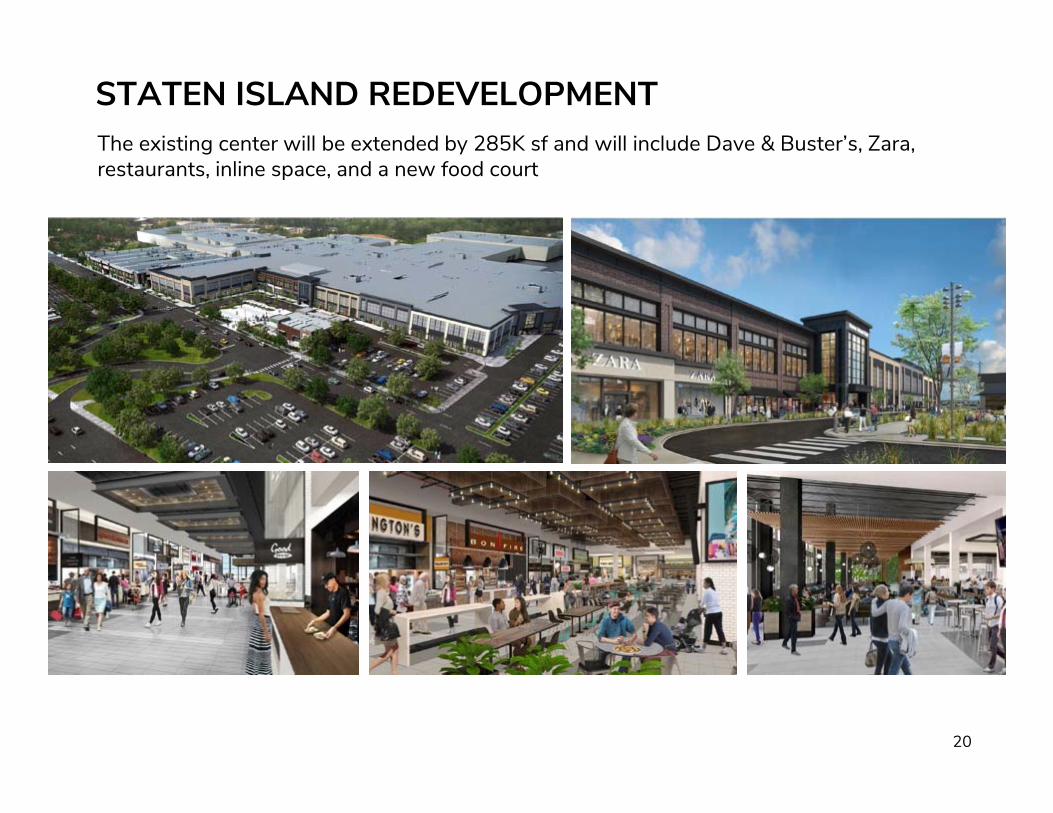
STATEN ISLAND REDEVELOPMENTThe existing center will be extended by 285K sf and will include Dave & Buster’s, Zara, restaurants, inline space, and a new food court

BRICK AND MORTAR CAPTURES 93% OF RETAIL SALES
$151 (3.3%)
$43 (0.9%)
$38 (0.8%)
$23 (0.5%)
$131 (2.8%)
Brick and Mortar Sales
Pure Play E-commerce
Sales
Omnichannel Sales
Non Merchandise Receipts(shipping & handling, auction commissions, and other costs) Mail Order &
E-Commerce Auction Sales
Total Sales (billions)
% of TotalSales
$4,221 89.7% Direct brick and mortar sales
+ $143 3.0%Online sales from retailers with brick and mortar presence (Omnichannel Sales)
$4,364 92.7% Brick and mortar related retail sales
+ $144 3.1% Mail order and e-commerce auction sales
+ $26 0.6%Non-merchandise receipts (including shipping, electronicauction commissions)
+ $173 3.7% Pure-play e-commerce
$4,708 100% Total retail sales
Source: ICSC analysis of 2015 U.S. Census data
Buy Online, Fulfill in Store
Buy Online, Fulfill From Warehouse
21

ONE-CHANNEL GENERATES HIGHER SALES
Source: “Shopping Centers: America’s First and Foremost Marketplace,” ICSC, October 2014.22

E-COMMERCE EXPANSION INTO BRICK AND MORTAR
Bonobos launches online
First Guideshop launches in NYC
30 Guideshops across the U.S.
Warby Parker launches online
6 showrooms launch across
the U.S.
47 Showrooms across the U.S.
30 Kiosks launch in regional shopping centers.
Amazon launches
online
100 Guideshops
across the U.S. by 2020
800-1,000 physical locations
in the future
2011 2013 20161994 2007 2008 2010 2012
Fabletics launches
online
18 locations across the U.S.
Sugarfina launches
online
First locationopens
21 locations across the U.S.
Source
Wall StreeJournal
Wall StreetJournal
Amazon.co
Fabletics.co
Sugarfina.co
23
Athleta opens first flagship location in
San Francisco
Amazon Go announced, and Amazon Books opens 3 locations
Athleta expands to
120 locations
Athleta acquired by Gap
Online and mail order only.
GapInc.com
Amazon to open 5
additional Amazon
Books, for a total of 8.
Sources: Company websites and/or public statements
2017 and Beyond

SUSTAINABILITY
2015 IMPACT AT A GLANCE
Diverted 54,300 tons of waste fromlandfills; enough waste to fill over4,500 garbage trucks.
Reduced water consumption by 64million gallons; enough water to fillalmost 100 Olympic-size swimmingpools.
Top 10 U.S. company by solarcapacity.
Eliminated 23,200 metric tons ofcarbon dioxide equivalents, equal totaking 4,700 cars off U.S. roads.
Upgrades to power saved 44.5million kilowatt hours annually;equal to removing 4,200 homesfrom the electrical grid.
Since 2011, reduced electricityconsumption by 215.8 millionkilowatt hours; enough electricity topower all the homes in Coral Gables,FL for one year.
� Commitment to environmental responsibility
� Awarded the 2015 Green Star and recognized as the North American leader in the Retail – Large Cap Sector by GRESB in 2014
24

GGP’S DIGITAL INITIATIVES
25
PRODUCT SEARCH PARKING
GGP has invested in digital initiatives to solve customer pain points in the shopping process, such as parking and locating desired products.

DEBT PROFILE
26
Overview as of 12/31/2016($ in millions at GGP share)
Fixed Rate $14,759
Variable Rate $3,575
Total Debt $18,335
Remaining Term(a) 5.5 Years
Total Debt / Enterprise Value 45.5%
Net Debt / EBITDA (b) 7.9x
Interest Coverage 2.8x
Debt Maturity Ladder(a)($ in billions at GGP share)
a) Assumes maturity extension options are exercised and approved.b) Refer to page 4 for Company Ebitda, and page 27 for Net Debt in GGP’s Fourth Quarter 2016 Supplemental available at Investor.GGP.com
$0.1$0.5
$2.1$2.8 $3.0
$2.4$1.9 $1.6 $1.7
$0.5 $0.5
2017 2018 2019 2020 2021 2022 2023 2024 2025 2026 2027 +

FORWARD-LOOKING STATEMENTS
Certain statements made in this presentation may be deemed "forward-looking statements" within the meaning of the PrivateSecurities Litigation Reform Act of 1995. Although the Company believes the expectations reflected in any forward-lookingstatement are based on reasonable assumption, it can give no assurance that its expectations will be attained, and it is possiblethat actual results may differ materially from those indicated by these forward-looking statements due to a variety of risks,uncertainties and other factors. Such factors include, but are not limited to, the Company's ability to refinance, extend, restructureor repay near and intermediate term debt, its indebtedness, its ability to raise capital through equity issuances, asset sales or theincurrence of new debt, retail and credit market conditions, impairments, its liquidity demands, and economic conditions. TheCompany discusses these and other risks and uncertainties in its annual and quarterly periodic reports filed with the Securitiesand Exchange Commission. The Company may update that discussion in its periodic reports, but otherwise takes no duty orobligation to update or revise these forward-looking statements, whether as a result of new information, future developments, orotherwise.
Investors and others should note that the Company posts this Investor Presentation on the Investors page of its website atwww.ggp.com. From time to time, the Company updates the Investor Presentation and when it does, it will be posted on theInvestors section of its website at www.ggp.com. It is possible that the updates could include information deemed to be materialinformation. Therefore, the Company encourages investors, the media and others interested in the Company to review theinformation posted on the Investors section of its website at www.ggp.com from time to time.
Michael BermanExecutive Vice President and Chief Financial [email protected]
Kevin BerrySenior Vice PresidentInvestor & Public [email protected]
27
Contact Information:
A R E T A I L R E A L E S T A T E C O M P A N Y