a review of geostats’ efforts with visualization of nhts...
TRANSCRIPT
A Review of GeoStats’ Efforts with Visualization of NHTS Data
Marcelo Simas Oliveira, GeoStats, Atlanta GA

1 Using NHTS Data for Transportation Decision Making
Presentation Outline
Introduction Background GeoStats & Visualization Visualizing NHTS DataR and ggplot2Google Fusion Tables
Final Remarks

2 Using NHTS Data for Transportation Decision Making
GeoStats Background
GeoStats, a women-owned business established in 2000, is a leader and innovator in the development and use of the Global Positioning System (GPS) and Geospatial Systems for the collection, analysis, and reporting of transportation data. GeoStats is located in Atlanta, Georgia – USA
Leader in GPS Household Travel Surveyso Developed processing tools for all modes of GPS travel survey
o Now working on 100% GPS travel surveys (Jerusalem and Cleveland)
Transportation System Performance Physical Activity Studies Technology for transportation data collection
o Software Development

3 Using NHTS Data for Transportation Decision Making
GeoStats & Visualization – GPS Processing
GPS Data => Wealth of datao Strong location component
o Processing uses tools with built in visualization
o Visualization helps to parse through the large volume of data and to deal with the multiple dimensions in the data

4 Using NHTS Data for Transportation Decision Making
GeoStats & Visualization – Google Earth
Example of a combined GPS and accelerometer data

5 Using NHTS Data for Transportation Decision Making
Using NHTS Data
Using only OSS or “free” tools Wanted to use what’s available – so downloaded files from website Downloaded and read documentation
o Made sure I used weights!
Basic set of steps:o First tried to bring in the SAS Transport files directly into R – did not work, resorted to
downloading the CSV files
– Created database schema (set of tables that mapped to the original CSV files)
– Imported file into a database (SQLite)o Wrote queries to bring in and summarize data into R
o Generated charts in R
o Exported data aggregations to CSV for upload to Google Fusion Tables
6 Using NHTS Data for Transportation Decision Making
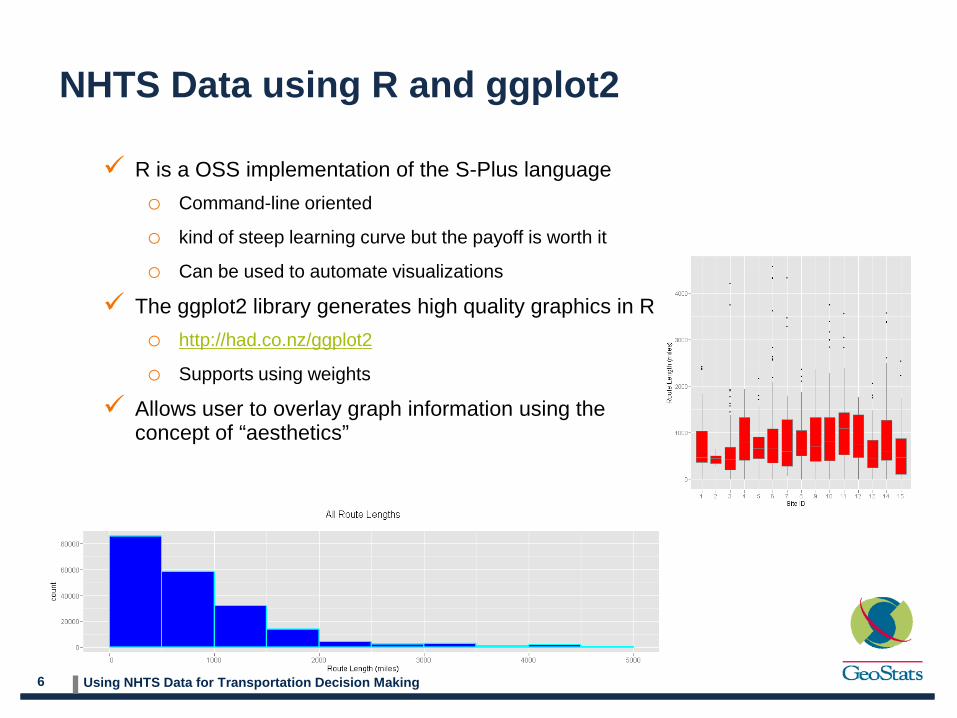
NHTS Data using R and ggplot2
R is a OSS implementation of the S-Plus languageo Command-line oriented
o kind of steep learning curve but the payoff is worth it
o Can be used to automate visualizations
The ggplot2 library generates high quality graphics in R o http://had.co.nz/ggplot2
o Supports using weights
Allows user to overlay graph information using the concept of “aesthetics”
7 Using NHTS Data for Transportation Decision Making
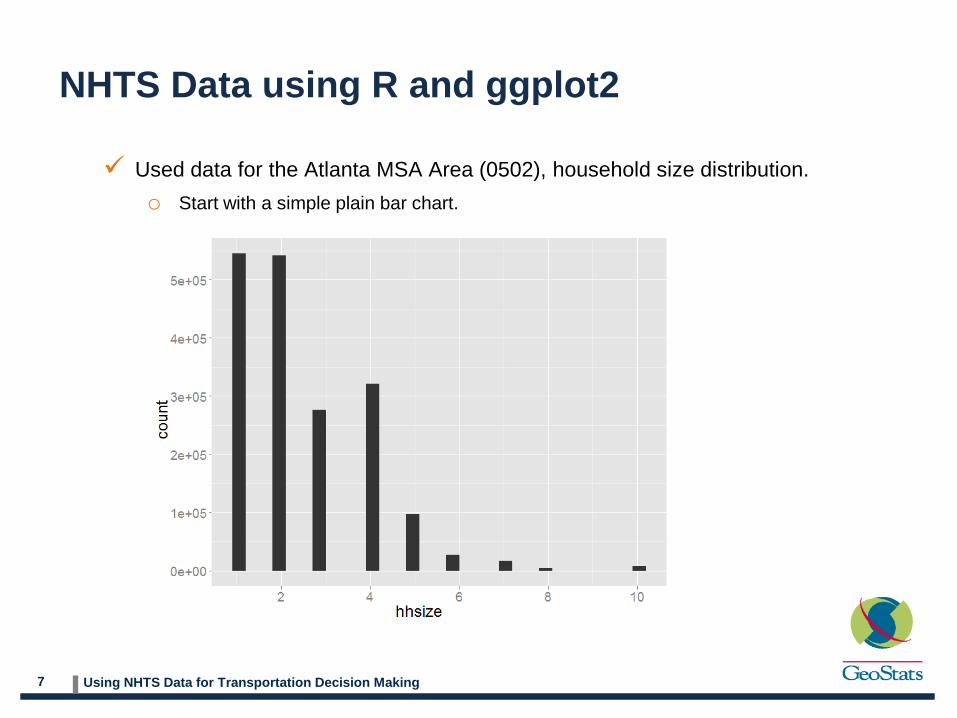
NHTS Data using R and ggplot2
Used data for the Atlanta MSA Area (0502), household size distribution.o Start with a simple plain bar chart.
8 Using NHTS Data for Transportation Decision Making
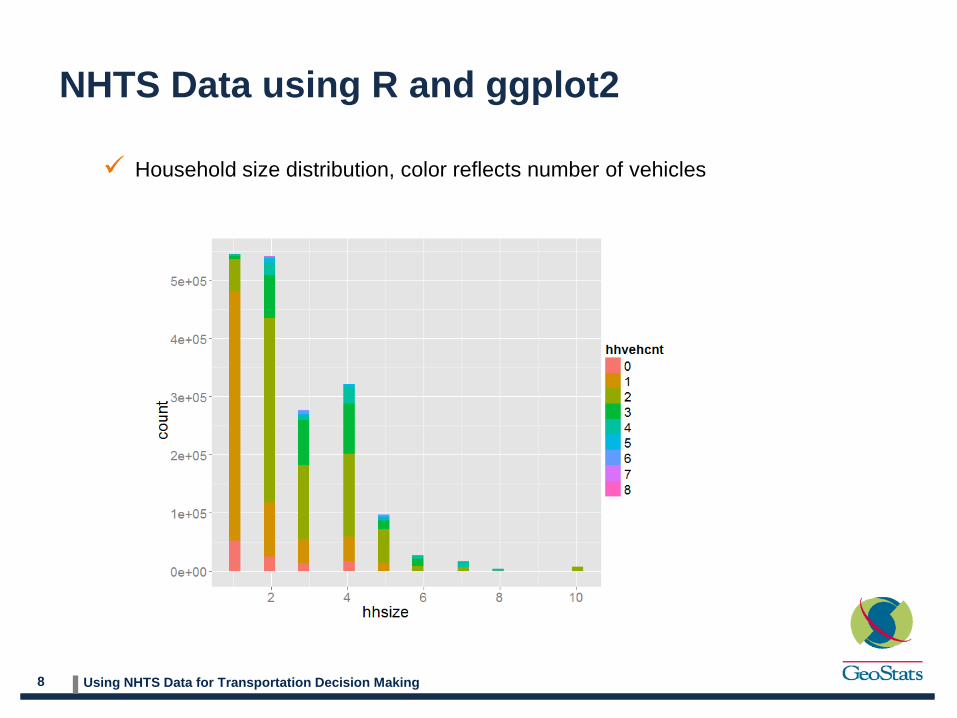
NHTS Data using R and ggplot2
Household size distribution, color reflects number of vehicles

9 Using NHTS Data for Transportation Decision Making
NHTS Data using R and ggplot2
Trip length distribution for trips shorter than 100 miles, removed negative values (codes for missing data)

10 Using NHTS Data for Transportation Decision Making
NHTS Data using R and ggplot2
Trip length distribution for trips shorter than five miles, color reflects gen. purpose
11 Using NHTS Data for Transportation Decision Making
NHTS Data using R and ggplot2
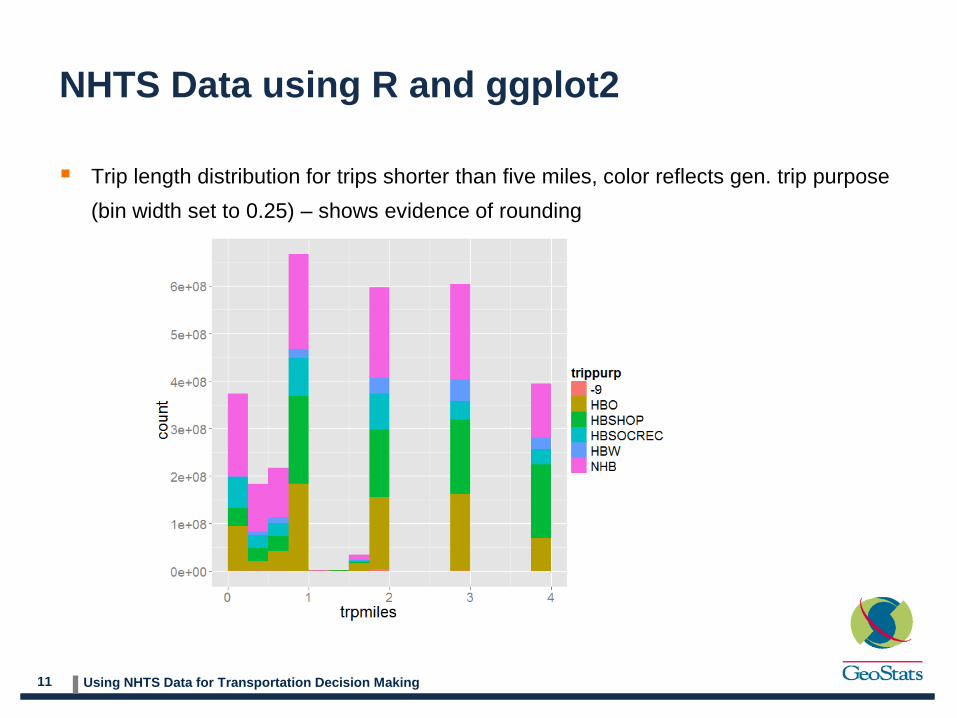
Trip length distribution for trips shorter than five miles, color reflects gen. trip purpose (bin width set to 0.25) – shows evidence of rounding

12 Using NHTS Data for Transportation Decision Making
NHTS Data using R and ggplot2
Trip length for trips shorter than 100 miles as a function of dwell time (minutes), color reflects gen. purpose and dots are sized as a function of the number of persons on the trip

13 Using NHTS Data for Transportation Decision Making
Google Fusion Tables
Cloud-based data manipulation, storage and visualization tools -> easy to share Basic analytical capabilities + joining datasets Quick and easy visualization
o DRCOG Vehicle GPS Data Shown (33,078 trips, 673 households, 1328 vehicles)
o GPS trip traces matched to the model networks and trip starts

14 Using NHTS Data for Transportation Decision Making
NHTS Data using Google Fusion Tables
Example visualizationso Intensity Maps – average trip distance by state
o Motion – trip distance vs. travel time over an artificial week (constructed using DOW information in the trip records)

15 Using NHTS Data for Transportation Decision Making
NHTS Data using Google Fusion Tables
Downloaded MSA Shapefile from the Census website, converted it to KML uploaded and merged it with NHTS datao Color shows average trip length by MSA
16 Using NHTS Data for Transportation Decision Making
Final Remarks
Spatial information in the general NHTS files do not allow for very interesting mapping of the data
It would be helpful if the NHTS data were to be provided in a format that supports code-sets and which R can understand
Sample R code and SQL queries can be provided upon request Same goes for the Google Fusion tables – made all them public
Thank you!o Marcelo Simas Oliveira ([email protected])