a review of separation technologies for salty wastewater
TRANSCRIPT

A Review of Separation Technologies for Salty Wastewater
Reduction in the Dairy Industry
G. Q. Chen1, S. L. Gras1,2, S. E. Kentish1*
1 The ARC Dairy Innovation Hub, Department of Chemical and Biomolecular Engineering,
University of Melbourne, Victoria 3010, Australia.
2 The Bio21 Molecular Science and Biotechnology Institute, The University of Melbourne,
Victoria 3010, Australia
Keywords: Wastewater, dairy, salt, desalination, separation, membranes.
*Corresponding Author
Tel: +61 3 8344 6682
Fax: +61 3 8344 4153
E-mail address: [email protected]

Page I
ABSTRACT
The wastewater discharged by cheese manufacturing processes is highly saline. This waste is
generated from whey demineralisation, chromatography and Clean-In-Place processes. Salty effluent
can be diluted with other effluents and discharged as trade waste but the high salinity can trigger
penalties imposed by local water authorities. Alternatively, such waste can be sent to evaporation
ponds, but in some areas in Australia, environmental impacts regarding land degradation, odour and
dust have prevented further pond construction. Similar concentrate and brine management issues are
emerging in the seawater desalination and mining industries. This paper reviews a range of
commercial and emerging separation technologies that may be suitable to both reduce the costs of
salty wastewater treatment and to improve the recoveries of dairy and salt-based products. These
technologies have been commercialised or applied at a laboratory scale to the fields of desalination
and brine concentration. Each technology is discussed in terms of its principle of operation and
suitability for treating high salinity dairy wastewater. The potential energy requirement and
processing cost of each technology is identified with respect to feed water salinity, to provide
additional insights into the energy and cost efficiencies of these technologies.
Page II
Table of Contents
ABSTRACT ..................................................................................................................................................... I
1. INTRODUCTION ...................................................................................................................................... 3
2. TECHNOLOGY REVIEW ............................................................................................................................ 6
2.1 COMMERCIAL TECHNOLOGIES .............................................................................................................................. 6
2.1.1 Thermal Separation ............................................................................................................................... 6 (1) Evaporation Lagoons and Evaporation Enhancement Technologies ..................................................................... 6 (2) Thermal Desalination (Evaporative Processes) ...................................................................................................... 7 (3) Thermal Crystallisers .............................................................................................................................................. 8 (4) Spray Dryers ........................................................................................................................................................... 8 (5) The SAL PROC approach ......................................................................................................................................... 9
2.1.2 Ion Exchange ....................................................................................................................................... 11
2.1.3 Membrane Technologies ..................................................................................................................... 11 (1) Nanofiltration ....................................................................................................................................................... 11 (2) Reverse Osmosis .................................................................................................................................................. 12 (3) Patented High-Recovery Systems ........................................................................................................................ 12 (4) Electrodialysis ...................................................................................................................................................... 13
2.2 EMERGING TECHNOLOGIES ................................................................................................................................ 17
2.2.1 Thermal Evaporation and Crystallisation ............................................................................................ 17 (1) Ohmic Evaporation ............................................................................................................................................... 17 (2) Aquamill Process .................................................................................................................................................. 17
2.2.2 Freeze Desalination (Freeze-thaw) ...................................................................................................... 19
2.2.3 Eutectic Freeze Crystallisation (EFC) ................................................................................................... 21
2.2.4 Sonocrystallisation .............................................................................................................................. 22
2.2.5 Clathrate/Hydrate Desalination Processes ......................................................................................... 23
2.2.6 Corrosion Resistant Materials ............................................................................................................. 24
2.2.7 Membrane Technologies ..................................................................................................................... 25 (1) Membrane Distillation ......................................................................................................................................... 25 (2) Forward Osmosis ................................................................................................................................................. 26 (3) Salinity Gradient Power ....................................................................................................................................... 28 (4) Membrane Capacitive Deionisation ..................................................................................................................... 29 (5) Bioelectrochemical System (BES) ......................................................................................................................... 30
3. PERFORMANCE PARAMETERS ............................................................................................................... 32
4. CONCLUSIONS ...................................................................................................................................... 36
ACKNOWLEDGEMENTS .............................................................................................................................. 36
REFERENCES ............................................................................................................................................... 37

Page 3
1. INTRODUCTION
As Australia’s third largest rural industry, the dairy industry processes more than 9,500 million litres
of milk annually (1). Depending on the product mix, dairy and milk processes produce 0.2-11 litres of
effluent per litre of processed milk with a polluting charge of 0.2-2.5 gL-1 biological oxygen demand
(BOD) (2). Utilization and treatment of these waste streams depends heavily upon the wastewater
quantity, local government regulations, stream characteristics and economic factors. Since 30% of milk
production in Australia is utilised for cheese manufacturing (1), discharging a large volume of sodium
salts to the environment is one of the causes of dryland salinity facing rural and regional Australia.
In 2007, over 6.7 billion litres of milk was processed annually in Victoria, Australia. A total of 24
factories in Victoria discharged 10,000 million litres of wastewater and 3,400 tonnes of sodium in a
single year. Over $20 million was spent on managing the milk processing related waste (3, 4). The cost
of inland salinity to the Australian community, however, is less known. A study by Wilson (5) reported
that dryland salinity had cost >$300 million per annum for the community of the Murray-Darling Basin,
a large geographical area (>1 million square km) in the interior of South-eastern Australia. This includes
costs to agricultural producers, households, commerce and industry.
Our recent survey (6) identified that salty streams originating from dairy processing operations include
chromatography wastes, clean-in-place (CIP) wastewater, acid whey and waste generated from whey
demineralisation processes including nanofiltration, electrodialysis and ion exchange. These processes
either introduce salts to the process or remove salts from dairy fluids to produce value added
products. For example, salt (sodium chloride) is added to protein-rich cheese curds to reduce the
water activity within the curd when making semi hard or hard cheese (e.g. Cheddar and Colby). The
excessive moisture is expelled during the salting and pressing processes, together with a significant
amount (50-65%) of the added salt, forming a brine stream called salty whey (Table 1).
High salinity waste streams are commonly disposed of into trade waste or evaporation ponds. Local
water authorities are imposing increasing penalties, however, for sodium in their trade waste (6).
Further, the construction of further evaporation ponds in some areas of Australia is prohibited due
to the associated environmental impacts regarding land degradation, odour and dust (7). As a result,
salt removal and recovery from salty waste streams has become a major focus of the sustainability
agenda of the Australian dairy industry.
The level of salinity and sodium concentration in dairy effluents is within similar ranges of those found
in seawater desalination and oil and gas operations, where a large volume of brine is produced (Table
1). Strategies for salty wastewater management from these larger scale industries have developed
over the past couple of decades, leading to significant advances in brine treatment technologies. In
particular, the concept of Zero Liquid Discharge (ZLD) has emerged where a combination of
desalination processes are used to produce high quality fresh water with no discharge of waste liquid.
Such technologies can reduce the size of waste streams by converting the effluents into a compact
solid waste (8, 9). Generally, three steps are taken to achieve ZLD:
Conventional wastewater treatment facilities to remove fat and suspended solids, using
conventional physical and biological treatment technologies (aerobic and/or anaerobic).

Page 4
Membrane technologies ranging from MF, UF, NF and RO are engineered depending on the
quality of pre-treated water for waste water recovery.
The brine after fresh water recovery is treated using thermal technologies. Crystallisation
technologies are used as well to capture valuable by-products.
Different ZLD systems have been developed and licensed by various companies, including GEA (USA),
Ovivo (UK), Aquatech (USA), GE Power & Water (USA) and Geo-Processors USA, Inc. The commercial
technologies discussed in the next Section are the building blocks of these ZLD systems. The selection
and design of a ZLD technology ultimately depends upon wastewater chemistry, the quality of purified
water needed and the characteristics of the solids needed for safe disposal or product recovery (8,
10). Unlike reverse osmosis concentrate and produced water from the oil and gas industry where
sulphate ions and heavy metals are commonly present (11, 12), dairy salty water has relatively high
concentrations of organic matter, phosphorus and nitrogen (13) and this chemistry plays a significant
role in determining the most suitable technology. In some cases, nutritional and valuable compounds
may not have been recovered from upstream processing, contributing to the BOD and TDS of the
treatment process, but also reducing potential economic benefits that may be gained from further
treatment.
This work reviews the commercial and emerging technologies that could be used to remove and
concentrate salts from such dairy streams and potentially provide a ZLD facility. Each technology will
be discussed in terms of its basic principle of operation, feed salinity limit and most importantly, the
potential application of this technology to treat and manage saline dairy wastewater.

Page 5
Table 1: Characteristics of salty water from dairy processes, desalination plants and oil and gas production.
Characteristic Unit
Dairy waste streams
Reverse osmosis
concentrates (ROC)
from desalination
plants (11)
Produced water
from oil and
natural gas
production (USA)
(12)
Spent
caustic
from CIP
(14)
Salty
whey
(14)
Permeate from
Ultrafiltration of
salty whey (15)
Ion exchanger
regeneration
solution (14)
Secondary
treated
effluent (14)
Turbidity NTU 12 1,700 NR 38 31 NR NR
COD [mg/L] 600 29,000 NR 1,200 140 NR NR
Conductivity mS/cm 22 43 39 - 127 26 5.2 13 - 33 NR
TDS [mg/L] 8000 48,000 60,000 – 120,000^ 24,000 3,626 28,000 – 50,000 1,000 – 400,000
Sodium [mg/L] 3000 13,000 11,000 – 33,000 7000 700 2,000 – 16,000 9,400 - 150,000
Calcium [mg/L] NR NR 1,400 – 2,000 NR NR 540 – 2,100 1,500 -74,000
Phosphorus [mg/L] NR NR 250 - 430 NR NR <0.22 NR
Sulphate [mg/L] NR NR NR NR NR 1,600 – 3,100 500 - 15,000
Bicarbonate [mg/L] NR NR NR NR NR 200 - 580 400 - 15,000
Data has been rounded to improve the readability of the table. NR: Not reported ^ Converted from g/100g using a density of 1,030 g/L

Page 6
2. TECHNOLOGY REVIEW
Traditional treatment facilities are capable of treating low salinity waste streams within dairy
processing operations. Dissolved air flotation (DAF) and Induced air flotation (IAF) are common
options for fat removal. Solids removal can be achieved via gravity settling, coagulation-flocculation
or acid/thermal precipitation. Aerobic and anaerobic processes are biological treatments used for BOD
and COD removal. Sludge and biosolids generated from the biological and separation processes are
also often dewatered before being disposed of as solid waste.
When the salinity level reaches a certain level, however, it complicates the operation of some of the
aforementioned units. For instance, a high salinity environment does not favour microbial activity
during anaerobic digestion and salt reduces the kinetics of this process (16, 17). As a result, high salt
effluents must be treated separately once the volume is too large to be diluted. This section reviews
the separation technologies that are available for demineralization and desalination, brine
management and zero liquid discharge (ZLD) systems in both non-dairy and dairy industries.
2.1 COMMERCIAL TECHNOLOGIES
2.1.1 Thermal Separation
(1) Evaporation Lagoons and Evaporation Enhancement Technologies
For many years evaporation ponds have been widely used in inland-based desalination facilities for
brine management. They are typically dams or lagoons that act as temporary storage, a brine stream
concentrating facility or a facility for salt crystallisation. The net rate of evaporation from the ponds is
a function of a number of environmental parameters, such as exposed water surface area, pond depth,
surface temperature, wind velocity, rainfall rates, ambient humidity and water salinity (18).
Technologies have been developed to enhance the rate of evaporation from these ponds,
predominantly by creating additional surface area other than the surface area of the pond. Sprinklers
and misters are often used for this purpose. These technologies create water droplets of small
diameter that provide extra surface area for evaporation to occur. Wind Aided Intensified Evaporation
(WAIV) is a similar approach where vertically mounted cloths or plastic strips are orientated normal
to the prevailing wind, with the pond feed water evenly distributed from the top of the strips (19).
Such increases in surface area can enhance evaporation rates tenfold, allowing for potential recovery
of mineral by-products (20). While the evaporation rate may increase, the final equilibrium salt
concentration that can be achieved is unchanged, however, as this is a function of the ambient
humidity and temperature, as well as the salt composition.
As the salt concentration in the lagoons increases over time and reaches a hyper-saline level, microbial
breakdown of the ‘incoming’ wastewater is also impeded. This results in a number of health and
environmental risks. Odour in and around the lagoons is a major problem due to the slow biological
decomposition of organic matter. Unwanted algal growth is encouraged, forming algal blooms on the
surface of the ponds. Dust is another problem where fine salt can be airborne on windy days.
Crystalline dust is also often found around the edges of the ponds [7, 12, 40].
Further disadvantages of the use of evaporation ponds include the need for impervious liners of clay
or synthetic materials (e.g. PVC or Hypalon) and the risk of leakage into underlying potable water

Page 7
aquifers (18, 21). As a result, the potential risks to the surrounding ecological environment and to the
health of the surrounding community have reduced the long term utility of evaporation lagoons for
high salinity wastewater treatment no longer a permanent solution.
(2) Thermal Desalination (Evaporative Processes)
Solar distillation was first invented many hundreds of years ago to recover fresh water from a saline
source (22). Heat from the sun causes evaporation of water and this pure water is condensed directly
on a nearby colder surface. Large scale production of water cannot be achieved by simple solar
distillation technology, however, due to the growth of algae on the colder surface and the dependence
of the process on constant solar radiation intensity.
Advanced thermal dewatering systems use thermal energy (which can be generated from solar power
systems or other energy sources) to ‘boil’ the salty water in a very similar manner. These evaporators
often integrate mechanical vapour re-compression (MVR) to reduce energy requirements. In this
case, the steam generated from evaporation is re-compressed to a higher pressure, either in a
compressor or via a steam ejector, allowing it to be re-used as a heating medium in the original
evaporator. The condensate is passed through a heat exchanger for preheating the feed wastewater
before being collected (23). Alternatively, in multiple effect distillation (MED), vapour from an initial
evaporator is used to provide the latent heat for evaporation in a second evaporator, which operates
at a lower pressure and temperature. The vapour produced in the second effect is then used in the
same manner in a third evaporator and so on.
Multi-stage flash (MSF) distillation systems consist of a similar series of evaporators with each
operating at a lower pressure and temperature than the preceding one (24). Salty water at high
pressure is fed to the top half of the last stage of the system and is heated as it moves through the
stages, exiting from the first stage. The temperature of this stream is then raised to near the saturation
temperature in a brine heater, before it enters the bottom part of the system through a sequence of
orifices. These restrictions reduce the stream pressure and hence cause the solution to flash into
steam during each distillation stage. The vapour produced enters the top half of the system through
demisters, where it condenses in a heat exchange with the incoming feed (22). The major advantage
of this system is the isolation of heat transfer from evaporation, which can effectively minimize the
risk of scaling.
Depending on the evaporator type, the design and the number of stages, commercial thermal
evaporation systems can typically produce up to ten times the mass of water vapor than the mass of
input steam used (22, 24, 25). It is recommended, however, that thermal evaporators are only used
for salt concentrations between 70,000 ppm to 170,000 ppm (8). Use at higher salt concentrations
may be possible but is restricted by the increasing boiling points of the concentrated solutions; the
need for expensive metals that can tolerate the combination of high temperature and high chloride
concentrations; and high risk of scaling from precipitating salts, such as the calcium phosphate present
in dairy brines.

Page 8
(3) Thermal Crystallisers
In areas where the construction cost of solar evaporation lagoons is high, solar evaporation rate is low
and deep well injection treatment is unfeasible or costly (26), thermal crystallisers have been used to
concentrate brine reject from desalination plants. Very similar in design to thermal evaporators,
thermal crystallisers are designed to maximize the removal of water to reduce the concentrate volume
and to recover valuable products from highly saline feed water (100,000 – 200,000 mg/L total solids
(27)). As above, mechanical vapour recompression and multiple effects can be used to increase energy
efficiency. A slip stream is taken off from the concentrating liquor for crystal harvesting by a solid-
liquid separation device (typically a centrifuge or automatic pressure filter) (27).
For dairy applications, crystallisation effects are normally used for the production of lactose (28). In
dealing with dairy salty waste streams, however, more than one salt is usually present. This
complicates the design and operating parameters for the crystallisers. As the solution is concentrated
over time, the composition and size of the crystals vary significantly because more soluble
components start to precipitate. The size of the crystals also decreases, as mixed salts are produced.
Foaming, scaling and corrosion are common issues for mixed salt crystallisers, due to the presence of
fine crystals, organics, poor pH control, high chloride concentration and soluble impurities. The
solubility of calcium phosphate has been shown to be impacted by the presence of lactose and sodium
chloride, as well as organic acids and anions (29). In such a multi-salt system, selective crystallisation
cannot be achieved during crystallisation of dairy effluent brine (30). In general, higher capital and
operating costs of the unit are also required compared to pure salt applications (27).
(4) Spray Dryers
One alternative to dewater a pre-concentrated stream (e.g. the brine stream produced by a brine
concentrator) is spray drying. As illustrated in Figure 1, this consists of three processing steps (31):
The liquid suspension feed is converted into tiny droplets by using rotary or nozzle atomizers;
The atomized fine droplets contact with hot air for drying of the individual droplets into solid particles inside a drying chamber;
The dried powder is partly collected from the base of the drying chamber and partly from the separation equipment (typically a cyclone separator) from the spent drying air.

Page 9
Figure 1: A typical spray drying operation utilizing a centrifugal atomizer and a cyclone separator
((32), reproduced with permission from RSC).
GEA Niro and SPX are among the several commercial spray dryer manufacturers that have developed
spray drying units for dairy applications in producing infant formula, milk powder, concentrated whey
and lactose. Spray dryers are integrated as part of GEA’s Zero Liquid Discharge (ZLD) solutions in
handling small quantities of wastewater (33).
If the formation of salt crystals in a suspension can be selective, a spray drying process is suitable for
salt recovery from saline waste streams, because it can be tailored to control product properties, such
as particle size distribution, bulk density, residual moisture content and particle shape (8). Spray dryer
costs, however, are significantly affected by the chemistry of the liquid suspension fed from the brine
concentrator, as it determines the construction materials required and the configuration of the spray
dryer unit (34). Spray dryers are more cost effective than brine crystallisers at flowrates below 2.3
m3/hr (34, 35).
(5) The SAL PROC approach
A patented ZLD process by Geo-Processors USA, Inc. (Glendale, California) called SAL-PROCTM has been
assessed by a number of brine management projects (9, 26, 36). It is an integrated system that claims
to selectively extract the dissolved elements from salty water in the form of valuable salts and
chemical compounds (mineral, slurry, and liquid forms) (37). The relevant patent (38) indicates that
the process involves reacting the brine with either calcium oxide or calcium hydroxide to precipitate
a solid, calcium carbonate, calcium sulphate (gypsum) or magnesium hydroxide, dependent upon the
feedwater type. This first product is saleable. The remaining brine is evaporated to promote the
formation of a further precipitate, predominantly sodium chloride and a mother liquor. The remaining
mother liquor must be processed by classical means i.e. either a solar evaporation pond or a thermal
crystalliser.
The approach classifies the saline feed into seven types (Table 2). Type 6 is the most relevant to
dairy systems. A typical flowsheet, said to apply to wastewater Types 2, 4, 5, 6 or 7 is provided in
Figure 2 below. The high level of organic components and the relatively low levels of magnesium,

Page 10
carbonate and sulphate in dairy effluents will require substantial modifications to this technology.
Therefore, despite this technology exists for almost a decade, it has yet to be used for any dairy
applications.
Table 2: The Classification of Saline Water into seven types, used by the SAL-PROC Process,
reproduced from (38).
Type TDS (g/L)
Cl-/HCO3- mol.
Cl-/SO42- mol.
1 1 to 60 <2 >1
2 1 to 15 ≥2 >1
3 1 to 15 >2 <1
4 >15, ≤60 >5 >7
5 >15, ≤60 >5 <7
6 >60 >5 >9
7 >60 >5 <9
Figure 2: Typical process route for the SAL-PROC process (adapted from (38)).
SALINE EFFLUENT
Page 11
2.1.2 Ion Exchange
An ion exchange process removes minerals from solution by absorbing them to beads of polymeric
resin that contain fixed charge groups. Ions passing through a packed bed of beads are adsorbed to
the fixed charge groups. Once the resin beads are saturated with ions, they are regenerated using acid
(for cation resins), alkali (for anion resins) or a brine solution. The absorbed ions desorb into the
solution hence producing a waste brine stream. In desalination applications, ion exchange has been
applied as a pre-treatment process to remove water hardness (i.e. calcium, magnesium and other
polyvalent cations). This process uses a cation resin initially loaded with Na+ cations. As water passes
through the resin bed, the resin absorbs Ca2+ and Mg2+ and in exchange releases Na+, hence reducing
the water hardness. Based on similar concepts, ion exchange has been used in the dairy industry for
whey demineralisation. Ion exchange technology alone is not considered suitable for salty waste
stream management but potentially can be used as a pre-treatment step.
2.1.3 Membrane Technologies
Reverse osmosis (RO), nanofiltration (NF), ultrafiltration (UF) and microfiltration (MF) are four
membrane processes commonly used in the dairy industry for selective separation of a variety of
species. These systems operate at various ranges of pressure, while the characteristics and pore sizes
of the membranes also vary. MF and UF technologies can be used as pre-treatment systems to remove
specific species and to minimise waste volume to a minimum, in order to reduce the total costs of
downstream ZLD processes (8).
(1) Nanofiltration
Nanofiltration is used for removing organics (BOD) and dissolved materials that are of a molecular
weight greater than 100-500 Da, at relatively high pressures (20-40 bar). It can also be used as a pre-
treatment unit to a RO system. Component separations in nanofiltration membranes are based on
molecular size, charge and other parameters. Most multivalent ions can be rejected but the removal
of monovalent ions by nanofiltration membranes varies between 50-90% depending on the material
and the operating parameters (39, 40).
NF membranes have been found to be efficient in polishing spent caustic CIP systems, with COD
rejection coefficients of ~98% and recovery of up to 95% of acid or caustic. The clean permeate stream
is also ready to be reused in subsequent CIP cycles. The SelRO™ Caustic Recovery System, using SelRO
MPS-34 nanofiltration membranes, is designed by KOCH Membrane Systems to remove more than
90% of the brown-burnt coloured contaminants and COD from spent caustic or acid, accompanied by
a substantial reduction of calcium and carbonates (ineffective alkalinity) (41). Nowadays, such caustic
CIP recovery systems have been employed in many of the dairy processing facilities across Australia.
Nanofiltration has also been used in the dairy industry to desalinate dairy process streams such as
skim milk and whey, as well as their UF permeate. For example, partial demineralization (up to ~30%)

Page 12
of sweet whey can be achieved by removal of monovalent ions using an appropriate NF membrane
system. Nanofiltration was recently demonstrated in both lab scale (42) and pilot scale (43), for
removing lactic acid from acid whey, a low saline waste stream from Greek yogurt and cream cheese
manufacturing, to allow for the recovery of whey proteins and lactose in a downstream drying unit. A
process called Ultra-Osmosis® (44) was reported to selectively remove the dissolved salts from salty
whey, achieving a retentate stream close to that of normal sweet whey. The NF permeates produced
from any of the applications mentioned above, however, are brine streams that need to be treated
carefully (see Table 1 for stream characteristics of salty whey NF permeate). This means that NF
filtration is not a competent technology for treating salty waste streams alone.
(2) Reverse Osmosis
Reverse osmosis is a high pressure membrane desalination technique that is traditionally used for salt
removal from brackish water or seawater. The transport of water from low to high concentration is
governed by an osmotic pressure gradient. The pressure applied to the high salt concentration
solution overcomes the osmotic pressure and thus forces pure water to pass through the
semipermeable membrane. Like any other membrane filtration processes, reverse osmosis is also
prone to membrane scaling/fouling and membrane deterioration (45). Therefore, pre-treatment of
the feed water using appropriate technologies is essential for removing the suspended compounds,
colloids and organic matter. Water hardness is also recommended to be reduced/removed prior to
RO treatment to ensure long term stability and performance of these systems.
Applications of reverse osmosis membranes in the dairy processing industry include the concentration
of milk, whey and lactose, water polishing for evaporator condensate, demineralisation of whey and
lactose, as well as clarification (28). The operating costs for some of these applications sometimes are
prohibitively high due to the difficulty in the control and prevention of membrane scaling and fouling,
as well as high energy requirements. For instance, treating condensate water (‘polishing’) for reuse
was found to cost 30% more than using town water in one of the dairy processing plants in Victoria,
Australia (46).
(3) Patented High-Recovery Systems
Classically, the feedwater salt concentration for an RO unit ranges from 2 – 32 g/L (47). Beyond this
range, an excessive osmotic pressure must be overcome, and mineral scaling can become excessive,
making RO no long viable in terms of energy and process efficiency. Commercially available
technologies are emerging, however, that claim to be able to achieve high recovery of water from
much more highly concentrated streams, using RO systems.
Vibratory Shear Enhanced Processing (V-SEP), developed by New Logic Research, Inc. (USA) uses shear
to remove mineral scaling as it occurs. Specifically, shear is created by oscillating circular disc
membranes in a direction tangent to the membrane surface. As illustrated in Figure 3, the oscillatory
vibration reduces the level of concentration polarization by keeping the colloidal materials within the
suspension and washing them away from the membrane surface. As a result, the cake formation that
is usually observed in conventional membrane filtration systems is avoided. In turn, this reduces cake
enhanced osmotic pressure effects. V-SEP is a proprietary technology that has not been used in a large
scale brine application. A pilot scale V-SEP unit fitted with nanofiltration membranes was investigated,
however, for treating magnetic ion exchange waste brine containing dissolved organic compounds

Page 13
desorbed from the ion exchanger in salty water. A removal of >97% of dissolved organic compounds
and an 80% brine recovery were achieved (48). For dairy applications, New Logic Research, Inc.
indicates that the V-SEP system can also be used to recover ultra-pure water from acid whey for reuse
and concentrated protein for sale. For processing 545 m3 of acid whey per day at 75% recovery, the
operating costs are estimated to be $315k per annum including power consumption (49).
Figure 3: A schematic showing the principle of operation for V-SEP ((50), reproduced with permission
from Elsevier).
High-efficiency reverse osmosis (HERO) is a patented process developed by Aquatech, Inc., USA. It
consists of three steps: ion exchange for hardness and suspended solids removal, membrane
degasification for CO2 removal and reverse osmosis operated at elevated pH (51). Scaling issues can
be eliminated because the RO system operates at high pH. A theoretical recovery of 95% can be
achieved. This system is specially designed to treat water that is of high silica content and hence is not
likely to be useful in the dairy industry.
A similarly innovative water treatment process using RO membranes has been developed and
patented by Osmoflo, Australia to concentrate the brine from conventional RO plants. This ‘Brine
Squeezer’ technology is claimed to achieve an overall recovery of 95% or more by using the existing
RO system reject as the feed. It can concentrate feedwater to a TDS of up to 150,000 mg/L, with a
specific energy consumption ranging from 6-8 kWh/m3 (52). A high pressure circuit is used to
recirculate the concentrate to increase cross-flow velocity and upstream pre-treatment processes are
used to remove potential scalants. No dairy application of this technology has been found to date.
(4) Electrodialysis
Electrodialysis is a commercially proven electrochemical process, where charged particles and ions are
transported from the feed solution (diluate) into a permeate solution (concentrate) under the
influence of an electrical potential. As shown in Figure 4, the positively charged ions (cations) can pass
through a cation exchange membrane towards the cathode but are selectively retained by the
upstream anion exchange membrane. The opposite occurs for the negatively charged anions. The
alternating configuration of ion exchange membranes results in a concentrated salt solution in the
concentrate compartments and a desalinated solution in the diluate compartments.

Page 14
Similar to all other membrane processes, scaling and fouling can occur when the ions accumulate on
the surface of the membrane, particularly with calcium ions. To minimize the effect of scaling and
fouling, the polarity of the electrodes can be regularly reversed through a process called electrodialysis
reversal (EDR) or a pulsed electric field can be used. These changes in electrical potential remove the
deposited ions from the membrane surface, effectively performing a self-cleaning step, without the
need for additional chemicals. This cleaning step allows the ED process to operate at relatively higher
water recoveries and also prolongs the membrane life (53).
Figure 4: A electrodialysis stack setup, showing cation and anion exchange membranes in alternating
series between two electrodes (reproduced from (54)). (AEM: Anion exchange membrane; CEM:
cation exchange membrane.)
Electrodialysis is applied on an industrial scale for the production of table salt from seawater,
desalination of brackish water, the treatment of boiler-feed water and the demineralisation of whey.
For solid salt production from seawater in Japan, the target energy consumption was reported to be
lower than 0.12 kWh/kg NaCl for a NaCl product stream with a concentration higher than 200 g/L (55,
56). Reig et al. (57) and Casas et al. (58) used a pilot scale electrodialysis plant to show that at least
0.19 kWh/kg NaCl was needed to achieve such a concentration from seawater RO concentrate (Figure
5). It was also shown that the highest concentration achievable (>250 g/L NaCl) still did not meet the
feed concentration requirement (300 g/L) for a typical membrane electrolysis unit. Due to the limited
ion selectivity between monovalent and multivalent ions from commercial ion exchange membranes,
the resulting ED concentrate stream contains trace account of minor ionic species (e.g. Ca2+, Ni2+, Sr2+
and Cu2+) that also need to be further purified for chlor-alkali production.

Page 15
Figure 5: Relationship between the NaCl concentration and the continuous energy consumption
necessary to concentrate one tonne of NaCl from reverse osmosis brine using electrodialysis,
illustrating the influence of operating temperature (T) ((57), reproduced with permission from
Elsevier).
Electrodialysis was integrated with a two stage reverse osmosis system by a research group in Israel
to concentrate brackish water from 0.3% to over 10% TDS (Figure 6) (59). ED was used to concentrate
the brine from the second RO unit, with calcium salt scaling avoided by constant removal through
precipitation in a crystalliser/settling device. The supernatant produced from the crystallizer/settler
was then used as the concentrate stream for the ED unit. The salt slurry was dewatered by a WAIV
unit, discharging only solid waste. Further, by reducing the diluate concentration to that of an inter-
stage RO feed, the electrical potential could be kept at the lowest possible (60). The energy
requirement for EDR as a function of brine concentration indicated that 5–6 kWh/m3 is required for
desalinating the brackish water reverse osmosis concentrate from ~10,000 ppm to 1,000 ppm (59).
The authors claim the overall product water costs, with 98% total RO recovery for a plant with a feed
of 100 m3/h, ranges from 0.41 to 0.44 Euros/m3 (0.48 to 0.52 USD/m3, exchange rate: 1 EUR = 1.18
USD).
For dairy applications, electrodialysis is more cost-effective for demineralisation of whey to levels
below 70%, compared to ion exchange (28). Effective removal of lactic acid from acid whey using
electrodialysis was also demonstrated by Chen et al., resulting in a demineralised whey stream that
can be further processed for drying (61). The concentrate stream from an ED demineralisation process
contains the salts removed from whey. The NaCl concentration of these streams falls within the range
reported for reverse osmosis concentrate (see Table 1), thus to concentrate them further using ED is
likely to consume a similar level of energy as shown in Figure 5. In general, the use of ED is limited by
the energy consumption for high salt concentration applications and where the degree of salt removal
is high (59, 62).

Page 16
Figure 6: Schematic Presentation of the Zero Liquid Discharge (ZLD) process proposed by Reig et al.
containing RO, ED, crystalliser, UF and WAIV unit operations ((59), reproduced with permission from
Elsevier).
Electrodialysis with bipolar membranes (EDBM) is a more recent approach, where bipolar membranes
(consisting of an anion and cation exchange membrane adhered together) are used to dissociate water
into protons and hydroxide ions under an electrical field, thus producing acids and bases from a brine
feed. The simplest design for a bipolar membrane processe is illustrated in Figure 7. Na+ ions migrate
through the cation exchange membrane toward the cathode but are retained in the compartment
that is sandwiched between the bipolar membrane and the cation exchange membrane. OH- ions
generated from the splitting of water react with the retained Na+ ions to produce sodium hydroxide
(NaOH). The corresponding acids, such as sulphuric acid (H2SO4) and hydrochloride acid (HCl), are
produced in a similar manner in the compartment on the anode side of the bipolar membrane.
EDBM is an electrolytic process and thus the co-production of hydrogen and oxygen is inevitable. This
coproduction needs to be accounted for when assessing the energy consumption of this process. If
organic matter can be removed effectively upstream, EDBM can be used for treating the sodium-rich
salty streams from the dairy industry, to produce hydrochloric acid and sodium hydroxide that can be
readily reused for IEX regeneration and CIP cleaning. This approach has been identified (63) and
demonstrated with pure sodium chloride (64) and simulated brominated butyl rubber wastewater
(65). While research outcomes have been positive, no commercial application of this technology has
yet been reported in the dairy industry.

Page 17
Figure 7: Schematic of a 3-compartment electrodialysis cell with bipolar membranes ((36),
reproduced with permission from Elsevier). (BP: bipolar membrane; A: anion exchange membrane; C:
cation exchange membrane)
2.2 EMERGING TECHNOLOGIES
In this section, technologies are reviewed that are still at the laboratory bench scale, or where
commercial scale units are few in number.
2.2.1 Thermal Evaporation and Crystallisation
(1) Ohmic Evaporation
Ohmic evaporation is an emerging thermal-based evaporation process, which uses an alternating
electric field of strength ranging from 24 V/cm to 87 V/cm at a frequency of 60 Hz (66). The current
passes through a conductive material of high resistance to generate ohmic heating. This technology
was demonstrated to be able to concentrate a brine from 80,000 ppm. In spite of the fact that no
pretreament of the feed water is required and there is no scaling, the energy consumption (minimum
of 218 kWh/m3) for this technology is much larger than conventional thermal evaporation processes,
making it economically uncompetitive for brine concentration (66, 67). Niche applications of ohmic
heating have been found in the food industry for concentrating sour cherry juice (68), pomegranate
juice (69) and tomato dewatering (70), where it offers the advantage of high heating rate and
maintenance of colour and nutritional value of food.
(2) Aquamill Process
The Aquamill process (71) uses an evaporator that incorporates spray drying to crystallise salts and
operates at sub ambient pressures (72). The unit can be run with mechanical vapour recompression,
in a forward feed, backward feed or multiple feed mode, similar to a conventional multistage
evaporator.
As an example, Figure 8 shows the operation in forward feed mode. The contaminated feedwater is
pumped by a high pressure pump through a heat exchanger to the misting spray nozzles, where it
mixes with circulating superheated steam in the drying cells. As the mist travels down the drying zones,

Page 18
heat energy is exchanged between the steam and the droplets, thus causing water in the droplets to
evaporate and form more steam. As a result, the mass of the droplets decreases and the salt
concentration within each droplet increases. A feature of this evaporation process is that it occurs in
a volume devoid of hot heat transfer surfaces, so that problems of scale formation are reduced. After
the droplets have travelled a distance down the drying zone and the bulk of the water within them
has been removed, the remaining droplets are collected by the mist eliminators and collected at the
base of the machine as a concentrate stream. This concentrate is fed to the next stage, which operates
at lower pressure and temperature. A portion of the circulating steam, which is now cooler but
increased in flow due to the steam generated within the drying cell, is condensed in the downstream
heat exchanger, while the remainder also moves to the next stage.
It is claimed that Aquamil process is highly energy efficient and can handle feed water of up to 70,000
ppm TDS, compared with a limit of 50,000 ppm TDS for RO (73). Two case studies have been performed
on this unit but there has not yet been any successful commercial application.
Figure 8: A Forward cascade injection drying zone within an Aquamill Evaporator (adapted from
(72)).
Feedwater
Concentrated
Brine
Spray Nozzle
Array
Spray Nozzle
Array
Sup
erheated
Steam Flo
w
Superheated
Steam
Concentrate
Spray Nozzle
Array

Page 19
2.2.2 Freeze Desalination (Freeze-thaw)
In contrast to thermal distillation, freeze desalination induces a phase changes from liquid to solid. As
salty water freezes, ice crystals form containing only pure water, while dissolved salts are excluded
from the crystal structure. Ice crystals are then separated and removed from the ice-brine mixture.
Freeze desalination is attractive, as it takes much less energy to freeze (334 kJ/kg) than to boil the
equivalent mass of water (2,326 kJ/kg) in a single-stage operation.
In an indirect freezing process, salty water does not come into direct contact with the refrigerant. As
shown in Figure 9, ice crystals formed in the freezer are separated in the washer. Ice is then melted in
the melter to produce fresh water, while brine is discharged. The energy in the cold brine and fresh
water streams is recovered in a heat exchanger to pre-cool the feed saline water before the freezer.
The energy demand in such a system tends to be high, due to the extra heat transfer resistance caused
by the contact surface between the saline water and the refrigerant.
Figure 9: Schematic of an indirect freezing desalination process, involving freezer, washer, melter,
and heat exchanger operations ((74), reproduced with permission from Elsevier).
Direct freezing processes have been designed to remove the heat transfer resistance in order to lower
the energy requirements of freeze desalination. Two types of processes have been developed:
Vacuum Freeze Desalination and Secondary Refrigerant Freezing. For vacuum freeze desalination
(Figure 10), saline water is flashed into a vacuum chamber (~0.004 atm (74)) vaporising some of the
water. The vaporisation process removes more heat from the water causing ice to form. The ice-brine
slurry is separated in the washer/melter where ice floating on the brine is washed with fresh water
and brine is discharged. In the secondary refrigerant freezing process, a secondary refrigerant,
typically a liquid hydrocarbon refrigerant such as butane (not miscible with water), is used. As shown
in Figure 11, liquefied butane is vaporised as it contacts with the saline water, taking away the energy
from the saline water and causing an ice-brine slurry to form. The vaporised butane is re-compressed
and reused, while the slurry of ice is separated. The secondary refrigerant freezing process is claimed
to consume less energy and be less susceptible to scaling and corrosion (76).

Page 20
Figure 10: Schematic diagram of vacuum freeze desalination process ((74), reproduced with
permission from Elsevier).
Figure 11: Schematic diagram of a freezer using a secondary refrigerant (butane) ((76), reproduced
with permission from John Wiley and Sons).
In spite of the fact that direct and indirect freezing desalination technologies were invented between
1950 and 1970, they still have not been utilised at a commercial scale. The reasons reported in the
literature include issues with brine adhering to the ice crystals, the complexity of the equipment
required to separate ice from brine, the unsuitability of conventional refrigerant compressors (77),
unit size limitations and the retention of undesirable flavours and aromas in the outlet water stream
(78). In MSF and MED processes, energy integration through the use of multiple stages reduces the
energy requirement dramatically down to <20 kJ/kg (<6 kWh/m3) (79). This is a very challenging target
for freeze desalination to achieve, because only single stage units have been developed. Energy
requirements are primarily due to the compression stage and the freezer efficiency. This type of
technology needs to be carefully assessed for treating dairy salty waste water, due to the limitations
in commercial scale applications and the greater complexity of dairy waste water compared to
seawater.

Page 21
2.2.3 Eutectic Freeze Crystallisation (EFC)
Eutectic freeze crystallisation technology was developed by the Delft University of Technology
(Netherlands) and patented in 2001 (80). This process involves a simultaneous separation and
purification, operating at the eutectic temperature of the salt solution. It is claimed to overcome the
limited temperature sensitivity of sodium chloride crystallisation and the high energy demand of the
standard approach.
A typical phase diagram relevant for any salt solution is presented in Figure 12 (81). If the solution is
cooled from point A to below 265 K, ice begins to form in the unsaturated solution. A further decrease
in temperature, however, shifts the system composition from point B to point C and eventually the
solution reaches the eutectic point (point D), defined as the lowest possible temperature of
crystallisation. At this point, crystalline salt structures and ice crystals form separately. Because of the
huge density difference between ice and salts, the crystals can be readily separated by gravity. As
illustrated in Figure 13, ice is taken off and washed from the top of the separator, while salt crystals
drawn from the bottom of the separator are filtered to produce solid salt. The brine from both
processes is recycled to the crystalliser for further processing. In theory, eutectic freeze crystallisation
can achieve 100% separation of the saline water into ice and salt (81).
Figure 12: A water–salt phase diagram; point D is the working point of EFC ((81), reproduced with
permission from Elsevier). Points A to C are defined in the text.

Page 22
Figure 13: Schematic representation of the EFC process for the production of pure water and salt
from waste or process streams ((81), reproduced with permission from Elsevier).
Treatment of a mining RO brine using EFC has shown that 97% of liquid waste from the RO plant can
be converted to pure water, calcium sulphate (98.0% purity) and sodium sulphate (96.4% purity) (82).
A life cycle assessment comparing EFC and evaporative crystallisation for this purpose indicated that
EFC processes have great potential in reducing the energy consumption and greenhouse footprint of
crystallisation units (83). EFC is currently being commercialized by EFCseparations BV, a spin-off
company from the Delft University of Technology. They have developed single stage EFC that can
handle multi-component systems and multi-stage EFC that can crystallise out the specific salts in
sequence by operating a series of crystallisers at different temperatures. The major advantages
reported are the energy saving, high purity of salts and the lack of additional chemicals (84). It was
found that the EFC process consumes 6 - 7 times less energy when compared to evaporative
crystallisation for a 4 %wt model solution of sodium sulphate (83), illustrating the potential of this
approach.
Other than the process described by EFCseparators BV, the removal of multiple salts from multi-
component and hypersaline water has not been demonstrated in the literature. Salty waste streams
from the dairy industry could be used to demonstrate the applicability of the EFC technology. It is
anticipated that pre-treatment to remove the organic matter would be required for this application.
2.2.4 Sonocrystallisation
Ultrasound can induce primary nucleation at much lower supersaturation levels compared to
operation using conventional crystallisation (85), by reducing the induction time for crystals to form
(see Figure 14) (86) and eliminating the need to add seed crystals (87). The power and duration of
ultrasound can be used to manipulate the crystal size and distribution to tailer these properties for
the requirements of the downstream processes. In general, a short burst of ultrasound to nucleate at
a low level of supersaturation can grow larger crystals, while continuous insonation significantly
decrease the mean crystal size (87).
Sonocrystallisation has been used at a commercial scale in the alumina industry to induce
crystallisation of salts from Bayer liquor (85); and in the pharmaceutical industry (88). Contrary to the
horn type ultrasound transducers used at a laboratory scale, the commercial scale units use an array
of small transducers attached to the external surface of a pipe. This approach allows a relatively high

Page 23
acoustic field density at the centre of the pipe and avoids issues of metal erosion of an oscillating
surface.
Crystallisation using ultrasound was patented in 2002 (89) but there is still no commercial application
of sonocrystallisation in the dairy industry. Studies have investigated the crystallisation of lactose
using ultrasound (90-92). In general, rapid precipitation of lactose crystals, higher lactose recoveries
and a more uniform crystal size distribution are observed. The yield of crystallised lactose is, however,
not altered (93). The induction time for salt crystallisation from saline dairy effluent was also found to
be shortened using ultrasound but selective crystallisation of calcium phosphate was not achieved
(30).
Figure 14: Schematic representation of the reduction in the metastable zone (i.e. an increase in the
temperature at which nucleation occurs) using ultrasound ((87), reproduced with permission from
Springer Nature).
2.2.5 Clathrate/Hydrate Desalination Processes
When a hydrocarbon gas, such as methane or ethane, is introduced into a pressurized salt solution,
the hydrocarbon and water react forming hydrates or clathrates (Figure 15). These salt-free clathrates
are in a solid (ice-like) phase, which floats to the top of the salt solution due to the lower density
achieved by the presence of the hydrocarbon gas molecules trapped in the ‘ice-cage’. Upon melting,
only freshwater is produced after the release of the hydrocarbon gas.

Page 24
Figure 15: A methane molecule in a “cage’ of water molecules ((75), reproduced with permission
from Springer Nature.
Hydrate formation in water desalination was patented in 1972 (94) but it took until 1996 for the
clathrate freeze desalination apparatus and method to be filed by Ramco, Inc (95). This emerging
process has developed more rapidly since but large scale application has still not been seen. A non-
flammable gas like CO2 had been considered as the clathrate former (96). Ultrasonic energy had also
been used to aid the formation of the clathrates (97). Different gas pairs are also being investigated
to eliminate the need for refrigeration and to form the hydrates at more moderate pressures (98).
It has been recently claimed that if such a system works, the cost of producing one cubic meter of
freshwater from saltwater will be ~46-52 US cents, much less than for reverse osmosis (~45-92 US
cents) or thermal purification (~110-150 US cents). One of the hurdles, however, that must be
overcome would be to eliminate the contamination of the clathrate phase by the salty water (99, 100).
2.2.6 Corrosion Resistant Materials
One of the challenges with handling high salinity fluids, particularly at the elevated temperatures that
occur in thermal evaporators, is the corrosion of the metal parts. Corrosion is accelerated in solutions
of high conductivity (i.e. salinity), since the dissociation of salt ions increases the electron transfer rate
at the metal-solution interface. Corrosion resistant alloys, such as stainless steel, have improved
corrosion resistance properties due to the addition of nickel and chromium. Localised corrosion
including pitting, intergranular or stress cracking can still develop, however, in chloride containing
environments (101). To date, titanium and high-alloy forms of steel are used for the construction of
equipment used in the high salinity environment for desalination and brine management. The use of
these expensive materials, however, adds to the cost of water recovery and production and often
prevents the applications of certain technologies.
Corrosion control is an active research field, with a number of approaches being investigated,
including corrosion inhibitors, surface modification, alloy substitution and organic, inorganic or
metallic coatings (102, 103). Conducting polymers have been coated onto some alloys for anti-
corrosion testing (104-107). Heat conducting polymers can often provide thermal conductivity of up
to ~40 W/(m·K), which is 5 to 500 times the value of conventional plastics (108). Heat conductive
compounds of various types have been developed and commercialised by companies such as
Honeywell, Dow Corning, PolyOne Corp., Cool Polymers and DuPont. These polymers have been used
in lighting, as heat sinks on circuit boards, in telecommunication devices, business machines and
industrial equipment used in corrosive environments (109).
Page 25
Polyelectrolyte multilayer coatings have also been investigated for the protection of stainless steel.
These cationic and anionic polyelectrolytes are coated in an alternating order using a layer by layer
self-assembly technique. The thickness of each layer is typically 1-2 nm. Examples of the cationic
polyelectrolytes studied include polyallyamine hydrochloride (PHA), Poly(diallyldimethylammonium
chloride) (PDADMA) and poly(N-octyl-4-vinyl pyridinium iodide) (PNOVP) (102, 110). Some of the
anionic polyelectrolytes are polyacrylic acid (PAA), polystyrene sulphonate-co-maleic acid,
polystyrene sulphonate (PSS) (101). While promising, further improvement in film adherence,
continuity and corrosion resistance is still needed for significant advances to occur in this area.
2.2.7 Membrane Technologies
(1) Membrane Distillation
Membrane distillation is an emerging membrane process that uses a vapour pressure gradient
between the feed and permeate side to achieve separation. A microporous hydrophobic membrane
is used to separate a heated feed liquid phase, allowing the vapour phase (e.g. water vapour) to pass
through. As water vapour reaches the cooler permeate side of the membrane, condensation occurs
allowing for the collection of pure water.
The key advantages of membrane distillation over evaporation processes include the possible use of
low-grade waste or solar heat (111-114) and the use of polymeric membranes of lower mechanical
strength (115). The heat transfer surface is constructed from plastic, eliminating the corrosion issues
associated with thermal evaporation. Ideally, the entire process is constructed from plastic
components.
Membrane distillation can be configured based on the condition of the permeate streams as (111,
116):
a) Direct contact membrane distillation (DCMD) – this is the simplest configuration where both
feed and permeate streams have direct contact with the membrane surfaces. This
configuration offers high flux and is suitable for treating aqueous solutions (i.e. desalination
and concentration of food products) but is not the most energy efficient.
b) Air gap membrane distillation (AGMD) – in this configuration the cold condensing side is
separated from the membrane by a thin film of air. This is the most versatile configuration
and can be applied to most solvent systems.
c) Sweeping gas membrane distillation (SGMD) – where a sweep gas stream passes tangentially
across the permeate side of the membrane.
d) Vacuum membrane distillation (VMD) – where a vacuum is drawn on the permeate side.
Membrane distillation requires the use of membranes with small pore sizes (0.2-1.0 µm) and
membrane materials that are highly hydrophobic and so not wetted by the process fluid. Capillary
condensation must be avoided inside the membrane pores. The vapour liquid equilibrium of the
components should not be altered by the selected membrane (113, 117, 118).

Page 26
Small membrane distillation units are now commercially available, supplied by companies such as
Aquaver (the Netherlands), Aquastill (the Netherlands) and Solarspring (Germany), with installations
up to 10,000 litres/day of fresh water (118, 119). These units use waste heat or solar energy. There
are also many lab-scale experiments and pilot scale trials investigating this approach (120). In the field
of dairy processing, applications including the concentration of whey protein (121), milk, whey and
lactose (120, 122) have been studied. Recently, direct membrane distillation was successfully
demonstrated at a laboratory scale for the concentration of salty whey using flat sheet PTFE
membranes, achieving a final TDS concentration of ~30%w/w with a water recovery of up to 83% (15).
Figure 16: Classification of MD processes based on the configuration of the permeate side
configuration. (a) DCMD: direct contact membrane distillation and LGDCMD: liquid gap direct
membrane distillation; (b) VMD: vacuum membrane distillation; (C) SGMD: sweeping gas membrane
distillation and TSGMD: Thermostatic sweeping gas membrane distillation; and (d) AGMD: air gap
membrane distillation. ((116), reproduced with permission from Elsevier.)
(2) Forward Osmosis
Forward osmosis (FO) is a membrane filtration process that has recently been developed to desalinate
brackish water and seawater. A draw solution, typically a salt solution that has a high osmotic potential
is used on the permeate side of the FO membrane to ‘draw’ water from the feed stream and thus to
reduce this osmotic pressure (Figure 17). Since this is a thermodynamically favoured process, no
pressure differential is required, contrary to reverse osmosis. FO membranes need to be relatively
thin to reduce mass transfer resistance and thus are mechanically weak (123).

Page 27
A mixture of ammonia and carbon dioxide is the most studied draw solution, due to its inherently high
osmotic pressure (124). Following dilution of this draw solution in the FO unit, the ammonia and
carbon dioxide are recovered by evaporation using heat and returned to the process, as shown in
Figure 17 [129]. An FO membrane brine concentrator (MBC) has been developed by Oasys using an
ammonia/CO2 based draw solution that is capable of concentrating the brine to between 150,000 –
250,000 ppm TDS (125). In other applications, the draw solutions may not be recycled. For instance, a
waste brine stream might be used as a draw solution and then disposed directly to the open ocean as
a more dilute brine, if this option is available. In fertigation, water is extracted from a brine or other
wastewater stream through an FO membrane to dilute concentrated fertilisers on farm (126), allowing
the delivery of the fertiliser and fresh water to the land for minimal cost .
Laboratory scale and pilot plant studies of forward osmosis in wastewater treatment include the
treatment of landfill leachate (127), direct potable reuse of wastewater in advance life support
systems for space applications (128, 129), concentration of liquids from anaerobic sludge digestion
(130), sucrose concentration (131) and brine concentration (123, 132). The challenges of
commercializing FO in desalination are the development of advanced membrane materials and
effective draw solutions (133). In recent years, draw solutions have undergone significant
development to provide high osmotic pressure, zero toxicity, easy recovery and can now also be
altered at low cost (133).
Figure 17: A proposed process schematic of a forward osmosis desalination process using NH3/CO2 as
a draw solution ((134), reproduced with permission from Elsevier).
Hydroxsys, established in 2012, has been commercializing a proprietary thin film composite
membrane suitable for forward osmosis systems to concentrate milk at or near milk farms before it is
transported to dairy processing facilities (135). Porifera (USA) has patented plate and frame forward
osmosis systems for milk concentration up to 40% total solids (136). Integrated (137) systems
incorporating forward osmosis and reverse osmosis were also studied for water recovery and whey
powder production by Aydiner et al. (138). It was found that a FO/RO system using a NaCl draw
solution could be successful, with the total solid content increasing from 6.75 % (raw whey) to 28 %,
illustrating the potential of FO.
Page 28
Membrane distillation can be coupled with forward osmosis to recover water from the diluted draw
solution. In 2011, Chung et al. (139) applied this idea to the concentration of protein solutions using
concentrated NaCl solution as the draw solution and the same approach was taken for dye wastewater
treatment using a poly(acrylic acid) sodium (PAA-Na) salt as the draw solution (140). They found such
a hybrid system to be stable, repeatable, controllable and predictable and the combined system
performed better than an individual FO process (140). If a suitable draw solute can be found,
combining these two technologies might be an effective system for salty waste stream concentration
in the dairy industry.
(3) Salinity Gradient Power
The net energy obtained as water flows from a dilute feed to a draw solution of higher osmotic
pressure can be converted into electrical power (141-143). If seawater is used as the draw solution,
a maximum theoretical pressure of 26 bar, equivalent to a 270 m high water column, can be reached
if the volume on the concentrated solution side is fixed (144). A common approach is pressure
retarded osmosis (PRO), as illustrated in Figure 18. In this case, an FO membrane is used to dilute the
highly saline water (e.g. seawater) using less salty water (e.g. river water). The diluted solution leaving
the membrane module is split into two streams. One powers the turbine and generates electricity,
while the other is used to pressurise the incoming seawater via a pressure exchanger.
Reverse electrodialysis (RED) (141, 145) converts a similar osmotic gradient into electricity by
reversing the mechanism of electrodialysis. Cation and anion exchange membranes are stacked
between two electrodes (Figure 19), with high and low concentrations of salty water filling the
alternating compartments. Salt ions migrate from the high conductivity compartments to the low
conductivity compartments through the respective ion exchange membranes, resulting in an electron
flow from the anode to the cathode via an external electrical circuit.
It should be noted that neither PRO nor RED are designed for desalination. They can make use of the
salinity in a brine stream, however, before disposal. Clogging, scaling and fouling of membranes are
common issues for these systems, although RED is claimed to experience less fouling than PRO (146).
Pressure-retarded osmosis was found to be more attractive for power generation using concentrated
saline brines, because of the higher power density combined with higher energy recovery, whereas
reverse electrodialysis was more attractive for power generation using seawater and river water (141).
The availability of a large volume of diluted water and the environmental issues arising from the
generation of less salty streams for disposal has restricted the application of salinity gradient power.
A pilot scale evaluation of PRO in Norway that commenced in 2008 has now been abandoned as
uneconomical (147), but further trials are underway in Korea and Japan. RED is being tested at pilot
scale in the Netherlands and in Italy (148) but the outcomes have not been fully reported. In dairy
processing facilities, the salinity gradients that occur, where low and high salinity streams are merged,
could be converted into electrical energy using this approach.

Page 29
Figure 18: Conceptual representation of an energy conversion scheme using pressure-retarded
osmosis (PRO) ((141), reproduced with permission from Elsevier).
Figure 19: Conceptual representation of an energy conversion scheme using reverse electrodialysis
(RED) ((141), reproduced with permission from Elsevier).
(4) Membrane Capacitive Deionisation
Capacitive deionisation (CDI) is an electrostatic process where salt water is passed through an
electrode assembly. By applying an electrical voltage difference between two porous electrodes,
dissociated ions are adsorbed onto the oppositely charged electrodes, generating a desalinated
Page 30
product stream. When the capacity of the electrodes is reached, the polarity of the electrodes is
reversed, so ions will desorb from the electrodes into the water flow, generating a brine stream. This
is essentially an alternative technique to ion exchange for removing charged ions but where electricity
is used in place of chemicals for regeneration.
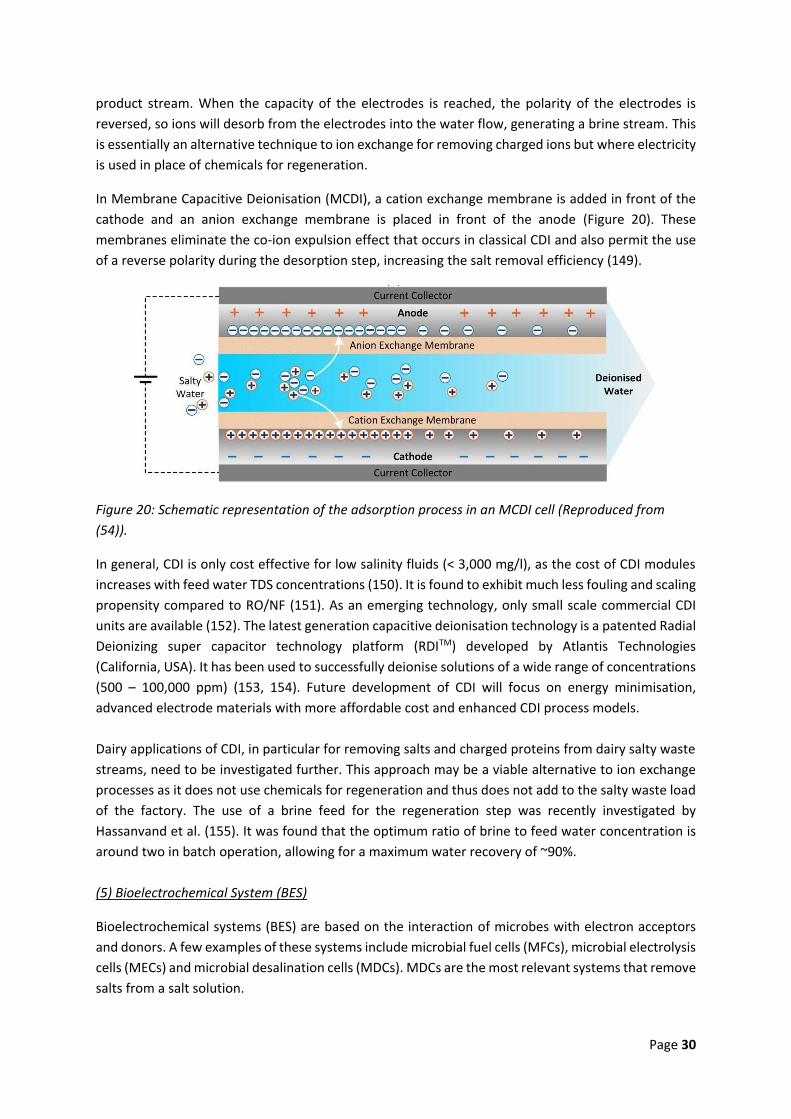
In Membrane Capacitive Deionisation (MCDI), a cation exchange membrane is added in front of the
cathode and an anion exchange membrane is placed in front of the anode (Figure 20). These
membranes eliminate the co-ion expulsion effect that occurs in classical CDI and also permit the use
of a reverse polarity during the desorption step, increasing the salt removal efficiency (149).
Figure 20: Schematic representation of the adsorption process in an MCDI cell (Reproduced from
(54)).
In general, CDI is only cost effective for low salinity fluids (< 3,000 mg/l), as the cost of CDI modules
increases with feed water TDS concentrations (150). It is found to exhibit much less fouling and scaling
propensity compared to RO/NF (151). As an emerging technology, only small scale commercial CDI
units are available (152). The latest generation capacitive deionisation technology is a patented Radial
Deionizing super capacitor technology platform (RDITM) developed by Atlantis Technologies
(California, USA). It has been used to successfully deionise solutions of a wide range of concentrations
(500 – 100,000 ppm) (153, 154). Future development of CDI will focus on energy minimisation,
advanced electrode materials with more affordable cost and enhanced CDI process models.
Dairy applications of CDI, in particular for removing salts and charged proteins from dairy salty waste
streams, need to be investigated further. This approach may be a viable alternative to ion exchange
processes as it does not use chemicals for regeneration and thus does not add to the salty waste load
of the factory. The use of a brine feed for the regeneration step was recently investigated by
Hassanvand et al. (155). It was found that the optimum ratio of brine to feed water concentration is
around two in batch operation, allowing for a maximum water recovery of ~90%.
(5) Bioelectrochemical System (BES)
Bioelectrochemical systems (BES) are based on the interaction of microbes with electron acceptors
and donors. A few examples of these systems include microbial fuel cells (MFCs), microbial electrolysis
cells (MECs) and microbial desalination cells (MDCs). MDCs are the most relevant systems that remove
salts from a salt solution.

Page 31
Figure 21: Schematic of the series of hydraulically connected MDCs under continuous operation (156).
As illustrated in Figure 21, a typical MDC consists of an anode chamber, a desalinating middle chamber,
a cathode chamber and ion exchange membranes. Exoelectrogenic bacteria, which are
microorganisms that have the ability to transfer electrons extracellularly, grow on the anode and
oxidize the organic and inorganic matters in the chamber, releasing electrons to the anode and
protons into the fluid that is contained in the anode chamber. Due to electron flow, protons are
consumed at the cathode, producing hydroxyl anions into the fluid that is contained in the cathode
chamber) (157). Similar to within an electrodialysis stack, anions in the middle chamber migrate to
the anode chamber and cations to the cathode chamber. Protons in the anode chamber are balanced
by the anions from the brine chamber through the anion exchange membrane, while hydroxyl ions
react with the cations from the brine. To increase the overall desalination performance, multiple pairs
of ion exchange membranes can be used or several MDCs can be arranged in series (158, 159). It
should be noted that as the feed salinity increases (>41 g/L TDS), the exoelectrogenic activity of the
bacteria is inhibited. For a salinity greater than 46 g/L TDS, it was found that bacterial community
permanently losses the exoelectrogenic activity (160). Hence, more research is required in the
microbial community to increase microbial salinity tolerance for extended time of acclimation in
bioelectrochemical systems (161).

Page 32
3. PERFORMANCE PARAMETERS
The minimum theoretical work required for removing water from brine can be calculated from
thermodynamic considerations and is a useful measure for compassion across the systems introduced
above. For example, the minimum energy requirement for desalinating seawater to 33,000 ppm at
25oC is 0.77kW/m3 (162). Depending on the type of process used, current desalination processes use
5 – 26 times as much energy as the theoretical minimum (163).
Figure 22 presents the energy consumption and production cost of some commercial and emerging
energies and the maximum feedwater salinity that can be treated, based on the data summarised in
Tables 3 and 4. The range shown for energy consumption and cost of water produced reflect the
variation in feed water concentration, water recovery, as well as the size of plant (164). Data is
available for most of the commercial technologies at industrial scale (up to >60,000 m3/day). Since the
emerging technologies are less mature, data is scarce and performance often based only on laboratory
scale or pilot plant operations. The salinity of the maximum feedwater shown in Figure 22 for these
emerging technologies (ED, MD, MCDI, and FO) reflects these limitations in available data. For
example, MD is more likely to be useful for feed salinities of 100,000 to 200,000 ppm TDS but the only
data available for energy consumption and cost is at 63,000 ppm TDS. Energy consumption and
production costs are also expected to increase as feed water salinity increases. Large scale operation
is needed to further validate these parameters.
For commercial technologies, the energy consumption per cubic meter of feed water increases
exponentially with the increasing salinity level of the feed water (Figure 22 (a)). The range of
processing cost for 1 cubic meter of product water, however, appears less dependent upon this
feedwater salinity (Figure 22 (b)). Although an individual technology can seem to have a relatively low
energy consumption, often multiple technology steps will be required, e.g. for ZLD processes this will
increase both capital costs and operating costs. Further research needs to be conducted on process
integration of such technology series to achieve reductions in brine disposal costs and high water
recovery to increase the competitiveness of these approaches.

Page 33
Figure 22: Energy consumption (a) and processing cost (b) of various commercial and emerging
technologies processing salty water and their maximum feed stream salinity. (*For ED, MD, MCDI and
FO, the energy consumption and processing cost reported are specific to the feed water salinity
specified in the Remarks in Table 3 and Table 4. These salinity values are used for plotting this figure.)

Page 34
Table 3: Performance indicators for some of the commercial technologies discussed in Section 3.1.
Group Technology
Feed Stream Salinity
Concentrate/Brine Fresh Water Quality
Energy# Processing
Cost Remarks
References
TDS, ppm TDS, ppm TDS, ppm kWh/m3
feedwater $/m3 product
water TDS Energy/Costs
Thermal Technologies
Evaporation Ponds * * no limit, for brine disposal
Thermal Desalination
70,000 - 170,000* 200,000 - 300,000** < 10 20 - 27^
14 - 22^^ 7 - 16^^^
0.6 – 1.8^ 0.5 - 1.5^^
0.9 – 2.6^^^
* Brine Concentrator ** Oilfield brine feed ^ Multi-stage flash (MSF)/Seawater ^^ Multi-Effect Distillation (MED)/Seawater (plant size: >12,000 m3/day) ^^^ Vapour Compression (VC)/Seawater
(165), (166), (167)
(163)
Thermal Crystallisers no limit* No limit including
solids* 100-500* 53-66
* SaltMakerTM
(168) (10)
Spray Dryers > 50 Used only for small flow (<45 L/min) (35)
Ion Exchange Ion Exchange (IE) 100 – 500 (8), (165)
Membrane Technologies
Nanofiltration (NF) 1,000 – 2,500 0.6 – 1.2 (24)
Reverse Osmosis (RO) 150 - 50,000 ~70,000** 1-10* 4 - 6^ 0.45 – 1.62^
* Triple stage RO ** Seawater RO ^ Seawater RO (plant size: >15,000 m3/day)
(169), (170), (171)
(163)
Patented High-Recovery RO Systems
5,000 - 70,000** 50,000 - 75,000* up to 150,000**
3-5^
6-8**
* High efficiency RO ** Brine squeezer ^ HEROTM process (brackish water)
(167)* (52)**
(163, 172)
Electrodialysis (ED) 3,000* - 100,000 >290,000^^^ 500**
0.7- 2.5^
5 - 8^^ 8-14^^^
0.6-1.1^
* Most cost-effective for low TDS feed ** Product water of a three-stage system ^ ED of brackish water (10,000 ppm) ^^ED of RO brine ^^^ ED series, from coal mine brine (33 g/L)
(170), (173), (166), (59)
(163)^, (59), (60)^^,
(174)^^^
# Conversion factor for thermal energy to equivalent electrical energy is assumed to be 30% (163, 175).

Page 35
Table 4: Some performance indicators for some of the emerging technologies discussed in Section 3.2.
Group Technology
Feed Stream Salinity
Concentrate/Brine Fresh Water
Quality Energy
Processing Cost
Remarks
References
TDS, ppm TDS, ppm TDS, ppm kWh/m3
feedwater $/m3 product
water TDS
Energy /Costs
Thermal Technologies
Aquamill 70,000 <60 (73)
Ohmic Evaporator >80,000 >218 (66)
Clathrate or hydrate formation processes
0.46-0.52
From seawater
(99)
Membrane Technologies
Membrane Distillation (MD)
< 200,000* ~250,000 –
up to 360,000** 2-10*
10.3-13.2^^
0.61-1.72^
** Feed stream: groundwater and salty whey, DCMD ^ Eco. Evaluation with different energy sources (up to 30,000 ppm feed) ^^ Concentrate from thermal desalination plants (TDS 1.4-1.8 times of raw sea water: ~63,000 ppm)
(176)*, (15, 177)** (177)^
(172, 178)^^
Forward Osmosis (FO)
<200,000 150,000 - 250,000* 21^
* FO membrane brine concentrator ^ feed salinity of 73 g/L, with NH3/CO2 draw solution
(125)*, (179) (180)^
Salinity Gradient Power
- 1MW/m3
fresh water*
*11-15 bar, ambient temperature, seawater PRO
(144)
Membrane Capacitive Deionization (MCDI)
< 100,000* 1-5^
~5.6**
* RDITM, Eagle-Ford shale gas “produced” water ** For 10,000 ppm feed ^ AQWATEC research report, for 88-89% removal, feed water TDS 2,500 - 6,000 ppm
(149), (153)* (181)^, (153)**

Page 36
4. CONCLUSIONS
The present technology review describes a wide range of separation technologies that are available
for demineralization and desalination of saline effluents. The major limitations and the potential of
both commercial and emerging approaches is presented, with a focus on application to the high
salinity wastewater that is an increasing problem for the dairy industry. Generally, the energy required
for desalination increases exponentially with feedwater salinity, from a low of 0.6 kWh/m3 to over 50
kWh/m3 of product water if crystallised salt is to be produced. To provide a permanent solution to the
environmental concerns and the increasing regulatory requirements associated with salty waste
streams, however, a combination of technologies will likely need to be integrated within a zero liquid
discharge approach. This will add to both the overall cost and the total energy requirements. These
costs but must be balanced, however, against the likely regulatory costs and environmental impacts
of not taking action.
ACKNOWLEDGEMENTS
This research was supported under Australian Research Council's Industrial Transformation Research
Program (ITRP) funding scheme (project number IH120100005). The ARC Dairy Innovation Hub is a
collaboration between The University of Melbourne, The University of Queensland and Dairy
Innovation Australia Ltd.

Page 37
REFERENCES
1. Dairy Australia (2016) Australian Dairy Industry In Focus 2016. Dairy Australia. Available from: https://www.dairyaustralia.com.au/-/media/dairyaustralia/documents/about-dairy-australia/key-publications/2016-in-focus.ashx?la=en&hash=663613D9E790F02D90D825E6C842C31BCB3F40D0 (Accessed 12 September, 2017).
2. Wilkinson, K.,Brooks, R.,Halliwell, D. (2004) Survey of dairy factory solid and liquid waste management practices. Closing the Loop: An holistic approach to the management of dairy processor waste streams. Department of Environment and Primary Industries, Queenscliff, Australia. Requested from Dairy Industry Association of Australia.
3. Aral, H. and Sleigh, R. (2007) Closing the Loop: An holistic approach to the management of dairy processor waste stream-Salt Recovery Strategies for New Value-Added Salt Products, Part Two.Department of Environment and Primary Industries, Queenscliff, Australia. Requested from Dairy Industry Association of Australia.
4. Aral, H.,Sleigh, R.,Simons, L. (2007) Closing the Loop: An holistic approach to the management of dairy processor waste streams-Salt Recovery Strategies for New Value-addd Salt products, Part One.Department of Environment and Primary Industries, Queenscliff, Australia. Requested from Dairy Industry Association of Australia.
5. Wilson, S.M. (2004) Dryland and urban salinity costs across the Murray-Darling Basin. An overview & guidelines for identifying and valuing the impacts.Murray-Darling Basin Commission, Canberra.
6. Chen, G.Q.,Talebi, S.,Gras, S.L.,Weeks, M.,Kentish, S.E. (2018) A Review of Salty Waste Stream Management in the Australian Dairy Industry. J. Environ. Manage., under review.
7. Fell, C. (2014) Discussion Paper for the Office of NSW Chief Scientist and Engineer: Water Treatment And Coal Seam Gas.FELL Consulting Pty Ltd.
8. Ahmad, M. and Williams, P. (2011) Assessment of desalination technologies for high saline brine applications — Discussion Paper. Desalin. Water Treat., 30(1-3): 22-36.
9. Morillo, J.,Usero, J.,Rosado, D.,El Bakouri, H.,Riaza, A.,Bernaola, F.-J. (2014) Comparative study of brine management technologies for desalination plants. Desalination, 336: 32-49.
10. Mickley, M. (2008) Survey of high-recovery and zero liquid discharge technologies for water utilities. WateReuse Foundation, Alexandria, VA.
11. Pérez-González, A.,Urtiaga, A.M.,Ibáñez, R.,Ortiz, I. (2012) State of the art and review on the treatment technologies of water reverse osmosis concentrates. Water Res., 46(2): 267-283.
12. Benko, K.L. and Drewes, J.E. (2008) Produced Water in the Western United States: Geographical Distribution, Occurrence, and Composition. Environ. Eng. Sci., 25(2): 239-246.
13. Durham, R.J. and Hourigan, J.A. (2009) Waste management and co-product recovery in dairy processing in Waldron, K. (Ed) Handbook of Waste Management and Co-Product Recovery in Food Processing, Volume 1;Woodhead Publishing Limited and CRC Press LLC.
14. Baskaran, K.B.,Jamil, K.,Farago, L.,Jeyaseelan, S.,Wang, M. (2007) Closing the Loop: An holistic approach to the management of dairy processor waste streams-Evaluation of Technologies for Removal of Salts from Wastewater Streams in Dairy Processing Industries, Final Milestone Report.Department of Primary Industries, Queenscliff, Australia. Requested from Dairy Inducstry Association of Australia.
15. Kezia, K.,Lee, J.,Weeks, M.,Kentish, S. (2015) Direct contact membrane distillation for the concentration of saline dairy effluent. Water Res., 81: 167-177.
16. Feijoo, G.,Soto, M.,Méndez, R.,Lema, J.M. (1995) Sodium inhibition in the anaerobic digestion process: Antagonism and adaptation phenomena. Enzyme Microb. Technol., 17(2): 180-188.
17. Chen, Y.,Cheng, J.J.,Creamer, K.S. (2008) Inhibition of anaerobic digestion process: A review. Bioresour. Technol., 99(10): 4044-4064.

Page 38
18. Ahmed, M.,Shayya, W.H.,Hoey, D.,Mahendran, A.,Morris, R.,Al-Handaly, J. (2000) Use of evaporation ponds for brine disposal in desalination plants. Desalination, 130(2): 155-168.
19. Gilron, J.,Folkman, Y.,Savliev, R.,Waisman, M.,Kedem, O. (2003) WAIV — wind aided intensified evaporation for reduction of desalination brine volume. Desalination, 158(1–3): 205-214.
20. Katzir, L.,Volkmann, Y.,Daltrophe, N.,Korngold, E.,Mesalem, R.,Oren, Y.,Gilron, J. (2010) WAIV - Wind aided intensified evaporation for brine volume reduction and generating mineral byproducts. Desalin. Water Treat., 13(1-3): 63-73.
21. Mickly, M. (2010) State-of-the-Science White Paper: Brackish ground water concentrate mangement. Prepared for New Mexico State University (NMSU) and Consortium for High Technology Investigations on Water and Wastewater(CHIWAWA), Boulder, Colorado.
22. Kalogirou, S. (1997) Survey of solar desalination systems and system selection. Energy, 22(1): 69-81.
23. Ettouney, H. (2006) Design of single-effect mechanical vapor compression. Desalination, 190(1): 1-15.
24. Asano, T.,Burton, F.,Leverenz, H.,Tsuchihashi, R.,Tchobanoglous, G. (2007) Water Reuse Issues, Technologies, and Applications;McGraw-Hill.
25. Kutz, M. (2013) Handbook of Farm, Dairy and Food Machinery Engineering; Elsevier Science 26. Tinos, NTUA, Culligan S.A (2012) Report on the evaluation of existing methods of brine
treatment and disposal practices (LIFE+Environment project: LIFE 09 ENV/GR/000299).Greece. 27. Griffin, S.J., Schooley, K.E.,Solomon, R.L. (2011) The advantage of mixed salt crystallizers in zero
liquid discharge (ZLD) wastewater treatment systems. 28. Bylund, G. and Hellman, M. (2015) Dairy processing handbook;Tetra Pak Processing
Systems:Lund, Sweden. 29. Kezia, K.,Lee, J.,Zisu, B.,Chen, G.Q.,Gras, S.L.,Kentish, S.E. (2017) Solubility of Calcium Phosphate
in Concentrated Dairy Effluent Brines. J. Agric. Food. Chem., 65(20): 4027-4034. 30. Kezia, K.,Lee, J.,Zisu, B.,Weeks, M.,Chen, G.,Gras, S.,Kentish, S. (2016) Crystallisation of minerals
from concentrated saline dairy effluent. Water Res., 101: 300-308. 31. Christansen, O.B. (2012) Successful spray drying. Ceramic Industry, 152(6): 60. 32. Augustin, M.A. and Hemar, Y. (2009) Nano- and micro-structured assemblies for encapsulation
of food ingredients. Chem. Soc. Rev., 38(4): p. 902-912. 33. GEA.com (2017) Zero Liquid Discharge, Reduce end-of-pipe streams, increase values. Available
from: http://www.gea.com/en/binaries/zld-wastewater-agrochemicals-mining-oil-brine-gea_tcm11-34824.pdf (accessed 21 August, 2017).
34. Center for Integrated Water Research (2010) Concentrate Management, Finance - Zero Liquid Discharge Available from: https://ciwr.soe.ucsc.edu/sites/default/files/ICM_D7.pdf (accessed 20 August, 2017).
35. Mackey, E.D. and Seacord, T. (2008) Regional Solution for Concentration Management, Water Reuse Research Foundation, Final Report.
36. Yang, Y.,Gao, X.,Fan, A.,Fu, L.,Gao, C. (2014) An innovative beneficial reuse of seawater concentrate using bipolar membrane electrodialysis. J. Membr. Sci., 449: 119-126.
37. GEO-PROCESSORS USA, I. (2006) SAL-PROCTM. Available from: http://www.geoprocessors.com/salproc.html (accessed 12 August, 2018).
38. Arakel, A.,Tian, H.,Stapleton, J. (2009) Process for the Treatment of Saline Water. United States Patent Number 7,595,001 B2.
39. Nath, K. (2008) Membrane separation processes;PHI Learning Pvt. Ltd 40. Oatley-Radcliffe, D.L.,Walters, M.,Ainscough, T.J.,Williams, P.M.,Mohammad, A.W.,Hilal, N.
(2017) Nanofiltration membranes and processes: A review of research trends over the past decade. J. Water Proc. Eng., 19: 164-171.
41. KOCH Membrane Systems (2017) Recovery of Caustic and Acids in the Dairy Industry. Available from: http://www.kochmembrane.com/resources/application-bulletins/recovery-of-caustic-and-acids-in-the-dairy-industr.aspx (accessed 09 September, 2017).

Page 39
42. Chandrapala, J.,Chen, G.Q.,Kezia, K.,Bowman, E.G.,Vasiljevic, T.,Kentish, S.E. (2016) Removal of lactate from acid whey using nanofiltration. J. Food Eng., 177: 59-64.
43. Bédas, M.,Tanguy, G.,Dolivet, A.,Méjean, S.,Gaucheron, F.,Garric, G.,Senard, G.,Jeantet, R.,Schuck, P. (2017) Nanofiltration of lactic acid whey prior to spray drying: Scaling up to a semi-industrial scale. LWT - Food Science and Technology, 79: 355-360.
44. Heldman, D.R.,Lund, D.B.,Sabliov, C. (2006) Handbook of Food Engineering, Second Edition;Taylor & Francis
45. Greenlee, L.F.,Lawler, D.F.,Freeman, B.D.,Marrot, B.,Moulin, P. (2009) Reverse osmosis desalination: Water sources, technology, and today's challenges. Water Res., 43(9): 2317-2348.
46. Dairy Australia (2004) Eco-effi ciency for Australian dairy processors, Fact sheet 10: Membranes. 47. Baker, R.W. (2004) Membrane technology and application;John Willey &Sons Ltd:Menlo Park,
California. 48. Leong, J.,Tan, J.,Heitz, A.,Ladewig, B.P. (2016) Use of vibratory shear enhanced processing to
treat magnetic ion exchange concentrate: A techno-economic analysis. Desalination, 383: 46-52.
49. New Logic Research (2017) Industries-Food & Beverage-Dairy processing. Available from: http://www.vsep.com/industries/dairy-processing.html (accessed 10 August, 2017).
50. Shi, W. and Benjamin, M.M. (2009) Fouling of RO membranes in a vibratory shear enhanced filtration process (VSEP) system. J. Membr. Sci., 331(1): 11-20.
51. Aquatech (2014) High Efficiency Reverse Osmosis (HEROTM). Available from: http://www.aquatech.com/innovations/high-efficiency-reverse-osmosis/ (accessed 03 August, 2017).
52. OSMOFLO (2017) Osmoflo Brine Squeezer Technology, Patented technology to maximise recovery of reject brine from reverse osmosis. Available from: http://www.osmoflo.com/globalassets/ourcapabilities/osmoflo-brine-squeezer---obs.pdf (accessed 01 September, 2017).
53. Waterions (2012) Overview: Electrodialysis Reversal. Available from: http://waterions.aceenvironment.com/edr (accessed 07 August, 2017).
54. Hassanvand, A.,Wei, K.,Talebi, S.,Chen, G.,Kentish, S. (2017) The Role of Ion Exchange Membranes in Membrane Capacitive Deionisation. Membranes, 7(3): 54.
55. Tanaka, Y. (2009) A computer simulation of continuous ion exchange membrane electrodialysis for desalination of saline water. Desalination, 249(2): 809-821.
56. Tanaka, Y. (2010) A computer simulation of feed and bleed ion exchange membrane electrodialysis for desalination of saline water. Desalination, 254(1): 99-107.
57. Reig, M.,Casas, S.,Aladjem, C.,Valderrama, C.,Gibert, O.,Valero, F.,Centeno, C.M.,Larrotcha, E.,Cortina, J.L. (2014) Concentration of NaCl from seawater reverse osmosis brines for the chlor-alkali industry by electrodialysis. Desalination, 342: 107-117.
58. Casas, S.,Aladjem, C.,Cortina, J.L.,Larrotcha, E.,Cremades, L.V. (2012) Seawater Reverse Osmosis Brines as a New Salt Source for the Chlor-Alkali Industry: Integration of NaCl Concentration by Electrodialysis. Solvent Extr. Ion Exch., 30(4): 322-332.
59. Oren, Y.,Korngold, E.,Daltrophe, N.,Messalem, R.,Volkman, Y.,Aronov, L.,Weismann, M.,Bouriakov, N.,Glueckstern, P.,Gilron, J. (2010) Pilot studies on high recovery BWRO-EDR for near zero liquid discharge approach. Desalination, 261(3): 321-330.
60. Korngold, E.,Aronov, L.,Daltrophe, N. (2009) Electrodialysis of brine solutions discharged from an RO plant. Desalination, 242(1): 215-227.
61. Chen, G.Q.,Eschbach, F.I.I.,Weeks, M.,Gras, S.L.,Kentish, S.E. (2016) Removal of lactic acid from acid whey using electrodialysis. Sep. Purif. Technol., 158: 230-237.
62. McGovern, R.K.,Zubair, S.M.,Lienhard V, J.H. (2014) The benefits of hybridising electrodialysis with reverse osmosis. J. Membr. Sci., 469: 326-335.
63. Wang, L.K.,Chen, J.P.,Hung, Y.T.,Shammas, N.K. (2010) Membrane and Desalination Technologies;Humana Press

Page 40
64. Mazrou, S.,Kerdjoudj, H.,T. Cherif, A.,Elmidaoui, A.,Molenat, J. (1998) Regeneration of hydrochloric acid and sodium hydroxide with bipolar membrane electrodialysis from pure sodium chloride. New J. Chem., 22(4): 355-361.
65. Wei, Y.,Wang, Y.,Zhang, X.,Xu, T. (2011) Treatment of simulated brominated butyl rubber wastewater by bipolar membrane electrodialysis. Sep. Purif. Technol., 80(2): 196-201.
66. Assiry, A.M. (2011) Application of ohmic heating technique to approach near-ZLD during the evaporation process of seawater. Desalination, 280(1): 217-223.
67. Sakr, M. and Liu, S. (2014) A comprehensive review on applications of ohmic heating (OH). Renew. Sust. Energ. Rev., 39: 262-269.
68. Sabanci, S. and Icier, F. (2017) Applicability of ohmic heating assisted vacuum evaporation for concentration of sour cherry juice. J. Food Eng., 212: 262-270.
69. Icier, F.,Yildiz, H.,Sabanci, S.,Cevik, M.,Cokgezme, O.F. (2017) Ohmic heating assisted vacuum evaporation of pomegranate juice: Electrical conductivity changes. Innov. Food Sci. Emerg. Technol., 39: 241-246.
70. Darvishi, H.,Hosainpour, A.,Nargesi, F.,Fadavi, A. (2015) Exergy and energy analyses of liquid food in an Ohmic heating process: A case study of tomato production. Innov. Food Sci. Emerg. Technol., 31: 73-82.
71. Aquamill (2013) Aquamill Unit - How does it work? Available from: http://aquamill.com.au/pages/how-does-it-work.html (accessed 20 August, 2017).
72. Zmood, R.B.,Withington, S.J.,Botcher, C.N. Device for heating a liquid comprising a solvent and solute, and separating the solvent and solution. WO2011103622A1, 2012.
73. Aquamill (2016) Aquamill Unit - Technical Specification. Available from: http://aquamill.com.au/images/pdf/Technical_Specifications_2016.pdf (accessed 20 August, 2017).
74. Williams, P.M., Ahmad, M., Connolly, B.S., Oatley-Radcliffe, D.L. (2015) Technology for freeze concentration in the desalination industry. Desalination, 356: p. 314-327.
75. Giavarini, C. and Hester, K. (2011) The Structure and Formation of Gas Hydrates Gas Hydrates: Immense Energy Potential and Environmental Challenges;Springer London:London.
76. Byrd, L.W. and Mulligan, J.C. (1986) A population balance approach to direct-contact secondary refrigerant freezing. AlChE J., 32(11): 1881-1888.
77. Rice, W. and Chau, D.S.C. (1997) Freeze desalination using hydraulic refrigerant compressors. Desalination, 109(2): 157-164.
78. Rahman, M.S.,Ahmed, M.,Chen, X.D. (2007) Freezing-melting process and desalination: review of present status and future prospects. Int. J. Nucl. Desalination, 2(3): 253-264.
79. (2013) Freeze Desalination: a look back. Water Desalination Report, 49(27). 80. Witkamp, G.-J.,Vrijenhoef, J.P.,Graauw, J.D.,Van, D.H.F. (2001) Crystallisation of materials from
aqueous solutions. Canadian Patent Number CA 2388812 A1. 81. van der Ham, F.,Witkamp, G.J.,de Graauw, J.,van Rosmalen, G.M. (1998) Eutectic freeze
crystallization: Application to process streams and waste water purification. Chem. Eng. Process.: Process Intensification, 37(2): 207-213.
82. Randall, D.G.,Nathoo, J.,Lewis, A.E. (2011) A case study for treating a reverse osmosis brine using Eutectic Freeze Crystallization—Approaching a zero waste process. Desalination, 266(1–3): 256-262.
83. Fernández-Torres, M.J.,Randall, D.G.,Melamu, R.,von Blottnitz, H. (2012) A comparative life cycle assessment of eutectic freeze crystallisation and evaporative crystallisation for the treatment of saline wastewater. Desalination, 306(0): 17-23.
84. EFC Separations (2012) The EFC-separation process. Available from: http://www.efc.nl/the-efc-process/ (accessed 11 September, 2017).
85. Ruecroft, G.,Hipkiss, D.,Ly, T.,Maxted, N.,Cains, P.W. (2005) Sonocrystallization: The Use of Ultrasound for Improved Industrial Crystallization. Org. Process Res. Dev., 9(6): 923-932.

Page 41
86. Luque de Castro, M.D. and Priego-Capote, F. (2007) Ultrasound-assisted crystallization (sonocrystallization). Ultrason. Sonochem., 14(6): 717-724.
87. Feng, H.,Barbosa-Cánovas, G.,Weiss, J. (2010) Ultrasound Technologies for Food and Bioprocessing;Springer
88. Ruecroft, G.,Hipkiss, D.,Fennell, M., Improving the bayer process by power ultrasound induced crystallization (sonocrystallization) of key impurities. In 134th The Minerals, Metals & Materials Society Annual Meeting, Kvande, H., Ed. TMS, San Francisco, California, 2005; pp 163-166.
89. Arends, B.J.,Blindt, R.A.,Jassen, J.,Patrick, M. (2002) Crystallisation process using ultrasound. World Patent Number WO 2002005921 A1.
90. Bund, R.K. and Pandit, A.B. (2007) Sonocrystallization: Effect on lactose recovery and crystal habit. Ultrason. Sonochem., 14(2): 143-152.
91. Patel, S.R. and Murthy, Z.V.P. (2012) Lactose Recovery Processes from Whey: A Comparative Study Based on Sonocrystallization. Sep. Purif. Rev., 41(4): 251-266.
92. Dhumal, R.,Biradar, S.,Paradkar, A.,York, P. (2008) Ultrasound Assisted Engineering of Lactose Crystals. Pharm. Res., 25(12): 2835-2844.
93. Zisu, B.,Sciberras, M.,Jayasena, V.,Weeks, M.,Palmer, M.,Dincer, T.D. (2014) Sonocrystallisation of lactose in concentrated whey. Ultrason. Sonochem., 21(6): 2117-2121.
94. Klass, D. (1974) Hydrate forming in water desalination. US Patent Number 3856492 A. 95. McCormack, R.A. (1996) Clathrate freeze desalination apparatus and method. US Patent
Number 5553456 A. 96. McCormack, R.A. and Andersen, R.K. (1995) Clathrate Desalination Plant - Preliminary research
study. Thermal Energy Storage, Inc., San Diego, CA (United States) 97. McCormack, R.A. and Ripmeester, J.A. (2012) Clathrate desalination process using an ultrasonic
actuator. World Patent Number WO2013049253 A1. 98. Cai, L.,Pethica, B.A.,Debenedetti, P.G.,Sundaresan, S. (2014) Formation kinetics of
cyclopentane–methane binary clathrate hydrate. Chem. Eng. Sci., 119(0): 147-157. 99. Kelley, L. (2015) How Can Clathrate Hydrates Be Used for Water Desalination? Available from:
http://theoriginal1701.hubpages.com/hub/Water-Desalination-Process-Using-Hydrates# (accessed 14 August, 2017).
100. Bradshaw, R.W.,Greathouse, J.A.,Cygan, R.T.,Simmons, B.A.,Dedrick, D.E.,Majzoub, E.H. (2008) Desalination Utilizing Clathrate Hydrates (LDRD Final Report). Sandia National Laboratories, U.S. Department of Commerce.
101. Khaled, M.,Abu-Sharkh, B.,Amr, E.,Yilbas, B.S.,Manda, A.,Abulkibash, A. (2007) Corrosion properties of 316L stainless steel coated with polyelectrolyte multilayers of varying anionic acidity. Corrosion Engineering, Sci. Technol., 42(4): 356-362.
102. Farhat, T.R. and Schlenoff, J.B. (2002) Corrosion Control Using Polyelectrolyte Multilayers. Electrochem. Solid-State Lett., 5(4): B13-B15.
103. Transport Information Service (2017) Classification of corrosion protection methods. Available from: http://www.tis-gdv.de/tis_e/verpack/korrosio/schutz/schutz.htm (accessed 03 September, 2017).
104. Tallman, D.,Spinks, G.,Dominis, A.,Wallace, G. (2002) Electroactive conducting polymers for corrosion control. J. Solid State Electrochem., 6(2): 73-84.
105. Sitaram, S.P.,Stoffer, J.O.,O’Keefe, T.J. (1997) Application of conducting polymers in corrosion protection. J. Coat. Technol., 69(866): 65-69.
106. Rupprecht, L. (1999) Conductive Polymers and Plastics: In Industrial Applications;Elsevier Science
107. Inzelt, G. (2012) Conducting Polymers: A New Era in Electrochemistry;Springer 108. Celanese (2017) CoolPoly E-series - Thermally & Electrically Conductive Plastics. Available from:
https://www.celanese.com/engineered-materials/products/CoolPoly-TCP/coolpoy-e-series.aspx (accessed 25 September, 2017).

Page 42
109. Sherman, L.M. (2001) Plastics tthat conduct heat. Available from: http://www.ptonline.com/articles/plastics-that-conduct-heat (accessed 24 September, 2017).
110. M, V.P.,Bayraktar, O.,Picó, G.A. (2014) Polyelectrolytes: Thermodynamics and Rheology;Springer International Publishing
111. El-Bourawi, M.S.,Ding, Z.,Ma, R.,Khayet, M. (2006) A framework for better understanding membrane distillation separation process. J. Membr. Sci., 285(1-2): 4-29.
112. Kayet, M.S. and Matsuura, T. (2011) Membrane Distillation Principle and Application;Elsevier:Amsterdam, The Netherlands.
113. Lawson, K.W. and Lloyd, D.R. (1997) Membrane distillation. J. Membr. Sci., 124(1): 1-25. 114. Smolders, K. and Franken, A.C.M. (1990) Terminology for membrane distillation. Chemical. Eng.
Prog., (3): 249. 115. Yun, Y.,Ma, R.,Zhang, W.,Fane, A.G.,Li, J. (2006) Direct contact membrane distillation
mechanism for high concentration NaCl solutions. Desalination, 188(1-3): 251-262. 116. Khayet Souhaimi, M. and Matsuura, T. (2011) Membrane Distillation: Principles and
Applications;Burlington : Elsevier Science, 2011. 117. Alklaibi, A.M. and Lior, N. (2005) Membrane-distillation desalination: Status and potential.
Desalination, 171(2): 111-131. 118. Drioli, E.,Ali, A.,Macedonio, F. Membrane distillation: Recent developments and perspectives.
Desalination, 356: 56-84. 119. SolarSpring (2016) MDPilot Process and Waste Water Treatment. Available from:
http://www.solarspring.de/index.php?id=12 (accessed 12 March, 2018) 120. Hausmann, A.,Sanciolo, P.,Vasiljevic, T.,Ponnampalam, E.,Quispe-Chavez, N.,Weeks, M.,Duke,
M. (2011) Direct Contact Membrane Distillation of Dairy Process Streams. Membranes, 1(1): 48-58.
121. Christensen, K.,Andresen, R.,Tandskov, I.,Norddahl, B.,du Preez, J.H. (2006) Using direct contact membrane distillation for whey protein concentration. Desalination, 200(1–3): 523-525.
122. Hausmann, A.,Sanciolo, P.,Vasiljevic, T.,Kulozik, U.,Duke, M. (2014) Performance assessment of membrane distillation for skim milk and whey processing. J. Dairy Sci., 97(1): 56-71.
123. Moody, C.,Yi, D.,Riley, R.,Kessler, J.O.,Norris, M. (2013) Desalination by fowardy osmosis. Available from: https://www.usbr.gov/research/projects/download_product.cfm?id=726 (accessed 12 October, 2017)
124. McCutcheon, J.R.,McGinnis, R.L.,Elimelech, M. (2006) Desalination by ammonia–carbon dioxide forward osmosis: Influence of draw and feed solution concentrations on process performance. J. Membr. Sci., 278(1–2): 114-123.
125. Coday, B.D.,Xu, P.,Beaudry, E.G.,Herron, J.,Lampi, K.,Hancock, N.T.,Cath, T.Y. (2014) The sweet spot of forward osmosis: Treatment of produced water, drilling wastewater, and other complex and difficult liquid streams. Desalination, 333(1): 23-35.
126. Phuntsho, S.,Kim, J.E.,Johir, M.A.H.,Hong, S.,Li, Z.,Ghaffour, N.,Leiknes, T.,Shon, H.K. (2016) Fertiliser drawn forward osmosis process: Pilot-scale desalination of mine impaired water for fertigation. J. Membr. Sci., 508: 22-31.
127. Hydration Technology Innovations (2010) Applying HTI’s Forward Osmosis Technology to Landfill Leachate Treatment. Available from: http://futuretechme.com/downloads/forward-
osmosis/Landfill%20Leachate.PDF (accessed 22 August, 2017). 128. Cath, T.Y.,Gormly, S.,Beaudry, E.G.,Flynn, M.T.,Adams, V.D.,Childress, A.E. (2005) Membrane
contactor processes for wastewater reclamation in space: Part I. Direct osmotic concentration as pretreatment for reverse osmosis. J. Membr. Sci., 257(1–2): 85-98.
129. Cath, T.Y.,Adams, D.,Childress, A.E. (2005) Membrane contactor processes for wastewater reclamation in space: II. Combined direct osmosis, osmotic distillation, and membrane distillation for treatment of metabolic wastewater. J. Membr. Sci., 257(1–2): 111-119.
130. Holloway, R.W.,Childress, A.E.,Dennett, K.E.,Cath, T.Y. (2007) Forward osmosis for concentration of anaerobic digester centrate. Water Res., 41(17): 4005-4014.

Page 43
131. Garcia-Castello, E.M.,McCutcheon, J.R.,Elimelech, M. (2009) Performance evaluation of sucrose concentration using forward osmosis. J. Membr. Sci., 338(1–2): 61-66.
132. McGinnis, R.L.,McCutcheon, J.R.,Elimelech, M. (2007) A novel ammonia–carbon dioxide osmotic heat engine for power generation. J. Membr. Sci., 305(1–2): 13-19.
133. Chung, T.-S.,Zhang, S.,Wang, K.Y.,Su, J.,Ling, M.M. (2012) Forward osmosis processes: Yesterday, today and tomorrow. Desalination, 287(0): 78-81.
134. Cath, T.Y.,Childress, A.E.,Elimelech, M. (2006) Forward osmosis: Principles, applications, and recent developments. J. Membr. Sci., 281(1): 70-87.
135. Piddock, G. (2013) Milk processing breakthrough. Available from: http://www.stuff.co.nz/business/farming/dairy/8924040/Milk-processing-breakthrough (accessed 25 July 2017).
136. Porifera (2017) Milk concentration with Porifera. Available from: https://static1.squarespace.com/static/5910fcb22e69cf8bc09a2db8/t/594ab226b8a79bed257e7030/1498067510687/MilkCaseStudy_final.pdf (accessed 26 July 2017).
137. Phuntsho, S.,Shon, H.,Hong, S.,Lee, S.,Vigneswaran, S.,Kandasamy, J. (2012) Fertiliser drawn forward osmosis desalination: the concept, performance and limitations for fertigation. Rev. Environ. Sci. Biotechnol., 11(2): 147-168.
138. Aydiner, C.,Sen, U.,Topcu, S.,Sesli, D.,Ekinci, D.,Altınay, A.D.,Ozbey, B.,Koseoglu-Imer, D.Y.,Keskinler, B. (2014) Techno-economic investigation of water recovery and whey powder production from whey using UF/RO and FO/RO integrated membrane systems. Desalin. Water Treat., 52(1-3): 123-133.
139. Wang, K.Y.,Teoh, M.M.,Nugroho, A.,Chung, T.-S. (2011) Integrated forward osmosis–membrane distillation (FO–MD) hybrid system for the concentration of protein solutions. Chem. Eng. Sci., 66(11): 2421-2430.
140. Ge, Q.,Wang, P.,Wan, C.,Chung, T.-S. (2012) Polyelectrolyte-Promoted Forward Osmosis–Membrane Distillation (FO–MD) Hybrid Process for Dye Wastewater Treatment. Environ. Sci. Technol., 46(11): 6236-6243.
141. Post, J.W.,Veerman, J.,Hamelers, H.V.M.,Euverink, G.J.W.,Metz, S.J.,Nymeijer, K.,Buisman, C.J.N. (2007) Salinity-gradient power: Evaluation of pressure-retarded osmosis and reverse electrodialysis. J. Membr. Sci., 288(1–2): 218-230.
142. Yip, N.Y.,Tiraferri, A.,Phillip, W.A.,Schiffman, J.D.,Hoover, L.A.,Kim, Y.C.,Elimelech, M. (2011) Thin-Film Composite Pressure Retarded Osmosis Membranes for Sustainable Power Generation from Salinity Gradients. Environ. Sci. Technol., 45(10): 4360-4369.
143. Norman, R.S. (1974) Water Salination: A Source of Energy. Science, 186(4161): 350-352. 144. Skilhagen, S.E.,Dugstad, J.E.,Aaberg, R.J. (2008) Osmotic power — power production based on
the osmotic pressure difference between waters with varying salt gradients. Desalination, 220(1–3): 476-482.
145. Post, J.W.,Hamelers, H.V.M.,Buisman, C.J.N. (2008) Energy Recovery from Controlled Mixing Salt and Fresh Water with a Reverse Electrodialysis System. Environ. Sci. Technol., 42(15): 5785-5790.
146. Vermaas, D.A.,Kunteng, D.,Saakes, M.,Nijmeijer, K. (2013) Fouling in reverse electrodialysis under natural conditions. Water Res., 47(3): 1289-1298.
147. Achilli, A. and Hickenbottom, K.L. (2016) 3 - Pressure retarded osmosis: Applications in Sustainable Energy from Salinity Gradients;Woodhead Publishing
148. Cipollina, A.,Micale, G.,Tamburini, A.,Tedesco, M.,Gurreri, L.,Veerman, J.,Grasman, S. (2016) 5 - Reverse electrodialysis: Applications in Sustainable Energy from Salinity Gradients;Woodhead Publishing
149. Biesheuvel, P.M. and van der Wal, A. (2010) Membrane capacitive deionization. J. Membr. Sci., 346(2): 256-262.

Page 44
150. Zhao, R.,Porada, S.,Biesheuvel, P.M.,van der Wal, A. (2013) Energy consumption in membrane capacitive deionization for different water recoveries and flow rates, and comparison with reverse osmosis. Desalination, 330: 35-41.
151. AlMarzooqi, F.A.,Al Ghaferi, A.A.,Saadat, I.,Hilal, N. (2014) Application of Capacitive Deionisation in water desalination: A review. Desalination, 342(0): 3-15.
152. Current Water Technologies Inc. (2016) Electro Static Deionization. Available from: http://www.currentwatertechnologies.com/electro-static-deionization (accessed 02 September, 2017).
153. AtlantisTechnologies (2017) Technical Summary Radial Deionization. Available from: http://www.atlantis-water.com/solutions-2/ (accessed 20 August, 2017).
154. Curran, P.M. (2016) Concentric layer electric double layer capacitor cylinder, system, and method of use. US Patent Number 20160096751 A1.
155. Hassanvand, A.,Chen, G.Q.,Webley, P.A.,Kentish, S.E. (2017) Improvement of MCDI operation and design through experiment and modelling: Regeneration with brine and optimum residence time. Desalination, 417: 36-51.
156. Qu, Y.,Feng, Y.,Liu, J.,He, W.,Shi, X.,Yang, Q.,Lv, J.,Logan, B.E. (2013) Salt removal using multiple microbial desalination cells under continuous flow conditions. Desalination, 317(0): 17-22.
157. Kim, Y. and Logan, B.E. (2011) Microbial Reverse Electrodialysis Cells for Synergistically Enhanced Power Production. Environ. Sci. Technol., 45(13): 5834-5839.
158. Chen, X.,Xia, X.,Liang, P.,Cao, X.,Sun, H.,Huang, X. (2011) Stacked Microbial Desalination Cells to Enhance Water Desalination Efficiency. Environ. Sci. Technol., 45(6): 2465-2470.
159. Kim, Y. and Logan, B.E. (2011) Series Assembly of Microbial Desalination Cells Containing Stacked Electrodialysis Cells for Partial or Complete Seawater Desalination. Environ. Sci. Technol., 45(13): 5840-5845.
160. Kim, Y. and Logan, B.E. (2013) Simultaneous removal of organic matter and salt ions from saline wastewater in bioelectrochemical systems. Desalination, 308: 115-121.
161. Carmalin Sophia, A.,Bhalambaal, V.M.,Lima, E.C.,Thirunavoukkarasu, M. (2016) Microbial desalination cell technology: Contribution to sustainable waste water treatment process, current status and future applications. J. Environ. Chem. Eng., 4(3): 3468-3478.
162. Lachish, U. (2007) Osmosis and thermodynamics. Am. J. Phys., 75(11): 997-998. 163. Al-Karaghouli, A. and Kazmerski, L.L. (2013) Energy consumption and water production cost of
conventional and renewable-energy-powered desalination processes. Renew. Sust. Energ. Rev., 24: 343-356.
164. Karagiannis, I.C. and Soldatos, P.G. (2008) Water desalination cost literature: review and assessment. Desalination, 223(1): 448-456.
165. Ryan, L. (2011) Coal Seam Gas Water Management Considerations. Available from: https://www.spe-qld.org/useruploads/files/july_2011_spe_lunch_presentation_(larry_ryan).pdf (accessed 11 September, 2017).
166. URS Australia (2002) Summary Report - Introduction to Desalination Technologies in Australia. Department of Agriculture, Fisheries and Forestry (Australia).
167. GWI Desalination (2012) Fuzzy logic: oilfield brine management. Water Desalination Report, 48(14).
168. SaltworksTech (2014) SaltMaker - Low Temperature Crystallizer. Available from: http://www.saltworkstech.com/wp-content/uploads/2015/03/Saltworks_SaltMaker_Product_Sheet_EN.pdf (accessed 05 September, 2017).
169. Start, C.L. and Maurer, S.W. (2001) Evaluation of hydrometrics, Inc. High Efficiency Reverse Osmosis (HEROTM) Industrial Wastewater Treatment System; DIANE Publishing.
170. Aquamill (2016) Technology Overview (Public Distribution) - Aquamill water purification technology. Available from:

Page 45
http://aquamill.com.au/images/pdf/Aquamill%20Technology%20Overview-Public%20Distribution%202016.pdf (accessed 12 September, 2017).
171. Xavier, B.,Oriol, G.,Roger, G.,Joana, T.,Carlos, C. (2010) The economics of desalination for various uses Re-thinking Water and Food Security;CRC Press.
172. Subramani, A. and Jacangelo, J.G. (2014) Treatment technologies for reverse osmosis concentrate volume minimization: A review. Sep. Purif. Technol., 122: 472-489.
173. U.S. Department of the Interior and Reclamation and Bureau of Reclamation (2009) Reclamation-Managing Water in the West, Brine-Concentrate treatment and disposal options report, Southern California regional brine-concentrate management study - Phase I. Available from: http://s3-us-west-2.amazonaws.com/ucldc-nuxeo-ref-media/69c012ec-cae3-4b58-a56a-3a712960a918 (accessed 15 September, 2017)
174. Turek, M. (2004) Electrodialytic desalination and concentration of coal-mine brine. Desalination, 162: 355-359.
175. Kalogirou, S.A. (2005) Seawater desalination using renewable energy sources. Prog. Energy Combust. Sci., 31(3): 242-281.
176. AQWATEC-Advanced WAter Technology Center (2012) Membrane Distillation. Available from: http://aqwatec.mines.edu/produced_water/treat/docs/Membrane_Distillation.pdf (accessed 24 September, 2017).
177. Kesieme, U.K.,Milne, N.,Aral, H.,Cheng, C.Y.,Duke, M. (2013) Economic analysis of desalination technologies in the context of carbon pricing, and opportunities for membrane distillation. Desalination, 323(0): 66-74.
178. Cotruvo, J.,Voutchkov, N.,Fawell, J.,Payment, P.,Cunliffe, D.,Lattemann, S. (2011) Desalination Technology: Health and Environmental Impacts;Taylor & Francis
179. Xu, P.,Cath, T.,Drewes, J.E. (2012) Novel and Emerging Technologies for Produced Water Treatment. Available from: http://www2.epa.gov/sites/production/files/documents/18_Xu_-_Treatment_Technologies_508.pdf (accessed 1 September, 2017).
180. McGinnis, R.L.,Hancock, N.T.,Nowosielski-Slepowron, M.S.,McGurgan, G.D. (2013) Pilot demonstration of the NH3/CO2 forward osmosis desalination process on high salinity brines. Desalination, 312: 67-74.
181. AQWATEC-Advanced WAter Technology Center (2012) Capacitive deionization. Available from: http://aqwatec.mines.edu/produced_water/treat/docs/Membrane_Distillation.pdf (accessed 24 September, 2017).

Page 46
Tables
Table 1: Characteristics of salty water from dairy processes, desalination plants and oil and gas
production.
Table 2: The Classification of Saline Water into seven types, used by the SAL-PROC Process,
reproduced from (38).
Table 3: Performance indicators for some of the commercial technologies discussed in Section 3.1.
Table 4: Some performance indicators for some of the emerging technologies discussed in Section
3.2.

Page 47
Figure Captions
Figure 1: A typical spray drying operation utilizing a centrifugal atomizer and a cyclone separator
((32), reproduced with permission from RSC).
Figure 2: Typical process route for the SAL-PROC process (adapted from (38)).
Figure 3: A schematic showing the principle of operation for V-SEP ((50), reproduced with permission
from Elsevier).
Figure 4: A electrodialysis stack setup, showing cation and anion exchange membranes in alternating
series between two electrodes (reproduced from (54)). (AEM: Anion exchange membrane; CEM:
cation exchange membrane.)
Figure 5: Relationship between the NaCl concentration and the continuous energy consumption
necessary to concentrate one tonne of NaCl from reverse osmosis brine using electrodialysis,
illustrating the influence of operating temperature (T) ((57), reproduced with permission from
Elsevier).
Figure 6: Schematic Presentation of the Zero Liquid Discharge (ZLD) process proposed by Reig et al.
containing RO, ED, crystalliser, UF and WAIV unit operations ((59), reproduced with permission from
Elsevier).
Figure 7: Schematic of a 3-compartment electrodialysis cell with bipolar membranes ((36),
reproduced with permission from Elsevier). (BP: bipolar membrane; A: anion exchange membrane;
C: cation exchange membrane)
Figure 8: A Forward cascade injection drying zone within an Aquamill Evaporator (adapted from
(72)).
Figure 9: Schematic of an indirect freezing desalination process, involving freezer, washer, melter,
and heat exchanger operations ((74), reproduced with permission from Elsevier).
Figure 10: Schematic diagram of vacuum freeze desalination process ((74), reproduced with
permission from Elsevier).
Figure 11: Schematic diagram of a freezer using a secondary refrigerant (butane) ((76), reproduced
with permission from John Wiley and Sons).
Figure 12: A water–salt phase diagram; point D is the working point of EFC ((81), reproduced with
permission from Elsevier). Points A to C are defined in the text.
Figure 13: Schematic representation of the EFC process for the production of pure water and salt
from waste or process streams ((81), reproduced with permission from Elsevier).
Figure 14: Schematic representation of the reduction in the metastable zone (i.e. an increase in the
temperature at which nucleation occurs) using ultrasound ((87), reproduced with permission from
Springer Nature).
Figure 15: A methane molecule in a “cage’ of water molecules ((75), reproduced with permission
from Springer Nature.
Figure 16: Classification of MD processes based on the configuration of the permeate side
configuration. (a) DCMD: direct contact membrane distillation and LGDCMD: liquid gap direct
membrane distillation; (b) VMD: vacuum membrane distillation; (C) SGMD: sweeping gas membrane
distillation and TSGMD: Thermostatic sweeping gas membrane distillation; and (d) AGMD: air gap
membrane distillation. ((116), reproduced with permission from Elsevier.)
Figure 17: A proposed process schematic of a forward osmosis desalination process using NH3/CO2
as a draw solution ((134), reproduced with permission from Elsevier).

Page 48
Figure 18: Conceptual representation of an energy conversion scheme using pressure-retarded
osmosis (PRO) ((141), reproduced with permission from Elsevier).
Figure 19: Conceptual representation of an energy conversion scheme using reverse electrodialysis
(RED) ((141), reproduced with permission from Elsevier).
Figure 20: Schematic representation of the adsorption process in an MCDI cell (Reproduced from
(54)).
Figure 21: Schematic of the series of hydraulically connected MDCs under continuous operation
(156).
Figure 22: Energy consumption (a) and processing cost (b) of various commercial and emerging
technologies processing salty water and their maximum feed stream salinity. (*For ED, MD, MCDI
and FO, the energy consumption and processing cost reported are specific to the feed water salinity
specified in the Remarks in Table 3 and Table 4. These salinity values are used for plotting this
figure.)

Minerva Access is the Institutional Repository of The University of Melbourne
Author/s:
Chen, GQ; Gras, SL; Kentish, SE
Title:
Separation Technologies for Salty Wastewater Reduction in the Dairy Industry
Date:
2019-10-02
Citation:
Chen, G. Q., Gras, S. L. & Kentish, S. E. (2019). Separation Technologies for Salty
Wastewater Reduction in the Dairy Industry. Separation & Purification Reviews, 48 (4),
pp.325-353. https://doi.org/10.1080/15422119.2018.1496452.
Persistent Link:
http://hdl.handle.net/11343/225556
File Description:
Accepted version