a review of solid waste management practices in polokwane city
TRANSCRIPT

A Review of Solid Waste Management Practices in Polokwane City
by
Prudence Hlamarisa Maluleke
submitted in accordance with the requirements for
the degree of
Master of Science
In the subject
Environmental Management
at the
University of South Africa
Supervisor: Prof S.J Moja
March 2014

DECLARATION
Student Number: 47189460
I declare that * A Review on Solid Waste Management Practices in Polokwane City
is my own work and that all the sources that I have used or quoted have been
indicated and acknowledged by means of complete references.
________________________ ________
SIGNATURE DATE
(Ms P.H Maluleke)
Copyright © University of South Africa 2014

ii
DEDICATION
I dedicate this work to my family. A special feeling of gratitude to my siblings, Fannie
and Ntsako who mean so much to me. And also to my mother, although she is no
longer of this world, her memory continues to inspire me. To my father whose love
for me knew no bounds and, who taught me the value of hard work. Thank you so
much I will never forget you.

iii
ACKNOWLEDGEMENTS
I would like to express my gratitude to my supervisor Professor S.J. Moja for the
useful comments, remarks and engagement through the learning process of this
master thesis. Furthermore I would like to thank my father for the financial
support through this study. Also, I like to thank the participants in my survey, who
have willingly shared their precious time during the process of interviewing. I
would like to thank my loved ones, who have supported me throughout the entire
process, both by keeping me harmonious and helping me putting pieces together.
I will be grateful forever for your love.

iv
ABSTRACT
This study reviews solid waste management practices in Polokwane City. The study
area covered some of the residential areas in Polokwane City; namely; Ivy Park,
Fauna Park, Welgelegen, Westernburg and the City Centre. This article describes
two main methods that were used to collect data; that is Qualitative and Quantitative
method. Field survey was also made to validate data obtained from the participants
that were interviewed during qualitative data process. After framing the problem, the
objectives of Solid Waste Management Practices in Polokwane City were briefly
outlined as follows:
• Assess solid waste management practices in Polokwane City.
• Make comparison on how households and the municipality take responsibility
in storing, collecting, transporting, treating and disposing solid waste.
• Investigate what problems the City encounters in managing solid waste.
• Make relevant recommendations aimed at improving solid waste management
practices within the City.
The service management was administered by the municipality and private sector.
From the five study residential areas, the Municipality manages waste in the City
Centre while the private sector manages waste in the other residential areas.
However, the City continues to play an administrative role over the contracted
service provider.
Statistical results were presented in figures and tables. The results showed the
storage habits, frequency of collection, mode of transport and methods of disposal
for solid waste in Polokwane City.
The only method of disposal in the city was found to be landfilling. Activities that
took place at the landfill site, such as reclaiming were outlined together with the
economic values that these activities add to the City. The study also revealed that as
population increases, the amount of solid waste generated also increased.
Key Terms: Waste Management, Solid Waste, Polokwane, Qualitative Method,
Quantitative Method, Waste Disposal, Waste Storage, Landfill, Household Waste
and Recycling.

v
CONTENTS PAGE
DECLARATION STATEMENT AND COPYRIGHT i
DEDICATIONS ii
ACKNOWLEDGEMENTS iii
ABSTRACT (EXECUTIVE SUMMARY) iv
CONTENTS v
LIST OF FIGURES x
LIST OF TABLES xii
GLOSSARY OF TERMS xiii
ACRONYMS AND ABBREVIATIONS xvi
CHAPTER 1: INTRODUCTION 1
1.1 Background 1
1.2 Problem Statement 4
1.3 Rationale 5
1.4 Aims and Objectives 6
1.5 Research questions 6
1.6 Study area 6
1.6.1 Location 7
1.6.2 Population Size 7
1.6.3 Economic Situation 7
1.6.4 Waste Management 8
1.7 Methodology 8

vi
1.8 Limitations 9
1.9 Concluding Thought 10
References 11
CHAPTERS 2: LITERATURE REVIEW 13
2.1 Background 13
2.2 A Review of different experiences 14
2.2.1 International experiences 14
2.3.2.1 Solid waste statistics 17
2.3.2.2 Solid waste recovery and recycling in Turkey 21
2.3.2.3 Separate collection of household packaging waste/ review of municipal
programmes 22
2.3.2.4 Influence of participation and awareness in separate collection
Programmes 23
2.3.2.5 Costs and financing of solid waste collection and recovery operations in
Turkey 24

vii
2.2.2 Regional Experiences 28
2.2.3.Local Experience on Solid Waste Management 43
2.3.1.1 Data analysis 44
2.3.1.2 Waste composition 46
2.3.1.3 Waste recycling 47
2.4 Summary 48
References 56
CHAPTER 3: RESEARCH METHODOLOGY 60
3.1 Study Area 60
3.2 Methods and Materials 62
3.2.1 Quantitative Method 62
3.2.2 Qualitative Method 63
3.2.3 Field Surveys 63
3.3 Sampling Plan 64
3.4 Polokwane Disposal Site 66
References 72
CHAPTER 4: DATA ANALYSIS AND INTERPRETATION OF RESULTS 73
4.1 Introduction 73
4.2 Demographics 74
4.2.1 Gender of respondents 74
4.2.2 Age of respondents 76

viii
4.2.3 Educational level of respondents 77
4.2.4 Employment information of respondents 78
4.2.5 Income of respondents 79
4.3 Any assistance from the government 80
4.3.1 Kind of assistance 81
4.4 Waste management practices 82
4.4.1 Burning of solid near your houses 82
4.4.2 Burying of solid waste near houses 83
4.4.3 Hauling of solid waste to the community dump or landfill 83
4.4.4 Dumping of solid waste in a secluded spot 89
4.4.5 Collecting and dumping of solid waste in the landfill 90
4.4.6 Recyclable waste 86
4.4.7 Type of container used to store garbage before disposing of 87
4.4.7.1 Metal or plastic garbage cans at homes or businesses 87
4.4.7.2 Cardboard boxes at homes 88
4.4.7.3 55- gallon/ 200 litre drums 89
4.4.7.4 Plastics bags 90
4.4.8 Number of bags of trash disposed of each week 91
4.4.9 Old batteries 92
4.4.10 Old appliances, snow machine, four wheelers, boat motors, trucks 93
4.4.11.1 Household hazardous waste 94
4.4.11.2 Used oil 95
4.4.12 Recycling waste materials 96

ix
References 106
CHAPTER 5: CONCLUSION AND RECOMMENDATIONS 107
5.1 Research Findings 107
5.1.1 Solid Waste Management Options for Polokwane City 109
5.2 Gaps and weaknesses of waste management in Polokwane City 109
5.3 Policy recommendations 110
5.4 Recommendations 112
5.4.1 Waste Generation 112
5.4.2 Recycling and Re-use 112
5.4.3 Punitive Measures -Polluter Pays Principle 113
5.4.4 Community Awareness and Education 113
5.4.5 Waste Separation 113
5.4.6 Community Involvement 113
5.4.7 Effective Storage and Collection 114
5.4.8 Illegal Dumping of Waste 114
APPENDICES 115
Appendix i 115
Appendix ii 116
Appendix iii 130

x
LIST OF FIGURES PAGE
Figure 1.1: Polokwane City located on the map of South Africa 7
Figure 3.1: The physical location of different suburbs in Polokwane (Net- Focus Interactive, 2012). 60
Figure 3.2: Weltevreden land fill site 66
Figure 3.3: A mountain of waste in Weltevreden landfill site 67
Figure 3.4: Waste weighing bridge 68
Figure 3.5: Municipal truck after waste disposal at Weltevreden landfill site 69
Figure 3.6: Reclaimed plastic bottles 70
Figure 4.1: Gender distribution 75
Figure 4.2: Age of respondents 76
Figure 4.3: Educational Levels 77
Figure 4.4: Employment information 78
Figure 4.5: Income Distribution 79
Figure 4.6: Assistance from the government 80
Figure 4.7: Kinds of assistance 81
Figure 4.8 Distribution of waste burnt in the yard 82
Figure 4.9: Dump it in a secluded spot away from the community 84
Figure 4.10: Waste collected and taken to the landfill 85
Figure 4.11: Recycling of cans or other waste 86
Figure 4.12: Metal or plastic garbage cans at your home or business 87
Figure 4:13 : 200 litre drums 89

xi
Figure 4.14: Plastic bags 90
Figure 4.15: Bags of trash disposed per week 91
Figure 4.16: Old batteries 92
Figure 4.17: Old appliances 93
Figure 4.18: Household hazardous waste 94
Figure 4.19: Used oil 95
Figure 4.20: Current state of recycled waste materials. 96

xii
LIST OF TABLES PAGE
Table 2.1: Household solid waste (HSW) composition in Turkey 18
Table 2.2: Municipal solid waste in Turkey 18
Table 2.3: Municipal solid waste composition in major cities of Turkey, (% in weight) 20
Table 2.4: Scope and source of separate collection data used in this study 23
Table 2.5: Cost estimation for a medium sized city wide recycling programme for Turkey, with difficult collection methodology 25
Table 2.6: sales values of sorted material with different collection source 26
Table 2.7: Local Experience on Solid Waste Management 43
Table 2.8: A summary of results on the reviewed experiences of solid waste management. 49
Table 4.1: Do you bury solid waste near your house? 83
Table 4.2: Haul waste to the community dump 83
Table 4.3 : Cardboard boxes 88
Table 4.4 :Educational level of respondent * Income Cross tabulation 97
Table 4.5: Educational level of respondent * Do you get any kind of assistance from the government? Cross tabulation 98 Table 4.6: Age of respondent * Employment information Crosstabulation 99
Table 4.7: Gender * Employment information Crosstabulation 100
Table 4.8:Rotated Component Matrixa 101

xiii
GLOSSARY OF TERMS
Composting- is a method of waste disposal whereby waste is discarded on the ground and can be covered by soil or grass.
Domestic waste- waste that is produced by households.
Dumps- spots that are either owned by government or private owners but communities have designated for illegal dumping .
Globalisation- is the process of international integration arising from the interchange of world views, products, ideas and other aspects of culture.
Gross domestic product- the market value of all official recognised final goods and services produced within a country in a given period of time.
Health hazards- the state of events that have the potential to cause harm in environmental or people’s health.
Incineration- burning waste and disposing their ashes and may include reusing other resulting compositions.
Industrialisation- is the period of social and economic change that transforms a human group from an agrarian society into an industrial one.

xiv
Landfill- is a site for disposal of waste materials by burial.
Leachates- is any liquid that in passing through matter, extracts solutes, suspended solids or any other component of the material through which it has passed.
Positive Correlation- a relationship between two variables such that their values increase or decrease together.
Qualitative method- a method of inquiry in different academic disciplines seeking to gather in depth understanding of human behaviour and the reason that governs such behaviour.
Quantitative Method- a research method where systematic empirical investigation of social phenomena through statistics or mathematical techniques is applied.
Random Sampling- a subset of individuals chosen from a larger set
Reclaimers- the term refers to people who identify goods from waste that is disposed and sell these waste as goods for either recycling or reuse.
Recyclables- goods that can also be regarded as waste by some individuals but can be recycled.
Refuse collectors- people employed by the government or private sectors to collect and remove waste from homes and businesses to the disposal site.

xv
Resource recovery- selective extraction of disposed materials for specific next use such as recycling.
Sampling plan- a detailed outline of events to be taken, time frames and responsible persons for a sample.
Scavenging- refers to searching through for salvageable material; such as looking through waste storage bins for food.
Solid waste management -controlling the generation, storage, collection, transfer and transport, processing and disposal of solid waste.
Urbanisation- the physical growth of urban areas which results in migration and even suburban concentration into cities.
Waste classification- grouping wastes according to their characteristics and compositions.
Waste generation- quantity of materials that enter waste stream before composition,
Waste management- is the collection, transport, processing or disposal, managing and monitoring of waste materials.

xvi
ACRONYMS AND ABBREVIATIONS
BGCM- Bursa Greater City Municipality
CERCLA- Comprehensive Environmental Response, Compensation and Liability Act
ECA- Environment Conservation Act
EUPWD -European Union Packaging Waste Directive
HWSA- Hazardous and Solid Waste Amendments
ICGM- Istanbul Greater City Municipality
ISWM -Integrated Solid Waste Management
IZMIR- Iziminr Greater City Municipality
JICA- Japan International Cooperation Agency
LDPFA- Land Disposal Programme Flexibility Act
MRF- Material Recovery Facilities
MSW- Municipal Solid Waste
MSWM- Municipal Solid Waste Management
NWMS- National Waste Management Strategy
NCC-Nairobi City Council
NERF- National Environmental Regulatory Framework
RCRA- Resource Conservation and Recovery Act
SIS- State Institute of Statistics
SWDA- Solid Waste Disposal Act
SPSS- Statistical Packaged for Social Science
US- United States
1
CHAPTER 1: INTRODUCTION
1.1 Background
South Africa faces urban growth problems, in an Op-Ed piece published. South
African Parliament member Ian Ollis (2011) describes the problems that modern
African cities face. He notes that while the state of urban cities are connected to the
environment, we should not look at it like that. Poorly planned cities hurt that
environment, but what is more important is the impact that a poorly planned city has
on its finances and job opportunities.
The crisis in our cities is whether we can sustain our cities with current practices in
the full sense of sustain, including, (but not limited to) financial planning, spatial and
town planning, roads and storm water infrastructure, water, electricity and sewer
installation and recycling as well as the human migration and sustainable
employment practices. It is not just a green revolution that we need. The
environmental crisis is but a subset problem. With current practices, our cities are
not sustainable financially either. Nor can we control people movements and job
opportunities, which makes spatial and urban planning very difficult.
Ollis (2011) goes on to describe the problems with poorly planned city infrastructure
projects. The initial problem is suburban sprawl. People moving away from the city
into the suburbs creates problems from trying to get city services to the citizens who
live away from the central city; it includes building roads, waste management
services, sewer systems and electric lines to people who live far away. The second
problem with this is the cost of maintaining of those roads and utilities. Infrastructure
naturally breaks down and needs to be fixed, maintained and replaced. This creates
quite a financial hardship on local governments who are not willing to raise taxes to
increase revenue (Ollis, 2011).

2
The Daily Trust (2013) indicates that during the course of the last century,
industrialisation has affected the lives of everybody living in Southern Africa shaping
the society we live in today. This feature examines the process of industrialisation in
South Africa.
Industrialisation describes a complicated process of change. This process has
unfolded in a variety of ways across different countries (Daily Trust, 2013) . In the
late 19th Century, South Africa changed rapidly from an agricultural society, where
most people lived off the land, to an industrial society. This took place largely as a
result of the discovery of large diamond deposits in Kimberley in 1867 followed in
1886 by the discovery of gold on the Witwatersrand. These resulted in the migration
of people from rural areas to urban areas with a hope to find jobs. However, the
increase in the number of people to the cities resulted in the increase in waste
generation in cities.
Waste management is the collection, transport, processing or disposal, managing
and monitoring of waste materials. The term usually relates to materials produced by
human activity and the process is generally undertaken to reduce their effect on
health and the environment. Waste management is a distinct practice from resource
recovery which focuses on delaying the rate of consumption of natural resources.
Generally, waste management tends to treat all waste materials as a single class,
whether solid, liquid, gaseous or radioactive substances, and attempt to reduce the
harmful environmental impacts of each through different methods.
Waste can take many different forms: solid, liquid, gas, or energy in the form of heat
or noise. Liquid waste includes any waste that is liquid at 20 °C regardless of
whether it is packaged or otherwise contained and irrespective of whether or not the
packaging container is to be disposed of together with the liquid that it contains
(EPA, 2009). Gas waste is produced by homes, mines, construction industries and it
pollutes the air. Energy waste can be divided into two categories, waste heat refers
to heat produced by machines, electrical equipment and industrial processes for

3
which no useful application is found, while noise waste is created when noise is
made for no particular purpose (EPA, 2009).
Solid waste definition includes a number of materials that are not generally thought
of as ‘solid’. Household garbage, trash, refuse and rubbish are all solid waste. It
include solids, various semisolids, liquids and gas that are produced from mining,
agricultural, commercial and industrial activities. Often substances such as liquids
and gases are confined in solid containers and disposed of with more conventional
solid wastes. Sewage, effluent and wastewater from commercial enterprises,
organisations and private homes are not solid waste, but once wastewater is treated
and various residues are removed from the water to form sludge, the sludge is
usually treated as a form of solid waste (APO, 2007).
Solid waste may be divided into two broad categories depending on its origination:
municipal solid waste (produced by various institutions, businesses, and homes) and
industrial solid waste. This study will focus on municipal solid waste that is generated
by homes (households).
Asian Productive Organisation (APO), 2007 defined solid-waste management as the
discipline associated with controlling the generation, storage, collection, transfer and
transport, processing and disposal of solid waste. The discipline should be in
accordance with the best principles of health, economics, engineering, conservation,
aesthetics, and other environmental considerations, and that is also responsive to
public attitudes. It can also cause serious pollution that may result in environmental
degradation. It is therefore important that this solid waste be managed effectively
and efficiently to promote a healthy community. This enshrined in the constitution of
the Republic of South Africa, 1996.

4
1.2 Problem Statement
As urbanisation increases, the amount of municipal solid waste (MSW) increases
too. People immigrate from various areas in Limpopo Province to Polokwane City.
The City is the heart of the Province where everyone hopes for a better job
opportunity to improve their livelihoods.
Professionals buy properties around the City and some become permanent
residents. Some can afford to buy houses while others rent property within the city.
An increase in the number of residents result in the increase product consumption
and waste generation. This will in turn require more resources to manage waste
generated that is; storage and disposal. This causes a strain to the municipal budget
that must effectively manage waste. If the municipal budget is limited waste will not
be properly managed and this will put the environment and people’s health at risk.
Residents store waste on storage bins and there are prescribed days given to each
residential site by the municipality for collection.
As urbanisation and economic development increases in Polokwane, nowhere is the
impact more obvious than in society’s solid waste. In years to come, 10 years from
now on, government should anticipate spending at least double the amount on solid
waste management related activities.
To carry out integrated solid waste management, Polokwane City need partners. Local
governments must reduce the externalities of waste by considering measures such as
full cost accounting, package deposits, manufacturer responsibility, and extended
product care. The general community, which is probably the most important stakeholder
in waste management activities, must also actively participate in the solutions by
modifying their behaviour patterns. For example, they need to exert discipline in
separating waste, using containers in a beneficial way, and exercising environmentally
friendly purchasing habits.

5
1.3 Rationale
The rationale of solid waste management practices is clearly based on the fact that
everyone generates waste and can be affected directly and indirectly if waste is not well
managed. Waste can be hazardous to human being and the environment if not
appropriately managed. Poor management of waste can also affect ground water.
Consequently everyone has to be involved in waste management programmes for its
effective and efficient waste practices. On the other hand solid waste can be a resource
that can be used and provide employment opportunities that may contribute to poverty
alleviation if research articles, thesis and papers are published to inform and educate
people in waste management practices and processes.
Mismanaging solid waste will lead to both health and environmental problems. Degraded
households’ solid waste would lead to contamination or pollution of natural resources
(such as water, marine life, soil and air). This in turn would increase the health risk of
those who are utilising or are exposed to these resources. Hence, the subject is taking
central place in the national environmental policies of many countries. In developing
countries, solid wastes have not received sufficient attention. This is because, very
often, environmental issues compete with other sectors of the economy for very limited
resources available. Thus, management of solid waste end up not getting the priority it
deserves.
In many countries, hazardous and medical wastes are still handled and disposed
together with domestic wastes, posing a great health risk to municipal workers, the
public and the environment (Blight, 2000). Medical waste must be separated from
municipal solid waste. Some of these wastes may be infectious and may also contain
sharp objects such as needles that can cause injury to men. This tend not to apply in
many parts of Africa as it tends to be collected along with the rest of the waste stream
(Kgathi & Bolanee, 2001).

6
1.4 Aims of the Study
The study achieved the following:
• Assessed solid waste management practices in Polokwane City
• Made comparison on how households and the municipality take responsibility in
storing, collecting, transporting, treating and disposing solid waste.
• Investigated what problems the City encounters in managing solid wastes
• Made relevant recommendations aimed at improving solid waste management
practices within the City.
1.5 The research questions
Waste management practices questionnaire was carried out from the five residential
study areas in Polokwane. The questionnaire focused on the type of methods used to
dispose solid waste and also whether waste is recycled.
1.6 Study area
The Polokwane Local Municipality is located within the Capricorn District Municipality of
Limpopo Province (See Figure 1.1). The Municipality covers a surface area of 3775 km2
and accounts for 3 % of the provincial land area of 12 400 km2 . Polokwane Municipality
is urbanised, 71 % rural and smallholdings, industrial recreational land. Polokwane's
economy is essentially built on its function as a central service hub for the entire
Limpopo Province and to a lesser degree for the neighbouring provinces and countries.
The data and analysis of this study should help to inform on regional economic
development and other work being undertaken by the Municipality. (S.A History, 2013).

7
Figure 1.1: Polokwane City located on the map of South Africa (S.A Venues, 2013)
1.6.1 Population size
The municipal population size in 2010 was 625 000 with a current growth rate of 1,6
% per annum (S.A History, 2013). Over the past four years the population has
increased by 9 %. The growth in population can be 23 % attributed in part to the fact
that 6 %. Polokwane is the economic hub and much wider area than that of the
municipal boundaries. A growing number of people, from both within and outside the
province migrate to the City in search of work (S.A History, 2013).
1.6.2 Economic situation
The gross domestic product of Limpopo province is mainly from three sectors; that
is Agriculture, Forestry and Mining (GCIS, 2013). These are the three sectors that

8
creates a large percentage of employment in the province. Apart from these industry,
government creates jobs to semi-skilled personnel as well.
1.6.3 Waste management
Polokwane Declaration on Zero Waste by 2022 was agreed upon at a meeting held
in Polokwane City in 2001 so as to address the problems of waste in the country.
This declaration was based on the urgent need to reduce, re-use and recycle waste
in order to protect the environment and introduce waste management system which
promotes effective waste reduction. The goal of this declaration was to reduce waste
generation and disposal by 50 % and 25 % respectively by 2012 and develop a zero
waste plan by 2022 (Kumar, 2011). The South African Government developed a
National Waste Management Strategy to address waste management aspects
including the zero waste plan as envisaged (Ogola, 2012).
Other initiatives taken by the South African Government is the plastic bag agreement.
South Africa amended the Environmental Conservation Act 73 of 1989 by developing
plastic regulation in terms of section 24. This regulation came as a result of problems
associated with the collection and disposal of plastic bags which resulted in pollution
and degradation. The problem was mainly affecting low income areas where refuse
removal services are inadequate. The regulation’s main aim is to restrict the production
of non-reusable plastic bags, and unnecessary use of excessive amounts of disposable
thin plastic film for packaging (DEAT, 2001).
1.7 Methodology
Quantitative method was applied through enquiring on how waste is handled that is,
whether waste is weighed before being transported from different waste generators’
areas. It was applied through field surveys that were conducted for data collection
from households and analysed to address the research objectives.

9
Qualitative method through interviews, observations and field notes were used as
data collection methods. Interviews were used to collect information from the
municipal officials for solid waste. Observations and field notes were made while
visiting the study areas.
Information on whether waste is separated or measured before collection was
acquired from participant households. The five residential areas were from different
directions of the city i.e. Westernburg is located on the western side of the city, Ivy
Park from south west, Fauna Park on the east, Welgelegen from the northern part of
the City, the City Centre is the Central on the centre of the City. Data was analysed
through the use of Statistical Packaged for Social Science (SPSS), where descriptive
analyses through the use of numbers, tables and graphs was used to describe and
present data.
1.8 Limitations
In compiling these data, the author identified shortcomings with sampling plan and
built-in problems with consistency. A sampling plan through questionnaire
participation of 100 Voluntary respondents from five research areas was used during
research. This required 20 respondents from each of the 5 residential areas, this was
done randomly per street in order to draw a summary from each residential area.
The fact that this was a voluntarily participation raised a concern of willingness to
participate to the study by respondents as they will be selected in a random manner.
Another issue of honesty when responding to the questionnaires arose. Randomised
samples was also not possible in houses where owners were not available at the
time of the study i.e. some leave caretakers while they relocates to other places.
This can made answering the questionnaire a bit difficult.
These factors challenged the accuracy of the results that was used to explain the
state of solid waste management practices in Polokwane City. The study made
recommendations to help overcome these limitations and for improving solid waste

10
data collection and presentation. It is beyond the scope of this paper to venture into
the debate on the negative environmental impacts that will occur from wastes
generated by an increase in the number of people immigrating to Polokwane City.
1.9 Concluding thought
Solid Waste Management is one of the critical functions that Polokwane Municipality
has to perform. It involves the collection, transportation and disposal of solid waste
generated by various users. Failure to perform this function can lead to an outbreak
of various diseases and can cause serious pollution and hence cause degradation of
the environment. The municipality has the mandate to remove and transport refuse
to the landfill sites. The mandates also include the management of landfill sites and
transfer stations. The Municipality also ensures that the streets are clean and
monitors illegal dumping. Currently, only the City and Seshego and some parts of
Mankweng and Sebayeng clusters have conventional waste management services
in place. The municipality should explore alternative service delivery mechanisms to
deal with waste management taking into account the growth in the City (Mihelcic &
Zimmerman, 2010).

11
References
Abor P.A, 2007. Medical waste practices in Southern African Hospital. Cape
Peninsula University.
APO 2007: Solid Waste Management: Issues and Challenges in Asia. Report of the
APO Survey on Solid-Waste Management 2004–05 the Asian Productivity
Organization.
Banar, M., Vardar, C, ., Malkoc, , S., S, ahin, A., Neyim, O.C., Ero¨ ztu¨ rk, A.,
2001. Recovery of campus solid wastes and as an example: Anadolu University. In:
2nd International Packaging Congress and Exhibition, Proceeding Book.
Blight, G.E 2000: The Management of Hazardous Waste in South Africa. University
of Witwatersrand, Johannesburg.
Daily Trust. 2013: Industrialisation in South Africa: The impact of globalisation.
TradeMark Southern Africa.
Department of Environmental Affairs and Tourism (2001): National Waste
Management Strategy (NWMS), Version D, Pretoria,
EPA 2009: This guideline provides definitions for a range of terms commonly used
within the waste industry. http://www.epa.org. 842/09.
Government Communication and Information Systems 2013. Pocket guide S.A
2012/2013. http://www.GCIS.gov.za/Agriculture
Kgathi, D.L & Bolanee, B, 2001: Instruments for Sustainable Solid Waste
Management in Botswana, Waste Management Research.
Kumar, S 2011: Integrated Waste Management Volume I. http://www.intechweb.org
Ollis I 2011. No quick fix to save our cities, so we’d better start now. The Daily
Maverick. http://www.thedailymaverick.co.za/opinionista/2011-03-12-no-quick-fix-to-
save-our-cities-so-wed-better-start-now
Mihelcic JR & Zimmerman JB 2010: Environmental Engineering: Fundamentals,
Sustainability, Design . John Wiley & Sons.
Myvirtualpaper, 2012. http://www.myvirtualpaper.com/doc/plk-
municipality/investment-guide/2012070901/12.htm/

12
Ogola JS et al., 2012: Management of Solid Wastes: A case Study in Limpopo
Province, South Africa. http://www. Intechopen.com/ InTech.
Taru, P & Kuvarega, A. T, 2005. Solid Medical Waste Management. The Case of
Parirenyatwa Hospital,Zimbabwe, Revista Biomédica,
South African History Online. http://www.sahistory.org.za/archive.what-
industrialisation
South African Venues Online. http://www.sa-venues.com.limpopo.polokwane

13
CHAPTER 2: LITERATURE REVIEW
2.1 Background
This chapter reviews various studies concerning waste management practices
around the world. Similarities and comparison was made on how waste is handled
focusing on waste classification, municipal solid waste, policies and solid waste
management practices.
During the past fifty years, cities in the developing world have undergone rapid
urbanization. Between 1987 and 2015, the number of urban dwellers is expected to
double. Nearly 90 per cent of this increase will take place in the developing world,
where growth rates exceed 3 per cent a year, three times that of the developed
countries (UN-HABITAT, 2003).
A positive correlation tends to exist between a community’s income and the amount
of solid waste generated. Wealthier individuals, who consume more than people on
lower income, generate a higher rate of waste. The processes of accelerated
population growth and urbanization translate into greater volume of waste generated.
Globalization can promote economic growth, a desirable outcome. However, this
economic growth- in addition to population increase and urbanization- will seriously
strain the municipal resources in order to deal with a booming amount of waste
(Beall et al., 2010).
Higher income and economic growth also tend to have an impact on the composition
of waste. Wealthier individuals consume more packaged products, which results in a
higher percentage of inorganic materials- metals, plastics, glass, textiles, and so on-
in the waste stream (Medina, 2010). Higher volumes of waste and a changing
composition have a profound impact on waste management practices. More waste
being generated, and with a higher content of inorganic materials, could have a
significant impact on human health and environment. If the additional waste resulting
from population and economic growth is not collected, treated, and disposed of

14
properly, health and environment in urban areas of the developing world will further
deteriorate (Beall et al.,2010).
Distinct differences have been identified in literature between Municipal Solid Waste
Management (MSWM) in developed and developing countries. In most developed
countries, public health is no more a major driver of waste management; the current
focus is on optimization of waste management practices with a broader goal of
resource conservation (McDougall et al.,2001). Municipal Solid Waste Management
(MSWM) in most developing countries is often characterized by inadequate service
coverage, operational inefficiencies of services, limited utilisation of recycling
activities, inadequate management of non-industrial hazardous waste and
inadequate landfill disposal (Zurbrügg & Schertenleib, 1998).
Although distinct differences exist between waste management in developed and the
developing countries, as developing countries achieve economic growth coupled
with population growth. The environmental and economic burdens of solid waste
management will increase. According to UNEP (2005) the rate of waste generation
generally increases in direct proportion to that of a nation’s advance in development.
Failure to provide a management system could result in greater environmental
degradation with increase health risk to the urban population.
2.2 A Review of different experiences
2.2.1 International experiences
Most cities in the developing countries do not collect the entire waste generated by
their residents, which has a negative impact on human health and the environment.
In areas that are not served by the municipalities, local entrepreneurs provide waste
collection for a fee. In many Latin American cities, informal refuse collectors use
pushcarts, tricycles, donkey carts, horsecarts, and pick-up trucks to serve the poor.
They retrieve the recyclables contained in the garbage, before disposing of the
remainder of the waste (Beall et al., 2010).

15
In Santa Cruz, Bolivia, for example, informal refuse collectors serve about 37 per
cent of the population. In the low-income areas around Mexico city, hundreds of
informal collectors with pick-up trucks, pushcarts, and horse carts provide service in
areas that are not served by municipal authorities. The municipalities employ
sweepers to sweep the city streets and public areas by using simple tools and
facilities (Weiner & Matthews, 2003).
Since dumping waste on the roadside or in other public places is a common practice
in Asian developing countries, street sweeping is one of the important activities in the
waste-management system. Household’s waste, is commonly placed in plastic bags
or other containers and stored at the collection centres. Community containers are
placed at the roadsides to be collected by vehicles or hand-operated carts.
Generally, Asian cities collect their household waste once a day. Major streets are
generally swept on a daily basis, while other streets are swept less frequently
(Weiner & Matthews, 2003).
The legislation for water and air pollution control are comprehensive and well
established, in Asia but not for solid-waste management. Solid-waste management
is still very much a municipal government responsibility. The lack of awareness,
technical knowledge, legislation, policies, and long-term strategy are major issues for
solid-waste management in Asian developing countries (EPA, 2007).
The Environment Conservation Act 1995 (ECA, 1995), the Environmental
Conservation Rule (ECR, 1997), and other national-level basic laws and regulations
are stipulated for environmental issues in Asia. However, even prior to these rules,
provisions existed that addressed environmental issues. Subsequently, the Asian
government has given its highest priority to the environment and passed the
Environmental Court of Law (2000) for completing environmentally related legal
proceedings effectively (APO, 2007).

16
Municipal solid waste (MSW) management is a growing problem in Sri Lanka. It has
a direct relationship with urbanization and industrialization. Therefore, MSW-related
matters are more serious in cities and in urbanized areas than in rural areas.
However, MSW management is statutorily treated as a local-government subject in
Sri Lanka (EPA, 2009). Policy analysis and evaluation focus on the process of policy
formulation, implementation, and evaluation (Van Dijk, 2006). There are three
mechanisms of regulating public services in cities: price regulation, service quality
regulation and access to information regulation. One may also wonder whether it is a
question of a good regulatory framework or of working in a context in which people
have confidence. In countries like China and Tanzania operators seem to have
confidence in the new policies, which makes it much easier to implement them (EPA,
2009).
Like all other developing countries, concern for the environment is growing in
Bangladesh at all levels, including the government, for an effective and economic
management of environmental issues. In Bangladesh, the Ministry of Environment
and Forestry is the authority for making environmental policy, regulations, standards,
and enforcement. Its implementing agency is the Department of Environment. In the
fourth Five-Year Plan (1990) the government’s environmental objectives have been
described as follows:
• To control pollution and degradation related to soil, water, and air.
• To promote environment-friendly activities in the development process.
• To preserve, protect, and develop the natural resource base.
• To strengthen the capabilities of the public and private sectors to manage
environmental concerns as a basic requisite for sustainable development.
• To create public awareness to encourage participation in environmental
promotion activities ( Kamaliski, 2010).

17
Asian Productivity Organisation, (APO), 2007 indicates that Bangladesh has
established the following regulations in order to minimise the risk of harming the
environment; National Environmental Regulatory Framework (NERF) in
Bangladesh:
1. Environmental Conservation Rule, 1997 (ECR 1997)
2.Environmental Court of Law, 2000
The initiative on the legal front of environmental issues, however, has been far from
adequate. This has been compounded by the lack of awareness and technical
knowledge that is the major factor causing the deterioration of the environment.
Metin et al., (2003) review the existing data on Solid Waste Management (SWM) in
Turkey. Since, solid waste management constitutes one of the major Municipal
expenditures; an additional attempt was made to review the cost data of solid waste
management practices. The characteristics and costs for managing solid waste
alters from one Municipal application to another and in addition to demographic
facts, it is also a factor of how cost and solid waste terms are defined. The authors
have made an attempt to consolidate some of the solid waste data representing
demographic and social facts of Turkey. This study can be assumed as a summary
of long-standing efforts in establishing reliable figures on solid waste characteristics
of Turkey (Metin et al., 2003).
2.3.2.1 Solid waste statistics
The State Institute of Statistics (SIS) has published a major source of information in
solid waste in Turkey. This extensive research published in 1993, provides valuable
data on compositional variations in the household solid waste in Turkey (SIS, 1993).
The household solid waste data collected from 57% of municipalities, corresponds to
a sufficiently long sampling time frame and statistically acceptable waste collection
frequencies. Therefore, almost all scientific publications emanating from Turkey,

18
reference this important study. This particular data covers only solid waste generated
by individual households. The SIS also published ‘‘Municipal Solid Waste’’ statistics
in 1994 (SIS, 1994). The results of these two major studies are summarized in table
2.1 and 2.2 (Metin et al., 2003):
Table 2.1: Household solid waste (HSW) composition in Turkey
Table 2.2: Municipal solid waste in Turkey
The data in table 2.1 indicates that the majority of the household waste in Turkey is
organic in nature, and that slag and ash constitute an important fraction. Because
this study was conducted about eight years ago, when coal heating used to be the
dominant heating method employed in most of the households in Turkey, recent
Season HSW (kg/day)
Organic and wet (%)
Ash and slag (%)
Recyclable (%)
Summer 0.6 80.21 2.61 17.18
Winter 0.5 46.2 45.89 7.9
Average 0.57 68.87 17.04 14.09
Municipal solid waste (kg-person-day) Treatment of solid waste
1994 2001
Summer 0.9
Winter 1.0 % Landfill 4.7 15
Average 0.97 %
Compositing
1.1 2.0

19
studies should reflect significant variation in the characteristics of solid waste.
Natural gas has now become the major source of energy used for household
heating, at least in major towns. Therefore, significant alterations in the household
solid waste characteristics in the recent years should be expected.
The lack of periodicity in SIS studies remains to be the main problem in obtaining
reliable solid waste data in Turkey. This called for a survey with municipalities
representing some major large cities and with municipalities representing a group of
small -medium towns constituting a region has been conducted.
Metin et al. 2003 cite Bursa, Istanbul, Izmir, Adana and Mersin as the sources of
information representing major cities utilized in this paper. The Municipality of Bursa (an
industrial town with a population of two million people) has supplied the most
comprehensive and extensive data on solid waste. It covers more than five years of
continuous and detailed data collection process which constitutes an important reference
for Turkey (BGCM, 2000). Also, some efforts conducted by international agencies in
southern parts and major cities of Turkey must be referred to as well (IGCM, 2000).
A summary of the data gathered from these various resources are presented in Table 2.3.
The table shows that major constituents of the municipal solid waste (MSW) are organic,
whereas recyclable materials constitute almost 1/3 of total MSW in big cities. Another
extensive municipal solid waste survey conducted with Municipal Authorities in the Aegean
coast of Turkey indicates the difference between big cities vs. small towns as well as
peculiarities of touristic towns (Kirkitsos et al. , 2000).
The data summarised in Table 2.3 show the variation in MSW as well as the compositional
characteristics of waste. In summary, two different groups of MSW data are provided in
Tables 2.2 and 2.3. The data corresponds with the nationwide research of SIS and long-
term statistical data gathered from major cities of Turkey. The comparative analysis of these
three sets of data reflects the typical variation of MSW based on the demographic, social
and economic differences. Such differences are typical of many developing countries

20
(Sundaravadivel & Vigneswaran, 2002). However, most of the time, for general purposes,
overall figures reflecting the national average characteristics of MSW are useful.
Table 2.3: Municipal solid waste composition in major cities of Turkey, (% in weight)
BURSA
(Bursa Greater city Municipality, 2000)
ISTANBUL
(Istanbul Greater city Municipality, 2000)
IZMIR (Izmnir Greater city Municipality, 2000)
ADANA
(JICA, 2000)
MERSIN
(JICA, 2000)
Population 1 958 529 9 198 809 3 114 859 1 682 483 1 508 232
Organic 53.1 43 46 64.4 63
Recyclable 36.4 33.9 31.0 25.2 29.4
Paper/boar
d
18.4 7.8 12 14.8 18.42
Plastics 11.6 14 12 5.92 6.69
Metal 3 2 3 1.4 1.25
Glass 3.4 5.8 4 3.08 3.08
Other 10.5 6.2 23 11.4 7.6
Based on these evaluations and interpretation of the MSW in Turkey, it is concluded
that the average per capita MSW generation in Turkey can be assumed to be 0.95
kg/person-day. When it comes to compositional characteristics of MSW, one should
take into account the social and demographic factors of the individual town or village.

21
2.3.2.2 Solid waste recovery and recycling in Turkey
Solid waste recovery and recycling has been a longstanding commercial activity in
Turkey. Glass and paper recycling have been conducted at industrial scales since
the 1950s ( Banar et al., 2001). With the recent investments in the recycling industry,
almost all types plastic materials, glass, paper and metals can be recycled at
industrial levels in Turkey. Recycling of scrap metal should be considered at a scale
beyond the municipal solid waste management system; however, due to similarities
of the collection process of recyclable waste, it will only be mentioned briefly here.
As one of the biggest steel scrap importers of the world, Turkey recycles more than 2
million tons of steel scrap annually (Metin et al., 2003). Recycling of nonferrous
metals is also widespread and conducted at industrial scale, including aluminium,
copper, lead and silver. The scrap metal recycling industry essentially is built on
small and medium scale scrap dealers spread around the country. Recovery of
plastics, paper, glass and metal from municipal solid waste is mostly conducted, as
indicated above, by the scrap dealers and individual collectors (scavengers).
Paper and cardboard are collected through the scrap/ waste dealers and delivered to
recycling facilities nationwide. There exists approximately 30 medium to large-scale
paper recyclers operating with capacities exceeding 50 tons/day. The output of these
facilities is mostly the packaging cardboard made out of recycled paper. Glass
recycling also works on the free market principles, which is mostly operated by the
Glassworks Co. of Turkey, consuming more than 90% of the collected used glass
bottles. The collection and recovery scheme is essentially the same as paper and
cardboard recovery. In addition to glass bottle banks well spread in large cities,
private entrepreneurs and scrap dealers collect, sort and prepare used glass bottles
for recycling (Metin et al., 2003).
There exist five major buy back centres and glass cullet preparation units
nationwide. Significant efforts have been made, in recent years, to increase the

22
number of glass bottle banks and separate collection systems. The plastics and
metal packaging collection system is essentially the same. PET recycling has been
an industrial activity since the establishment of a major PET recycling plant in 1992.
Currently, three industrial scale PET recycling plants exist in Turkey with a total
operating capacity exceeding 25,000 tons per year. In summary a strong market
demand exist for almost all types of packaging waste, regardless of its nature.
Current scrap material prices are indicative of the influences of world markets.
However, glass, paper and PET recycling are being conducted at fairly high
industrial capacities, which is another important recyclable item in household solid
waste.
Used beverage and tin cans are being recycled together with steel scrap by the steel
smelters. Several small-scale aluminium recyclers are spread around the country;
and a major aluminium can recycler recently started operation in the western part of
Turkey with a capacity of 12,000 tons/year.
2.3.2.3 Separate collection of household packaging waste/ review of municipal
programmes
Separate/curbside collection of the recyclable materials has started within the last
ten years in Turkey. Currently more than 60 municipal recovery programmes are
operational nationwide. These pilot programmes have been a useful tool to develop
relevant statistical basis for solid waste recovery activities in Turkey; the data have
been summarized elsewhere (Banar et al., 2001).
Metin et al., (2003) show a list of municipal recovery programmes implemented in
Turkey in Table 2.4. This list also supplies the data on the amount of used packaging
material recovered and recycled through these programmes. Data on collection
frequency are also given, which refers to a fairly long period of time, and therefore
represents a relatively high statistical significance. The collection scheme is similar in
all of the municipal separate collection programmes and is based on the weekly,

23
commingled collection by plastic bags. Commingled recyclable waste materials
include plastic, glass, metal, and paper. The collected packaging waste is either
transported to Material Recovery Facilities (MRF) or is being handled by the
individual private waste contractors.
Table 2.4: Scope and source of separate collection data used in this study
Number of municipalities
Number of households
Number of hotels
Number of schools
Number of commercials
Total waste collection (kg/month)
31
186 311
320
237
179
1 090 000
(Metin et al.,2003)
2.3.2.4 Influence of participation and awareness in separate collection
programmes
Public participation and awareness in municipal recovery programmes has been an
important issue in all curbside/separate collection programmes. Several types of
tests and opinion polls have been conducted in order to gain an insight to the role of
public awareness in these types of environmental programmes (Banar et al., 2001).
Metin et al., (2003) further shows an example of such comprehensive programmes
has been implemented by a joint effort of UNDP-CEVKO local municipalities as a
part of a programme in the earthquake-affected regions of Turkey (CEVKO, 2000).
This programme covered 39,000 prefabricated temporary settlements and
approximately 130,000 people directly influenced from the earthquake, after which
solid waste management has become a serious problem for municipalities. The

24
results, show that even under difficult living conditions, such as in temporary
settlements in the disaster region, regular citizens support and participate in
environmental actions especially when properly informed.
2.3.2.5 Costs and financing of solid waste collection and recovery operations
in Turkey
According to Metin et al., (2003); a cost data on solid waste management in Turkey
is usually highly controversial and complicated due to the nature of the subject. The
cost data is further complicated by the specifics of the Municipal Region and the cost
accounting methodology employed. However, here we attempt to simplify some of
the factors involved (by separating out some cost build up operations) in order to
gain an overall assessment of Municipal Solid Waste (MSW) management cost
factors. In this section, two separate Municipal cost analyses have been conducted.
The first one covered Municipal collection and transport costs whereas the other one
is essentially an economic performance analysis of two small-medium scale material
recovery facilities.
The data on cost of collection and sorting has been summarized in Tables 2.5 and
2.6 for a medium-to-large city.

25
Table 2.5: Cost estimation for a medium sized city wide recycling programme for
Turkey, with difficult collection methodology
Cost item/collection method
Bring centres
Palstic bins
Door-door, plastic bags
Invest Invest
980 000 0
750 000 750 000
650 000 650 000
2 380 000 1 400 000
Monthly
Monthly
34 000 28 000
25 500 78 000
60 000 60 000
119 500 166 000
(Metin et al.,2003)

26
Table 2.6: Sales values of sorted material with different collection source
Material source
Paper and board
Plastics Metal Glass Average revenue $/ton
Total revenues $/month
Sales value
$/ton
80 150 120 35 96.25
Residential 38
%
21% 9% 32% 99 170 000
Commercial 72
%
26% 2% 200 00
composite 70
%
18% 3% 9% 89.75 182 000
(Metin et al.,2003)
An average population is estimated to be 1.0 million in Turkey. Based on the detailed
waste analysis, a cost/revenue analysis for a city wide recycling programme is made.
The analysis indicates that revenues are sufficient to cover the general operational
costs of material recovery facilities if operated at full capacities. Depending on the
source composition or depending on the collection method employed, a relatively
acceptable commercial profit can be retained.
Collections through bring-centres yields relatively high investment costs and low
operational costs, whereas door-to-door collection of recyclable materials by plastic
bags has the lowest investment cost. However the continuing consumption of plastic
bags yields relatively higher operational costs. These analyses are found to be
consistent with the data published by Coopers and Lybrand (2000) and seem to be

27
in line with similar studies (White et al., 1995). Obviously, the cost of separate
collection, purely on financial terms will be misleading since environmental costs and
benefits are not accounted for in simple financial evaluations. The results indicate
that at large scales of collection and sorting, market gains of the sold material are
usually sufficient to support the operational costs of material recovery facilities.
Additional costs due to separate collection and public training processes are usually
considered to be compensated as an environmental benefit. These costs and
benefits must be studied through a life cycle approach, which has been a topic of
various publications. Intensive efforts are being made by the European Commission
and European Countries in order to assess the ‘‘value’’ of material recycling versus
other methods of waste management, such as land filling, incineration, composting
(Coopers & Lybrand, 2000). The results indicate that material recycling has the
highest environmental benefit. Therefore, the recent legislative proposals in the
European Union Packaging Waste Directive (EUPWD) targets higher recycling rates.
Environmental Protection Agency (EPA) 2009 explains the legislation of solid waste
in the United States (U.S). The Solid Waste Disposal Act (SWDA) of 1965 was the
first U.S. federal solid waste management law enacted. It focused on research,
demonstrations, and training. In a second phase, the Resource Recovery Act of
1970 emphasized reclaiming energy and materials from solid waste instead of
dumping. In a third phase, the federal government started playing more active
regulatory role, with the Resource Conservation and Recovery Act (RCRA) of 1976.
RCRA instituted the first federal permitting program for hazardous waste and it also
made open dumping illegal. RCRA focuses only on active and future facilities and
does not address abandoned or historical sites which are managed under the
Comprehensive Environmental Response, Compensation, and Liability Act
(CERCLA) of 1980 - commonly known as Superfund.
Implementation of RCRA was relatively slow and Congress reauthorized and
strengthened RCRA through the Hazardous and Solid Waste Amendments (HSWA)
28
of 1984. This was the beginning of the fourth phase. The 1984 RCRA Amendments
suggested a policy shift away from land disposal and toward more preventive
solutions. RCRA has been amended on two occasions since HSWA: the Federal
Facility Compliance Act of 1992 which strengthened enforcement of RCRA at federal
facilities and the Land Disposal Program Flexibility Act (LDPFA) of 1996 which
provided regulatory flexibility for land disposal of certain wastes (EPA, 2009).
In the past twenty years, there has been an increased emphasis on reduction, reuse
and recycling (the three Rs) as part of the pollution prevention hierarchy in the U.S .
Numerous local, state, and national regulations have been enacted to increase the
use of the three Rs (SWIRP, 2013). These initiatives have been motivated by a
desire to further reduce adverse social and environmental impacts and to conserve
natural resources (including water and energy). At the same time, there has been an
increased recognition of the importance of lifecycle assessment in evaluating solid
waste- management options in the U.S. Recent trends place greater importance on
an integrated or systems-based approach to solid- waste management (Mihelcic &
Zimmerman, 2010).
2.2.2 Regional Experiences
UNEP, 2005 states that administration is one of the major weaknesses of Municipal
Solid Waste Management (MSWM) systems in Africa. Limited funding and
restrictions on raising or directly accessing user fee revenues is another. Cost
recovery by municipalities through retained user fees and taxes has shown promise
in several cities. Private enterprise may play a role in vastly improving MSWM
services in Africa. In many cases improvements may be obtained with high-labour,
low-capital alternatives and enabling administrative changes. Cooperatives and
community organizations may also play a role in providing MSWM services, from
pre-collection to recycling and composting (UNEP, 2005).
In areas that lack refuse collection- usually low-income communities- residents tend
either to dump their garbage at the nearest vacant lot, public space, creek, or river,

29
or simply burn it in their backyards. Uncollected waste can accumulate on the streets
and clog drainage systems when it rains, which might cause flooding. Waste can
also be carried away by run-off water to rivers, lakes, and seas, affecting those
ecosystems. Alternatively, waste can end up in open dumps, legal and illegal: the
most common disposal method in the developing world. Open dumping of solid
waste generates various environmental and health hazards. The decomposition of
organic materials produces methane, which can cause fire and explosions, and is a
potent greenhouse gas. The biological and chemical processes that occur in open
dumps produce strong leachates, which pollute surface and groundwater (Medina,
2010).
Fires periodically break out in open dumps, generating smoke and contributing to air
pollution. In the Mexican city of Tampico, on the Gulf of Mexico coast, for instance, a
fire burned for over six months at the local open dump. Fires at open dumps often
start spontaneously, caused by the methane and heat generated by biological
decomposition. Dump managers in some cities deliberately and periodically set fires
at the dumps in order to reduce the volume of the waste, which allows more waste to
be disposed there and thus extends the life of the dumps. Human scavengers might
also cause intentional fires, since metals are easier to spot and recover among the
ashes after the fires than among piles of mixed wastes. Food leftovers and kitchen
waste attract birds, rats, flies, and other animals to the dumps. Animals feeding at
the dumps can transmit diseases to humans living in the vicinity. Biodegradation of
organic materials could take decades, which might limit the future use of the land on
which open dumps are located (UNU,WIDER, 2013).
Collecting, transporting, and disposal of MSW represents a large expenditure for
developing country cities: waste management usually accounts for 30-50 per cent of
municipal operational budgets. Despite these high expenses, cities collect only 50-80
per cent of the refuse generated. In Cairo, for instance, about 50 per cent of the
refuse generated is collected. Disposal receives less attention: as much as 90 per
cent of the MSW collected in Asian cities ends up in open dumps (Cointreau, 2008).
For example, according to the Public Health Act in Kenya chapter 242, the
Department of Environment of Nairobi City Council (NCC) is responsible for

30
implementation of policy, collection and disposal of waste. The department continues
to carry regulation and monitoring of activities of waste companies and generators of
solid waste. The NCC also enforces all laws and by-laws relating to solid waste, and
coordinates actors involved in solid waste management (UNEP, 2005).The private
companies in Nairobi operate without any regulation, monitoring or supervision by
the NCC (Karanja, 2005). The private sector participation in solid waste collection is
spontaneous, unplanned and open to competition without the NCC regulation. The
companies violate many of the solid waste laws and by-laws, especially those on
disposal (Van Dijki & Oduro-Kwarteng, 2007).
Looking at Ghana on the other hand, the implementation of the national
environmental sanitation policy is not receiving the necessary attention and therefore
influences the quality of solid waste service (Awortwi, 2003). The Kumasi
Metropolitan Assembly (KMA) has powers conferred on it by the Local Government
Act 1993 (Act 462) to promulgate and enforce by-laws to regulate solid waste
management, sanitation, cleansing and abatement of nuisance in the Kumasi
Metropolis. Companies cannot operate without the approval of or license from the
KMA (Van Dijki & Oduro-Kwarteng, 2007).
Thompson (1995) reviews waste management in Ghana. The Republic of Ghana is
home to 22 million residents. Accra, the nation’s capital serves as the economic,
administrative, and cultural centre of the country. Its geographical position has
allowed it to function as a natural port to the Atlantic Ocean, which has in turn made
it an important destination point for number of Ghanaian trading industries. It covers
an area of approximately 65 square miles. It houses a full 18 % of the total Ghanaian
population and 30 % of the country’s urban population. Unlike the towns and villages
spread throughout the majority of the countryside, Accra is a veritable urban Mecca
for labour-seeking residents from all over Ghana. Half of Accra lives below the World
Bank’s absolute poverty threshold of little less than a dollar a day. Still, for the past
two decades this city of roughly 4 million inhabitants has had an annual growth rate
of 4 % making it one of the fastest growing metropolis in Africa. This phenomenal
31
growth has contributed to municipal waste production that far outstrips the city’s
capacity for containment and processing. (Thompson, 1995)
Thompson (1995) further indicates that Ghana has waste management difficulties
that extend from the state to the local municipalities, and refuse of all shapes and
sizes is a common site in both urban and rural areas. These difficulties are
concentrated and complicated by population pressures in the few heavily populated
cities of which Accra is the most prominent. Inequality features heavily in the capital.
80 % of the city population lives in low income, high density population areas. The
middle class is occupied by 17 % of the population. Only 3 % of Accra lives in high
income, low density residential areas. The sanitary infrastructure of Accra is
reflective of the income divisions. Only 30 % of all houses have toilets that actually
flush. Only 1 in every 5 houses has functioning indoor plumbing. The public latrines
that have been built to accommodate these disparities are overused and often
shared by 10 or more people.
According to Thompson (1995), visitors to Accra are confronted by two narratives. In
one, Accra is the posh clean “gateway to Africa”. Streets are manicured, palm trees
are coiffed, and all the amenities of the western world including regular waste
removal can be heard. In the other version, city residents are contending with
congestion, illegal settlements, substandard housing, and poor sanitation. This
environment is the predominant experience of most city residents and is reflective of
growing inequality that that has come to represent Accra. The confluence of poor
governance and human factors (such as indiscriminate dumping) has resulted in a
city environment characterized by choked drains, clogged gutters, and garbage piles
heaped in the open. (Thompson, 1995).
The story of how two such divergent experiences came to exist in the same city
speaks to the challenges of urbanization with regard to waste management. Accra’s
modern day waste management deficiencies has it beginnings in the 1980s when
Ghana was in a period of economic decline. In Ghana privatisation is usually an

32
exercise meshing political capital with governmental responsibility. Many staff
positions, jobs, and contracts are linked to the party in power. The management of
public services can be disrupted cyclically with every election. New parties in power
may remove those in charge of sanitation duties because of their support or
instalment by another party. Private firms are usually receiving the patronage of the
current administration. The administrative priorities and the management approach
of the Accra Metropolitan Authority (AMA) however have managed to remain rather
consistent over the past decade, and by most accounts privatisation has allowed
AMA to increase the average yearly waste collected.
Accra is currently divided into 16 waste collection zones each contracted to different
waste management firm responsible for collecting and disposing solid waste.
Collection of solid waste from these zones has been delegated to the private sector.
The AMA concentrates on supervision of waste collection, monitoring of the public-
private partnership, and management of final disposal points. The private local firms
are the ones in charge of actual collection and provide their services for a fee
according to specific contractual agreements that each company makes with the city
authority, the AMA. The AMA pays those companies with national budgetary
allocations from the state government and internally generated funds.
Benneh et al., 1993 point out that “half of Accra households perceive local
accumulations of solid waste to be a problem, and more than one third mention open
dumpsites in their neighbourhood where waste goes uncollected for a week or
more”. The current situation is not tenable. The advent of e-waste imports—old TV
sets, radios, and computers from developed nations-- threaten to further destabilize
an environmental approach that is not keeping pace with emerging health risks. In
the near future Accra will have to improve its waste management.
This study will centre on the present approaches and strategies being used to
address Accra’s growing waste management problem. Thompson focused the
analysis on solid domestic waste. Characteristics of Ghanaian society that both aid

33
and detract from effective waste management will be considered. The environmental
and health consequences of the waste dilemma will be explored. Solutions being
proposed to help resolve the current predicament will be discussed.
Domestic waste in Accra is primarily made of organic material (65 %). The remainder
of the disposed waste consists of paper, plastics, glass, metals and textiles. The
organic material is typically a mixture of kitchen waste (vegetables, rotten fruits, crop
residues, and leaves) and animal excreta. None of the organic material is in and of
itself toxic to humans or the environment. Frequently it is the manner in which the
waste is kept that dictates the exposure to health risks. The largest risk to humans
comes in the form of diseases associated with unsanitary conditions. Infectious
diseases of poor sanitation and poverty are the most common diseases affecting the
residents of Accra (Thompson,1995).
In the Accra households it is not uncommon to find open waste containers. Many
households store their waste in baskets and plastic bags. The hot and humid
weather conditions favour accelerated fermentation of organic matter. The lack of
substantive toilet infrastructure means that citizens at times resort to defecating
outside. Past studies have found more than two-fold increase in childhood diarrhoea
prevalence due to neighbourhood outdoor defecation.
About 18 % of households in greater Accra region (mostly low-income households)
burn their waste. This burning can contribute to outdoor air pollution. As a result,
leachants from burned refuse can enter the groundwater. Even though the burning of
domestic waste has been associated with respiratory illness, households that are
inconsistently serviced by waste collection companies sometimes burn their waste.
Hence, in these households, respiratory diseases are more common in mothers and
children.
Water pollution is another important potential outcome of inappropriately managed
waste. For example, the unregulated leachants from refuse near waterways increase

34
the technical difficulty of providing clean water and subject city residents to urban
flooding risk. Urban floods occur when drainage systems and other storm control
devices overflow because of waterway blockages.
The poorer population of Accra bears a disproportionate amount of the
environmental health risk burden. The most vulnerable populations are sanitation
workers and the migrant workers from the North. Migrant workers frequently resort to
scavenging to provide income. Scavengers can be seen in broad daylight searching
through refuse at open dumps for materials—plastic slivers and metals—that can be
sold back to processing factories.
Sanitation workers are hired by private companies. However, they receive little or no
protective clothing from the waste management companies which employ them.
These workers earn low wages, and thus are not able to purchase appropriate
clothing for their protection. Thus, they suffer more exposure, and as a consequence
have a higher turnover rate, higher incidences of sick days and work-related
accidents, and higher mortality than the rest of the city population.
Present approaches:
Many approaches to waste management exist in Ghana. Generally, solid waste in
Accra is managed through economic instruments, landfills, incineration, recycling or
reuse. A thorough discussion of Accra’s governance would necessitate a detailed
retelling of Ghana’s political history. For the purposes of this study; the reader should
consider good governance as a potential moderator for each of the approaches
discussed. Bad governance will weaken the approaches. Good governance will
bolster the approaches. Improvements to any of the elements discussed will in turn
enable better governance.
Like most developing countries, Ghana and consequently Accra has an established
set of comprehensive environmental laws. However it lacks the means to enforce

35
those laws. This study did not discuss advanced waste disposal systems, such as
gasification and pyrolysis, which Ghana does not have the financial and technical
resources to support. It will only address the technologies and approaches already in
use in Accra and other comparable heavily populated urban cities in sub-Saharan
Africa.
Economic Instruments: Privatisation
Economic instruments can be grouped into two categories: revenue- raising
instruments (licenses, user charges), and non-revenue instruments (performance-
based management contracting, clean neighbourhood competitions, privatisation).
The problem of waste collection is structurally dissimilar from the problem of waste
disposal.
The AMA’s main economic tool is privatisation. Advocates of privatisation believe
that for-profit competitive systems increase efficiency and better calibrate supply and
demand. Opening the waste management market to competition can stimulate
development of better pollution control technology and expertise. Before 1995 solid
waste management was run purely as a government monopoly. However the
government was failing to adequately address the sanitary needs of its citizens.
Privatisation has permitted waste collection services to be allocated to the parties
who value them the most. Opponents to Accra’s privatisation program acknowledge
that the living standard in higher social economic classes has increased, but they
argue that the benefits of privatisation are not experienced equally by residents of
Accra. Poorer socioeconomic classes have only received marginal benefits.
Low-income residential areas (which make up the majority of Accra) are still under
serviced. Critiques of privatisation point out that waste collection relies on the
government management of infrastructure (ensuring streets are paved and
accessible, enforcement of zoning laws against squatters) independent of public or
private servicing. Private firms will only be as good as the infrastructure that supports

36
them. Private firms have little incentive (and virtually zero technical capacity) to
repair and maintain roads.
Privatisation depends on fees. In high-income neighbourhoods each household pays
a fee for the privilege of waste collection. Houses are sufficiently spread that if a
household determines not to pay the fee and waste accumulates, that action does
not immediately offend the aesthetic environment of neighbouring households. In
low-income neighbourhoods, the opposite is true. Waste is accumulated at central
collection points. When payment schemes have been instituted (such as requiring
residents to pay a specific fee before the central container units are collected),
residents simply free-ride.
The population is too dense and municipal workforce too sparse for effective policing
of environmental by-laws. Thus paying households in poor neighbourhoods receive
little tangible aesthetic benefit as their immediate surroundings are still polluted by
other residents. Cities are permitted to appoint designated landfill sites, but these
sites are more accurately designated as open dumps. Sanitary or engineered
terminal end sites for Accra’s waste deposition are non-existent.
Accra’s landfills mostly consist of abandoned stone quarry sites, gouged natural
depressions in the earth, old mining areas, or man-made holes in the ground. Many
of these sites are at the outskirts of the city where the poorly maintained roads
present significant risks to waste transport.
The Ghanaian Environmental Protection Agency has recognised the need to have
the municipal dumps of Accra replaced or upgraded to engineered landfills and has
set a 2020 target for the conversion of all these sites. Waste manage disposal is
underdeveloped. Most of these landfills operate near or beyond maximum capacity.
Waste is not subject to compaction. Volume remains expanded, and as a result
these dumps are frequently infested by roaches, rodents, and flies.

37
Composting:
Composting is a minimally used form of waste disposal in Accra and does not
contribute to the danger of food pollution. Of the 1250 tons of garbage collected per
day – about 10 – 15 % is composted. In theory composting could reduce
environmental pollution and provide job opportunities. Compost fertilizer also could
help improve agricultural production and improve soil structure – which means it
offers a longer term advantage over other non-compost mineral-based fertilizers.
The high percentage of organic material that is disposed as trash suggests that
composting could be a viable municipal solid waste technology.
In practice, composting is not a widely employed technology. Greater use of
composting requires analysis of the different levels of technical sophistication and
the potential transport capacity of Accra’s waste collection system. Profitability and
investment analysis for constructing and operating compost facilities in Accra would
have to be undertaken. Such forms of analysis have actually been done as recently
as 2004. Results show that the overall cost of building and operating composting
facilities in the Accra-Tema Metropolitan area is much lower than for incineration and
land filling. There are two active compost plants active near Accra. These plants are
capital intensive and require very few men for efficient production. It is not fully clear
why composting plants are not used and encouraged more.
The price of compost is also sensitive to transport costs. As Accra has grown and
expanded, agricultural end destinations for compost have become further and further
removed from the site of compost production adding to the expense of compost
purchasing. The current preference of non-composting waste management
technology may be difficult to adjust considering these circumstances, which is a
shame as many urban farmers (inexperienced and experienced) have positive
perceptions and are willing to use compost. One potential solution to this impasse is
using farmer associations (already in existence) to purchase compost in bulk to
reduce transport costs. Until transport costs are reduced, composting will likely

38
remain low on the priority list of technological processes expected to ameliorate the
waste management burden in the future.
Recycling:
Only 2 % of the solid waste is recycled at a recycling facility. Recycling is practiced
informally, but the recycling base of Ghana is in general weak. Households in low
income areas do not dispose of plastics, bottles, paper, cardboards and cans readily.
Recyclable materials are used and reused for domestic purposes and only thrown
away when they are no longer of any use to the owners. In high income areas,
domestic servants will sell these materials to middlemen to supplement income
instead of disposing them along with the other refuse. There are two main recycling
plants in operation in Accra.
Unlike other poor cities around the world, Accra lacks a substantial sector of waste
pickers to collect and sort household waste on behalf of merchants, recycling firms,
and composting units. Encouragement of the waste picker labour market and other
participants in the informal recycling sector could help extend the lifespan of the
cities landfills through waste diversion.
Incineration:
It is used primarily as disposal for biological waste associated with medical care.
Policies governing the appropriate use of incineration exist in Ghana, but Accra
incinerators mostly consist of ovens or open pits used to burn bandages and blood
products. After burning, the ash is usually moved straight to an adjacent landfill,
where it takes up only a tenth of the volume of the original waste. Ghana’s national
policy recommends small scale incineration plants, but primarily as a disposal option
for health care wastes.
Public apathy to environmental issues prevents residents from making meaningful
contributions to the difficult decisions that are required to prioritize environmental

39
health. Historically, community participation in Accra municipal decisions has been
low. Accra lacks the resources to organise dialogue sessions, and rarely employs
facilitators to involve people in decision making.
Labour is one of the most available inputs in Ghana’s waste management sector. It
is certainly more readily available than capital stock and imported technologies. But
no institute has responsibility for research into Accra’s major resource—its people. A
major research effort on the economics of the waste management labour market is
needed to determine if substantial gains in output, employment, and services can be
had from the introduction of labour-intensive methods of waste collection and
disposal. It is possible that short-term efficiency gains could be had if waste
companies used a higher ratio of labour to capital.
Community participation is vital for all these proposed plans of action. The literature
is replete with examples of projects that have yielded sustainable results from
community organising efforts. One of the most successful examples is the Orangi
Pilot Project in which residents of Karachi Pakistan slums were given the capacity to
participate effectively in the creation (purely community financed and constructed) of
their own sewage system. It is crucial to create and access a self-referential body of
research (through focus groups, small scale pilot projects, and published studies) to
help determine if similar initiatives are applicable to the environmental conditions in
Accra. These research demonstrations can help guide citywide policy and highlight
how best to engage with the city’s poor communities.
Landfill Gas Recovery Research:
A technological intervention with the potential for long term impact on Accra’s waste
management woes is landfill gas recovery. At sites with large inputs of commercial
and industrial organic waste, large amounts of methane gas are produced. Methane
gas can be captured and fed to gas wells used to generate electricity. This
technology is already in use in the developed world. The first Landfill gas capture

40
project was recently started in South Africa and is currently entering phase 2 of its
completion. Already electricity is being produced and sold to the local population to
generate revenue. Additional revenue is being received from carbon credits that can
be sold on the carbon market through the Kyoto Protocol.
While landfill methane capture will not reduce the amount of waste generated, it can
serve as a potential source of energy for local residential and commercial buildings.
Additionally, it can lower environmental risk by lowering overall emission of methane.
Methane, the second most important greenhouse gas after carbon dioxide, has a
global warming potential that is 23 times that of carbon dioxide.
The utilisation of such a technology in Ghana would allow citizens to make more use
of the landfills by harnessing the effort put into collecting and storing garbage and
transforming it into needed power supply. Currently, landfill electricity-from-gas
generation projects in Africa are not competitive with local electricity costs. In South
Africa for example, the gas-recovery landfill in Durban is 66% more expensive than
the current electricity supply. However, the landfill construction is funded from the
Worldbank’s Prototype Carbon fund – a recently available form of finance provided
from carbon credit market. Ghana stands to benefit from research into innovative
projects like the gas-recovery landfill in South Africa if only investors can be attracted
to the waste management sector.
Solid waste management in Egypt
Municipal solid waste composition
Municipal waste composition varies from one region to another according to income
levels, population density and predominant activities. Seasonal changes in food
composition result in seasonal changes in waste composition. Changes in the
lifestyle and the increasing dependence on processed food and its associated

41
plastic, carton, and metallic packaging continuously alter the composition of solid
waste in Egypt (Zayani, 2010).
Collection and treatment
Zayani (2010) states that collection of municipal solid waste is the responsibility of
local municipalities in Egypt. However, in Cairo and in the big cities, waste collection
is subcontracted to local “zabaleen” (garbage collectors), and in recent years to
private local and multinational companies. The average collection rate in urban areas
is 30-77 %, in Cairo it ranges between 0 % in the slums and the poor
neighbourhoods and 90 % in the private residential compounds. The collected waste
is disposed in open dumpsites, where scavengers separate recyclable materials, and
the rest is left to rot, or is burned to reduce the volume. Spontaneous fires are very
frequent and so is landfill gas and leachate formation, two substances that are very
harmful to the atmosphere and the ground water table.
In rural areas, waste collection and disposal systems are virtually non-existent. The
organic fraction is generally used to feed the household’s feedstock. The non-usable
fraction is dumped in empty land lots, along roads, irrigation and drainage canals. A
few municipalities in some villages use trucks and tractors to collect municipal solid
waste, which is dumped in open dumpsites, where it is burned to reduce its volume,
or left to rot naturally.
Future plans
Landfilling and incineration have recently been introduced in Egypt as more
environmentally sound solid waste treatment techniques. The Egyptian Government
also adopted a national plan for establishing composting plants throughout the
country, whereby produced compost would be used as an organic fertilizer.
However, government plans were not successful in the last ten years, as in the year
2000 it announced its objectives of collecting 99 % of waste in urban areas and 70 %

42
in rural areas, but despite the announced spending of 1.9 billion Economic Gross
Product (EGP) over ten years17, and the Spanish and Italian contractors, the
situation of municipal solid waste in Cairo has worsened greatly in the past 10 years
(Zayani, 2010).
Current state agricultural solid waste
Agricultural activities generate around 17 million tons of crop residuals, an average
of 147 million m3 of cattle manure and 1.1 million m3 of poultry manure annually.
Agricultural solid waste did not represent a problem in Egypt’s rural areas, until the
introduction and rise of artificially synthesized materials that are not biodegradable.
Farm waste has been generally re-used on the farm in various ways (as cattle
fodder, as fertilizer or as combustible). Crops residuals used to be stored by farmers
on top of their roofs to be used as a source of fuel when burned.
However, the increasing spread of propane/butane gas fired ovens and stoves
resulted in decreasing the use of waste as a fuel. Moreover, new regulations were
introduced by the Ministry of Agriculture to ban the storage of agricultural waste as a
measure to fight pests and diseases, and to prevent hazardous fires. Due to the lack
of resources, farmers prefer to dispose off the undesired, non-storable waste by
illegal means such as burning or random dumping. This reduced the utilisation rate
of agricultural waste from 100 % to 40 %.
Composting current status and potential
The national production capacity of compost in 2001 was about 20.7 million
tons/year, creating a severe shortage. The current production capacity is estimated
to be higher with no precise figure. In a report made for the USAID and the Ministry
of water resources and irrigation in July 2005, the demand for compost has been
estimated to around 53 million tons/year for the old Nile Valley land, and 1.5 million

43
tons/year for reclaimed land. The demand for compost for the reclaimed desert land
is expected to reach at least 30.7 million tons/year by 2017 (Zayani, 2010).
2.2.3.Local Experience on Solid Waste Management
Table 2.7: Local Experience on Solid Waste Management
Local Experience on Solid Waste Management
Waste in South Africa is currently governed by means of a number of pieces of
legislation, including:
• Environment Conservation Act (Act 73 of 1989)
• National Water Act (Act 36 of 1998)
• The National Environmental Management Act (Act 107 of 1998)
• National Environmental Management: Waste Act, 2008 (Act 59 of 2008)
The President of the Republic of South Africa signed The National
Environmental Management: Waste Bill into an Act of Parliament in March
2009, The Act took effect from 01 July 2009. It is the intention of this Act to
address the current fragmentation in waste legislation in South Africa.
The process of waste management may be divided into six functional components.
The waste management process takes place within a complex milieu of ever-
changing economic, social, political and biotic factors, all of which have to be taken
into account in the development of any waste management strategy. The term waste
management strategy implies a holistic approach to waste management should not
be based on crisis management, although allowance must be made for this. It should
be the implementation of a logical and systematic discipline which has considered all
appropriate alternatives and in which all sectors co-operate in an informed and
responsible way to arrive at the best practicable environmentally acceptable option
for the disposal of any given waste (Lombard & McPherson, 2003).

44
In rural areas of South Africa, households are responsible for their own waste. The
common practices used to dispose waste are; burning and burying waste in the yard.
A Case Study in Limpopo Province, South Africa conducted by Ogola et al., (2012)
describes six general sources of waste generation in Polokwane. These include;
domestic, commercial, industrial, agricultural, institutional and natural.
• Households are the highest producers of domestic waste. Domestic waste
includes, among others, paper and cartons, plastics, glass, leftover food and
cans.
• main agents of commercial waste producers are stores, business premises,
markets and restaurants.
• Industrial waste refers to wastes from construction and demolition debris and
food processing outlets.
• Agricultural wastes refer to the waste outcomes from dairy and poultry farms,
livestock and other agricultural activities like vegetation cultivation. Most of the
agricultural wastes contain biodegradable components.
• In case of institutional wastes, major producers are schools, offices and banks.
This type of waste contains paper and cartons.
• Natural waste consists of leaves, tree branches, seeds and carcasses of animals.
Ogola et al., (2012) further used the following methodology to collect data on waste
management in Polokwane.
2.3.1.1 Data analysis
The data obtained were subjected to statistical analysis in order to establish whether
there was any significant relationship between the quantity of waste obtained and the
income groups. The significant relationship was based on 95% level of confidence.
The study focused on the household solid waste generated within the three selected
residential areas of Polokwane city, namely: Low income-Ivypark, Middle income-
Florapark and High income-Sterpark. Food waste was the highest across all the

45
income groups with a percentage waste generation of 34 % . The trend of wastes
was as follows: Paper-20 % > plastics-18 % >glass-11 % > cans- 11 % >garden
waste –6 %.
Ogola et al. (2012) indicates that wastes from the households were not sorted.
Instead, all the wastes collected from individual households were mixed in refuse
bags. This makes recycling of wastes from homes not practical, and thereby
reducing the quality of recyclable wastes like paper and cardboard through mixing of
waste. The waste refuse bags from households are collected weekly on a specific
day for each suburb. For example, for Ivypark, collection is on Thursday, Florapark
collection on Wednesday and Sterpark on Tuesday. The amount of waste collected
on a weekly basis from the residential areas and city center amounts to 456 m3. The
collection system is quite effective, thus no refuse bag is left by the road side to litter
the city.
Ogola (2012) indicates that currently, there is no recycling programme implemented
by the Municipality of Polokwane City. It has been found that 60 % of waste disposed
in the landfill consists of recyclable waste. Although the Municipality does not have a
formal waste recycling system, it was found that the disposal site has informal waste
reclaimers that are collecting recyclable wastes on a daily basis.
Ogola et al., 2012’s discussions and recommendations:
This study indicates that waste generation in the three income groups to be
computed as 0.3-0.7 kg per person per day, which was distributed as follows:
Low income group at 0.3 kg per person;
Middle income group at 0.4 kg per person and;
High income group at 0.7 kg per person.
46
This amount of waste generated was low as compared to the findings of the Baseline
Studies (DWAF,1998). Where the average amount of waste generated per person
was found to be 0,7 kg per person in South Africa. Generally, it was observed that
the amount of waste generated by the three income groups depended on the socio-
economic level of the group. The High income group was found to generate more
waste than the low and middle income groups. This was attributed to the affordability
of goods by this income group.
It is worth noting that the waste generated per person in Polokwane city is lower than
that generated per person in Johannesburg. For example, in Johannesburg, the
average waste generated per income group ranged from 0.4-0.7 kg per person, 0.7-
1.1 kg per person and 1.2-2.5 kg per person for low, middle and high income groups
respectively (City of Johannesburg, SOER, 2003). This is rather not surprising since
most of the people residing in Johannesburg earn more than their counterparts in
Polokwane and, therefore are expected to afford more goods which are disposed of
after utilisation.
2.3.1.2 Waste composition
Food waste constitutes the highest percentage of waste generated in all the income
groups, although the percentage varied with the high income group having 37 %,
middle group-36 % and low income group-25 %. The waste composition found in the
three income groups varied markedly. While the waste from the low income group
had the highest percentage of grass waste, and that from the middle and high
income groups were composed mainly of recyclable waste: plastics, glass, paper
and cans. Studies conducted in Nairobi agree with the data in Polokwane city that
household waste comprised high percentage of food waste in all the three income
groups sampled. Almost 50 % of waste generated in Nairobi was food waste,
whereas in Polokwane food waste comprised 34 % of the total waste generated from
the income groups (Henry et al., 2006)

47
The results of this study shows that in Polokwane amount of organic waste
generated amounts to 40 % which is low as compared to other studies conducted in
Nepal, where organic wastes was 70 % of the total waste generated, and 60 %
recyclables for Polokwane versus the 20.5 %. According to the studies carried out in
Macao in China, food waste accounted for 15 % of the total waste generated, and 52
% was of recyclable waste(Jin et al., 2006).
2.3.1.3 Waste recycling
Ogola (2012) indicated, that about 60 % of wastes generated can be recycled. This
included glass – 11 %, plastics -18 %, paper- 20 % and cans-11 %. The amount of
potentially recyclable waste in Polokwane city is much high as compared to other
cities for example, Nairobi 35 %, Macao-China 52 %, Singapore 30 % and
Kathmandu 20.5 %, (Bai & Suntato, 2001). Although the Municipality does not have
a formal waste recycling system, it was found that the disposal site had informal
waste reclaimers that are collecting recyclable waste on a daily basis. This has also
led to development of an informal settlement close to the landfill. Waste reclaimers
collect all the waste that is re-usable, ranging from bricks, plastics, steel, card boxes,
cans.
No formal recycling programme exists in Polokwane Municipality whereas other
Municipalities such as the City of Johannesburg and the City of Cape Town have
initiated recycling programmes. This is one area that the Municipality must explore in
order to achieve the Polokwane Declaration target on Zero Waste (Trois et al.,
2008).
Ogola et al., 2012 recommendations were as follows:
• There is a need to develop an integrated waste management plan for
Polokwane City with a priority on waste recycling to reduce the final amount of
waste for disposal.

48
• The Polokwane Municipality should develop an environmental awareness
programme on recycling supported by placement of the recycling containers at
strategic points to collect recyclable waste.
• The Municipality should come up with a strategy of supporting household
separation at source.
• The programme of cooperatives for litter picking should be extended to include
recycling.
• Waste generation is a vital component of waste statistics. The accuracy of these
statistics is important in planning, development and monitoring waste
management strategies. The Municipality should develop a monitoring system
for waste classification, quality and quantity.
2.4 Summary
Profound differences exist between developed and developing countries in terms of
income, standard of living, consumption patterns, institutional capacity, and capital
available for urban investment. Conventional solutions usually do not take into
account these differences resulting in less than optimum outcomes. Residents of low
income countries tend to generate less garbage than people in wealthier areas. But
they are catching up fast. China, with its billion-plus population, growing economy
and improving standard of living, surpassed the US as the world’s largest generator
of solid wastes in 2005. If current trends continue, India will also generate more total
wastes than the US in the year 2025 (Medina, 2008a).
There are also profound differences between waste management in urban and rural
areas. If per capita incomes are higher in the cities than in rural areas as is often the
case in developing countries- urban residents tend to generate more waste per
person. The composition of urban wastes tends to be highly diverse due to the wide
variety of production activities and all the various material inputs used in them.
Productive activities also generate wastes in their processes and consumers discard
products and packaging materials after consumption. Thus, urban wastes are highly

49
diverse and urban residents tends to generate more wastes than their rural
counterparts.
Rural areas, however, can generate large amounts of wastes, depending on the type
of existing economic activity, but these tend to be less diverse than urban wastes.
(Cointreau, 2008). Due to their dispersion, the cost of collecting wastes from rural
residents can be much higher than in urban areas. Not surprisingly, many rural area
in developing countries lack waste collection services. Rural residents who lack
refuse collection often dump their wastes on vacant land, bodies of water, or simply
burn them.
Table 2.8: A summary of comparative analysis of solid waste management.
International Experiences
Regional experiences
Local experiences
Sources of waste domestic,
commercial,
industrial,
agricultural,
institutional
and natural.
domestic,
commercial,
industrial,
agricultural,
institutional
and natural.
domestic,
commercial,
industrial,
agricultural,
institutional and
natural.
Waste
Management
Practices
Open
dumping,
incineration,
composting
and landfilling
in Sri Lanka
Landfillig,
composting
and
incineration
in Egypt.
Landfilling,
incineration,
composting in
Polokwane.
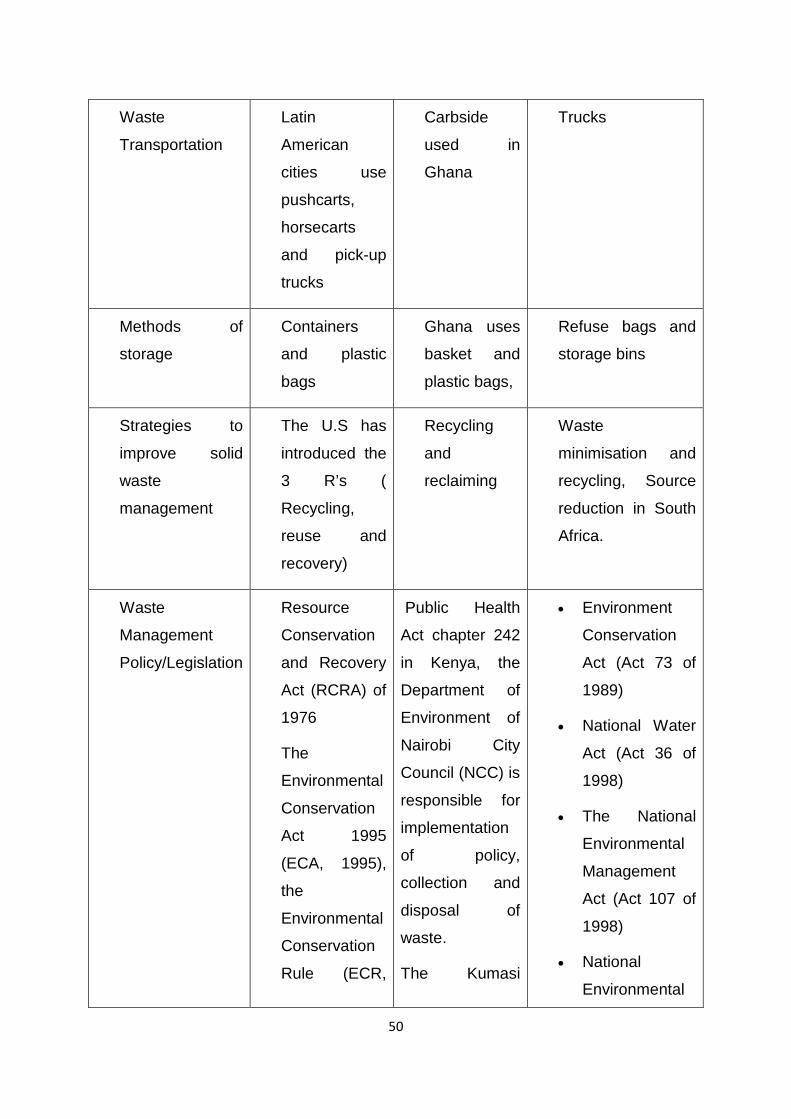
50
Waste
Transportation
Latin
American
cities use
pushcarts,
horsecarts
and pick-up
trucks
Carbside
used in
Ghana
Trucks
Methods of
storage
Containers
and plastic
bags
Ghana uses
basket and
plastic bags,
Refuse bags and
storage bins
Strategies to
improve solid
waste
management
The U.S has
introduced the
3 R’s (
Recycling,
reuse and
recovery)
Recycling
and
reclaiming
Waste
minimisation and
recycling, Source
reduction in South
Africa.
Waste
Management
Policy/Legislation
Resource
Conservation
and Recovery
Act (RCRA) of
1976
The
Environmental
Conservation
Act 1995
(ECA, 1995),
the
Environmental
Conservation
Rule (ECR,
Public Health
Act chapter 242
in Kenya, the
Department of
Environment of
Nairobi City
Council (NCC) is
responsible for
implementation
of policy,
collection and
disposal of
waste.
The Kumasi
• Environment
Conservation
Act (Act 73 of
1989)
• National Water
Act (Act 36 of
1998)
• The National
Environmental
Management
Act (Act 107 of
1998)
• National
Environmental

51
1997),
Environmental
Conservation
Rule, 1997
(ECR 1997),
Environmental
Court of Law,
2000.
Metropolitan
Assembly has
powers
conferred on it
by the Local
Government Act
1993 (Act 462)
to be
promulgated in
order to enforce
by-laws and
regulate solid
waste
management,
sanitation,
cleansing and
abatement
of nuisance in
the Kumasi
Metropolis.
Management:
Waste Act,
2008 (Act 59 of
2008)
Polokwane city is
currently reviewing
the refuse (solid
waste) and
sanitary by-law, the
Administrative
Notice No 845 of
1983, in line with
the Integrated
Waste
Management Plan
for the city.
Challenges Asia shows
lack of
awareness
and technical
knowledge is
a major factor
causing the
deterioration
of the
environment.
Lack of
regulation,
monitoring
and
supervision
by City
councils in
Kenya.
Ghana lacks
means to
Limited formal
recyclable
programmes.

52
enforce laws
established
to manage
waste.
Table 2.8 shows challenges that are faced by Asian waste management system.
There is a lack of awareness and technical knowledge in waste management. A
review of municipal and household solid waste statistics in an Asian country (Turkey)
focused on solid waste management costs. The results indicated that average
household waste generation per capita is 0.6 kg/day and average municipal solid
waste is 0.95 kg/day. The composition of municipal solid waste varies by the source
of waste; however in all cases organic constituents accounts for more than 50 % of
municipal solid waste.
Material recovery data have been obtained from 31 municipal separate collection
programmes, with data period extending up to 5 years of collection and sorting
operations. These data clearly indicate that the composition of recovered material
shows some variation depending on the source (commercial, residential and mixed)
and the season of the year. However, regardless of the source of collection, whether
it is commercial, residential or a tourist site, the majority of the material collected is
composed of paper and cardboard. Glass packaging ranks second with an average
of 20–25 % (by weight) and plastics constitute 15–20 % of the outputs of the material
recovery facilities.
The US showed a strength on waste management due to the phases that were
followed when developing waste management legislation. The first phase
emphasised research and training, followed by the second phase that focused on
resources recovery and reclaiming. The third face encouraged active future use of
facilities to manage waste. The final phase enforced RCRA at federal facility.

53
The regional review on solid waste reveals that the challenge lies with the
percentage of waste generated and waste collection. An example is seen where
only 50% of the waste generated in Cairo is collected for disposal. This is mainly due
to lack of enough attention given to policy formulation to manage waste and the
implementation of such policies. An example is a situation in Nairobi, Kenya where
private companies operate without any regulation, monitoring and supervision by
Nairobi City Council.
Solid waste generated by households, industry and agriculture is clearly badly-
managed in Egypt, creating countless environmental and health problems. The
collection and separation of municipal solid waste is technologically feasible and
economically sound. Recycling and recovery of metals, plastics, paper, glass and
several other materials is already done in an effective way, without being efficient.
Garbage collectors and scavengers are exposed to unhealthy and risky conditions.
The remaining fraction of municipal waste that is not collected also creates several
health and aesthetic problems. The existing landfills generate a lot of greenhouse
gases and pollute the soil and the ground water.
Agricultural solid waste is being under-managed and under-exploited as well. The
existing and mature composting technology already offers economically and
environmentally interesting solutions as domestic as well as international demand
exist and are growing with the ever increasing global interest for organic farming.
Environmental consciousness and green investments are on the rise in Egypt and
there is no doubt that the waste management field will grow considerably in the
future, especially with the rising prices of raw materials and with the expected cuts in
natural gas subsidies.
A Solid Waste Management Strategy for Egpyt had been developed in 1992. Its full
implementation was not realized at the time for several reasons. In 2000, a National
Strategy for Integrated Solid Waste Management (NSISWM) was prepared.

54
This national strategy focused on Municipal Solid Waste (MSW), identifying core
problem areas, root cause(s), and conceptualizing a vision for possible and
foreseeable solutions. The goal and the major outcome from the implementation of
the national strategy are to establish and achieve an effective, sustainable national
system for IMSWM. The strategy anticipates a partnership of the Central
Government, the Governorates, Local Governments, Industry and the Public. It
depends heavily on the regional approach; with the Governorates being the principal
participant for the implementation of that strategy.
The strategy also adopts a philosophy of management that addresses solid wastes
as a natural resource that is founded on the development of its various prerequisites;
embodying proper policies, legislation, institutions, human resources, technological
infrastructure and supportive public awareness. In addition, it aims to provide Solid
Waste Management services to all segments of the community in an environmentally
sound manner and with least possible cost. The broad objectives of the NSISWM are
to eliminate uncontrolled accumulations of solid waste, and provide an efficient
storage, collection, transfer and final disposal.
Accra city in Ghana indicates that recent policy directives and legislation suggest the
Accra Metropolitan Authority (AMA) is at the very least interested in taking small
steps that will place Accra’s waste sector on the road to sustainable development.
The range of options available is at present constrained by technical know-how and
financial support of the state administration. But even within these constraints, the
extent to which AMA can implement preferred technologies will depend on the
greater participation of the residents it serves. For better or worse the future of
Accra’s waste management services is irrevocably tied to the involvement of the
public. Neglect of these potential actors will result in severe consequences for the
capital’s environment health.
55
South Africa lacks formal recyclable programmes to recycle waste. Ogola et al,
(2012) study indicates that South Africa’s 60 % of waste can be recyclable and this is
more as compared to other African countries. The implications of recycling would
lead to the achievement of the Polokwane Zero waste declaration target of 50 %
waste reduction by 2010 and zero waste generation by 2020. Ogola (2012) focused
on the income groups versus waste generation. It was concluded that level of
income of each household group determines the volume of waste generated by
such a group, thus the higher the level of income for the group, the more waste it
generates.
Ogola et al., 2012 observed that volumes of waste and composition were not the
same in each household group but this depended on the lifestyle. For example, the
high income group had the lowest garden waste since they can afford private garden
services that dispose garden waste after its generated, as compared to the low
income group. The high income group also had the highest percentage of paper
waste in a print form, which is linked to affordability.

References
APO 2007: Solid Waste Management: Issues and Challenges in Asia. Report of the
APO Survey on Solid-Waste Management 2004–05 the Asian Productivity
Organization.
Awortwi N 2003: Getting the fundamentals wrong: Governance of multiple modalities
of basic services delivery in three Ghanaian Cities. PhD Thesis. ISS.
Bai, R. and Suntato, M. (2001): The practice and challenges of solid waste
management in Singapore.
Beall J et al., 2010: URBANISZATION AND DEVELOPMENT.
MULTIDISCIPLINARY PERSPCETIVES. Oxford University Press.
Benneh, G et al., 1993: Environmental problem and urban household In Greater
Accra Metropolitan Area(GAMA). M.A.C. Stockholm, Ghana.
Bursa Greater City Municipality (BGCM) 2000: Separate Collection and Recovery
Projects, Feasibility Study.
CEVKO Trust 2000: European Commission Humanitarian Organization (ECHO),
United Nations Development Programme (UNDP). Improving Solid Waste
Management Services in the Earthquake Affected Areas, Final Report.
Coopers & Lybrand 2000: Cost-Benefit Analysis of the Different Municipal Waste
Management Systems; Objectives and Instruments for the Year 2000. Luxembourg.
City of Johannesburg 2003: City of Johannesburg State of Environmental Report
Ekurhuleni Metropolitan Municipality, Johannesburg, South Africa.
Cointreau SJ 2008: Declaration of Principles for Sustainable and Integrated Solid Waste
Management. Washington, D.C.: World Bank.
Dijk MP van 2007: Research methods and tools for an MBA course in Nanjing, Delft:
UNESCO-IHE Institute for Water education.
Dijki M.P van M & Oduro-Kwarteng S 2007: A contribution to the ISWA World congress in
57
September in Amsterdam.
Dijk, M.P. van and Sijbesma, C: 2006. Water and sanitation: institutional challenges in
India. New Delhi: Manohar, .
EPA 2009: This guideline provides definitions for a range of terms commonly used within
the waste industry. hhtp://www.epa.org. 842/09.
Henry et al., 2006: Municipal Solid Waste Management Challenges in Developing
Countries-Kenyan Case Study, Waste Management.
Istanbul Greater City Municipality (IGCM)2000: Solid Waste Statistics
Report.
Japan International Cooperation Agency (JICA) 2000: The Study on Regional Solid Waste
Management for Adana-Mersin in the Republic of Turkey, Final Report. Kokusai Kogyo
Co.Ltd.
Jin et al., 2006: Solid Waste Management in Macao: Practices and Challenges, Waste
Management.
Kamalski, J. 2010. Research Practice in Waste Management. Utrecht University,
Netherlands.
Karanja A 2005: Solid waste management in Nairobi: actors, institutional arrangements
and contribution to sustainable development. PhD Dissertation, ISS.
Kirkitsos, P.,et al. 2000. Strategic planning for the implementation of an integrated solid
waste management and recycling program of large coastal cities of Turkey in the Aegean
Lombard R & McPherson M 2003: A COMPARISON OF THREE WASTE COLLECTION
SYSTEMS APPROPRIATE TO FORMALISING COMMUNITIES IN SOUTHERN. Solid
waste collection that benefits the urban poor. Dar es Salaam.
Matete, N & Trois, C 2008: Towards Zero waste in Emerging countries – A South African
experience. Waste Management.
Medina, M. (2010). Brazil: The World’s Largest Scavenger Movement. BioCycle, August.
McDougall, F et al., 2001: Integrated Solid Waste Management: A Life Cycle Inventory
(2nd ed.). Oxford, UK: Blackwell Science.

58
Medina, M 2008: ‘The Informal Recycling Sector in Developing Countries: Asset or
Liability?’. GRIDLINES. Washington, DC: World Bank.
Metin et al., 2003:Waste Management Practices and Review of Recovery of Recycling
Opeartions in Turkey. Pergamon, Istanbul.
Mihelcic JR & Zimmerman JB 2010: Environmental Engineering: Fundamentals,
Sustainability, Design . John Wiley & Sons.
Neyim O.C. et al., 2001: 2nd International Packaging Congress and Exhibition,
Proceeding Book.
Ogola JS et al., 2012: Management of Solid Wastes: A case Study in Limpopo Province,
South Africa. http://www. Intechopen.com/ InTech.
Solid Waste Integrated Resources Plan (SWIRP), 2013: A zero waste master plan.
http//www.citysan.org
State Institute of Statistics of Turkey (SIS), 1993. Environmental Statistics,Household
Solid Waste Composition Survey.
State Institute of Statistics of Turkey (SIS), 1994. Municipal Environmental
Inventory, Fundamental Environment Indicators.
Sundaravadivel, M & Vigneswaran, S: 2002. Sustainable MSW management in
developing countries, the experiences of smaller towns in India.
Thompson, W.R 1995: Introduction: Urban economics in the global age. North American
cities and the global economy,Thousand Oaks.
UNEP 2005: Solid Waste Management. CaRecovery Incorporated
UN-HABITAT 2003:. The Challenge of Slums: Global Report on Human Settlements
London: Earthscan.
UNU-WIDER 2013: Inclusive Growth in Africa: Measurement, Causes and Consequences.
Helsinki, Finland.
Van Dijki M & Oduro-Kwarteng 2007: A contribution to the ISWA World congress
Amsterdam.
Weiner R.F & Matthews M 2003: Environmental Engineering. 4th Ed. Oxford.

59
White, P.R., Franke, M., Hindle, P., 1995. Integrated Solid Waste Management, A Life
Cycle Inventory. ISBN0-7514-004 6-7.
Zayani, A 2010: Solid Waste Management. Overview and current state in Egypt. Tri-
Ocean Carbon.
Zurbrügg, C. & Schertenleib, R. 1998: Main Problems and Issues of Municipal Solid
Waste Management in Developing Countries with Emphasis on Problems Related to
Disposal by Landfill. Paper presented at Third Swedish Landfill Research Symposia,
Lulea,Sweden.
http://www.eawag.ch/forschung/sandec/publikationen/swm/dl/Zurbruegg_1998_Landfill.pdf

60
CHAPTER 3: RESEARCH METHODOLOGY
In this chapter, a detailed description of the study area is discussed. Various
methods used to collect data are also discussed. This study focuses on
quantitative and qualitative characterisation of the wastes generated in
Polokwane. In addition, it investigates solid waste management practices that are
in place in the city, especially with respect to their environmental and institutional
resilience. Assessment on recycling and recovering of waste will also be made.
3.1 Study area
Figure 3.1: The physical location of different suburbs in Polokwane (Net- Focus
Interactive, 2012).
61
In 1904 Pietersburg had a population of 3,276, of whom 1,620 (49.5 %) were
whites. The remaining 50 % were probably black. Pietersburg was a white-
designated area during the apartheid period and so had an overwhelming white
majority before 1990. After the dismantling of apartheid, the city retained a large
white population. Neighbouring townships have an overwhelming (if not
exclusive) black majority (S.A. History, 2010)
Polokwane features a semi-arid climate under the Köppen climate classification.
Despite its position on the Tropic of Capricorn, the climate is tempered by its
position on a plateau 1230 meters above sea level. Average temperatures reach
around 21–22 °C in summer and fall to 11 °C in winter. As with much of inland
South Africa, Polokwane has experienced notably warmer seasons over the last
decade than its long term average. It has a dry climate with a summer rainy
season and a pronounced dry spell during winter. The average annual rainfall is
495 millimetres in December or (less often) January the wettest month and July
the driest. A comparative study of the solid waste management practices of
experiences from four suburbs and city centre was undertaken.
The South African Census showed the population of Polokwane as 271,911 in
2001 and 503,000 in 2011. The population almost doubled in nine years. An
increase in population means an increase in waste generation in the city. This
requires a rapid increase in the municipal budget in order to effectively manage
waste.
Under the apartheid government certain areas were allocated to certain racial
groups; these areas still have a majority of these racial groups present.
• Westernburg - Former Coloured township
• Seshego and Mankweng - black townships outside Polokwane
• Nirvana - Former Indian township and;

62
Former White suburbs in the city include:
Bendor, Flora Park, Fauna Park, Penina Park, Hospital Park and Ster Park
These suburbs no longer host exclusive racial groups as the local government
has launched a project to encourage integration.
The study was conducted in five residential areas located in the four different
directions from the city centre within the Polokwane Municipality (see Figure 3.1)
The five residential areas were from different directions of the city. For instance,
Westernburg is located at -23.9045587 Lat and 29.4309914 Long, 2.2 km on the
western side of the city centre. Ivy Park is located at the South Westerly direction
at -23.9188394 Lat& 29.4433238 Long at 1.873 km from the city centre. Fauna
Park is on the East of the city centre at -23.9065.96 & 29.4861164 at 3.971 km.,
Welgelegen is located on the Northern part of the city cetre at -23.893147 Lat &
29.4694361 Long at 5.681 km., and as one would expect, the City centre is on
the centre of the city at -23.90881 Lat & 29.45279 Long.
3.2 Methods and Materials
The approach and methodology used to achieve the study objectives were the
following:
3.2.1 Quantitative method
Quantitative method is defined as a research method that is used to quantify the
problem by way of generating numerical data or data that can be transformed into
useable statistics (Wyse, 2011). This method was applied through enquiring on
how waste is handled. That is, whether waste was weighed before being
transported from different waste generators sites. It was applied through field
surveys that were conducted during data collection from households.
Questionnaire distribution took place over a period of 5 working days (8th-10th) in
April 2013. Twenty voluntary participants were recruited from each residential
area. These totaled100 for the whole study area. Questions such as how the

63
participants dispose solid waste were asked and the responses were recorded on
the questionnaire forms.
3.2.2 Qualitative method
Wyse (2011) defines qualitative research as an exploratory research that is used
to gain an understanding of underlying reasons, opinions, and motivations. Wyse
(2011) further indicates that it provides insights into the problem or helps to
develop hypotheses for potential quantitative research. Interviews, observations
and field notes were used as data collection procedures. Interviews were used to
collect information from the municipal officials for solid waste. Polokwane
Municipal Office and the Waste Management Strategic Business Unit were
visited where a number of questions on how waste is managed were asked. A
visit to the landfill site was undertaken by researcher in the company of Municipal
official for observations.
Question asked during the interview were as follows:
General information. For example,age, gender, educational level, employment
information, income, assistance provided by the government.
• Methods used for disposal
• The number of bags or trash disposed weekly
• Types of containers used to store waste
• Whether waste is recycled.
3.2.3 Field survey
Enquiry whether on-site waste separation and measurements is done at
individual households from five residential areas. Ten litre plastic bins and 50 kg
weighing scale were used to collect and weigh the wastes selected during
sampling from households (Ogola et al., 2006). Gloves and refuse bags were

64
used for sorting the wastes; while facemasks and safety attires were used for
protection during the sampling and measurement period.
3.3 Sampling Plan
About 100 voluntary respondents were recruited from the five study areas.
Respondents were representative of all local ethnic groups, genders and were all
18 years or older. All respondents were briefed in advance about the study and
what it entails. The respondents were also briefed about their rights and were
also assured that their identities will be kept secret. Respondents were also
assured that they could withdraw anytime from participating in the study when
they want and nothing will be held against them. Basic demographic information
was required from the participants such as age and education. Random sampling
method was used during the study, where participants were recruited randomly in
each study area. The interview schedule was 15 minutes and the participants
were asked questions related to solid waste management practices.
The Qualitative interview was divided into two sections.
Section 1 comprised questions which were aimed at eliciting respondents’
biographical profile, age, gender, educational level, employment information,
income, kind of assistance received and the type of assistance received from the
governments collected from the work which is relevant to the objectives of the
study. These questions provide information which might have a bearing on the
findings of the study.
Section 2 covered a range of questions pertaining to the key investigative
questions in an attempt to ascertain the impact of solid waste and wastes
management practices in the Polokwane City.

65
This could, amongst others, shed more light on:
1. Current disposal of garbage by using one or more of these methods:
1.1 Burn it somewhere near your house or business?
1.2 Bury it somewhere near your house or business?
1.3 Haul it to the community dump or landfill yourself?
1.4 Dump it in a secluded spot away from the community?
1.5 Collected and taken to the landfill
1.6 Recycle cans or order waste.
1.7 Type of container to store garbage in before disposing it off
1.8 Large dumpster near your home or business
1.9 Metal or plastic garbage cans at your home or business
1.10 55-gallon drums / barrel
1.11 Plastic bags
2. About how many bags of trash do you dispose of each week?
2.1 1-2 bags per week
2.2 3-4 bags per week
2.3 3 -7 bags per week
2.4 More than 7 bags per week
3. Types of waste
3.1 Old batteries
3.2 Old appliances, snow machines….
3.3 Household hazardous waste
3.4 Used oil
In other sections, questions were referred to a range of questions pertaining to
the key investigative in an attempt to ascertain how the municipality manages
solid waste.
Take them to the landfill / dump.
Throw them out in the yard.

66
Take them to a battery collection area or tote.
Dump them in the landfill / dump
Dump them in your hard
Pour them in the sewage lagoon
Take them to a special collection area in the community.
In the qualitative questionnaire, respondents had to:
1. Described any ways that they dispose garbage
2. Indicate the method used most often
3. Specify what they recycle
3.4 Polokwane Disposal Site
Figure 3.2 shows a sign board at the only landfill site, Weltevreden, in Polokwane
which was visited during the study. Interview with the site management revealed
that the site has been operating for almost 15 years. The Polokwane Municipality
has contracted a company to operate the landfill.
Figure 3.2: Weltevreden land fill site

67
A mountain of waste (see Figure 3.3) is formed due to compaction that is done
using a compactor from time to time. This rubbish heap looks like any other
normal mountain from a distance, but a closer look shows the waste material
protruding in different parts. Tons of waste are disposed off daily and they are
weighed at a weighing bridge (see Figure 3.4) at the entrance to the landfill. A
report compiled by a contracted company indicated that waste disposed by April
2013 was 4 242 tons.
Figure 3.3: A mountain of waste in Weltevreden landfill site
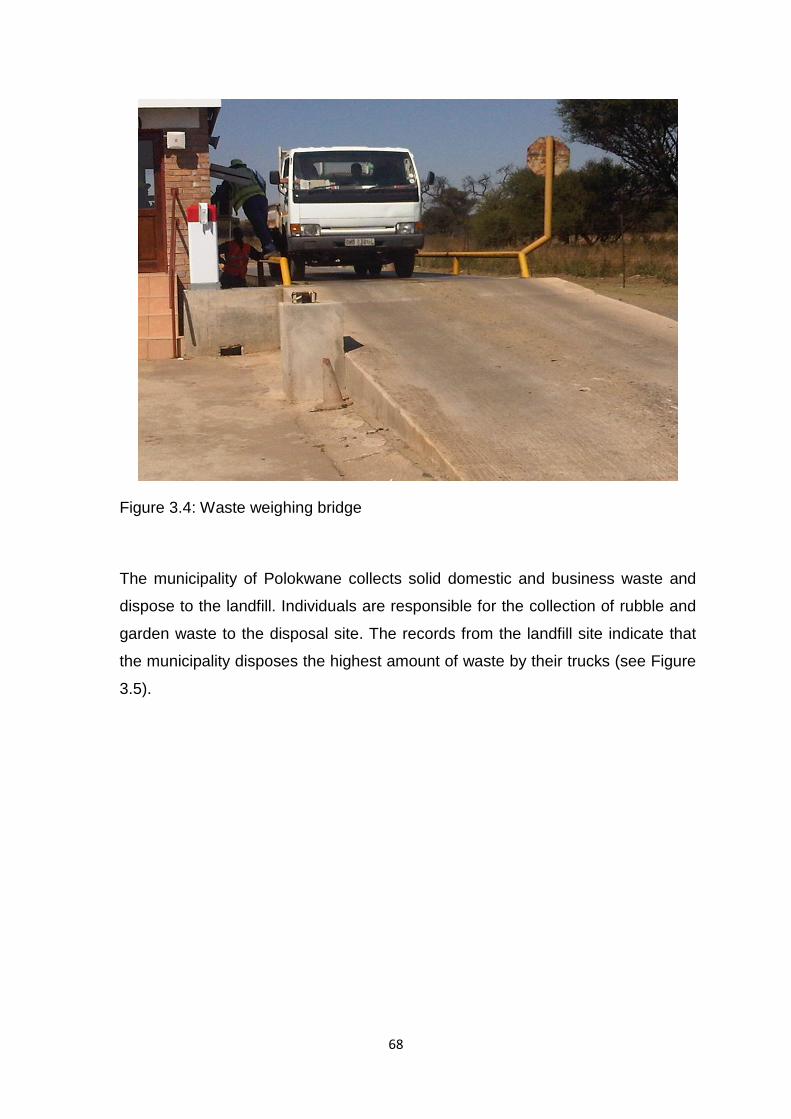
68
Figure 3.4: Waste weighing bridge
The municipality of Polokwane collects solid domestic and business waste and
dispose to the landfill. Individuals are responsible for the collection of rubble and
garden waste to the disposal site. The records from the landfill site indicate that
the municipality disposes the highest amount of waste by their trucks (see Figure
3.5).

69
Figure 3.5: Municipal truck after waste disposal at Weltevreden landfill site
The landfill site only allows the disposal of domestic, garden, rubble and business
waste. However the municipality agreed with some companies such as
Polokwane Brewery, to manage their special wastes. Since the Weltevreden
landfill is not lined, it cannot be used to dispose off hazardous waste. This landfill
is accessible for 24 hours every day by the municipality and from 7:00 to 18:00 by
individual residents.
There are waste reclaimers on site who reclaim waste for reuse, recycling and
recovery. Most of the reclaimers come from Zimbabwe and a few are South
Africans. They reclaim different material. For instance, some reclaim papers, card
boards, bottles and plastic bottles. Most reclaimers focus on plastic bottles (see
Figure 3.6). Every reclaimers reclaims according to their needs and they have
contracted with buyers who come to the site to collect the reclaimed items.
Reclaimers have weighing scales where they way items per kg and buyers pay
them before they leave the site.

70
Figure 3.6: Reclaimed plastic bottles
The private sector has over the last decade predominantly been involved with
waste minimisation and recycling issues in South Africa. The new focus of
government enhanced the importance of waste characterisation studies in terms
of identifying the recycling and composting potential of general waste streams
generated from various socio-economic residential areas and central business
districts of South Africa. Even though a number of pilot studies and small scale
separation at source projects have been undertaken, at municipal level very little
is currently in place. Legislation has not compelled the public or industry to
reduce waste generated or to separate out their recyclables at source. The
Waste Bill mandates municipalities to undertake separation at source for general
(household and commercial) waste, which they are responsible to manage
(Fiehn, 2007).
The modern practices of waste management such as open dumping, incineration
(burning), composting and landfill (burial), can be traced back to early civilisation.

71
However, the practices were conducted haphazardly and specific to particular
cultures and traditions. The quest for a cleaner environment has introduced the
modern systematic management approach of storage, collection and disposal of
waste. Countries all over the world have acts that provide for the removal by the
local authorities, on specified days, accumulated wastes from premises. The
waste is normally placed into removal receptacles, bags and bins, for easier
removal. This rapid revolution of waste management that started in the
developed countries has spread to the developing countries, particularly the more
affluent areas.
Department of Environmental Affairs and Tourism (DEAT), 2000 indicates that
the advances in technology have also contributed immensely to the common
practices today of waste management. Fifteen years back, waste management
was not regarded as a national priority issue in South Africa. The waste
management practice that took place before 1994 focused mainly on waste
disposal. The low emphasis that was accorded to waste management has
resulted in waste impacting negatively on South African environment and on
human health. In 1999, South Africa adopted the National Waste Management
Strategy (NWMS). This strategy outlines the goals to address waste
management in the country. The entire strategy is based on a 3R (Re-use,
Reduce, and Re-cycle) to improve the quality of the environmental resources
affected by uncontrolled and uncoordinated waste management.
Solid waste management in developing countries/emerging economies is
generally characterised by highly inefficient waste collection practices, variable
and inadequate levels of service due to limited resources. There is also a lack of
environmental control systems and appropriate legislation, limited know-how,
indiscriminate dumping, littering and scavenging and, most of all, poor
environmental and waste awareness of the general public (Matete and Trois,
2008).

72
References
DEAT: Department of Environmental Affairs and Tourism (2000): White Paper on
Integrated Pollution and Waste Management in South Africa. Pretoria, South
Africa.
Fiehn, H 2007. A CASE STUDY ON ALTERNATIVE APPROACHES TO WASTE
CHARACTERIZATION ANALYSIS AMID SALVAGING AND RECYCLING
ISSUES IN SOUTH AFRICA. In: Eleventh International Waste Management and
Landfill Symposium. Italy.
Matete, N & Trois, C 2008: Towards Zero waste in Emerging countries – A South
African experience. Waste Management.
Net-Focus Interactive 2012: South Africa Travel News: http://www.SA-
Venues.com@1999-2012
Ogola, H et al., 2006: Functional analysis of glutamine
synthetaseadenylyltransferase from E. coli. 20th IUBMB International Congress of
Biochemistry and Molecular Biology and 11th FAOBMB Congress Abstracts
Japan.
South African History Online 2010: http://www.sahistory org.za/archive. What-
industrialisation.
Wyse 2011: What is the Difference between Qualitative Research and
Quantitative Research? http://www.snapsurveys.com
73
CHAPTER 4: DATA ANALYSIS AND INTERPRETATION OF RESULTS
4.1 Introduction
In this chapter, an analysis of data collected from residents is presented. A
discussion of the findings will be based on the responses of the 100 residents who
completed the questionnaires for this study.
The goal of this research was to assess solid wastes management practices in
Polokwane City. Historically, solid waste generated from homes (households)
includes a number of items that are not generally thought of as `solid`. This type of
waste includes household, refuse, rubbish, liquids and gases that are confined in
solid containers and disposed of with conventional solid wastes. It is noted that solid
waste could be harmful to the environment, the health and well-being of the public
and other living and non-living organisms within and beyond the area as some
pollutants possess poisonous chemicals. This calls for knowledge of solid waste
management and compliance with the regulation.
It is well known that the environment still continues to be massively destroyed
through degrading human activity as the different metros and municipalities in this
country are highly littered. To this end, the solid waste management and procedures
have to be adequately enforced to comply with the remedy of the environment from
destruction. Failure to pay attention to solid waste management often leads to
various diseases and serious pollution as it is important that such waste be disposed
of effectively and efficiently to promote a healthy community. This benefit will be
directed to the community and the public sector on a mutual understanding of
protection of the environment and the people.
This study first made a comparison on how households, suburbs and the
municipality took responsibility in storing, collecting, transporting, treating and
disposing of solid waste. Secondly, it investigated problems encountered by the City

74
in managing solid wastes. Lastly, it made relevant recommendations aimed at
improving solid waste management practices within the Polokwane City.
Data were collected by means of a questionnaire which was specifically designed for
this study by the researcher, based on literature review and the investigative
questions to be answered. The questionnaire was divided into three sections.
The first part covers qualitative data and is divided into two sections.
The first section reports on the following the demographics variables: Gender, age,
educational level, employment information and income. The second section covers
the role of local government and the last section will focus on the specific waste
management variables.
Each of the variables were analysed independently and then paired up to assess
their impact on solid waste management within the community.
4.2 Demographics
Demographics is the study of the behaviors and other characteristics of groups of
human beings in terms of statistics (Rouse, 2005). These are socioeconomic groups
characterized by age, income, sex, education, occupation, etc.
4.2.1 Gender of respondents
As indicated in the bar chart below, of the 100 employed respondents 43 were males
and 57 were females (Figure 4.1). This is to be expected because of the historical
exclusion of women from formal employment especially in professional positions.
This composition is reflective of the report on labour survey (Stats S.A, 2013). With
the changing social changes, transformation within organisations, employment
opportunities and other career options which were previously reserved for men have
now opened for women.

75
Figure 4.1 presents gender distribution of the 100 employed respondents who
participated in the questionnaire of solid waste management practices in Polokwane
city.
Figure 4.1 Gender distribution
As indicated in the bar chart (Figure 4.1), 100 respondents 43 were males and 57
were females. This is to be expected because of the historical exclusion of women
from formal employment especially in professional positions. This composition is
reflective of the report on labour survey. With the changing social changes,
transformation within organisations, employment opportunities and other career
options which were previously reserved for men have now opened for women.
Historically, employees were predominantly males. As in other careers and
professions such as information technology, financial, institutions and science.
Some sectors started to accept and recruit women very late; the new regulation like
employment equity compels the public works to employ more women.

76
4.2.2 Age of respondents
Figure 4.2 presents data on the age of household respondents who participated in
the study.
Figure 4.2 Age of respondents
The age distribution of the respondents in figure 4.2 shows an interesting aspect, in
that the most common age group slots are that of 35 to 44 years, followed by the
group age of 45 to 64 years, which represents 56 % and 26 % respectively. This is
pointing towards the national trend. This is in relation with the Labour report that
indicated people within these age groups are the ones employed.

77
4.2.3 Educational level of respondents
Figure 4.3 provides a summary of the data on educational level of the respondents.
Figure 4.3: Educational Levels
A large number of respondents (81 %) had post high school education (certificate,
diploma and degree). Fifteen percent had high school education, 3 % had
Intermediate school education and 1 % had no formal schooling. The high number of
individuals who completed post high school education augurs well for the city’s
waste management endeavours and economy.

78
4.3 Employment information of respondents
Figure 4.4 presents data of the employment information of the 100 respondents who
participated in solid waste management practices questionnaire in Polokwane city.
Figure 4.4: Employment information
The majority of the respondents in Polokwane, 56% were found to be professional
employees, 31 % indicated that they are self-employed and 13 % are unemployed.
These statistics correspond with the level of education of the respondents. For
example, the high number of respondents that have acquired post high school
education (81 %) could have influenced the employability of the participants to a total
of 87 %. From the results of the analysis, it may be assumed that there is a very
good support from the government which promotes policies that promoted job
creation and made the market favourable.

79
4.2.5 Income of respondents
A high percentage of the respondents, 75 %, indicated that they earn above
R10,000 followed by 19 % who earn between R5,000 to R10,000 and 6 % of the
respondents earn between R2,000 to R5,000 (see Figure 4.5).
Figure 4.5: Income Distribution
The positive response by a high number of respondents indicates the benefit of the
educational and the desire to obtain a degree / diploma as a reward of further
studying after completing high school education. Better post school qualification
improves employment opportunities, as it was discussed earlier.

80
4.3 Assistance from the government
Figure (4.6) shows percentages of people from the 100 respondents who receive
assistance from the government. This sort to find out any assistance that the
respondents receive from the national government; example; social grants. And also
assistance that the government as an employer can provide to the people, example,
medical aid subsidy and housing allowance.
Figure 4.6: Assistance from the government
A large number of respondents, 70 %, disagreed that there is adequate support from
the government. One can infer that this problem might depend on the relevant skills
or educational qualifications or work experience of the candidate.

81
4.3.1 Kind of assistance received
Figure 4.3 below indicates types of assistances that participants from the 100
respondents received. These participants took part in the questionnaire for solid
waste management practices in Polokwane city.
Figure 4.7: Kinds of assistance
About 66 % of respondents reported that they do not receive any form of assistance,
but these results could also mean that the question was not understood (Figure 4.7).
About 29 % of the respondents indicated that they received subsidised allowance
towards their medical aid costs; 3 % indicated that they receive subsidized water, 2
% indicated that they are subsidised in form of finance for small business. This
disparity could be directly ascribed to the skills levels, position occupied and the
productivity of employees.

82
4.4 Waste management practices
4.4.1 Burning of solid waste material near houses or businesses
Figure 4.8 indicates the percentage of respondents who burn waste near their
houses or businesses. About 99% of the respondents indicated that they do not burn
waste near their houses. The remaining 1% agreed to have been burning waste near
their houses. This could mean that a larger percentage in Polokwane city are not
putting the environment at risk with regard to waste burning. However, it could not be
concluded that people are aware of the damage waste burning can cause to the
environment.
Figure 4.8 Distribution of waste burnt in the yard

83
4.4.2 Burying solid waste near the house or business
Table 4.1 indicates the frequency and percentage of people who bury wastes near
houses.
Table 4.1: Burying of solid waste near your houses
Frequency Percent
Yes 1 1.0
No 99 99.0
Total 100 100.0
The large number of respondents (99 %) do not bury solid waste near their house
and It is collected from their homes by the municipal waste management company.
This practice will limit possible diseases that could emanate from the decomposed
solid waste buried near the house.
4.4.3 Hauling of solid waste to the community dump or landfill
Table 4.2 below indicates the frequency and percentage of people from the 100
respondents who haul waste in the community dump or landfill it themselves.
Table 4.2: Haul waste to the community dump
Frequency Percent
Yes 1 1.0
No 99 99.0
Total 100 100.0

84
Of the 100 respondents 99 % indicated that they do not frequently haul waste to the
community dump. This could be because the respondents have prescribed days
where the municipality collects waste to the landfill and do not see a point for hauling
it. The remaining 1 % responded positively to hauling waste in the community dump.
This could mean that the prescribed single day in a week for the municipality to
collect waste is not enough. The waste storage bins may be full and people do not
have alternative storage containers and may cause bad odour in the households.
4.4.4 Dumping solid waste in a secluded spot
Figure 4.9 indicates that 99 % of the respondents do not dump their solid waste
randomly in secluded spots. This response indicates a high level of awareness
about good waste management practice. Only 1 % of the respondents randomly
dump waste in the scheduled spot. This could be waste that the municipality does
not collect for landfilling; that is grass, leaves, etc.
4.9: Dumping in a secluded spot

85
4.4.5 Collection and taking solid waste to the landfill
Figure 4.10 shows the percentage of respondents whom their waste is collected and
take to the landfill.
Figure 4.10: Waste collected and taken to the landfill
Regarding this section, a large number of respondents (98%) agreed that there is
regular collection of waste in the area. This points out that waste management works
as a cohesive unit in the implementation of their plan and achieve their project
objectives successfully. Failure to take attention to solid waste management will lead
to various diseases and serious pollution as it is therefore important that solid waste
be rendered effectively and efficiently to promote a healthy community. This benefit
will be directed to the community and the public sector on a mutual understanding of
protection of the environment and the people.

86
4.4.6 Recyclable waste
Figure 4.11 below indicates the percentage of recycling waste from the 100
respondents in a questionnaire conducted in Polokwane City.
Figure 4.11: Recycling waste
As indicated in the above bar chart, 95 % of the respondents strongly disagreed that
they recycle waste. It is the responsibility of the management to recycle waste
products.

87
4.4.7 Type of storage container for garbage before disposal
4.4.7.1 Metal or plastic garbage cans at home
Figure 4.12 indicates the percentages of metal or plastic garbage cans at their
homes or businesses.
Figure 4.12: Metal or plastic garbage cans at your home or business
As indicated in the proceeding bar chart, 50 % disagreed and 49 % agreed to the
statement. This is positive because collection and disposal of waste are viewed
generally as tools for keeping the environment clean and safe from objects that could
cause damage to the environment.

88
4.4.7.2 Cardboard boxes at your home or business
The following Table (4.3) indicates the frequency and percentage of people who
store waste in cardboard boxes at their homes or businesses.
Table 4.3: Cardboard boxes
Frequency Percent
Yes 1 1.0
No 98 98.0
None respondents 1 1.0
Total 100 100.0
Of the 100 respondents, 98 % indicated that they do not use cardboard boxes as
containers to store garbage prior to disposing of it. This indicates that the majority of
the respondents utilise other types of container.

89
4.4.7.3 55- gallon/ 200 litre drums
Figure 4.13 shows the percentage of people who store waste on 200 litre drums from
the 100 respondents who participated in a questionnaire of solid waste management
practices.
Figure 4.13: 200 litre drums
The analysis shows that 55 % of the respondents strongly disagreed and 14 %
agreed to dispose the 200 litre drums.

90
4. 4.7.4 Plastics bags
The following Figure (4.14) shows the percentage of people who store waste on
plastic bags from the 100 respondents; who participated in the solid waste
management practices questionnaire.
Figure 4.14: Plastic bags
The large number of respondents agreed that they store garbage in the plastic bags.
This view is aligned with the government strategy which seeks to ensure that
communities protect their environment. This indicates that, for the Polokwane
municipality, to educate the community on how to keep solid waste management is
not a problem.

91
4.4.8 20 L bags of trash disposed of each week
The Figure (4.15) below indicates the number of bags disposed of weekly by
respondents who participated in a solid waste management practices questionnaire
in Polokwane city.
Figure 4.15: Bags of trash disposed per week
From the results of this study, 55 % indicated that they use 3 to 4 bags (20 L) per
week. 22 % indicted that they use 1 to 2 disposable bags. Similarly, 22 % indicated
that they use 5 to 7 bags per week and only 1 % was using more than 7 bags. This
was not surprising sincethe community knows about the solid management. All this
adds to the success rate of solid waste management practises in Polokwane city.
This confirms that solid waste management is rendered effectively and efficiently to
promote a healthy community in this municipality.

92
4.4.9 What do you do with the following types of waste? Old batteries
The following Figure (4.16) shows what the participants do with old batteries.
Figure 4.16: Old batteries
A large number of the respondents, that is 93 % believed that they have to take solid
waste to the landfill as they know the impact of solid waste health, economics,
engineering and environmental considerations. Failure to take action may lead to
various diseases and pollution that might also cause degradation of the environment.

93
4.10 What do you do with the following types of waste? Old appliances, snow machine, four wheelers, boat motors, trucks
The following Figure (4.17) shows what the people do with old appliances in
percentage.
Figure 4.17: Old appliances
Of the 100 respondents, 55 % believed that old appliances and other staff have to be
taken to a battery collection centre and 45 % believed that it is important to take
them to the landfill. What is positive about this response is that the community is
aware that solid waste needs to be moved out of their homes. This approach
inevitably leads the success of the Polokwane municipality to solid waste
programme.

94
4.4.11 What do you do with the following types of waste?
4.4.11.1 Household hazardous waste
Figure 4.18 shows how households handle hazardous waste in Polokwane city. this
was part of the questionnaire for solid waste management practices.
Figure 4.18: Household hazardous waste
The majority of the respondents 73 % agreed that household hazardous waste have
to be dumped in the landfill. 24 % indicated that they have to be poured in the drain,
whilst 3 % indicated that they should be dumped in the yard. This result suggests
that little challenges exist as far as household hazardous waste with the community
is concerned. The lack information thereof of the community to handle hazardous
waste, calls the waste management to continue educate the community as this will
create serious problems in the City. New sets of knowledge, skills and behaviour are
necessary to be undertaken within the Polokwane city in hazardous waste
management. Organisations are required to become learning entities that

95
continuously enhance the knowledge, skills and experience of their human
resources, including Polokwane Municipality.
4.4.11.2 Used oil
Figure 4.19 indicates the percentage of people and how they dispose of used oil.
Figure 4.19: Used oil
The majority of respondents 72 % believe that used oil can be dump in the landfill
while 28 % think to dump in the yard. Lack of knowledge about solid waste could be
harmful to the environment, the health and well-being of the public and other living
and non-living organisms within and beyond the area. This is due to some pollutants
that possess poisonous chemicals existing in the community of Polokwane. This
confirms that this community have the knowledge of solid waste management and
comply with the regulation. This could further explain the increase in the likelihood of
the Municipality success within the city.

96
4.18 Current state of recycled waste materials
The following figure (4.20) indicates the current state of recycling of waste materials
in Polokwane city.
Figure 4.20: Current state of recycled waste materials.
The above results shown in Figure 4.20 indicates that, 88.66 % do not recycle waste
materials as they are not sufficiently informed and trained on recycling solid waste. A
new waste management education philosophy, coupled with new sets of knowledge,
skills and behaviour are necessary to be proposed so that the Municipality could take
an initiative to include on the plan. This benefit will be directed to the community and
the public sector on a mutual understanding of recycles waste materials.

97
The following table provides data on the educational level in relation to the income
of the respondents who participated in a solid waste management questionnaire in
Polokwane city.
Table 4.4: Educational level of respondent * Income Crosstabulation
Income Total
R1000
-
R2000
R2000
-
R5000
R5000
-
R10000
above
R10000
Educational
level of
respondent
No formal
schooling
1 0 0 1 2
Secondary
completed
1 0 0 2 3
Post-secondary 0 1 4 10 15
Certificate 0 1 14 22 37
Diploma/Degree 0 3 1 40 44
Total 1 5 19 75 100
Table 4.4 indicates the relationship between the educational level and income in the
study area. The Table indicates that 44 % of the residents who hold
diplomas/degrees (classed as the highest qualification in this study) earn more than
R10 000. No residents in this class were found to be in the lowest income range; that

98
is; R1 000- R2000. 50 % of people with no formal schooling and those 40 % of
people with secondary schooling were found in the lowest income range.
Table 4.5: Educational level of respondent * Do you get any kind of assistance from the government? Cross tabulation
The Table shows the educational level of respondents in relation to the kind of
assistance they receive from the government.
Do you get any kind of
assistance from the
government?
Total
Yes No
Educational level
of respondent
No formal
schooling
0 1 1
Secondary
completed
0 3 3
Post-
secondary
1 14 15
Certificate 8 29 37
Diploma/Degre
e
21 23 44
Total 30 70 100
Table 4.5 indicates the kind of assistance that residents in the study area receive
from the government. Those who are in the highest qualification class 21 % received

99
assistance from the government. People with no formal schooling and with
secondary schooling showed that they do not receive any assistance. Therefore, the
higher the qualifications one possesses, the higher the chance s of getting
government assistance. This may be due to the fact that people in this class know
their rights and access information on services that they can be assisted with.
Table 4.6: Age of respondent * Employment information Crosstabulation
The following table shows the age of respondent in relation to the employment
information.
Employment information Total
Employe
d
Unemploy
ed
Self
employed
Pensioner Student
Age of
respond
ent
18 to
34
11 0 5 0 2 18
35 to
44
35 6 14 1 0 56
45 to
64
10 4 12 0 0 26
Total 56 10 31 1 2 100
The table indicates the age of respondent in relation with the employment
information. Only 10 % of the respondents are unemployed while the remaining 90 %
is comprised of 56 % of which is employed,31 % self-employed, 1 % pensioners and
2 % students. According to the results, the rate of employment is shown as high in
Polokwane.

100
The following table indicates gender in relation to employment information of the
respondent in a solid waste management practices questionnaire.
Table 4.7:Gender * Employment information Crosstabulation
Employment information Total
Empl
oyed
Unempl
oyed
Self
employe
d
Pensi
oner
Stud
ent
Gender 1 20 2 21 0 0 43
2 36 8 10 1 2 57
Total 56 10 31 1 2 100
Table 4.7 indicates that 57 % the employed respondets were female, while the
remaining 43 % were male. It can be concluded that gender equality in the
employment category is balanced in Polokwane city.
Factor analysis
As statistical technique, factor analysis discovers simple patterns of the relationship
among the variables. In particular it seeks to discover if the observed variables can
be explained largely or in terms of much smaller number of variables called factors
(Nacson, 2007).
The researcher wanted to understand about solid waste management practices in
Polokwane.
• To separate factors for the variables involved, factor analysis would be used to
identify the underlying evaluative dimensions. Specific items that correlated
highly are assumed to be a “member” of that broader dimension. The following

101
correlation matrix was found: A typical factor analysis suggests to answer to the
two major questions:
• How many different factors are needed to explain the pattern of the relationships
among these variables?
• What is the nature of those factors?
Table 4.8:Rotated Component Matrix
Component
1 2 3 4 5 6 7 8
Educational level
of respondent
.086 -.196 .805 .192 .086 .110 .076 -.019
Employment
information
.111 .507 -.569 -.119 -.142 -.119 .119 -.038
Do you get any
kind of assistance
from the
government?
-.118 .871 -.242 .088 .085 .072 .039 .014
Which assistance
do you receive?
.027 .889 .176 -.186 -.096 .085 -.002 .023
Burn it in yard -.110 .104 .014 -.639 .122 .067 -.124 -.002
Bury it near house .912 .055 .043 .054 .061 .018 .012 -.052

102
Haul it to the
community dump
.005 .225 .833 -.094 -.100 -.060 -.033 -.002
Dump it in a
secluded spot
away from the
community?
-.024 -.006 -.023 .087 .004 -.904 -.087 -.042
Collected and
taken to the
landfill?
.013 .076 .061 .095 -.005 .913 -.142 -.066
Recycle cans or
other waste?
.018 -.060 .024 -.159 .001 -.170 .824 -.006
Large dumpster
near home
.069 .012 .008 -.019 .923 -.034 -.003 .062
Metal or plastic
garbage cans at
home
-.249 -.246 .035 .187 .450 .168 .307 -.515
Cardboard boxes .690 .047 .036 .025 .693 -.011 .007 .006
55-gallon drums .305 .174 .025 -.684 -.332 -.060 -.087 .172
20 L Plastic bags
-.011
.069
.151
.840
-.004
.060
-.213
.091
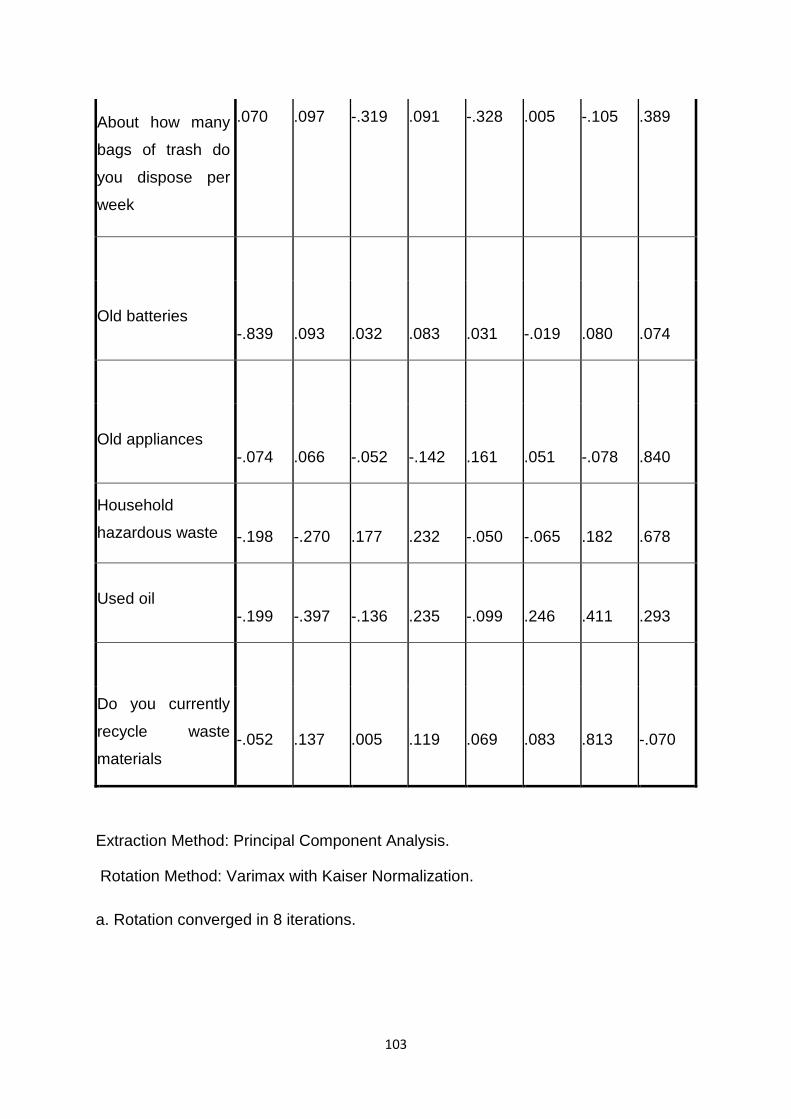
103
About how many
bags of trash do
you dispose per
week
.070 .097 -.319 .091 -.328 .005 -.105 .389
Old batteries
-.839
.093
.032
.083
.031
-.019
.080
.074
Old appliances
-.074
.066
-.052
-.142
.161
.051
-.078
.840
Household
hazardous waste
-.198
-.270
.177
.232
-.050
-.065
.182
.678
Used oil
-.199
-.397
-.136
.235
-.099
.246
.411
.293
Do you currently
recycle waste
materials
-.052
.137
.005
.119
.069
.083
.813
-.070
Extraction Method: Principal Component Analysis.
Rotation Method: Varimax with Kaiser Normalization.
a. Rotation converged in 8 iterations.

104
From the findings eight factors retained to define broad areas for influential actions.
The Factor 1 reveals that one variable is generally high: Bury it somewhere near
your house or somewhere (0.912). This variable stand alone as it could be seen not
having any negative impact with solid waste.
Factor 2 indicates three variables high variables: Do you get any kind of assistance
from the government (0.871), which assistance do you receive? (0.889), and the
question regarding the employment information (0.507). The results of the factors
indicate that there is support from the government level when respondents obtained
a diploma/degree.
The factor 3 includes two variables: Educational level (0.805), haul it to the
community dump or landfill it yourself? (0.833). This indicates that with a high
educational level the knowledge of solid waste is not a problem.
The factor 4 has three high variables: Burn it somewhere near your house or
business (-0.639), 55-gallon drums / barrel (-0.684) and plastic bags (0.840). The
practice of burning solid waste is inversely to the used of the plastic bags. This is
positive practices that the community is exposed to solid waste to be out of the yard.
The factor 5 includes two variables: Large dumpster near your home or business
(0.923) and Cardboard boxes (0.693). This reinforces the argument that the
community does not encounter problems in managing solid waste.
The factor 6 reveals two variables: Dump it in a secluded spot away from the
community (- 0.904) and collected and taken to the landfill? (0.913). These two
practices are opposite but they are aligned with the knowledge of the community to
solid waste.

105
Factor 7 has one variable that is high: Recycle cans or other waste (0.824)
Factor 8 includes one variable: Metal or plastic garbage cans at your home or
business (- 0.515).
The qualitative data obtained from the respondents is presented below:
1. Described ways that they dispose garbage.
2. Indicated the method used most often
3. Specified what was recycled
Two questions of the questionnaire were open ended. For thorough analysis,
underlying themes were identified from the various responses. The results are
reported below:
In section 2 “waste management practices” two questions under 2.1 of the questionnaire: Do you currently dispose of garbage by using one or more of these
methods?
Major themes identified were as follows:
Describe any other ways that you dispose of your garbage and which method do you
use most often?
Ninety nine per cent (99 %) of the respondents reported that they store solid waste in
refuse bags and bins. Waste is then collected weekly by service providers contracted
by the Municipality and transported to the landfill. One percent (1 %) suggested that
burying solid waste near their houses, hauling waste in a dump and burning waste
satisfied them. The favour of the responses was that respondents share
responsibility in storing, collecting, transporting, treating well and disposing solid
waste. Respondents had good knowledge of solid waste and the regulations
governing this type of waste.

106
References
At Work 2007: Institute for Work and Health, Issue 50: What researchers mean by
validity and reliability. Toronto.
Nacson, J 2007: Prepared for KEYS. Data Analysis and
Interpretation. http://www.google.co.za/?gws_rd=cr&ei=4.
Statistical release P0211, 2013: Quarterly Labour Force
Survey. www.stassa.gov.za/publications/P02111stQuarter2013.pdf.
Rouse, M 2005: definition demographics
http:www.whatis.techtarget.com/definition/demographics

107
CHAPTER 5: CONCLUSION AND RECOMMENDATIONS
The study was about finding out how solid waste is managed in Polokwane city.
This was achieved through conducting field surveys, interviews, observations and
taking field notes to collect data from households. Of the five (5) study areas; four
are in the suburbs of Westernburg, Ivy Park, Fauna Park and Welgelegen. The fifth
study area is located within the residences in City Centre. This chapter summarises
and assesses the findings of the research. It concludes with gaps and weaknesses;
and policy recommendations. Recommendations are also made at the end of this
Chapter.
Waste management is not a new phenomenon. As human society become more
complex, as our numbers increased, so is the range and scale of environmental
issues experienced such as waste have multiplied. Polokwane city has experienced
an increase in waste generation as people move to the city in search of work.
5.1 Research Findings
The study results showed that 43 % of people who participated in the questionnaire
were males while 57 % were females. The most prevalent age group of the
interviewed individuals was between 50-60 years old. This may be due to the fact
that houses in town are expensive and people within this age range have saved and
invested and are likely to afford houses. Others afford because they have
established businesses that increase their monthly incomes. The results showed that
most people have studied beyond matric. Their higher educational level should have
contributed to their better lifestyle because the results indicated a high employment
rate followed by people who are self-employed. Acquiring post matric education by
those who are self-employed may have helped them to secure loans from banks to
start their businesses.

108
Most people have indicated to be at a scale of the highest income group (>R10 000 /
month) in the study. This may mean that this group of people are professional
employees and run successful businesses. About 70 % of the residents from the
study area indicated that they receive no assistance from the government. This could
be an indicator of people doing well economically and it is not necessary for the
government to assist them with anything. However, from the percentage that has
indicated to receive assistance from the government, 85 % of them are subsidised
on medical aid.
On waste management practices; only 1 % burn, haul, bury and dump waste in a
scheduled spot. About 1 % of the participants positively responded on waste
recycling. This is an opportunity for the city to raise awareness and highlight the
benefits on recycling cans and bottles and the income it can generate. However,
people could be aware of recycling and its advantages but see it as a job for the
poor. Most people indicated that they store waste in refuse bags and storage bins.
These are good storage practices. Every participant was able to give the exact
number of refuse bags they dispose every week. This indicated that almost everyone
is keeping a good track of their garbage and is aware that it has to be taken to a
landfill site.
About 55 % of the participants indicated that they take old appliances for recycling.
There is a need for the remaining 45 % to be made aware of recycling goods. Most
people do not separate waste, they place oil and hazardous waste with any other
waste. This requires awareness because hazardous waste can cause fires in the
landfill sites. The study has confirmed that the City of Polokwane is managing their
waste satisfactorily, however, there is room for improvement with regard to
promoting recycling activities.
The research revealed financial benefits that were found in waste reclaiming from
the landfill site. There is little or no doubt that the cash earned from waste reclaiming
is a welcome relief to the households involved, and provided traders with another
source of income. Indeed, commercialization of waste has had the effect of

109
expanding the limited choices that people have to earn income. This product is most
important in overcoming shortfalls in income. Also, in providing cash at crucial times
in the household schedule for instance; for school fees, grocery and payments of
furniture bills. This assists households to cope with unusual expenses, in diversifying
livelihood options, and in offering a safety net or survival strategy for the poorest
members of society. Waste reclaiming plays a significant role in poverty reduction
and is demonstrated by the growing numbers of people joining the trade, particularly
by the unemployed.
5.1.1 Solid Waste Management Options for Polokwane City
The main waste management practice currently favoured by the suburbs of Ivy Park,
Fauna Park, Welgelegen and Westernburg is privatization. However, the municipality
is responsible for managing waste in the City centre.
5.2 Gaps and weaknesses of waste management in Polokwane city include:
• Appropriate final treatment and disposal glass facility does not exist in
Polokwane city.
• Lack of full recognition by authorities of the important role of local reclaimers
in the landfill.
• Long-term and focused awareness campaign in solid waste management has
not been implemented in Polokwane city.
• Technology transfer programme to support co-manufacturing of solid waste
technologies has not yet been introduced.

110
5.3 Policy recommendations
Reform of the roles and responsibilities of Polokwane municipality and the Provincial
Department of Environmental Affairs would serve as a factor that could improve the
management of solid waste in Polokwane city.
• Polokwane municipality and the Provincial Department of Environmental
Affairs should try to provide awareness and also highlight the importance of
solid waste management. The fact that it provides job creation and alleviates
poverty through reclaiming that leads to recycling, reuse and recovery should
be emphasised.
• In order to be successful and sustainable, any future investments in
equipment and in technology must be preceded by background studies and
surveys of the solid waste management situation. This will ensure that the use
of means is best suited to the capabilities of the city and their people.
• Education and communication channels between sectors, especially
government and civil society, should be made efficient and broadened. A right
to know, transparency and openness to information will have a major
contributory factor to good waste management practices in Polokwane City.
Good environmental practices and application of the Integrated Solid Waste
Management (ISWM) approach as per Polokwane declaration on waste
management must be emphasised to the community. The declaration says that
government, business and civil society need to join in common efforts toward the
accomplishment of the goal of the declaration. The goal aimed for reduction of waste
generation and disposal by 50 % and 25 % respectively by 2012; and develop a plan
for zero waste by 2022 by engaging in the following actions (DEAT, 2001).
(1) Prioritization of Waste Management by the City.
(2) Implementation of the National Waste Management Strategy in the City.
(3) Development and implementation of a Legislative and Regulatory Framework to
promote waste avoidance, prevention, reduction, re-use and recycle.

111
(4) Provision of efficient and effective collection and disposal facilities within
Polokwane Municpality as a whole.
(5) Establishment and enforcement of targets for waste reduction and recycling.
(6) Setting benchmarks towards achieving the 2012 target.
(7) Disseminate information on the status and trends on waste reduction in the
country.
(8) Introduce mandatory waste audit processes.
(9) Explore the use of economic instruments to support waste management
initiatives.
(10) Develop and provide the public with educative resources necessary to allow
participation in the waste elimination process on an informed basis.
(11) Develop Intergovernmental Capacity.
(12) Develop Waste Information and Monitoring Systems.
(13) Establish systems that ensure that physical and financial responsibility for waste
is borne by the product producers.
(14) Effectively manage waste disposal/reprocessing facilities, thereby avoiding the
need to establish new, or expand existing facilities.
(15) Promote employment and economic empowerment opportunities, in particular in
Small, Medium and Micro Enterprises, through increased product reuse and material
recycling.
(16) Promote clean technology and clean production.
Polokwane Municipality is responsible for waste management in Polokwane City,
however, a contractor has been allocated part of the City to manage waste. The
Municipality is providing storage bins for the residents. The Municipality has taken
responsibility for street sweeping in town and grass cutting in town. The municipality
is monitoring and evaluating the contractor on a regular basis.

112
The declaration for reducing waste generation and disposal by 50 % and 25 %
respectively by 2012 has not yet been met. The Municipality indicates that waste
generation has not been reduced by the targeted 50% instead it has rapidly
increase. The landfill site also confirmed an increase in the waste disposed daily as it
is weighed before disposal. A plan for zero waste by 2022 is not yet in place and by
the observation made during the study it is unlikely that the city will be able to reach
the target by 2022
5.4 Recommendations
The following section presents the recommendations that were proposed for this
study under the following sub-headings adopted from the IWMP (2005):
5.4.1 Waste Generation
• The use of plastic bags especially by shops and supermarkets should be
discouraged; for example: A loaf of bread being provided in two plastic bags
at the same time.
• Recyclable paper bags as value added plastic bags should be introduced.
• Introduction of natural products such as sorghum plastic could reduce waste
generation.
5.4.2 Recycling and Re-use
• Value-adding should be encouraged for waste products with a view to encourage
recycling and re-use of products.
• Lower taxation for recycled products to encourage the value of these
products should be made.
• Manufacturers should be given incentives to encourage consumers to recycle

113
their products and reduce their waste production.
5.4.3 Punitive Measures- Polluter Pays Principle
• Monitoring mechanisms should be placed on dumping sites to avoid illegal
dumping.
5.4.4 Community Awareness and Education
• The community needs to be educated on the impacts of dumping waste on the
natural environment, and the degradation that this can cause to the land.
5.4.5 Waste Separation
• Separation of waste at source should be started by households.
• Different colour bags could be provided for waste separation at household level.
• People should be made aware that broken bottles in plastic bags are
dangerous to waste collectors and should be encouraged to separate from
other waste.
5.4.6 Community Involvement
• Community based contracts should be issued for the management of waste
separation facilities.
• Community based waste collection projects should be initiated by the
City.
5.4.7 Effective Storage and Collection

114
• All households in Polokwane City should be provided with bins to ensure
effective waste storage.
• An incentive scheme facilitated by the City should be developed to reward
households or companies making use of effective waste storage and reward
recycling initiatives.
5.4.8 Illegal Dumping of Waste
• Trees should be planted on open spaces within the City and these areas can be
converted to parks, whereby it would not be easy for people to dump waste.
• There should be rewards of monetary value for individuals who report the illegally
dumping of waste.
• The reasons why people dump waste illegally need to be understood and
addressed to ensure that this practice does not continue endlessly.

115
APPENDICES
Appendix i Permission letter to conduct research by Polokwane Municipality
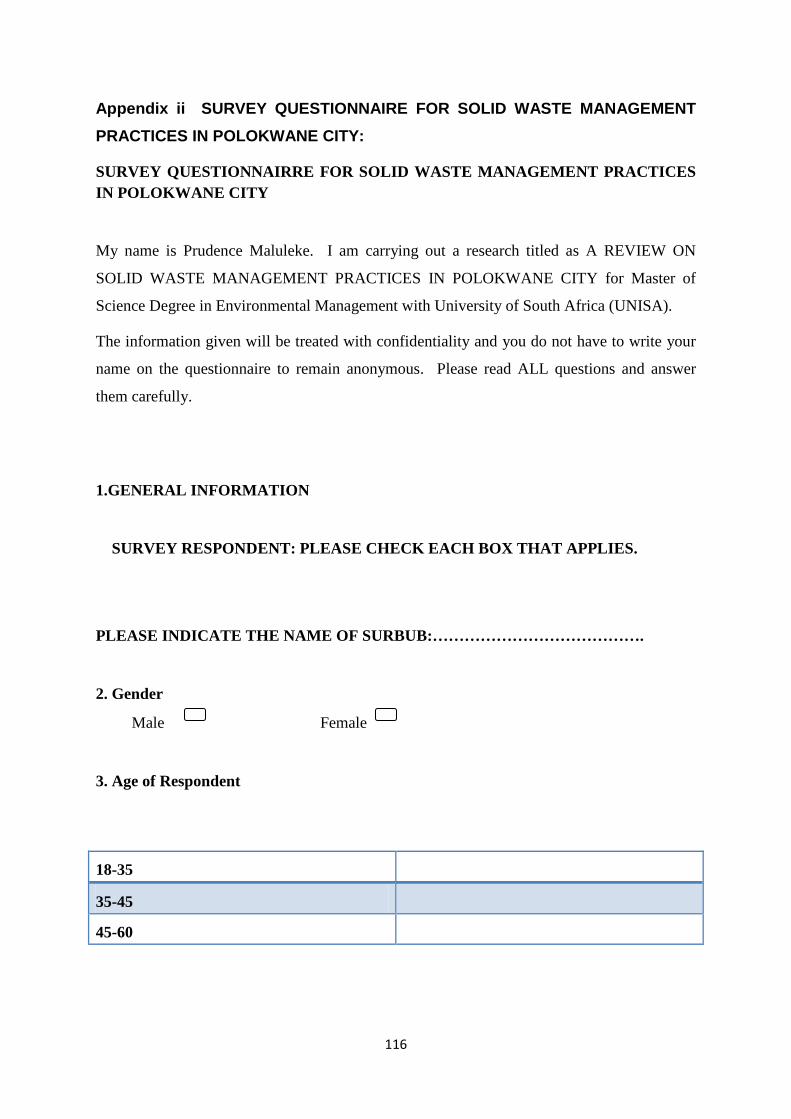
116
Appendix ii SURVEY QUESTIONNAIRE FOR SOLID WASTE MANAGEMENT PRACTICES IN POLOKWANE CITY:
SURVEY QUESTIONNAIRRE FOR SOLID WASTE MANAGEMENT PRACTICES IN POLOKWANE CITY
My name is Prudence Maluleke. I am carrying out a research titled as A REVIEW ON
SOLID WASTE MANAGEMENT PRACTICES IN POLOKWANE CITY for Master of
Science Degree in Environmental Management with University of South Africa (UNISA).
The information given will be treated with confidentiality and you do not have to write your
name on the questionnaire to remain anonymous. Please read ALL questions and answer
them carefully.
1.GENERAL INFORMATION
SURVEY RESPONDENT: PLEASE CHECK EACH BOX THAT APPLIES.
PLEASE INDICATE THE NAME OF SURBUB:………………………………….
2. Gender
Male Female
3. Age of Respondent
18-35
35-45
45-60

117
4. Educational level of respondent
No formal schooling
Primary completed
Secondary completed
Post- Secondary
Certificate
Diploma/Degree
5. Employment information
Employed
Unemployed
Self employed
Pensioner
Student
6. Income
R 1000- R2000
R2000-R5000
R5000-R1000
> R10000
7. Do you get any kind of assistance from government
Yes No
If yes which assistance do you receive?

118
Subsidised electricity
Subsidised water
Free water
Free housing
Free refuse removal
Subsidised medical aid
Training
Finance to establish small businesses
Other (please specify)
2. WASTE MANAGEMENT PRACTICES
2.1 Do you currently dispose of garbage by using one or more of these methods?
Burn it somewhere near your house or business (i.e., in the yard)? Yes No
Bury it somewhere it near your house or business? Yes No
Haul it to the community dump or landfill yourself? Yes No
Dump it in a secluded spot away from the community? Yes No
Collected and taken to the landfill Yes No
Recycle cans or other waste Yes No
Describe any other ways you dispose of your garbage ____________________
_______________________________________________________________
_______________________________________________________________
Which method(s) do you use most often? ______________________________

119
2.2. What type of container do you store your garbage in before disposing of it?
(check all boxes that apply)
Large dumpster near your home or business Yes No
Metal or plastic garbage cans at your home or business Yes No
Cardboard boxes Yes No
55-gallon drums/ barrels Yes No
Plastic bags Yes No
Other types of containers _____________________________________________
2.3. About how many bags of trash do you dispose of each week?
1-2 bags per week
3-4 bags per week
3-7 bags per week
More than 7 bags per week. How many more? _________________
2.4. What do you do with the following types of waste?
a. Old batteries
Take them to the landfill/dump
Throw them out in your yard or a secluded area
Take them to a battery collection area or tote
Other _________________________________________________

120
b. Old appliances, snow machines, four-wheelers, boat motors, trucks, etc.
Take them to the landfill/dump
Throw them out in your yard
Take them to a collection area
Other _________________________________________________
c. Household hazardous waste (e.g. old paint, cleaning products, etc.)
Dump them in the landfill/dump
Dump them in your yard
Pour them in the sewage lagoon or down the drain
Take them to a special collection area in the community
Other _________________________________________________
d. Used Oil
Dump it in the landfill/dump
Dump it in your yard
Take it to a collection place or waste oil burner
Other __________________________________________________
2.5 Do you currently recycle waste materials (i.e., glass, soda cans, paper,
plastic)?
Yes, What do you recycle? ______________________________
No

121
SURVEY QUESTIONNAIRE FOR SOLID WASTE MANAGEMENT PRACTICES IN POLOKWANE CITY
My name is Prudence Maluleke. I am carrying out a research titled as A REVIEW ON
SOLID WASTE MANAGEMENT PRACTICES IN POLOKWANE CITY for Master of
Science Degree in Environmental Management with University of South Africa (UNISA).
1.General Information
1.1.Name and address of authority responsible for solid waste management
…………………………………………………………………………………………
……………………………………………………………………………………………
……………………………………………………………………………………………
1.2 Area jurisdiction
Total area…………….. (sq.km)
1.3 Population
2002 2007 2012
1.4 Department responsible for solid waste management
(1) Name, address and telephone of the Department
…………………………………………………………………………………………………
…………………………………………………………………………………………………
…………………………………………………………………………………………………
(2) Name and telephone of the Head of Department
…………………………………………………………Telephone:………………………
(3) Name and telephone of officer responsible for solid waste management

122
.…………………………………………………………Telephone………………………..
.
2. Function carried out by the Department
Function Carried Out By Remarks
Own staff Contractor Others, please
specify
Solid waste
managemement
service to
domestic
premises
Solid waste
management
service to
commercial/
trade premises
Solid waste
management
service to
industrial
premises
Street sweeping
Grass cutting
Drain/river
cleansing
Public toilet
cleansing
Removal of dead
animals
Removal of

123
garden waste
Removal of
bulky waste e.g.
TV
Development/
building pal
approval
Training of solid
waste
management
staff
Special solid
waste
management
campaign/project
Others

124
3. Planning and Development
3.1 Physical characteristics of solid waste
3.1.1 If data on waste characteristics are available, please complete the following table:
Component % By Weight
Paper
Plastic and rubber
Organic or vegetables
Glass and ceramic
Ferrous metal
Aluminium
Wood
Textile
Garden waste
Others
Total
3.2 Year when the data was collected:
3.3 Data collected by actual survey or by estimation:
4. Storage
(1) Does the Department have a storage bin standardisation policy? If so, please briefly
outline the policy.
………………………………………………………………………………………
………………………………………………………………………………………
………………………………………………………………………………………
………………………………………………………………………………………

125
………………………………………………………………………………………
(2) Type of storage bin used (please tick appropriate space)
Type of containers Residential Premise Commercial Premise
A F S N A F S N
Individual
Containers
Metal bin
Plastic bin
Plastic bag
Oil drum
others
Communal
Containers
Metal bin
Plastic bin
Oil drum
Concrete bin
Roll-on roll-off
others
A=Almost exclusively used
F= Frequently used
S= Sometimes use
N= Never used
5. Collection
(1) Collection service coverage for domestic premises for the year 2011
% of Total Population Frequency of Collection

126
(2) Amount of waste collected (by both the Department and contractors) for the year
2011:
Waste Type Estimated
Recycling
Rate (%)
Amount Collected
Measured Estimated Measured Estimated
Domestic, institutional,
commercial and trade
waste
Industrial waste
Street/park cleansing
waste
Drain cleansing waste
Bulky waste
Others
Total
Note: Attempt should be made to provide the breakdown data. If impossible, at least
data for the total should be provided.
6. Disposal
Items Disposal Site
Site 1 Site 2 Site 3
Name of site
Total area (ha)
Year when disposal started
Estimated lifespan remaining

127
(year)
Amount of waste deposited
daily (tonne/day)
Distance from collection area
to the site (km)
Disposal method
Existence of animals on site Yes/No Yes/No Yes/No
Existence of scavengers on site Yes/No Yes/No Yes/No
Existence of open burning on
site
Yes/No Yes/No Yes/No
7. Problems encountered in solid waste management service. Please tick appropriate
spaces
Problem Very
serious
Serious Not so
serious
No
problem
Inadequate service coverage (some people not
given service)
Lack service quality (not frequent enough,
spill, etc)
Lack of authority to make financial and
administrative decision
Lack of financial resources
Lack of trained personnel
Lack of vehicles
Lack of equipment
Old vehicle/equipment frequent breakdown
Difficult to obtain spare parts

128
Lack of capability to maintain/repair
vehicle/equipment
No standardisation of vehicle/equipment
No proper institutional set-up for solid waste
management service
Lack of legislation
Lack of enforcement measure and capability
Lack of planning (short, medium and long
term plan)
Rapid urbanisation outstripping service
capacity
Uncontrolled proliferation of squatter
settlements
Difficult to locate and acquire landfill site
Difficult to obtain cover material
Poor cooperation by Government agencies
Poor public cooperation
Uncontrolled use of packaging material
Poor response to waste minimisation
(reuse/recycle)
8. Human Resource
Personnel responsible for solid waste management service
Type of personnel Area of Work
A CT S G FD O Total
Administrator

129
Health officer
Public health inspector (PHI)or
equivalent
Assistant to PHI
Engineer
Technical assistance
Technician
Mechanic
Mechanic’s assistant
Supervisor
Driver
Labourer
Others
Total
A= Administration/supervision
CT=Collection and transportation
S= Street sweeping
G=Grass cutting
FD= Final disposal
O= Others

130
Appendix iii
Title: A Review of Solid Waste Management Practices in Polokwane City
Authors: P.H Maluleke and S.J Moja
Targeted Journal: Journal of Waste Management and Research
Year: 2014