a review of survey data-collection modes: with a focus on
TRANSCRIPT

185
A Review of Survey Data-Collection Modes: With a Focus on Computerizations
2015, Vol.30 No.2:185-200理論と方法(Sociological Theory and Methods)
Special Issue
A Review of Survey Data-Collection Modes:
With a Focus on Computerizations
Tom W. Smith Jibum Kim
(The University of Chicago) (Sungkyunkwan University)
Abstract
Surveys are conducted using many different modes (e.g. face-to-face, mail, telephone, Internet). Because different modes have different error structures, it is very important to understand the advantages and disadvantages associated with each mode. In recent years there have been major changes in the modes typically utilized in surveys. In particular, there has been increases in the use of computers in data collection, self-administration, and mixed-mode designs. The implications of these and future changes are considered.
Keywords and phrases: CATI, CAPI, CASI, mode, measurement effects
1 IntroductionSurveys are conducted using a wide variety of data-collection modes. The variety of modes is
increasing and the complexity of survey designs is growing. Moreover, in recent decades there has
been an appreciable change in what modes are typically employed. Perhaps the most far-reaching
development has been the expansion of computer-assisted survey information collection (CASIC). 1) As Couper and Nicholls (1998) have noted, “survey research has undergone many important
changes in the last half century…. Yet none of these changes may have more far-reaching effects on
survey research than the application of computer methods to survey data collection and capture.”
Furthermore, this is a change that Couper (2008) characterizes as “inexorable.” 2)
In light of the major changes in modes and the increased computerization of surveys, this paper
examines 1) the complex variety of modes that are used in survey data collection, 2) the use of
mixed-mode surveys, 3) measurement effects and operational differences resulting from different
modes, and 4) mode-related changes that have been and are likely to continue to develop.
2 Typologies of Survey ModesVarious schemata have been developed to classify surveys (Couper 2011; Tourangeau, Conrad,
and Couper 2013; Tourangeau and Smith 1996). Table 1 shows a typology of surveys on three
dimensions. Along the rows, are the four standard modes of survey: In-person or Face-to-Face,

186
理論と方法
Telephone, Mail, and Internet or Online. The columns distinguish two more dimensions: whether
1) computers are or are not utilized in data collection3) and 2) the survey is interviewer- or self-
administered. The first row covers In-person surveys. In the upper left corner are traditional paper
and pencil interviews (PAPI) in which an interviewer conducts an in-person interview with a
respondent and reads questions from and records responses into a printed, hardcopy questionnaire.
Moving to the right are PAPI surveys that include one or more self-administered questionnaire
(SAQ) components. PAPI+SAQ is a mixed-mode format since the SAQ typically represents
only a minority of the total questionnaire. Next comes computer-assisted personal interviews
(CAPI) in which an interviewer administers the survey as in PAPI, but reads from and records
responses into a computer. The final variants of in-person interviews are a variety of computer-
assisted self-interviews (CASI) also known as computerized self-administered questionnaires
(CSAQ). Traditionally, these involve having the interviewer turn the computer around and having
the respondent read questions and enter their answers into the machine without the interviewer
observing their responses. Extensions of CASI include 1) audio computer-assisted self-interviewers
(ACASI) in which the computer reads the questions aloud to respondents who usually listen on
earphones and often simultaneously see the written questions on the computer screen and then enter
their answers into the computer, 2) video computer-assisted self- interviews (VCASI) in which
respondents are shown either still or dynamic visuals on the computer as either part of content
of the question or as the response options, and 3) audio-video computer-assisted self-interviews
(AVCASI) in which respondents both listen to audio (either the questions being read and/or sounds
being evaluated as part of the question content)and watch visuals (stills and/or dynamic). These are
sometimes referred to as multi-media presentations.
The next row covers telephone surveys. In the left-most column are traditional telephone
interviews (TI) not utilizing computers in which interviewers read from and record responses into
a printed questionnaire. There is no current self-administered version of TIs that do not utilize
computers. There used to be fax surveys in which a questionnaire was faxed to respondents,
printed out by them, manually-filled out and then faxed back to the sender. Next comes computer-
assisted telephone interviews (CATI) which are administered like TIs, but the interviewer reads
from and enters responses into a computerized questionnaire. Most CATIs use centralized data
collection and desktops, but Distributed-CATI, in which interviewers use desk/laptops from their
homes, are also utilized (Couper 2008). Self-administered telephone interviews consist of both 1)
fully computerized systems using interactive voice response (IVR) in which a computer contacts
respondents, introduces the survey and orally asks the questions (with the sound typically being
machine generated using text-to-speech (TTS) software (Couper 2008; Couper et al. 2014; Smith
and Sokolowski 2011) and responses are collected by respondents answering using phones with
traditional touchtone keypads and smartphone equivalents, or orally with their responses being
captured by automatic speech recognition (ASR) or voice recognition (VR) software and 2) hybrid
telephone audio computer-assisted interviews (T-ACASI) in which interviewers initially contact

187
A Review of Survey Data-Collection Modes:With a Focus on Computerizations
respondents and some or all of the subsequent interview is administered by computer as in the pure
IVR case. The former case is sometimes dismissively referred to as robopolls.
Table 1. Typology of Surveys by Mode and MediumNo Computer Computer
Interviewer Self-Administered Interviewer Self-AdministeredIn-Person PAPI PAPI+SAQ CAPI CASI/CSAQ
ACASI
VCASI
AVCASI
Telephone TI Null CATI IVR/T-ACASI
Mail Null MQ Null Mailed Disk
Internet Null Null Null EQ
OQ
ACASI=audio computer-assisted self-interviewAVCASI=audio-video computer-assisted self-interviewEQ=email questionnaireCAPI=computer -assisted personal interviewCASI=computer-assisted self-interviewCATI=computer-assisted telephone interviewCSAQ=computerized self-administered questionnaireIVR=interactive voice responseMQ=mail questionnaireNull=rare or non-existentOQ=online questionnairePAPI=paper and pencil interviewSAQ=self-administered questionnaireT-ACASI=telephone audio computer-assisted self-interviewTI=telephone interviewVCASI=video computer-assisted self-interview
The third row covers mail surveys. This mode is entirely self-completed and no interviewers are
involved. Traditionally, a mail questionnaire (MQ) is sent to respondents who read it, manually
complete it, and then mail it back to the sender. There used to be a partial computerized version
in which a diskette was mailed to respondents who uploaded it on their own computer, completed
the questionnaire, and then downloaded it on to the diskette and mailed it back to the sender (or
possibly emailed it back in some cases), but this is no longer used (Wright and Marsden 2010).
The final row covers Internet surveys. Naturally, these only involve computers. Traditionally,
like mail surveys, these have been entirely a self-completion mode, but, as discussed below, their
nature is evolving along with the Internet. The initial version involved email questionnaires (EQ)
in which respondents were sent a questionnaire as an attachment, completed it on their computer,
and electronically sent it back to the sender (Couper and Bosnjak 2010; Wright and Marsden 2010).

188
理論と方法
These have largely been replaced by a variety of online questionnaires (OQ)(Couper and Bosnjak
2010). In the most common case, respondents are sent an electronic invitation with a link to a
website where an interactive questionnaire can be completed and submitted. There are an enormous
variety of OQs varying on several dimensions such as how the sample is drawn (e.g. probability
and non-probability access panels, river sampling, list samples of some sub-population like students
in a college or employees of a company), the device on which respondents complete the survey
(desktop, laptops, tablets, smartphones), the operating systems and software utilized, and how basic
or advanced the questionnaire design is (Couper 2008; Couper and Bosnjak 2010; Tourangeau et al.
2013).
Table 2 elaborates on the different types of surveys by examining administration mechanism -
visual, audio, or mixed (both employed) and again subdivides surveys by whether a computer is
used or not and whether it is interviewer- or self-administered (Smith and Sokolowski 2011). By
emphasizing the administration mechanism or channels of communication rather than the standard
survey modes, Table 2 shows the similarities and differences that exist across the many different
varieties of surveys delineated in Table 1.
Table 2. Typology of Surveys by Visual/Audio Dimensions and ModeNo Computer Computer
Interviewer Self-Administered Interviewer Self-Administered
Visual Drop-off Mail
Classroom handout
Null OQ
CASI
Audio PAPI
TI
Null CAPI
CATI
IVR/T-ACASI
Mixed PAPI+show cards TI+show cards
TI+diary
PAPI+SAQ
CAPI+show cards ACASI
AVCASI
ACASI=audio computer-assisted self-interviewCAPI=computer-assisted personal interviewCASI=computer-assisted self-interviewCATI=computer-assisted telephone interview Null=rare or non-existentPAPI=paper and pencil interviewSAQ=self-administered questionnaireTI=telephone interview
The first row covers visually-administered surveys. Visual-administration includes both reading
text (i.e. questions and questionnaire instructions) and viewing static or dynamic images (e.g.
photographs or animated and real-life videos). Visuals include both their use as part of the stimuli
(e.g. still and dynamic pictures to be evaluated by respondents) or as part of the response options
189
A Review of Survey Data-Collection Modes:With a Focus on Computerizations
(e.g. scales of response options). Visual modes using interviewers and not using computers would
include when an interviewer drops-off a questionnaire which the respondent completes and
which is later picked up by the interviewer (or sometimes mailed back). Visuals neither using an
interviewer nor a computer would include MQs and classroom handout questionnaires. Visuals
using computers and self-administered include OQ and CASI surveys. Surveys only using visuals (no
audio) and using both computers and Interviewers essentially do not exist.
The second row includes audio-administered surveys. Those using interviewers and no computer
include PAPI and TI. Those self-administered and without a computer do not occur. Audio surveys
using computers and interviewers include CAPI and CATI. Those using computers and self-
administered include IVR and T-ACASI. These also cover ASR in which responses are given
verbally and converted into data by the receiving computer. Computerized audio formats (e.g. IVR,
ACASI) may involve recordings of actual people reading the questions or artificial voices often
generated by TTS programs (Smith and Sokolowski 2011). The shift over time has been from the
actual to the artificial. In addition, programming options for the computerized voices have become
more sophisticated and one can regulate many aspects of the audio such the gender of the voice
and such other features as accents, volume, timbre, and pitch. Also, if questionnaires are needed in
multiple languages, multilingual TTS programs can produce audio in the respective languages.
The third row contains surveys that use both audio and visual elements. Even many surveys
that primarily use one collection mode often use a mix of mechanisms. Those using mixed
surveys without a computer and with an interviewer include PAPI surveys using show cards listing
response categories and PAPI surveys with visual stimuli such as a contingent valuation survey
that showed different pictures of the sky over the Grand Canyon and asked people how much they
would pay in taxes to achieve clearer views (and cleaner air). Mixed surveys incorporating self-
administration and no computer include TI in which show cards or diaries had been previously
mailed to the respondents. In the case of hardcopy diaries, these would usually later be mailed back
by respondents. It would also cover PAPI surveys with a hardcopy SAQ component. These are
self-completed by respondents and then often placed in a sealed envelope before being returned to
the interviewer. Mixed surveys using computers and an interviewer include CAPI+show cards or
CAPI with still or dynamic visuals shown on the computer. Those using computers and not using
an interviewer include ACASI (since question text and response options are usually provided along
with the audio) and AVCASI. These would also typically use TTS to program their questionnaires
as well. It would also include OQs that had an audio component as part of their question content,
such as evaluations of music or speeches. It would also cover ASR in which responses are given
orally, but these are uncommon.
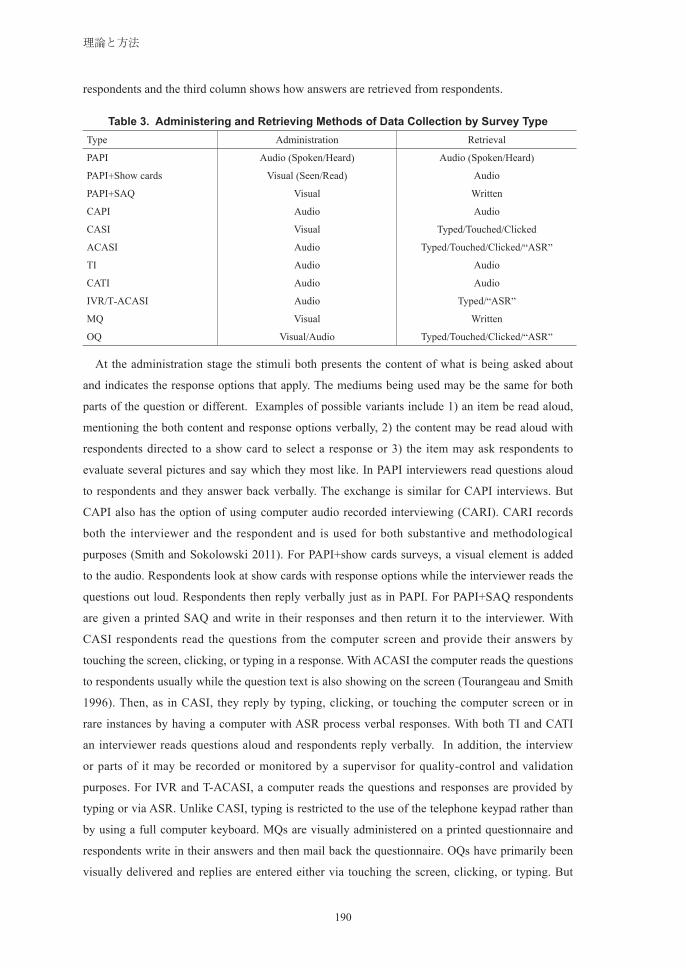
Table 3 further elaborates on how data are collected in the interaction between interviewer/
questionnaire and respondent. It distinguishes between how the survey is administered and how
responses are retrieved (Smith and Sokolowski 2011). The first column lists the main current forms
of surveys delineated in Table 1, the second column indicates how questions are administered to
190
理論と方法
respondents and the third column shows how answers are retrieved from respondents.
Table 3. Administering and Retrieving Methods of Data Collection by Survey TypeType Administration Retrieval
PAPI Audio (Spoken/Heard) Audio (Spoken/Heard)
PAPI+Show cards Visual (Seen/Read) Audio
PAPI+SAQ Visual Written
CAPI Audio Audio
CASI Visual Typed/Touched/Clicked
ACASI Audio Typed/Touched/Clicked/“ASR”
TI Audio Audio
CATI Audio Audio
IVR/T-ACASI Audio Typed/“ASR”
MQ Visual Written
OQ Visual/Audio Typed/Touched/Clicked/“ASR”
At the administration stage the stimuli both presents the content of what is being asked about
and indicates the response options that apply. The mediums being used may be the same for both
parts of the question or different. Examples of possible variants include 1) an item be read aloud,
mentioning the both content and response options verbally, 2) the content may be read aloud with
respondents directed to a show card to select a response or 3) the item may ask respondents to
evaluate several pictures and say which they most like. In PAPI interviewers read questions aloud
to respondents and they answer back verbally. The exchange is similar for CAPI interviews. But
CAPI also has the option of using computer audio recorded interviewing (CARI). CARI records
both the interviewer and the respondent and is used for both substantive and methodological
purposes (Smith and Sokolowski 2011). For PAPI+show cards surveys, a visual element is added
to the audio. Respondents look at show cards with response options while the interviewer reads the
questions out loud. Respondents then reply verbally just as in PAPI. For PAPI+SAQ respondents
are given a printed SAQ and write in their responses and then return it to the interviewer. With
CASI respondents read the questions from the computer screen and provide their answers by
touching the screen, clicking, or typing in a response. With ACASI the computer reads the questions
to respondents usually while the question text is also showing on the screen (Tourangeau and Smith
1996). Then, as in CASI, they reply by typing, clicking, or touching the computer screen or in
rare instances by having a computer with ASR process verbal responses. With both TI and CATI
an interviewer reads questions aloud and respondents reply verbally. In addition, the interview
or parts of it may be recorded or monitored by a supervisor for quality-control and validation
purposes. For IVR and T-ACASI, a computer reads the questions and responses are provided by
typing or via ASR. Unlike CASI, typing is restricted to the use of the telephone keypad rather than
by using a full computer keyboard. MQs are visually administered on a printed questionnaire and
respondents write in their answers and then mail back the questionnaire. OQs have primarily been
visually delivered and replies are entered either via touching the screen, clicking, or typing. But
191
A Review of Survey Data-Collection Modes:With a Focus on Computerizations
audio stimuli are also possible and with the expansion of computer speakers and VOIP (Voice Over
IP) audio, and mixed-mode delivery, audio OQs are emerging. Similarly, response via ASR is a
developing possibility, but still uncommon.
As discussed above, mode variations are usually thought of as varying between the major modes
of data collection (e.g. in-person, telephone, mail, and Internet) and/or between interviewer- and
self-administered modes. But there are also important differences within the basic modes. For
example, CAPI and OQ surveys can be conducted on laptops (or desktops for OQ surveys), tablets,
and/or smartphones. Questionnaires have to be designed differently for these different platforms.
For example, certain formats, which work well for lap/desktops, work poorly or not at all on
smartphones. Similarly, PAPI surveys vary considerably in terms of the use of show cards, the
format of questions, the amount of interviewer probing, and in other ways. This sub-mode variation
of course makes the situation even more complex.
3 Mixed ModesThe array of survey modes described above are further complicated by the fact that increasingly
survey designs are becoming more complex and often employ mixed or multiple modes (Couper
2005, 2011). There are several different types of mixed-mode surveys (MMSs – Couper 2011;
de Leeuw 2005; Dillman, Smyth, and Christian 2009): 1) Concurrent MMSs contact respondents
and offer the prospective respondents two or more modes in which to complete the survey. For
example, a mailed letter may offer recipients the options of completing a MQ or doing a OQ. 2)
Sequential MMSs contact all cases in one mode and then switch to other modes to increase the
response rate. One common practice is to start with the least expensive mode and then progress
to more expensive and more persuasive modes, such as starting with a MQ and followed next
with CATI and finally with CAPI. 3) Parallel or experimental MMSs divide the survey into two
or more random subsamples and using different modes for each subsample. This is often done
as part of methodological research on mode effects, to calibrate a shift in a time series from one
mode to another, or to reduce overall costs by combining lower and higher cost modes. 4) Modular
MMSs use multiple modes across different sections of a survey. For example, the PAPI US General
Social Survey (GSS) used to include sections using SAQs and the current CAPI GSS uses CASI
to administer sensitive questions. 5) Panel MMSs use different modes across different waves.
For example, the US Current Population Survey initially contacts households in-person and then
utilizes telephone as the primary mode for reinterviews in waves 2-4. 6) Combination MMSs use
two or more of the previous five types of MMSs. For example, a sequential design may also employ
modular MMS components. One needs to fully take into consideration the complexity of mixed-
mode designs regarding conducting surveys and assessing mode effects.
4 Mode Differences: Advantages and Disadvantages The major shifts in survey modes in recent decades have been the increased use of computerization

192
理論と方法
and the rise in self-administration (Couper 2008). The differences across modes along these
changing dimensions in how surveys are conducted, their relative pluses and minuses, and
variations in measurement error are considered next.
Computerization of surveys has several distinct advantages: 1) more complex survey designs
with a) complicated skips and b) other customization can be utilized (Couper 2008; Couper and
Bosnjak 2010; Stafford 2010), this includes the randomization of question order and/or the order of
responses, customized question wording fills, and consistency checks (Couper and Bosnjak 2010;
Nicholls, Baker, and Martin 1997). For example, surveys using factorial vignettes and dynamic
item response theory (IRT) filtering are nearly impossible to implement without computerization. 2)
Measurement error related to implementing filters and skips and suspect values (e.g. out of range)
can be reduced (Caeyers, Chalmers, and De Weerdt 2012; Couper and Bosnjak 2010; Groves and
Tortora 1998). 3) Item nonresponse can be lowered (Banks and Laurie 2000; Nicholls et al. 1997).
4) The time and costs of a separate, data-entry stage are eliminated (Dielman and Couper 1995).
5) Less time and effort are needed for post-production cleaning (Baker 1992; Couper and Nicholls
1998). 6) More paradata can be easily collected (e.g. keystrokes, GPS readings, interview and
question timings - Caeyers et al. 2012; Caviglia-Harris et al. 2012; Couper, Hansen, and Sadosky
1997). 7) New format can be accommodated such as including musical or video content as stimuli
(Couper and Bosnjak 2010). 8) Easier coordination of cases with case-management systems can
be achieved (Hansen 2008). And 9) dependent interviewing is much easier to implement (this is
primarily a benefit for panel surveys - Caviglia-Harris et al. 2012; Nicholls et al. 1997; Stafford
2010).
Several other claimed advantages have not been clearly established. First, the idea that
interviewer variance will be eliminated or notably reduced is not well-supported. Interviewer
variance relating to skip pattern errors is probably reduced, but many sources of interviewer
variance (e.g. response rates, reading questions, assisting respondents) are not materially affected.
Second, the hope that response rates would increase or at least that their general decline would
stabilize has not been realized (Couper 2005; Kohno et al. 2008; Matsubayashi and Nishizawa
2012). Finally, the expectation that CAPI would reduce costs has not been routinely established
(Baker 1992; Caeyers et al. 2012; Couper and Nicholls 1998; Groves and Tortora 1998; Singla
et al. 2014). It is hard to rigorously compare costs and the relative costs depend on the type of
staff that a survey organization employs, how the cost of laptops and survey hardware is allocated
across multiple surveys, and other accounting issues. The best generalization is that CAPI usually
saves costs for complex surveys with large samples and PAPI is still less expensive for smaller,
simpler surveys. CATI is widely seen as less expensive than TI, but no rigorous studies appear to
have documented this. OQs are apparently less expensive than MQs, but again studies carefully
comparing costs while controlling for response rate, target population, and other variables do not
appear to exist.
Computerization also has some negatives: 1) data-entry errors by interviewers cannot be caught
193
A Review of Survey Data-Collection Modes:With a Focus on Computerizations
(unless an invalid entry is caught by a range or consistency check). Interviewers are under pressure
to move the survey along and may be less careful that data-entry clerks whose work can be quality
controlled by supervisor oversight and/or double-entry validation (Dielman and Couper 1995).4)
2) More training is needed for interviewers to cover matters such as the how the laptop or other
device works, how the CAPI program works, and how to upload completed cases (Caviglia-Harris
et al. 2012). 3) CAPI programming errors can cause skip and filtering errors. While CAPI notably
reduces such errors on average, a programming error can create large error for the affected variables
(Banks and Laurie 2000; Groves and Tortora 1997). Related to this is the concern that interviewers
using CAPI are less familiar with the survey instrument and like automatons just blindly follow the
CAPI program. 4) While post-production time is reduced by CAPI, preparing and usability testing
the CAPI program necessitates longer set up time (Couper 2000; Fernee and Sonck 2013). 5) The
need to continually adapt computer-assisted formats to the latest hardware and software presents a
continuing challenge and increases the likelihood of failures if adaptions to the newer devices and
programs are not fully successful. 6) Some types of computerized survey may have other problems.
For example, there is evidence that OQs may encourage more satisficing by respondents and thus
more measurement error (Couper 2011; Tourangeau et al. 2013). And 7) when transitioning from a
PAPI design to a CAPI design, methodological artifacts can occur. The CAPI instrument must not
only be a correct CAPI instrument, but also equivalent to the PAPI instrument. Surveys making
the PAPI-to-CAPI transition have generally been very successful (Baker 1992; Banks and Laurie
2000; Couper 2000; Smith and Kim 2003), but examples of problems have been found (Caeyers
et al. 2012; Nicholls et al. 1997). For example, Smith and Kim (2003) found that CAPI produced
more multiple mentions of ethnicity than PAPI did because it in effect prompted interviewers to
probe more. A subsequent experiment showed that a revised-CAPI version was able to duplicate
PAPI results (Smith 2008). One adaptation that is difficult is the use of show cards. Show cards do
not adjust well to CAPI. An interviewer cannot simultaneously read the respondents a question and
show them a screen with response options. As a result, many surveys that used show cards with
PAPI have retained the same identical printed show cards after transitioning to CAPI. When CAPI
surveys are being designed de novo, question formats needing show cards are usually avoided.
Another challenge is duplicating don’t-know levels. For most questions Don’t Know/No Opinion
is a pre-coded, but unread response option. In PAPI surveys it is often a printed response along
with the written responses (e.g. Yes/No, Strongly Agree…Strongly Disagree), while in many CAPI
surveys it is not a listed response, but captured by the use of a designated key, such as F8. This
seems to lower the recorded levels of Don’t Knows in CAPI surveys (Smith and Kim 2003).5)
Differences between computerized and non-computerized modes can vary according to their
exact design. For example, both CAPI surveys designed to match baseline PAPI surveys and those
in the initial adoption phase of CAPI are typically designed to closely resemble the style and format
of PAPI surveys. This is not only due to an explicit goal of replicating established PAPI surveys,
but also because questionnaire designers are used to designing PAPI surveys and merely apply their

194
理論と方法
standard approaches. But over time as CAPI programs have become more sophisticated, laptops
have become more powerful and versatile, and questionnaire designers have adopted computerized
questionnaires as their standard platform, CAPI questionnaires have evolved and become more
differentiated from PAPI questionnaires. First, they have adopted computer-friendly formats (e.g.
radio buttons) not previously utilized. Second, they have often utilized features not employable in
PAPI surveys and even beyond the reach of early CAPI survey. These include the showing dynamic
and/or still visuals (e.g. video clips and/or photographs) and the playing of music.
Several other expected disadvantages of computerization have not materialized. There has been
concern that interviewers and/or respondents would not positively handle and react to the use of
computers. Even when CAPI was first widely introduced (e.g. in the early 1990s in the US), this
was not found to be a serious problem and concern about this has dissipated over time (Baker
1992; Caeyers et al. 2012; Couper et al. 1997; Groves and Tortora 1998). However, there are still
appreciable differences across age cohorts in how familiar interviewers and respondents are with
various types of hardware, software, and CAPI, CASI, and OQ functions and these are not likely
to diminish since new technologies will continue to be introduced that are typically initially mostly
adopted by younger cohorts and this will continually recreate cohort-based, digital divides that
survey designers need to keep in mind. Also, different cultures and various sub-groups will often
react to technologies in disparate ways (Fussell et al. 2008), but this has not proven to be a notable
impediment to the computerization of surveys.
Also, there has been concern that the hardware would not hold up, but failure rates have been
quite small (Nicholls et al. 1997) and CAPI has successfully be employed in even very remote and
challenging environments (Caeyers et al. 2012; Caviglia-Harris et al. 2012; Leisher 2014; Paudel et
al. 2013). Lost and stolen computers have also not materialized as a notable problem.
The other major shift has been an increased use of self-administration modes. Self-administration
has the clear advantage of reducing social-desirability bias compared to interviewer-administered
surveys (Mavletova and Couper 2013; Nicholls et al. 1997; Tourangeau and Smith 1996). The main
disadvantage of self-administration is that there no interviewer to answer questions that respondents
may have about the questions or the survey in general, to probe to clarify responses, or to
encourage respondents to complete the survey (Couper and Bosnjak 2010; Tourangeau et al. 2013).
Another problem is that with PAPI+SAQ and CASI cases are not actually always self-administered.
Due to illiteracy, poor eyesight, respondent preference, or other reasons, self-administration may
actually not occur. Couper and Rowe (1996) found that only 79% of CASI cases were actually
fully self-administered. Also, even when self-administration is achieved interviewer effects may
still occur. West and Peytcheva (2014) found that interviewer behaviors during ACASI affected
responses. Additionally, switching to self-administration during a PAPI or CAPI interview often
increases item nonresponse due to respondents declining to do the SAQ/CASI. Kim et al. (2010)
noted that 10-16% declined to do the SAQ and that decliners were different from completers on a
number of demographics.

195
A Review of Survey Data-Collection Modes:With a Focus on Computerizations
While computer-use and mode of administration are independent dimensions, they interact with
one another in various ways. For example, there is some evidence that the social-desirability bias
reduction is even greater when computers are utilized such as when CASI or ACASI are used
vs. PAPI+SAQs (Mavletova and Couper 2013; Tourangeau and Smith 1996; Turner et al. 1998).
Likewise, computerized, self-administered surveys (e.g. CASI and OQ) could have help aids
programmed in while it would be much more difficult for hardcopy SAQs to easily incorporate
comparable assistance. Similarly, CASI and OQ can easily handle complex skips that are poorly
navigated by respondents using SAQs. In addition, the use of both have increased over time mostly
due to the rise of OQs, but also due to the technological advances that have replaced some CATI
surveys with IVR and T-ACASI surveys.
5 Future DevelopmentsModes have been and will continue to evolve due both to technological advances and changes in
other societal conditions that affect surveying (Couper 2022; Smith and Sokolowski 2011; Savel
et al. 2014; Tourangeau et al. 2013). In CASIC surveys (CAPI, CASI, and OQ), newer devices are
beginning to replace desk/laptops. Tablets rather than laptops have been successfully employed
in CAPI (Leisher 2014; Paudel et al. 2013), CASI (Singleton et al. 2011), and OQ (Wells, Bailey,
and Link 2013) surveys. Considerable careful effort is needed to adapt surveys designed for desk/
laptops for surveys in general and special effort is needed when the tablets will be used for self-
administration since respondents may not be familiar with their format or operation. Smartphones
are a much more challenging device than tablets to conduct surveys on (Alam et al. 2014; Buskirk
and Andrus 2014; de Bruijine and Wijnant 2014a, 2014b; Link and Murphy 2014; Mavletova
and Couper 2014; Toepoel and Lugtig 2014; Wells et al. 2013). They have not been widely used,
but that is likely to change rapidly (Fernee and Sonck 2013; Link and Murphy 2014). So far
smartphones appear to have been used only with OQ and not with CAPI or CASI. Screen size is a
major impediment that affects all smartphones (but ones with smaller screens more than others). A
second obstacle is the wide range of different operating systems and devices (e.g. Android, IPhone,
etc. – Buskirk and Andrus 2012; Savel et al. 2014; Wells et al. 2013). A smartphone survey needs to
be compatible across these different platforms. Wells et al. (2013) found them much more difficult
for respondents to use and resulted in higher breakoffs and more item non-response than those
using other devices. While the use of newer devices present some promising opportunities, one
should be cautious about employing the most cutting-edge hardware, apps, and features since many
computer and Internet users at any point in time are not in the innovative avant garde and either do
not have hardware and/or software capable of utilizing the latest technologies or are unfamiliar with
the newest features and unable to easily handle them (Dal 2011).
Computer development has extended so far and is advancing so rapidly, that “interviewer”
based OQs are on the cusp of being practical. Computer graphics used in movies and games and
TTS programs have advanced to a level that human-like avatars can closely resemble the look

196
理論と方法
and sound of real people (Savel et al. 2014; Smith and Sokolowski 2011). Coupled with some
artificial intelligence and human exchange programing, it will soon be possible to develop fully-
computerized surveys that could closely resemble a human interview and even approach passing a
simple version of the Turing test. Whether this development should be pursued is another question.
Concern has been raised that the humanization of computerized surveys will shift them from being
perceived as self-administered to being seen as an interpersonal exchange similar to that done by a
human interviewer. If that occurred, then the reduction in social desirability bias that SAQs achieve
might be lost. So far the research has indicated that the primitive humanization of OQs implemented
so far has not led to this (Couper 2005; 2008; Tourangeau et al. 2013), but the nearly-feasible
Turing-test passing “interviewers” might lose the reduction in social desirability bias achieved by
self-administration.
Also, the expansion of webcams and photographic and video uploads from smartphones and
tablets means OQs can be adapted to allow two-way, “face-to-face” interviews via the Internet. It
also means that the collection of audio, visual, and audio-visual data from respondents (e.g. selfies,
views of their immediate environment) is now feasible (Couper 2011; Smith and Sokolowski 2011).
Also as part of these technological developments, the distinctions across survey modes are
muddying (Couper 2011). Unlike traditional landline and cell phones, smartphones are no longer
solely a device for long-distant voice communication. Smartphones add written communication
to audio – including emailing, texting, and tweeting, allow the taking and uploading of pictures
and video, have the ability to access information in many forms from the Internet, and permit the
broadcasting messages rather contacting specific individuals or organizations. It is likely that many
smartphone users employ their devices more as computerized communicators and cameras rather
than as telephones. This and other technological hybridizations mean that distinctions between
survey modes are also likely to breakdown.
6 ConclusionIn a different context Marshall McLuhan noted that “the medium is the message.” That observation
applies to surveys as it does to mass-media distributions. Different survey modes have varied
advantages and disadvantages and these can produce different outcomes, the result of so-called
mode effects (a sub-category of the broader category of measurement effects). To optimize
survey quality and increase reliability and validity, it is important to reduce total survey error in
general and to minimize mode effects in particular. This goal has become more challenging as
survey designs have become more complex and increasingly utilize mixed-modes and emergent
technologies. Switching from traditional modes to newer modes (e.g. from mail to online or from
PAPI to CAPI) always involves a learning curve and that often leads to a few adoption difficulties.
Survey researchers need to fully understand the strengths and limitations of all mode options and
to adopt survey designs best suited for the research topic under investigation, the target population,
and other parameters of their specific investigation.

197
A Review of Survey Data-Collection Modes:With a Focus on Computerizations
Notes1) While some use the term computer-assisted interviewing (CAI) as a general term for surveys that
uses computers as part of data collection, better terms are computer-assisted survey information collection (CASIC) and computer-assisted data collection (CADAC) since they clearly include both interviewer- and self-administration while CAI does not obviously do so (Collins, Sykes, and O’Muircheartaigh 1998; Couper and Nicholls 1998).
2) For the history of CASIC and its early adoption see Baker (1992), Couper and Nicholls (1998), and Wright and Marsden (2010). While computerization of in-person surveys in Japan has lagged behind that of most other advanced countries, there have been a number of applications. These include CAPI surveys such as the World Mental Health Japan Survey (Kawakami et al. 2005) and the Japanese Study of Stratification, Health, Income, and Neighborhood in the Tokyo metro area (Kanbayashi 2014) and the GLOPE Computer Assist Self-Administered Interview 2007 Study (Kohno et al. 2008).
3) Computers are of course now used in various ways in essentially all surveys. Even a printed, hardcopy questionnaire would almost always be created using a computer with word processing and probably no survey is analyzed without using a computer. Here the use of computers only refers to their utilization during the data-collection phase.
4) In capturing open-ended response misspelling and typos are very common with CAPI, although they rarely are so garbled to be unintelligible.
5) Mode differences in the handling of Don’t Knows are even greater across interviewer- and self-administered questionnaires (Smith 2003; Smith and Dennis 2005, 2008; Dennis, Li, and Hadfield 2007).
ReferencesAlam, Iftikhar, Shah Khusro, Azhar Rauf, and Qamruz Zaman. 2014. “Conducting Surveys and Data
Collection: From Traditional to Mobile and SMS-based Surveys.” Pakistan Journal of Statistics and Operation Research 10: 169-187.
Baker, Reginald P. 1992. “New Technology in Survey Research: Computer-Assisted Personal Interviewing.” Social Science Computer Review 10 (2): 145-157.
Banks, Randy, and Heather Laurie. 2000. “From Papi to Capi: The Case of the British Household Panel Survey.” Social Science Computer Review 18: 397-406.
Buskirk, Trent D., and Charles Andrus. 2012. “Smart Surveys for Smart Phones: Exploring Various Approaches for Conducting Online Mobile Surveys via Smartphones.” Survey Practice 5(1): 1-11.
―. 2014. “Making Mobile Browser Survey Smarter: Results from a Randomized Experiment Comparing Online Surveys Completed via Computer or Smartphone.” Field Methods 26: 322-342.
Caeyers, Bet, Neil Chalmers, and Joachim De Weerdt. 2012. “Improving Consumption Measurement and Other Survey Data through CAPI: Evidence from a Randomized Experiment.” Journal of Development Economics 98: 19-33.
Caviglia-Harris, Jill, Simon Hall, Katrina Mulllan, Charlie Macintyre, Simone Carolina Bauch, Daniel Harris, Erin Sills, Dar Roberts, Michael Toomey, and Hoon Cha. 2012. “Improving Household Surveys Through Computer-Assisted Data Collection: Use of Touch-Screen Laptops in Challenging Environments.” Field Methods 24: 74-94.
Collins, Martin, Wendy Sykes and Colm O’Muircheartaigh. 1998. “Diffusion of Technological Innovation: Computer Assisted Data Collection in the U.K.” Pp. 23-44 in Computer Assisted Survey Information Collection, edited by Mick P. Couper, Reginald P. Baker, Jelke Bethlehem, Cynthia Z. F. Clark, Jean Martin, William L. Nicholls, II, James M. O'Reilly. New York: John Wiley and Sons.

198
理論と方法
Couper, Mick P. 2000. “Usability Evaluation of Computer-Assisted Survey Instruments.” Social Science Computer Review 18: 384-396.
―. 2005. “Technology Trends in Survey Data Collection.” Social Science Computer Review 23: 486-501.
―. 2008. “Technology and the Survey Interview/Questionnaire.” Pp. 58-76 in Envisioning the Survey Interview of the Future, edited by Frederick G. Conrad and Michael F. Schober. New York: John Wiley and Sons.
―. 2011. “The Future of Modes of Data Collection.” Public Opinion Quarterly 75: 889-908.Couper, Mick P., Patricia Berglund, Nicole Kirgis, and Sarrah Buageila. 2014. “Using Text-to-Speech (TTS)
for Audio Computer-Assisted Self-Interviewing (ACASI).” Field Methods, forthcoming.Couper, Mick P., Sue Ellen Hansen and Sally A Sadosky. 1997. “Evaluating Interviewer Use of CAPI
Technology.” Pp. 267-286 in Survey Measurement and Process Quality, edited by Lars E. Lyberg, Paul P. Biemer, Martin Collins, Edith D. De Leeuw, Cathryn Dippo, Norbert Schwarz, Dennis Trewin. New York: John Wiley and Sons.
Couper Mick P., and Michael Bosnjak. 2010. “Internet Surveys.” Pp. 527-550 in Handbook of Survey Research. 2nd Edition, edited by Peter V. Marsden and James D. Wright. Bingley: Emerald.
Couper, Mick P., and William L. Nicholls. 1998. “The History and Development of Computer Assisted Survey Information Collection Methods.” Pp. 1-22 in Computer Assisted Survey Information Collection, edited by Mick P. Couper et al. New York: John Wiley and Sons.
Couper, Mick P., and Benjamin Rowe. 1996. “Evaluation of a Computer-Assisted Self-Interview Component in a Computer-Assisted Personal Interview Survey.” Public Opinion Quarterly 60: 89-105.
Dal, Michael. 2011. “Online Data Collection and Data Analysis Using Emergent Technologies.” Pp. 275-299 in The Handbook of Emergent Technologies in Social Research, edited by Sharlene Hesse-Biber. Oxford: Oxford University Press.
De Bruijine, Marika, and Arnaud Wijnant. 2014a. “Improving Response Rates and Questionnaire Design for Mobile Web Surveys.” Public Opinion Quarterly 78: 951-962.
―. 2014b. “Mobiles Response in Web Panels.” Social Science Computer Review 32: 728-742.De Leeuw, Edith D. 2005. “To Mix or Not to Mix Data Collection Modes in Surveys.” Journal of Official
Statistics 21: 233-255.Dennis, J. Michael, Rick Li and Joe Hadfield. 2007. “Results of a Within-Panel Survey Experiment of
Data Collection Mode Effects Using the General Social Survey’s National Priority Battery." Paper presented to the American Association for Public Opinion Research, May, Anaheim.
Dielman, Lynn, and Mick P. Couper. 1995. “Data Quality in a CAPI Survey: Keying Errors.” Journal of Official Statistics 11: 141-146.
Dillman, Don A., Jolene D. Smyth and Leah Melani Christian. 2009. Internet, Mail, and Mixed Mode Surveys. New York: Willey.
Fernee, Henk, and Nathalie Sonck. 2013. “Is Everyone Able to Use a Smartphone in Survey Research?” Survey Practice 6(4): 1-7.
Fussell, Susan R., Qiping Zhang, Frederick G. Conrad, Michael F. Schober, and Leslie D. Setlock. 2008. “Culture, Computer-Mediated Communication, and Survey Interviewing.” Pp. 215-239 in Envisioning the Survey Interview of the Future, edited by Frederick G. Conrad and Michael F. Schober. New York: John Wiley and Sons.
Groves, Robert M., and Robert D. Tortora. 1998. “Integrating CASIC into Existing Designs and Organizations: A Survey of the Field.” Pp. 45-62 in Computer Assisted Survey Information Collection, edited by Mick P. Couper et al. New York: John Wiley and Sons.
Hansen, Sue Ellen. 2008. “CATI Sample Management Systems.” Pp. 340-358 in Advances in Telephone

199
A Review of Survey Data-Collection Modes:With a Focus on Computerizations
Survey Methodology, edited by James M. Lepkowski, Clyde Tucker, J. Michael Brick, Edith D. De Leeuw, Lilli Japec, Paul J. Lavrakas, Michael W. Link, Roberta L. Sangster. Hoboken, NJ: John Wiley and Sons.
Kanbayashi, Hiroshi. 2014. “Gender Difference in the Influence of Non-Regular Employment on Mental Health: The Case of Japan.” Paper presented to the World Congress of Sociology, Yokohama, July.
Kawakami, Norito, Tadashi Takeshima, Yutaka Ono, Hidenori Uda, Yukihiro Hata, Yoshibumi Nakane, Hideyuki Nakane, Noboru Iwata, Toshiaki A. Furukawa, and Takehiko Kikkawa. 2005. “Twelve-month Prevalence, Severity, and the Treatment of Common Mental Disorders in Communities in Japan: Preliminary Finding from the World Mental Health Japan Survey 2002-2003.” Psychiatry and Clinical Neuroscience 59(4): 441-452.
Kim, Jibum, Jeong-han Kang, Seokho Kim, Tom W. Smith, Jaesok Son, and Jennifer Berktold. 2010. “Comparison between SAQ and CASI for Supplemental Survey Nonresponse.” Field Methods 22(1): 57-69.
Kohno, Masaru, Koichi Kuriyama, Yuko Morimoto, Aiji Tanaka, and Motoki Watabe. 2008. “The Making of Making CASI Possible in Japan.” Paper presented to the American Political Science Association, Boston, August.
Leisher, Craig. 2014. “A Comparison of the Tablet-Based and Paper-Based Survey Data Collection in Conservation Project.” Social Science 2: 264-271.
Link, Michael, and Joe Murphy. 2014. “Emerging Technologies in Public Opinion Research – The Current Landscape.” American Association for Public Opinion Research (AAPOR) Webinar, www.aapor.org/aaporkentico/aapor_main/media/Webinar_Previews/WEB1014/lib/playback.html
Matsubayashi, Tetsuya, and Nishizawa, Yoshitaka. 2012. “Estimating the Causal Effect of Survey Modes.” G-COE GLOPE II Working Paper Series No. 55.
Mavletova, Aigul, and Mick P. Couper. 2013. “Sensitive Topics in PC Web and Mobile Web Surveys: Is There a Difference?" Survey Research Methods 7: 191-205.
―. 2014. “Mobile Web Survey Design: Scrolling versus Paging, SMS versus E-mail Invitations.” Journal of Survey Statistics and Methodology 2: 498-518.
Nicholls, William L., Reginald P. Baker and Jean Martin. 1997. “The Effect of New Data Collection Technologies on Survey Data.” Pp. 221-248 in Survey Measurement and Process Quality, edited by Lars E. Lyberg et al. New York: John Wiley and Sons.
Paudel, Deepak, Marie Ahmed, Anjushree Pradhan, and Rajendra Lal Dangol. 2013. “Successful Use of Tablet Personal Computers and Wireless Technologies for the 2011 Nepal Demographic and Health Survey.” Global Health: Science and Practice 1(2): 277-284.
Savel, Craig, Stan Mierzwa, Pamina Gorbach, Michelle Lally, Gregory Zimet, Kristin Meyer, Samir Souidi, Adolescent Trials Network for HIV, and AIDS Interventions. 2014. “Web-based Mobile-device Friendly, Self-report Survey System Incorporating Avatars and Gaming Console Techniques.” Online Journal of Public Health Informatics 6(2): e191.
Singla, Rohit, Mywish Maredia, Byron Reyes, and Anwar Naseem. 2014. “Cost-Effectiveness of Computer Assisted Personal Interviewing vs Paper-and Pencil Based Interviewing Methods for Data Collection,” Paper presented to the Agricultural and Applied Economics Association, Minneapolis. July.
Singleton, Kyle W., Mars Lan, Corey Arnold, Mani Vahidi, Lisa Arangua, Lillian Gelberg, and Alex A.T. Bui. 2011. “Wireless Data Collection of Self-administered Survey using Tablet Computers.” AMIA Annual Symposium Proceedings: 1261-1269.
Smith, Tom W. 2003. “An Experimental Comparison of Knowledge Networks and the GSS.” International Journal of Public Opinion Research 15: 167-179.
―. 2008. “An Experimental Comparison of Measuring Ethnicity.” Field Methods 20: 171-178.

200
理論と方法
Smith, Tom W., and J. Michael Dennis. 2005 “Comparing the Knowledge Networks Web-Enabled Panel and the In-Person 2002 General Social Survey: Experiments with Mode, Format, and Question Wordings.” Public Opinion Pros 1 at http://www.publicopinionpros.norc.org/
―. 2008. “Mode Effects on In-Person and Internet Surveys: A Comparison of the General Social Survey and Knowledge Network Surveys.” Paper presented to the American Statistical Association, August, Salt Lake City.
Smith, Tom W., and Seokho Kim. 2003. “A Review of the CAPI-Effects on the 2002 General Social Survey.” GSS Methodology Report No. 98.
Smith, Tom W., and John Sokolowski. 2011. “Using Audio-Visuals in Surveys.“ Pp. 437-452 in The Handbook of Emergent Technologies in Social Research, edited by Sharlene Hesse-Biber. Oxford: Oxford University Press.
Stafford, Frank P. 2010. “Panel Surveys: Conducting Surveys over Time.” Pp. 765-794 in Handbook of Survey Research., 2nd Edition, edited by Peter V. Marsden and James D. Wright. Bingley: Emerald.
Toepoel, Vera, and Peter Lugtig. 2014. “What Happens If You Offer a Mobile Option to Your Web Panel?” Social Science Computer Review 32: 544-560.
Tourangeau, Roger, Frederick G. Conrad and Mick P. Couper. 2013. The Science of Web Surveys. Oxford: Oxford University Press.
Tourangeau, Roger, and Tom W. Smith. 1996. “Asking Sensitive Questions: The Impact of Data Collection Mode, Question Format, and Question Context.” Public Opinion Quarterly 60: 275-304.
Turner, Charles F., L. Ku, S. M. Rogers, L. D. Lindberg, J. H. Pleck, and F.L. Sonenstein. 1998. “Adolescent Sexual Behavior, Drug Use, and Violence: Increased Reporting with Computer Survey Technology.” Science 280: 867-873.
Wells, Tom, Justin T. Bailey and Michael W. Link. 2013. “Filling the Void: Gaining Better Understanding of Tablet-based Surveys.” Survey Practice 6 (1): 1-9.
West, Brady T., and Emilia Peytcheva. 2014. “Can Interviewer Behaviors during ACASI Affect Data Quality?” Survey Practice 7 (5): 1-10.
Wright, James D., and Peter V. Marsden. 2010. “Survey Research and Social Science: History, Current Practice, and Future Prospects.” Pp. 3-26 in Handbook of Survey Research., 2nd Edition, edited by Peter V. Marsden and James D. Wright. Bingley: Emerald.
(Received February 12, 2015/Accepted June 8, 2015)
Tom W. Smith / NORC at the University of Chicago, Senior Fellow and Director / 1155 E 60th Street, Chicago, IL 60637, USA / [email protected] / Areas of Interest: Societal Change, Survey Methodology
Jibum Kim / Sungkyunkwan University, Associate Professor / 25-2 Sungkyunkwan-ro, Jongno-gu, Seoul, Korea / [email protected] / Areas of Interest: Sociology of Aging, Survey Research Method, Religion