a review on cfd analysis of drag reduction of a generic ... · pdf fileansys-(fluent) may be...
TRANSCRIPT

International Research Journal of Engineering and Technology (IRJET) e-ISSN: 2395 -0056
Volume: 04 Issue: 05 | May -2017 www.irjet.net p-ISSN: 2395-0072
© 2017, IRJET | Impact Factor value: 5.181 | ISO 9001:2008 Certified Journal | Page 973
A Review on CFD Analysis of Drag Reduction of a Generic Sedan and
Hatchback
Shashi Kant1,Desh Deepak Srivastava2,Rishabh Shanker3,Raj Kunwar Singh4,Aviral Sachan5
1M. Tech., Mechanical Engineering, Noida Institute of Engineering & Technology, Greater Noida, Uttar Pradesh, India
2,3,4,5B.Tech., Mechanical Engineering, IMS Engineering College, Ghaziabad, Uttar Pradesh, India
---------------------------------------------------------------------***---------------------------------------------------------------------Abstract - In today’s world, Automobile industries are
working on increasing the fuel efficiency of vehicle alongwith
maintaining the stability at high speed. Advanced tools like
Ansys-(Fluent) may be used for analysis and hence reducing
the drag force , increasing the stability and fuel efficiency. This
review attempts to compare the effect of drag forces on sedan
car on applying different types of spoilers, vortex generators
and also compare the sedan’s car drag force with that of
hatchback type car.
Key Words: Fluent, Drag Coefficient, Spoilers, Aerodynamics, Sedan & Hatchback
1. INTRODUCTION These days car designers of an automobile industry which
designs the car have huge stress to make a car fulfill the
aspects such as performance , fuel economical, aerodynamic
shape etc. Because of this the manufacturers are looking for
new ways and discovering new technologies to reduce fuel
consumption and improve vehicle efficiency.[1]Several
methods are used to reduce aerodynamic drag for
controlling the flow separation at the rear end.These
technique, includes modifying the shape of the vehicle or
attaching add-on devices to reduce the aerodynamic drag, it
is the easiest to implement as it appears but unfortunately it
is only dedicated for specific application [2].As price of fuel
increased from 2002 the decreasing sales of automobiles
severely damaged the industry all over the world.[3]
Drag forces is determined by the airflow over a vehicle,
which in turn affects the car’s performance and design of
efficiency testing equipment has been done to measure both
the vertical and horizontal components of air resistance on a
model car. Down force, the vertical component is simply
negative lift.[4]
The performance and fuel efficiency of aircraft, road vehicles
or racing cars are affected by the drag force as it works
opposite to the direction of movement. About 30% to 40% of
the total fuel energy is lost to overcome road resistance,
about 10% to 20% for operating electrical appliances and
50% to 60% to overcome the drag force. So reducing of
aerodynamic drag has become the primary concern in
vehicle aerodynamics great efforts in research have been
employed for better fuel economy and performance of
aircraft and road vehicles due to market competition.[5]
Study of flow around solid objects of various shapes is called
an external aerodynamics. Examples of external
aerodynamics are evaluating the lift and drag on an airplane,
the shock waves that form in front of the nose of a rocket, or
the flow of air over a wind turbine blade are examples of
external aerodynamics. On the other hand, internal
aerodynamics is the study of flow through passages in solid
objects. Examples of internal aerodynamics comprises the
study of the airflow through a jet engine or through an air
conditioning pipe and other internal flow conditions.[6]
Most of the finest sedan cars were manufactured in 20th century. From highest speed Hennessey Venom GT reaching up to 270.49 mph, Bugatti Veyron to the luxurious Rolls Royce phantom and much more. Depending on the customer’s choice , personal cars ranging from hatch backs, sedans & SUV have seen major changes in their design and ergonomics. Change of aerodynamics in car is gradually seen from initial designers to the manufacturers’ to obtain more power under the hood. This in turn will provide more stability; better performance, better grip and most prominently increase the comfort of the car. To have the best output performance people seem to have sportier look. This certainly does mean that the cars are equipped with more additional parts such as front and rear spoilers, diffusers, VGs (vortex generators) ,air dams on the surface of the cars. Rear spoilers are used most widely in passenger cars. This aids in greater drag reduction and in the same occasion increases the stability of the car.[7]
2. ABOUT CFD Science of predicting fluid flow, heat and mass transfer
,chemical reactions, and related phenomenon is called as
Computational Fluid Dynaimcs(CFD) . The equations used

International Research Journal of Engineering and Technology (IRJET) e-ISSN: 2395 -0056
Volume: 04 Issue: 05 | May -2017 www.irjet.net p-ISSN: 2395-0072
© 2017, IRJET | Impact Factor value: 5.181 | ISO 9001:2008 Certified Journal | Page 974
ensure the conservation of mass, momentum , energy, etc.
CFD is used in the following stages of the design process:
Redesign Conceptual studies of new designs Detailed product development Troubleshooting
By reducing the total effort and cost required for
experimentation and data acquisition CFD Analysis
complements testing and experimentation. CFD is being used
im following areas and they are:
Automobile Aerospace Food Processing HVAC Marine Electronics
3. ADVANTAGES OF CFD CFD has changed from high level mathematics to an essential
tool in almost every branch of fluid mechanics as the
availability of high speed computer has become so easy. Now
CFD results can give more confident, consistent and more
reliable results. Some of the advantages are listed below
a) As compared to laboratory testing evaluation of geometric changes and answer “What if” questions can be solved in much less time and cost.
b) It has become almost mandatory in simulating conditions, where it is not possible to take detailed measurements such as high temperature or dangerous environment like in an oven.
c) It provides a detailed understanding of mass and heat transfer, particulate separation , flow distribution etc. So this provides a much better and deeper understanding of what is happening in a particular process or system to plant managers.[8]
Figure 1: The different disciplines contained within
computational fluid dynamics[9]
For the automotive and aerospace industries external aerodynamics simulation using CFD are well established tools in the development process. The technology of CFD simulation helps engineers to understand the physical phenomena taking place around the design and helps the engineers to optimize the performance with respect to certain criteria. In the automotive domain for example the aerodynamic forces i.e. lift, drag have strong impact on the vehicle fuel efficiency and handling behaviour. CFD can be leveraged to analyse this forces and determine an optimum design..[10].Navier–Stokes equations are the fundamental basis for almost all CFD problems.[11]
4. LITERATURE REVIEW Fluid Mechanics has a branch called “Aerodynamics” which
is concerned with the forces generated on a body in a flow
and thus the aerodynamics usually involves a lot of
calculation in various properties of the flow such as velocity,
pressure, temperature, density and even time [12]. The point
of difference in between the aerodynamics of passenger car
and aerodynamics of race car is that race cars aim to
increase the downforce while the passenger cars aim to
decrease the drag.[13]
The first car in wind tunnel was tested by the pioneers of
aerodynamics in cars named Edmund Rumpler and Viennese
.Drag of about 1/3rd of the contemporary vechiles was found
by them in car Trophenwagen. In the same period Paul
Jaray, an Austo-Hungarian designer well know for his
aerodynamic and streamline design of cars. He innovated the
smooth surfaces of the headlamps , cambered windshields
and body of the car. Big car manufacturing players like BMW,
Mercedes, Audi, Diamler-Benz (Dimitris, 2007)copied much
of his work.Streamline shape of cars generated a high drag
cofficient of around 0.4 so streamline shape was never a hit.
Some of the streamline designs still in use are like Porsche
911, Vokswagen Beetle.
Kammback cars became prominent in early 1970’s due to
crisis for petrol and inorder to increase efficieny. Concept of
aerodynamics in cars, which was the use of airfoils was
brought by Wunibald Kamm an aerodynaist from Germany.
He showed that the air foils with slight truncated tailing edge
have slightly lesser drag coefficient compared to completely
air foil shaped cars. Drastic change in the automobile shapes
from brick designs to rain drop and streamline shapes was
seen in post world war 2.
International Research Journal of Engineering and Technology (IRJET) e-ISSN: 2395 -0056
Volume: 04 Issue: 05 | May -2017 www.irjet.net p-ISSN: 2395-0072
© 2017, IRJET | Impact Factor value: 5.181 | ISO 9001:2008 Certified Journal | Page 975
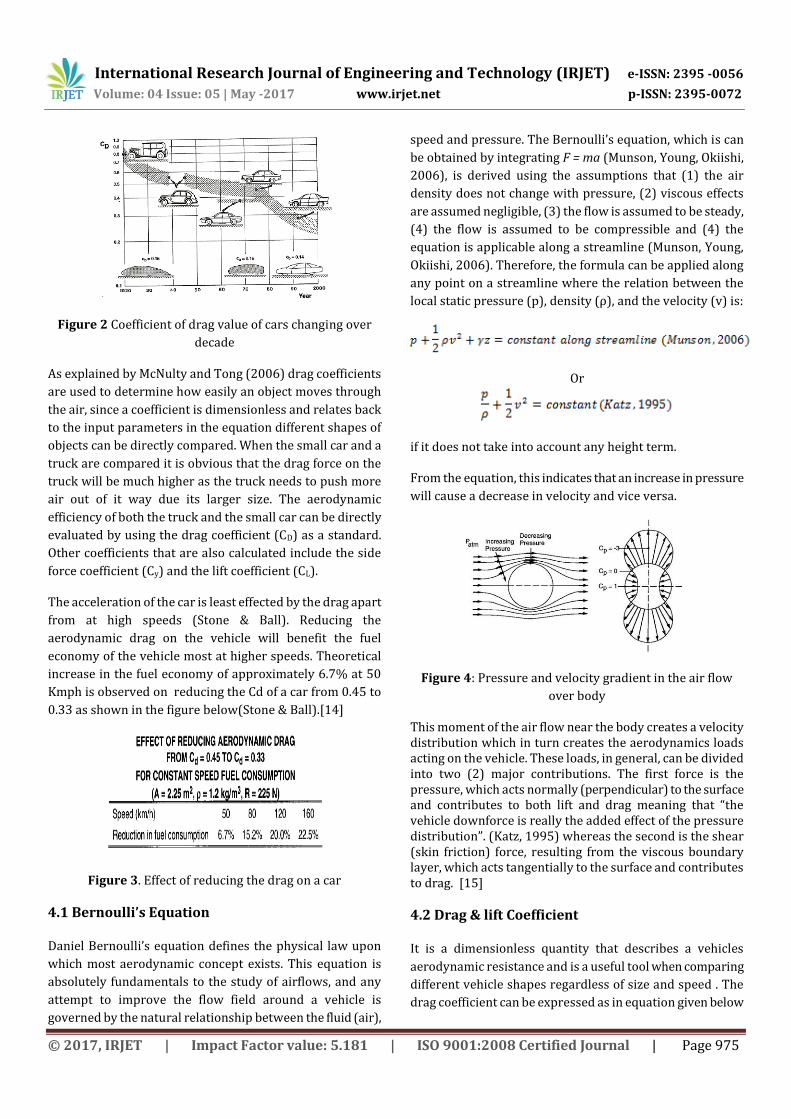
Figure 2 Coefficient of drag value of cars changing over
decade
As explained by McNulty and Tong (2006) drag coefficients
are used to determine how easily an object moves through
the air, since a coefficient is dimensionless and relates back
to the input parameters in the equation different shapes of
objects can be directly compared. When the small car and a
truck are compared it is obvious that the drag force on the
truck will be much higher as the truck needs to push more
air out of it way due its larger size. The aerodynamic
efficiency of both the truck and the small car can be directly
evaluated by using the drag coefficient (CD) as a standard.
Other coefficients that are also calculated include the side
force coefficient (Cy) and the lift coefficient (CL).
The acceleration of the car is least effected by the drag apart
from at high speeds (Stone & Ball). Reducing the
aerodynamic drag on the vehicle will benefit the fuel
economy of the vehicle most at higher speeds. Theoretical
increase in the fuel economy of approximately 6.7% at 50
Kmph is observed on reducing the Cd of a car from 0.45 to
0.33 as shown in the figure below(Stone & Ball).[14]
Figure 3. Effect of reducing the drag on a car
4.1 Bernoulli’s Equation Daniel Bernoulli’s equation defines the physical law upon
which most aerodynamic concept exists. This equation is
absolutely fundamentals to the study of airflows, and any
attempt to improve the flow field around a vehicle is
governed by the natural relationship between the fluid (air),
speed and pressure. The Bernoulli’s equation, which is can
be obtained by integrating F = ma (Munson, Young, Okiishi,
2006), is derived using the assumptions that (1) the air
density does not change with pressure, (2) viscous effects
are assumed negligible, (3) the flow is assumed to be steady,
(4) the flow is assumed to be compressible and (4) the
equation is applicable along a streamline (Munson, Young,
Okiishi, 2006). Therefore, the formula can be applied along
any point on a streamline where the relation between the
local static pressure (p), density (ρ), and the velocity (v) is:
Or
if it does not take into account any height term.
From the equation, this indicates that an increase in pressure
will cause a decrease in velocity and vice versa.
Figure 4: Pressure and velocity gradient in the air flow
over body
This moment of the air flow near the body creates a velocity distribution which in turn creates the aerodynamics loads acting on the vehicle. These loads, in general, can be divided into two (2) major contributions. The first force is the pressure, which acts normally (perpendicular) to the surface and contributes to both lift and drag meaning that “the vehicle downforce is really the added effect of the pressure distribution”. (Katz, 1995) whereas the second is the shear (skin friction) force, resulting from the viscous boundary layer, which acts tangentially to the surface and contributes to drag. [15]
4.2 Drag & lift Coefficient It is a dimensionless quantity that describes a vehicles
aerodynamic resistance and is a useful tool when comparing
different vehicle shapes regardless of size and speed . The
drag coefficient can be expressed as in equation given below

International Research Journal of Engineering and Technology (IRJET) e-ISSN: 2395 -0056
Volume: 04 Issue: 05 | May -2017 www.irjet.net p-ISSN: 2395-0072
© 2017, IRJET | Impact Factor value: 5.181 | ISO 9001:2008 Certified Journal | Page 976
.The drag coefficient can be divided into two components a
friction and form component [16]
Where ρ = air density , U = freestream velocity , FD = drag
force , A = frontal area
When air streams around a body there will be pressure
difference between the upper and lower part , if no
separation occurs in the flow field the air on the upper
surface will travel a longer path to reach the end of a vehicle .
This difference in travel length will create a diference in the
speed of the fluid , longer way to travel will give a higher
speed , and lower pressure . On a vehicle the pressure will be
lower on top of the vehicle and higher underneath it , this
gives the lifting force (FL). The lift coefficient is a
dimensionless coefficient that describes the lift generate on
the body and is expressed as:-
4.3 Spoiler Concept
An automobile rear boot has an aerodynamic device
attatched to it called a “spoiler” ,whose intended design
function is to ‘spoil’ unfavourable air movement across a
body of a vehicle of some kind in motion. Usually sedan type
cars such as NASCAR stock carsuses spoilers. These
aerodynamic aids produce down force by creating a "dam" at
the rear lip of the trunk. An improved vehicle stability is
created by decreasing lift or decreasing drag that may cause
unpredictable handling in a car at high speed. Spoilers are
often fitted to race and high performance sports car,
although they have become common on passenger vehicles
as well.
Rear spoilers provide the following advantages.
At very high speed in offers stability. Capability of the tyre to produce the required force is
increased. Braking performance increases Better traction generating fuel efficiency
Figure 5 Different types of spoilers available in market.
In Kelbessa Kenea Deressa research work the spoiler base
curve was modelled in sketcher module of CATIA by taking
the vehicle roof surface as reference. The dimensions of
spoiler base curve were plotted according to the geometry of
the vehicle and by taking reference from some journals.
These curves were plotted over the roof surface of Bolero
vehicle using splines and providing sufficient tension to the
curves.[17]. By increasing the pressure in the base area and
reducing the base area the drag at the SUV base can be
reduced.[18]. In Formula 1 season of 2010 McLaren
Engineers developed an ingenious device, called RW80, for
the MP4/25 car. Estimation was done that with this device,
the system would be able to increase the car’s top speed by 6
to 10 Kmph . This device got its nickname “F-Duct”.[19]
Figure: 6 Surface modelling of spoiler
The lift coefficient can be altered drastically in case of
“wings” based only on its orientation with respect to the
oncoming flow. Wing orientation is described by an angle
called as the angle of attack (alpha) and more specifically, it
describes the angle between the chord line of a wing and the
direction of the oncoming flow. A pictorial representation

International Research Journal of Engineering and Technology (IRJET) e-ISSN: 2395 -0056
Volume: 04 Issue: 05 | May -2017 www.irjet.net p-ISSN: 2395-0072
© 2017, IRJET | Impact Factor value: 5.181 | ISO 9001:2008 Certified Journal | Page 977
can be found in fig. 7 below[20] .The type of drag produced
in a wake region is determined by the angle of attack and the
shape of the body. As an instance, an airfoil is considered as a
body with a small angle of attack by the fluid flowing over it.
This means that it has attached boundary layers, which
produce less pressure drag on airfoil.[21]. The control of the
3D behavior exhibited behind the car due to wake is very
difficult to control since it offers unsteadiness and
sensititvity to the car geometry.[22]
Figure 7. Diagram describing angle of attack.
The aerodynamic fairings(a structure used to reduce drag
and improve appearance) have notable impact on
aerodynamic drag. 17% of drag can be reduced by external
device front fairing alone can. More drag reduction up to
26% may be possible using various combinations of
aerodynamic fairings in different parts of the truck body.[16]
Pressure drag is the most dominant drag in case of heavy
tractor-trailer combinations. The reason being large area of
the front portion of the truck available for resistance for the
in-coming air. Also large wakes originating from the blunt
back end of the trailer. The drag which accounts for the
resistance from side and top portion of the trailers is the
frictional drag. But contribution of frictional drag in the
overall drag is minimum.[24]
Figure 8 Variatiom of pressure coefficient along (a)Angle
of application (b) with spoiler height
5. METHODOLOGY
CFD analysis basically involves three major tasks called Pre-
Processing, Solving and Post Processing.
Pre-Processing: We need to do some processes before the
numerical solution which is called as pre-processing. It
includes defining the problem, creating its 3D model,
meshing, and applying physical operating condition called
boundary conditions. A fluid volume which encompasses a
vehicle is created in order to simulate the air flow around the
vehicle. This is done by creating an enclosure around the
vehicle and subtracting the vehicle body by using Boolean
command in ANSYS. This enclosure acts as the air domain.
To reduce the overall computational cost and time, the
vehicle was considered symmetric laterally.[25]
V.Vasudevan in his work created the models of vehicle and two different spoilers which was further 3D printed using the software called SolidWorks to CAD format for numerical analysis. Then after, this model has been analysed for drag coefficient and forces under the AUTODESK Flow design module and values of drag coefficient, lift coefficient. [26]

International Research Journal of Engineering and Technology (IRJET) e-ISSN: 2395 -0056
Volume: 04 Issue: 05 | May -2017 www.irjet.net p-ISSN: 2395-0072
© 2017, IRJET | Impact Factor value: 5.181 | ISO 9001:2008 Certified Journal | Page 978
Figure 9. Enclosure Dimensions
Figure 10. Inflation Meshing
Figure 11. Meshing Satyan Chandra, Allison Lee, Steven Gorrell completed meshing in three steps: capsuling the car using the Star CCM+ Surface Wrapper tool; creating a surface mesh; and creating a volume mesh that included boundary layers.[27]
R. B. Sharma, Ram Bansal created tetrahedron mesh on cars
surface and a surface mesh of 1.5mm size is created on the
vehicle surface.[28]
Processing: Processing involves solving mathematical
equations of fluid flow until inacceptable convergence is
achieved. Usually it requires the computer to solve many
thousands of equations and might take few hrs. to few days.
Post-processing: The post processor is the last phase of the CFD process which involves data visualization and results analysis of the CFD process. This phase uses the versatile data visualization tools of the CFD solver to observe the following results of the simulation:
1. Vector plots 2. Line and shaded contour plots 3. 2D and 3D surface plots 4. XY plots and graphs of results 5. Domain geometry and Grid display 6. Particle tracking
5.1 Boundary Conditions
Adarsh P with his group used the RANS k-ϵ turbulence model
for the analysis. The air was assumed to be incompressible
and steady ,as the Mach number under consideration was
less than 0.3. Standard wall functions are assumed during
this analysis.[29]
5.2 Velocity Inlet Boundary Conditions
It is used to define the flow velocity, along with all relevant
scalar properties of the flow, at flow inlets. The static
properties of the flow are not constant, so they will rise to
whatever value is necessary to get the required velocity
distribution. Sharath Kumar S N in his research solved the
problem using ANSYS Fluent for both sedan and hatchback
car models at 4 different velocities 10m/s, 15 m/s, 20m/s,
25 m/s . At first he went for 7000 iterations at a particular
velocity. Since there were no appreciable changes in the
residue values above 2000 iterations, all the other flow
problems were made to run for 2000 iterations, thereby
reducing computational time. Fig. 12 shows the convergence
plot for Sedan car model at 20 m/s. Convergence absolute
criteria for scaled residues was set to 10-6. As the scaled
residues for all the parameters are less than 10-6 it can be
said that solution is converged.[30]

International Research Journal of Engineering and Technology (IRJET) e-ISSN: 2395 -0056
Volume: 04 Issue: 05 | May -2017 www.irjet.net p-ISSN: 2395-0072
© 2017, IRJET | Impact Factor value: 5.181 | ISO 9001:2008 Certified Journal | Page 979
Figure. 12: Convergence Plot for Sedan Car Model
Specification of a static (gauge) pressure is required for the
pressure outlet boundary condition. The value of static
pressure specified is used only while the flow is
subsonic.The specified pressure is no longer used if the flow
becomes locally supersonic. The default values of pressure
outlet boundary conditions in FLUENT are given in Table 1.
Also on the two walls of the domain under consideration no
slip boundary conditions are specified and the body is
considered to be stationary.
Table 1. Outlet Boundary Conditions
Figure 13 and 15 shows the velocity contours for the sedan
car and jeep without spoilers Maximum Coefficient of drag
Value obtained for sedan car was0.5225 and for jeep
Coefficient of drag value was about 0.72.
Figure 13. Velocity contours for sedan car without
spoilers
Figure 14. Pressure contours for sedan car without
spoilers
In fig 14 two positive pressure areas can be found: one is at
the front of the vehicle body, and the other is between the
hood and the windshield. At the same time, high negative
pressure areas can be found at the front and rear end of the
roof and a small area at the front end of the hood; as the
pressure coefficient increases to more than definite value the
flow accelerates over the bonnet and due to this acceleration
the pressure drops and becomes negative.[31]
Figure 15. Velocity contours for jeep without spoiler
Naveen Kumar, K. Lalit Narayan did the analysis on the
sedan cars by applying 2 different types of spoilers and
compared the results with the car without the spoilers at the
inlet velocity of 70km/hr whose results are as follows:

International Research Journal of Engineering and Technology (IRJET) e-ISSN: 2395 -0056
Volume: 04 Issue: 05 | May -2017 www.irjet.net p-ISSN: 2395-0072
© 2017, IRJET | Impact Factor value: 5.181 | ISO 9001:2008 Certified Journal | Page 980
S. No.
Name
Velocity(Km/hr)
Drag Force(N)
Lift Force(N)
CD CL
1 Car Without Spoiler
70 153.86
51.109
0.329
0.1183
2 Car with Spoiler 1
70 147.431
49.646
0.3326
0.112
3 Car With Spoiler 2
70 144.062
49.867
0.325
0.1125
Table 2. Comparison of Data
Advantages of using spoiler2:
Increases tires capability to produce cornering force Stabilizes vehicles at high speed Improves braking performance Gives better traction
6. LIMITATION OF USING SPOILER
1) Spoilers tend to be quite expensive. 2) It is difficult to install and it can involve some
permanent changes in car . 3) Spoilers are usually made of fiberglass, ABS plastic,
silicon, or carbon fiber which can’t take beating so they suffer the lack of durability.
4) Locating the exact lip spoiler for specific car is rarely an easy task. Even if one is lucky enough to find a lip spoiler that they may think is going to fit, there is always a chance that something might go wrong.
7.SCOPE OF FUTURE WORK
This work can performed on different car models, building
shapes, aero plane models etc, with different helical angles
300, 600, 900, 1800, 3600. This can be performed on the
building shapes with square, taper square, helical, pentagon,
hexagon etc. with different velocities like 5m/s, 10m/s,
12m/s, 30m/s. And at different angles like 120, 250, 300, 450,
600 etc, to the flow direction And Also by locating pressure
ports at different heights on model surfaces.
Although this review focussed on the Drag force reduction
using spoilers but their can be more things on which one can
work upon. The drag force reduction using other add on
devices like front spoilers , diffuser, vortex generators etc
can be also done . Jaspinder Singh1 in his study told that the
with an optimized body shape and without any additional
devices an aerodynamic drag can be reduced .[32]
8. CONCLUSION
This review mainly focussed on the comparison of drag
forces in sedan and jeep and was concluded that jeep has
much larger drag value than sedan .Different types of car in
sedan class use rear trunk spoilers so review also focusses
on the application of different types of spoilers and
comparing the drag forces on application of different
spoilers. By talking about the values of drag and velocities of
models like opel astra, Honda city, Hyundai Santro, Hyundai
Accent, G Radha Krishna concluded that Honda city model is
with good aero dynamical shape and has the least
aerodynamic drag.[33] The coefficient of drag exhibits
negligible variation with respect to velocity, while it has a
considerable variation with the change in the shape of the
body.
REFERENCES [1] Shashank Arya, Pankaj Goud, Shubham Mathur, Vishal
Sharma, Sourabh Tripathi, Vishal Shukla, International
Research Journal of Engineering and Technology (IRJET)
Volume: 03 Issue: 11 Nov -2016
[2] Mohd Nizam Sudin, Mohd Azman Abdullah, Shamsul
Anuar Shamsuddin, Faiz Redza Ramli, Musthafah Mohd
Tahir,” Review of Research on Vehicle Aerodynamic
Drag Reduction Methods”, International Jouranal of
Mechanical & Mechatronics Engineering IJMME-IJENS
VOL:14 NO:02.
[3] Ram Bansal and RB Sharma, Journal of Aerodynamics
Volume 2014 (2014).
[4] Bhagirathsinh H Zala, Harilal S Sorathia, Dinesh L.
Suthar, Vashant K. Pipalia International Journal of
Advanced Engineering Technology Vol. VI/Issue I/Jan.-
March,2015
[5] P Ramya,A Hemanth Kumar, Jaswanth Moturi ,
N.Ramanaiah ,International Journal of Engineering
Trends and Technology (IJETT) – Volume 29 Number 4 -
November 2015
[6] P.N.Selvaraju, Dr.K.M.Parammasivam, Shankar,
Dr.G.Devaradjane ,Journal of Chemical and
Pharmaceutical Sciences ,Issue 7: 2015

International Research Journal of Engineering and Technology (IRJET) e-ISSN: 2395 -0056
Volume: 04 Issue: 05 | May -2017 www.irjet.net p-ISSN: 2395-0072
© 2017, IRJET | Impact Factor value: 5.181 | ISO 9001:2008 Certified Journal | Page 981
[7] Dibyajyoti Laha, Computational aerodynamic analysis of
a rear spoiler on a car in two dimensions, Anglia Ruskin
University
[8] N. Bhagat ,Shashi Kant and Amit Tiwari International
Journal of Mechanical Engineering and Technology
(IJMET) Volume 7, Issue 2, March-April 2016
[9] V. Naveen Kumar, K. Lalit Narayan, L. N. V. Narasimha
Rao and Y. Sri Ram, International Journal of Advances in
Scientific Research VOL 01 ISSUE 08,2015
[10] Gavin Dias, Nisha R. Tiwari, Joju John Varghese, Graham
Koyeerath IOSR Journal of Mechanical and Civil
Engineering Volume 13, Issue 3 2016
[11] Ms.SujataShenkar, Mr. Sanjay D. Nikhade
Mr.Sagarkumar Banerjee, Mr.AmarjeetKunal, Mr.
Santosh Mote, Mr. Mustufa Sadikot, International Journal
of Engineering Science Invention Volume 5 Issue 11
November 2016
[12] Raguvaran A/L Jayahkudy, An Aerodynamic study on
MPV spoiler, University Teknilal, Malaysia Melaka
[13] Nathan Pandian, , A review of engineering in everyday
life, Volume XVII Issue III, April 22, 2017
[14] Johan Basson, Research Project, University of Southern
Queensland Faculty of Health, Engineering & Sciences,
October 2013
[15] Ridhwan Bin Che Zake, Research Project, University
Malaysia Pahang, November 2008
[16] Johan Levin , Rikard Rigdal, Division Of Vehicle
Engineering and Autonomous Systems, Chalmers
University Of Technology, Goteborg, Sweden 2011
[17] Kelbessa Kenea Deressa, Kiran Kumar Sureddy,
International Research Journal of Engineering and
Technology (IRJET) Volume: 03 Issue: 06 June-2016
[18] Pramod Nari Krishnani, Thesis, B.S., Mumbai University,
Mumbai, India 2006
[19] Vishal Vinod Raul, Research Work, Wichita State
university , December 2013
[20] T. Ragavan , S. Palanikumar, D. Anastraj, R. Arulalagan,
Journal of Basic and Applied Engineering Research
Volume 1, Number 4; October, 2014
[21] Datta Kisan Wakshe, G.N. Thokal International Journal of
Advanced Research in Education & Technology (IJARET)
Vol. 3, Issue 1 (Jan. - Mar. 2016)
[22] Laurent Dumas Universit´e Pierre et Marie Curie
Laboratoire Jacques-Louis Lions4, place Jussieu, 75230
Paris Cedex 05
[23] Sanat M. Gameti,Prof. H. P. Patel,Musa Jacob Khatri,Prof.
P. D. Patel, IJSRD - International Journal for Scientific
Research & Development| Vol. 3, Issue 12, 2016
[24] Rishabh S. Singh ,International Journal of Latest Trends
in Engineering and Technology (IJLTET) Vol. 6 Issue 2
November 2015
[25] Akshay Parab Ammar Sakarwala Bhushan Paste Vaibhav
Patil Amol Mangrulkar International Journal on Recent
Technologies in Mechanical and Electrical Engineering
(IJRMEE),Volume: 1 Issue: 4
[26] G Ganesh, V Vasudevan, International Journal of
Scientific & Engineering Research, Volume 6, Issue 6,
June-2015
[27] Satyan Chandra, Allison Lee, Steven Gorrell and C. Greg
Jensen Brigham Young University, Computer-Aided
Design & Applications, PACE (1), 2011
[28] R. B. Sharma, Ram Bansal, IOSR Journal of Mechanical
and Civil Engineering (IOSR-JMCE) Volume 7, Issue 5
(Jul. - Aug. 2013)
[29] ADARSH P, ANDREW GEORGE CHERIAN, ARUN K S, D
ROSHAN KUMAR International Journal of Mechanical
And Production Engineering, Volume- 2, Issue- 4, April-
2014
[30] Sharath Kumar S N, Dr. C. K. Umesh IJRMET Vol. 6, Issue
1, Nov 2015-Apri l 2016
[31] Xu-xia Hu, Eric T.T. Wong International Scholarly and
Scientific Research & Innovation 5(9) 2011
[32] Jaspinder Singh, Jagjit Singh Randhawa International
Journal of Science and Research (IJSR) Volume 3 Issue 6,
June 2014
[33] G. Radha Krishna, K.Vishnu Vardhan, K.Ravi Teja, B.Sai
Krishna, I.Praveen International Journal of Engineering
Science and Computing, May 2016
BIOGRAPHIES
Shashi Kant received his graduate degree B.Tech (Mechanical Engineering) from UCER,Greater Noida (UPTU Lucknow) in the Year 2014 and pursuing post graduate degree M.Tech (Computer Aided Design) from Noida Institute of Engineering and Technology, Greater Noida (Dr. A.P.J. Abdul Kalam Technical University, Lucknow). He is certified Solidworks Professional and Associate by Dassault Systemes.
International Research Journal of Engineering and Technology (IRJET) e-ISSN: 2395 -0056
Volume: 04 Issue: 05 | May -2017 www.irjet.net p-ISSN: 2395-0072
© 2017, IRJET | Impact Factor value: 5.181 | ISO 9001:2008 Certified Journal | Page 982
He is AutoCAD certified professional by AutoDesk. He has 2.5 years experience of service in LeLogix Design Solutions Pvt. Ltd. Greater Noida as Senior Design Engineer. He has taught a number of designing softwares of Mechanical and Civil Engineering at LeLogix CAD Training Centre, Greater Noida. He has published four research papers in International Journals with good impact factor. He has very good experience on FEA Software (Ansys).
Desh Deepak Srivastava is currently pursuing his B.Tech (Mechanical Engineering) from IMS Engineering College, Ghaziabad batch 2013-2017. He has a good knowledge of the several designing software of Mechanical Engineering. He is also a member of SAE India collegiate club . He has experience of internship in some reputed companies.
Rishabh Shanker is currently pursuing his Btech in Mechanical Engineering from IMS Engineering College , Ghaziabad batch 2013-2017 . He is a member of SAE India Collegiate club and he is well equipped with several designing softwares related to Mechanical Engineering.