a review on fundamentals and applications of electrophoretic
TRANSCRIPT

Progress in Materials Science 52 (2007) 1–61
www.elsevier.com/locate/pmatsci
A review on fundamentals and applicationsof electrophoretic deposition (EPD)
Laxmidhar Besra a,*, Meilin Liu b
a Colloids and Materials Chemistry Group, Regional Research Laboratory (Council of Scientific and
Industrial Research), Bhubaneswar 751013, Orissa, Indiab School of Materials Science and Engineering, Georgia Institute of Technology,
771 Ferst Drive, Atlanta, GA 30332-0245, USA
Received 10 January 2006; accepted 5 July 2006
Abstract
This review encompasses the fundamental aspects of electrophoretic deposition technique, factorsinfluencing the deposition process, kinetic aspects, types of EPD, the driving forces, preparation ofelectrophoretic suspension, stability and control of suspension, mechanisms involved in EPD, mul-ticomponent/composite deposition, drying of deposits obtained by EPD. Numerous applicationsincluding coatings, nanoscale assembly, micropatterned thin films, near shape ceramics and glasses,solid oxide fuel cells, laminated or graded materials, hybrid materials, infiltration in porous andwoven fibre preforms for preparation of fibre reinforced ceramic matrix composites, etc. have beendescribed. The use of mathematical modeling including kinetic equations for deposit formation andvolumetric particle concentration in the suspension, together with brief description of discrete ele-ment modeling of EPD process is presented.� 2006 Elsevier Ltd. All rights reserved.
Contents
1. Introduction . . . . . . . . . . . . . . . . . . . . . . . . . . . . . . . . . . . . . . . . . . . . . . . . . . . . . . 32. Electrophoretic deposition – definition . . . . . . . . . . . . . . . . . . . . . . . . . . . . . . . . . . . . 33. Factors influencing EPD. . . . . . . . . . . . . . . . . . . . . . . . . . . . . . . . . . . . . . . . . . . . . . 5
0079-6425/$ - see front matter � 2006 Elsevier Ltd. All rights reserved.
doi:10.1016/j.pmatsci.2006.07.001
* Corresponding author. Tel.: +91 674 481 635; fax: +91 674 581 637.E-mail address: [email protected] (L. Besra).

1
2 L. Besra, M. Liu / Progress in Materials Science 52 (2007) 1–61
3.1. Parameters related to the suspension . . . . . . . . . . . . . . . . . . . . . . . . . . . . . . 6
3.1.1. Particle size . . . . . . . . . . . . . . . . . . . . . . . . . . . . . . . . . . . . . . . . . . . . . . 63.1.2. Dielectric constant of liquid . . . . . . . . . . . . . . . . . . . . . . . . . . . . . . . . . . 73.1.3. Conductivity of suspension. . . . . . . . . . . . . . . . . . . . . . . . . . . . . . . . . . . 83.1.4. Viscosity of suspension. . . . . . . . . . . . . . . . . . . . . . . . . . . . . . . . . . . . . . 83.1.5. Zeta potential . . . . . . . . . . . . . . . . . . . . . . . . . . . . . . . . . . . . . . . . . . . . 83.1.6. Stability of suspension . . . . . . . . . . . . . . . . . . . . . . . . . . . . . . . . . . . . . . . 103.2. Parameters related to the process . . . . . . . . . . . . . . . . . . . . . . . . . . . . . . . . . . . 10
3.2.1. Effect of deposition time . . . . . . . . . . . . . . . . . . . . . . . . . . . . . . . . . . . . . 103.2.2. Applied voltage . . . . . . . . . . . . . . . . . . . . . . . . . . . . . . . . . . . . . . . . . . . . 113.2.3. Concentration of solid in suspension . . . . . . . . . . . . . . . . . . . . . . . . . . . . 133.2.4. Conductivity of substrate . . . . . . . . . . . . . . . . . . . . . . . . . . . . . . . . . . . . . 134. Kinetics of electrophoretic deposition. . . . . . . . . . . . . . . . . . . . . . . . . . . . . . . . . . . . . . . 145. Role of polymer binders in EPD . . . . . . . . . . . . . . . . . . . . . . . . . . . . . . . . . . . . . . . . . . 156. Importance of powder washing before EPD . . . . . . . . . . . . . . . . . . . . . . . . . . . . . . . . . . 167. Practical considerations . . . . . . . . . . . . . . . . . . . . . . . . . . . . . . . . . . . . . . . . . . . . . . . . . 178. Water-based EPD . . . . . . . . . . . . . . . . . . . . . . . . . . . . . . . . . . . . . . . . . . . . . . . . . . . . . 179. Non-aqueous EPD. . . . . . . . . . . . . . . . . . . . . . . . . . . . . . . . . . . . . . . . . . . . . . . . . . . . . 19
10. Charge development on powder surface in suspension . . . . . . . . . . . . . . . . . . . . . . . . . . 19
10.1. Aqueous suspension . . . . . . . . . . . . . . . . . . . . . . . . . . . . . . . . . . . . . . . . . . . . 1910.2. Non-aqueous suspension . . . . . . . . . . . . . . . . . . . . . . . . . . . . . . . . . . . . . . . . 2011. Properties of suspension for EPD . . . . . . . . . . . . . . . . . . . . . . . . . . . . . . . . . . . . . . . . . 21
11.1. The electrical double layer and electrophoretic mobility. . . . . . . . . . . . . . . . . . . 2111.2. DLVO theory and suspension stability. . . . . . . . . . . . . . . . . . . . . . . . . . . . . . . 242. Mechanism of EPD process . . . . . . . . . . . . . . . . . . . . . . . . . . . . . . . . . . . . . . . . . . . . . 27
12.1. Flocculation by particle accumulation . . . . . . . . . . . . . . . . . . . . . . . . . . . . . . . 2812.2. Particle charge neutralization mechanism. . . . . . . . . . . . . . . . . . . . . . . . . . . . . 2812.3. Electrochemical particle coagulation mechanism. . . . . . . . . . . . . . . . . . . . . . . . 2812.4. Electrical double layer (EDL) distortion and thinning mechanism . . . . . . . . . . . 2913. Multi-component deposition . . . . . . . . . . . . . . . . . . . . . . . . . . . . . . . . . . . . . . . . . . . . 30
14. Drying of deposits produced by EPD. . . . . . . . . . . . . . . . . . . . . . . . . . . . . . . . . . . . . . 32
15. Design of electrophoretic apparatus . . . . . . . . . . . . . . . . . . . . . . . . . . . . . . . . . . . . . . . 34
16. Deposition on non-conducting substrates . . . . . . . . . . . . . . . . . . . . . . . . . . . . . . . . . . . 34
17. Application of EPD . . . . . . . . . . . . . . . . . . . . . . . . . . . . . . . . . . . . . . . . . . . . . . . . . . 36
17.1. Assembly of nanoscale particles into nanostructures and micropatterned thinfilms. . . . . . . . . . . . . . . . . . . . . . . . . . . . . . . . . . . . . . . . . . . . . . . . . . . . . . . 3617.2. Near shape manufacturing of complex-shaped glasses and ceramics . . . . . . . . . . 4117.3. Solid oxide fuel cell (SOFC) fabrication. . . . . . . . . . . . . . . . . . . . . . . . . . . . . . 4317.4. Laminated materials . . . . . . . . . . . . . . . . . . . . . . . . . . . . . . . . . . . . . . . . . . . 4717.5. Functionally graded materials. . . . . . . . . . . . . . . . . . . . . . . . . . . . . . . . . . . . . 4817.6. Hybrid materials . . . . . . . . . . . . . . . . . . . . . . . . . . . . . . . . . . . . . . . . . . . . . . 4917.7. Fibre reinforced ceramic matrix composites . . . . . . . . . . . . . . . . . . . . . . . . . . . 50
18. Modeling of EPD process . . . . . . . . . . . . . . . . . . . . . . . . . . . . . . . . . . . . . . . . . . . . . . 51
19. Concluding remarks . . . . . . . . . . . . . . . . . . . . . . . . . . . . . . . . . . . . . . . . . . . . . . . . . . 54Acknowledgements . . . . . . . . . . . . . . . . . . . . . . . . . . . . . . . . . . . . . . . . . . . . . . . . . . . . 54References . . . . . . . . . . . . . . . . . . . . . . . . . . . . . . . . . . . . . . . . . . . . . . . . . . . . . . . . . . . 54

L. Besra, M. Liu / Progress in Materials Science 52 (2007) 1–61 3
1. Introduction
The electrophoretic deposition (EPD) technique with a wide range of novel applicationsin the processing of advanced ceramic materials and coatings, has recently gained increas-ing interest both in academia and industrial sector not only because of the high versatilityof its use with different materials and their combinations but also because of its cost-effec-tiveness requiring simple apparatus. Electrophoretic deposition (EPD) has been knownsince 1808 when the Russian scientist Ruess observed an electric field induced movementof clay particles in water. But the first practical use of the techniques occurred in 1933when the deposition of thoria particles on a platinum cathode as an emitter for electrontube application was patented in USA. Although the basic phenomena involved in EPDare well known and have been the subject of extensive theoretical and experimentalresearch, the EPD of ceramics was first studied by Hamaker [1], and only in the 1980sdid the process receive attention in the field of advanced ceramics. There is general agree-ment in the scientific community that further R&D work needs to be done to develop afull, quantitative understanding of the fundamental mechanisms of EPD to optimise theworking parameters for a broader use of EPD in materials processing. This paper presentsa review of electrophoretic deposition and its application in various fields of processing.
2. Electrophoretic deposition – definition
Electrophoretic deposition (EPD) is one of the colloidal processes in ceramic produc-tion and has advantages of short formation time, needs simple apparatus, little restrictionof the shape of substrate, no requirement for binder burnout as the green coating containsfew or no organics. Compared to other advanced shaping techniques, the EPD process isvery versatile since it can be modified easily for a specific application. For example, depo-sition can be made on flat, cylindrical or any other shaped substrate with only minorchange in electrode design and positioning. In particular, despite being a wet process,EPD offers easy control of the thickness and morphology of a deposited film throughsimple adjustment of the deposition time and applied potential. In EPD, charged powderparticles, dispersed or suspended in a liquid medium are attracted and deposited onto aconductive substrate of opposite charge on application of a DC electric field. The term‘electrodeposition’ is often used somewhat ambiguously to refer to either electroplatingor electrophoretic deposition, although it more usually refers to the former. Table 1presents the distinction between the two processes [2].
The basic difference between an electrophoretic deposition process (EPD) and an electro-lytic deposition process (ELD) is that the former is based on the suspension of particles in asolvent whereas the later is based on solution of salts, i.e., ionic species [3]. There can be twotypes of electrophoretic deposition depending on which electrode the deposition occurs.When the particles are positively charged, the deposition happens on the cathode and the pro-cess is called cathodic electrophoretic deposition. The deposition of negatively charged par-ticles on positive electrode (anode) is termed as anodic electrophoretic deposition. By suitablemodification of the surface charge on the particles, any of the two mode of deposition is pos-sible. Fig. 1 presents a schematic illustration of the two electrophoretic deposition process.
With regard to technological application the potential of electrophoretic deposition(EPD) as a materials processing technique is being increasingly recognised by scientistsand technologists. In addition to its conventional applications in fabrication of wear

Table 1Characteristics of electrodeposition techniques [2]
Property Electroplating Electrophoretic deposition
Moving species Ions Solid particlesCharge transfer on deposition Ion reduction NoneRequired conductance of liquid medium High LowPreferred liquid Water Organic
Fig. 1. Schematic illustration of electrophoretic deposition process. (a) Cathodic EPD and (b) anodic EPD.
4 L. Besra, M. Liu / Progress in Materials Science 52 (2007) 1–61
resistant and anti-oxidant ceramic coatings, fabrication of functional films for advancedmicroelectronic devices and solid oxide fuel cells as well as in the development of novelcomposites or bioactive coatings for medical implants, there has been increased interestfor its application in nanoscale assembly for advanced functional materials [4]. Electropho-retic deposition also offers important advantages in the deposition of complex compoundsand ceramic laminates. The degree of stoichiometry in the electrophoretic deposit is con-trolled by the degree of stoichiometry in the powder used. According to Sarkar and Nich-olson [5], particle/electrode reactions are not involved in EPD, and ceramic particles do notlose their charge on being deposited which can be shown from the observation that reversalof the electric field will strip of the deposited layer [6]. Therefore, it is important to use sim-ilarly charged particles and similar solvent–binder–dispersant systems for gaining bettercontrol of layer thickness. The principal driving force for electrophoretic deposition(EPD) is the charge on the particle and the electrophoretic mobility of the particles inthe solvent under the influence of an applied electric field. The EPD technique has beenused successfully for thick film of silica [7], nanosize zeolite membrane [8], hydroxyapatitecoating on metal substrate for biomedical applications [9,10], luminescent materials [11–13], high-Tc superconducting films [14,15], gas diffusion electrodes and sensors [16,17],multi-layer composites [18], glass and ceramic matrix composites by infiltration of ceramicparticles onto fibre fabrics [19], oxide nanorods [20], carbon nanotube film [21], functionallygraded ceramics [22,23], layered ceramics [24], superconductors [25,26], piezoelectric mate-rials [27], etc. Indeed, the only intrinsic disadvantages of EPD, compared with other colloi-dal processes (e.g. dip and slurry coating), is that it cannot use water as the liquid medium,because the application of a voltage to water causes the evolution of hydrogen and oxygengases at the electrodes which could adversely affect the quality of the deposits formed. How-ever, given the numerous non-aqueous solvents that are available, this limitation is minor.

L. Besra, M. Liu / Progress in Materials Science 52 (2007) 1–61 5
3. Factors influencing EPD
The mechanism of EPD involve charged particles in a suspension being deposited ontoan electrode under the influence of an applied electric field. Two groups of parametersdetermine the characteristics of this process; (i) those related to the suspension, and (ii)those related to the process including the physical parameters such as the electrical natureof the electrodes, the electrical conditions (voltage/intensity relationship, deposition time,etc.).
For the EPD of particles, part of the current should be carried not only by the chargedparticles but by free ions co-existing in the suspension. Therefore the amount of depositedparticle is not simply related to the current. However, the current carried by the free ionscould be ignored when the amount of free ions is negligible. Indeed the amount of free ionsis generally small in organic suspensions such as ketones. On the other hand, it is believedthat the accumulation of anionic and cationic charge at the electrodes during electropho-resis suppresses the subsequent deposition rate. However the effect of accumulated ions arenegligible in the initial period.
The first attempt to correlate the amount of particles deposited during EPD with differ-ent influencing parameters was described by Hamaker [1] and Avgustnik et al. [28]Hamakers law relates the deposit yield (w) to the electric field strength (E), the electropho-retic mobility (l), the surface area of the electrode (A), and the particle mass concentrationin the suspension (C) through the following equation:
w ¼Z t2
t1
l � E � A � C � dt ð1Þ
Avgustinik’s law is based upon cylindrical, coaxial, electrodes and the electrophoreticmobility has been expanded and is represented in terms of permittivity (e), the zeta poten-tial (n), and the viscosity of the suspension (g)
w ¼ l � E � e � n � C � t3 lnða=bÞ � g ð2Þ
where l and a are the length and radius of the deposition electrode, respectively, b is theradius of the coaxial counter electrode (b > a).
Biesheuval and Verweij [29] improved upon these classical equations and developedmore complex model of the deposition process by considering the presence of three distinctphases namely (i) a solid phase (the deposit), (ii) a suspension phase, and (iii) a phase con-taining little or no solid particles. The deposit phase and the particle-free liquid phase bothgrow at the expense of the suspension phase. By considering the movement of the bound-ary between the deposit and the suspension phase with time along with the continuityequation and expression for velocity of particles in the suspension, Biesheuval and Verweij[29] derived the following equation based on that of Avgustinik et al. [28]:
w ¼ 2 � p � l � l � E � Cd
lnða=bÞ � /s
/d � /s
� t ð3Þ
where /s and /d are the volumetric concentration of particles in suspension and deposit,respectively, Cd is the mass concentration of particles in the deposit, l is the electropho-retic mobility (= en/6pg).

6 L. Besra, M. Liu / Progress in Materials Science 52 (2007) 1–61
Ishihara et al. [30] and Chen and Liu [31] used the following equation for the weight (w)of charged particles deposited per unit area of electrode in the initial period, ignoring thecharge carried by the free ions
w ¼ 2
3C � e0 � er � n �
1
g
� �� E
L
� �� t ð4Þ
where C is the concentration of the particle, e0 is the permittivity of vacuum, er is the rel-ative permittivity of the solvent, n is the zeta potential of the particles, g is the viscosity ofthe solvent, E is the applied potential, L is the distance between the electrodes, and t is thedeposition time. The above equations, often termed as Hamaker equation, suggests thatthe deposition weight of the charged particles under ideal electrophoretic depositiondepends on the above parameters. However, if the solvent, the particles, and the apparatusfor EPD are fixed, the factors n, er, g and L in the above equation are constant. Conse-quently, the weight of the deposited particles (w) in the EPD method is a function of E,t and C. Therefore, the mass of the deposited particles, namely, the thickness of the filmscan be readily controlled by the concentration of the suspension, applied potential, anddeposition time in the EPD method.
3.1. Parameters related to the suspension
Regarding the suspension properties, many parameters must be considered, such as thephysicochemical nature of both suspended particle and the liquid medium, surface prop-erties of the powder, and the influence of the type and concentration of the additives,mainly dispersants.
3.1.1. Particle size
Although there is no general thumb rule to specify particle sizes suitable for electropho-retic deposition, good deposition for a variety of ceramic and clay systems have beenreported to occur in the range of 1–20 lm [2]. But this does not necessarily mean thatdeposition of particles outside this size range is not feasible. Recently, with increasingthrust on nanostructured materials, the EPD technique is being viewed with more interestfor assembly of nanoparticles, and will be discussed in more detail in later section. It isimportant that the particles remain completely dispersed and stable for homogeneousand smooth deposition. For larger particles, the main problem is that they tend to settledue to gravity. Ideally, the mobility of particles due to electrophoresis must be higher thanthat due to gravity. It is difficult to get uniform deposition from sedimenting suspension oflarge particles. Electrophoretic deposition from settling suspension will lead to gradient indeposition, i.e., thinner above and thicker deposit at the bottom when the deposition elec-trode is placed vertical. In addition, for electrophoretic deposition to occur with largerparticles, either a very strong surface charge must be obtained, or the electrical doublelayer region must increase in size. Particle size has also been found to have a prominentinfluence on controlling the cracking of the deposit during drying. Sato et al. [4] investi-gated the effect of YBa2Cu3O7�d (YBCO) particle size reduction on crack formationand their results are shown in Fig. 2. Crack in films deposited from a suspension consistingof relatively smaller particle (0.06 lm) was much less than that in films deposited from thesuspension containing larger particles (3 lm). Hence, reduction in particle size improved

Fig. 2. SEM images of YBCO film electrophoretically deposited on silver electrode from its suspension in acetoneat 10 V for 180 s (film A: mean particle size = 3 lm; film B: mean particle size = 0.06 lm). The films were sinteredat 945 �C for 1 h and annealed at 500 �C for 6 h [4].
L. Besra, M. Liu / Progress in Materials Science 52 (2007) 1–61 7
the morphology of the YBCO superconducting film fabricated by electrophoretic deposi-tion suggesting that it is a useful technique to minimize cracking of deposits.
3.1.2. Dielectric constant of liquidPowers [32] investigated beta-alumina suspensions in numerous organic media and
determined the incidence of deposition as a function of the dielectric constant of the liquidand the conductivity of the suspension. A sharp increase in conductivity with dielectricconstant was noted; which apparently refers to the liquid in their pure state. It should alsobe noted that impurities, in particular water, affects the conductivity and that conductivityof milled suspension is very different to that of pure liquid, as a consequence of dissociativeor adsorptive charging modes. Powers [32] obtained deposits only with liquid for whichthe dielectric constant was in the range of 12–25. With too low a dielectric constant, depo-sition fails because of insufficient dissociative power, whilst with a high dielectric constant,the high ionic concentration in the liquid reduces the size of the double layer region andconsequently the electrophoretic mobility. Consequently, the ionic concentration in theliquid must remain low, a condition favoured in liquids of low dielectric constant. The
Table 2Physical properties of solvents [33]
Solvents Viscosity (cP) = 10�3 N s m�2 Relative dielectric constant
Methanol 0.557 32.63Ethanol 1.0885 24.55n-Propanol 1.9365 20.33Iso-propanol 2.0439 19.92n-Butanol 2.5875 17.51Ethylene glycol 16.265 37.7Acetone 0.3087 20.7Acetylacetone 1.09 25.7
8 L. Besra, M. Liu / Progress in Materials Science 52 (2007) 1–61
dielectric constant is generally the product of relative dielectric constant and dielectric con-stant in vacuum. Table 2 shows physical properties such as viscosity and relative dielectricconstant of some solvents [33].
3.1.3. Conductivity of suspension
Ferrari and Moreno [34], after a careful study proposed that the conductivity of the sus-pension is a key factor and needs to be taken into account in EPD experiments. It has beenpointed out that if the suspension is too conductive, particle motion is very low, and if thesuspension is too resistive, the particles charge electronically and the stability is lost. Theyobserved increase in conductivity of the suspension with both temperature and with poly-electrolyte (dispersant) concentration; but not all conductivity values were found useful forelectrophoretic deposition. They found the existence of a narrow band of conductivityrange at varying dispersant dosage and temperature, in which the deposit is formed. Con-ductivity out of this region are not suitable for EPD, limiting the forming possibilities.This suitable region of conductivity is however expected to be different for different sys-tems. The margin of conductivity region suitable for EPD, however can be increased bythe applied current assuring the success of the EPD process [35].
3.1.4. Viscosity of suspension
In casting processes, the main controlling parameter is the viscosity. Rheological mea-surements on concentrated slips give us a good idea about the optimum dispersing statewhen adding dispersants. In EPD process, the solid loading is very low and the viscositycannot be used to evaluate the dispersion state [34,35]. But the desired properties in thesuspension vehicle are low viscosity, high dielectric constant and low conductivity.
3.1.5. Zeta potential
The zeta potential of particles is a key factor in the electrophoretic deposition process.It is imperative to achieve a high and uniform surface charge of the suspended particles. Itplays a role in: (i) stabilization of the suspension by determining the intensity of repulsiveinteraction between particles, (ii) determining the direction and migration velocity ofparticle during EPD, (iii) determining the green density of the deposit. The overall stabilityof a system depends on the interaction between individual particles in the suspension. Twomechanisms affect this interaction, which are due to electrostatic and van der Waals forces.The probability of coagulation of a disperse system depends on the interaction energyresulting from this forces, and will be dealt with in detail later. A high electrostatic

L. Besra, M. Liu / Progress in Materials Science 52 (2007) 1–61 9
repulsion due to high particle charge is required to avoid particle agglomeration. The par-ticle charge also affects the green density of the deposit. During formation of the deposit,the particles become closer to each other and with increasing attraction force. If the par-ticle charge is low, the particles would coagulate even for relative large inter-particledistances, leading to porous, sponge-like deposits. On the contrary, if the particles havea high surface charge during deposition they will repulse each other, occupying positionswhich will lead to high particle packing density [36]. It is therefore very important to con-trol the solids loading and concentration of solvents and additives in the EPD suspensionin order to reach the highest possible green density of the deposit. The zeta potential canbe controlled by a variety of charging agents such as acids, bases and specifically adsorbedions or polyelectrolytes, to the suspension [37]. Thus there exists a variety of additives thataffect the charge magnitude and its polarity. These additives act by different mechanisms.The main criteria for selection of a charging agent are the preferred polarity and deposi-tion rate of the particles.
Chen et al. [38] found that the stability and deposition rates of alumina from its suspen-sion in ethanol was maximum at pH value of 2.2 at which the positive zeta potential ofalumina was maximum (Fig. 3). However, under higher pH value of �11, the suspensionswere less stable. This can be explained based on a charging mechanism recently proposedby Wang et al. [39] on the alumina surface
AlOHþ2 (Hþ
AlOH )OH�
AlO� þH2O ð5ÞUnder basic conditions such as pH �11, AlOH tends to form AlO�; however, the presenceof water is prone to bring the above reaction towards the formation of AlOHþ2 , ratherthan the formation of AlO�, resulting in an absolute value of the zeta potential greaterat pH �2 than at pH �11. This led to high stability of suspension at lower pH than athigher pH conditions.
Fig. 3. Zeta potential of Al2O3 powder in ethanol [38].

10 L. Besra, M. Liu / Progress in Materials Science 52 (2007) 1–61
Zarbov et al. [37] established that while the deposition rate is directly dependent on thezeta potential, which is determined by the charging additive, the influence of such an addi-tive is exerted also by its effect on the ionic conductivity of the suspension. The ionic con-ductivity determines the potential drop in the bulk of the suspension, which constitute thedriving force for the transfer of the particles to the electrode.
3.1.6. Stability of suspension
Electrophoresis is the phenomenon of motion of particles in a colloidal solution or sus-pension in an electric field, and generally occurs when the distance over which the doublelayer charge falls to zero is large compared to the particle size. In this condition, the par-ticles will move relative to the liquid phase when the electric field is applied. Colloidal par-ticles which are 1 lm or less in diameter, tend to remain in suspension for long periods dueto Brownian motion. Particles larger than 1 lm require continuous hydrodynamic agita-tion to remain in suspension. The suspension stability is characterized by settling rateand tendency to undergo or avoid flocculation. Stable suspensions show no tendency toflocculate, settle slowly and form dense and strongly adhering deposits at the bottom ofthe container. Flocculating suspensions settle rapidly and form low density, weakly adher-ing deposits. If the suspension is too stable, the repulsive forces between the particles willnot be overcome by the electric field, and deposition will not occur. According to somemodels for electrophoretic deposition the suspension should be unstable in the vicinityof the electrodes [5]. This local instability could be caused by the formation of ions fromelectrolysis or discharge of the particles; these ions then cause flocculation close to the elec-trode surface. It is desirable to find suitable physical/chemical parameters that characterizea suspension sufficiently in order that its ability to deposit can be predicted. Most inves-tigators use zeta potential or electrophoretic mobility, but these do not uniquely determinethe ability of a suspension to deposit. For example, in suspension of aluminium in alcoholthe addition of electrolyte causes no significant change to the zeta potential, but depositscan only be obtained in the presence of the electrolyte [40]. The stability of the suspensionis evidently its most significant property, but this is a somewhat empirical property notclosely related to fundamental parameters.
3.2. Parameters related to the process
3.2.1. Effect of deposition time
Basu et al. [41] found that deposition rate for a fixed applied field decreases withincreased or prolonged deposition time. Similar observation was made by Chen and Liu[31]. Fig. 4 shows a typical deposition characteristics of ZnO coating on copper electrodeat different applied potentials, with increasing time of deposition [42]. It is clearly evidentthat the deposition is linear during the initial time of deposition. But as more and moretime is allowed, the deposition rate decreases and attains a plateau at very high depositiontimes.
In a constant voltage EPD, this is expected because: while the potential differencebetween the electrodes is maintained constant, the electric field influencing electrophoresisdecreases (Fig. 5) with deposition time because of the formation of an insulating layer ofceramic particles on the electrode surface [43]. But during the initial period of EPD, thereis generally a linear relationship between deposition mass and time.

Fig. 4. Relationship between deposit thickness and time of deposition for ZnO coatings on copper electrode atdifferent applied potential [42].
Fig. 5. Current density versus deposition time for deposition of hydroxyapatite at different applied voltages: (a)50 V; (b) 100 V; (c) 200 V [43].
L. Besra, M. Liu / Progress in Materials Science 52 (2007) 1–61 11
3.2.2. Applied voltage
Normally the amount of deposit increases with increase in applied potential. Fig. 6shows the weight of deposited hydroxyapatite on Ti6Al4V substrate from its suspensionin isopropyl alcohol. Although powders can be deposited more quickly if greater appliedfields are used, the quality of the deposit can suffer. Basu et al. [41] found that more uni-form films are deposited at moderate applied fields (25–100 V/cm), whereas the film qual-ity deteriorates if relatively higher applied fields (>100 V/cm) are used. Because theformation of particulate film on the electrode is a kinetic phenomenon, the accumulationrate of the particles influences their packing behaviour in coating. For a higher appliedfield, which may cause turbulence in the suspension, the coating may be disturbed by flowsin the surrounding medium, even during its deposition. In addition, particles can move so

Fig. 6. Weight of deposited hydroxyapatite on Ti6Al4V substrate versus applied voltage for different depositiondurations: (a) 30 s and (b) 120 s [43].
12 L. Besra, M. Liu / Progress in Materials Science 52 (2007) 1–61
fast that they cannot find enough time to sit in their best positions to form a close-packedstructure. Finally, in high field situations, lateral motion of the particles once deposited,also are restricted on the surface of the already deposited layer, because higher appliedpotential exerts more pressure on particle flux and movement, the applied field affectsthe deposition rate and the structure of the deposit.
Negishi et al. [33] observed that the current density of n-propanol solvent in absence ofany powder, were proportional to applied voltage and it tend to unstable with increasingapplied voltages (Fig. 7). Such stability data serves as a good guideline for deciding thedeposition parameters and consequently the quality of deposit formed by EPD. It is con-sidered that the unstable current density influences the quality of deposition morphology.
Fig. 7. Stability of current density of n-propanol for different applied voltages [33].

L. Besra, M. Liu / Progress in Materials Science 52 (2007) 1–61 13
From the current density profile in Fig. 7, it is reasonable to suggest that the applied volt-age should be less than 100 V in the case of n-propanol. It was observed that amount ofYSZ deposition from the n-propanol bath increased with increasing applied voltage. How-ever, the deposit surface morphologies were found to be flat at low voltages and it becamemore rough with increasing applied voltage.
3.2.3. Concentration of solid in suspension
The volume fraction of solid in the suspension play an important role, particularly formulti-component EPD. In some cases, although each of the particle species have same signof surface charge, they could deposit at different rates depending on the volume fraction ofsolids in the suspension. If the volume fraction of solids is high, the powders deposit at anequal rate. If however, the volume fraction of solids is low, the particles can deposit atrates proportional to their individual electrophoretic mobility [44].
3.2.4. Conductivity of substrate
The uniformity and conductivity of substrate electrode is an important parameter crit-ical to the quality of the deposition of green film by EPD. Peng and Liu [45] observed thatlow conductivity of the La0.9Sr0.1MnO3 (LSM) substrate leads to non-uniform green filmand slow deposition. Chen and Liu [31] noticed that when as pressed LSM or LSM–YSZcomposite pellets were used as substrate for EPD, the deposition rate of YSZ was slow andobtained film was non-uniform. This was attributed to be due to the high resistance of thesubstrates resulting from the binder added. When the pellets were fired at 700 �C for 0.5 hto remove the binder, the conductivity of the substrates increased substantially. Conse-quently, the green YSZ film obtained was of high quality.
It is quite evident from the above discussion that the kinetics of electrophoretic depo-sition and the quality of deposit formed is dependent on a large number of parameters. Itis required to have a careful control of these individual parameters during electrophoreticdeposition. However, many of the parameters are inter-related to one another. It is notedthat the quality of electrophoretic deposition heavily depends on the suspension conditions[46]. In general, a well-dispersed stable suspension will provide a better deposition duringEPD compared to an unstable or agglomerated powder suspension. Zeta potential is animportant parameter that relates to suspension stability and mobility. It measures thepotential difference between the particle surface and the shear layer plane formed by theadsorbed ions. As zeta potential is closely related to the particle’s double layer thickness,it hence provides information on the agglomeration of the particles in the suspension. Ingeneral, the higher the absolute value of the measured zeta potential, the better is the dis-persion of the particles in the suspension. Besides the stability criteria, it is also noted thatit is the ions in the suspension that are carrying most of the current when an electric field isgenerated during EPD [4,5], as a result, the electrical conductivity of the suspension alsoplays an important role in the process. Fig. 8 shows the zeta potential and electrical con-ductivity of lead zirconate titanate (PZT) suspension as a function of pH [46]. It can beseen that as the pH value decreases from 7.5 (isoelectric point) to 4.5, the value of the zetapotential increases. This is attributed to the adsorption of the H+ ions onto the particlesurfaces which enhances the electrostatic repulsion force. However, as more H+ ions areadded to the suspension, i.e., when pH value decreases from 4.5 to 2.0, the large amountof positive ions results in the reduction of the double layer thickness and, hence, a decreasein repulsive force between the particles. This will promote particle agglomeration and,

Fig. 8. Zeta potential and conductivity of the PZT suspension at varying pH in aqueous media [46].
14 L. Besra, M. Liu / Progress in Materials Science 52 (2007) 1–61
hence, give rise to poorer deposition results. At the alkaline range, similar phenomenon isobserved but with the adsorption of OH� ions in the suspension. It is, however, noted thatat the alkaline range, the zeta potential measured appeared to be much lower in absolutemagnitude compared to that at the acidic range. The ionic concentration not only affectsthe zeta potential, but is also closely related to the suspension electrical conductivity. Thiscan be seen from Fig. 8 which shows that the electrical conductivity is low when the ionicconcentration in the suspension is low. However, as the ionic concentration in the suspen-sion increases, the conductivity of the suspension increases rapidly. It is found that at highionic concentration, not only the rate of agglomeration will increase and form largeragglomerates that have lower mobility, but also the large amount of free ions in the suspen-sion may become the main current carrier and, hence, reduce the electrophoretic mobility ofthe particles. The conductivity of suspension is also directly related to dielectric constant ofthe suspending medium and it increases with increase in dielectric constant [32]. Hence thechoice of the suspension parameters needs to be made judiciously for preparation of a suit-able EPD suspension. Once the parameters related to the suspension are fixed, the processparameters can be altered conveniently for attaining desired deposition. Obviously, themost dominant parameters influencing the electrophoretic deposition are the processparameters such as applied voltage, deposition time and particle concentration in the sus-pension. Invariably, high applied potential leads to higher deposition rate but care has to betaken to ensure stable current density to obtain uniform deposit. Similarly, higher deposi-tion rate is expected with increasing particle concentration and deposition time [44].
4. Kinetics of electrophoretic deposition
To make EPD process commercially more viable, a knowledge of the kinetics of EPDprocess is necessary in order to (a) control and manipulate deposition rate, and (b) achieveflexibility in microstructural manipulation. Hamaker [1] observed a linear dependence ofthe deposited weight or yield of the EPD with the amount of charge passed, and proposedthat the amount deposited is proportional to the concentration of the suspension, time of

Fig. 9. Schematic of EPD kinetics [47].
L. Besra, M. Liu / Progress in Materials Science 52 (2007) 1–61 15
deposition, surface area of deposit, and the electric field. EPD can be conducted underconstant current or constant voltage mode with either constant or changing concentration(decreasing concentration of suspension) with deposition time. Sarkar et al. [47] demon-strated the kinetic aspects of EPD through schematic plots (Fig. 9) of deposit weightagainst time of deposition for four possible deposition conditions: curve A (constant-cur-rent and constant-suspension concentration), curve B (constant-current but decreasingsuspension concentration), curve C (constant-voltage and constant-suspension concentra-tion) and curve D (constant-voltage but decreasing suspension concentration). Except incurve A where the rate of deposition is constant with time, the rate of deposition decreasesasymptotically with deposition time in either curve B, C, or D. After allowing for sufficientdeposition time, the final yield and rate of deposition are highest in curve A, followed bycurve B, C, and D, respectively. The effect of decreasing suspension concentration on thereduction of the final yield and rate of deposition is obvious during either constant-current(curves A and B) or constant-voltage curve C and D) EPD. Comparison of curve A (con-stant-current) and curve C (constant-voltage) clearly reveals that even if the suspensionconcentration is kept constant during deposition in both of them, (a) the rate of depositionwas constant in curve A while it decreased asymptotically with time in curve C and (b)final yield was considerably higher in curve A than that in curve C. Thus the deviationof curve A from curve C is not due to decreasing suspension concentration but is dueto a decrease of particle velocity as a function of deposition time. Such decrease in particlevelocity during constant-voltage EPD is due to the fact that deposited mass acts as ashielding effect and has higher electrical resistance than the suspension from which depo-sition takes place. Consequently, as the deposit grows with deposition time, the availableelectrical driving force or voltage per unit length of suspension decreases with time.
5. Role of polymer binders in EPD
Polymer binders are common additives in ceramic processing. The EPD processingemploys binder only seldom or minimal. The role of binders in EPD processing is

16 L. Besra, M. Liu / Progress in Materials Science 52 (2007) 1–61
multifunctional. Polymer binders are used to obtain adherent deposits and prevent cracks.Moreover, the adsorbed polymer can provide steric stabilization of suspension of ceramicparticles and reduce viscosity of the suspension. In EPD processing, charged polymer par-ticles transport adsorbed polymer to the electrode surface, thus allowing the polymer bin-der to be included in the deposit. This is in contrast to some other ceramic techniques,where the entire dissolved polymer is included in the green body after solvent evaporation.Therefore, the control of polymer adsorption is of paramount importance for electropho-retic deposition. The amount of polymer adsorption depends on polymer concentration insuspension and specific polymer–particle, polymer–solvent, particle–solvent and particle–dispersant interactions. Good solvents are necessary in order to achieve high polymer con-centration in solution. However, the polymer can be adsorbed on the surface of ceramicparticles when its solubility in the dispersion medium is low. Adsorption of polymer onceramic particles in poor solvent can result in bridging flocculation. In contrast, good sol-vents are important to achieve steric stabilization. Polymer stabilizing moieties, whichextend out from the particle surface must be well solvated in a good solvent. Therefore,for electrophoretic deposition, it could be advantageous to use copolymers of a blockor graft type. Indeed, soluble polymers serve to anchor copolymer molecules to the particlesurface, whereas chains of soluble polymers enable steric stabilization.
6. Importance of powder washing before EPD
Successful EPD techniques requires a stable suspension wherein well dispersed particleshave a controlled surface charge. Thus the preparation of a particulate suspension with acarefully defined chemistry before conducting EPD is essential. The first step in suspensionpreparation is powder washing to remove any residual impurities incorporated duringpowder preparation. As an example, during preparation of yttria stabilized zirconia(YSZ) powders (TZ-8YS) by co-precipitation technique using chloride precursors (e.g. zir-conyl chloride, ZrOCl2), the solution contain residual surface chlorides which can betested by measuring specific conductivity of the supernatant of the dispersion. The conduc-tivity of de-ionised water is about 0.04 lS/cm. Presence of Cl� ions can also be confirmedby adding a small amount of silver nitrate (AgNO3) salt to the supernatant. If there is for-mation of an insoluble precipitate (of AgCl) then there is residual chloride impurities in thesolution.
Removal of the Cl� ions and other impurities is very important because it can affect thesuspension stability, deposition characteristics and later, the sintering. Basu et al. [41]found that unwashed powder led to unstable suspension which needed agitation every5–10 min. When the suspension is settling constantly, during EPD, the unwashed powderled to lower deposition yield, gradient in the EPD film thickness (thinner coating at top,thicker on bottom), a decrease of 15–25% in overall green density of the as depositedcoating.
Basu et al. [41] accomplished removal of Cl� impurities from surface of the particlesusing successive washing in de-ionised water because water easily participates in an ion-exchange interaction between the impurities on the powder surface and the bulk solventin accordance with Eq. (6)
Cl (surface) + H2O (solvent)!H2O (surface) + Cl� (solvent) ð6Þ

L. Besra, M. Liu / Progress in Materials Science 52 (2007) 1–61 17
A significant reduction in conductivity of supernatant was observed on washing. In addi-tion, washing the TZ-8YS powder eight times in de-ionised water was sufficient to yieldreproducible behaviour during EPD.
7. Practical considerations
In view of the sensitivity of the electrophoretic mobility to factors such as chemicalenvironment and particle surface topography, and the need for suspension of marginal sta-bility, it might be thought that a process based on electrophoretic deposition would beinherently difficult to control. This situation is not helped by the shortcomings in funda-mental understanding of electrophoretic deposition, and it is almost impossible to predictwhether suspensions will deposit electrophoretically. With any system, it is of course abso-lutely necessary to avoid contamination by any impurity that can adversely influence theelectrokinetic properties of the suspension; a stringent requirement, but one that shouldperhaps be regarded as a strength rather than a weakness of the process. The EPD processcan deposit powder uniformly on a complicated shape electrode and, as a result, can pro-duce geometrically complicated shapes. However, in the case of bulk ceramic, after shapeforming the substrate (depositing electrode) needs to be removed from the deposit. Com-mercial applicability of EPD forming depends on the effective separation of the substratefrom the deposit. In the case of simple geometry, separation can be done after drying ofthe deposit. For complicated shapes, a combustible substrate that can be removed duringthe sintering process could be used. In the case of coatings, the sample often developscracking during drying and sintering and the successful application of EPD to this areadepends on overcoming this problem.
Another important area of concern is how to avoid cracking in the ceramic coating dur-ing drying and sintering [48]. During drying and sintering, the coating densifies, and as aresult shrinks, but the substrate typically does not change dimension. During this process,the coating will develop tensile stress in it and these stresses will be relieved by the forma-tion of cracks. There are several approaches that can be taken to avoid this cracking. Care-ful control of the EPD process together with moderate control on drying may avoid theformation of drying cracks. During sintering the coating typically has about 10–15% linearshrinkage. Traditionally, this sintering cracking is avoided by using a liquid phase duringsintering; a good example is glass enamel on a metal substrate. The enamel composition isadjusted in such a way that its thermal expansion is closely matched with the substrate. Asa result it does not form cracks during cooling from the sintering temperature. This liquidphase sintering is also equally effective in avoiding cracking in fiber composite synthesis.The second approach is to use a substrate that also shrinks during sintering. Recently, thisapproach has been used, particularly in SOFC fabrication where typically a YSZ electro-lyte is applied to a partially sintered or an unsintered anode substrate. During sintering,both the substrate and coating shrink thereby avoiding cracks.
8. Water-based EPD
In general, the organic solvents are very popular as dispersing media in electrophoreticdeposition. Table 3 presents a summary of some solvents commonly used in electropho-retic deposition. But the use of aqueous system has important advantages since they needmuch lower voltage to be applied and the environmental problems associated with

Table 3Solvents used for electrophoretic deposition
Sl. no. Solvent Deposited material Reference
1 Water Al2O3 [34,35,49]Al2O3/ZrO2 [50]
2 Acetone YSZ [51]La1�xSrxGa1�yMgyO3�(x+y)/2 [52]
3 Acetone–ethanol YSZ [45]4 Acetylacetone YSZ [53]
[51]5 Cyclohexane YSZ [51]6 Isopropylalcohol Hydroxyapatite [54]
YBa2Cu3O7�x [55]7 Ethyl alcohol Al2O3, ZrO2 [56]8 Ethyl alcohol–water CeO2 [57]
SnO2 [58]CaSiO3 [59]
9 Ethyl alcohol–acetylacetone MgO, Al2O3 [60]10 Glacial acetic acid PZT [27]11 Dichloromethane b-alumina [61]12 Methyl ethyl ketone (MEK) Al2O3 [62]13 Toluene-ethyl alcohol Al2O3 [62]
18 L. Besra, M. Liu / Progress in Materials Science 52 (2007) 1–61
organics are avoided [35]. Obviously, the use of water implies advantages such as highertemperature-control during the process or a faster kinetics, in addition to importanthealth, environmental, and cost benefits. These advantages promoted the interest in someresearch groups in the 1990s to consider using aqueous EPD to process technical ceramics.The water-based suspensions however causes a number of problems in electrophoreticforming [63]. The main problems are related to electrochemical reaction in the electrodeswhen current is passed through, which seriously affects the efficiency of the process and theuniformity of the deposit. First and foremost, there is a deviation in the deposition kineticsfrom the linear Hamaker growth due to deviation in current density and powder concen-tration [64]. The deviation from linearity could not be prevented even after controlling thecurrent density and powder concentration suggesting that there could be factors otherthan those already discussed, which affect the aqueous EPD process. Electrolysis of wateroccurs at low voltages, and gas evolution at the electrodes is inevitable at field strengthshigh enough to give reasonably short deposit times. This causes bubbles to be trappedwithin the deposit unless special procedures are adopted, such as the use of absorbingor porous electrode materials, or high speed chamber flows. Current densities are high,leading to Joule heating of the suspension, and electrochemical attack of the deposit. Sec-ondly, when metallic electrodes are used, the normal potential of the electrode is largelyoverpassed. This facilitates oxidation of the electrodes and migration of metallic impuritiestowards the slurry in the opposite direction to that of the migrating particles. In mostcases, these impurities are retained in the deposit as heterogeneities and/or residual poros-ity, thus degrading its expected properties.
Another electrokinetic phenomena occurring in an aqueous EPD is water electroosmo-sis, which consist of the movement of the liquid phase because of an external electric field.This could be helpful in EPD because it would accelerate drying of the deposit surface

L. Besra, M. Liu / Progress in Materials Science 52 (2007) 1–61 19
which is in contact with the electrode. So, if the process were well controlled, demouldingof the self-supported deposits would be easier. Contrarily, if the deposits were too thick, orthe process were too fast, crack formation would occur as a consequence of the drying gra-dient. Therefore, an adequate control of the colloid chemistry of the particles in the slurryis necessary.
9. Non-aqueous EPD
In general, organic liquids are superior to water as a suspension medium for electropho-retic forming. While the generally lower dielectric constant in organic liquids limits thecharge on the particles as a result of the lower dissociating power, much higher fieldstrengths can be used since the problems of electrolytic gas evolution, joule heating andelectrochemical attack of the electrodes are greatly reduced or non-existent. Moreover,the organic liquids are preferred due to their higher density, good chemical stability andlow conductivity.
The electrolysis and gas evolution associated with aqueous EPD processing can beavoided by using solvents of extremely high oxidation–reduction potentials like benzeneor ketones. However, the electric charge on oxide particles in benzene or ketones will beinsufficient for EPD as very small amounts of free ions exist in these solvents. Conse-quently, a few hundreds of volts are required for EPD. It is reported that protons areformed by a reaction between ketone and iodine. The reaction of iodine with acetonecan be represented by Eq. (7) [52]
CH3–CO–CH3 + 2I2 () ICH2–CO–CH2I + 2Hþ+ 2I� ð7Þ
Similarly, the reaction between acetylacetone and iodine can be represented by the follow-ing equation [51]:
CH3–CO–CH2–CO–CH3 ()I2
ICH2–CO–CO–CH2Iþ 2I� þ 2Hþ ð8ÞAdsorption of the formed protons onto the suspended particles will make them positivelycharged. Application of a DC field causes the positively charged particles to move towardsand deposit on the cathode.
The major problems associated with the use of organics are that higher voltages arerequired. Moreover, the cost, toxicity and flammability of organic liquids warrants judi-cious selection and practice of solvent reclamation in order to minimise these problems.
10. Charge development on powder surface in suspension
10.1. Aqueous suspension
Electrophoretic deposition relies on the capability of the powder to acquire an electriccharge in the liquid in which it is dispersed. In general when solid powder is dispersed in apolar liquid, such as water, usually it results in the buildup of a charge at the solid–liquidinterface [65]. The interfacial charge is a result of a range of mechanisms such as adsorp-tion or orientation of dipolar molecules at the particle surface, electron transfer betweenthe solid and the liquid phase due to differences in work function, selective adsorption ofions onto the solid particle and dissociation of ions from the solid phase into the liquid.

20 L. Besra, M. Liu / Progress in Materials Science 52 (2007) 1–61
For aqueous suspensions of ceramic powders, especially oxides, the role of protons ascharge determining ions has been clearly established in literature. Yates et al. [66] pro-posed the following description of the interaction of surfaces of oxides with the liquidthrough simple ionization reactions of surface groups:
S–OH! S–O� þHþ ð9ÞS–OHþ2 ! S–OHþHþ ð10Þ
Later, the description was improved to account for the reaction of major electrolyte ionswith ionisable surface sites. The net charge as evident by the above reactions, is controlledby pH and reaction constant for the respective dissociation reaction. The point of zerocharge (pzc) is the pH value where the surface concentration of (S–O�) and ðS–OHþ2 Þare equal. The surface charge is negative at pH > pHpzc and positive at pH < pHpzc.
10.2. Non-aqueous suspension
For non-aqueous media, however, the hydrogen concentration (pH) looses its validityas a general measure for the acidity or alkalinity of a medium, and systematic informationon charging in these media is relatively scarce. Nonetheless, the necessity of a globalapproach towards the behaviour of a solute in a series of solvents, such as its solubility,redox potential or degree of ionization, has led to the development of donor numbers,which express the tendency of a solvent to donate electrons [67]. The relative measureof the alkalinity of a solvent is given by the enthalpy of its reaction with an arbitrarily cho-sen reference acid. Ranking the relative degree of acidity of media can be performed byusing the acceptor number scale, which is a measure for the tendency of solvents to acceptelectrons. Indeed, Labib and Williams [68] have shown that in the absence of water, thesign of the charge on the surface of ceramic powders depend on the donor number ofthe solvent, strongly suggesting that charging through electron exchange with the solventis possible. However, Wang et al. [39] found the surface charge characteristics on aluminapowder dispersed in ethanol to be analogous to the behaviour of oxides in water where amere adjustment in pH of ethanol by addition of acetic acid or tetra-methyl-ammonium-hydroxide allowed control of the sign of the charge on alumina powder. Since in the EPDprocessing, organic solvents are used more frequently than aqueous suspensions, thisobservation on control of surface charge on ceramic powder through addition of acidsor bases to organic media serves as a valuable general guideline for suspension prepara-tion. In reality, many organic solvents of technical quality do contain some residual water.Although the evidence for the charging in non-aqueous media by electron transfer is inter-esting from a theoretical point of view, for practical use in ceramic industry the require-ment of working under absolutely dry conditions is far too expensive. To test how farthe observation of Wang et al. [39] for alumina can be generalized to ceramic processing,Vandeperre et al. [67] measured the charging of a range of ceramic powders (oxides, car-bides, nitrides and borides) by potentiometric titration and compared them with sign ofthe electrophoretic mobility in an acidic and alkaline organic reference medium. Theirmeasurement showed that to a large extent the rationale for charging of ceramic powdersin water also applies to charging in non-aqueous media. Negishi et al. [69], while preparingYSZ suspension in n-propanol, suggested that the small amount of residual water presentin commercial n-propanol used for preparation of YSZ suspension for EPD, generated H+

L. Besra, M. Liu / Progress in Materials Science 52 (2007) 1–61 21
ions and OH� ions by electrolytic dissociation. The zeta potential is influenced by theadsorption of the generated H+ ions onto the YSZ in n-propanol bath leading to positivecharge on YSZ in n-propanol.
11. Properties of suspension for EPD
A key ingredient in most of the colloidal processing methods of ceramic forming includ-ing electrophoretic deposition (EPD) is the achievement of a well stabilized, unagglomer-ated, and homogeneous slurry. Through careful control of the interparticle forces,colloidal suspensions can be prepared in the dispersed, weakly flocculated or strongly floc-culated states. A distinguishing feature of all colloidal system is that the contact areabetween the particle surface and the dispersing liquid is large. As a result the interparti-cle/surface forces strongly influence suspension behavior. The colloidal stability is gov-erned by the total interparticle potential energy. The dominating interparticle forces inmost ceramic system are: (i) the van der Waal attractive force, (ii) double layer (electro-static) repulsive force, and (iii) steric (polymeric) forces. In order to obtain a well-stabilizedsuspension, particles dispersed in the suspending medium must exhibit sufficient repulsiveforces to offset the van der Waals attraction. These forces are better understood in terms ofelectrical double layer and their interactions and will be discussed in the following section.
11.1. The electrical double layer and electrophoretic mobility
Most substances acquire surface electric charge when brought in contact with a polar(e.g. aqueous) medium. It is now well recognised that the development of electrical chargeon colloids dispersed in water is due to: (i) surface group ionisation (controlled by the pHof the dispersion media), (ii) differential solubility of ions (e.g. silver iodide crystals aresparingly soluble in water and silver ions dissolve preferentially to leave a negativelycharged surface), (iii) isomorphous replacement/lattice substitution (e.g. in kaolinite,Si4+ is replaced by Al3+ to give negative charges), (iv) charged crystal surface fracturing(crystals can reveal surfaces with differing properties), and (v) specific ion adsorption (sur-factant ions may be specifically adsorbed). This surface charge influences the distributionof nearby ions in the polar medium. The ions, which establish the surface charge, aretermed potential determining ions (pdi). These normally include ions of which the solidis composed; hydrogen and hydroxyl ions, ions capable of forming complex or insolublesalts with the solid surface species. Ions of opposite charge (counter-ions) are attractedtowards the surface and ions of like charge (co-ions) are repelled away from the surface.This leads to the formation of a net electrical charge of one sign on one side of the inter-face and a charge of opposite sign on the other side-giving rise to what is called the elec-
trical double layer. Fig. 10 shows the schematic of a typical electrical double layer [70].The theoretical and practical aspects of electrical double layer have been recognised and
understood through a vast amount of available literature and a major field of investigationin modern colloid and interface science has been the search for a means to predict anddetermine the exact distribution of electrical charges at or near the solid–liquid interface.A widely accepted model for the double layer is that due to Stern [71], later modified byGraham [as cited in Ref. 72], in which a part of the counter-ion charge is located close tothe particle surface (Stern layer) and the remainder is distributed more broadly in the dif-
fuse double layer or lyosphere. The Stern layer is actually a hypothetical plane representing

Fig. 10. Schematic representation of the double layer and potential drop across the double layer (a) surfacecharge, (b) Stern layer, (c) diffuse layers of counter-ions [70].
22 L. Besra, M. Liu / Progress in Materials Science 52 (2007) 1–61
the closest distance of approach of hydrated counter ions to the surface. A schematic rep-resentation of the distribution of charge species and the potential drop across the doublelayer in accordance with the Stern model is also represented in Fig. 10 [70].
The interaction between charged particles is governed predominantly by the overlap ofthe diffuse layer, and accordingly the potential most relevant to the interaction is the onedeveloped at the boundary between the Stern and diffuse layer (wd) rather than the poten-tial at the particle surface (w0). This potential difference between Stern plane and the dif-fuse layer is called the zeta potential (n) [73]. The potential (w) at a distance x from theStern plane may reasonably be represented by the following linear form of the Poisson–Boltzmann expression:
w ¼ wd expð�jxÞ ð11Þ
where j is the Debye–Huckle parameter [71] and has the unit of (length)�1, 1/j is the dis-tance at which the potential w drops to 1/e of its value at the Stern plane, wd, and this dis-tance is called the double layer thickness or Debye length. The double layer thickness is ofgreat importance in colloid stability and for that matter in flocculation: it controls therange of the double layer interaction. The thickness is controlled by the concentrationand valence of ions in solution. A high concentration of ions (high ionic strength) inthe medium generally results in a decrease in the double layer thickness and consequentdecrease in the potential [74]. The thickness is commonly represented in the followingform:
1
j¼ ee0kT
e2P
iniz2i
� �1=2
ð12Þ

L. Besra, M. Liu / Progress in Materials Science 52 (2007) 1–61 23
where e is the electronic charge, ni is the concentration of ions with charge zi, e is the dielec-tric constant of the liquid, and e0 is the permittivity of a vacuum. For aqueous solutions at25 �C, the value of j (m�1) is given by [71]
j ¼ 2:3� 109X
niz2i
� �1=2
ð13Þ
where ni is the molar concentration and zi is the valence of ion i.The potential at the slip plane, the n potential, determines the velocity (m) by which the
particles move under the influence of an applied electric field (E) and the electrophoreticmobility (l) which is given by
l ¼ mE
ð14Þ
The motion of particles under the effect of electrophoretic forces has been first addressedby Smoluchowski [75] and subsequently by many others [76–80]. Smoluchowski predictedthat a rigid spherical particle possessing an electric double layer and embedded in anunbound flow field would be forced to move if subjected to an electrical potential gradient.The mobility of the particle depend linearly on the dielectric constant (or permittivity) ofthe fluid, the potential gradient, and the zeta potential of the particle and is inverselyproportional to the fluid viscosity and is given by the following Henry equation:
l ¼ 2
3
e0erng
f ðjrÞ ð15Þ
where e0 is the permittivity of vacuum, er is the relative permittivity of the solvent, g is thesolvent viscosity, f(jr) is the Henry coefficient, which depends on the relation between thethickness of the double layer (1/j) and the core radius (r) of the particle. For a pointcharge (jr� 1, Huekel–Onsager case) or a flat surface (jr� 1, Helmholtz –Smoluchow-ski case) this coefficient is 3/2 and 1, respectively [81].
The flow fields with finite boundary conditions, the wall effects were accounted for byMorrison and Stukel [79] and Keh and Anderson [80] (i.e., for the case of particle travelingin close proximity to the containing boundaries of the flow field). Keh and Anderson [80]have shown that if electro-osmosis is disregarded, the particle would experience an increas-ing drag force and reduced mobility. It was also shown that, due to the electric field, theinsulating rigid walls would induce an electro-osmotic flow, its direction depending on thesign of the zeta potential. For an open permeable structure, the electro-osmotic flow pos-sesses a uniform velocity profile and a neutral particle immersed in the fluid would bedragged by the electro-osmotic flow and move with identical velocity. However, for animpermeable structure though the induced electro-osmotic flow still exists it is non-uni-form since a net zero mass flow must be observed inside the pore. Haber [82] investigatedthe electrophoretic penetration and deposition of colloidal ceramic particles into an imper-meable porous substrate. The substrate is immersed in a suspension containing the parti-cles and positioned between two electrodes. An electric potential gradient between theelectrodes is used to drive the ceramic particles into the pores which are closed at thefar end not allowing fluid permeation. Three driving mechanism for movement of the par-ticles have been identified: (a) the hydrodynamic drag force exerted on the particles due tothe electro-osmotic flow of the solvent inside the pores, (b) the electrophoretic forceexerted on the particles, and (c) the Brownian force due to thermal fluctuations of the

24 L. Besra, M. Liu / Progress in Materials Science 52 (2007) 1–61
solvent molecules. It was shown that under these forces the particles may reach the walls ofthe pore and short range van der Waals forces may cause their capturing and depositiononto walls.
11.2. DLVO theory and suspension stability
An essential role in interpretation of particle deposition process is played by the state ofdispersion and stability of suspension [83]. The state of dispersion of particles in suspen-sion or ‘‘the suspension structure’’ can be controlled via careful manipulation of the inter-particle forces and their interactions. The Van der Waals force for any given colloidalsystem is essentially independent of almost any changes made to the solution. (e.g. byaddition of electrolyte). Even the adsorption of a surfactant forming monolayer ontothe particle surface will have only a slight effect on the van der Waals attraction [84]. Thissuggests that in order to change the stability of a colloidal solution it is necessary to alterthe electrostatic double-layer forces in the system. Particle aggregation occurs when theattractive van der Waals force exceeds the repulsive electrostatic ones. A quantitative esti-mate of the relationship between stability of suspension in terms of interparticle forces andenergies of interactions that exist between colloidal particles and other surfaces in a liquidhas been described by the classical DLVO theory established by Derjaguin and Landau[85] and Verwey and Overbeek [86]. The colloidal stability as per this theory is based onthe perikinetic phenomenon, i.e., the liquid is assumed to be stationary and collisions occurdue to Brownian translational motion. It assumes that the effect of two forces is additive,and by combining the effect of electrostatic repulsion (VR) and van der Waals attraction(VA) between two particles, the following expression for the total interaction energy func-tion (VT) has been presented by Hiemenz [87]. Although the theory is based on the simpleadditivity of dispersion and electrostatic interactions, it has proved successful in predictingbasic features of colloid stability and particle deposition phenomena. According to thistheory, the stability of a colloidal system is determined by the total energy of interaction,determined by sum of the electrical double layer repulsive forces (VR) and the van derWaals attractive forces (VA) which the particles experience as they approach one another
V TOTAL ¼ V R þ V A ð16ÞThe electrostatic repulsive force (VR) in the above equation can be expressed as
V R ¼eawd
2lnf1þ expð�jDÞg ð17Þ
where e is the dielectric constant of the liquid, a is the radius of the particle, wd is the sur-face potential which is often represented by zeta potential of the particle, j is the reciprocalof double layer thickness, and D is the distance of separation between two interacting par-ticles. The van der Waals attractive energy VA can be represented as
V A ¼ �aA131
2Df ðP Þ ð18Þ
where A131 is the Hamaker constant for media 1 of which the particles are composed andseparated in a liquid media 3, and is given by
A131 ¼ ðA1=211 � A1=2
33 Þ2 ð19Þ

L. Besra, M. Liu / Progress in Materials Science 52 (2007) 1–61 25
where A11 and A33 are the interactions of 1 and 3, respectively, in vacuum. The above equa-tion implies that the interaction between similar materials in a liquid would always beattractive in nature (positive Hamaker constant); whatever might be the values of A11
and A33. However, for different materials 1 and 2 in liquid 3 (when A11 > A33 > A22), thepossibility of negative Hamaker constants and van der Waals repulsion arises. Althoughthe van der Waals repulsion may be important in wetting phenomena and in phase separa-tion from polymer solutions, there is very little evidence of such effect in colloidal disper-sions. Practically for all aqueous dispersions, Hamaker constants lie in the range of0.30–10.0 · 10�20 J. Biological, and other low density materials normally have quite lowvalues of Hamaker constants. Increasing the ionic strength can significantly reduce theeffective Hamaker constant further. For materials with Hamaker constants greater than10�20 J, the van der Waals interaction can be assumed to be essentially independent ofthe ionic strength.
Although the Hamaker approach is mostly used for determination of interactionbetween particles, it must often be corrected for retardation effects, which arise becauseof the electromagnetic characteristics of the van der Waals dispersion forces. It is oftenassumed that retardation becomes significant at a much closer approach. The forces canbe predicted more rigorously by direct computation based on the information about elec-tromagnetic properties of the media utilising the Lifshitz or macroscopic approach [88].Schenkel and Kitchener [89] proposed a simple expression for the magnitude of this inter-action, which takes into account the effect of retardation. The term f(P) in the equation forVA is the retardation factor and is given by
f ðP Þ ¼ 1
1þ 1:77Pfor P 6 0:5 ð20Þ
f ðP Þ ¼ 2:45
5P� 2:17
15P 2þ 0:59
P 3for P > 0:5 ð21Þ
The form of the equation for total interaction energy is such that the van der Waals attrac-tion always dominates both at small and large interparticle separations. At intermediateparticle separations, the behaviour depends critically upon the ionic strength and hencethe electrolyte concentration of the medium. Depending on the ionic strengths, the totalpotential energy of interaction versus interparticle distance as depicted in Fig. 11, showsfour classes of shapes with large variations in stability [90,91]. At very low ionic strengths,the potential energy curve (Curve A) represents only strong and long range repulsiveforces producing a totally dispersed system. At a slightly higher but still low enough ionicstrengths, there appears a primary minimum and a maximum in the total interaction en-ergy profile (curve B). But the energy is still repulsive in nature.
The maximum in the energy profile represents a potential energy barrier against closeapproach of the two particles and is of great significance in colloid stability. The mainpoints of consideration are: (i) the height of the energy barrier, and (ii) the depth of thepotential well (primary minimum) at very small distances. Fig. 11 clearly explains that evenif it is energetically favourable for the particles to come into close contact, the two collid-ing particles would need to possess sufficient energy to overcome this energy barrier for theformation of an aggregate. The height of this energy barrier depends upon the magnitudeof wd (and n) and upon the range of repulsive forces. For highly charged surfaces in diluteelectrolyte (i.e., long Debye length) there is a strong and long range repulsion resulting in a

+
-
Primary minimum
Inte
ract
ion
Ene
rgy
van der Waals attraction
Electrostatic repulsion, VR
A
B C
D E
Energy Barrier, Eb
Secondaryminimum
Particleseparation
Fig. 11. Total potential energy versus interparticle distance curve between two particles showing four differenttypes of interactions: A = spontaneous dispersion of particles; B = no primary coagulation due to high energybarrier; C, D = weak secondary minimum coagulation; E = fast coagulation into primary minimum [90,91].
26 L. Besra, M. Liu / Progress in Materials Science 52 (2007) 1–61
high energy barrier. When the maximum potential energy is quite large enough comparedto the thermal energy (kBT) of the particles, the system should be stable. The role of coag-ulant or polymeric flocculants is either to lower the energy barrier by reducing the electro-static repulsion and hence making it easier for the particles to come close to one another,or to introduce some forms of interaction thereby destabilising the suspension and pro-moting solid–liquid separation. Once the barrier has been overcome, the particles shouldbe held in a deep primary minimum from where escape would be very unlikely. In principle,van der Waals attraction is infinitely strong on contact of particles and the primary min-imum should be of infinite depth. However, short range effects limit the closeness ofapproach and hence the depth of the primary minimum in some cases may be quiteshallow.
However, in the intermediate ionic strength, there appears a primary minimum, a pri-mary maximum and a secondary minimum (curves C and D). The secondary minimum inthe potential energy curves is a characteristic feature at relatively large interparticle dis-tance in a reasonably more concentrated electrolyte solution. When the minimum is mod-erately deep, compared with the thermal energy (kBT), reversible flocculation may easilytake place [92]. Re-dispersion from the secondary minimum is also possible by dilutingthe electrolyte solution. For small particles, the high value of maximum potential energy,prevent coagulation into the primary minimum; the secondary minimum is also never deepenough for the aggregation to occur. However, for particles of larger radii and irregularshapes, the effect on aggregation due to secondary minimum is more pronounced in com-parison to perfectly spherical particles.

Fig. 12. Schematic illustration of electrostatic and steric stabilization of suspensions. (a) Electrostaticstabilisation and (b) steric stabilisation.
L. Besra, M. Liu / Progress in Materials Science 52 (2007) 1–61 27
The colloid particles experience no repulsive force in a medium of high ionic strengthand fall directly into the deep primary minimum (curve E). Under such circumstances, fastcoagulation occurs and the system is completely unstable.
In the original DLVO theory, only the van der Waals and electrostatic interactions wereconsidered. Now it has also been identified that in addition to these forces, another cate-gory of physical interaction has to be considered in order to get a complete theory of col-loidal stability. Stabilization of colloidal dispersions may also be influenced by stericstabilization and structural forces. These mechanisms become important when there arehydrophilic macromolecules adsorbed or bounded to the particle surface. Stabilisationis caused by the repulsion between these adsorbed macromolecules. A schematic illustra-tion of electrostatic and steric stabilisation is shown in Fig. 12. The steric stabilizationforces are generally short-range force (<2 nm). Presence of these forces can also changethe shape of the potential well that controls the particle–substrate interaction. Cautionmust be exercised in using sterically stabilized suspension for electrophoretic depositionbecause the surface properties of the particles are altered completely for which the electro-phoretic mobility will be very different from those of electrostatically stabilized suspension.In extreme cases when the sign of surface charge is reversed due to adsorbed polymer thedeposition may fail or could occur on the counter electrode.
12. Mechanism of EPD process
Although the electrophoretic deposition has been applied successfully for manyapplications, the exact mechanisms that allow a deposit to be formed are still not entirelyclear [93]. Fukada et al. [94] gives a comprehensive account of mechanism of depositformation by EPD. Bouyer and Foissy [95] suggest that EPD is a two-step process. Underthe application of an electric field, the particles in the suspension first migrate to one of theelectrodes, depending on the particle charge, where they eventually deposit. The migrationstep involves the bulk properties of the colloidal dispersion (bath conductivity, viscosity,particle concentration, size distribution, and surface charge density) and the actual fieldstrength in the bath. The deposition step proceeds by a complex superposition of

28 L. Besra, M. Liu / Progress in Materials Science 52 (2007) 1–61
electrochemical and aggregation phenomena. The production of dense and cohesivedeposit requires that the particles lose their charge at the electrode.
12.1. Flocculation by particle accumulation
The first attempt to explain the phenomenon of EPD was made by Hamaker [1] andHamaker and Verwey [96]. They pointed out that successful EPD needs stable suspension.They observed that an EPD suspension, when allowed to stand, produced a stronglyadhering sediment. Therefore, they suggested that the formation of deposit by electropho-resis is akin to the formation of a sediment due to gravitation and that the primary func-tion of the applied electric field in EPD is to move the particles towards the electrode toaccumulate. The pressure exerted by the incoming particles enables particles next to thedeposit to overcome the interparticle repulsion. This mechanism is feasible when deposi-tion does not occur at the electrode, i.e., deposition on a dialysis membrane [2]. It explainsdeposits on porous membranes that are not electrodes. Vanderperre [97] noted that, whenthe solids loading is increased, the zeta potential of the particle shifts towards the isoelec-tric point. This observation supports this mechanism.
12.2. Particle charge neutralization mechanism
Grillon et al. [98] suggested that particles would neutralize upon contact with the depo-sition electrode or the deposit and then become static. This mechanism is important forsingle particles and monolayer deposits. It explains deposition of powders that chargeon salt addition to the suspension. This mechanism explains initial stage deposition fromvery dilute suspensions but is invalid under the following conditions: (a) EPD for longertimes (thick deposits), (b) when particle–electrode processes are prevented, e.g. semi-per-meable membrane induces deposition between the electrodes, and (c) when reactions occurat the electrode which alter the pH thereabout.
12.3. Electrochemical particle coagulation mechanism
This mechanism implies reduction of the repulsive forces between particles. Koelmans[99] calculated the expected increase in ionic strength next to an electrode and foundthat the ionic strength was of the same order as required to flocculate a suspension. Inhis view, the interparticle repulsion decreases due to the increase in electrolyte concentra-tion near the deposition electrode. This in turn lowers the zeta potential and inducesflocculation of particles which collapse to deposit. Since a finite time is required for theelectrolyte concentration to build up near the electrode, one expects that deposition wouldnot occur before a certain time has passed. Koelmans [99] indeed found that MgCO3 par-ticles suspended in methanol gets collected on the electrode as soon as the potential wasapplied, and that they remain there only after certain critical time after voltage was cut-off. The magnitude of the critical time was found to be inversely proportional to theapplied voltage to the second power. Hence the critical time can be very short, whichexplains why it is frequently not observed.
This mechanism is plausible when the electrode reactions generate OH� ions, e.g., sus-pensions containing water. This mechanism is invalid when there is no increase of electro-lyte concentration near the electrode.

L. Besra, M. Liu / Progress in Materials Science 52 (2007) 1–61 29
12.4. Electrical double layer (EDL) distortion and thinning mechanism
The explanation for invalidation of electrochemical coagulation mechanism when thereis no increase of electrolyte concentration near the electrode, was offered by Sarkar andNicholson [5] by considering the movement of a positively charge oxide particle towardsthe cathode in an EPD cell as shown in Fig. 13. When the particle lyosphere system (thecounter ions from liquid around the charged particle forms what is called diffuse doublelayer or lyosphere) moves, fluid dynamics and applied electric field will distort the doublelayer envelope in a way such that it becomes thinner ahead, and wider behind the particle.The cations in the liquid also move to the cathode along with the positively charged par-ticle. The counter ions in the extended ‘tail’ will tend to react with these accompanying
Fig. 13. Electrical double layer distortion and thinning mechanism for electrophoretic deposition [5].

30 L. Besra, M. Liu / Progress in Materials Science 52 (2007) 1–61
cations in high concentration around them. As a result of this chemical reaction, the dou-ble layer around the ‘tail’ of the particle will thin so that the next incoming particle (whichhas a thin leading double layer) can approach close enough for London Van der Waals(LVDW) attractive force to dominate and induce coagulation/deposition. The distortionof the double layer leading to coagulation is plausible considering the high concentrationof particles near the electrode (or high collision efficiency). Secondly, this mechanismworks for incoming particles with thin double layer heads, coagulating with particlesalready in the deposit.
13. Multi-component deposition
Unlike the electrophoretic deposition of single component, the deposition of two ormore components simultaneously from the same suspension is somewhat complex andtricky. This is of special significance during deposition of composite or hybrid materials.Unless due care is taken to ensure similar ionic charge and density around each compo-nent, multi-component deposition would not be possible [36]. The particles with a positivesurface charge would deposit on the cathode whereas the negatively charged particles willtend to deposit on the anode. Addition of a suitable additive like dispersant will have animportant role to play in these cases. However, the choice of additives should be made insuch way that the resultant sign and magnitude of surface charge on the particles are com-parable. In some cases, although each of the particle species have same sign of charge, theycould deposit at different rates depending on the volume fraction of solids in the suspen-sion. If the volume fraction of solids is high, the powders deposit at an equal rate. If how-ever, the volume fraction of solids is low, the particles can deposit at rates proportional totheir individual electrophoretic mobility [44].
Fig. 14. Characteristic electrophoretic deposition of various ceramic powders observed in mixed solution ofacetylacetone (Acac) and ethanol (EtOH) under conditions of d.c. electric field of 300 V cm�1, concentration ofdispersed powders of 2.5 g l�1, and deposition time of 2–3 min. For deposition of ST, propanol was used [60].
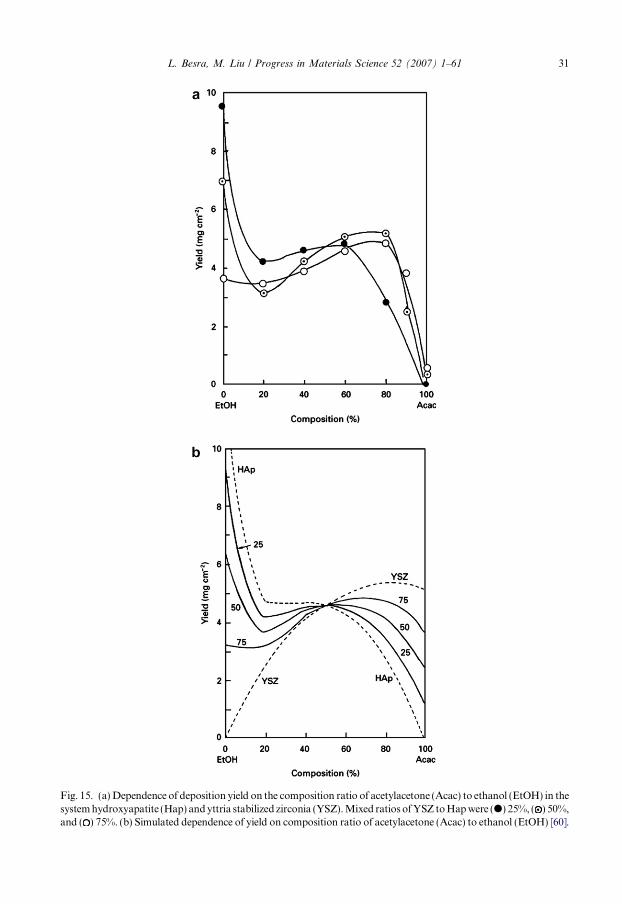
Fig. 15. (a) Dependence of deposition yield on the composition ratio of acetylacetone (Acac) to ethanol (EtOH) in thesystem hydroxyapatite (Hap) and yttria stabilized zirconia (YSZ). Mixed ratios of YSZ to Hap were (d) 25%, ( ) 50%,and ( ) 75%. (b) Simulated dependence of yield on composition ratio of acetylacetone (Acac) to ethanol (EtOH) [60].
L. Besra, M. Liu / Progress in Materials Science 52 (2007) 1–61 31
32 L. Besra, M. Liu / Progress in Materials Science 52 (2007) 1–61
Borner et al. [100] pointed out that the particles with higher mobility will deposit fasterat the beginning of the deposition process. However, it also depletes the suspension fasterand, due to the dependence of the deposition rate on local concentration, the rate of depo-sition of the high mobility component slows down. Yamashita et al. [60] observed thiseffect is prominent at longer deposition times during the deposition of zirconia/hydroxy-apatite. They employed mixed solvents (ethanol and acetylacetone), for the deposition of avariety of ceramic powders such as hydroxyapatite (HAp), barium titanate (BT), stron-tium titanate (ST), yttria stabilized zirconia (YSZ), magnesia, alumina, lead zirconate tita-nate (PZT), and their mixtures on platinum foil. They observed effective deposition ofhydroxyapatite from its suspension in ethyl alcohol (EtOH), but very rare coating fromits suspension in acetylacetone (Acac) (Fig. 14). Strontium titanate (ST) also depositedwell from its suspension in EtOH compared to acetylacetone. On the other hand the depo-sition yield of both YSZ and MgO increased with an increase in the amount of Acac in themixed solution as shown in Fig. 14.
Fig. 15 demonstrates the dependence of the deposition yield on both the composition ofsolution media and the mixed ratio of powders. With increase in the ratio of Acac toEtOH, there is first a steep decrease in the yield of HAp–YSZ mixture to a minimum, thenan increase to the maximum values, thereafter a decrease again to 0. With a smaller mixingratio of YSZ to Hap, larger yield was obtained in lower mixing region of Acac to EtOHwhile higher YSZ to Hap resulted in a larger yield in a medium to high ratio of EtOH toAcac. The use of mixed solution experimentally proved to be effective for control of thecomposition of deposited layers. Their simulated results (via the additive rule), agreedreasonably well for <70% acetylacetone (Fig. 15). At higher than 70%, the deposition ofmixed powders is limited even in higher YSZ content, although YSZ is deposited wellin Acetylacetone. This large difference between simulated and observed results may sug-gest the interference of HAp with the behaviour of YSZ powders or the absorption of acet-ylacetone on YSZ.
14. Drying of deposits produced by EPD
Depositing ceramic or other powder on a metal (or a conductive substrate) by EPD isrelatively simple. But the most important factor is how to avoid cracking in the ceramiccoating during drying and sintering. There have been reports of cracking of the depositsduring sintering specially in the cases of thicker deposits. Therefore, a careful control ofthe sintering parameters is necessary to combat this problem. It is important that substrateand as-deposited film be homogeneous on a micron scale; large variations in compositionor green density of the substrate or film could lead to differential densification and warpingof the sintered bilayer. During drying and sintering, the shrinkage of deposit/coating couldbe substantially different from the substrate depending on the material properties andcomposition. As a result, tensile/compressive stresses are developed in the coating/sub-strate and are relieved by the formation and propagation of cracks that originate fromflaws or defects in them.
The following scenarios are possible [101]: (a) the film shrinks more than the substratethereby putting the film in tension (Fig. 16a) and results in porosity in the film on appli-cation of a force/weight on the bilayer during sintering; (b) the substrate shrinks morethan the film putting the film in compression (Fig. 16b); and (c) the film and the substrate

Fig. 16. Schematic of different possible configuration of bilayer consisting of substrate and deposit on shrinkagedue to drying and sintering: (a) film shrinks more than substrate; (b) the shrinkage of film and substrate matchesexactly; (c) the substrate shrinks more than the film [101].
L. Besra, M. Liu / Progress in Materials Science 52 (2007) 1–61 33
have identical shrinkage profiles and the shrinkage matches exactly leading to a flat bilayerafter firing (Fig. 16c).
There are several approaches that can be adopted to avoid cracking during drying.Recently, Sarkar et al. [47] reviewed critical issues of electrophoretic deposition and out-lined strategies to avoid cracking of the deposit during sintering. When a wet coating orgreen body undergoes drying, the origin of stresses in it is due to capillary forces. Crackingcan be avoided by minimizing capillary stresses either by using a low surface tension sol-vent, or avoiding fine pore structure in the coating. However, attention must also be paidto the evaporation rate of the solvents. Peng and Liu [45] presented an account of this factduring drying and sintering of YSZ film deposited on porous La0.9Sr0.1MnO3 (LSM) sub-strates, from suspensions in acetone and ethanol. Acetone has small surface tension buthigh evaporation rate; it dries too fast when the film is taken out from the solvent, leadingto cracks in the green YSZ films. Ethanol has slower evaporating rate, but its large surfacetension tends to pull the YSZ film off the substrate as the sample is taken out from thesuspension. In order to overcome these problems, a mixture of acetone and ethanol wereused subsequently in their experiments.
Capillary stresses can also be removed altogether by adopting freeze/supercritical dry-ing since in this process the solvent phase is sublimed. Furthermore, controlled slow dryingvia adjustment of vapour pressure of solvent in the drying medium will help control thecapillary stresses and as a result, formation of drying cracks may be avoided. For aqueouselectrophoretic deposition, the use of a high humidity oven for drying is generally found toprevent cracks.
Ceramic coatings typically suffer about 10–15% linear shrinkage during sintering. Tra-ditionally cracking during sintering is avoided by using a liquid phase during sintering; agood example is sintering of glass enamel on a metal substrate. The composition isadjusted in such a way that its thermal expansion is closely matched with the substrate.As a result, it does not form crack during cooling from the sintering temperature.

34 L. Besra, M. Liu / Progress in Materials Science 52 (2007) 1–61
To avoid cracking during sintering, one can also use a substrate that also shrinks duringsintering. Recently, this approach has been used, particularly in solid oxide fuel cell(SOFC) fabrication where typically an YSZ electrolyte is deposited on a partially sinteredor an unsintered NiO–YSZ cermet anode substrate. During sintering, both the substrateand the coating shrinks, thereby avoiding cracks. Furthermore, the compositions of thesubstrate and coating are chosen such a way that their thermal expansion coefficientsmatch to each other, minimizing any thermal stress and resultant cracking during coolingfrom the sintering temperature.
The problem of cracking in electrolytic zirconia deposits which usually occurs upondrying has recently been addressed by the use of polymer additives [102,103]. It was shown[102] that poly(diallyldimethylammonium chloride) (PDDA) acts as a binder, providingbetter adhesion of zirconia deposits and preventing cracking. An important finding wasthat the amount of organic phase in the deposits could be changed by variation of PDDAconcentration in solutions. These results pave the way for EPD of thick films.
15. Design of electrophoretic apparatus
The design and construction of an electrophoretic deposition facility is straightforward,an attraction of the process being its flexibility with regards to green shape geometry. Flatplates, crucible shape, tubes of circular or rectangular cross-section of any size can be depos-ited by means of appropriate design of the mandrel or forming electrode. Although theequipment requirement for electrophoretic deposition are simple, a number of design fea-tures are needed to be taken into consideration. The materials used in construction of thechamber must be selected carefully to avoid neutralization of the charge on the suspendedparticles. It also must be stable in the solvent or its vapour during the deposition process.If the size of the particles are large and deposition times longer, then continuous agitationmay be necessary to avoid gravitational settling. Agitation can be achieved by magnetic stir-ring or by continuous peristaltic pumping. The chamber geometry needs careful design toensure a uniform electric field between the electrodes. The thickness profile of deposit canbe influenced not only by the field distribution but also by the flow pattern of the suspensionin the chamber. For uniform field distribution between the electrodes, the surface area ofcounter electrode is generally made relatively larger than the deposition electrode.
To our knowledge, there is no specific commercial design of any electrophoretic depo-sition apparatus. Different research groups have employed a variety of different designsdepending on the requirement of different shapes. Most of the designs are based on depo-sition on flat surfaces [10,104–108] although some designs on deposition of tubular shapes[69,107] have also been adopted. For tubular shape designs, sometimes, the container itselfacted as the counter electrode.
16. Deposition on non-conducting substrates
Conventionally, one of the pre-requisite for electrophoretic deposition is that the sub-strate be electrically conducting, for which most EPD processes reported in the literatureare on metallic or carbon/graphite substrates. In some instances, the deposition substratehas been subjected to heat treatments in reducing atmospheres [109] or sputtering of a con-ducting coating such as platinum [110] to make it electrically conductive before EPD. Mat-suda et al. [111] used a thin layer of graphite coating on one side of the non-conducting

L. Besra, M. Liu / Progress in Materials Science 52 (2007) 1–61 35
NiO–YSZ porous substrate before EPD. The YSZ films were deposited on the reverse sidethat did not contain the graphite layer. Such preparatory step, however, make the EPDprocess more expensive. If it were possible to deposit on non-conducting substrates, thenthe EPD process would be more attractive technology for application in wide spectrum ofmaterials processing. Recently, we reported electrophoretic deposition of YSZ films onNiO–YSZ substrate which were previously deposited electrophoretically on thin discs ofcarbon sheets [53]. The NiO–YSZ deposit along with the carbon sheet substrate was trans-ferred into a YSZ bath followed by constant voltage EPD for deposition of YSZ. Thedeposition of YSZ was possible only when the NiO–YSZ substrate was saturated with sol-vent. No deposition was possible on completely dried substrates. The carbon sheets getsburnt off during subsequent sintering stage leaving behind a porous NiO–YSZ with a thinand dense YSZ layer on it. In this paper, we present conditions under which electropho-retic deposition of YSZ is made possible on non-conducting NiO–YSZ substrates whicheliminates the need for heat treatment in reducing atmospheres or the need for coatinga conductive backing. The YSZ film thus deposited was found suitable as electrolyte forsolid oxide fuel cell (SOFC) application. In some subsequent communications [112,113],the EPD of YSZ particles on the non-conducting NiO–YSZ substrate was made possiblethrough the use of an adequately porous substrate which facilitates availability of electricfield near the substrate. The porous substrates when saturated with the solvent, helps inestablishing a ‘‘conductive path’’ between the electrical contact and the particles in suspen-sion. Deposition was found to increase with increasing substrate porosity up to a certainvalue. Higher the applied potential, more was the deposition. For a given applied poten-tial, there exists a threshold porosity value above which deposition by EPD was possible(Fig. 17). No deposition was possible on substrates with porosity below the thresholdvalue. The microstructure of YSZ film thus deposited is shown in Fig. 18. SOFC con-structed on bilayers of NiO–YSZ/YSZ with YSZ layer thickness of 40 lm, exhibited opencircuit voltage (OCV) of 0.86 V and power density of 263.8 mW/cm2 when tested with H2
as fuel and ambient air as oxidant.
0
0.01
0.02
0.03
0.04
0.05
50 55 60 65 70 75 80Porosity, %
Dep
osite
d w
eigh
t, gm 100 V, 3 min
25 V, 3 min
Fig. 17. Influence of substrate porosity on electrophoretic deposition of YSZ on non-conducting NiO–YSZ, fromits suspension in acetylacetone (deposition area: 1.0825 cm2).

Fig. 18. Surface (a) and cross-sectional SEM image of YSZ film (b) deposited on NiO–YSZ substrate(porosity = 72.55%) at 100 V for 3 min and sintered at 1400 �C for 2 h.
36 L. Besra, M. Liu / Progress in Materials Science 52 (2007) 1–61
17. Application of EPD
17.1. Assembly of nanoscale particles into nanostructures and micropatterned thin films
The emerging fields of nanoscience and nanoengineering are leading to unprecedentedunderstanding and control over the fundamental building blocks of all physical matter.Today, the nanophase engineering expands in a rapidly growing number of structural

L. Besra, M. Liu / Progress in Materials Science 52 (2007) 1–61 37
and functional materials, both inorganic and organic. The rising interest in nanostructuredmaterials is because they often exhibit new properties that are remarkably different fromthose of bulk materials, allowing the manipulation of mechanical, electrical, magnetic,optical, catalytic and electronic functions. The ability to fabricate materials and structureswith sub-micrometer and nanoscale features reliably and economically is of interest inmany areas of science and technology. Significant and vigorous research efforts arefocused on controlling the assembly of inorganic and metallic nanoscopic particles[114]. The production of materials with micrometer, submicrometer and nanoscale patternis of importance in a range of applications, such as photonic materials, high density mag-netic data storage devices, microchip reactors, and biosensors. One method of preparingsuch structures is through the assembly of colloidal and nanoparticles.
The creation of nanophase or cluster-assembled materials is usually based upon the cre-ation of separated small clusters which are then fused into a bulk-like materials or as a thinfilm or even by embedding into a solid matrix, polymers or glass either in a disordered orordered array. One specific goal in these investigations has been to tailor the size, shape,and geometrical arrangement of nanoscopic particles, clusters, and aggregates in an effortto produce desired properties. Ordered assemblies of nanometer-sized particles are a classof nanomaterials that provide exceptional potentials to achieve one-, two- and three-dimensional structures for a wide variety of applications ranging from photonic devicesto memory devices, two-dimensional array of magnetic nanoparticles, or single electronmicroelectronic devices, quantum-confined size tunable luminescence behaviour, coulom-bic staircase effects, photonic band-gap responses, optimization of localized electromag-netic surface enhancement phenomena, etc. In order to make full use of this potentialfor materials engineering, it is important to identify and gain control over the relevantgrowth and ordering parameters.
Conventionally, micropatterned assembly of colloidal or nanoparticles have beenproduced with lithographically patterned electrodes, or micromoulds. Majority of thesemethods suffers from drawbacks such as: (i) slow kinetics of assembly (hours to days),(ii) surface particle density is sometimes difficult to regulate, (iii) difficulty in creating pat-terned assembly over large area. These drawbacks are largely a consequence of dealingwith very small particles for which the colloidal forces, i.e., buoyancy, frictional, and cou-lombic forces outweigh the gravitational force and act to keep the particles in suspension.Consequently, the particle transport is governed solely by Brownian motion, resulting incompletely random particle–particle and particle–substrate collision.
In an attempt to circumvent some of these limitations, recent studies have focused oncreating templated nanoparticle assemblies using methods such as microcontact printingof self-assembled monolayers (SAMs) [115], nanoetching [116] and e-beam lithography[117] to fabricate spatially and density controlled nanoparticle architectures.
Since the colloidal particles are usually charged, the concept of electrophoretic deposi-tion utilizing a directional force (external electric field) has generated significant interestrecently for patterned assembly of nanoparticles [118]. EPD of nanoparticles was first usedby Giersig and Mulvaney [119,120] to prepare ordered monolayers of gold nanoparticles.Prior to that this method had only been used to produce 2D and 3D ordered structures oflatex particles, such as polystrene and silica [121,122]. It has now been put forward bysome researchers that the EPD method can be developed into a general method to prepare2D and 3D ordered structures of nanoparticles by means of using sols that maintain col-loidal stable on the electrode/sol interface; however, this conclusion is based on the work

38 L. Besra, M. Liu / Progress in Materials Science 52 (2007) 1–61
done on micrometer-sized polystrene, silica particles, and nanometer-sized gold particlesand it requires further evidence. Tabellion and Clasen [123] investigated the depositionstructure of gold, silver and rare-earth carbonate nanoparticles by EPD and found thatthe composition and surface condition as well as the size distribution of the particlescan affect the order of the particles in the monolayer. It was also observed that particleshaving similar diameter tended to pack together to form more orderly packed area com-pared to particles with wide size distribution. The ordering of Au nanoparticle thusobtained for different deposition conditions are shown in Fig. 19.
As already discussed, the colloidal and nanoparticles tend to remain in suspension forlong periods due to Brownian motion. They maintain their Brownian motion even as theyarrive on the surface, i.e., they do not become immobilized on the surface at lower voltagesand require higher voltages to overcome Brownian motion for attachment to the surface.Boehmer [124] illustrated this fact by in situ observation of submicron sized latex particleson indium tin oxide (ITO) electrode during electrophoretic deposition. Strong two-dimen-sional clustering of the particles on the electrode surface was observed upon application ofa potential similar to those of Tabellion and Clasen [123] shown in Fig. 19. Interactionsbetween particles were observed over distances of several particle diameters, especiallyfor interactions between single particle and clusters. Even cluster–cluster aggregation phe-nomena were observed. Once the clusters are formed, they rapidly grow and the distanceover which they attract newly arrived particles on the surface increases. Particles arrivingat a cluster move around its periphery until they reach their most favourable position, i.e.,a position where they may be incorporated into the already existing lattice. It was alsoreported by Boehmer [124] that with increasing salt concentration, the deposition ratedecreases because the conductivity of the suspension increases and, consequently, thepotential drop across the suspension becomes smaller. The decrease in deposition/
Fig. 19. Transmission electron microscope (TEM) images of Au nanoparticles on carbon coated copper gridformed by EPD at 20 �C (a) at 100 mV cm�1 for 5 min, (b) at 500 mV cm�1 for 5 min [123].

L. Besra, M. Liu / Progress in Materials Science 52 (2007) 1–61 39
aggregation of the particles at the electrode with increasing ionic strength does not agreewith the DLVO theory. So the clustering is not a consequence of DLVO type interactionas proposed by Giersig and Mulvaney [119,120] for gold nanoparticles on graphite. Herethe interactions were long range, extending over one or more particle diameter, which ismuch larger than the Debye length. Boehmer [124] suggested that over this long rangethe distortion of the electric field by the particles and hydrodynamic interaction is impor-tant and has to be considered to formulate possible interpretation of such observation.Hayward et al. [125] proposed that once the particles are close to the surface, where theyremain mobile, electro-hydrodynamic or electro-osmotic effects assemble them into arrays.Particles can be permanently attached to the surface by increasing the attractive forcesbetween the particle and the electrode. When the attractive forces exceed that due to stericrepulsion, entry into the primary minimum creates a permanent bond. Li et al. [126] pre-sented the results of electrophoretic deposition of ligand-stabilized silver nanoparticles(LSSN) synthesized by photochemical reduction. Their results indicate that the synthesiz-ing conditions of LSSN, such as irradiation time during synthesis, and the concentrationof surfactant used, had a dominant influence on deposit quality. When the irradiation timewas 5 min, the deposited film was in the form of individual nanoparticles. However whenthe irradiation time was increased to 10 min, the deposited film was in the form of singlecrystal. Lower concentration of surfactant led to better quality single-crystal silver film.Higher deposition voltage led to coalescence of LSSN in the film. One of the major prob-lems encountered during the direct deposition of gold nanoparticles (e.g., by solvent evap-oration technique) is the interparticle interaction leading to aggregation effects [127]. Uponaggregation, the metal nanoparticles lose the surface plasmon absorbance that is charac-teristic of individual gold nanoparticles. These films usually exhibit blue colourationcaused by the red-shift in the absorption band. One way to overcome these interparticleinteractions is to functionalise the gold nanoparticles (for e.g. with thiols). Chandrasekh-aran and Kamat [127] reported deposition of three-dimensional network of gold nanopar-ticles on a nanostructured TiO2 film by electrophoretic deposition at DC electric fieldbetween 50 and 500 V. Fig. 20 shows the absorption spectra of gold film cast on nano-structured TiO2 film obtained after different time of deposition, recorded using a UV/VIS spectrophotometer. At early stages of electrophoretic deposition, the absorption is
Fig. 20. Absorption spectra of gold films cast on nanostructured TiO2 films. The spectra were recorded at timeintervals of (a) 0, (b) 2, (c) 10, (d) 18, (e) 26, (f) 34, (g) 46, (h) 50, (i) 58, and (j) 70 min. A dc electric field of 100 Vwas applied to OTE/TiO2 electrode in contact with 2.5 mM gold colloidal suspension in toluene containing2.4 mM of tetraoctylammonium bromide (TOAB). The inset shows the absorption spectrum of 0.3 mM of Aucolloids in toluene [119].

40 L. Besra, M. Liu / Progress in Materials Science 52 (2007) 1–61
dominated mainly by the TiO2 film (spectra a and b in Fig. 20). With increasing deposi-tion time, an increase in the absorption was noticed in the visible wavelength range(spectra c–j). The prominent absorption maximum seen at 516 nm arises from the surfaceplasmon band gold nanoparticles. The increase in the absorption of the surface plasmonband with time represents the deposition of gold nanoparticles. By controlling the concen-tration of gold particles in the toluene suspending medium, and the applied voltage, it waspossible to control the thickness of gold film without inducing aggregation effects.Recently, several experimental studies have demonstrated that confinement of colloidand nanoparticles in a suitable width/area can significantly enhance colloid and nanocrys-tal growth to produce single-crystal or close-to-single crystal structure. Kumacheva et al.[128] showed how transition from a disordered state to strongly ordered state occurs intwo-dimensional arrays of colloidal microspheres, following their confinement to thinnergaps. The confinement induces disorder-order transition at a well defined width of the gap.Mondispersed polymethyl methacrylate (PMMA) particles of 0.58 lm size were electro-phoretically deposited onto a substrate patterned with an array of electro-conductivegrooves whose progressively diminishing width was either commensurate or incommensu-rate with the dimensions of a discrete number of colloidal spheres. Their results indicatedno noticeable difference in ordering between particles deposited on non-patterned sub-strate and those deposited on patterned substrates with groove width exceeding ca.7.5 lm. The structures of the colloidal array was essentially disordered with occasionalordered domains not exceeding 20 lm2 (Fig. 21a). Layering of the particle was observed
Fig. 21. SEM images showing PMMA particle arrays electrophoretically deposited on (a) non-patterned, and (b,c) patterned indium tin oxide (ITO) surface. The width of the grooves are 5.5 lm for (a) and 4.2 lm for (b, c)[128].
L. Besra, M. Liu / Progress in Materials Science 52 (2007) 1–61 41
to occur parallel to the rib walls when the groove width was ca. 6.0 ± 1.3 lm. A dramaticenhancement in organisation of the particles in 2D hexagonal close-packed array wasobserved for groove width less than 4.7 lm (Fig. 21(c)). Kumacheva et al. [128] have alsoobserved that at the beginning of the electrophoretic deposition process, the structures ofcolloidal array in the groove are essentially random. However, as more particles reach theelectrode, reorganization of the particles happen in the groove by squeezing of the newlyarriving particles between the already deposited ones and follows a synergistic particlerearrangement. This resulted in large scale particle ordering for assembly of the colloidalspheres in 4.2 lm wide groove. A quantitative measure of planar packing density for 2Darray of particles in the groove as a function of the groove width showed oscillation withsome periodicity. The theoretical width of groove required to accommodate a discretenumber of close-packed hexagonal particles was found to be about 5 ± 3% smaller thanthe experimental values of groove widths providing strong microsphere ordering. This dis-crepancy is presumably caused because of a larger effective particle diameter due to elec-trostatic repulsion between the particles.
Recently an interesting but significant development has taken place in preparation ofsize tunable ordered array of nanostructures by colloid sphere and block polymer templateassisted electrophoretic deposition. In this approach, templates are first made by coating afilm of colloid spheres of polystrene latex or block co-polymers micelles on the substratesby drop coating or spin coating followed by their self-assembly or subjecting the film toselective chemical etching, ozonation, or through exposure to UV light treatment. Theabove treatments can selectively remove segments of the block polymer leading to devel-opment of different structural patterns. The form of structural patterns can be varied bysuitable choice of block polymer. Nanoparticles of desired materials are then incorporatedinto these templates by electrophoretic deposition. Rogach et al. [129] reported impregna-tion of luminescent CdTe nanocrystals into such template made of polystrene latex spheresdeposited on indium tin oxide (ITO) coated glass substrate by electrophoretic deposition.It is noted that electrophoretic deposition technique also opens the possibility of prepara-tion of uniform coatings from photonic crystals on curved substances such as spheres,which would be impossible by means of gravitational or centrifugal force. Fig. 22 showselectrophoretic impregnation of CdSe nanoparticles into nanotrenches in templatesprepared from polystrene-block-poly(methyl methacrylate) (PS-b-PMMA) diblockcopolymers [130]. The quantum dots thus prepared by this method maintained its photo-luminescence property within the nanostructure.
17.2. Near shape manufacturing of complex-shaped glasses and ceramics
Many recent reviews on ceramic processing have clarified that most traditional formingmethods such as dry pressing followed by machining, slip casting, pressure casting, injec-tion moulding, etc., suffers from different inherent problems like introduction of heteroge-neities during processing, slowness of the process, prohibitive cost to form complexshapes, etc. The dry pressing for example, is a fast fabrication method attractive for largescale production, but involves high pressure requirements, develops density gradient in theceramic body with inhomogeneous microstructure, and needs cost intensive machining toobtain complex shaped objects. All the drain-casting techniques such as slip casting, pres-sure casting and centrifugal casting involves a solid–liquid separation process to formdense green bodies. But these traditional drain casting methods are plagued by some

Fig. 22. TEM images of template with nanotrenches generated from lamellar PS-b-PMMA diblock copolymerthin film: (a) before deposition; (b) after 1 min deposition time with an electric field strength of 0.4 V/cm; (c) after10 min deposition time with an electric field strength of 0.8 V/cm [130].
42 L. Besra, M. Liu / Progress in Materials Science 52 (2007) 1–61
generic problems which include slowness of the process, dependence of the suspensionproperties on flow of liquid, development of stress gradient which may also lead to

L. Besra, M. Liu / Progress in Materials Science 52 (2007) 1–61 43
non-uniform densities in the green body and causes mass segregation because of differencein particle size and density.
The major problem confronting the injection moulding is the removal of binder whichnormally constitute about 25–30 wt.% polymer for a 50 vol.% solids. Binder burnout mustproceed at a slow rate (taking up to several days) to avoid problems with slumping andcrack formation. The polymer removal time increases drastically when the size of the greenbody increases, making it difficult to produce parts with thick cross-sections.
Drying process also has a major influence on the green microstructure and productionrate. Drying is a critical operation, which has to be controlled to avoid cracking and warp-ing. Fast drying can cause cracks. Decreasing the drying rate results in increasing greendensities. During drying, transport of evaporating dispersing media can cause binderand small particle migration to the surface. This can lead to additional problems duringburnout and sintering. These problems can be minimised or avoided when the binder con-tent is low or the dispersing media is sublimated.
Another aspect of concern when casting submicron and nanosized powders is theattainment of limited solid loading and hence green density due to the high surface areaof the particles. The low green density results in a high shrinkage during drying and sin-tering. Thus sophisticated process control is necessary for larger and more complex-shaped components. This makes near-shape manufacturing very complicated. One possi-ble solution is to increase the green density significantly. This can be achieved by combin-ing powders with distinctly different particle size distribution, like mixture of nanosizedand microsized particles. It is important that no size dependent separation of the particlesoccurs during shaping because this can result in inhomogeneous sintering behaviour anddistortion of the component.
Since the electrophoretic deposition process is not dependent on flow of liquid and alsouses little or no binder, it is being looked upon as a suitable method for fabrication of nearnet shaped glasses and ceramics. Tabellion and Clasen [105] demonstrated that near-shapemanufacture of complex structures and large components is possible by EPD from aque-ous suspension. The shaping of complex silica glass and zirconia components, like tubes orstructured parts were made by EPD. Three-dimensional shaped porous polymer mouldswere used as ion-permeable deposition surface (Fig. 23a). Fig. 23b shows the sintered zir-conia components shaped by EPD on porous moulds and subsequent firing. To enablenear-shape manufacturing mixtures of nanosized and microsized particles were electro-phoretically deposited. By combining nanosized powders with micrometer powders greendensity could be increased significantly and shrinkage could be minimized (<12%).
17.3. Solid oxide fuel cell (SOFC) fabrication
Solid oxide fuel cells (SOFCs) have attracted great attention as new electric power gen-eration system because of their high energy conversion efficiency, clean power generation,reliability, modularity, fuel adaptability, noise-free, excellent long term stability and theversatile nature of the technology for direct conversion of chemical energy to electricalenergy [131]. The potential of solid oxide fuel cells (SOFCs) to meet future electric powerdemand, utilizing the current fuel resources, is well described in the literature [132,133]. Ingeneral, an SOFC consists of a stack of multiple single fuel cells. A single SOFC cell inturn comprises of a solid electrolyte layer with an oxidizer electrode (cathode) on one sideof the electrolyte and a fuel electrode (anode) on the other side. The electrodes are required

Fig. 23. Porous polymer moulds (a) and sintered zirconia component (b) shaped by EPD from aqueoussuspension of nano and microsized zirconia suspension [105].
44 L. Besra, M. Liu / Progress in Materials Science 52 (2007) 1–61
to be porous, or at least permeable to oxidizer at the cathode and fuel at the anode, whilethe electrolyte layer is required to be dense so as to prevent leakage of gas across the layer.While the existing SOFC technology has demonstrated much higher energy efficiency withminimal pollutant emission over conventional energy technologies, the cost of the currentSOFC systems is still prohibitive for wide commercial application. To be economicallycompetitive, the cost of the materials and fabrication must be dramatically reduced.
Yttria-stabilized zirconia (YSZ) is by far the most popular material used as SOFC elec-trolyte because of its unique combination of properties such as high chemical and thermal

L. Besra, M. Liu / Progress in Materials Science 52 (2007) 1–61 45
stability and pure ionic conductivity over a wide range of conditions. Solid oxide fuel cellsbased on YSZ have been developed for high operating temperature range of 900–1000 �C.Such high operating temperature was advantageous as it was beneficial for internalreforming of fuels such as natural gas, promotes rapid electrocatalysis with non-preciousmetals, and produces high quality byproduct heat for cogeneration, but it normallyinduced some adverse influence on the cell and/or stack stability due to degradation[131,134]. Thus reducing the operating temperature of SOFC has been one of the hottestissues for the commercialization of SOFC in the last 10 years. The motivation for reducedoperating temperature SOFCs to below 800 �C or less includes reduction in the degrada-tion of cell components, greater flexibility in cell design, lower manufacturing cost bybroadening materials choices as cheap and readily available ferritic steel can be used forthe interconnector [135,136]. However, the electrolyte conductivity and electrode kineticsdrop significantly with lowered operating temperature. This can be overcome by loweringthe electrolyte resistance (i.e., ohmic losses across the electrolyte can be minimized) eitherby decreasing the electrolyte thickness or with alternative materials of higher ionic conduc-tivity at lower temperatures. Although it has been proposed elsewhere that LaGaO3-basedoxides [137] and cerium oxide doped with gadolinium (GDC) [132,138] exhibits high oxideion conductivity to be useful as electrolytes in intermediate temperature SOFCs, the pro-duction of thin films from solid electrolytes still has been important for the development ofcommercial SOFCs. Recently, considerable efforts have been directed by a number ofgroups worldwide to reduced-temperature SOFCs based on thin film electrolyte. Severalmethods currently used for thin film deposition vary greatly with respect to methodologyand result [139]. These methods include the physical vapour deposition (PVD) such assputtering, pulsed laser deposition, molecular beam epitaxy (MBE) [140], chemical vapourdeposition (CVD) or electrochemical vapour deposition methods (EVD) [141–143], com-bustion chemical vapour deposition (CCVD) [144], plasma technologies [145,146].However, the PVD and CVD deposition methods ordinarily require sophisticated andexpensive equipment making them either undesirable or impracticable for implementationin manufacturing environment. They are also plagued by high processing temperaturesand limitations on the materials from which the support anode is made.
To make thin film solid oxide fuel cells more efficient and less expensive to fabricate,improved method for forming the porous electrode and non-porous electrolyte used insuch devices are needed. The colloidal deposition routes have been proven to be simpleand less expensive processing method for many advanced ceramics [2]. The colloidalmethod such as dipcoating, slipcasting, etc. though inexpensive are rather poor withregard to controlling the deposition. Therefore, the development of alternative methodfor the preparation of a thin, but gas tight electrolyte film remains a challenging project.
Considering the vast fields of application, the EPD technique is being recognized tohold a great potential for economic fabrication of thin, dense and gas tight electrolyteas well as porous electrodes for SOFC applications. However, in spite of these promises,there seems to be little application of EPD in SOFC technology as evident by the availabil-ity of only a handful of related literature, possibly due to the lack of a viable EPD chem-istry and process development for the application, or due to the need for more preciseprocess control and consequently the need for higher trained operators compared to theother common production methods. To our knowledge, the first published account ofusing EPD for the production of zirconia electrolytes for SOFCs was reported by Ishiharaet al. [30,51,147,148]. In these studies, zirconia electrolyte films were deposited on

46 L. Besra, M. Liu / Progress in Materials Science 52 (2007) 1–61
platinum-coated-nickel–CaO-stabilised ZrO2 (Ni–YSZ) cermet anode and substrate ofporous Sr-doped LaMnO3 (LSM) cathode form acetylacetone slurry, using at least sixdeposition steps, each followed by a sintering step. Although it was possible to producethin and gas-tight YSZ film with high cell performance, the method is not suitable for massproduction because the technique of multiple deposition and sintering steps is compli-cated, time-consuming and inordinately expensive. In addition, without the multiple depo-sition steps, a gas-tight electrolyte layer and acceptable fuel cell performance could not beobtained. Following these reports, Basu et al. [41,149,150] attempted to use one step EPDmethod to deposit dense YSZ electrolyte on a porous doped LaMnO3 for tubular solidoxide fuel cells. They used a carbon interlayer sputter deposited by high vacuum sputteringapparatus on the porous doped LaMnO3 substrate prior to deposition of YSZ by EPD.On firing at 1250 �C, the film produced without carbon interlayer had more and largerpores, a less even surface topology, and a less uniform grain size distribution, whichbecame more pronounced at 1300 �C. The lower surface roughness and better packingdensity of the coatings produced using graphite interlayers was attributed to the more-controlled deposition and equipotential electric-field distribution created on the poroussubstrate when the interlayer is present. Although, the carbon interlayer approach pro-duced reasonably good YSZ film, it increases the cost of deposition. Peng and Liu [45]and Chen and Liu [31] demonstrated that dense YSZ thin films can be prepared on porousLa0.85Sr0.15MnO3 (LSM) substrate (of sol–gel derived powder) by electrophoretic deposi-tion, followed by sintering at 1250 �C which is about 200 �C lower than other film depo-sition approaches reported in literature. The densification of the YSZ film at such lowtemperature was due to the large shrinkage of the LSM substrate (using the sol–gel derivedpowder) which greatly enhances the densification process. However, no report was madeof any fuel cell performance. Zhitomirsky and Petric [151,152] reported the electrophoreticdeposition of La0.85Sr0.2Ga0.875Mg0.125O3�x (LSGM), La0.8Sr0.2Co0.2Fe0.8O3�d (LSCF),and (Ce0.8Gd0.2)O1.9 (CGO) on Ni foils and Ni–YSZ substrate prepared by tape casting.The goal of the work involved finding a common solvent–binder–dispersant system forcathodic EPD of these materials. Although, ethyl alcohol, phosphate ester (PE) and poly-vinyl butyral (PVB) were identified as suitable solvent, dispersant, and binder, respectively,for electrophoretic deposition, the CGO and YSZ film thus obtained were highly porouseven after sintering at 1400 �C. Therefore, further optimization of the deposition processand thermal treatment procedures are necessary in order to obtain dense deposits forapplication as electrolytes in fuel cells. Self-supported dense films of 40–80 lm thicknesswere fabricated from LSGM by EPD of those powders on graphite substrate followedby sintering at high temperature [153]. But the sintering cycle required first stage heatingto 800 �C, holding for about 9 h, followed by further heating to 1500 �C and curing for10 h. Such long sintering cycles are not only energy intensive but also time consuming.The SOFC constructed on the films exhibited power densities of 0.34 and 0.50 W/cm2
at 600 and 700 �C, respectively. Will et al. [109] reported the EPD processing of thin zir-conia electrolytes on porous anodic substrates (NiO/CeO2/ZrO2) which were prepared viatape casting. In this study, emphasis was put on the kinetics of the deposition process(including direct determination of the deposited layer thickness during EPD process)and not on achieving optimal values of the SOFC for maximum performance. Since thesubstrates for EPD are restricted to conductive materials, the NiO was reduced to metallicNi by heat treatment in 10% H2 and 90% Ar at 700 �C before the EPD experiments. TheSOFC consisting of the Ni-cermet anode, 20 lm zirconia layer processed via EPD, and a

L. Besra, M. Liu / Progress in Materials Science 52 (2007) 1–61 47
Pt cathode of 50 nm sputter coated on it exhibited a power density of 200 mW/cm2 at0.5 A/cm2and 700 �C in a 3 vol.% H2, 97 vol.% N2 atmosphere saturated with water.
As evident from the literature above, a great deal still remains to be done for commer-cial utilisation of electrophoretic deposition for solid oxide fuel cells. Preparation of con-ducting substrate, selection of suitable solvent, development of a suitable EPD chemistry,optimization of processing parameters for obtaining homogeneous, uniform and crackfree films still remains an important subject of study.
Recently we reported electrophoretic deposition of YSZ films on NiO–YSZ substratewhich were previously deposited electrophoretically on thin discs of carbon sheets [53].The NiO–YSZ deposit along with the carbon sheet substrate was transferred into aYSZ bath followed by constant voltage EPD for deposition of YSZ. The deposition ofYSZ was possible only when the NiO–YSZ substrate was saturated with solvent. No depo-sition was possible on completely dried substrates. The carbon sheets gets burnt off duringsubsequent sintering stage leaving behind a porous NiO–YSZ with a thin and dense YSZlayer on it. Fig. 24 presents the NiO–YSZ bilayer plus a layer of SOFC cathode paintedfrom a paste of LSM–YSZ (50:50 mixture), after fuel cell testing with H2 as fuel upto800 �C. The fuel cell performance is shown in Fig. 25.
17.4. Laminated materials
Layered materials can also be produced via EPD. When the desired thickness of thefirst layer is reached, the deposition electrode can be moved to a second suspension fordeposition of a layer of different composition. By changing back and forth, a layered mate-rial is readily obtained. Nicholson et al. [154] have produced ZrO2/Al2O3 laminates withalumina layers as thin as 12 lm and zirconia layers of 2 lm from ethanol-based suspen-sions. The boundaries between layers were straight and well defined showing that althoughEPD can be fast process, good control of the growth of the layers can be obtained. Thesame group also produced alumina/lanthanum laminates [155]. Ferrari et al. [156] andFischer et al. [50] produced alumina/zirconate laminates from aqueous suspensions. Hechtet al. [157] prepared superconducting multilayer tapes of (Tl,Pb)-1233 on silver tapes.
Fig. 24. A cross-sectional view (SEM) of Ni–YSZ/YSZ/LSM–YSZ after testing under H2 atmosphere at 800 �C[53].

0
0.1
0.2
0.3
0.4
0.5
0.6
0.7
0.8
0.9
1
1.1
0 200 400 600 800 1000 1200 1400 1600
Current density (mA/cm2)
Cel
l Vol
tage
(V
)
0
100
200
300
400
500
0 200 400 600 800 1000 1200 1400 1600
Current density (mA/cm2)
Pow
er density (mW
/cm2)
800 oC
750 oC
700 oC
Fig. 25. Cell voltage and power densities as a function of operating current density for a SOFC withconfiguration of NiO:YSZ (60:40 by weight)/YSZ/LSM–YSZ (50:50 by weight) fuel cells [53].
48 L. Besra, M. Liu / Progress in Materials Science 52 (2007) 1–61
Vandeperre and Van der Biest [44] made a range of SiC-based interlayers. They also pro-duced laminated SiC/graphite composite tubes [158], thus combining the ability of EPD toproduce laminated materials with the shaping capabilities of the process. Recently, Youet al. [159] reported the fabrication of SiC/TiC laminated structure by electrophoreticdeposition from acetone-based suspensions (Fig. 26).
17.5. Functionally graded materials
While layered materials are obtained by immersing the deposition electrode in differentbaths, graded materials can also be made by gradually changing the composition of the
Fig. 26. SiC/TiC laminated structure produced by constant-current electrophoretic deposition (solids load-ing = 50 g/l, deposition time for each layer = 1 min) [159].

Fig. 27. Backscattered SEM micrographs of WC-6Co/WC-25Co functionally graded materials obtained byconstant voltage electrophoretic deposition at 800 V. The second suspension was added after 1 min depositionwith first suspension (d = distance from the low cobalt side) [163].
L. Besra, M. Liu / Progress in Materials Science 52 (2007) 1–61 49
suspension from which EPD is carried out. Sarkar et al. [56] demonstrated the ability toform graded materials by slowly adding an ethanol-based suspension of an alumina powderto an ethanol-based suspension of an yttria-stabilized zirconia powder during deposition. Agradual increase in the alumina content of the deposit was observed. Later, the same groupalso produced Al2O3/MoSi2- and Al2O3/Ni-graded materials [160,161]. Zhao et al. [162]produced alumina-stabilized zirconia-graded rods from an acetone based suspension. Putet al. [163] deposited nanocrystalline WC-Co composites with a gradient in cobalt contentby means of EPD of the green materials and subsequent pressure less sintering (Fig. 27). Astarting suspension containing 100 g/l WC-6Co in acetone/n-butylamine was pumped intodeposition cell by peristaltic pump. A second suspension containing 400 g/l WC-25Co wasadded to the circulating suspension by another pump allowing to continuously change thecobalt concentration from 6% upto 17% at the end, because some WC-6Co powder is stillpresent in the suspension at the end of the experiment.
17.6. Hybrid materials
Composites and inorganic–organic hybrid materials have been proven to exhibit supe-rior properties than the conventional materials. Interesting applications of inorganic–organic hybrid materials have been reported for water-repellant coatings, opticalwaveguides, dielectric films and others [164,165]. Most of the hybrid materials are basedon organofunctional silanes, which contribute to the siloxane backbone and at the sametime play the role as a carrier of organic functions. The incorporation of various metallicelements other than Si are being investigated to alter properties of the hybrid materials[166,167]. To make full use of the properties derived from particles, it is important to con-trol the arrangement of particles with high packing density in hybrid materials. The elec-trophoretic deposition have been found to enable desired particle arrangement andpacking density with various shapes [5]. A necessary condition of controlling the deposi-tion process is the same electrophoretic mobility of the two components in the suspension.Ferrari et al. [168] reported the co-deposition of Al2O3/Y-TZP by electrophoretic deposi-tion. The problem of poor adhesion and shape retention at the substrate that leads to lowdensity, cracking and heterogeneous surfaces were overcome by consolidating the deposits

Fig. 28. Microstructure of Al2O3/ZrO2 composite microstructure obtained by EPD [169].
50 L. Besra, M. Liu / Progress in Materials Science 52 (2007) 1–61
immediately by thermogelation of polysaccharides, which is introduced in the suspension.Hadraba et al. [169] obtained homogeneous distribution of individual components ofAl2O3 and ZrO2 over the whole deposit cross-section (Fig. 28) by maintaining identicalelectrophoretic mobility of Al2O3 and ZrO2 in isopropanol suspensions stabilized bymonochloroacetic acid.
17.7. Fibre reinforced ceramic matrix composites
Electrophoretic deposition (EPD) is a simple and cost-effective method for fabricationof high-quality fibre reinforced ceramic matrix composites. In this application, EPD isused to infiltrate preforms with tight two- or three-dimensional fibre architectures usingnanosized ceramic particles. A recent comprehensive review article reveals the great varietyof conducting and non-conducting fibre and matrix combinations that have been explored,including SiC, carbon, and oxide ceramic fibre architecture and silica, borosilicate glass,stainless steel, alumina, zirconia, mullite hydroxyapatite, SiC and Si3N4 matrices [170–172]. Kaya et al. [107] used EPD to infiltrate preforms with tight fibre weave architecturesusing different anodized ceramic particles, including silica and boehemite sols, as well asdual-component sols of mullite compositions. Fig. 29 shows the EPD infiltrated Ni-coated
Fig. 29. Ni-coated carbon fibre perform infiltrated with boehmite sol [170].

L. Besra, M. Liu / Progress in Materials Science 52 (2007) 1–61 51
carbon fibres reinforced alumina matrix composites containing 30 vol.% fibre loading. TheNi-coated carbon fibre perform was fully infiltrated with the boehmite sol even to regionswhere the fibres were nearly touching each other, leading to high quality deposit.
18. Modeling of EPD process
A distinct feature of electrophoretic deposition or any other colloidal processing ofceramics is the large area of contact between the particles and the dispersing medium.Hence interparticle (or surface) forces strongly influences suspension behavior and powderpacking density during deposition/shaping. In EPD it has been suggested that the primaryfunction of the applied electric field is to accelerate the charged particles towards the elec-trode of opposite charge, the electrostatic force being the driving force. In the case of lowconcentrated suspensions, the motion of particles is determined by equilibrium betweenelectrical and frictional forces and a constant drift velocity can be found. When the solidload becomes higher close to the electrode surface, the mobility of individual particle willbe restricted and a collective pressure onto the particles closer to the electrode surface issupposed to develop. The accumulated particles will be forced to flocculate and form asolid packing structure. Moreover local flocculation near the electrode surface may beinduced by electrolytic reactions which gives rise to a distinct shift of the pH. Thus, ifdeposition in an aqueous suspension occurs on a cathode, pH may be increased signifi-cantly to the basic region, which may cause particles stabilized in acidic conditions to floc-culate. All these factors must be taken into account while developing model for EPDprocess.
Mathematical modeling of constant voltage electrophoretic deposition from stirred sus-pension was reported recently by Gonzalez-Cuenca et al. [173]. Based on the first principle,the influence of deposit formation on deposit growth was implemented, which is a refine-ment of the model described earlier by Biesheuvel and Verweij [29] and already presentedby Eq. (3). For a stirred suspension, concentration gradient ($/s) will not form and thevolumetric particle concentration in the suspension (/s) is given by an overall mass bal-ance for the particles in the suspension
dð/sV Þdt
¼ /s
dVdtþ V
d/s
dt¼ �Audfd ð22Þ
where V is the volume of the suspension and A is the electrode surface area, ud is thegrowth rate of the deposit, and fd is the deposit packing factor (unity minus porosity).In the above equation, the mass density of liquid and the particles is assumed constant.On substituting the overall mass balance for the entire suspension given by
dVdt¼ �Aud ð23Þ
in Eq. (22), the kinetic equation for volumetric particle concentration in the suspensionbecomes
d/s
dt¼ � A
Vudð/d � /sÞ ð24Þ

52 L. Besra, M. Liu / Progress in Materials Science 52 (2007) 1–61
According to Zhang et al. [174] the kinetic equation for deposited weight (w) can beexpressed as an exponential function of time
dwðtÞdt¼ w0k expð�ktÞ ð25Þ
where
k ¼ AV
en4pgðE � DEÞ ð26Þ
in which, w is the weight of the solid particle deposited on the electrode, k is the kineticconstant, t is the deposition time, A is the area of the electrode, V is the volume of suspen-sion, w0 is the starting weight of the solid particle in the suspension, e is the dielectric con-stant of the liquid, n is the zeta potential of the particle in the solvent, E is the applied DCvoltage, and DE is the voltage drop across the deposited layer. Wang et al. [42] suggestedthat for uniform and dense packing of deposit as was the case for ZnO nanoparticles, it ismore convenient to use the deposited thickness (h) instead of the weight (w) to model thedeposition kinetics. The deposited weight as a function of h can be expressed as
wðtÞ ¼ AhðtÞq ð27Þwhere q is the density of the particle. By combining Eqs. (25) and (27), and assuming con-stant density of deposit with time, Wang et al. [42] arrived at the following kinetic equationfor electrophoretic deposition:
dhðtÞdt¼ k0 expð�ktÞ ð28Þ
and
k0 ¼ kw0
Aq¼ w0
V qen
4pgðE � DEÞ ð29Þ
where k 0 has the unit of velocity (cm/s). For relatively short deposition time, a linear func-tion for the deposited thickness and time is expected and Eq. (29) is simplified to the fol-lowing form:
hðtÞ ¼ k0t ð30ÞCordelair and Greil [175] used discrete element method (DEM) to gain insight into thekinetics determining particle packing and density gradient microstructure during deposi-tion of colloidal ZrO2 from aqueous suspension. In DEM, each particle is treated as anindividual element, each keeping its mass, radius and charge as a function of time andlocation, as well as parameters from local suspension properties such as ionic concentra-tion, Debye parameter, pH and electric field strength. These data can be used to trace themovement of each powder particle in the suspension and thus allow to predict the particlepacking behavior as derived from local suspension and particle properties. Depending onpH, electrolyte concentration, current density and mass flow, the particle zone close to thedeposit layer mutually repel (stable state), weakly attract (flocculated state) or strongly at-tract (coagulated state) each other as shown schematically in Fig. 30. In the stable state theparticles form highly ordered deposit with a maximum packing density on the electrode(Fig. 30a). Formation of regions where the particles are weakly bound to each other (in

Fig. 30. Particle distribution structures in the Nerst layer (a) stable state, (b) flocculated state, (c) coagulated state[175].
L. Besra, M. Liu / Progress in Materials Science 52 (2007) 1–61 53
the secondary minimum of the interaction energy function) characterises the flocculatedstate (Fig. 30b). These aggregates tend to form non-uniform packing structures. Theaggregation process of coagulated colloid (Fig. 30c) clusters can be viewed best as diffusionlimited aggregation. Depending on the solid loading, large but deeply fissured clusters aregenerated. The maximum possible packing density (hexagonal close packing) is generallynot achieved due to incorporation of packing defects.
Studies of electrodynamic particle aggregation during EPD both under steady [176] andalternating [177] electric fields have been conducted recently, which have led to equationsfor the time evolution of the probability of separation between deposited particles underdifferent conditions. The models are useful to explain the experimentally observed cluster-ing of colloidal particles near an electrode in a DC electric field by considering convectionby electro-osmotic flow about the particles [178]. Recently numerical simulations havebeen used to model the buildup of a deposit of charged particles on an electrode duringEPD [179,180]. These studies provide insight into local variations of particle interaction

54 L. Besra, M. Liu / Progress in Materials Science 52 (2007) 1–61
processes during deposition, which can be used for optimization of EPD techniques. Sar-kar et al. [181] observed that the deposition of silica particles on silicon wafer with timewas strikingly similar to nucleation and growth of silica particle layer with that of atomicfilm growth via molecular beam epitaxy. This indicates possible new directions for furtherresearch as the equivalence between the two processes provides insight into the growthkinetics of EPD films and can be used for their microstructural optimization.
19. Concluding remarks
The electrophoretic deposition process has gained considerable interest in recent yearsfor fabrication of advanced materials. The process is simple, easy to use and cost-effectivemethod of deposition, which finds innumerable applications including thin and thick filmdeposition, layered ceramics, hybrid materials, fibre reinforced composites as well as nano-composites, nanoscale assembly of 2-D and 3-D ordered structures and micropatternedthin films. However, the process needs judicious choice of solvent media such that anappreciable magnitude of surface charge is developed on the powder surface in the suspen-sion to ensure stability of the suspension as well as facilitate high electrophoretic mobility.Although the mechanisms are still completely not clear, the possibility of deposition onnon-conducting substrates opens up a whole new range of applications including gas sep-aration sensors, thermal barrier coatings, etc. However, it requires further research in fun-damental understanding of the mechanisms by appropriate modeling of the process,charge development in non-aqueous suspension for proper control of suspension stabilityand deposition. The non-aqueous suspensions are popular media for electrophoretic depo-sition. But development of aqueous electrophoretic deposition will go a long way in reduc-ing cost of deposition and also minimise environmental concerns associated with use ofnon-aqueous suspensions.
Acknowledgements
This work was supported by the US Department of Energy SECA Core TechnologyProgram (under Award Number DE-FC26-02NT41572). One of the authors (L.B.) isthankful to the Department of Science and Technology (DST), Govt. of India, for theBOYSCAST fellowship (Award No. HR/BY/E-11/2003). Permission of the Director,Regional Research Laboratory, Bhubaneswar, to publish this paper is duly acknowledged.
References
[1] Hamaker HC. Formation of deposition by electrophoresis. Trans Farad Soc 1940;36:279–83.[2] Heavens N. Electrophoretic deposition as a processing route for ceramics. In: Binner GP, editor. Advanced
ceramic processing and technology, vol. 1. Park Ridge (NJ), USA: Noyes Publications; 1990. p. 255–83[chapter 7].
[3] Zhitomirsky I. Cathodic electrophoretic deposition of ceramic and organoceramic materials – fundamentalaspects. Adv Colloid Interface Sci 2002;97:279–317.
[4] Sato N, Kawachi M, Noto K, Yoshimoto N, Yoshizawa M. Effect of particle size reduction on crackformation in electrophoretically deposited YBCO films. Physica C 2001;357–360:1019–22.
[5] Sarkar P, Nicholson PS. Electrophoretic deposition (EPD): mechanisms, kinetics and application toceramics. J Am Ceram Soc 1996;79(8):1987–2002.
[6] Troelstra SA. Applying coatings by electrophoresis. Philips Tech Rev 1951;12:293–303.

L. Besra, M. Liu / Progress in Materials Science 52 (2007) 1–61 55
[7] Hasegawa K, Kunugi S, Tatsumisago M, Minami T. Preparation of thick films by electrophoreticdeposition using modified silica particles derived by sol–gel method. J Sol–gel Sci Technol 1999;15:243–9.
[8] Shan W, Zhang Y, Yang W, Ke C, Gao Z, Ke Y, et al. Electrophoretic deposition of nano-size zeolites innon-aqueous medium and its application in fabricating thin zeolite membranes. Micropor Mesopor Mater2004;69:35–42.
[9] Wei M, Ruys AJ, Milthorpe BK, Sorrell CC, Evans JH. Electrophoretic deposition of hydroxyapatitecoatings on metal substrate: a nano-particulate dual coating approach. J Sol–gel Sci Technol 2001;21:39–48.
[10] Sridhar TM, Mudali UK. Development of bioactive hydroxyapatite coatings on Type 316L stainless steelby electrophoretic deposition for orthopaedic applications. Trans Ind Inst Met 2003;56(3):221–30.
[11] Yum J-H, Seo S-Y, Lee S, Sung Y-E. Y3Al5O12: Ce0.05 phosphor coating on gallium nitride for white lightemitting diodes. J Electrochem Soc 2003;150(2):H47–52.
[12] Shane MJ, Talbot JB, Kinney BG, Sluzky E, Hesse HR. Electrophoretic deposition of phosphors: IIdeposition experiments and analysis. J Colloid Interface Sci 1994;165:334–40.
[13] Shane MJ, Talbot JB, Schreiber RG, Ross CL, Sluzky E, Hesse KR. Electrophoretic deposition ofphosphors: I conductivity and zeta potential measurements. J Colloid Interface Sci 1994;165:325–33.
[14] Ochsenkuehn-Petropoulou MT, Altzoumailis AF, Argyropoulou R, Ochsenkuehn KM. Superconductingcoatings of MgB2 prepared by electrophoretic deposition. Anal Bioanal Chem 2004;379:792–5.
[15] Sarka P, Mathur S, Nicholson PS, Stager CV. Fabrication of textured Bi–Sr–Ca–Cu–O thick film byelectrophoretic deposition. J Appl Phys 1991;69(3):1775–7.
[16] Hayashi K, Furuya N. Preparation of gas diffusion electrodes by electrophoretic deposition. J ElectrochemSoc 2004;151(3):A354–7.
[17] Dougami N, Takada T. Modification of metal oxide semiconductor gas sensor by electrophoreticdeposition. Sens Actuators B 2003;93:316–20.
[18] Yamashita K, Yonehara E, Ding X, Nagai M, Umegaki T, Matsuda M. Electrophoretic coating ofmultilayered apatite composite on alumina ceramics. HA coating on alumina ceramics. John Wiley andsons, Inc.; 1998. p. 46–53.
[19] Boccaccini AR, Kern H, Krueger HG, Trusty PA, Taplin DMR. Electrophoretic deposition ofnanoceramic particles onto electrically conducting fibre fabrics. In: Proceedings of the 43rd internationalscientific colloquium. Technical University of Ilmenau, September 21–24, 1998; p. 630–5.
[20] Limmer SJ, Cao G. Sol–gel electrophoretic deposition for the growth of oxide nanorods. Adv Mater2003;15(5):427–31.
[21] Du C, Heldbrant D, Pan N. Preparation and preliminary property study of carbon nanotubes films byelectrophoretic deposition. Mater Lett 2002;57:434–8.
[22] Put S, Vleugels J, Anne G, Van der Biest O. Functionally graded ceramic and ceramic-metal compositesshaped by electrophoretic deposition. Colloids Surf A: Physicochem Eng Aspects 2003;222:223–32.
[23] Sarkar P, Datta S, Nicholson PS. Functionally graded ceramic/ceramic and metal/ceramic composites byelectrophoretic deposition. Composites Part B 1997;28B:49–54.
[24] Ferrari B, Sanchez-Herencia AJ, Moreno R. Electrophoretic forming of Al2O3/Y-TZP layered ceramicsform aqueous suspension. Mater Res Bull 1998;33(3):487–99.
[25] Maiti HS, Datta S, Basu RN. High Tc superconductor coating on metal substrates by an electrophoretictechnique. J Am Ceram Soc 1989;72(9):1733–5.
[26] Yau SKF, Sorrel CC. High-Jc (Bi,Pb)2Sr2Ca2CuO10+x tapes fabricated by electrophoretic deposition.Physica C 1997;282–287:2563–4.
[27] Van Tassel J, Randall CA. Electrophoretic deposition and sintering of thin/thick PZT film. J Eur CeramSoc 1999;19:955–8.
[28] Avgustinik AI, Vigdergauz VS, Zharavlev GI. Electrophoretic deposition of ceramic masses fromsuspension and calculation of deposit yields. J Appl Chem USSR (English Translation) 1962;35(10):2175–80.
[29] Biesheuvel PM, Verweij H. Theory of cast formation in electrophoretic deposition. J Am Ceram Soc 1999;82(6):1451–5.
[30] Ishihara T, Shimise K, Kudo T, Nishiguchi H, Akbay T, Takita Y. Preparation of Yttria-stabilised zirconiathin-films on strontium doped LaMnO3 cathode substrate via electrophoretic deposition for solid oxide fuelcells. J Am Ceram Soc 2000;83(8):1921–7.
[31] Chen F, Liu M. Preparation of yttria-stabilised zirconia (YSZ) films on La0.85Sr0.15MnO3 (LSM) and LSM–YSZ substrate using an electrophoretic deposition (EPD) process. J Eur Ceram Soc 2001;21:127–34.
[32] Powers RW. The electrophoretic forming of beta-alumina ceramic. J Electrochem Soc 1975;122:482–6.

56 L. Besra, M. Liu / Progress in Materials Science 52 (2007) 1–61
[33] Negishi H, Yanagishita H, Yokokawa H. Electrophoretic deposition of solid oxide fuel cell materialpowders. In: Proceedings of the electrochemical society on electrophoretic deposition: fundamentals andapplications, vol. 2002-21, Pennington, USA, 2002. p. 214–21.
[34] Ferrari B, Moreno R. The conductivity of aqueous Al2O3 slips for electrophoretic deposition. Mater Lett1996;28:353–5.
[35] Ferrari B, Moreno R. Electrophoretic deposition of aqueous alumina slip. J Eur Ceram Soc 1997;17:549–56.
[36] Krueger HG, Knote A, Schindler U, Kern H, Boccaccini A. Composite ceramic metal coatings by means ofcombined electrophoretic deposition. J Mater Sci 2004;39:839–44.
[37] Zarbov M, Schuster I, Gal-Or L. Methodology for selection of charging agents for electrophoreticdeposition of ceramic particles. In: Proceedings of the international symposium on electrophoreticdeposition: fundamentals and applications. The Electrochemical Society Inc, USA, Proc. vol. 2002-21,2002. p. 39–46.
[38] Chen C-Y, Chen S-Y, Liu D-M. Electrophoretic deposition forming of porous alumina membranes. ActaMater 1999;47(9):2717–26.
[39] Wang G, Sarkar P, Nicholson PS. Influence of acidity on the electrostatic stability of alumina suspensionsin ethanol. J Am Ceram Soc 1997;80(4):965–72.
[40] Brown DR, Salt FW. The mechanism of electrophoretic deposition. J Appl Chem 1965;15:40–8.[41] Basu RN, Randall CA, Mayo MJ. Fabrication of dense zirconia electrolyte films for tubular solid oxide fuel
cells by electrophoretic deposition. J Am Ceram Soc 2001;84(1):33–40.[42] Wang Y-C, Leu I-Chi, Hon M-H. Kinetics of electrophoretic deposition for nanocrystalline zinc oxide
coatings. J Am Ceram Soc 2004;87(1):84–8.[43] Zhitomirsky I, Gal-or L. Electrophoretic deposition of hydroxyapatite. J Mater Sci: Mater Med 1997;8:
213–9.[44] Vandeperre L, Van Der Biest O, Clegg WJ. Silicon carbide laminates with carbon interlayers by
electrophoretic deposition. Key Eng Mater (Pt. 1, Ceramic and Metal Matrix Composites) 1997;127–131:567–73.
[45] Peng Z, Liu M. Preparation of dense platinum-yttria stabilized zirconia and yttria stabilized zirconia filmson porous La0.9Sr0.1MnO3 (LSM) substrates. J Am Ceram Soc 2001;84(2):283–8.
[46] Ma J, Chen W. Deposition and packing study of sub-micron PZT ceramics using electrophoreticdeposition. Mater Lett 2002;56:721–7.
[47] Sarkar P, De D, Rho H. Synthesis and microstructural manipulation of ceramics by electrophoreticdeposition. J Mater Sci 2004;39:819–23.
[48] Sarkar P. Synthesis and microstructural manipulation of ceramics by electrophoretic deposition. In:Proceedings of the electrochemical society on electrophoretic deposition: fundamentals and applications,vol. 2002-21, Pennington, USA, 2002. p. 71–7.
[49] Hirata Y, Nishimoto A, Ishihara Y. Nippon Seramikkusu Kyokai Gakujutsu Ronbunshi 1991;99:108.[50] Fischer R, Fischer E, De Portu D, Roncari E. Preparation of ceramic micro-laminate by electrophoresis in
aqueous system. J Mater Sci Lett 1995;14(1):25–7.[51] Ishihara T, Sato K, Takita Y. Electrophoretic deposition of Y2O3 stabilised ZrO2 electrolyte films in solid
oxide fuel cells. J Am Ceram Soc 1996;79(4):913–9.[52] Mathews T, Rabu N, Sellar JR, Muddle BC. Fabrication of La1�xSrxGa1�yMgyO3�(x+y)/2 thin films by
electrophoretic deposition and its conductivity measurement. Solid State Ionics 2000;128:111–5.[53] Besra L, Zha S, Liu M. Preparation of NiO–YSZ/YSZ Bi-layers for solid oxide fuel cells by electrophoretic
deposition. J Power Sources, in press.[54] Ducheyne P, Radin S, Heughebaert M, Heughebaert JC. Calcium phosphate ceramic coatings on porous
titanium: effect of structure and composition on electrophoretic deposition, vacuum sintering and in vitrodissolution. Biomaterials 1990;11(4):244–54.
[55] Abolmaali SB, Talbot JB. Synthesis of superconductive thin films of YBa2Cu3O7�x by a nonaqueouselectrodeposition process. J Electrochem Soc 1993;140:443.
[56] Nicholson PS, Sarkar P, Haung X. Electrophoretic deposition and its use to synthesize zirconia/aluminamicro-laminate ceramic/ceramic composites. J Mater Sci 1993;28(23):6274–8.
[57] Zhitomirsky I, Petric A. Electrolytic and electrophoretic deposition of CeO2 films. Mater Lett 1999;40:263.
[58] Zhitomirsky I. JOM-e Miner Met Mater Soc J 52;2000. Available from: <www.tms.org_pubs_jour-nals_JOM_0001_Zhitomirsky_Zhitomirsky-0001.html>.

L. Besra, M. Liu / Progress in Materials Science 52 (2007) 1–61 57
[59] Hayashi S, Nakagawa Z, Yasumori A, Okada K. Effects of H2O in EtOH–H2O disperse medium on theelectrophoretic deposition of CaSiO3 fine powder. J Eur Ceram Soc 1999;19(1):75–9.
[60] Yamashita K, Nagai M, Umegaki T. Fabrication of green films of single and multi-component ceramiccomposites by electrophoretic deposition technique. J Mater Sci 1997;32:6661–4.
[61] Foissy AA, Robert G. Bull Am Ceram Soc 1982;61:251.[62] Andrews JM, Collins AH, Cornish DC, Dracass J. Proc Brit Ceram Soc 1969;12:211.[63] Moreno R, Ferrari B. Effect of the slurry properties on the homogeneity of alumina deposits obtained by
aqueous electrophoretic deposition. Mater Res Bull 2000;35:887–97.[64] Ferrari B, Moreno R. Zirconia thick films deposited on nickel by aqueous electrophoretic deposition. J
Electrochem Soc 2000;147(8):2987–92.[65] Sigmund WM, Bell NS, Bergstroem L. Novel powder-processing methods for advanced ceramics. J Am
Ceram Soc 2000;83(7):1557–74.[66] Yates DE, Levine S, Healy TW. J Chem Soc Faraday Trans 1974;170:1807–18.[67] Vandeperre L, Zhao C, Van der Biest O. Correlation between surface charge of a powder in water and
electrophoretic deposition from non-aqueous media. Novel chemistry and processing of ceramics. In:Binner Jon, editor. Proceedings of the novel chemistry/processing session of the sixth conference andexhibition of the European Ceramic Society, Brighton, UK, 20–24 June 1999, Published by IOMCommunications Ltd., London; 2000. p. 69–74.
[68] Labib ME, Williams R. An experimental comparison between aqueous pH scale and the electron donicityscale. Colloid Polym Sci 1986;264(6):533–51.
[69] Negishi H, Yamaji K, Imura T, Kitamoto D, Ikegami T, Yanagishita H. Electrophoretic depositionmechanism of YSZ/n-propanol suspension. J Electrochem Soc 2005;152(2):J16–22.
[70] Weise NL, editor. SME Mineral processing handbook, vol. 1. New York: Society of Mining Engineers;1985. p. 5.42.
[71] Stern O. Z Elektrochem 1924;30:508.[72] Hunter RJ. Zeta potential in colloid science. London: Academic Press; 1981.[73] Lyklema J. Water at interfaces: a colloid-chemical approach. J Colloid Interface Sci 1977;58(2):242–50.[74] Sennet P, Olivier JP. Colloidal dispersions, electrokinetic effects and the concept of zeta potential. In: Ross
S, editor. Chemistry and physics of interfaces. Washington (DC): Am Chem Soc; 1965. p. 73–93.[75] von Smoluchowski M. Versuch einer mathematischen Theorie der Koagulationkinetik kolloider Loesun-
gen. Z Phys Chem 1917;92:129–32.[76] Zukoski IV CF, Saville DA. Electrokinetic properties of particles in concentrated suspensions. J Colloid
Interface Sci 1987;115(2):422–36.[77] O’Brien RW, Ward DN. The electrophoresis of a spheroid with a thin double layer. J Colloid Interface Sci
1988;121(2):402–13.[78] Matthew WK, Davis EJ. Electrokinetics of concentrated suspensions and porous media: I thin electrical
double layers. J Colloid Interface Sci 1989;127(2):497–510.[79] Morrison FA, Stukel JJ. Electrophoresis of an insulating sphere normal to a conducting plane. J Colloid
Interface Sci 1970;33(1):88–93.[80] Keh HJ, Anderson JL. Boundary effects on electrophoretic motion of colloidal spheres. J Fluid Mech 1985;
153:417–39.[81] Kremser L, Blaas D, Kennedler E. Capillary electrophoresis of biological particles: viruses, bacteria, and
eukaryotic cells. Electrophoresis 2004;25:2282–92.[82] Haber S. Deep electrophoretic penetration and deposition of ceramic particles inside impermeable porous
substrates. J Colloid Interface Sci 1996;179:380–90.[83] Adamczyk Z. Particle adsorption and deposition: role of electrostatic interactions. Adv Colloid Interface
Sci 2003;100–102:267–347.[84] Mahanty J, Ninham BW. Dispersion forces. London: Academic Press; 1976.[85] Deryaguin BV, Landau LD. A theory of the stability of strongly charged lyophobic sols and of the adhesion
of strongly charged particles in the solution of electrolytes. Acta Physicochim USSR 1941;14:633.[86] Verwey EJW, Overbeek JThG. Theory of the stability of lyophobic colloids. Amsterdam: Elsevier; 1948.[87] Hiemenz PC. Principles of colloid and surface chemistry. 2nd ed. New York: Marcel Dekker; 1986.[88] Lifshitz EM. Theory of molecular attractive forces. Sov Phys, JETP 1956;2:73.[89] Schenkel JH, Kitchener JA. Trans Faraday Soc 1960;56(1):161.[90] Laskowski JS, Pugh RJ. In: Laskowski JS, Ralston J, editors. Developments in mineral processing. Colloid
chemistry in mineral processing, vol. 12. New York: Elsevier; 1992. p. 115.

58 L. Besra, M. Liu / Progress in Materials Science 52 (2007) 1–61
[91] Stoll S, Buffle J. Computer simulation of colloids and macromolecules aggregate formation. Chimia 1995;49(7–8):300–7.
[92] Israelachvili JN. Intermolecular and surface forces. 2nd ed. New York: Academic Press; 1992. p. 248.[93] Van der Biest OO, Vandeperre LJ. Electrophoretic deposition of materials. Annu Rev Mater Sci 1999;29:
327–52.[94] Fukada Y, Nagarajan N, Mekky W, Bao Y, Kim HS, Nicholson PS. Electrophoretic deposition –
mechanisms, myths and materials. J Mater Sci 2004;39:787–801.[95] Bouyer F, Foissy A. Electrophoretic deposition of silicon carbide. J Am Ceram Soc 1999;82(8):2001–10.[96] Hamaker HC, Verwey EJW. The role of the forces between the particles in electrodeposition and other
phenomena. Trans Farad Soc 1940;36:180–5.[97] Vanderperre L. PhD thesis. Katholieke University, Leuven, Belgium, 1998.[98] Grillon F, Fayeulle D, Jeandin M. J Mater Sci Lett 1992;11:272–5.[99] Koelmans H. Phillips Res Rep 1995;10:161–93.
[100] Borner A, Herbig R, Mangler M, Tomand IG. Mater Sci Forum 1999;89:308–11.[101] Visco SJ, Jacobson CP, Jonghe LCDe. Method for making thin, flat dense membrane on porous substrates.
US patent no. US 6,458,170 B1, 2002.[102] Zhitomirsky I, Petric A. Electrolytic deposition of zirconia and zirconia organoceramic composites. Mater
Lett 2000;46:1–6.[103] Zhitomirsky I, Petric A. Fabrication of organoceramic films by electrodeposition. Bull Am Ceram Soc 2001;
80:41–6.[104] Ozturk K, Basu RN, Randall CA, Mayo MJ. Diffusion bonding of rigid zirconia pieces using
electrophoretically deposited particulate interlayer. Scripta Mater 1999;41(11):1191–5.[105] Tabellion J, Clasen R. Electrophoretic deposition from aqueous suspensions for near-shape manufacturing
of advances ceramics and glasses-applications. J Mater Sci 2004;39:803–11.[106] Kaya C, Boccacini AR, Trusty PA. Processing and characterization of 2-D woven metal fibre reinforced
multi-layer silica matrix composites using electrophoretic deposition and pressure filtration. J Eur CeramSoc 1999;19:2859–66.
[107] Kaya C, Kaya F, Atiq S, Boccaccini R. Electrophoretic deposition of ceramic coatings on ceramiccomposite substrates. Br Ceram Trans 2003;102(3):99–102.
[108] Nagarajan N, Nicholson PS. Nickel–alumina functionally graded materials by electrophoretic deposition.J Am Ceram Soc 2004;87(11):2053–7.
[109] Will J, Hruschka MKM, Gubler L, Gauckler LJ. Electrophoretic deposition of zirconia on porous anodicsubstrate. J Am Ceram Soc 2002;84(2):328–32.
[110] Van Tassel J, Randall CA. Potential for integration of electrophoretic deposition into electronic devicemanufacture; demonstrations using silver/palladium. J Mater Sci 2004;39:867–79.
[111] Matsuda M, Hosomi T, Murata K, Fukui T, Miyake M. Direct EPD of YSZ electrolyte film onto porousNiO–YSZ composite substrate for reduced-temperature operating anode-supported SOFC. ElectrochemSolid State Lett 2005;8(1):A8–A11.
[112] Besra L, Compson C, Liu M. Electrophoretic deposition of YSZ particles on non-conducting porous NiO–YSZ substrates for solid oxide fuel cell (SOFC) applications. J Am Ceram Soc, in press.
[113] Besra L, Liu M. Electrophoretic deposition on non-conducting substrates: the case of YSZ film onNiO–YSZ composite substrates for solid oxide fuel cell application. Solid State Ionics, submitted forpublication.
[114] Dutta J, Hofmann H. Self organization of colloidal nanoparticles. In: Nalwa HS, editor. Encyclopedia ofnanoscience and nanotechnology, vol. X. American Scientific Publishers; 2003. p. 1–32.
[115] Aizenberg J, Braun PV, Wiltzius P. Patterned colloidal deposition controlled by electrostatic and capillaryforces. Phys Rev Lett 2000;84(13):2997–3000.
[116] Xia Y, Zhao X-M, Kim E, Whitesides GM. A selective etching solution for use with patterned self-assembled monolayers of alkanethiolates on gold. Chem Mater 1995;7(12):2332–7.
[117] Jones RG, Tate PCM. Electron beam and X-ray resists. Adv Mater Opt Electron 1994;4(2):139–53.[118] Bailey RC, Stevenson KJ, Hupp JT. Assembly of micropatterned colloidal gold thin film via microtransfer
molding and electrophoretic deposition. Adv Mater 2002;12(24):1930–4.[119] Giersig M, Mulvaney P. Formation of ordered two-dimensional gold colloid lattices by electrophoretic
deposition. J Phys Chem 1993;97:6334–6.[120] Giersig M, Mulvaney P. Preparation of ordered colloid monolayers by electrophoretic deposition.
Langmuir 1993;9:3408–13.

L. Besra, M. Liu / Progress in Materials Science 52 (2007) 1–61 59
[121] Yeh Syun-Ru, Michael S, Boris IS. Assembly of ordered colloidal aggregates by electric-field-induced fluidflow. Nature 1997;386:57–9.
[122] Trau M, Saville DA, Aksay IA. Field induced layering of colloidal crystals. Science 1996;272(5262):706–9.[123] Tabellion J, Clasen R. Electrophoretic deposition from aqueous suspension for near-shape manufacturing
of advanced ceramics and glasses – applications. J Mater Sci 2004;39:803–11.[124] Boehmer M. In situ observation of 2-dimensional clustering during electrophoretic deposition. Langmuir
1996;12(4):5747–50.[125] Hayward RC, Saville DA, Aksay IA. Electrophoretic assembly of colloidal crystals with optically tunable
micropatterns. Nature 2000(March):56–9.[126] Li HX, Lin MZ, Hou JG. Electrophoretic deposition of ligand-stabilized silver nanoparticles synthesized by
the process of photochemical reduction. J Cryst Growth 2000;212:222–6.[127] Chandrasekharan N, Kamat PV. Assembling gold nanoparticle as nanostructured films using an
electrophoretic deposition approach. NanoLetters 2001;1(2):67–70.[128] Kamacheva E, Golding RK, Allard M, Sargent EH. Colloid crystal growth on mesoscopically patterned
surfaces: effect of confinement. Adv Mater 2002;14(3):221–4.[129] Rogach AL, Kotov NA, Koktysh DS, Ostrander JW, Ragoisha GA. Electrophoretic deposition of latex-
based 3D colloidal photonic crystals: a technique for rapid production of high quality opals. Chem Mater2000;12:2721–6.
[130] Zhang Q, Xu T, Butterfield D, Misner MJ, Ryu Du Y, Emrick T, et al. Controlled placement of CdSenanoparticles in block copolymer templates by electrophoretic deposition. NanoLetters 2005;5(2):357–61.
[131] Stambouli AB, Traversa E. Solid oxide fuel cells (SOFCs): a review of an environmentally clean andefficient source of energy. Renew Sustainable Energy Rev 2002;6:433–55.
[132] Steele BCH, Heinzel A. Materials for fuel cell technologies. Nature 2001;414(15):345–52.[133] Minh NQ, Takahashi T. Science and technology of ceramic fuel cells. Amsterdam, Netherlands: Elsevier;
1995. p. 1–14.[134] Dokiya M. SOFC system and technology. Solid State Ionics 2002;152:383–92.[135] Steele BCH. In: Bossel U, editor. Proceedings of the 1st european solid oxide fuel cell forum. European
SOFC Forum, Oberrohrdorf, Switzerland, 1994. p. 375.[136] Buckkremer HP, Diekmann U, DeHaart LGJ, Kabs H, Stimming U, Stoever D. In: Stimming V, Singhal
SC, Tagawa H, Lehnert W, editors. Proceedings of 5th international symposium solid oxide fuel cells(SOFC-V). Pennington (NJ): The Electrochemical Society; 1997. p. 160.
[137] Ishihara T, Honda M, Shibayama T, Minami H, Nishiguchi H, Takita Y. Intermediate temperature solidoxide fuel cells using new LaGaO3 based oxide ion conductor. J Electrochem Soc 1998;145:3177–83.
[138] Zha S, Rauch W, Liu M. Ni–Ce0.9Gd0.1O1.95 anode for GDC electrolyte-based low-temperature SOFCs.Solid State Ionics 2004;166:241–50.
[139] Will J, Mitterdorfer A, Kleinlogel C, Perednis D, Gauckler LJ. Fabrication of thin electrolytes for secondgeneration solid oxide fuel cells. Solid State Ionics 2000;131:79–96.
[140] Chen X, Wu N, Ignatiev A. Thin film oxide fuel cell and method for forming. US patent no. 6,645,656 B1,2003.
[141] Pal UB, Singhal SC. Electrochemical vapour deposition of yttria stabilized zirconia films. J ElectrochemSoc 1990;137:2937–41.
[142] Inaba M, Mineshinge A, Maeda T. Growth rate of yttria stabilized zirconia thin films formed byelectrochemical vapour deposition using NiO as an oxygen source – II effect of the porosity of NiOsubstrate. Solid State Ionics 1997;104(3–4):303–10.
[143] Aizawa M, Kobayashi C, Yamane H, Hirai T. Preparation of ZrO2 thin-films by CVD using H2–CO2 asoxidizer. J Ceram Soc Jpn 1993;101(2):237–9.
[144] Xu Z, Shankar J, Yarmolenko S. Yttria-stabilised zirconia coatings produced using combustion chemicalvapour deposition. Surf Coat Technol 2004;177:52–9.
[145] Ogumi Z, Uchimoto Y, Tsuji Y, Takehara Z. Electrodeposition of thin yttria-stabilized zirconia layersusing glow-discharge plasma. J Appl Phys 1992;72:1577–82.
[146] Tsukuda H, Notomi A, Hisatome N. Application of plasma spraying to tubular-type solid oxide fuel cellsproduction. J Thermal Spray Technol 2000;9(3):364–8.
[147] Ishihara T, Sato K, Mizuhara Y, Takita Y. Preparation of yttria stabilized zirconia films for solid oxide fuelcells by electrophoretic deposition method. Chem Lett 1992:943–6.
[148] Ishihara T, Shimose K, Shiomitsu T, Takita Y. Electrophoretic deposition of Y2O3-stabilized ZrO2 on theporous La0.8Sr0.2MnO3 cathode substrate for SOFC. In: Dokiya M, Yamamoto O, Tagawa H, Singhal SC,

60 L. Besra, M. Liu / Progress in Materials Science 52 (2007) 1–61
editor. Proceedings of the fourth international symposium on solid oxide fuel cells (SOFC-IV); 1995. p.334–43.
[149] Basu RN, Randall CA, Mayo MJ. Development of zirconia electrolyte films on porous lanthanummanganite cathodes by electrophoretic deposition, New materials for batteries and fuel cells. In: Materialresearch society symposium proceedings, San Francisco, USA, vol. 575; 2000. p. 303–8.
[150] Basu RN, Mayo MJ, Randall CA. Fabrication of zirconia electrolyte films by electrophoretic deposition,US patent no. 6,270,642 B1, 2001.
[151] Zhitomirsky I, Petric A. Electrophoretic deposition of ceramic materials for fuel cell applications. J EurCeram Soc 2002;20:2055–61.
[152] Zhitomirsky I, Petric A. Electrophoretic deposition of electrolyte materials for solid oxide fuel cell. J MaterSci 2004;39:825–31.
[153] Matsuda M, Ohara O, Murata K, Ohara S, Fukui T, Miyake M. Electrophoretic fabrication and cellperformance of dense Sr- and Mg-doped LaGaO3-based electrolyte films. Electrochem Solid-State Lett2003;6(7):A140–3.
[154] Nicholson PS, Sarkar P. Ceramic/ceramic laminates by electrophoretic deposition: potentially strong, toughceramics. Advanced ceramics for structural and tribological applications. In: Proceedings of theinternational symposium on advanced ceramics for structural and tribological applications, Vancouver,BC, August 20–24, 1995. p. 475–81.
[155] Nicholson PS, Sarkar P, Prakash O, Wang G. Mimicking nature’s ceramic/ceramic laminar composites byelectrophoretic deposition. Ceram Trans 1994;46:533–41.
[156] Ferrari B, Sanchez-Herencia AJ, Moreno R. Aqueous electrophoretic deposition of Al2O3/ZrO2 layeredceramics. Mater Lett 1998;35(5–6):370–4.
[157] Hecht M, Renk KF, Reimann C, Waldmann O. Preparation of (Tl,Pb)-1233 multilayer tapes by use of anelectrophoretic technique. Supercond Sci Technol 1998;11:227–30.
[158] Vandeperre L, van Der Biest O. Composite SiC–graphite interlayers for crack deflection in ceramiclaminates. Silicates Industriels 1998;63(3–4):39–43.
[159] You Ch, Jiang DL, Tan SH. SiC/TiC laminated structure shaped by electrophoretic deposition. Ceram Int2004;30:813–5.
[160] Sarkar P, Datta S, Nicholson PS. Functionally graded ceramic/ceramic and metal/ceramic composites byelectrophoretic deposition. Composites Part B: Engineering 1998;28B(1–2):49–56.
[161] Sarkar P, Datta S, Nicholson PS. Electrophoretic forming of functionally-graded materials. Ceram Trans76:1997;15–30 [Functionally Graded Materials].
[162] Zhao C, Vleugels J, Vandeperre L, Basu B, Van Der Biest O. Y-TZP/Ce-TZP functionally gradedcomposite. J Mater Sci Lett 1998;17(17):1453–5.
[163] Put S, Vleugels J, van der Biest O. Functionally graded WC-Co materials produced by electrophoreticdeposition. Scripta Mater 2001;45:1139–45.
[164] Izumi K, Tanaka H, Murakami M, Deguchi T, Morita A, Tohge N, et al. Coating of fluorine-doped ZrO2
films on steel sheets by sol–gel method. J Noncryst Solids 1990;121(1–3):344–7.[165] Sorek Y, Reisefeld R, Finkelstein I, Ruschin S. Appl Phys Lett 1993;63:3256.[166] Yamada N, Shoji H, Kubo Y, Katayama S. Preparation of inorganic–organic hybrid films containing
particles using electrophoretic deposition method. J Mater Sci 2002;37:2071–6.[167] Yamada N, Yoshinaga I, Katayama S. Synthesis and dynamic mechanical behaviour of inorganic–organic
hybrids containing various inorganic components. J Mater Chem 1997;7:1491–6.[168] Ferrari B, Santacruz I, Nieto MI, Moreno R. Thermogelation of Al2O3/Y-TZP films produced by
electrophoretic co-deposition. J Eur Ceram Soc 2004;24:3073–80.[169] Hadraba H, Maca K, Cihlar J. Electrophoretic deposition of alumina and zirconia II. Two-component
systems. Ceram Int 2004;30:853–63.[170] Boccaccini AR, Kaya C, Chawla KK. Use of electrophoretic deposition in the processing of fibre reinforced
ceramic and glass matrix composites: a review. Composites Part A: Appl Sci Eng 2001;32:997–1006.[171] Kaya C, Kaya F, Boccaccini AR, Chawla KK. Fabrication and characterisation of Ni-coated carbon fibre-
reinforced alumina ceramic matrix composites using electrophoretic deposition. Acta Mater 2001;49:1189–97.
[172] Moritz K, Mueller E. Electrophoretic infiltration of woven carbon fibre mats with SiC powder suspensions.Key Eng Mater 2002;206–213:193–6.
[173] Gonzalez-Cuenca M, Biesheuvel PM, Verweij H. Modeling constant voltage electrophoretic depositionfrom stirred suspension. AIChE J 2000;46(3):626–31.

L. Besra, M. Liu / Progress in Materials Science 52 (2007) 1–61 61
[174] Zhang Z, Huang Y, Jiang Z. Electrophoretic deposition forming of SiC-TZP composites in nonaqueous sol.J Am Ceram Soc 1994;77(7):1946–9.
[175] Cordelair J, Greil P. Discrete element modeling of solid formation during electrophoretic deposition. JMater Sci 2004;39:1017–21.
[176] Solomentsev Y, Guelcher SA, Bevan M, Anderson JL. Aggregation dynamics for two particles duringelectrophoretic deposition under steady fields. Langmuir 2000;16:9208–16.
[177] Sides PJ. Electrodynamically particle aggregation on an electrode driven by an alternating electric fieldnormal to it. Langmuir 2001;17:5791–800.
[178] Guelcher SA, Solomentsev Y, Anderson JL. Aggregation of pairs of particles on electrodes duringelectrophoretic deposition. Powder Technol 2000;110:90–7.
[179] Perez AT, Saville D, Soria C. Modeling the electrophoretic deposition of colloidal particles. Europhys Lett2001;55:425–31.
[180] Greil P, Cordelair J, Bezold A. Discrete element simulation of ceramic powder processing. Z Metallk 2001;92:682–9.
[181] Sarkar P, De D, Yamashita K, Nicholson PS, Umegaki T. Mimicking nanometer atomic processes on amicrometer scale via electrophoretic deposition. J Am Ceram Soc 2000;83:1399–401.