a revised load estimation procedure for the susquehanna
TRANSCRIPT

In cooperation with
Maryland Department of Natural Resources
A Revised Load Estimation Procedure for the Susquehanna Potomac Patuxent and Choptank Rivers
By Daniel J Phelan Lisa D Olsen Martha L Cashel Judith L Tegler and Elizabeth H Marchand
Water-Resources Investigations Report 00-4156
US Department of the Interior US Geological Survey
US Department of the Interior US Geological Survey
A Revised Load Estimation Procedure for the Susquehanna Potomac Patuxent and Choptank Rivers
By Steven E Yochum
Water-Resources Investigations Report 00-4156
In cooperation with
Maryland Department of Natural Resources
The contents of this report have been approved for public release and unlimited distribution by the US Army--distribution number 2958-A-4
Baltimore Maryland 2000
US DEPARTMENT OF THE INTERIOR BRUCE BABBITT Secretary
US Geological Survey Charles G Groat Director
The use of trade product or firm names in this report is for descriptive purposes only and does not imply endorsement by the US Geological Survey
For additional information contact
District Chief US Geological Survey WRD 8987 Yellow Brick Road Baltimore Maryland 21237
Copies of this report can be purchased from
US Geological Survey Branch of Information Services Box 25286 Denver Colorado 80225-0286
Contents
Abstract 1Introduction 1
Purpose and scope3Description of study area 3Acknowledgments 3
Methods of load estimation 3Monitoring record 3Regression model5Historical load estimates5
Revised procedure for load estimation7Background7Description of revised methods 8Comparison of historical and revised load estimates9
Summary and conclusions11References cited 11Appendixes12
A Annual load estimates for the River Input monitoring stations on theSusquehanna Potomac Patuxent and Choptank Rivers 13
B Percent differences between historical and revised load estimates46
Figures
1 Map showing the Chesapeake Bay Basin study area drainage basins and location ofMaryland River Input monitoring stations 2
2 Graphs showing sampling frequency of total phosphorus at the Maryland River Inputmonitoring stations 1978ndash99 at(A) Susquehanna River at Conowingo Dam Maryland (Station ID 01578310) (B) Potomac River at Chain Bridge at Washington DC (Station ID 01646580) (C) Patuxent River near Bowie Maryland (Station ID 01594440) and (D) Choptank River near Greensboro Maryland (Station ID 01491000) 4
3 Schematic illustrating historical load computation methodology6
4 Schematic illustrating revised load computation methodology8
5 Graphs showing comparison of selected revised and historical load estimates withstandard errors of prediction(A) Patuxent River near Bowie Maryland (Total Nitrogen) (B) Choptank River near Greensboro Maryland (Total Kjeldahl Nitrogen) (C) Susquehanna River at Conowingo Dam Maryland (Orthophosphorus) and (D) Potomac River at Chain Bridge at Washington DC (Suspended Sediment)10
Tables
1 Constituents monitored in the River Input Program3
iii
_____________________________________________________________________________________________________________________________________
_____________________________________________________________________________________________________________________________________
Conversion Factors and Vertical Datum
Multiply By To obtain
___________________________________________________________________________________
Length
__________________________________________________
inch (in) 254 centimeter inch (in) 254 millimeter mile (mi) 1609 kilometer
Area
square mile (mi2) square mile (mi2)
2590 2590
hectare square kilometer
Flow rate
cubic foot per second (ft3s) 002832 cubic meter per second
Vertical Datum In this report ldquosea levelrdquo refers to the National Geodetic Vertical Datum of 1929ndashA geodetic datum derived from a general adjustment of the first-order level nets of the United States and Canada formerly called Sea Level Datum of 1929
Temperature in degrees Celsius ( deg C) may be converted to degrees Fahrenheit ( deg F) as follows
deg F = 18 ( deg C) + 32
Temperature in degrees Fahrenheit ( deg F) may be converted to degrees Celsius ( deg C) as follows
deg C = ( deg F - 32) 18
Chemical concentration in water is expressed in milligrams per liter (mgL) or micrograms per liter (microgL)
Water year is defined as the 12-month period of October 1 through September 30 and is designated by the calendar year in which it ends
iv
A Revised Load Estimation Procedure for the Susquehanna Potomac Patuxent and Choptank Rivers
By Steven E Yochum
Abstract
The US Geological Surveyrsquos Chesapeake Bay River Input Program has updated the nutrient and suspended-sediment load data base for the Susquehanna Potomac Patuxent and Choptank Rivers using a multiple-window center-estimate regression methodology The revised method optimizes the seven-parameter regression approach that has been used historically by the program The revised method estimates load using the fifth or center year of a sliding 9-year window Each year a new model is run for each site and constituent the most recent year is added and the previous 4 years of estimates are updated The fifth year in the 9-year window is considered the best estimate and is kept in the data base The last year of estimation shows the most change from the previous yearrsquos estimate and this change approaches a minimum at the fifth year Differences between loads computed using this revised methodology and the loads populating the historical data base have been noted but the load estimates do not typically change drastically The data base resulting from the application of this revised methodology is populated by annual and monthly load estimates that are known with greater certainty than in the previous load data base
Introduction
Since 1985 the US Geological Survey (USGS) Maryland Chesapeake Bay River Input Program in a cooperative effort with the Maryland Department of Natural Resources and the Metropolitan Washington Council of Governments (MWCOG) has monitored streamflow nutrients and suspended-sediment concentrations in the Susquehanna Potomac Patuxent and Choptank Rivers just above the point of tidal influence (fig 1) These data are used to estimate nutrient and sediment loads entering the tidal waters of the Chesapeake Bay The USGS Virginia Chesapeake Bay River Input Program in cooperation with the Virginia Department of Environmental Quality monitors concentrations of nutrients and suspended sediments of five Virginia rivers just above the point of tidal influence The Maryland and Virginia programs jointly comprise the USGS River Input Program
Within the Maryland River Input Program 12 nutrient and suspended-sediment constituents are monitored at 4 stations Annual and monthly loads are estimated using a seven-parameter log-linear regression model This regression model known as Estimator was developed by the USGS and is widely used for load estimation During this program a historical data base of annual and monthly load estimates had been generated for each constituent from eleven 10- to 14-year model windows with the first window providing load estimates over its entire calibration window length and the remaining estimates extracted from the last year of calibration of each subsequent model These end-of-model-window estimates that have traditionally been provided by the monitoring program are not statistically preferred The preferred load estimates for any individual year (those with minimum uncertainty) are the ones computed in the center of the regression A new data base populated by loads estimated for the fifth or center year of 9-year calibration windows has been developed A 9-year window is preferred because it has a center (for the load estimation) and it is long enough to encompass a sufficient number of samples and a full range of wet to dry periods These center estimates have less uncertainty than the load estimates in the historical data base
Introduction 1
A Revised Load Estimation Procedure for the Susquehanna Potomac Patuxent and Choptank Rivers 2
Purpose and Scope The purpose of this report is to describe and provide
justification for a revised procedure implemented in the computation of nutrient and suspended-sediment loads at the Maryland River Input monitoring stations The revised annual loads at the monitoring stations are also presented This report limits its discussion to the load computations at the four Maryland River Input monitoring stations from 1978 through 1999 (a shorter period for some constituents and sites) and provides only a brief description of the monitoring program and study area
Description of Study Area The watersheds that drain to the four Maryland River
Input monitoring stations (fig 1) include a wide range of land cover geographic and geologic regions The watersheds encompass such diverse areas as the forested Appalachian Plateau of New York and Pennsylvania the Valley and Ridge of the West Virginia highlands as well as the agricultural regions of Pennsylvaniarsquos Lancaster County the Shenandoah Valley of Virginia and the flat lowlands of the Delmarva Peninsula
The Susquehanna River is monitored just downstream from Conowingo Dam Md and has a drainage area of 27100 mi2 (square miles) The Susquehanna is the largest tributary to the Chesapeake Bay and is the largest single source of total nitrogen and phosphorus (Darrell and others 1999) The Potomac River is the second largest contributor of streamflow to the Bay and the largest contributor of suspended sediment The Potomac is monitored at Chain Bridge and has a drainage area of 11570 mi2 The Patuxent River is monitored near Bowie Md at Governorrsquos Bridge and has a drainage area at the monitoring station of 348 mi2 The Choptank River is the smallest tributary monitored in the River Input Program The Choptank monitoring station is near Greensboro Md on the Delmarva Peninsula and has a contributing drainage area of 112 mi2
Acknowledgments The author gratefully acknowledges the many
technicians who collected the base-flow and stormflow samples used in the load computations for this study Much of these data were collected during long days weekends holidays and during adverse weather conditions Their dedication and expertise is much appreciated A special thanks is extended to David Brower of the USGS the hydrologic technician who currently collects samples for this project The author would also like to thank Joel Blomquist and Timothy Cohn of USGS who both helped develop the revised methodology and Brenda Majedi of USGS who provided much insight into the history of the River Input monitoring program The specialists and data base personnel in the Maryland-Delaware-DC District office of the USGS are also thanked for their advice and support
Harry Post of the Occoquan Watershed Monitoring Laboratory and Christine Becker of the Metropolitan Washington Council of Governments are thanked for their
monitoring efforts at the Potomac River at Chain Bridge The cooperation of the Philadelphia Electric Company in the Susquehanna River sampling and gaging at Conowingo Md is also appreciated
Methods of Load Estimation
A detailed description of the concentration data base used in the load computations is provided below The regression model Estimator the model that was used to compute loads for both the historical and revised methodologies is also discussed A description of the historical load data base is also provided
Monitoring Record Twelve nutrient and suspended-sediment constituents are
monitored at the four River Input monitoring stations These constituents are listed in table 1 Annual and monthly loads are estimated for all 12 of these constituents The table also indicates how each constituent is reported and the parameter numbers used for each constituent in the USGS National Water Information System (NWIS) water-quality data base and subsequently in the load computation process
Table 1 Constituents monitored in the River Input Program
[na not applicable]
Parameter ReportedConstituent number as
Total nitrogen (TN) P00600 N
Dissolved ammonia (NH3) P00608 N
Dissolved nitrite (NO2) P00613 N
Dissolved kjeldahl nitrogen (dissKN) P00623 N
Total kjeldahl ntrogen (TKN) P00625 N
Dissolved nitrite + nitrate (NO2 +NO3) P00631 N
Total phosphorus (TP) P00665 P
Dissolved phosphorus (dissP) P00666 P
Orthophosphorus (o-PO4) P00671 P
Total organic carbon (TOC) P00680 C
Dissolved silica (SiO2) P00955 SiO2
Suspended sediment P80154 na
Methods of Load Estimation 3
The Maryland River Input Program began in 1985 For this program 15 to 30 samples per year are collected (during both base-flow and stormflow conditions) using an equal-width-increment depth-integrated sampling procedure at the Susquehanna the Patuxent and the Choptank River sites The Potomac River is monitored by MWCOG through the Occoquan Watershed Monitoring Laboratory (OWML) OWML uses an automatic sampler at the Potomac River site Additionally the River Input Program periodically collects Potomac River storm samples using the equal-width-increment depth-integrated sampling procedure Nutrient and suspended-sediment data were collected by the USGS National Water-Quality Assessment (NAWQA) Program for the Susquehanna and Potomac Rivers from 1993 to the present and at the Choptank River from 1987ndash90 Additional samples were collected by the USGS National Stream-Quality Accounting Network (NASQAN) at all four of the sites until the midndash1990rsquos (Darrell and others 1999)
and a study by Lang (1982) populated the data base from 1979 through 1981 for the Potomac and Susquehanna Rivers
Except for the data collected by OWML for the Potomac River at Chain Bridge all of these data are the result of USGS collection and analysis and constitute the concentration data set used to estimate loads at the four Maryland River Input monitoring stations These data are available on the USGS River Input Program web site at httpwww-vausgsgovchesbayRIMP
The sampling record for the Susquehanna River at Conowingo Dam monitoring station began with the 1979 water year Figure 2a shows the sampling frequency at the dam for total phosphorus from 1978 through 1999 (Total phosphorus represents one of the more frequently sampled constituents in the record) The sampling frequencies for all constituents peaked between 1979 and 1981 during the study by Lang (1982) were at a minimum or were not analyzed for
A Revised Load Estimation Procedure for the Susquehanna Potomac Patuxent and Choptank Rivers 4
from 1982 through 1984 and then increased steadily to comparatively high levels from 1987 through 1990 Samples were collected less frequently in 1991 and 1992 as the NASQAN Program was phased out Sampling frequency increased again in 1993 when the NAWQA program entered a high-intensity phase in this river but then decreased to a minimal level as NAWQA passed into a low-intensity phase At present (2000) 25 to 35 samples per year are collected at this site (depending upon hydrologic conditions)
The sampling frequency for total phosphorus at the Potomac River station is shown in figure 2b Sampling at this site was also initiated at the beginning of the 1979 water year with an increasing frequency through 1981 for all 12 constituents during the Lang (1982) study Few water-quality data were collected in 1982 as Langrsquos sampling program ended but the sampling frequency for most constituents increased again in 1983 when MWCOG and OWML began water-quality monitoring at this site OWML does not analyze samples for nitrite and suspended sedimentmdashthese data sets have been populated since 1985 by only limited (usually monthly) USGS sampling As a result of this limited data availability estimates of nitrite and suspended-sediment loads have greater uncertainty (larger standard errors) than the other constituents Currently 60ndash80 samples per year are collected at this site (depending upon hydrologic conditions)
Sampling was relatively infrequent at the Patuxent River site from 1978ndash84 for most constituents (fig 2c) only the NASQAN Program collected samples during this period Maximum sampling frequency occurred after the River Input Program was initiated in 1985 and both the River Input and NASQAN Programs collected samples The sampling frequency decreased through the early 1990rsquos for all constituents after the River Input Program became the only program collecting samples at this site Currently 20 to 30 samples per year are collected at this site (depending upon hydrologic conditions)
Relatively low frequency sampling also occurred at the Choptank River site from 1978 through 1984 for most constituents (fig 2d) The sampling frequency was higher from 1985 through 1990 with both the River Input and NASQAN Programs sampling at this site Sampling frequency at this site peaked during the high flow year of 1989 Since 1990 the sampling frequency for all constituents has remained relatively constant with only the River Input Program sampling at this site Currently 20 to 30 samples per year are collected at this site (depending upon hydrologic conditions)
Regression Model A seven-parameter log-linear regression model is used to
characterize concentration data and estimate annual and monthly loads of nutrients and suspended sediment at the River Input monitoring stations This regression model (Estimator) incorporates a Minimum Variance Unbiased Estimator (MVUE) for correcting the bias induced by log transformation as well as an Adjusted Maximum Likelihood
Estimator (AMLE) for data sets containing censored observations (Darrell and others 1999) Descriptions of the Estimator model can be found in Darrell and others (1999) and Cohn and others (1992) The MVUE procedure is discussed in Gilroy and others (1990) Cohn and others (1989) and Bradu and Mundlak (1970) The AMLE procedure is discussed in Cohn and others (1992) and Cohn (1988)
The load estimation procedure involves two primary stepsmdashthe fitting of the model to the concentration data using ordinary least-squares regression and load estimation from the fit model (Darrell and others 1999) The model has the following form
ln[C] = β0+ β1ln (Q ) + Q β2[ln(Q )]2 + β3 (T-TQ ) +
β4 (T- )2 + β5 sin (2πT) + β6 cos (2πT) + ε (1)T
where
ln [] = natural logarithm function C = constituent concentration in milligrams per
liter (mgL) βrsquos = model coefficients Q = mean-daily streamflow in cubic feet per
second (ft3s) Q = centered streamflow T = time in decimal years T = centered time sin = sine function cos = cosine function and ε = independent random error
Daily concentration and load estimates are computed using the MVUE algorithm and the daily loads are summed to provide the monthly and annual fluxes (Darrell and others 1999) A standard error of prediction is also generated to indicate how well the estimated regression model fits a ldquotruerdquo regression model The standard error of prediction is a measure of the expected difference between an individual estimate and the estimated daily load (measured concentra-tion multiplied by the average daily discharge) This standard error of prediction is a function of the variability between the estimated and computed loads only on the days of measurement hence the standard error will be biased if there is any systematic sampling bias in the concentration data Also the standard error may not account for the variability on days without monitoring or from any systematic bias incorporated into the source concentration data set (Robertson and Roerish 1999) Possible sources of this bias include sampling techniques and designs that do not adequately represent the true environmental variability
Historical Load Estimates During the developmental period of these load-
estimation procedures it was known that the underlying principles of the model (the relation of concentration and
Methods of Load Estimation 5
streamflow) may change with time and that it would be inappropriate to assume that this relation would be constant over long periods On the basis of this observation and the amount of (monitoring) data available at that time a moving-window approach to load estimation for the years following these initial efforts was implemented (TA Cohn and JD Blomquist USGS oral and written communs 2000) A variation of this technique was employed and is described below
The historical load-estimation methodology is shown in figure 3 Each row represents a model calibration window and light-shaded boxes indicate years from which load estimates were recorded into a load data base The first model was calibrated over an 11-year period 1978 through 1988 and loads were predicted for all years During the following year a 10-year model was calibrated for 1980 through 1989 and the loads predicted for each constituent in 1989 the last year of the regression were entered into a data base with the 11 years of load estimates computed the year before This 10-year moving window approach was used for 6 years for model windows 1980ndash89 to 1985ndash94 and the loads estimated during the last year of each of these windows were recorded in the data base Starting with the 1985ndash95 model window each of the remaining Estimator models were calibrated using increasing window lengths with 1985 the reference year for the Chesapeake Bay Program as the base year for the model This method was used in the 1985ndash94 through the 1985ndash98 models Loads computed in
the last year of each of these calibration windows were entered into the load data base For each constituent the 1978 through 1998 historical load data base comprises annual and monthly load estimates from eleven 10- to 14-year model windows with the first window providing load estimates over its entire calibration window length and the remaining estimates extracted from the last year of calibration of each subsequent model
After differences between loads estimated throughout the 1985ndash98 14-year models and loads in the data base were noted a comparison between two overlapping but different regression window lengths was performed Annual loads for 11 constituents and all 4 Maryland River Input monitoring stations were computed for a 14-year 1985ndash98 model window and compared to loads estimated using a 10-year 1989ndash98 model window Annual loads were extracted from each group of models and percent differences were computed for the 11 constituents The differences between the load predictions from the two window lengths normally fell within the error bars of the standard error of prediction but the total phosphorus suspended-sediment ammonia and orthophosphorus models were found to give load predictions that were up to 50 percent different beyond the error bars of these models The greatest differences in load estimates were found at the edges of the 10-year window in 1989 and 1998 These differences indicated that a more systematic load computation procedure was required
A Revised Load Estimation Procedure for the Susquehanna Potomac Patuxent and Choptank Rivers 6
Revised Procedure for Load Estimation
The rationale for a more rigorous statistical approach in computing loads at the River Input monitoring stations is provided in this section A description of the revised procedure and a comparison of annual loads are also included
Background The concentration-discharge relation for some
constituents and rivers may change over time The Estimator model does not currently include a term allowing such flexibility however The model does allow the concentration-discharge relation to vary with time using the T and T 2 parameters but does not allow the slope of the Q and Q2 terms to change (β1 and β2 are constant) limiting the flexibility of the concentration-discharge relation over a given model window
After the model is fit to the raw concentration data within a calibration window each daily computed concentration is defined by the constant Q and Q2 parameters This relation is set by a specific decimal year value determining the T T 2 and seasonality parameters of the modelmdashthese parameters for any given day are constant Thus the concentration estimates for any given day are defined by the slope of the Q and Q2 parameters These slopes are the coefficients defined in the model fitting and are constant over a calibration window A ramification of this constancy is that for any given Estimator model the concentration-discharge relation for any particular date cannot change The T and T 2
terms can shift the curve through the model window but do not change the slope of the concentration-discharge relation With these defined concentrations the daily load estimates are computed using the MVUE algorithm (to account for the log-transformation bias) and summed and averaged to compute monthly and annual fluxes
Changes in the concentration-discharge relation (and time trends) can be caused by many things including changes in land use implementation of best management practices increases in sewage-effluent discharges improved sewage-treatment processes and climatic variation and change Long calibration windows have an increased chance of containing time periods with significantly different concentration-discharge relations Crossing through multiple concentration-discharge periods however will decrease the quality of the model fit therefore it is important to minimize the model calibration window length
Analyses of samples collected by the River Input Program at the Patuxent River indicated a large decrease in the concentrations of most constituents from the middle-to-late 1980rsquos to the early 1990rsquos which was probably due to the phosphorus detergent ban and sewage-treatment plant upgrades Before these changes occurred there was a strong inverse relation between concentration and discharge (as treatment-plant effluent was diluted during higher flows) This concentration-discharge relation likely changed however as urban and agricultural lands became more
important sources of nutrients in this basin Applying a single Estimator model to a period such as 1985 through 1998 will force the model to fit a constant concentration-discharge relation over a time period that has a varying relation
ldquoSteprdquo trends or rapid changes in concentration of nutrients or sediment over time can also present a problem for load estimation using the seven-parameter Estimator modelmdashparticularly when the model is calibrated over long periods Trends in concentration over time are fit using both the T and T 2 terms and offer a reasonable fit to gradual changes in concentration These two model terms are orthogonal and fit temporal variations evenly over the entire calibration period When a ldquosteprdquo change is encountered in the record this shift is actually represented by a gradual curvilinear relation with time The use of the T and T 2 terms is a considerable improvement over a simple linear trend because together they can provide a more suitable fit to the observed data and better estimates of actual loads The fitting of the T 2 term to a step trend however may cause inflation of estimates near the tails of the calibration window For the River Input monitoring stations the primary step trends are concentration and load decreases (from the mid 1980rsquos through the early 1990rsquos) that were most likely the result of the phosphorus detergent ban and incremental improvements in wastewater-treatment plants The effect of these trends on the estimated load is of primary concern Errors in load estimates are most likely to occur when a step trend occurs early in a long calibration window In this case loads are somewhat underestimated in early years and overestimated in later years
Several approaches to load estimation are possible where step trends are indicated The method chosen for this analysis shortens the calibration window in order to minimize the error in estimates at the tail of the calibration period This method is convenient because it can be standardized and can be applied without prior knowledge of changes in watershed management practices A second method attempts to identify step trends and calibrate separate models for pre- and post-step trend periods This method requires considerable knowledge of the forcing and timing of the step trends In most cases observed to date the precise timing of the response to management actions is unclear and may actually occur over a period of months to years It appears that phosphorus concentrations decreased signifi-cantly as a result of the phosphorus detergent ban for example however concentrations at some sites continued to decline for more than a year following the ban A third method develops additional variables and statistical tools using the current AMLEMVUE framework Such tools may fit step trends using separate model parameters (intercept terms) that are determined statistically rather than operationally Such tools should be investigated further as the period of water-quality record at the River Input monitoring stations expands to several decades
Multiple projects within the USGS have collected samples at the River Input monitoring stations and added
Revised Procedure for Load Estimation 7
data to the record As a result the sampling frequency throughout the period of record has varied considerably (fig 2) For the Susquehanna Patuxent and Choptank sites the sampling frequency reached a maximum in the late 1980rsquos by as much as two to three times the more recent sampling frequency thus placing inappropriate weight upon these years in the load estimates from a single Estimator model A moving calibration window gradually decreases and eventually eliminates the weight that these early measurements have on the load estimates
Two major conclusions can be drawn from this discussion The first is that load estimates near the tail of a calibration window have the greatest uncertainty As a result the end-of-model-window estimates that have traditionally been provided to the Chesapeake Bay scientific community by the program are not preferred The best load estimates for any individual yearmdashthose with minimum uncertaintymdashare those computed in the center of the regression The second major point is that the model window length needs to be minimized A 9-year window is considered optimal because the calibration data are nearly symmetrically distributed around the year for which estimated loads are needed while still providing sufficient length to encompass a reasonable number of samples and a full range of wet to dry periods
Description of Revised Methods The (revised) method consists of running multiple 9-year
calibration windows for each site and constituent An illustration of the procedure used to compute the revised loads is provided in figure 4 Each row represents a model window and the light-shaded boxes indicate the years in each calibration window from which load estimates were taken and entered into a data base For each constituent and site up to 14 models were run Load estimates were taken from the fifth (center) year of the calibration window and entered into a data base On the basis of the USGS concentration data base and the seven parameters in the model these estimates will have the least uncertainty
The first 4 years of estimates are in a tail of the calibration window and have greater uncertainty but are all the data allow Higher standard errors are usually observed during these first few years of estimates
The last 4 years of each model window are also in a tail of the calibration window have greater uncertainty and are considered preliminary and revised each year These estimates are marked by dark-shaded boxes in figure 4 When the last four years of load estimates are revised each year the greatest change can be expected for the last year of estimation from the previous year For example the load estimates from the last four years of the 1990ndash98 model
A Revised Load Estimation Procedure for the Susquehanna Potomac Patuxent and Choptank Rivers 8
windows (1995 through 1998) were compared to the loads predicted for these years in the 1991ndash99 model window For suspended sediment in the Choptank River the percent differences between the 1999 and 1998 model estimates were calculated to be -25 -16 6 and -04 percent for 1998 through 1995 respectively Likewise for dissolved nitrite plus nitrate in the Patuxent River percent differences were found to be 12 6 09 and 03 percent respectively This pattern supports the premise that the last year of load estimates in any calibration window has the greatest uncertainty
Comparison of Historical and Revised Load Estimates The annual load estimates for the four Maryland River
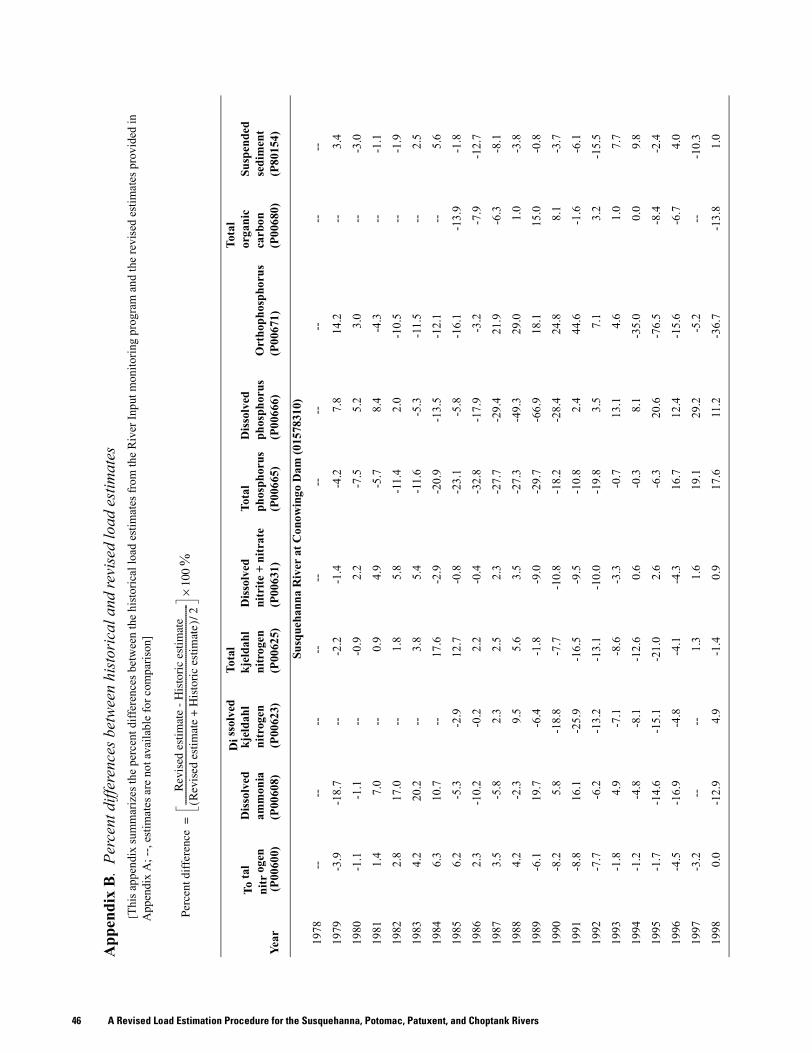
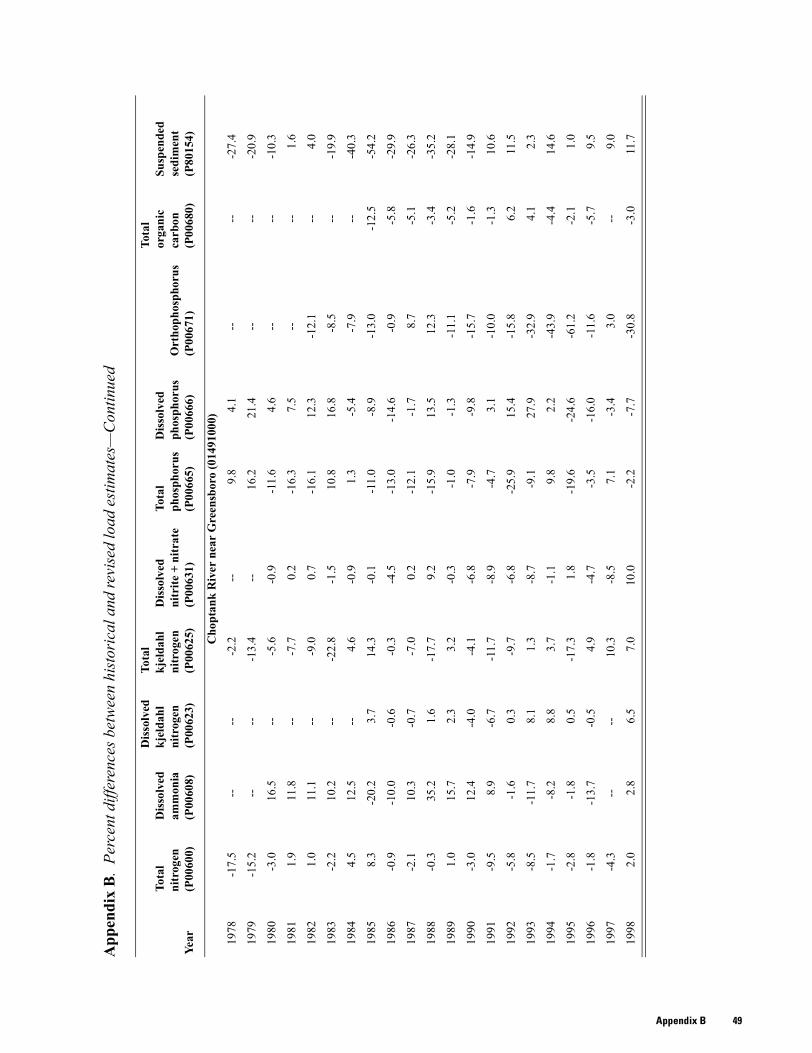
Input monitoring stations are provided in Appendix A The most up-to-date annual and monthly estimates can be accessed on the USGS River Input Program web site at httpwww-vausgsgovchesbayRIMP A comparison between the historical and revised load estimates is provided in Appendix B This table lists the percent differences between historical and revised annual load estimates for the four River Input monitoring sites and all available constituents
The historical and revised load estimates and error bars for a few selected constituents are shown in figure 5 These plots represent the full range of differences in estimates as well as both narrow and wide error bars As discussed earlier in this report these bars indicate the error in the regression but do not represent errors associated with sampling and laboratory analysis
In general it was found that the annual load estimates of total nitrogen at all four sites do not change considerably between methodologies As an example figure 5a shows a comparison of the revised and historical load estimates for total nitrogen (TN) at the Patuxent River near Bowie Md monitoring station The solid point and error bars represent the load value and standard error of the revised annual load estimate The error bars of the two sets of estimates usually overlap for this site and constituent despite the relatively narrow bar width For 1993 to 1995 however the revised method predicts loads with error bars that do not overlap the error bars of the historical values The load estimates for these 3 years were 10 to 12 percent different The error bars also decreased in size from 1978 to 1984 as estimates are taken progressively closer to the model centers and include
additional data points Finally the Patuxent River has shown significant reductions in concentrations of most constituents during the study period due predominantly to sewage-treatment plant upgrades The result of this point-source reduction effort can be seen in this plot as a downward trend in annual total nitrogen load estimates
Between methodologies estimates of annual loads of total kjeldahl nitrogen (TKN) typically show larger differences than estimates for TN Figure 5b shows a comparison of the load estimates and error bars for TKN in the Choptank River Differences between annual load estimates for TKN in the Choptank ranged from less than 1 to nearly 23 percent (see Appendix B) This consistency is typical at all four of the monitoring sites for this constituent The error bars for TKN tend to be wide and overlap for all but two of the years The error bars for the updated estimates become finer through the record then widen slightly during the last four years of estimates (the preliminary non-window-centered estimates)
The two methodologies estimated orthophosphorus (o-PO4) loads with the greatest differences among the 12 constituents Figure 5c shows the load estimates and error bars for o-PO4 at the Susquehanna River at Conwingo Dam monitoring station Differences between the load estimates vary from 3 to 77 percent with the greatest differences in 1994 and 1995 The error bars normally overlap but the variability may indicate limitations of this model in predicting o-PO4 loads especially o-PO4 loads discharging from the Susquehanna River at Conowingo Dam
Figure 5d shows a comparison of suspended-sediment load estimates for the Potomac River at Chain Bridge monitoring station This plot shows the large error bars that are typically computed for suspended-sediment estimates The largest estimate and bracket size was in 1985 a high discharge year Suspended-sediment concentrations vary a great deal in any river and a large number of samples are required for accurate estimates of load The current sampling program includes relatively few suspended-sediment samples from the Potomac River at Chain Bridge Considering that the Potomac River has been shown to provide the largest flux of sediment to the Chesapeake Bay (Darrell and others 1999) these large error bars are cause for concern
Revised Procedure for Load Estimation 9
A Revised Load Estimation Procedure for the Susquehanna Potomac Patuxent and Choptank Rivers 10
Summary and Conclusions
The US Geological Survey Chesapeake Bay River Input monitoring program has updated its data base for nutrient and suspended-sediment loads using an optimized methodology implementing the same seven-parameter log-linear regression model that has historically been used in the project This approach which uses a multiple-window center-estimate methodology was applied to the monitoring record of the River Input monitoring stations on the Susquehanna Potomac Patuxent and Choptank Rivers These four rivers have a wide range of watershed characteristics and include both the largest and smallest watersheds monitored in the program Concentrations of 12 nutrient and suspended-sediment constituents were included in the analysis and annual and monthly load estimates were revised
The regression model Estimator was used to compute loads in both the historical and revised methodologiesmdashthe new method merely optimizes the use of this model The historical load data base is composed of annual and monthly load estimates from eleven 10- to 14-year model windows with the first window providing load estimates over its entire calibration window length and the remaining estimates extracted from the last year of calibration of each subsequent model The revised methodology consists of multiple 9-year calibration windows For each site and constituent up to 14 models were computed Load estimates were taken from the fifth (center) year of each calibration window and entered into a data base The final four years of load estimates are preliminary and will be updated each year A new Estimator model is run annually for each site and constituent the most recent year is added and the previous four years of load estimates are revised The fifth year is considered the best estimate and kept in the data base The resulting data base is populated by load estimates that are known with more certainty than the historical load estimates
The new procedure was developed to minimize the effects that changing concentration-discharge relations in a river have on the regression Additionally the new methodology eliminates the use of end-of-regression load estimates which have been found to be overly sensitive to the fit of the time and time squared parameters and minimizes the effect of changing sampling frequencies in the monitoring record
It has been shown that the last year of estimates undergoes the most change from a previous year and this change usually decreases until made ldquofinalrdquo at the fifth year This finding is consistent with the premise that the last year of load estimates in any calibration window has the greatest uncertainty
A comparison between all of the historical and revised annual load estimates showed variable consistency The estimates for total nitrogen at all four sites are typically consistent and are within the error bars Total kjeldahl nitrogen and nitrite plus nitrate are also reasonably consistent Annual load estimates for suspended sediment
the three phosphorus species and ammonia have larger differences but these constituents also have wider error bars associated with them In general for some select years and monitoring stations the differences between load estimates are relatively large and are beyond the error bars but this is not commonmdashload estimates for these rivers do not change drastically when the new methodology is applied
This revised load computation methodology provides greater confidence in load estimates at the River Input Program monitoring stations Load estimation at these monitoring stations is an evolving process however This report documents various processes and shifting relations during the study period Load-estimation procedures will likely change in the future as the in-stream processes of these diverse rivers are more clearly understood and new statistical tools are implemented
References Cited
Bradu D and Mundlak Y 1970 Estimation of lognormal linear models Journal of the American Statistical Association 65 (329) p 198ndash211
Cohn TA 1988 Adjusted maximum likelihood estimation of the moments of lognormal populations from type I censored samples US Geological Survey Open-File Report 88ndash350 34 p
Cohn TA Delong LL Gilroy EJ Hirsch RM and Wells D 1989 Estimating constituent loads Water Resources Research v 25 no 5 p 937ndash942
Cohn TA Caulder DL Gilroy EJ Zynjuk LD and Summers RM 1992 The validity of a simple log-linear model for estimating fluvial constituent loads An empirical study involving nutrient loads entering Chesapeake Bay Water Resources Research v 28 no 9 p 2353ndash2364
Darrell LC Majedi BF Lizarraga JS and Blomquist JD 1999 Nutrient and suspended-sediment concentrations trends loads and yields from the nontidal part of the Susquehanna Potomac Patuxent and Choptank Rivers 1985ndash96 US Geological Survey Water-Resources Investigations Report 98ndash4177 38 p
Gilroy EJ Hirsch RM and Cohn TA 1990 Mean square error of regression-based constituent transport estimates Water Resources Research v 26 no 9 p 2069ndash2077
Lang DJ 1982 Water quality of the three major tributaries to the Chesapeake Bay the Susquehanna Potomac and James Rivers January 1979ndashApril 1981 US Geological Survey Water-Resources Investigations Report 82ndash32 64 p
Robertson DM and Roerish ED 1999 Influence of various water quality sampling strategies on load estimates for small streams Water Resources Research v 35 no 12 December p 3747ndash3759
Summary and Conclusions 11
APPENDIXES A AND B FOLLOW
A Revised Load Estimation Procedure for the Susquehanna Potomac Patuxent and Choptank Rivers 12
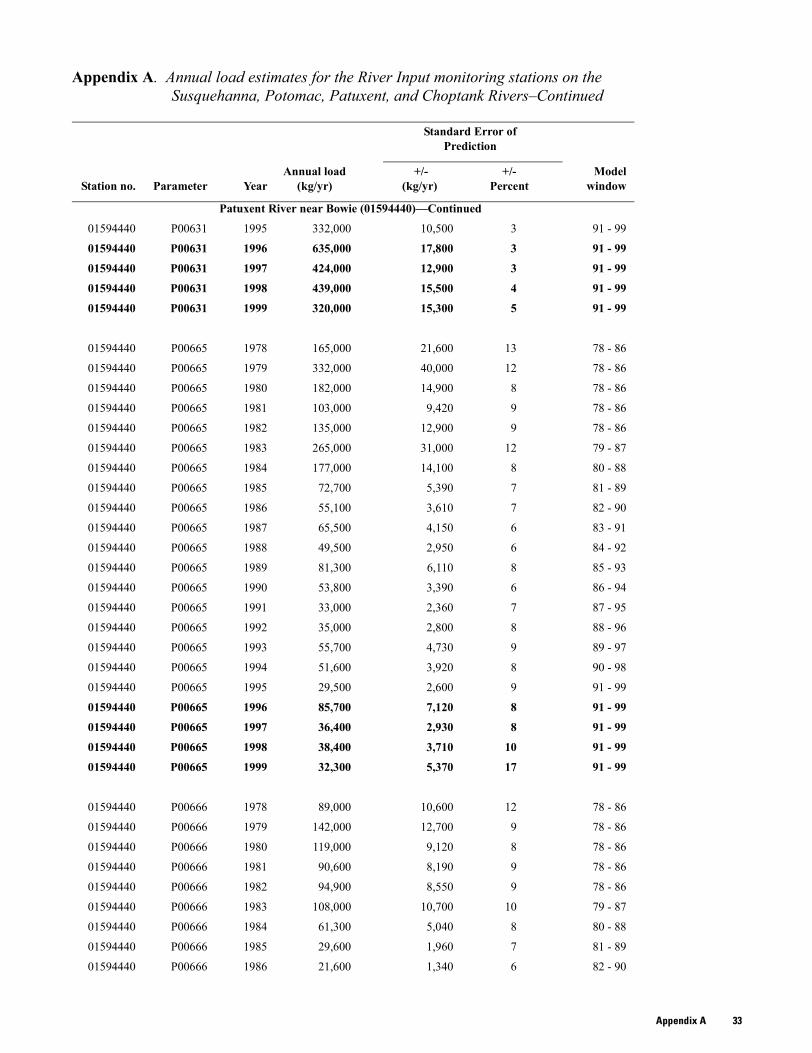
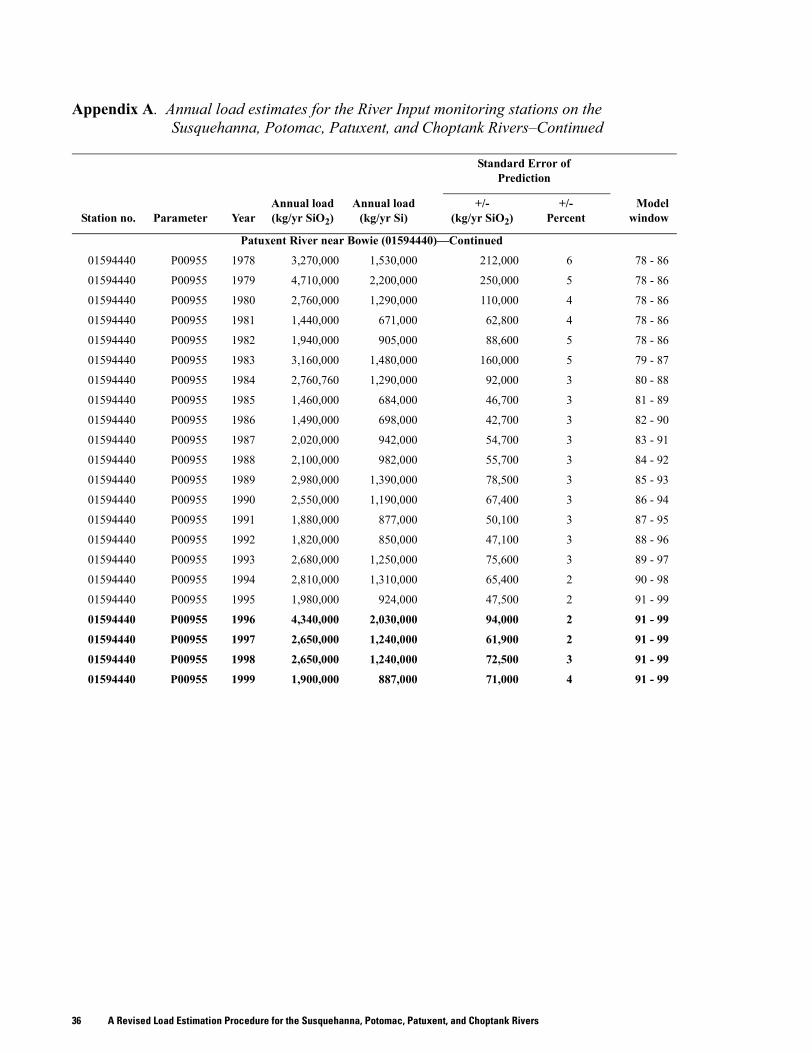
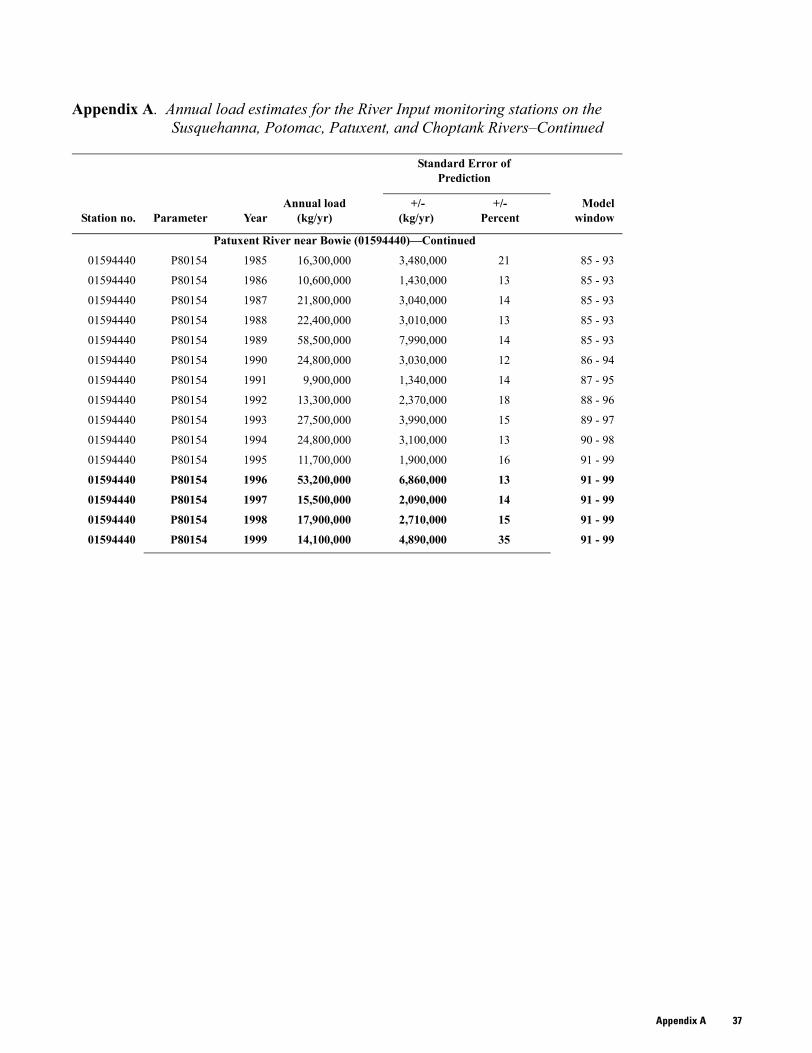
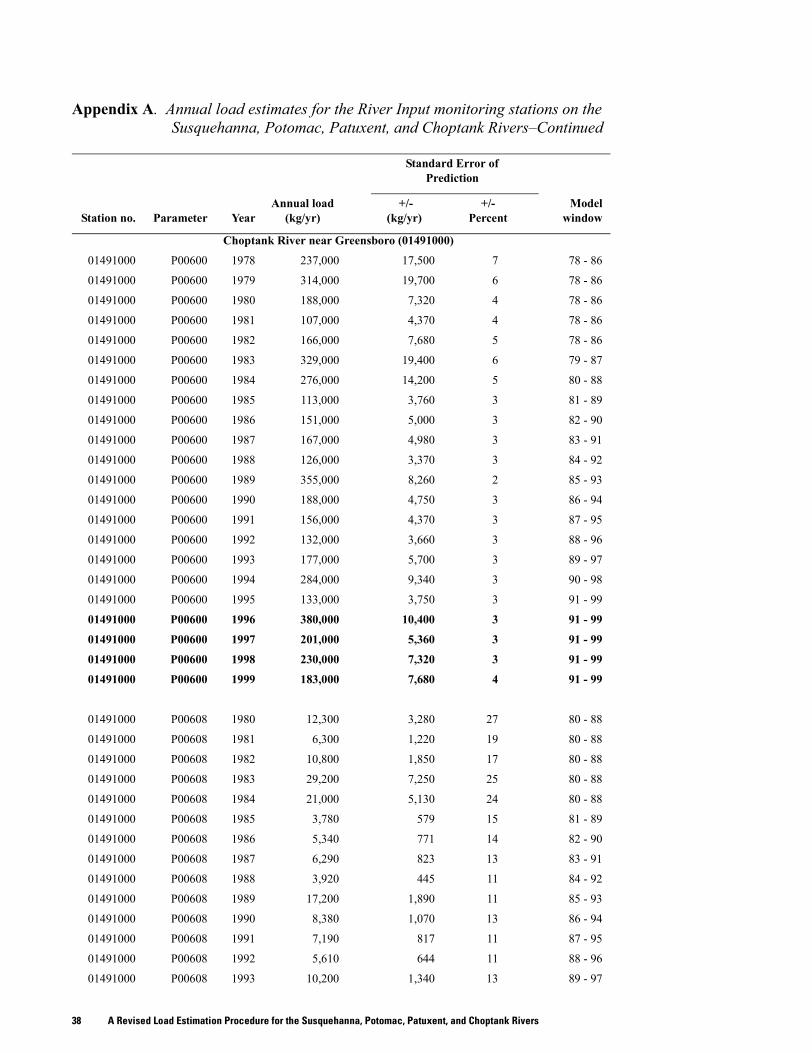
Appendix A Annual load estimates for the River Input monitoring stations on the Susquehanna Potomac Patuxent and Choptank Rivers
[kgyr kilograms per year +- plusminus the standard errors of prediction are also provided The standard error of prediction is a measure of the expected difference between an individual estimate and the estimated daily load Bold numbers indicate preliminary load estimates that will be revised For the most up-to-date annual and monthly load estimates see the USGS River Input Monitoring Program web site at httpwww-vausgsgovchesbayRIMP]
Parameter Constituent Reported as
P00600 Total nitrogen N
P00608 Dissolved ammonia N
P00613 Dissolved nitrite N
P00623 Dissolved kjeldahl nitrogen N
P00625 Total kjeldahl nitrogen N
P00631 Dissolved nitrite + nitrate N
P00665 Total phosphorus P
P00666 Dissolved phosphorus P
P00671 Orthophosphorus P
P00680 Total organic carbon C
P00955 Dissolved silica Si and SiO2
P80154 Suspended sediment not applicable
Appendix A 13
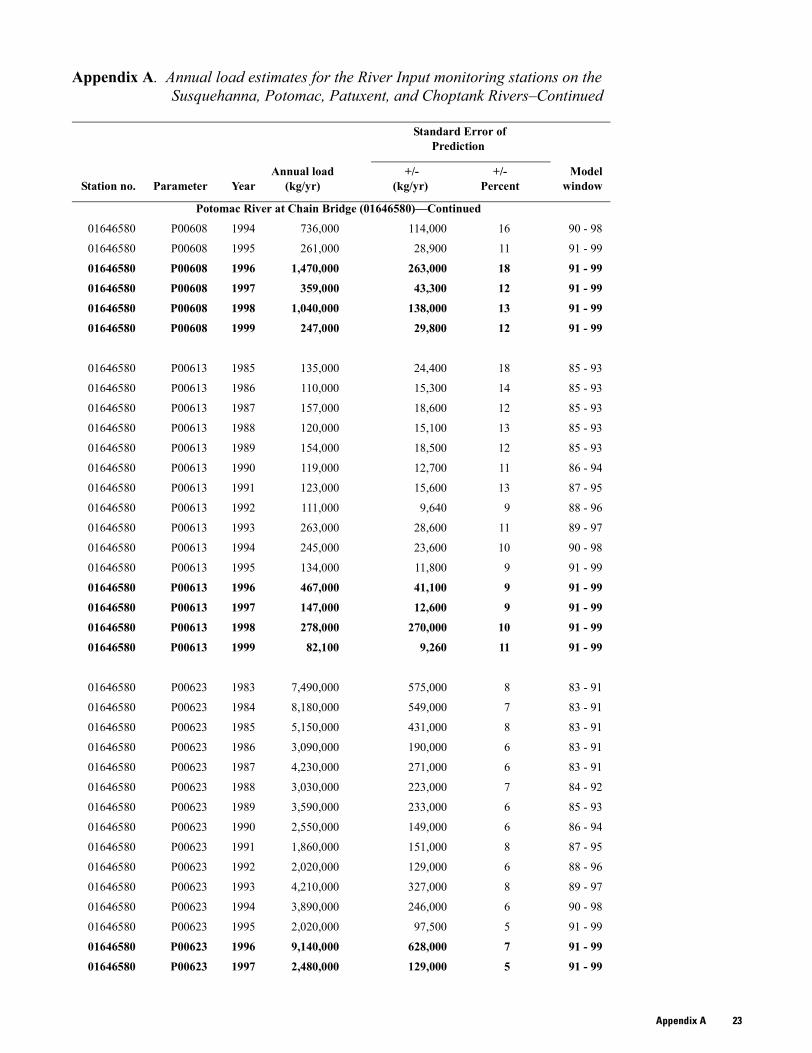
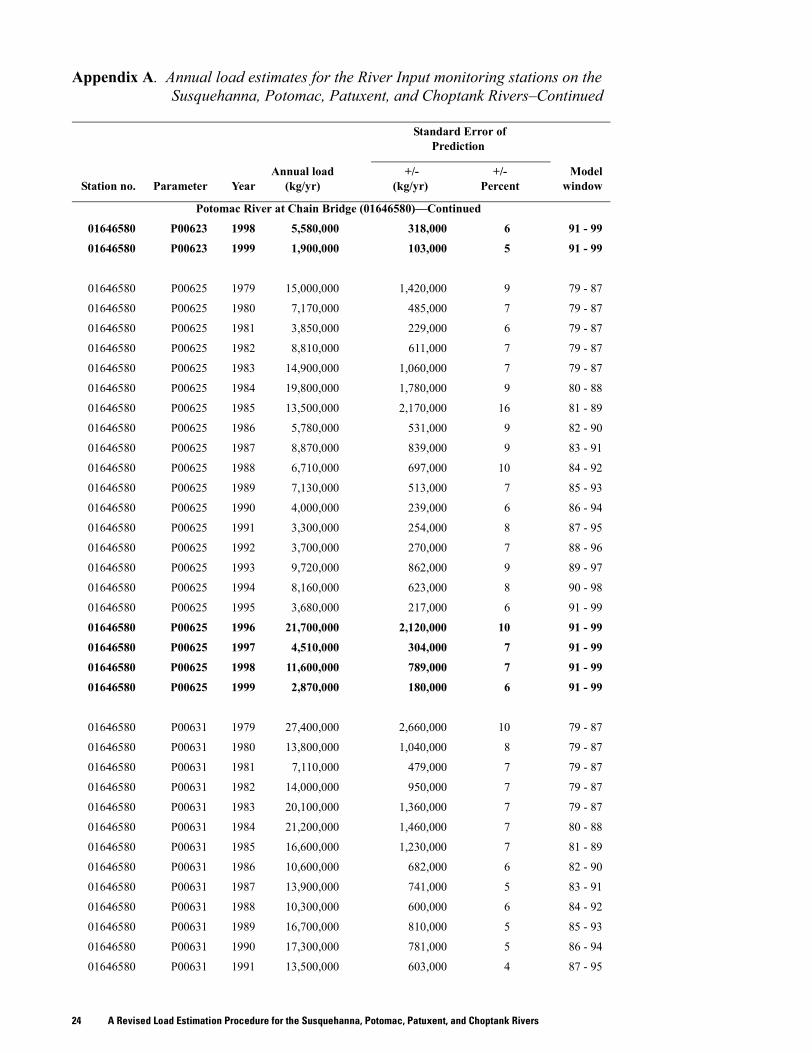
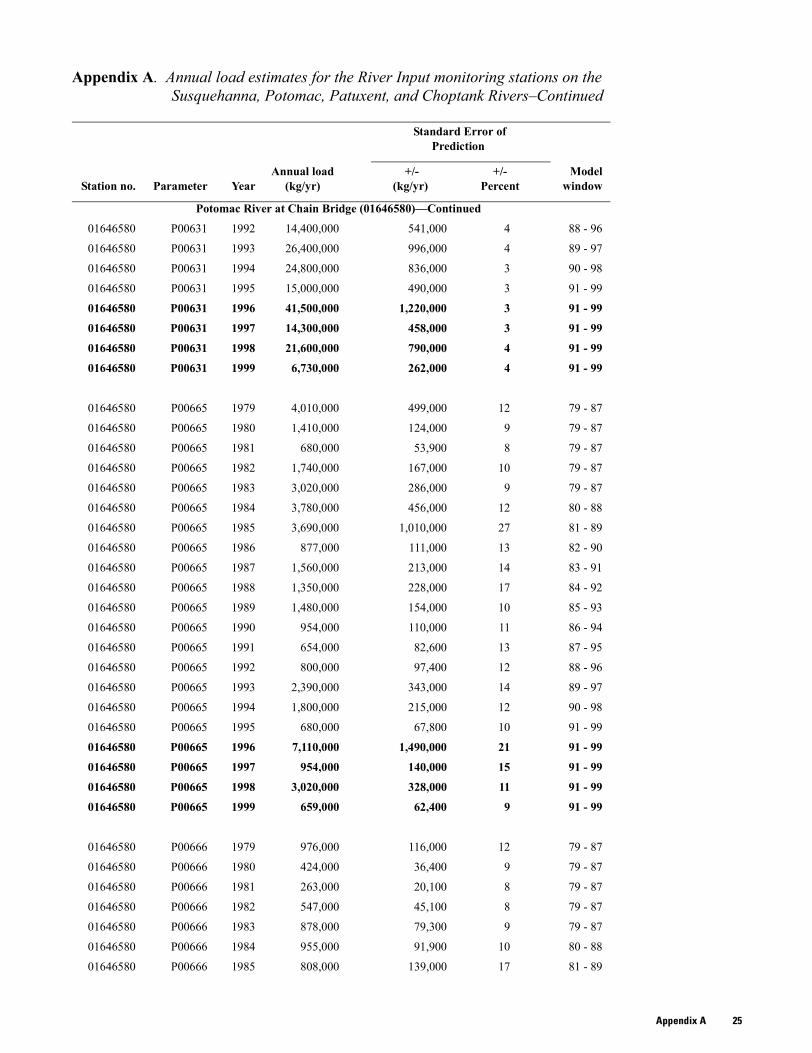
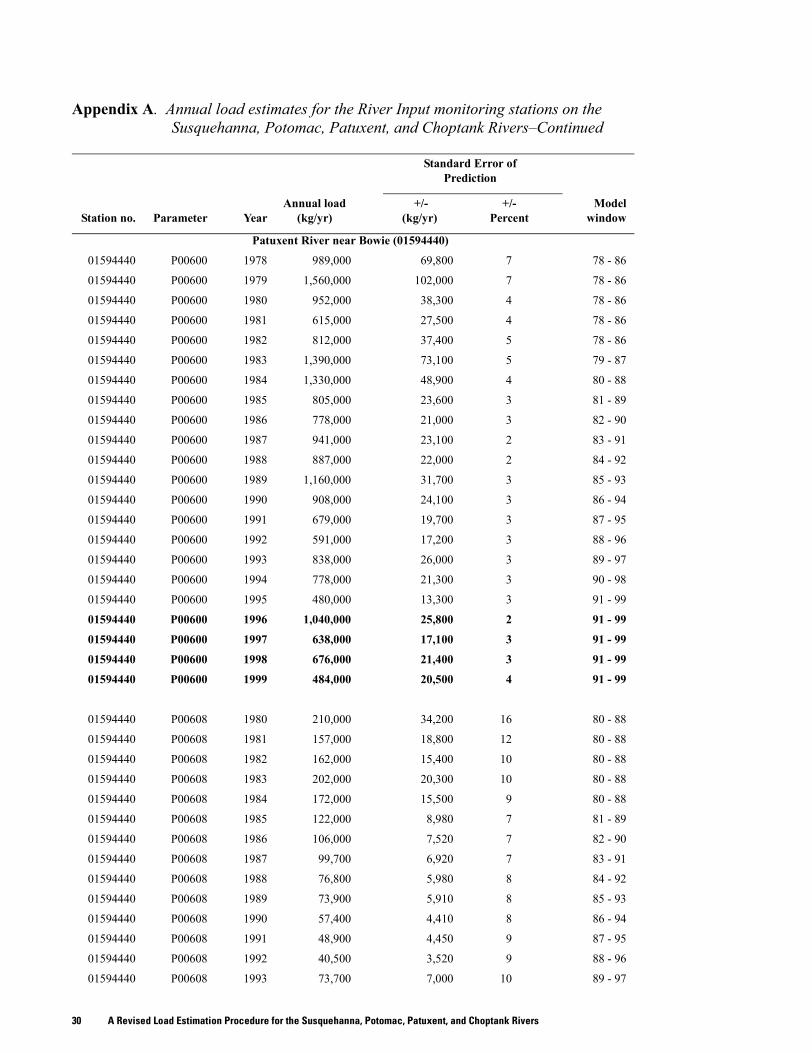
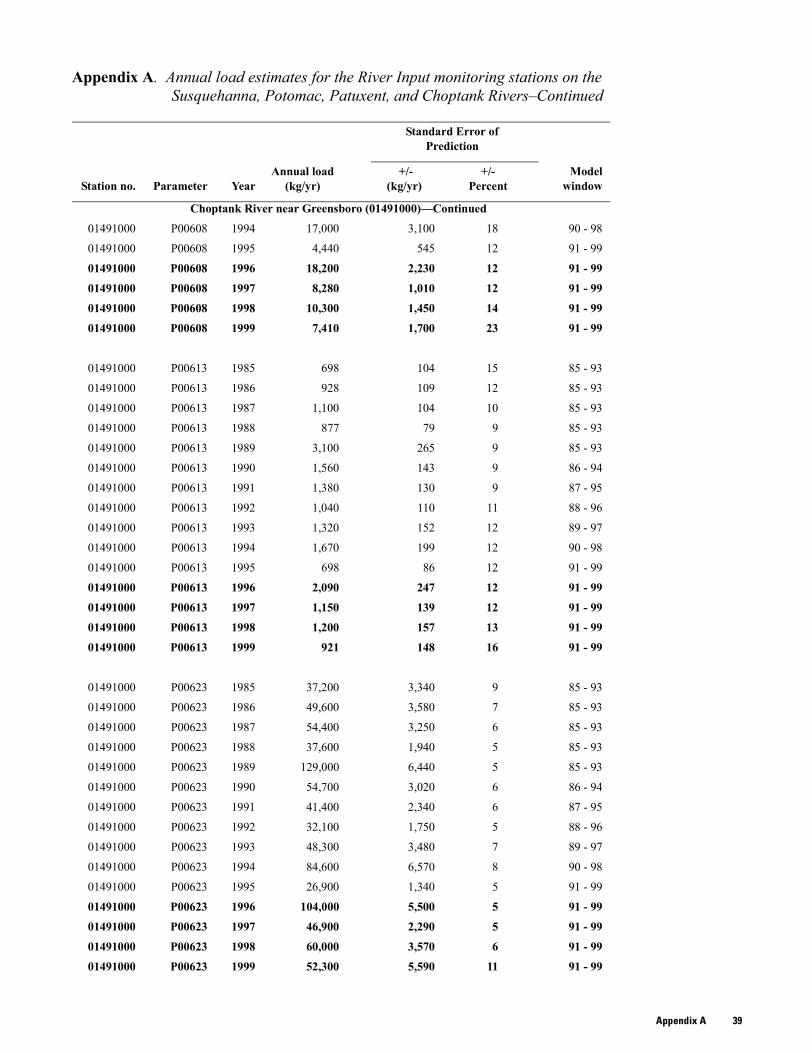
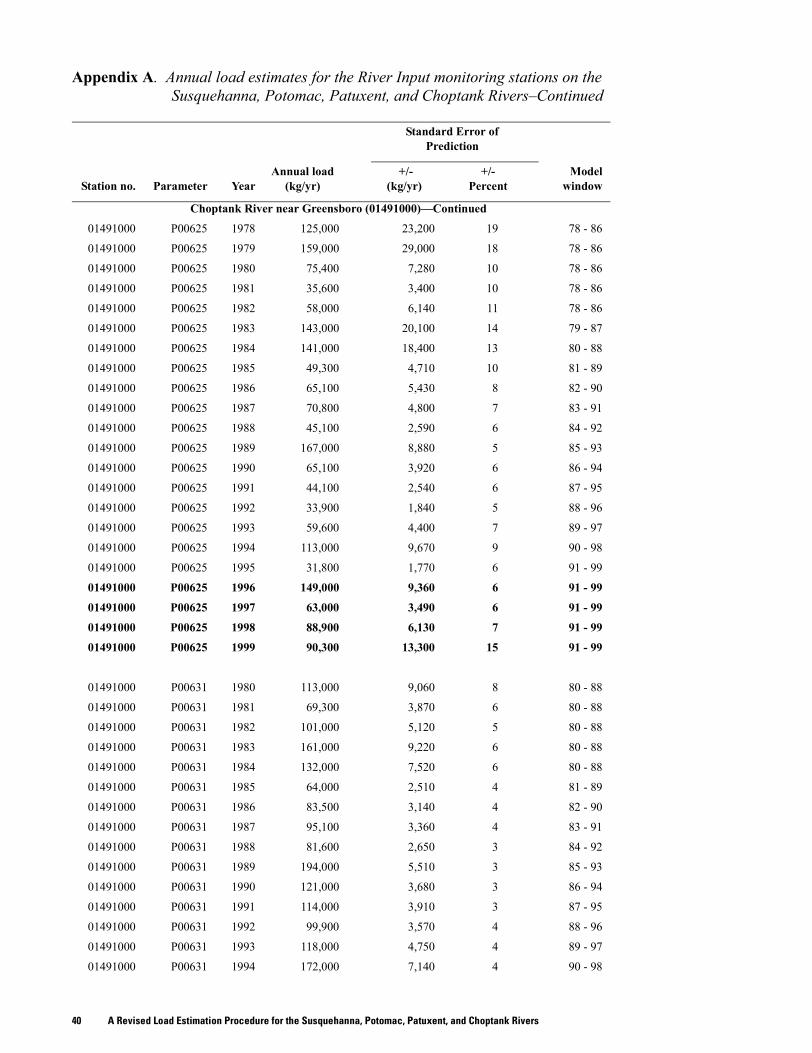
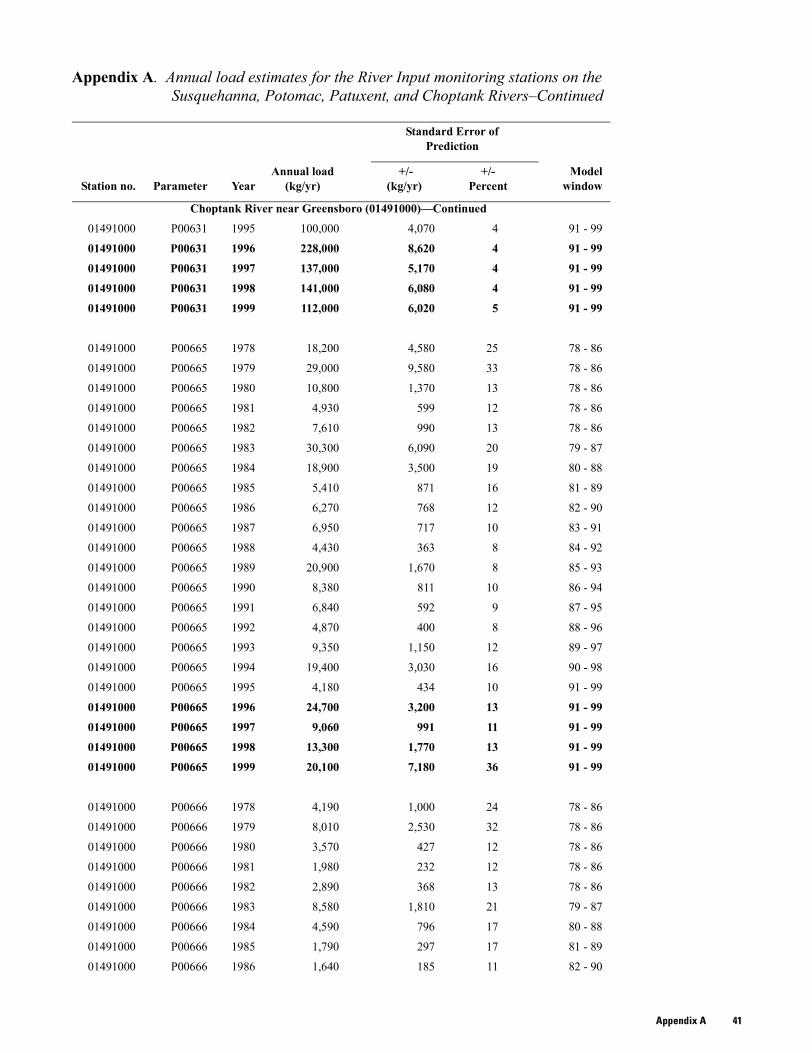
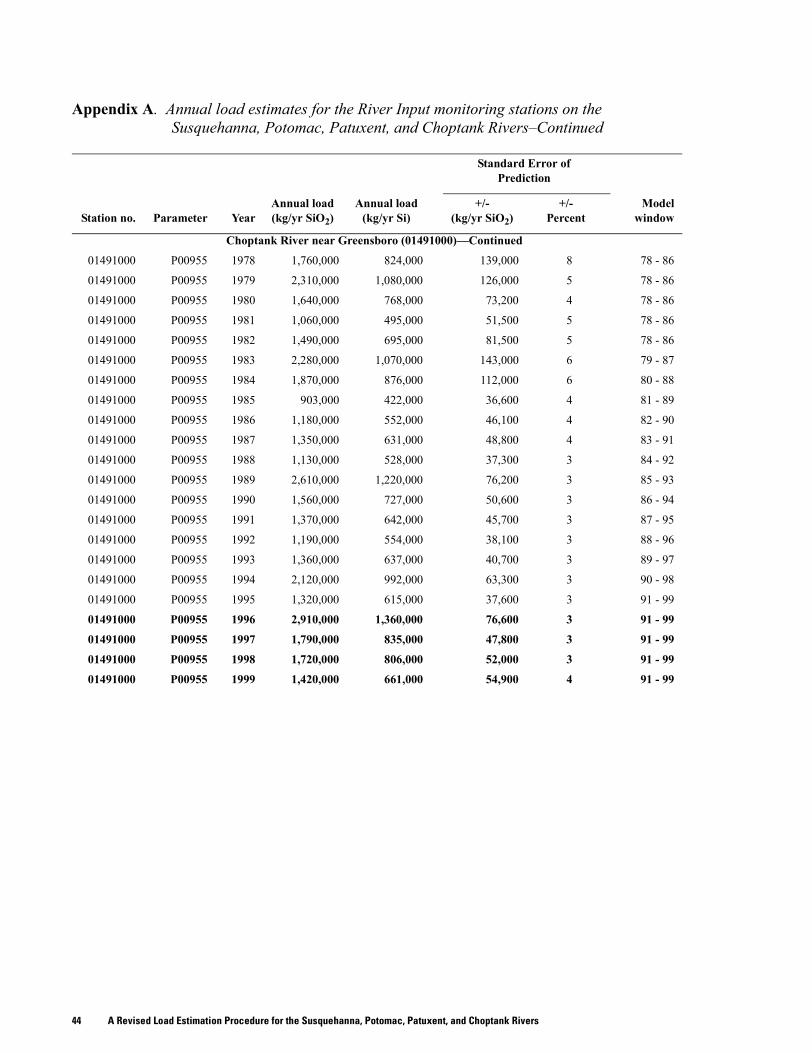
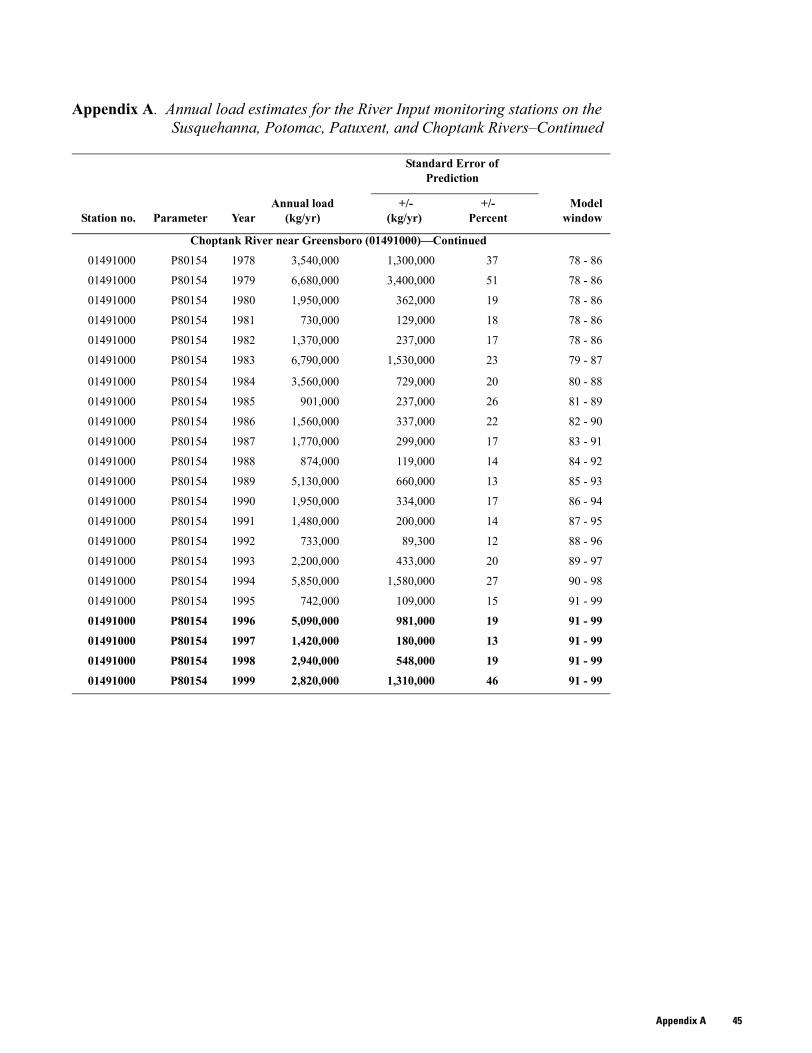
Appendix A Annual load estimates for the River Input monitoring stations on the Susquehanna Potomac Patuxent and Choptank RiversndashContinued
Standard Error of Prediction
Annual load +- +- ModelStation no Parameter Year (kgyr) (kgyr) Percent window
Susquehanna River at Conowingo Dam (01578310)
01578310 P00600 1979 76200000 3210000 4 79 - 87
01578310 P00600 1980 43400000 1560000 4 79 - 87
01578310 P00600 1981 50400000 1880000 4 79 - 87
01578310 P00600 1982 60200000 2480000 4 79 - 87
01578310 P00600 1983 77300000 3400000 4 79 - 87
01578310 P00600 1984 94500000 4070000 4 80 - 88
01578310 P00600 1985 58300000 2190000 4 81 - 89
01578310 P00600 1986 75700000 2360000 3 82 - 90
01578310 P00600 1987 57200000 1580000 3 83 - 91
01578310 P00600 1988 46700000 1360000 3 84 - 92
01578310 P00600 1989 64000000 1830000 3 85 - 93
01578310 P00600 1990 78300000 2210000 3 86 - 94
01578310 P00600 1991 48200000 1540000 3 87 - 95
01578310 P00600 1992 54100000 1470000 3 88 - 96
01578310 P00600 1993 82700000 2330000 3 89 - 97
01578310 P00600 1994 76100000 2060000 3 90 - 98
01578310 P00600 1995 41300000 1460000 4 91 - 99
01578310 P00600 1996 94500000 2810000 3 91 - 99
01578310 P00600 1997 43400000 1430000 3 91 - 99
01578310 P00600 1998 61300000 2160000 4 91 - 99
01578310 P00600 1999 40200000 1910000 5 91 - 99
01578310 P00608 1979 3320000 470000 14 79 - 87
01578310 P00608 1980 2450000 276000 11 79 - 87
01578310 P00608 1981 3160000 345000 11 79 - 87
01578310 P00608 1982 4150000 503000 12 79 - 87
01578310 P00608 1983 5490000 719000 13 79 - 87
01578310 P00608 1984 5980000 739000 12 80 - 88
01578310 P00608 1985 3210000 315000 10 81 - 89
01578310 P00608 1986 3970000 346000 9 82 - 90
01578310 P00608 1987 3010000 237000 8 83 - 91
01578310 P00608 1988 2470000 190000 8 84 - 92
01578310 P00608 1989 3360000 256000 8 85 - 93
01578310 P00608 1990 3570000 243000 7 86 - 94
01578310 P00608 1991 2520000 201000 8 87 - 95
01578310 P00608 1992 2540000 197000 8 88 - 96
01578310 P00608 1993 4420000 362000 8 89 - 97
A Revised Load Estimation Procedure for the Susquehanna Potomac Patuxent and Choptank Rivers 14
Appendix A Annual load estimates for the River Input monitoring stations on the Susquehanna Potomac Patuxent and Choptank RiversndashContinued
Standard Error of Prediction
Annual load +- +- ModelStation no Parameter Year (kgyr) (kgyr) Percent window
Susquehanna River at Conowingo Dam (01578310)mdashContinued
01578310 P00608 1994 3610000 283000 8 90 - 98
01578310 P00608 1995 1660000 151000 9 91 - 99
01578310 P00608 1996 3820000 325000 9 91 - 99
01578310 P00608 1997 1710000 148000 9 91 - 99
01578310 P00608 1998 2570000 247000 10 91 - 99
01578310 P00608 1999 1590000 202000 13 91 - 99
01578310 P00613 1985 661000 74900 11 85 - 93
01578310 P00613 1986 781000 62100 8 85 - 93
01578310 P00613 1987 677000 44700 7 85 - 93
01578310 P00613 1988 592000 41400 7 85 - 93
01578310 P00613 1989 774000 58500 8 85 - 93
01578310 P00613 1990 806000 58800 7 86 - 94
01578310 P00613 1991 554000 47900 9 87 - 95
01578310 P00613 1992 668000 60400 9 88 - 96
01578310 P00613 1993 694000 62000 9 89 - 97
01578310 P00613 1994 649000 65800 10 90 - 98
01578310 P00613 1995 407000 49100 12 91 - 99
01578310 P00613 1996 604000 64300 11 91 - 99
01578310 P00613 1997 414000 45800 11 91 - 99
01578310 P00613 1998 517000 64700 13 91 - 99
01578310 P00613 1999 479000 85200 18 91 - 99
01578310 P00623 1985 14700000 1200000 8 85 - 93
01578310 P00623 1986 19300000 1170000 6 85 - 93
01578310 P00623 1987 13800000 662000 5 85 - 93
01578310 P00623 1988 10800000 529000 5 85 - 93
01578310 P00623 1989 14200000 738000 5 85 - 93
01578310 P00623 1990 14500000 722000 5 86 - 94
01578310 P00623 1991 8000000 470000 6 87 - 95
01578310 P00623 1992 8050000 407000 5 88 - 96
01578310 P00623 1993 11900000 682000 6 89 - 97
01578310 P00623 1994 9770000 552000 6 90 - 98
01578310 P00623 1995 4730000 319000 7 91 - 99
01578310 P00623 1996 12100000 740000 6 91 - 99
01578310 P00623 1997 5010000 310000 6 91 - 99
01578310 P00623 1998 7740000 530000 7 91 - 99
01578310 P00623 1999 5350000 491000 9 91 - 99
Appendix A 15
Appendix A Annual load estimates for the River Input monitoring stations on the Susquehanna Potomac Patuxent and Choptank RiversndashContinued
Standard Error of Prediction
Annual load +- +- ModelStation no Parameter Year (kgyr) (kgyr) Percent window
Susquehanna River at Conowingo Dam (01578310)mdashContinued
01578310 P00625 1979 23100000 1870000 8 79 - 87
01578310 P00625 1980 14000000 984000 7 79 - 87
01578310 P00625 1981 17100000 1230000 7 79 - 87
01578310 P00625 1982 21200000 1680000 8 79 - 87
01578310 P00625 1983 28900000 2470000 9 79 - 87
01578310 P00625 1984 41100000 3280000 8 80 - 88
01578310 P00625 1985 21400000 1350000 6 81 - 89
01578310 P00625 1986 26200000 1450000 6 82 - 90
01578310 P00625 1987 18300000 912000 5 83 - 91
01578310 P00625 1988 14200000 709000 5 84 - 92
01578310 P00625 1989 19700000 1050000 5 85 - 93
01578310 P00625 1990 20100000 1020000 5 86 - 94
01578310 P00625 1991 10700000 610000 6 87 - 95
01578310 P00625 1992 11600000 540000 5 88 - 96
01578310 P00625 1993 19900000 1100000 6 89 - 97
01578310 P00625 1994 16300000 831000 5 90 - 98
01578310 P00625 1995 7230000 439000 6 91 - 99
01578310 P00625 1996 21700000 1290000 6 91 - 99
01578310 P00625 1997 8030000 453000 6 91 - 99
01578310 P00625 1998 13800000 902000 7 91 - 99
01578310 P00625 1999 9370000 814000 9 91 - 99
01578310 P00631 1979 54500000 2580000 5 79 - 87
01578310 P00631 1980 30200000 1230000 4 79 - 87
01578310 P00631 1981 34400000 1420000 4 79 - 87
01578310 P00631 1982 40200000 1830000 5 79 - 87
01578310 P00631 1983 49500000 2390000 5 79 - 87
01578310 P00631 1984 53700000 2510000 5 80 - 88
01578310 P00631 1985 35900000 1570000 4 81 - 89
01578310 P00631 1986 48600000 1840000 4 82 - 90
01578310 P00631 1987 38400000 1280000 3 83 - 91
01578310 P00631 1988 32600000 1140000 3 84 - 92
01578310 P00631 1989 44600000 1470000 3 85 - 93
01578310 P00631 1990 58900000 1830000 3 86 - 94
01578310 P00631 1991 38300000 1310000 3 87 - 95
01578310 P00631 1992 42300000 1240000 3 88 - 96
01578310 P00631 1993 61600000 1790000 3 89 - 97
01578310 P00631 1994 59100000 1640000 3 90 - 98
A Revised Load Estimation Procedure for the Susquehanna Potomac Patuxent and Choptank Rivers 16
Appendix A Annual load estimates for the River Input monitoring stations on the Susquehanna Potomac Patuxent and Choptank RiversndashContinued
Standard Error of Prediction
Annual load +- +- ModelStation no Parameter Year (kgyr) (kgyr) Percent window
Susquehanna River at Conowingo Dam (01578310)mdashContinued
01578310 P00631 1995 35400000 1340000 4 91 - 99
01578310 P00631 1996 74000000 2350000 3 91 - 99
01578310 P00631 1997 35800000 1280000 4 91 - 99
01578310 P00631 1998 46400000 1810000 4 91 - 99
01578310 P00631 1999 29500000 1560000 5 91 - 99
01578310 P00665 1979 4480000 551000 12 79 - 87
01578310 P00665 1980 1960000 195000 10 79 - 87
01578310 P00665 1981 2050000 230000 11 79 - 87
01578310 P00665 1982 2150000 220000 10 79 - 87
01578310 P00665 1983 2980000 353000 12 79 - 87
01578310 P00665 1984 3490000 424000 12 80 - 88
01578310 P00665 1985 1440000 127000 9 81 - 89
01578310 P00665 1986 2110000 178000 8 82 - 90
01578310 P00665 1987 1460000 104000 7 83 - 91
01578310 P00665 1988 1170000 86500 7 84 - 92
01578310 P00665 1989 1920000 155000 8 85 - 93
01578310 P00665 1990 2210000 172000 8 86 - 94
01578310 P00665 1991 1140000 95700 8 87 - 95
01578310 P00665 1992 1130000 83900 7 88 - 96
01578310 P00665 1993 3330000 380000 11 89 - 97
01578310 P00665 1994 2470000 256000 10 90 - 98
01578310 P00665 1995 840000 86300 10 91 - 99
01578310 P00665 1996 4160000 555000 13 91 - 99
01578310 P00665 1997 870000 78700 9 91 - 99
01578310 P00665 1998 1920000 231000 12 91 - 99
01578310 P00665 1999 1060000 152000 14 91 - 99
01578310 P00666 1979 1200000 135000 11 79 - 87
01578310 P00666 1980 524000 50600 10 79 - 87
01578310 P00666 1981 558000 56700 10 79 - 87
01578310 P00666 1982 571000 62500 11 79 - 87
01578310 P00666 1983 680000 80200 12 79 - 87
01578310 P00666 1984 764000 87200 11 80 - 88
01578310 P00666 1985 495000 52900 11 81 - 89
01578310 P00666 1986 660000 65800 10 82 - 90
01578310 P00666 1987 471000 42600 9 83 - 91
01578310 P00666 1988 345000 31700 9 84 - 92
Appendix A 17
Appendix A Annual load estimates for the River Input monitoring stations on the Susquehanna Potomac Patuxent and Choptank RiversndashContinued
Standard Error of Prediction
Annual load +- +- ModelStation no Parameter Year (kgyr) (kgyr) Percent window
Susquehanna River at Conowingo Dam (01578310)mdashContinued
01578310 P00666 1989 489000 42600 9 85 - 93
01578310 P00666 1990 697000 61900 9 86 - 94
01578310 P00666 1991 323000 30000 9 87 - 95
01578310 P00666 1992 425000 34400 8 88 - 96
01578310 P00666 1993 698000 57200 8 89 - 97
01578310 P00666 1994 675000 58700 9 90 - 98
01578310 P00666 1995 350000 34300 10 91 - 99
01578310 P00666 1996 994000 87700 9 91 - 99
01578310 P00666 1997 370000 33800 9 91 - 99
01578310 P00666 1998 552000 57200 10 91 - 99
01578310 P00666 1999 350000 48200 14 91 - 99
01578310 P00671 1979 1070000 166000 16 79 - 87
01578310 P00671 1980 478000 65100 14 79 - 87
01578310 P00671 1981 524000 73200 14 79 - 87
01578310 P00671 1982 544000 81500 15 79 - 87
01578310 P00671 1983 617000 96900 16 79 - 87
01578310 P00671 1984 646000 103000 16 80 - 88
01578310 P00671 1985 348000 51300 15 81 - 89
01578310 P00671 1986 432000 56700 13 82 - 90
01578310 P00671 1987 337000 42900 13 83 - 91
01578310 P00671 1988 222000 29600 13 84 - 92
01578310 P00671 1989 291000 37000 13 85 - 93
01578310 P00671 1990 425000 55500 13 86 - 94
01578310 P00671 1991 202000 30800 15 87 - 95
01578310 P00671 1992 260000 34300 13 88 - 96
01578310 P00671 1993 424000 55500 13 89 - 97
01578310 P00671 1994 404000 55300 14 90 - 98
01578310 P00671 1995 255000 43800 17 91 - 99
01578310 P00671 1996 669000 103000 15 91 - 99
01578310 P00671 1997 259000 42000 16 91 - 99
01578310 P00671 1998 365000 65800 18 91 - 99
01578310 P00671 1999 180000 41200 23 91 - 99
01578310 P00680 1985 92400000 4900000 5 85 - 93
01578310 P00680 1986 135000000 5830000 4 85 - 93
01578310 P00680 1987 93900000 3170000 3 85 - 93
01578310 P00680 1988 75900000 2630000 3 85 - 93
A Revised Load Estimation Procedure for the Susquehanna Potomac Patuxent and Choptank Rivers 18
Appendix A Annual load estimates for the River Input monitoring stations on the Susquehanna Potomac Patuxent and Choptank RiversndashContinued
Standard Error of Prediction
Annual load +- +- ModelStation no Parameter Year (kgyr) (kgyr) Percent window
Susquehanna River at Conowingo Dam (01578310)mdashContinued
01578310 P00680 1989 134000000 5180000 4 85 - 93
01578310 P00680 1990 149000000 5320000 4 86 - 94
01578310 P00680 1991 80400000 2660000 3 87 - 95
01578310 P00680 1992 102000000 2970000 3 88 - 96
01578310 P00680 1993 218000000 8000000 4 89 - 97
01578310 P00680 1994 198000000 6730000 3 90 - 98
01578310 P00680 1995 83600000 3260000 4 91 - 99
01578310 P00680 1996 267000000 10600000 4 91 - 99
01578310 P00680 1997 85300000 3110000 4 91 - 99
01578310 P00680 1998 140000000 5980000 4 91 - 99
01578310 P00680 1999 76300000 4300000 6 91 - 99
Appendix A 19
Appendix A Annual load estimates for the River Input monitoring stations on the Susquehanna Potomac Patuxent and Choptank RiversndashContinued
Standard Error of Prediction
Annual load Annual load +- +- Model Station no Parameter Year (kgyr SiO2) (kgyr Si) (kgyr SiO2) Percent window
Susquehanna River at Conowingo Dam (01578310)ndashContinued
01578310 P00955 1979 194000000 90700000 16800000 9 79 - 87
01578310 P00955 1980 87600000 41000000 6580000 8 79 - 87
01578310 P00955 1981 89400000 41800000 6830000 8 79 - 87
01578310 P00955 1982 100000000 47000000 7910000 8 79 - 87
01578310 P00955 1983 130000000 60900000 11000000 8 79 - 87
01578310 P00955 1984 175000000 81700000 15300000 9 80 - 88
01578310 P00955 1985 107000000 50200000 8200000 8 81 - 89
01578310 P00955 1986 160000000 74900000 11600000 7 82 - 90
01578310 P00955 1987 112000000 52300000 6750000 6 83 - 91
01578310 P00955 1988 93700000 43800000 5860000 6 84 - 92
01578310 P00955 1989 139000000 64900000 8290000 6 85 - 93
01578310 P00955 1990 189000000 88200000 11600000 6 86 - 94
01578310 P00955 1991 101000000 47200000 7380000 7 87 - 95
01578310 P00955 1992 116000000 54100000 7280000 6 88 - 96
01578310 P00955 1993 204000000 95500000 15200000 7 89 - 97
01578310 P00955 1994 186000000 87100000 12900000 7 90 - 98
01578310 P00955 1995 94500000 44200000 8110000 9 91 - 99
01578310 P00955 1996 259000000 121000000 20400000 8 91 - 99
01578310 P00955 1997 91600000 42800000 7470000 8 91 - 99
01578310 P00955 1998 135000000 63300000 12600000 9 91 - 99
01578310 P00955 1999 72600000 33900000 8920000 12 91 - 99
A Revised Load Estimation Procedure for the Susquehanna Potomac Patuxent and Choptank Rivers 20
Appendix A Annual load estimates for the River Input monitoring stations on the Susquehanna Potomac Patuxent and Choptank RiversndashContinued
Standard Error of Prediction
Annual load +- +- ModelStation no Parameter Year (kgyr) (kgyr) Percent window
Susquehanna River at Conowingo Dam (01578310)ndashContinued
01578310 P80154 1979 2700000000 458000000 17 79 - 87
01578310 P80154 1980 878000000 95500000 11 79 - 87
01578310 P80154 1981 942000000 140000000 15 79 - 87
01578310 P80154 1982 938000000 107000000 11 79 - 87
01578310 P80154 1983 1730000000 236000000 14 79 - 87
01578310 P80154 1984 2850000000 467000000 16 80 - 88
01578310 P80154 1985 516000000 40700000 8 81 - 89
01578310 P80154 1986 1110000000 122000000 11 82 - 90
01578310 P80154 1987 535000000 43400000 8 83 - 91
01578310 P80154 1988 397000000 30100000 8 84 - 92
01578310 P80154 1989 942000000 67700000 7 85 - 93
01578310 P80154 1990 861000000 49800000 6 86 - 94
01578310 P80154 1991 419000000 27400000 7 87 - 95
01578310 P80154 1992 422000000 25300000 6 88 - 96
01578310 P80154 1993 3080000000 340000000 11 89 - 97
01578310 P80154 1994 1970000000 192000000 10 90 - 98
01578310 P80154 1995 397000000 34600000 9 91 - 99
01578310 P80154 1996 3680000000 584000000 16 91 - 99
01578310 P80154 1997 364000000 26400000 7 91 - 99
01578310 P80154 1998 1110000000 123000000 11 91 - 99
01578310 P80154 1999 349000000 44600000 13 91 - 99
Appendix A 21
Appendix A Annual load estimates for the River Input monitoring stations on the Susquehanna Potomac Patuxent and Choptank RiversndashContinued
Standard Error of Prediction
Annual load +- +- Model Station no Parameter Year (kgyr) (kgyr) Percent window
Potomac River at Chain Bridge (01646580)
01646580 P00600 1979 41100000 2220000 5 79 - 87
01646580 P00600 1980 20200000 812000 4 79 - 87
01646580 P00600 1981 10600000 386000 4 79 - 87
01646580 P00600 1982 22200000 842000 4 79 - 87
01646580 P00600 1983 34200000 1340000 4 79 - 87
01646580 P00600 1984 40300000 1780000 4 80 - 88
01646580 P00600 1985 27700000 1500000 5 81 - 89
01646580 P00600 1986 16400000 622000 4 82 - 90
01646580 P00600 1987 23200000 792000 3 83 - 91
01646580 P00600 1988 17200000 657000 4 84 - 92
01646580 P00600 1989 23500000 711000 3 85 - 93
01646580 P00600 1990 19400000 475000 2 86 - 94
01646580 P00600 1991 16600000 503000 3 87 - 95
01646580 P00600 1992 17700000 496000 3 88 - 96
01646580 P00600 1993 36700000 1200000 3 89 - 97
01646580 P00600 1994 33900000 992000 3 90 - 98
01646580 P00600 1995 17800000 443000 2 91 - 99
01646580 P00600 1996 60900000 1580000 3 91 - 99
01646580 P00600 1997 18700000 469000 3 91 - 99
01646580 P00600 1998 34700000 993000 3 91 - 99
01646580 P00600 1999 9770000 284000 3 91 - 99
01646580 P00608 1979 1480000 352000 24 79 - 87
01646580 P00608 1980 686000 104000 15 79 - 87
01646580 P00608 1981 353000 46800 13 79 - 87
01646580 P00608 1982 728000 104000 14 79 - 87
01646580 P00608 1983 1080000 165000 15 79 - 87
01646580 P00608 1984 1320000 240000 20 80 - 88
01646580 P00608 1985 863000 322000 37 81 - 89
01646580 P00608 1986 375000 79700 21 82 - 90
01646580 P00608 1987 586000 125000 21 83 - 91
01646580 P00608 1988 473000 115000 24 84 - 92
01646580 P00608 1989 484000 73100 15 85 - 93
01646580 P00608 1990 323000 51400 16 86 - 94
01646580 P00608 1991 288000 54000 19 87 - 95
01646580 P00608 1992 290000 44300 15 88 - 96
01646580 P00608 1993 829000 156000 19 89 - 97
A Revised Load Estimation Procedure for the Susquehanna Potomac Patuxent and Choptank Rivers 22
Appendix A Annual load estimates for the River Input monitoring stations on the Susquehanna Potomac Patuxent and Choptank RiversndashContinued
Standard Error of Prediction
Annual load +- +- Model Station no Parameter Year (kgyr) (kgyr) Percent window
Potomac River at Chain Bridge (01646580)mdashContinued
01646580 P00608 1994 736000 114000 16 90 - 98
01646580 P00608 1995 261000 28900 11 91 - 99
01646580 P00608 1996 1470000 263000 18 91 - 99
01646580 P00608 1997 359000 43300 12 91 - 99
01646580 P00608 1998 1040000 138000 13 91 - 99
01646580 P00608 1999 247000 29800 12 91 - 99
01646580 P00613 1985 135000 24400 18 85 - 93
01646580 P00613 1986 110000 15300 14 85 - 93
01646580 P00613 1987 157000 18600 12 85 - 93
01646580 P00613 1988 120000 15100 13 85 - 93
01646580 P00613 1989 154000 18500 12 85 - 93
01646580 P00613 1990 119000 12700 11 86 - 94
01646580 P00613 1991 123000 15600 13 87 - 95
01646580 P00613 1992 111000 9640 9 88 - 96
01646580 P00613 1993 263000 28600 11 89 - 97
01646580 P00613 1994 245000 23600 10 90 - 98
01646580 P00613 1995 134000 11800 9 91 - 99
01646580 P00613 1996 467000 41100 9 91 - 99
01646580 P00613 1997 147000 12600 9 91 - 99
01646580 P00613 1998 278000 270000 10 91 - 99
01646580 P00613 1999 82100 9260 11 91 - 99
01646580 P00623 1983 7490000 575000 8 83 - 91
01646580 P00623 1984 8180000 549000 7 83 - 91
01646580 P00623 1985 5150000 431000 8 83 - 91
01646580 P00623 1986 3090000 190000 6 83 - 91
01646580 P00623 1987 4230000 271000 6 83 - 91
01646580 P00623 1988 3030000 223000 7 84 - 92
01646580 P00623 1989 3590000 233000 6 85 - 93
01646580 P00623 1990 2550000 149000 6 86 - 94
01646580 P00623 1991 1860000 151000 8 87 - 95
01646580 P00623 1992 2020000 129000 6 88 - 96
01646580 P00623 1993 4210000 327000 8 89 - 97
01646580 P00623 1994 3890000 246000 6 90 - 98
01646580 P00623 1995 2020000 97500 5 91 - 99
01646580 P00623 1996 9140000 628000 7 91 - 99
01646580 P00623 1997 2480000 129000 5 91 - 99
Appendix A 23
Appendix A Annual load estimates for the River Input monitoring stations on the Susquehanna Potomac Patuxent and Choptank RiversndashContinued
Standard Error of Prediction
Annual load +- +- Model Station no Parameter Year (kgyr) (kgyr) Percent window
Potomac River at Chain Bridge (01646580)mdashContinued
01646580 P00623 1998 5580000 318000 6 91 - 99
01646580 P00623 1999 1900000 103000 5 91 - 99
01646580 P00625 1979 15000000 1420000 9 79 - 87
01646580 P00625 1980 7170000 485000 7 79 - 87
01646580 P00625 1981 3850000 229000 6 79 - 87
01646580 P00625 1982 8810000 611000 7 79 - 87
01646580 P00625 1983 14900000 1060000 7 79 - 87
01646580 P00625 1984 19800000 1780000 9 80 - 88
01646580 P00625 1985 13500000 2170000 16 81 - 89
01646580 P00625 1986 5780000 531000 9 82 - 90
01646580 P00625 1987 8870000 839000 9 83 - 91
01646580 P00625 1988 6710000 697000 10 84 - 92
01646580 P00625 1989 7130000 513000 7 85 - 93
01646580 P00625 1990 4000000 239000 6 86 - 94
01646580 P00625 1991 3300000 254000 8 87 - 95
01646580 P00625 1992 3700000 270000 7 88 - 96
01646580 P00625 1993 9720000 862000 9 89 - 97
01646580 P00625 1994 8160000 623000 8 90 - 98
01646580 P00625 1995 3680000 217000 6 91 - 99
01646580 P00625 1996 21700000 2120000 10 91 - 99
01646580 P00625 1997 4510000 304000 7 91 - 99
01646580 P00625 1998 11600000 789000 7 91 - 99
01646580 P00625 1999 2870000 180000 6 91 - 99
01646580 P00631 1979 27400000 2660000 10 79 - 87
01646580 P00631 1980 13800000 1040000 8 79 - 87
01646580 P00631 1981 7110000 479000 7 79 - 87
01646580 P00631 1982 14000000 950000 7 79 - 87
01646580 P00631 1983 20100000 1360000 7 79 - 87
01646580 P00631 1984 21200000 1460000 7 80 - 88
01646580 P00631 1985 16600000 1230000 7 81 - 89
01646580 P00631 1986 10600000 682000 6 82 - 90
01646580 P00631 1987 13900000 741000 5 83 - 91
01646580 P00631 1988 10300000 600000 6 84 - 92
01646580 P00631 1989 16700000 810000 5 85 - 93
01646580 P00631 1990 17300000 781000 5 86 - 94
01646580 P00631 1991 13500000 603000 4 87 - 95
A Revised Load Estimation Procedure for the Susquehanna Potomac Patuxent and Choptank Rivers 24
Appendix A Annual load estimates for the River Input monitoring stations on the Susquehanna Potomac Patuxent and Choptank RiversndashContinued
Standard Error of Prediction
Annual load +- +- Model Station no Parameter Year (kgyr) (kgyr) Percent window
Potomac River at Chain Bridge (01646580)mdashContinued
01646580 P00631 1992 14400000 541000 4 88 - 96
01646580 P00631 1993 26400000 996000 4 89 - 97
01646580 P00631 1994 24800000 836000 3 90 - 98
01646580 P00631 1995 15000000 490000 3 91 - 99
01646580 P00631 1996 41500000 1220000 3 91 - 99
01646580 P00631 1997 14300000 458000 3 91 - 99
01646580 P00631 1998 21600000 790000 4 91 - 99
01646580 P00631 1999 6730000 262000 4 91 - 99
01646580 P00665 1979 4010000 499000 12 79 - 87
01646580 P00665 1980 1410000 124000 9 79 - 87
01646580 P00665 1981 680000 53900 8 79 - 87
01646580 P00665 1982 1740000 167000 10 79 - 87
01646580 P00665 1983 3020000 286000 9 79 - 87
01646580 P00665 1984 3780000 456000 12 80 - 88
01646580 P00665 1985 3690000 1010000 27 81 - 89
01646580 P00665 1986 877000 111000 13 82 - 90
01646580 P00665 1987 1560000 213000 14 83 - 91
01646580 P00665 1988 1350000 228000 17 84 - 92
01646580 P00665 1989 1480000 154000 10 85 - 93
01646580 P00665 1990 954000 110000 11 86 - 94
01646580 P00665 1991 654000 82600 13 87 - 95
01646580 P00665 1992 800000 97400 12 88 - 96
01646580 P00665 1993 2390000 343000 14 89 - 97
01646580 P00665 1994 1800000 215000 12 90 - 98
01646580 P00665 1995 680000 67800 10 91 - 99
01646580 P00665 1996 7110000 1490000 21 91 - 99
01646580 P00665 1997 954000 140000 15 91 - 99
01646580 P00665 1998 3020000 328000 11 91 - 99
01646580 P00665 1999 659000 62400 9 91 - 99
01646580 P00666 1979 976000 116000 12 79 - 87
01646580 P00666 1980 424000 36400 9 79 - 87
01646580 P00666 1981 263000 20100 8 79 - 87
01646580 P00666 1982 547000 45100 8 79 - 87
01646580 P00666 1983 878000 79300 9 79 - 87
01646580 P00666 1984 955000 91900 10 80 - 88
01646580 P00666 1985 808000 139000 17 81 - 89
Appendix A 25
Appendix A Annual load estimates for the River Input monitoring stations on the Susquehanna Potomac Patuxent and Choptank RiversndashContinued
Standard Error of Prediction
Annual load +- +- Model Station no Parameter Year (kgyr) (kgyr) Percent window
Potomac River at Chain Bridge (01646580)mdashContinued
01646580 P00666 1986 342000 35400 10 82 - 90
01646580 P00666 1987 482000 50300 10 83 - 91
01646580 P00666 1988 363000 52000 14 84 - 92
01646580 P00666 1989 555000 55800 10 85 - 93
01646580 P00666 1990 541000 68100 13 86 - 94
01646580 P00666 1991 298000 41900 14 87 - 95
01646580 P00666 1992 371000 42700 12 88 - 96
01646580 P00666 1993 645000 88200 14 89 - 97
01646580 P00666 1994 530000 58600 11 90 - 98
01646580 P00666 1995 251000 23600 9 91 - 99
01646580 P00666 1996 1510000 223000 15 91 - 99
01646580 P00666 1997 353000 43000 12 91 - 99
01646580 P00666 1998 917000 95600 10 91 - 99
01646580 P00666 1999 397000 40000 10 91 - 99
01646580 P00671 1979 659000 106000 16 79 - 87
01646580 P00671 1980 291000 36100 12 79 - 87
01646580 P00671 1981 183000 19700 11 79 - 87
01646580 P00671 1982 382000 40400 11 79 - 87
01646580 P00671 1983 613000 66200 11 79 - 87
01646580 P00671 1984 633000 68300 11 80 - 88
01646580 P00671 1985 542000 99500 18 81 - 89
01646580 P00671 1986 218000 26200 12 82 - 90
01646580 P00671 1987 311000 34100 11 83 - 91
01646580 P00671 1988 238000 36300 15 84 - 92
01646580 P00671 1989 445000 47800 11 85 - 93
01646580 P00671 1990 587000 108000 18 86 - 94
01646580 P00671 1991 254000 41600 16 87 - 95
01646580 P00671 1992 308000 37200 12 88 - 96
01646580 P00671 1993 543000 76300 14 89 - 97
01646580 P00671 1994 455000 54500 12 90 - 98
01646580 P00671 1995 187000 18900 10 91 - 99
01646580 P00671 1996 1160000 196000 17 91 - 99
01646580 P00671 1997 244000 32000 13 91 - 99
01646580 P00671 1998 643000 72100 11 91 - 99
01646580 P00671 1999 242000 25700 11 91 - 99
A Revised Load Estimation Procedure for the Susquehanna Potomac Patuxent and Choptank Rivers 26
Appendix A Annual load estimates for the River Input monitoring stations on the Susquehanna Potomac Patuxent and Choptank RiversndashContinued
Standard Error of Prediction
Annual load +- +- Model Station no Parameter Year (kgyr) (kgyr) Percent window
Potomac River at Chain Bridge (01646580)mdashContinued
01646580 P00680 1988 38300000 3820000 10 88 - 96
01646580 P00680 1989 55100000 3470000 6 88 - 96
01646580 P00680 1990 48400000 2760000 6 88 - 96
01646580 P00680 1991 44300000 2920000 7 88 - 96
01646580 P00680 1992 44900000 2540000 6 88 - 96
01646580 P00680 1993 104000000 7250000 7 89 - 97
01646580 P00680 1994 81300000 4330000 5 90 - 98
01646580 P00680 1995 32300000 1370000 4 91 - 99
01646580 P00680 1996 166000000 11500000 7 91 - 99
01646580 P00680 1997 34600000 1710000 5 91 - 99
01646580 P00680 1998 78400000 3950000 5 91 - 99
01646580 P00680 1999 21500000 1030000 5 91 - 99
Appendix A 27
Appendix A Annual load estimates for the River Input monitoring stations on the Susquehanna Potomac Patuxent and Choptank RiversndashContinued
Standard Error of Prediction
Annual load Annual load +- +- Model Station no Parameter Year (kgyr SiO2) (kgyr Si) (kgyr SiO2) Percent window
Potomac River at Chain Bridge (01646580)mdashContinued
01646580 P00955 1979 155000000 72300000 30000000 19 79 - 87
01646580 P00955 1980 57000000 26700000 8700000 15 79 - 87
01646580 P00955 1981 29100000 13600000 4070000 14 79 - 87
01646580 P00955 1982 65000000 30400000 11100000 17 79 - 87
01646580 P00955 1983 107000000 49900000 18100000 17 79 - 87
01646580 P00955 1984 140000000 65300000 29400000 21 80 - 88
01646580 P00955 1985 140000000 65200000 62900000 45 81 - 89
01646580 P00955 1986 39700000 18600000 8330000 21 82 - 90
01646580 P00955 1987 68500000 32000000 13500000 20 83 - 91
01646580 P00955 1988 67800000 31700000 18800000 28 84 - 92
01646580 P00955 1989 95700000 44700000 15400000 16 85 - 93
01646580 P00955 1990 79200000 37000000 15000000 19 86 - 94
01646580 P00955 1991 49500000 23200000 8340000 17 87 - 95
01646580 P00955 1992 56900000 26600000 6730000 12 88 - 96
01646580 P00955 1993 104000000 48700000 15600000 15 89 - 97
01646580 P00955 1994 95700000 44700000 12800000 13 90 - 98
01646580 P00955 1995 46500000 21700000 5760000 12 91 - 99
01646580 P00955 1996 265000000 124000000 54600000 21 91 - 99
01646580 P00955 1997 50200000 23500000 7080000 14 91 - 99
01646580 P00955 1998 127000000 59500000 19400000 15 91 - 99
01646580 P00955 1999 29600000 13800000 4200000 14 91 - 99
A Revised Load Estimation Procedure for the Susquehanna Potomac Patuxent and Choptank Rivers 28
Appendix A Annual load estimates for the River Input monitoring stations on the Susquehanna Potomac Patuxent and Choptank RiversndashContinued
Standard Error of Prediction
Annual load +- +- Model Station no Parameter Year (kgyr) (kgyr) Percent window
Potomac River at Chain Bridge (01646580)mdashContinued
01646580 P80154 1979 4130000000 833000000 20 79 - 87
01646580 P80154 1980 1090000000 148000000 14 79 - 87
01646580 P80154 1981 369000000 56900000 15 79 - 87
01646580 P80154 1982 1480000000 322000000 22 79 - 87
01646580 P80154 1983 2980000000 564000000 19 79 - 87
01646580 P80154 1984 7450000000 3110000000 42 80 - 88
01646580 P80154 1985 7530000000 5480000000 73 81 - 89
01646580 P80154 1986 684000000 229000000 34 82 - 90
01646580 P80154 1987 2100000000 737000000 35 83 - 91
01646580 P80154 1988 3050000000 1080000000 35 84 - 92
01646580 P80154 1989 1880000000 435000000 23 85 - 93
01646580 P80154 1990 876000000 228000000 26 86 - 94
01646580 P80154 1991 534000000 115000000 22 87 - 95
01646580 P80154 1992 378000000 65800000 17 88 - 96
01646580 P80154 1993 2080000000 382000000 18 89 - 97
01646580 P80154 1994 1300000000 224000000 17 90 - 98
01646580 P80154 1995 284000000 43600000 15 91 - 99
01646580 P80154 1996 5420000000 1650000000 30 91 - 99
01646580 P80154 1997 312000000 59300000 19 91 - 99
01646580 P80154 1998 1240000000 219000000 18 91 - 99
01646580 P80154 1999 73500000 12400000 17 91 - 99
Appendix A 29
Appendix A Annual load estimates for the River Input monitoring stations on the Susquehanna Potomac Patuxent and Choptank RiversndashContinued
Standard Error of Prediction
Annual load +- +- ModelStation no Parameter Year (kgyr) (kgyr) Percent window
Patuxent River near Bowie (01594440)
01594440 P00600 1978 989000 69800 7 78 - 86
01594440 P00600 1979 1560000 102000 7 78 - 86
01594440 P00600 1980 952000 38300 4 78 - 86
01594440 P00600 1981 615000 27500 4 78 - 86
01594440 P00600 1982 812000 37400 5 78 - 86
01594440 P00600 1983 1390000 73100 5 79 - 87
01594440 P00600 1984 1330000 48900 4 80 - 88
01594440 P00600 1985 805000 23600 3 81 - 89
01594440 P00600 1986 778000 21000 3 82 - 90
01594440 P00600 1987 941000 23100 2 83 - 91
01594440 P00600 1988 887000 22000 2 84 - 92
01594440 P00600 1989 1160000 31700 3 85 - 93
01594440 P00600 1990 908000 24100 3 86 - 94
01594440 P00600 1991 679000 19700 3 87 - 95
01594440 P00600 1992 591000 17200 3 88 - 96
01594440 P00600 1993 838000 26000 3 89 - 97
01594440 P00600 1994 778000 21300 3 90 - 98
01594440 P00600 1995 480000 13300 3 91 - 99
01594440 P00600 1996 1040000 25800 2 91 - 99
01594440 P00600 1997 638000 17100 3 91 - 99
01594440 P00600 1998 676000 21400 3 91 - 99
01594440 P00600 1999 484000 20500 4 91 - 99
01594440 P00608 1980 210000 34200 16 80 - 88
01594440 P00608 1981 157000 18800 12 80 - 88
01594440 P00608 1982 162000 15400 10 80 - 88
01594440 P00608 1983 202000 20300 10 80 - 88
01594440 P00608 1984 172000 15500 9 80 - 88
01594440 P00608 1985 122000 8980 7 81 - 89
01594440 P00608 1986 106000 7520 7 82 - 90
01594440 P00608 1987 99700 6920 7 83 - 91
01594440 P00608 1988 76800 5980 8 84 - 92
01594440 P00608 1989 73900 5910 8 85 - 93
01594440 P00608 1990 57400 4410 8 86 - 94
01594440 P00608 1991 48900 4450 9 87 - 95
01594440 P00608 1992 40500 3520 9 88 - 96
01594440 P00608 1993 73700 7000 10 89 - 97
A Revised Load Estimation Procedure for the Susquehanna Potomac Patuxent and Choptank Rivers 30
Appendix A Annual load estimates for the River Input monitoring stations on the Susquehanna Potomac Patuxent and Choptank RiversndashContinued
Standard Error of Prediction
Annual load +- +- ModelStation no Parameter Year (kgyr) (kgyr) Percent window
Patuxent River near Bowie (01594440)mdashContinued
01594440 P00608 1994 74300 7570 10 90 - 98
01594440 P00608 1995 39600 4090 10 91 - 99
01594440 P00608 1996 82900 7650 9 91 - 99
01594440 P00608 1997 52800 5370 10 91 - 99
01594440 P00608 1998 51100 6020 12 91 - 99
01594440 P00608 1999 27500 3960 14 91 - 99
01594440 P00613 1985 24900 3110 13 85 - 93
01594440 P00613 1986 17500 1560 9 85 - 93
01594440 P00613 1987 14300 1060 7 85 - 93
01594440 P00613 1988 11700 915 8 85 - 93
01594440 P00613 1989 12600 1210 10 85 - 93
01594440 P00613 1990 8410 680 8 86 - 94
01594440 P00613 1991 7120 635 9 87 - 95
01594440 P00613 1992 5980 470 8 88 - 96
01594440 P00613 1993 11200 916 8 89 - 97
01594440 P00613 1994 11300 973 9 90 - 98
01594440 P00613 1995 6820 623 9 91 - 99
01594440 P00613 1996 15000 1200 8 91 - 99
01594440 P00613 1997 9450 850 9 91 - 99
01594440 P00613 1998 9310 972 10 91 - 99
01594440 P00613 1999 5250 700 13 91 - 99
01594440 P00623 1985 253000 18100 7 85 - 93
01594440 P00623 1986 233000 11700 5 85 - 93
01594440 P00623 1987 258000 10600 4 85 - 93
01594440 P00623 1988 241000 10200 4 85 - 93
01594440 P00623 1989 296000 14800 5 85 - 93
01594440 P00623 1990 219000 9610 4 86 - 94
01594440 P00623 1991 155000 8100 5 87 - 95
01594440 P00623 1992 132000 6640 5 88 - 96
01594440 P00623 1993 215000 11800 5 89 - 97
01594440 P00623 1994 193000 10300 5 90 - 98
01594440 P00623 1995 110000 6140 6 91 - 99
01594440 P00623 1996 269000 13800 5 91 - 99
01594440 P00623 1997 150000 8110 5 91 - 99
01594440 P00623 1998 161000 10400 6 91 - 99
01594440 P00623 1999 109000 9310 9 91 - 99
Appendix A 31
Appendix A Annual load estimates for the River Input monitoring stations on the Susquehanna Potomac Patuxent and Choptank RiversndashContinued
Standard Error of Prediction
Annual load +- +- ModelStation no Parameter Year (kgyr) (kgyr) Percent window
Patuxent River near Bowie (01594440)mdashContinued
01594440 P00625 1978 427000 53300 12 78 - 86
01594440 P00625 1979 736000 91200 12 78 - 86
01594440 P00625 1980 376000 24400 6 78 - 86
01594440 P00625 1981 223000 15800 7 78 - 86
01594440 P00625 1982 305000 22500 7 78 - 86
01594440 P00625 1983 581000 52700 9 79 - 87
01594440 P00625 1984 557000 34600 6 80 - 88
01594440 P00625 1985 293000 15300 5 81 - 89
01594440 P00625 1986 272000 13200 5 82 - 90
01594440 P00625 1987 336000 14200 4 83 - 91
01594440 P00625 1988 296000 12300 4 84 - 92
01594440 P00625 1989 423000 22300 5 85 - 93
01594440 P00625 1990 298000 14000 5 86 - 94
01594440 P00625 1991 199000 11300 6 87 - 95
01594440 P00625 1992 182000 10100 6 88 - 96
01594440 P00625 1993 304000 18400 6 89 - 97
01594440 P00625 1994 276000 15400 6 90 - 98
01594440 P00625 1995 150000 8580 6 91 - 99
01594440 P00625 1996 409000 21500 5 91 - 99
01594440 P00625 1997 213000 11600 5 91 - 99
01594440 P00625 1998 237000 15600 7 91 - 99
01594440 P00625 1999 169000 15500 9 91 - 99
01594440 P00631 1980 539000 39000 7 80 - 88
01594440 P00631 1981 394000 20600 5 80 - 88
01594440 P00631 1982 504000 21000 4 80 - 88
01594440 P00631 1983 773000 35200 5 80 - 88
01594440 P00631 1984 754000 30400 4 80 - 88
01594440 P00631 1985 510000 15900 3 81 - 89
01594440 P00631 1986 510000 14600 3 82 - 90
01594440 P00631 1987 607000 15800 3 83 - 91
01594440 P00631 1988 596000 15800 3 84 - 92
01594440 P00631 1989 733000 20800 3 85 - 93
01594440 P00631 1990 603000 16700 3 86 - 94
01594440 P00631 1991 480000 13800 3 87 - 95
01594440 P00631 1992 400000 12600 3 88 - 96
01594440 P00631 1993 528000 17700 3 89 - 97
01594440 P00631 1994 492000 14800 3 90 - 98
A Revised Load Estimation Procedure for the Susquehanna Potomac Patuxent and Choptank Rivers 32
Appendix A Annual load estimates for the River Input monitoring stations on the Susquehanna Potomac Patuxent and Choptank RiversndashContinued
Standard Error of Prediction
Annual load +- +- ModelStation no Parameter Year (kgyr) (kgyr) Percent window
Patuxent River near Bowie (01594440)mdashContinued
01594440 P00631 1995 332000 10500 3 91 - 99
01594440 P00631 1996 635000 17800 3 91 - 99
01594440 P00631 1997 424000 12900 3 91 - 99
01594440 P00631 1998 439000 15500 4 91 - 99
01594440 P00631 1999 320000 15300 5 91 - 99
01594440 P00665 1978 165000 21600 13 78 - 86
01594440 P00665 1979 332000 40000 12 78 - 86
01594440 P00665 1980 182000 14900 8 78 - 86
01594440 P00665 1981 103000 9420 9 78 - 86
01594440 P00665 1982 135000 12900 9 78 - 86
01594440 P00665 1983 265000 31000 12 79 - 87
01594440 P00665 1984 177000 14100 8 80 - 88
01594440 P00665 1985 72700 5390 7 81 - 89
01594440 P00665 1986 55100 3610 7 82 - 90
01594440 P00665 1987 65500 4150 6 83 - 91
01594440 P00665 1988 49500 2950 6 84 - 92
01594440 P00665 1989 81300 6110 8 85 - 93
01594440 P00665 1990 53800 3390 6 86 - 94
01594440 P00665 1991 33000 2360 7 87 - 95
01594440 P00665 1992 35000 2800 8 88 - 96
01594440 P00665 1993 55700 4730 9 89 - 97
01594440 P00665 1994 51600 3920 8 90 - 98
01594440 P00665 1995 29500 2600 9 91 - 99
01594440 P00665 1996 85700 7120 8 91 - 99
01594440 P00665 1997 36400 2930 8 91 - 99
01594440 P00665 1998 38400 3710 10 91 - 99
01594440 P00665 1999 32300 5370 17 91 - 99
01594440 P00666 1978 89000 10600 12 78 - 86
01594440 P00666 1979 142000 12700 9 78 - 86
01594440 P00666 1980 119000 9120 8 78 - 86
01594440 P00666 1981 90600 8190 9 78 - 86
01594440 P00666 1982 94900 8550 9 78 - 86
01594440 P00666 1983 108000 10700 10 79 - 87
01594440 P00666 1984 61300 5040 8 80 - 88
01594440 P00666 1985 29600 1960 7 81 - 89
01594440 P00666 1986 21600 1340 6 82 - 90
Appendix A 33
Appendix A Annual load estimates for the River Input monitoring stations on the Susquehanna Potomac Patuxent and Choptank RiversndashContinued
Standard Error of Prediction
Annual load +- +- ModelStation no Parameter Year (kgyr) (kgyr) Percent window
Patuxent River near Bowie (01594440)mdashContinued
01594440 P00666 1987 18600 1050 6 83 - 91
01594440 P00666 1988 14100 805 6 84 - 92
01594440 P00666 1989 17200 1160 7 85 - 93
01594440 P00666 1990 12900 733 6 86 - 94
01594440 P00666 1991 9360 575 6 87 - 95
01594440 P00666 1992 10500 729 7 88 - 96
01594440 P00666 1993 15600 1250 8 89 - 97
01594440 P00666 1994 15600 1220 8 90 - 98
01594440 P00666 1995 9730 854 9 91 - 99
01594440 P00666 1996 21600 1800 8 91 - 99
01594440 P00666 1997 10900 886 8 91 - 99
01594440 P00666 1998 10600 1030 10 91 - 99
01594440 P00666 1999 8490 1290 15 91 - 99
01594440 P00671 1982 109000 19300 18 82 - 90
01594440 P00671 1983 96800 12200 13 82 - 90
01594440 P00671 1984 59900 5440 9 82 - 90
01594440 P00671 1985 26600 1850 7 82 - 90
01594440 P00671 1986 17700 1190 7 82 - 90
01594440 P00671 1987 15400 961 6 83 - 91
01594440 P00671 1988 11000 672 6 84 - 92
01594440 P00671 1989 12900 857 7 85 - 93
01594440 P00671 1990 10300 637 6 86 - 94
01594440 P00671 1991 7280 424 6 87 - 95
01594440 P00671 1992 8620 573 7 88 - 96
01594440 P00671 1993 12400 912 7 89 - 97
01594440 P00671 1994 13000 843 6 90 - 98
01594440 P00671 1995 9580 686 7 91 - 99
01594440 P00671 1996 21000 1440 7 91 - 99
01594440 P00671 1997 10200 674 7 91 - 99
01594440 P00671 1998 9240 722 8 91 - 99
01594440 P00671 1999 6850 840 12 91 - 99
01594440 P00680 1985 1440000 78300 5 85 - 93
01594440 P00680 1986 1230000 47800 4 85 - 93
01594440 P00680 1987 1750000 57200 3 85 - 93
01594440 P00680 1988 1720000 57200 3 85 - 93
01594440 P00680 1989 3210000 142000 4 85 - 93
A Revised Load Estimation Procedure for the Susquehanna Potomac Patuxent and Choptank Rivers 34
Appendix A Annual load estimates for the River Input monitoring stations on the Susquehanna Potomac Patuxent and Choptank RiversndashContinued
Standard Error of Prediction
Annual load +- +- ModelStation no Parameter Year (kgyr) (kgyr) Percent window
Patuxent River near Bowie (01594440)mdashContinued
01594440 P00680 1990 1980000 58400 3 86 - 94
01594440 P00680 1991 1260000 42200 3 87 - 95
01594440 P00680 1992 1430000 57700 4 88 - 96
01594440 P00680 1993 2740000 104000 4 89 - 97
01594440 P00680 1994 2730000 93600 3 90 - 98
01594440 P00680 1995 1560000 62400 4 91 - 99
01594440 P00680 1996 4940000 180000 4 91 - 99
01594440 P00680 1997 2200000 81000 4 91 - 99
01594440 P00680 1998 2370000 106000 4 91 - 99
01594440 P00680 1999 1640000 116000 7 91 - 99
Appendix A 35
Appendix A Annual load estimates for the River Input monitoring stations on the Susquehanna Potomac Patuxent and Choptank RiversndashContinued
Standard Error of Prediction
Annual load Annual load +- +- ModelStation no Parameter Year (kgyr SiO2) (kgyr Si) (kgyr SiO2) Percent window
Patuxent River near Bowie (01594440)mdashContinued
01594440 P00955 1978 3270000 1530000 212000 6 78 - 86
01594440 P00955 1979 4710000 2200000 250000 5 78 - 86
01594440 P00955 1980 2760000 1290000 110000 4 78 - 86
01594440 P00955 1981 1440000 671000 62800 4 78 - 86
01594440 P00955 1982 1940000 905000 88600 5 78 - 86
01594440 P00955 1983 3160000 1480000 160000 5 79 - 87
01594440 P00955 1984 2760760 1290000 92000 3 80 - 88
01594440 P00955 1985 1460000 684000 46700 3 81 - 89
01594440 P00955 1986 1490000 698000 42700 3 82 - 90
01594440 P00955 1987 2020000 942000 54700 3 83 - 91
01594440 P00955 1988 2100000 982000 55700 3 84 - 92
01594440 P00955 1989 2980000 1390000 78500 3 85 - 93
01594440 P00955 1990 2550000 1190000 67400 3 86 - 94
01594440 P00955 1991 1880000 877000 50100 3 87 - 95
01594440 P00955 1992 1820000 850000 47100 3 88 - 96
01594440 P00955 1993 2680000 1250000 75600 3 89 - 97
01594440 P00955 1994 2810000 1310000 65400 2 90 - 98
01594440 P00955 1995 1980000 924000 47500 2 91 - 99
01594440 P00955 1996 4340000 2030000 94000 2 91 - 99
01594440 P00955 1997 2650000 1240000 61900 2 91 - 99
01594440 P00955 1998 2650000 1240000 72500 3 91 - 99
01594440 P00955 1999 1900000 887000 71000 4 91 - 99
A Revised Load Estimation Procedure for the Susquehanna Potomac Patuxent and Choptank Rivers 36
Appendix A Annual load estimates for the River Input monitoring stations on the Susquehanna Potomac Patuxent and Choptank RiversndashContinued
Standard Error of Prediction
Annual load +- +- ModelStation no Parameter Year (kgyr) (kgyr) Percent window
Patuxent River near Bowie (01594440)mdashContinued
01594440 P80154 1985 16300000 3480000 21 85 - 93
01594440 P80154 1986 10600000 1430000 13 85 - 93
01594440 P80154 1987 21800000 3040000 14 85 - 93
01594440 P80154 1988 22400000 3010000 13 85 - 93
01594440 P80154 1989 58500000 7990000 14 85 - 93
01594440 P80154 1990 24800000 3030000 12 86 - 94
01594440 P80154 1991 9900000 1340000 14 87 - 95
01594440 P80154 1992 13300000 2370000 18 88 - 96
01594440 P80154 1993 27500000 3990000 15 89 - 97
01594440 P80154 1994 24800000 3100000 13 90 - 98
01594440 P80154 1995 11700000 1900000 16 91 - 99
01594440 P80154 1996 53200000 6860000 13 91 - 99
01594440 P80154 1997 15500000 2090000 14 91 - 99
01594440 P80154 1998 17900000 2710000 15 91 - 99
01594440 P80154 1999 14100000 4890000 35 91 - 99
Appendix A 37
Appendix A Annual load estimates for the River Input monitoring stations on the Susquehanna Potomac Patuxent and Choptank RiversndashContinued
Standard Error of Prediction
Annual load +- +- ModelStation no Parameter Year (kgyr) (kgyr) Percent window
Choptank River near Greensboro (01491000)
01491000 P00600 1978 237000 17500 7 78 - 86
01491000 P00600 1979 314000 19700 6 78 - 86
01491000 P00600 1980 188000 7320 4 78 - 86
01491000 P00600 1981 107000 4370 4 78 - 86
01491000 P00600 1982 166000 7680 5 78 - 86
01491000 P00600 1983 329000 19400 6 79 - 87
01491000 P00600 1984 276000 14200 5 80 - 88
01491000 P00600 1985 113000 3760 3 81 - 89
01491000 P00600 1986 151000 5000 3 82 - 90
01491000 P00600 1987 167000 4980 3 83 - 91
01491000 P00600 1988 126000 3370 3 84 - 92
01491000 P00600 1989 355000 8260 2 85 - 93
01491000 P00600 1990 188000 4750 3 86 - 94
01491000 P00600 1991 156000 4370 3 87 - 95
01491000 P00600 1992 132000 3660 3 88 - 96
01491000 P00600 1993 177000 5700 3 89 - 97
01491000 P00600 1994 284000 9340 3 90 - 98
01491000 P00600 1995 133000 3750 3 91 - 99
01491000 P00600 1996 380000 10400 3 91 - 99
01491000 P00600 1997 201000 5360 3 91 - 99
01491000 P00600 1998 230000 7320 3 91 - 99
01491000 P00600 1999 183000 7680 4 91 - 99
01491000 P00608 1980 12300 3280 27 80 - 88
01491000 P00608 1981 6300 1220 19 80 - 88
01491000 P00608 1982 10800 1850 17 80 - 88
01491000 P00608 1983 29200 7250 25 80 - 88
01491000 P00608 1984 21000 5130 24 80 - 88
01491000 P00608 1985 3780 579 15 81 - 89
01491000 P00608 1986 5340 771 14 82 - 90
01491000 P00608 1987 6290 823 13 83 - 91
01491000 P00608 1988 3920 445 11 84 - 92
01491000 P00608 1989 17200 1890 11 85 - 93
01491000 P00608 1990 8380 1070 13 86 - 94
01491000 P00608 1991 7190 817 11 87 - 95
01491000 P00608 1992 5610 644 11 88 - 96
01491000 P00608 1993 10200 1340 13 89 - 97
A Revised Load Estimation Procedure for the Susquehanna Potomac Patuxent and Choptank Rivers 38
Appendix A Annual load estimates for the River Input monitoring stations on the Susquehanna Potomac Patuxent and Choptank RiversndashContinued
Standard Error of Prediction
Annual load +- +- ModelStation no Parameter Year (kgyr) (kgyr) Percent window
Choptank River near Greensboro (01491000)mdashContinued
01491000 P00608 1994 17000 3100 18 90 - 98
01491000 P00608 1995 4440 545 12 91 - 99
01491000 P00608 1996 18200 2230 12 91 - 99
01491000 P00608 1997 8280 1010 12 91 - 99
01491000 P00608 1998 10300 1450 14 91 - 99
01491000 P00608 1999 7410 1700 23 91 - 99
01491000 P00613 1985 698 104 15 85 - 93
01491000 P00613 1986 928 109 12 85 - 93
01491000 P00613 1987 1100 104 10 85 - 93
01491000 P00613 1988 877 79 9 85 - 93
01491000 P00613 1989 3100 265 9 85 - 93
01491000 P00613 1990 1560 143 9 86 - 94
01491000 P00613 1991 1380 130 9 87 - 95
01491000 P00613 1992 1040 110 11 88 - 96
01491000 P00613 1993 1320 152 12 89 - 97
01491000 P00613 1994 1670 199 12 90 - 98
01491000 P00613 1995 698 86 12 91 - 99
01491000 P00613 1996 2090 247 12 91 - 99
01491000 P00613 1997 1150 139 12 91 - 99
01491000 P00613 1998 1200 157 13 91 - 99
01491000 P00613 1999 921 148 16 91 - 99
01491000 P00623 1985 37200 3340 9 85 - 93
01491000 P00623 1986 49600 3580 7 85 - 93
01491000 P00623 1987 54400 3250 6 85 - 93
01491000 P00623 1988 37600 1940 5 85 - 93
01491000 P00623 1989 129000 6440 5 85 - 93
01491000 P00623 1990 54700 3020 6 86 - 94
01491000 P00623 1991 41400 2340 6 87 - 95
01491000 P00623 1992 32100 1750 5 88 - 96
01491000 P00623 1993 48300 3480 7 89 - 97
01491000 P00623 1994 84600 6570 8 90 - 98
01491000 P00623 1995 26900 1340 5 91 - 99
01491000 P00623 1996 104000 5500 5 91 - 99
01491000 P00623 1997 46900 2290 5 91 - 99
01491000 P00623 1998 60000 3570 6 91 - 99
01491000 P00623 1999 52300 5590 11 91 - 99
Appendix A 39
Appendix A Annual load estimates for the River Input monitoring stations on the Susquehanna Potomac Patuxent and Choptank RiversndashContinued
Standard Error of Prediction
Annual load +- +- ModelStation no Parameter Year (kgyr) (kgyr) Percent window
Choptank River near Greensboro (01491000)mdashContinued
01491000 P00625 1978 125000 23200 19 78 - 86
01491000 P00625 1979 159000 29000 18 78 - 86
01491000 P00625 1980 75400 7280 10 78 - 86
01491000 P00625 1981 35600 3400 10 78 - 86
01491000 P00625 1982 58000 6140 11 78 - 86
01491000 P00625 1983 143000 20100 14 79 - 87
01491000 P00625 1984 141000 18400 13 80 - 88
01491000 P00625 1985 49300 4710 10 81 - 89
01491000 P00625 1986 65100 5430 8 82 - 90
01491000 P00625 1987 70800 4800 7 83 - 91
01491000 P00625 1988 45100 2590 6 84 - 92
01491000 P00625 1989 167000 8880 5 85 - 93
01491000 P00625 1990 65100 3920 6 86 - 94
01491000 P00625 1991 44100 2540 6 87 - 95
01491000 P00625 1992 33900 1840 5 88 - 96
01491000 P00625 1993 59600 4400 7 89 - 97
01491000 P00625 1994 113000 9670 9 90 - 98
01491000 P00625 1995 31800 1770 6 91 - 99
01491000 P00625 1996 149000 9360 6 91 - 99
01491000 P00625 1997 63000 3490 6 91 - 99
01491000 P00625 1998 88900 6130 7 91 - 99
01491000 P00625 1999 90300 13300 15 91 - 99
01491000 P00631 1980 113000 9060 8 80 - 88
01491000 P00631 1981 69300 3870 6 80 - 88
01491000 P00631 1982 101000 5120 5 80 - 88
01491000 P00631 1983 161000 9220 6 80 - 88
01491000 P00631 1984 132000 7520 6 80 - 88
01491000 P00631 1985 64000 2510 4 81 - 89
01491000 P00631 1986 83500 3140 4 82 - 90
01491000 P00631 1987 95100 3360 4 83 - 91
01491000 P00631 1988 81600 2650 3 84 - 92
01491000 P00631 1989 194000 5510 3 85 - 93
01491000 P00631 1990 121000 3680 3 86 - 94
01491000 P00631 1991 114000 3910 3 87 - 95
01491000 P00631 1992 99900 3570 4 88 - 96
01491000 P00631 1993 118000 4750 4 89 - 97
01491000 P00631 1994 172000 7140 4 90 - 98
A Revised Load Estimation Procedure for the Susquehanna Potomac Patuxent and Choptank Rivers 40
Appendix A Annual load estimates for the River Input monitoring stations on the Susquehanna Potomac Patuxent and Choptank RiversndashContinued
Standard Error of Prediction
Annual load +- +- ModelStation no Parameter Year (kgyr) (kgyr) Percent window
Choptank River near Greensboro (01491000)mdashContinued
01491000 P00631 1995 100000 4070 4 91 - 99
01491000 P00631 1996 228000 8620 4 91 - 99
01491000 P00631 1997 137000 5170 4 91 - 99
01491000 P00631 1998 141000 6080 4 91 - 99
01491000 P00631 1999 112000 6020 5 91 - 99
01491000 P00665 1978 18200 4580 25 78 - 86
01491000 P00665 1979 29000 9580 33 78 - 86
01491000 P00665 1980 10800 1370 13 78 - 86
01491000 P00665 1981 4930 599 12 78 - 86
01491000 P00665 1982 7610 990 13 78 - 86
01491000 P00665 1983 30300 6090 20 79 - 87
01491000 P00665 1984 18900 3500 19 80 - 88
01491000 P00665 1985 5410 871 16 81 - 89
01491000 P00665 1986 6270 768 12 82 - 90
01491000 P00665 1987 6950 717 10 83 - 91
01491000 P00665 1988 4430 363 8 84 - 92
01491000 P00665 1989 20900 1670 8 85 - 93
01491000 P00665 1990 8380 811 10 86 - 94
01491000 P00665 1991 6840 592 9 87 - 95
01491000 P00665 1992 4870 400 8 88 - 96
01491000 P00665 1993 9350 1150 12 89 - 97
01491000 P00665 1994 19400 3030 16 90 - 98
01491000 P00665 1995 4180 434 10 91 - 99
01491000 P00665 1996 24700 3200 13 91 - 99
01491000 P00665 1997 9060 991 11 91 - 99
01491000 P00665 1998 13300 1770 13 91 - 99
01491000 P00665 1999 20100 7180 36 91 - 99
01491000 P00666 1978 4190 1000 24 78 - 86
01491000 P00666 1979 8010 2530 32 78 - 86
01491000 P00666 1980 3570 427 12 78 - 86
01491000 P00666 1981 1980 232 12 78 - 86
01491000 P00666 1982 2890 368 13 78 - 86
01491000 P00666 1983 8580 1810 21 79 - 87
01491000 P00666 1984 4590 796 17 80 - 88
01491000 P00666 1985 1790 297 17 81 - 89
01491000 P00666 1986 1640 185 11 82 - 90
Appendix A 41
Appendix A Annual load estimates for the River Input monitoring stations on the Susquehanna Potomac Patuxent and Choptank RiversndashContinued
Standard Error of Prediction
Annual load +- +- ModelStation no Parameter Year (kgyr) (kgyr) Percent window
Choptank River near Greensboro (01491000)mdashContinued
01491000 P00666 1987 1930 183 10 83 - 91
01491000 P00666 1988 1570 121 8 84 - 92
01491000 P00666 1989 8700 700 8 85 - 93
01491000 P00666 1990 3250 321 10 86 - 94
01491000 P00666 1991 2860 268 9 87 - 95
01491000 P00666 1992 2680 208 8 88 - 96
01491000 P00666 1993 4020 379 9 89 - 97
01491000 P00666 1994 9650 1110 11 90 - 98
01491000 P00666 1995 2480 195 8 91 - 99
01491000 P00666 1996 13200 1280 10 91 - 99
01491000 P00666 1997 4420 379 9 91 - 99
01491000 P00666 1998 4830 479 10 91 - 99
01491000 P00666 1999 5410 1420 26 91 - 99
01491000 P00671 1982 2860 772 27 82 - 90
01491000 P00671 1983 7140 1580 22 82 - 90
01491000 P00671 1984 4090 761 19 82 - 90
01491000 P00671 1985 1410 304 22 82 - 90
01491000 P00671 1986 1350 216 16 82 - 90
01491000 P00671 1987 1530 201 13 83 - 91
01491000 P00671 1988 1160 123 11 84 - 92
01491000 P00671 1989 6260 685 11 85 - 93
01491000 P00671 1990 2500 358 14 86 - 94
01491000 P00671 1991 2280 292 13 87 - 95
01491000 P00671 1992 2110 245 12 88 - 96
01491000 P00671 1993 2950 419 14 89 - 97
01491000 P00671 1994 6290 1090 17 90 - 98
01491000 P00671 1995 1690 204 12 91 - 99
01491000 P00671 1996 7600 1070 14 91 - 99
01491000 P00671 1997 2870 368 13 91 - 99
01491000 P00671 1998 3200 478 15 91 - 99
01491000 P00671 1999 3050 1070 35 91 - 99
01491000 P00680 1985 430000 25900 6 85 - 93
01491000 P00680 1986 622000 30600 5 85 - 93
01491000 P00680 1987 680000 27500 4 85 - 93
01491000 P00680 1988 426000 13900 3 85 - 93
01491000 P00680 1989 1850000 61300 3 85 - 93
A Revised Load Estimation Procedure for the Susquehanna Potomac Patuxent and Choptank Rivers 42
Appendix A Annual load estimates for the River Input monitoring stations on the Susquehanna Potomac Patuxent and Choptank RiversndashContinued
Standard Error of Prediction
Annual load +- +- ModelStation no Parameter Year (kgyr) (kgyr) Percent window
Choptank River near Greensboro (01491000)mdashContinued
01491000 P00680 1990 759000 29300 4 86 - 94
01491000 P00680 1991 596000 21000 4 87 - 95
01491000 P00680 1992 461000 16300 4 88 - 96
01491000 P00680 1993 903000 44800 5 89 - 97
01491000 P00680 1994 1880000 101000 5 90 - 98
01491000 P00680 1995 555000 22000 4 91 - 99
01491000 P00680 1996 2590000 114000 4 91 - 99
01491000 P00680 1997 1040000 40400 4 91 - 99
01491000 P00680 1998 1370000 66900 5 91 - 99
01491000 P00680 1999 1190000 121000 10 91 - 99
Appendix A 43
Appendix A Annual load estimates for the River Input monitoring stations on the Susquehanna Potomac Patuxent and Choptank RiversndashContinued
Standard Error of Prediction
Annual load Annual load +- +- ModelStation no Parameter Year (kgyr SiO2) (kgyr Si) (kgyr SiO2) Percent window
Choptank River near Greensboro (01491000)mdashContinued
01491000 P00955 1978 1760000 824000 139000 8 78 - 86
01491000 P00955 1979 2310000 1080000 126000 5 78 - 86
01491000 P00955 1980 1640000 768000 73200 4 78 - 86
01491000 P00955 1981 1060000 495000 51500 5 78 - 86
01491000 P00955 1982 1490000 695000 81500 5 78 - 86
01491000 P00955 1983 2280000 1070000 143000 6 79 - 87
01491000 P00955 1984 1870000 876000 112000 6 80 - 88
01491000 P00955 1985 903000 422000 36600 4 81 - 89
01491000 P00955 1986 1180000 552000 46100 4 82 - 90
01491000 P00955 1987 1350000 631000 48800 4 83 - 91
01491000 P00955 1988 1130000 528000 37300 3 84 - 92
01491000 P00955 1989 2610000 1220000 76200 3 85 - 93
01491000 P00955 1990 1560000 727000 50600 3 86 - 94
01491000 P00955 1991 1370000 642000 45700 3 87 - 95
01491000 P00955 1992 1190000 554000 38100 3 88 - 96
01491000 P00955 1993 1360000 637000 40700 3 89 - 97
01491000 P00955 1994 2120000 992000 63300 3 90 - 98
01491000 P00955 1995 1320000 615000 37600 3 91 - 99
01491000 P00955 1996 2910000 1360000 76600 3 91 - 99
01491000 P00955 1997 1790000 835000 47800 3 91 - 99
01491000 P00955 1998 1720000 806000 52000 3 91 - 99
01491000 P00955 1999 1420000 661000 54900 4 91 - 99
A Revised Load Estimation Procedure for the Susquehanna Potomac Patuxent and Choptank Rivers 44
Appendix A Annual load estimates for the River Input monitoring stations on the Susquehanna Potomac Patuxent and Choptank RiversndashContinued
Standard Error of Prediction
Annual load +- +- ModelStation no Parameter Year (kgyr) (kgyr) Percent window
Choptank River near Greensboro (01491000)mdashContinued
01491000 P80154 1978 3540000 1300000 37 78 - 86
01491000 P80154 1979 6680000 3400000 51 78 - 86
01491000 P80154 1980 1950000 362000 19 78 - 86
01491000 P80154 1981 730000 129000 18 78 - 86
01491000 P80154 1982 1370000 237000 17 78 - 86
01491000 P80154 1983 6790000 1530000 23 79 - 87
01491000 P80154 1984 3560000 729000 20 80 - 88
01491000 P80154 1985 901000 237000 26 81 - 89
01491000 P80154 1986 1560000 337000 22 82 - 90
01491000 P80154 1987 1770000 299000 17 83 - 91
01491000 P80154 1988 874000 119000 14 84 - 92
01491000 P80154 1989 5130000 660000 13 85 - 93
01491000 P80154 1990 1950000 334000 17 86 - 94
01491000 P80154 1991 1480000 200000 14 87 - 95
01491000 P80154 1992 733000 89300 12 88 - 96
01491000 P80154 1993 2200000 433000 20 89 - 97
01491000 P80154 1994 5850000 1580000 27 90 - 98
01491000 P80154 1995 742000 109000 15 91 - 99
01491000 P80154 1996 5090000 981000 19 91 - 99
01491000 P80154 1997 1420000 180000 13 91 - 99
01491000 P80154 1998 2940000 548000 19 91 - 99
01491000 P80154 1999 2820000 1310000 46 91 - 99
Appendix A 45
--------
--------
--------
--------
--------
--------
--------
--------
--------
--------
--------
--------
-----
A Revised Load Estimation Procedure for the Susquehanna Potomac Patuxent and Choptank Rivers
App
endi
x B
Pe
rcen
t diff
eren
ces b
etw
een
hist
oric
al a
nd re
vise
d lo
ad e
stim
ates
[Thi
s app
endi
x su
mm
ariz
es th
e pe
rcen
t diff
eren
ces b
etw
een
the
hist
oric
al lo
ad e
stim
ates
from
the
Riv
er In
put m
onito
ring
prog
ram
and
the
revi
sed
estim
ates
pro
vide
d in
A
ppen
dix
A -
- es
timat
es a
re n
ot a
vaila
ble
for c
ompa
rison
]
Rev
ised
est
imat
e -
His
tori
c es
tim
ate
Per
cent
dif
fere
nce
=
times 10
0
(R
evis
ed e
stim
ate
+ H
isto
ric
estim
ate )
2
Dis
solv
edTo
tal
Tota
lTo
tal
Diss
olve
d k
jeld
ahl
kjel
dahl
Diss
olve
dTo
tal
Diss
olve
dor
gani
cSu
spen
ded
nitr
ogen
am
mon
ia n
itrog
enni
trog
enni
trite
+ n
itrat
eph
osph
orus
phos
phor
usO
rtho
phos
phor
usca
rbon
sedi
men
tYe
ar (P
0060
0) (P
0060
8) (P
0062
3)
(P00
625)
(P
0063
1)
(P00
665)
(P
0066
6)
(P00
671)
(P
0068
0)
(P80
154)
Susq
ueha
nna
Riv
er a
t Con
owin
go D
am (0
1578
310)
1978
--
----
----
----
----
--
1979
-3
9
-18
7 --
-22
-1
4
-42
7
8 14
2
--3
4
1980
-1
1
-11
--
-09
2
2 -7
5
52
30
---3
0
1981
1
4 7
0 --
09
49
-57
8
4 -4
3
---1
1
1982
2
8 17
0
--1
8 5
8 -1
14
20
-10
5 --
-19
1983
4
2 20
2
--3
8 5
4 -1
16
-53
-1
15
--2
5
1984
6
3 10
7
--17
6
-29
-2
09
-13
5 -1
21
--5
6
1985
6
2 -5
3
-29
12
7
-08
-2
31
-58
-1
61
-13
9 -1
8
1986
2
3 -1
02
-02
2
2 -0
4
-32
8 -1
79
-32
-7
9
-12
7
1987
3
5 -5
8
23
25
23
-27
7 -2
94
219
-6
3
-81
1988
4
2 -2
3
95
56
35
-27
3 -4
93
290
1
0 -3
8
1989
-6
1
197
-6
4
-18
-9
0
-29
7 -6
69
181
15
0
-08
1990
-8
2
58
-18
8 -7
7
-10
8 -1
82
-28
4 24
8
81
-37
1991
-8
8
161
-2
59
-16
5 -9
5
-10
8 2
4 44
6
-16
-6
1
1992
-7
7
-62
-1
32
-13
1 -1
00
-19
8 3
5 7
1 3
2 -1
55
1993
-1
8
49
-71
-8
6
-33
-0
7
131
4
6 1
0 7
7
1994
-1
2
-48
-8
1
-12
6 0
6 -0
3
81
-35
0 0
0 9
8
1995
-1
7
-14
6 -1
51
-21
0 2
6 -6
3
206
-7
65
-84
-2
4
1996
-4
5
-16
9 -4
8
-41
-4
3
167
12
4
-15
6 -6
7
40
1997
-3
2
----
13
16
191
29
2
-52
--
-10
3
1998
0
0 -1
29
49
-14
0
9 17
6
112
-3
67
-13
8 1
0
46
App
endi
x B
Pe
rcen
t diff
eren
ces b
etw
een
hist
oric
al a
nd re
vise
d lo
ad e
stim
ates
mdashC
ontin
ued
Diss
olve
dTo
tal
Tota
l T
otal
Diss
olve
d k
jeld
ahl
kjel
dahl
Diss
olve
dTo
tal
Diss
olve
dor
gani
cSu
spen
ded
nitr
ogen
am
mon
ia n
itrog
enni
trog
enni
trite
+ n
itrat
eph
osph
orus
phos
phor
usO
rtho
phos
phor
usca
rbon
sedi
men
tYe
ar (P
0060
0) (P
0060
8) (P
0062
3)
(P00
625)
(P
0063
1)
(P00
665)
(P
0066
6)
(P00
671)
(P
0068
0)
(P80
154)
Poto
mac
Riv
er a
t Cha
in B
ridg
e (0
1646
580)
1978
--
----
----
----
----
--
1979
1
2 49
6
--0
2 -3
2
39
150
27
7
---2
12
1980
2
0 35
6
--0
4 -2
8
14
127
17
2
--7
0
1981
1
3 24
3
---1
6
-25
-3
5
98
92
--29
3
1982
1
7 13
8
---2
4
06
-37
2
8 5
3 --
265
1983
0
7 2
5 0
6 -3
0
14
-55
-4
3
07
--26
9
1984
0
7 -4
7
-77
0
5 -0
6
-77
-9
8
-68
--
528
1985
-5
3
-50
-2
09
-96
1
2 -1
03
-15
7 -5
6
--41
3
1986
-9
2
-24
5 -1
41
-13
6 -1
12
-26
3 -1
91
-24
3 --
119
1987
-8
8
-21
-1
24
-99
-1
61
-11
8 -1
49
-13
5 --
348
1988
-3
9
246
-5
7
-41
-1
25
59
33
120
-3
28
574
1989
-0
1
-13
6 8
8 4
8 -7
0
64
141
12
5
-16
27
2
1990
-9
7
-36
7 6
7 -2
93
-38
-2
12
274
40
8
-20
6 17
6
1991
-1
68
-32
6 7
3 -2
75
-24
1 -2
85
-14
0 -1
60
-89
-6
8
1992
-1
32
-31
0 20
6
-80
-2
63
-21
9 -1
79
-26
4 -2
93
-32
5
1993
-8
0
-01
16
8
-80
-1
31
-76
-4
8
-14
-1
3
-14
4
1994
-3
1
229
13
7
-57
-4
4
21
159
26
0
61
-15
7
1995
5
2 1
1 8
8 4
3 -2
0
-20
-8
4
-14
2 3
3 -7
6
1996
-1
10
-83
-0
7
-29
-1
47
114
13
4
156
-2
7
-18
4
1997
-7
1
----
-20
-1
05
136
29
1
106
--
152
1998
-5
5
-40
1
3 -2
4
-64
5
3 8
9 9
6 -3
3
71
Appendix B 47
A Revised Load Estimation Procedure for the Susquehanna Potomac Patuxent and Choptank Rivers
App
endi
x B
Pe
rcen
t diff
eren
ces b
etw
een
hist
oric
al a
nd re
vise
d lo
ad e
stim
ates
mdashC
ontin
ued
Diss
olve
dTo
tal
Tota
l T
otal
Diss
olve
d k
jeld
ahl
kjel
dahl
Diss
olve
dTo
tal
Diss
olve
dor
gani
cSu
spen
ded
nitr
ogen
am
mon
ia n
itrog
enni
trog
enni
trite
+ n
itrat
eph
osph
orus
phos
phor
usO
rtho
phos
phor
usca
rbon
sedi
men
tYe
ar (P
0060
0) (P
0060
8) (P
0062
3)
(P00
625)
(P
0063
1)
(P00
665)
(P
0066
6)
(P00
671)
(P
0068
0)
(P80
154)
Patu
xent
Riv
er n
ear
Bow
ie (0
1594
440)
1978
-2
1
----
-11
7 --
-48
3 -5
04
----
--
1979
-2
3
----
-10
7 --
-36
7 -2
43
----
--
1980
-2
5
156
--
-57
-4
2
-10
9 10
6
----
--
1981
-7
4
61
---2
1
-51
-4
9
316
--
----
1982
-4
3
-21
--
-24
-2
2
19
362
33
6
----
1983
-0
4
-10
--
-43
1
4 17
2
388
14
7
----
1984
3
9 -6
6
--8
3 1
7 7
1 3
6 -8
1
----
1985
-1
8
-37
4
8 2
5 -1
9
-10
0 -1
42
-31
9 6
9 28
8
1986
-3
2
-48
2
2 -2
2
-12
-1
30
-17
9 -3
68
66
82
1987
0
3 0
1 1
8 0
8 0
2 0
6 -2
74
-30
9 9
8 3
4
1988
-3
8
-53
2
2 -9
8
-10
-1
2
-27
1 -2
33
119
-1
72
1989
0
8 21
0
57
32
00
88
-25
3 -1
89
123
14
5
1990
1
2 36
1
110
11
4
-16
14
4
43
-17
11
5
173
1991
5
6 57
4
76
113
5
8 6
0 -1
87
-27
3 -7
4
217
1992
-1
3
239
-0
5
71
07
62
-18
3 -2
18
-10
0 29
3
1993
9
9 27
6
192
12
0
131
0
9 -2
64
-37
4 6
6 22
0
1994
12
0
76
193
3
6 14
5
-10
-2
73
-37
1 4
8 10
0
1995
12
1
-20
0 1
2 -9
9
169
-1
88
-44
7 -5
16
-11
0 -1
74
1996
0
4 -8
9
-33
-0
6
05
-57
-1
41
-22
8 -9
3
-10
4
1997
4
6 --
----
68
-14
0 -2
86
-45
7 --
-10
0
1998
8
2 -3
23
35
-65
16
6
-31
9 -6
91
-72
8 -1
64
-15
2
48
App
endi
x B
Pe
rcen
t diff
eren
ces b
etw
een
hist
oric
al a
nd re
vise
d lo
ad e
stim
ates
mdashC
ontin
ued
Diss
olve
dTo
tal
Tota
l T
otal
Diss
olve
d k
jeld
ahl
kjel
dahl
Diss
olve
dTo
tal
Diss
olve
dor
gani
cSu
spen
ded
nitr
ogen
am
mon
ia n
itrog
enni
trog
enni
trite
+ n
itrat
eph
osph
orus
phos
phor
usO
rtho
phos
phor
usca
rbon
sedi
men
tYe
ar (P
0060
0) (P
0060
8) (P
0062
3)
(P00
625)
(P
0063
1)
(P00
665)
(P
0066
6)
(P00
671)
(P
0068
0)
(P80
154)
Cho
ptan
k R
iver
nea
r G
reen
sbor
o (0
1491
000)
1978
-1
75
----
-22
--
98
41
----
-27
4
1979
-1
52
----
-13
4 --
162
21
4
----
-20
9
1980
-3
0
165
--
-56
-0
9
-11
6 4
6 --
---1
03
1981
1
9 11
8
---7
7
02
-16
3 7
5 --
--1
6
1982
1
0 11
1
---9
0
07
-16
1 12
3
-12
1 --
40
1983
-2
2
102
--
-22
8 -1
5
108
16
8
-85
--
-19
9
1984
4
5 12
5
--4
6 -0
9
13
-54
-7
9
---4
03
1985
8
3 -2
02
37
143
-0
1
-11
0 -8
9
-13
0 -1
25
-54
2
1986
-0
9
-10
0 -0
6
-03
-4
5
-13
0 -1
46
-09
-5
8
-29
9
1987
-2
1
103
-0
7
-70
0
2 -1
21
-17
8
7 -5
1
-26
3
1988
-0
3
352
1
6 -1
77
92
-15
9 13
5
123
-3
4
-35
2
1989
1
0 15
7
23
32
-03
-1
0
-13
-1
11
-52
-2
81
1990
-3
0
124
-4
0
-41
-6
8
-79
-9
8
-15
7 -1
6
-14
9
1991
-9
5
89
-67
-1
17
-89
-4
7
31
-10
0 -1
3
106
1992
-5
8
-16
0
3 -9
7
-68
-2
59
154
-1
58
62
115
1993
-8
5
-11
7 8
1 1
3 -8
7
-91
27
9
-32
9 4
1 2
3
1994
-1
7
-82
8
8 3
7 -1
1
98
22
-43
9 -4
4
146
1995
-2
8
-18
0
5 -1
73
18
-19
6 -2
46
-61
2 -2
1
10
1996
-1
8
-13
7 -0
5
49
-47
-3
5
-16
0 -1
16
-57
9
5
1997
-4
3
----
103
-8
5
71
-34
3
0 --
90
1998
2
0 2
8 6
5 7
0 10
0
-22
-7
7
-30
8 -3
0
117
Appendix B 49
- Contents
- Abstract
- Introduction
-
- Purpose and Scope
- Description of Study Area
- Acknowledgments
-
- Methods of Load Estimation
-
- Monitoring Record
- Regression Model
- Historical Load Estimates
-
- Revised Procedure for Load Estimation
-
- Background
- Description of Revised Methods
- Comparison of Historical and Revised Load Estimates
-
- Summary and Conclusions
- References Cited
-

US Department of the Interior US Geological Survey
US Department of the Interior US Geological Survey
A Revised Load Estimation Procedure for the Susquehanna Potomac Patuxent and Choptank Rivers
By Steven E Yochum
Water-Resources Investigations Report 00-4156
In cooperation with
Maryland Department of Natural Resources
The contents of this report have been approved for public release and unlimited distribution by the US Army--distribution number 2958-A-4
Baltimore Maryland 2000
US DEPARTMENT OF THE INTERIOR BRUCE BABBITT Secretary
US Geological Survey Charles G Groat Director
The use of trade product or firm names in this report is for descriptive purposes only and does not imply endorsement by the US Geological Survey
For additional information contact
District Chief US Geological Survey WRD 8987 Yellow Brick Road Baltimore Maryland 21237
Copies of this report can be purchased from
US Geological Survey Branch of Information Services Box 25286 Denver Colorado 80225-0286
Contents
Abstract 1Introduction 1
Purpose and scope3Description of study area 3Acknowledgments 3
Methods of load estimation 3Monitoring record 3Regression model5Historical load estimates5
Revised procedure for load estimation7Background7Description of revised methods 8Comparison of historical and revised load estimates9
Summary and conclusions11References cited 11Appendixes12
A Annual load estimates for the River Input monitoring stations on theSusquehanna Potomac Patuxent and Choptank Rivers 13
B Percent differences between historical and revised load estimates46
Figures
1 Map showing the Chesapeake Bay Basin study area drainage basins and location ofMaryland River Input monitoring stations 2
2 Graphs showing sampling frequency of total phosphorus at the Maryland River Inputmonitoring stations 1978ndash99 at(A) Susquehanna River at Conowingo Dam Maryland (Station ID 01578310) (B) Potomac River at Chain Bridge at Washington DC (Station ID 01646580) (C) Patuxent River near Bowie Maryland (Station ID 01594440) and (D) Choptank River near Greensboro Maryland (Station ID 01491000) 4
3 Schematic illustrating historical load computation methodology6
4 Schematic illustrating revised load computation methodology8
5 Graphs showing comparison of selected revised and historical load estimates withstandard errors of prediction(A) Patuxent River near Bowie Maryland (Total Nitrogen) (B) Choptank River near Greensboro Maryland (Total Kjeldahl Nitrogen) (C) Susquehanna River at Conowingo Dam Maryland (Orthophosphorus) and (D) Potomac River at Chain Bridge at Washington DC (Suspended Sediment)10
Tables
1 Constituents monitored in the River Input Program3
iii
_____________________________________________________________________________________________________________________________________
_____________________________________________________________________________________________________________________________________
Conversion Factors and Vertical Datum
Multiply By To obtain
___________________________________________________________________________________
Length
__________________________________________________
inch (in) 254 centimeter inch (in) 254 millimeter mile (mi) 1609 kilometer
Area
square mile (mi2) square mile (mi2)
2590 2590
hectare square kilometer
Flow rate
cubic foot per second (ft3s) 002832 cubic meter per second
Vertical Datum In this report ldquosea levelrdquo refers to the National Geodetic Vertical Datum of 1929ndashA geodetic datum derived from a general adjustment of the first-order level nets of the United States and Canada formerly called Sea Level Datum of 1929
Temperature in degrees Celsius ( deg C) may be converted to degrees Fahrenheit ( deg F) as follows
deg F = 18 ( deg C) + 32
Temperature in degrees Fahrenheit ( deg F) may be converted to degrees Celsius ( deg C) as follows
deg C = ( deg F - 32) 18
Chemical concentration in water is expressed in milligrams per liter (mgL) or micrograms per liter (microgL)
Water year is defined as the 12-month period of October 1 through September 30 and is designated by the calendar year in which it ends
iv
A Revised Load Estimation Procedure for the Susquehanna Potomac Patuxent and Choptank Rivers
By Steven E Yochum
Abstract
The US Geological Surveyrsquos Chesapeake Bay River Input Program has updated the nutrient and suspended-sediment load data base for the Susquehanna Potomac Patuxent and Choptank Rivers using a multiple-window center-estimate regression methodology The revised method optimizes the seven-parameter regression approach that has been used historically by the program The revised method estimates load using the fifth or center year of a sliding 9-year window Each year a new model is run for each site and constituent the most recent year is added and the previous 4 years of estimates are updated The fifth year in the 9-year window is considered the best estimate and is kept in the data base The last year of estimation shows the most change from the previous yearrsquos estimate and this change approaches a minimum at the fifth year Differences between loads computed using this revised methodology and the loads populating the historical data base have been noted but the load estimates do not typically change drastically The data base resulting from the application of this revised methodology is populated by annual and monthly load estimates that are known with greater certainty than in the previous load data base
Introduction
Since 1985 the US Geological Survey (USGS) Maryland Chesapeake Bay River Input Program in a cooperative effort with the Maryland Department of Natural Resources and the Metropolitan Washington Council of Governments (MWCOG) has monitored streamflow nutrients and suspended-sediment concentrations in the Susquehanna Potomac Patuxent and Choptank Rivers just above the point of tidal influence (fig 1) These data are used to estimate nutrient and sediment loads entering the tidal waters of the Chesapeake Bay The USGS Virginia Chesapeake Bay River Input Program in cooperation with the Virginia Department of Environmental Quality monitors concentrations of nutrients and suspended sediments of five Virginia rivers just above the point of tidal influence The Maryland and Virginia programs jointly comprise the USGS River Input Program
Within the Maryland River Input Program 12 nutrient and suspended-sediment constituents are monitored at 4 stations Annual and monthly loads are estimated using a seven-parameter log-linear regression model This regression model known as Estimator was developed by the USGS and is widely used for load estimation During this program a historical data base of annual and monthly load estimates had been generated for each constituent from eleven 10- to 14-year model windows with the first window providing load estimates over its entire calibration window length and the remaining estimates extracted from the last year of calibration of each subsequent model These end-of-model-window estimates that have traditionally been provided by the monitoring program are not statistically preferred The preferred load estimates for any individual year (those with minimum uncertainty) are the ones computed in the center of the regression A new data base populated by loads estimated for the fifth or center year of 9-year calibration windows has been developed A 9-year window is preferred because it has a center (for the load estimation) and it is long enough to encompass a sufficient number of samples and a full range of wet to dry periods These center estimates have less uncertainty than the load estimates in the historical data base
Introduction 1
A Revised Load Estimation Procedure for the Susquehanna Potomac Patuxent and Choptank Rivers 2
Purpose and Scope The purpose of this report is to describe and provide
justification for a revised procedure implemented in the computation of nutrient and suspended-sediment loads at the Maryland River Input monitoring stations The revised annual loads at the monitoring stations are also presented This report limits its discussion to the load computations at the four Maryland River Input monitoring stations from 1978 through 1999 (a shorter period for some constituents and sites) and provides only a brief description of the monitoring program and study area
Description of Study Area The watersheds that drain to the four Maryland River
Input monitoring stations (fig 1) include a wide range of land cover geographic and geologic regions The watersheds encompass such diverse areas as the forested Appalachian Plateau of New York and Pennsylvania the Valley and Ridge of the West Virginia highlands as well as the agricultural regions of Pennsylvaniarsquos Lancaster County the Shenandoah Valley of Virginia and the flat lowlands of the Delmarva Peninsula
The Susquehanna River is monitored just downstream from Conowingo Dam Md and has a drainage area of 27100 mi2 (square miles) The Susquehanna is the largest tributary to the Chesapeake Bay and is the largest single source of total nitrogen and phosphorus (Darrell and others 1999) The Potomac River is the second largest contributor of streamflow to the Bay and the largest contributor of suspended sediment The Potomac is monitored at Chain Bridge and has a drainage area of 11570 mi2 The Patuxent River is monitored near Bowie Md at Governorrsquos Bridge and has a drainage area at the monitoring station of 348 mi2 The Choptank River is the smallest tributary monitored in the River Input Program The Choptank monitoring station is near Greensboro Md on the Delmarva Peninsula and has a contributing drainage area of 112 mi2
Acknowledgments The author gratefully acknowledges the many
technicians who collected the base-flow and stormflow samples used in the load computations for this study Much of these data were collected during long days weekends holidays and during adverse weather conditions Their dedication and expertise is much appreciated A special thanks is extended to David Brower of the USGS the hydrologic technician who currently collects samples for this project The author would also like to thank Joel Blomquist and Timothy Cohn of USGS who both helped develop the revised methodology and Brenda Majedi of USGS who provided much insight into the history of the River Input monitoring program The specialists and data base personnel in the Maryland-Delaware-DC District office of the USGS are also thanked for their advice and support
Harry Post of the Occoquan Watershed Monitoring Laboratory and Christine Becker of the Metropolitan Washington Council of Governments are thanked for their
monitoring efforts at the Potomac River at Chain Bridge The cooperation of the Philadelphia Electric Company in the Susquehanna River sampling and gaging at Conowingo Md is also appreciated
Methods of Load Estimation
A detailed description of the concentration data base used in the load computations is provided below The regression model Estimator the model that was used to compute loads for both the historical and revised methodologies is also discussed A description of the historical load data base is also provided
Monitoring Record Twelve nutrient and suspended-sediment constituents are
monitored at the four River Input monitoring stations These constituents are listed in table 1 Annual and monthly loads are estimated for all 12 of these constituents The table also indicates how each constituent is reported and the parameter numbers used for each constituent in the USGS National Water Information System (NWIS) water-quality data base and subsequently in the load computation process
Table 1 Constituents monitored in the River Input Program
[na not applicable]
Parameter ReportedConstituent number as
Total nitrogen (TN) P00600 N
Dissolved ammonia (NH3) P00608 N
Dissolved nitrite (NO2) P00613 N
Dissolved kjeldahl nitrogen (dissKN) P00623 N
Total kjeldahl ntrogen (TKN) P00625 N
Dissolved nitrite + nitrate (NO2 +NO3) P00631 N
Total phosphorus (TP) P00665 P
Dissolved phosphorus (dissP) P00666 P
Orthophosphorus (o-PO4) P00671 P
Total organic carbon (TOC) P00680 C
Dissolved silica (SiO2) P00955 SiO2
Suspended sediment P80154 na
Methods of Load Estimation 3
The Maryland River Input Program began in 1985 For this program 15 to 30 samples per year are collected (during both base-flow and stormflow conditions) using an equal-width-increment depth-integrated sampling procedure at the Susquehanna the Patuxent and the Choptank River sites The Potomac River is monitored by MWCOG through the Occoquan Watershed Monitoring Laboratory (OWML) OWML uses an automatic sampler at the Potomac River site Additionally the River Input Program periodically collects Potomac River storm samples using the equal-width-increment depth-integrated sampling procedure Nutrient and suspended-sediment data were collected by the USGS National Water-Quality Assessment (NAWQA) Program for the Susquehanna and Potomac Rivers from 1993 to the present and at the Choptank River from 1987ndash90 Additional samples were collected by the USGS National Stream-Quality Accounting Network (NASQAN) at all four of the sites until the midndash1990rsquos (Darrell and others 1999)
and a study by Lang (1982) populated the data base from 1979 through 1981 for the Potomac and Susquehanna Rivers
Except for the data collected by OWML for the Potomac River at Chain Bridge all of these data are the result of USGS collection and analysis and constitute the concentration data set used to estimate loads at the four Maryland River Input monitoring stations These data are available on the USGS River Input Program web site at httpwww-vausgsgovchesbayRIMP
The sampling record for the Susquehanna River at Conowingo Dam monitoring station began with the 1979 water year Figure 2a shows the sampling frequency at the dam for total phosphorus from 1978 through 1999 (Total phosphorus represents one of the more frequently sampled constituents in the record) The sampling frequencies for all constituents peaked between 1979 and 1981 during the study by Lang (1982) were at a minimum or were not analyzed for
A Revised Load Estimation Procedure for the Susquehanna Potomac Patuxent and Choptank Rivers 4
from 1982 through 1984 and then increased steadily to comparatively high levels from 1987 through 1990 Samples were collected less frequently in 1991 and 1992 as the NASQAN Program was phased out Sampling frequency increased again in 1993 when the NAWQA program entered a high-intensity phase in this river but then decreased to a minimal level as NAWQA passed into a low-intensity phase At present (2000) 25 to 35 samples per year are collected at this site (depending upon hydrologic conditions)
The sampling frequency for total phosphorus at the Potomac River station is shown in figure 2b Sampling at this site was also initiated at the beginning of the 1979 water year with an increasing frequency through 1981 for all 12 constituents during the Lang (1982) study Few water-quality data were collected in 1982 as Langrsquos sampling program ended but the sampling frequency for most constituents increased again in 1983 when MWCOG and OWML began water-quality monitoring at this site OWML does not analyze samples for nitrite and suspended sedimentmdashthese data sets have been populated since 1985 by only limited (usually monthly) USGS sampling As a result of this limited data availability estimates of nitrite and suspended-sediment loads have greater uncertainty (larger standard errors) than the other constituents Currently 60ndash80 samples per year are collected at this site (depending upon hydrologic conditions)
Sampling was relatively infrequent at the Patuxent River site from 1978ndash84 for most constituents (fig 2c) only the NASQAN Program collected samples during this period Maximum sampling frequency occurred after the River Input Program was initiated in 1985 and both the River Input and NASQAN Programs collected samples The sampling frequency decreased through the early 1990rsquos for all constituents after the River Input Program became the only program collecting samples at this site Currently 20 to 30 samples per year are collected at this site (depending upon hydrologic conditions)
Relatively low frequency sampling also occurred at the Choptank River site from 1978 through 1984 for most constituents (fig 2d) The sampling frequency was higher from 1985 through 1990 with both the River Input and NASQAN Programs sampling at this site Sampling frequency at this site peaked during the high flow year of 1989 Since 1990 the sampling frequency for all constituents has remained relatively constant with only the River Input Program sampling at this site Currently 20 to 30 samples per year are collected at this site (depending upon hydrologic conditions)
Regression Model A seven-parameter log-linear regression model is used to
characterize concentration data and estimate annual and monthly loads of nutrients and suspended sediment at the River Input monitoring stations This regression model (Estimator) incorporates a Minimum Variance Unbiased Estimator (MVUE) for correcting the bias induced by log transformation as well as an Adjusted Maximum Likelihood
Estimator (AMLE) for data sets containing censored observations (Darrell and others 1999) Descriptions of the Estimator model can be found in Darrell and others (1999) and Cohn and others (1992) The MVUE procedure is discussed in Gilroy and others (1990) Cohn and others (1989) and Bradu and Mundlak (1970) The AMLE procedure is discussed in Cohn and others (1992) and Cohn (1988)
The load estimation procedure involves two primary stepsmdashthe fitting of the model to the concentration data using ordinary least-squares regression and load estimation from the fit model (Darrell and others 1999) The model has the following form
ln[C] = β0+ β1ln (Q ) + Q β2[ln(Q )]2 + β3 (T-TQ ) +
β4 (T- )2 + β5 sin (2πT) + β6 cos (2πT) + ε (1)T
where
ln [] = natural logarithm function C = constituent concentration in milligrams per
liter (mgL) βrsquos = model coefficients Q = mean-daily streamflow in cubic feet per
second (ft3s) Q = centered streamflow T = time in decimal years T = centered time sin = sine function cos = cosine function and ε = independent random error
Daily concentration and load estimates are computed using the MVUE algorithm and the daily loads are summed to provide the monthly and annual fluxes (Darrell and others 1999) A standard error of prediction is also generated to indicate how well the estimated regression model fits a ldquotruerdquo regression model The standard error of prediction is a measure of the expected difference between an individual estimate and the estimated daily load (measured concentra-tion multiplied by the average daily discharge) This standard error of prediction is a function of the variability between the estimated and computed loads only on the days of measurement hence the standard error will be biased if there is any systematic sampling bias in the concentration data Also the standard error may not account for the variability on days without monitoring or from any systematic bias incorporated into the source concentration data set (Robertson and Roerish 1999) Possible sources of this bias include sampling techniques and designs that do not adequately represent the true environmental variability
Historical Load Estimates During the developmental period of these load-
estimation procedures it was known that the underlying principles of the model (the relation of concentration and
Methods of Load Estimation 5
streamflow) may change with time and that it would be inappropriate to assume that this relation would be constant over long periods On the basis of this observation and the amount of (monitoring) data available at that time a moving-window approach to load estimation for the years following these initial efforts was implemented (TA Cohn and JD Blomquist USGS oral and written communs 2000) A variation of this technique was employed and is described below
The historical load-estimation methodology is shown in figure 3 Each row represents a model calibration window and light-shaded boxes indicate years from which load estimates were recorded into a load data base The first model was calibrated over an 11-year period 1978 through 1988 and loads were predicted for all years During the following year a 10-year model was calibrated for 1980 through 1989 and the loads predicted for each constituent in 1989 the last year of the regression were entered into a data base with the 11 years of load estimates computed the year before This 10-year moving window approach was used for 6 years for model windows 1980ndash89 to 1985ndash94 and the loads estimated during the last year of each of these windows were recorded in the data base Starting with the 1985ndash95 model window each of the remaining Estimator models were calibrated using increasing window lengths with 1985 the reference year for the Chesapeake Bay Program as the base year for the model This method was used in the 1985ndash94 through the 1985ndash98 models Loads computed in
the last year of each of these calibration windows were entered into the load data base For each constituent the 1978 through 1998 historical load data base comprises annual and monthly load estimates from eleven 10- to 14-year model windows with the first window providing load estimates over its entire calibration window length and the remaining estimates extracted from the last year of calibration of each subsequent model
After differences between loads estimated throughout the 1985ndash98 14-year models and loads in the data base were noted a comparison between two overlapping but different regression window lengths was performed Annual loads for 11 constituents and all 4 Maryland River Input monitoring stations were computed for a 14-year 1985ndash98 model window and compared to loads estimated using a 10-year 1989ndash98 model window Annual loads were extracted from each group of models and percent differences were computed for the 11 constituents The differences between the load predictions from the two window lengths normally fell within the error bars of the standard error of prediction but the total phosphorus suspended-sediment ammonia and orthophosphorus models were found to give load predictions that were up to 50 percent different beyond the error bars of these models The greatest differences in load estimates were found at the edges of the 10-year window in 1989 and 1998 These differences indicated that a more systematic load computation procedure was required
A Revised Load Estimation Procedure for the Susquehanna Potomac Patuxent and Choptank Rivers 6
Revised Procedure for Load Estimation
The rationale for a more rigorous statistical approach in computing loads at the River Input monitoring stations is provided in this section A description of the revised procedure and a comparison of annual loads are also included
Background The concentration-discharge relation for some
constituents and rivers may change over time The Estimator model does not currently include a term allowing such flexibility however The model does allow the concentration-discharge relation to vary with time using the T and T 2 parameters but does not allow the slope of the Q and Q2 terms to change (β1 and β2 are constant) limiting the flexibility of the concentration-discharge relation over a given model window
After the model is fit to the raw concentration data within a calibration window each daily computed concentration is defined by the constant Q and Q2 parameters This relation is set by a specific decimal year value determining the T T 2 and seasonality parameters of the modelmdashthese parameters for any given day are constant Thus the concentration estimates for any given day are defined by the slope of the Q and Q2 parameters These slopes are the coefficients defined in the model fitting and are constant over a calibration window A ramification of this constancy is that for any given Estimator model the concentration-discharge relation for any particular date cannot change The T and T 2
terms can shift the curve through the model window but do not change the slope of the concentration-discharge relation With these defined concentrations the daily load estimates are computed using the MVUE algorithm (to account for the log-transformation bias) and summed and averaged to compute monthly and annual fluxes
Changes in the concentration-discharge relation (and time trends) can be caused by many things including changes in land use implementation of best management practices increases in sewage-effluent discharges improved sewage-treatment processes and climatic variation and change Long calibration windows have an increased chance of containing time periods with significantly different concentration-discharge relations Crossing through multiple concentration-discharge periods however will decrease the quality of the model fit therefore it is important to minimize the model calibration window length
Analyses of samples collected by the River Input Program at the Patuxent River indicated a large decrease in the concentrations of most constituents from the middle-to-late 1980rsquos to the early 1990rsquos which was probably due to the phosphorus detergent ban and sewage-treatment plant upgrades Before these changes occurred there was a strong inverse relation between concentration and discharge (as treatment-plant effluent was diluted during higher flows) This concentration-discharge relation likely changed however as urban and agricultural lands became more
important sources of nutrients in this basin Applying a single Estimator model to a period such as 1985 through 1998 will force the model to fit a constant concentration-discharge relation over a time period that has a varying relation
ldquoSteprdquo trends or rapid changes in concentration of nutrients or sediment over time can also present a problem for load estimation using the seven-parameter Estimator modelmdashparticularly when the model is calibrated over long periods Trends in concentration over time are fit using both the T and T 2 terms and offer a reasonable fit to gradual changes in concentration These two model terms are orthogonal and fit temporal variations evenly over the entire calibration period When a ldquosteprdquo change is encountered in the record this shift is actually represented by a gradual curvilinear relation with time The use of the T and T 2 terms is a considerable improvement over a simple linear trend because together they can provide a more suitable fit to the observed data and better estimates of actual loads The fitting of the T 2 term to a step trend however may cause inflation of estimates near the tails of the calibration window For the River Input monitoring stations the primary step trends are concentration and load decreases (from the mid 1980rsquos through the early 1990rsquos) that were most likely the result of the phosphorus detergent ban and incremental improvements in wastewater-treatment plants The effect of these trends on the estimated load is of primary concern Errors in load estimates are most likely to occur when a step trend occurs early in a long calibration window In this case loads are somewhat underestimated in early years and overestimated in later years
Several approaches to load estimation are possible where step trends are indicated The method chosen for this analysis shortens the calibration window in order to minimize the error in estimates at the tail of the calibration period This method is convenient because it can be standardized and can be applied without prior knowledge of changes in watershed management practices A second method attempts to identify step trends and calibrate separate models for pre- and post-step trend periods This method requires considerable knowledge of the forcing and timing of the step trends In most cases observed to date the precise timing of the response to management actions is unclear and may actually occur over a period of months to years It appears that phosphorus concentrations decreased signifi-cantly as a result of the phosphorus detergent ban for example however concentrations at some sites continued to decline for more than a year following the ban A third method develops additional variables and statistical tools using the current AMLEMVUE framework Such tools may fit step trends using separate model parameters (intercept terms) that are determined statistically rather than operationally Such tools should be investigated further as the period of water-quality record at the River Input monitoring stations expands to several decades
Multiple projects within the USGS have collected samples at the River Input monitoring stations and added
Revised Procedure for Load Estimation 7
data to the record As a result the sampling frequency throughout the period of record has varied considerably (fig 2) For the Susquehanna Patuxent and Choptank sites the sampling frequency reached a maximum in the late 1980rsquos by as much as two to three times the more recent sampling frequency thus placing inappropriate weight upon these years in the load estimates from a single Estimator model A moving calibration window gradually decreases and eventually eliminates the weight that these early measurements have on the load estimates
Two major conclusions can be drawn from this discussion The first is that load estimates near the tail of a calibration window have the greatest uncertainty As a result the end-of-model-window estimates that have traditionally been provided to the Chesapeake Bay scientific community by the program are not preferred The best load estimates for any individual yearmdashthose with minimum uncertaintymdashare those computed in the center of the regression The second major point is that the model window length needs to be minimized A 9-year window is considered optimal because the calibration data are nearly symmetrically distributed around the year for which estimated loads are needed while still providing sufficient length to encompass a reasonable number of samples and a full range of wet to dry periods
Description of Revised Methods The (revised) method consists of running multiple 9-year
calibration windows for each site and constituent An illustration of the procedure used to compute the revised loads is provided in figure 4 Each row represents a model window and the light-shaded boxes indicate the years in each calibration window from which load estimates were taken and entered into a data base For each constituent and site up to 14 models were run Load estimates were taken from the fifth (center) year of the calibration window and entered into a data base On the basis of the USGS concentration data base and the seven parameters in the model these estimates will have the least uncertainty
The first 4 years of estimates are in a tail of the calibration window and have greater uncertainty but are all the data allow Higher standard errors are usually observed during these first few years of estimates
The last 4 years of each model window are also in a tail of the calibration window have greater uncertainty and are considered preliminary and revised each year These estimates are marked by dark-shaded boxes in figure 4 When the last four years of load estimates are revised each year the greatest change can be expected for the last year of estimation from the previous year For example the load estimates from the last four years of the 1990ndash98 model
A Revised Load Estimation Procedure for the Susquehanna Potomac Patuxent and Choptank Rivers 8
windows (1995 through 1998) were compared to the loads predicted for these years in the 1991ndash99 model window For suspended sediment in the Choptank River the percent differences between the 1999 and 1998 model estimates were calculated to be -25 -16 6 and -04 percent for 1998 through 1995 respectively Likewise for dissolved nitrite plus nitrate in the Patuxent River percent differences were found to be 12 6 09 and 03 percent respectively This pattern supports the premise that the last year of load estimates in any calibration window has the greatest uncertainty
Comparison of Historical and Revised Load Estimates The annual load estimates for the four Maryland River
Input monitoring stations are provided in Appendix A The most up-to-date annual and monthly estimates can be accessed on the USGS River Input Program web site at httpwww-vausgsgovchesbayRIMP A comparison between the historical and revised load estimates is provided in Appendix B This table lists the percent differences between historical and revised annual load estimates for the four River Input monitoring sites and all available constituents
The historical and revised load estimates and error bars for a few selected constituents are shown in figure 5 These plots represent the full range of differences in estimates as well as both narrow and wide error bars As discussed earlier in this report these bars indicate the error in the regression but do not represent errors associated with sampling and laboratory analysis
In general it was found that the annual load estimates of total nitrogen at all four sites do not change considerably between methodologies As an example figure 5a shows a comparison of the revised and historical load estimates for total nitrogen (TN) at the Patuxent River near Bowie Md monitoring station The solid point and error bars represent the load value and standard error of the revised annual load estimate The error bars of the two sets of estimates usually overlap for this site and constituent despite the relatively narrow bar width For 1993 to 1995 however the revised method predicts loads with error bars that do not overlap the error bars of the historical values The load estimates for these 3 years were 10 to 12 percent different The error bars also decreased in size from 1978 to 1984 as estimates are taken progressively closer to the model centers and include
additional data points Finally the Patuxent River has shown significant reductions in concentrations of most constituents during the study period due predominantly to sewage-treatment plant upgrades The result of this point-source reduction effort can be seen in this plot as a downward trend in annual total nitrogen load estimates
Between methodologies estimates of annual loads of total kjeldahl nitrogen (TKN) typically show larger differences than estimates for TN Figure 5b shows a comparison of the load estimates and error bars for TKN in the Choptank River Differences between annual load estimates for TKN in the Choptank ranged from less than 1 to nearly 23 percent (see Appendix B) This consistency is typical at all four of the monitoring sites for this constituent The error bars for TKN tend to be wide and overlap for all but two of the years The error bars for the updated estimates become finer through the record then widen slightly during the last four years of estimates (the preliminary non-window-centered estimates)
The two methodologies estimated orthophosphorus (o-PO4) loads with the greatest differences among the 12 constituents Figure 5c shows the load estimates and error bars for o-PO4 at the Susquehanna River at Conwingo Dam monitoring station Differences between the load estimates vary from 3 to 77 percent with the greatest differences in 1994 and 1995 The error bars normally overlap but the variability may indicate limitations of this model in predicting o-PO4 loads especially o-PO4 loads discharging from the Susquehanna River at Conowingo Dam
Figure 5d shows a comparison of suspended-sediment load estimates for the Potomac River at Chain Bridge monitoring station This plot shows the large error bars that are typically computed for suspended-sediment estimates The largest estimate and bracket size was in 1985 a high discharge year Suspended-sediment concentrations vary a great deal in any river and a large number of samples are required for accurate estimates of load The current sampling program includes relatively few suspended-sediment samples from the Potomac River at Chain Bridge Considering that the Potomac River has been shown to provide the largest flux of sediment to the Chesapeake Bay (Darrell and others 1999) these large error bars are cause for concern
Revised Procedure for Load Estimation 9
A Revised Load Estimation Procedure for the Susquehanna Potomac Patuxent and Choptank Rivers 10
Summary and Conclusions
The US Geological Survey Chesapeake Bay River Input monitoring program has updated its data base for nutrient and suspended-sediment loads using an optimized methodology implementing the same seven-parameter log-linear regression model that has historically been used in the project This approach which uses a multiple-window center-estimate methodology was applied to the monitoring record of the River Input monitoring stations on the Susquehanna Potomac Patuxent and Choptank Rivers These four rivers have a wide range of watershed characteristics and include both the largest and smallest watersheds monitored in the program Concentrations of 12 nutrient and suspended-sediment constituents were included in the analysis and annual and monthly load estimates were revised
The regression model Estimator was used to compute loads in both the historical and revised methodologiesmdashthe new method merely optimizes the use of this model The historical load data base is composed of annual and monthly load estimates from eleven 10- to 14-year model windows with the first window providing load estimates over its entire calibration window length and the remaining estimates extracted from the last year of calibration of each subsequent model The revised methodology consists of multiple 9-year calibration windows For each site and constituent up to 14 models were computed Load estimates were taken from the fifth (center) year of each calibration window and entered into a data base The final four years of load estimates are preliminary and will be updated each year A new Estimator model is run annually for each site and constituent the most recent year is added and the previous four years of load estimates are revised The fifth year is considered the best estimate and kept in the data base The resulting data base is populated by load estimates that are known with more certainty than the historical load estimates
The new procedure was developed to minimize the effects that changing concentration-discharge relations in a river have on the regression Additionally the new methodology eliminates the use of end-of-regression load estimates which have been found to be overly sensitive to the fit of the time and time squared parameters and minimizes the effect of changing sampling frequencies in the monitoring record
It has been shown that the last year of estimates undergoes the most change from a previous year and this change usually decreases until made ldquofinalrdquo at the fifth year This finding is consistent with the premise that the last year of load estimates in any calibration window has the greatest uncertainty
A comparison between all of the historical and revised annual load estimates showed variable consistency The estimates for total nitrogen at all four sites are typically consistent and are within the error bars Total kjeldahl nitrogen and nitrite plus nitrate are also reasonably consistent Annual load estimates for suspended sediment
the three phosphorus species and ammonia have larger differences but these constituents also have wider error bars associated with them In general for some select years and monitoring stations the differences between load estimates are relatively large and are beyond the error bars but this is not commonmdashload estimates for these rivers do not change drastically when the new methodology is applied
This revised load computation methodology provides greater confidence in load estimates at the River Input Program monitoring stations Load estimation at these monitoring stations is an evolving process however This report documents various processes and shifting relations during the study period Load-estimation procedures will likely change in the future as the in-stream processes of these diverse rivers are more clearly understood and new statistical tools are implemented
References Cited
Bradu D and Mundlak Y 1970 Estimation of lognormal linear models Journal of the American Statistical Association 65 (329) p 198ndash211
Cohn TA 1988 Adjusted maximum likelihood estimation of the moments of lognormal populations from type I censored samples US Geological Survey Open-File Report 88ndash350 34 p
Cohn TA Delong LL Gilroy EJ Hirsch RM and Wells D 1989 Estimating constituent loads Water Resources Research v 25 no 5 p 937ndash942
Cohn TA Caulder DL Gilroy EJ Zynjuk LD and Summers RM 1992 The validity of a simple log-linear model for estimating fluvial constituent loads An empirical study involving nutrient loads entering Chesapeake Bay Water Resources Research v 28 no 9 p 2353ndash2364
Darrell LC Majedi BF Lizarraga JS and Blomquist JD 1999 Nutrient and suspended-sediment concentrations trends loads and yields from the nontidal part of the Susquehanna Potomac Patuxent and Choptank Rivers 1985ndash96 US Geological Survey Water-Resources Investigations Report 98ndash4177 38 p
Gilroy EJ Hirsch RM and Cohn TA 1990 Mean square error of regression-based constituent transport estimates Water Resources Research v 26 no 9 p 2069ndash2077
Lang DJ 1982 Water quality of the three major tributaries to the Chesapeake Bay the Susquehanna Potomac and James Rivers January 1979ndashApril 1981 US Geological Survey Water-Resources Investigations Report 82ndash32 64 p
Robertson DM and Roerish ED 1999 Influence of various water quality sampling strategies on load estimates for small streams Water Resources Research v 35 no 12 December p 3747ndash3759
Summary and Conclusions 11
APPENDIXES A AND B FOLLOW
A Revised Load Estimation Procedure for the Susquehanna Potomac Patuxent and Choptank Rivers 12
Appendix A Annual load estimates for the River Input monitoring stations on the Susquehanna Potomac Patuxent and Choptank Rivers
[kgyr kilograms per year +- plusminus the standard errors of prediction are also provided The standard error of prediction is a measure of the expected difference between an individual estimate and the estimated daily load Bold numbers indicate preliminary load estimates that will be revised For the most up-to-date annual and monthly load estimates see the USGS River Input Monitoring Program web site at httpwww-vausgsgovchesbayRIMP]
Parameter Constituent Reported as
P00600 Total nitrogen N
P00608 Dissolved ammonia N
P00613 Dissolved nitrite N
P00623 Dissolved kjeldahl nitrogen N
P00625 Total kjeldahl nitrogen N
P00631 Dissolved nitrite + nitrate N
P00665 Total phosphorus P
P00666 Dissolved phosphorus P
P00671 Orthophosphorus P
P00680 Total organic carbon C
P00955 Dissolved silica Si and SiO2
P80154 Suspended sediment not applicable
Appendix A 13
Appendix A Annual load estimates for the River Input monitoring stations on the Susquehanna Potomac Patuxent and Choptank RiversndashContinued
Standard Error of Prediction
Annual load +- +- ModelStation no Parameter Year (kgyr) (kgyr) Percent window
Susquehanna River at Conowingo Dam (01578310)
01578310 P00600 1979 76200000 3210000 4 79 - 87
01578310 P00600 1980 43400000 1560000 4 79 - 87
01578310 P00600 1981 50400000 1880000 4 79 - 87
01578310 P00600 1982 60200000 2480000 4 79 - 87
01578310 P00600 1983 77300000 3400000 4 79 - 87
01578310 P00600 1984 94500000 4070000 4 80 - 88
01578310 P00600 1985 58300000 2190000 4 81 - 89
01578310 P00600 1986 75700000 2360000 3 82 - 90
01578310 P00600 1987 57200000 1580000 3 83 - 91
01578310 P00600 1988 46700000 1360000 3 84 - 92
01578310 P00600 1989 64000000 1830000 3 85 - 93
01578310 P00600 1990 78300000 2210000 3 86 - 94
01578310 P00600 1991 48200000 1540000 3 87 - 95
01578310 P00600 1992 54100000 1470000 3 88 - 96
01578310 P00600 1993 82700000 2330000 3 89 - 97
01578310 P00600 1994 76100000 2060000 3 90 - 98
01578310 P00600 1995 41300000 1460000 4 91 - 99
01578310 P00600 1996 94500000 2810000 3 91 - 99
01578310 P00600 1997 43400000 1430000 3 91 - 99
01578310 P00600 1998 61300000 2160000 4 91 - 99
01578310 P00600 1999 40200000 1910000 5 91 - 99
01578310 P00608 1979 3320000 470000 14 79 - 87
01578310 P00608 1980 2450000 276000 11 79 - 87
01578310 P00608 1981 3160000 345000 11 79 - 87
01578310 P00608 1982 4150000 503000 12 79 - 87
01578310 P00608 1983 5490000 719000 13 79 - 87
01578310 P00608 1984 5980000 739000 12 80 - 88
01578310 P00608 1985 3210000 315000 10 81 - 89
01578310 P00608 1986 3970000 346000 9 82 - 90
01578310 P00608 1987 3010000 237000 8 83 - 91
01578310 P00608 1988 2470000 190000 8 84 - 92
01578310 P00608 1989 3360000 256000 8 85 - 93
01578310 P00608 1990 3570000 243000 7 86 - 94
01578310 P00608 1991 2520000 201000 8 87 - 95
01578310 P00608 1992 2540000 197000 8 88 - 96
01578310 P00608 1993 4420000 362000 8 89 - 97
A Revised Load Estimation Procedure for the Susquehanna Potomac Patuxent and Choptank Rivers 14
Appendix A Annual load estimates for the River Input monitoring stations on the Susquehanna Potomac Patuxent and Choptank RiversndashContinued
Standard Error of Prediction
Annual load +- +- ModelStation no Parameter Year (kgyr) (kgyr) Percent window
Susquehanna River at Conowingo Dam (01578310)mdashContinued
01578310 P00608 1994 3610000 283000 8 90 - 98
01578310 P00608 1995 1660000 151000 9 91 - 99
01578310 P00608 1996 3820000 325000 9 91 - 99
01578310 P00608 1997 1710000 148000 9 91 - 99
01578310 P00608 1998 2570000 247000 10 91 - 99
01578310 P00608 1999 1590000 202000 13 91 - 99
01578310 P00613 1985 661000 74900 11 85 - 93
01578310 P00613 1986 781000 62100 8 85 - 93
01578310 P00613 1987 677000 44700 7 85 - 93
01578310 P00613 1988 592000 41400 7 85 - 93
01578310 P00613 1989 774000 58500 8 85 - 93
01578310 P00613 1990 806000 58800 7 86 - 94
01578310 P00613 1991 554000 47900 9 87 - 95
01578310 P00613 1992 668000 60400 9 88 - 96
01578310 P00613 1993 694000 62000 9 89 - 97
01578310 P00613 1994 649000 65800 10 90 - 98
01578310 P00613 1995 407000 49100 12 91 - 99
01578310 P00613 1996 604000 64300 11 91 - 99
01578310 P00613 1997 414000 45800 11 91 - 99
01578310 P00613 1998 517000 64700 13 91 - 99
01578310 P00613 1999 479000 85200 18 91 - 99
01578310 P00623 1985 14700000 1200000 8 85 - 93
01578310 P00623 1986 19300000 1170000 6 85 - 93
01578310 P00623 1987 13800000 662000 5 85 - 93
01578310 P00623 1988 10800000 529000 5 85 - 93
01578310 P00623 1989 14200000 738000 5 85 - 93
01578310 P00623 1990 14500000 722000 5 86 - 94
01578310 P00623 1991 8000000 470000 6 87 - 95
01578310 P00623 1992 8050000 407000 5 88 - 96
01578310 P00623 1993 11900000 682000 6 89 - 97
01578310 P00623 1994 9770000 552000 6 90 - 98
01578310 P00623 1995 4730000 319000 7 91 - 99
01578310 P00623 1996 12100000 740000 6 91 - 99
01578310 P00623 1997 5010000 310000 6 91 - 99
01578310 P00623 1998 7740000 530000 7 91 - 99
01578310 P00623 1999 5350000 491000 9 91 - 99
Appendix A 15
Appendix A Annual load estimates for the River Input monitoring stations on the Susquehanna Potomac Patuxent and Choptank RiversndashContinued
Standard Error of Prediction
Annual load +- +- ModelStation no Parameter Year (kgyr) (kgyr) Percent window
Susquehanna River at Conowingo Dam (01578310)mdashContinued
01578310 P00625 1979 23100000 1870000 8 79 - 87
01578310 P00625 1980 14000000 984000 7 79 - 87
01578310 P00625 1981 17100000 1230000 7 79 - 87
01578310 P00625 1982 21200000 1680000 8 79 - 87
01578310 P00625 1983 28900000 2470000 9 79 - 87
01578310 P00625 1984 41100000 3280000 8 80 - 88
01578310 P00625 1985 21400000 1350000 6 81 - 89
01578310 P00625 1986 26200000 1450000 6 82 - 90
01578310 P00625 1987 18300000 912000 5 83 - 91
01578310 P00625 1988 14200000 709000 5 84 - 92
01578310 P00625 1989 19700000 1050000 5 85 - 93
01578310 P00625 1990 20100000 1020000 5 86 - 94
01578310 P00625 1991 10700000 610000 6 87 - 95
01578310 P00625 1992 11600000 540000 5 88 - 96
01578310 P00625 1993 19900000 1100000 6 89 - 97
01578310 P00625 1994 16300000 831000 5 90 - 98
01578310 P00625 1995 7230000 439000 6 91 - 99
01578310 P00625 1996 21700000 1290000 6 91 - 99
01578310 P00625 1997 8030000 453000 6 91 - 99
01578310 P00625 1998 13800000 902000 7 91 - 99
01578310 P00625 1999 9370000 814000 9 91 - 99
01578310 P00631 1979 54500000 2580000 5 79 - 87
01578310 P00631 1980 30200000 1230000 4 79 - 87
01578310 P00631 1981 34400000 1420000 4 79 - 87
01578310 P00631 1982 40200000 1830000 5 79 - 87
01578310 P00631 1983 49500000 2390000 5 79 - 87
01578310 P00631 1984 53700000 2510000 5 80 - 88
01578310 P00631 1985 35900000 1570000 4 81 - 89
01578310 P00631 1986 48600000 1840000 4 82 - 90
01578310 P00631 1987 38400000 1280000 3 83 - 91
01578310 P00631 1988 32600000 1140000 3 84 - 92
01578310 P00631 1989 44600000 1470000 3 85 - 93
01578310 P00631 1990 58900000 1830000 3 86 - 94
01578310 P00631 1991 38300000 1310000 3 87 - 95
01578310 P00631 1992 42300000 1240000 3 88 - 96
01578310 P00631 1993 61600000 1790000 3 89 - 97
01578310 P00631 1994 59100000 1640000 3 90 - 98
A Revised Load Estimation Procedure for the Susquehanna Potomac Patuxent and Choptank Rivers 16
Appendix A Annual load estimates for the River Input monitoring stations on the Susquehanna Potomac Patuxent and Choptank RiversndashContinued
Standard Error of Prediction
Annual load +- +- ModelStation no Parameter Year (kgyr) (kgyr) Percent window
Susquehanna River at Conowingo Dam (01578310)mdashContinued
01578310 P00631 1995 35400000 1340000 4 91 - 99
01578310 P00631 1996 74000000 2350000 3 91 - 99
01578310 P00631 1997 35800000 1280000 4 91 - 99
01578310 P00631 1998 46400000 1810000 4 91 - 99
01578310 P00631 1999 29500000 1560000 5 91 - 99
01578310 P00665 1979 4480000 551000 12 79 - 87
01578310 P00665 1980 1960000 195000 10 79 - 87
01578310 P00665 1981 2050000 230000 11 79 - 87
01578310 P00665 1982 2150000 220000 10 79 - 87
01578310 P00665 1983 2980000 353000 12 79 - 87
01578310 P00665 1984 3490000 424000 12 80 - 88
01578310 P00665 1985 1440000 127000 9 81 - 89
01578310 P00665 1986 2110000 178000 8 82 - 90
01578310 P00665 1987 1460000 104000 7 83 - 91
01578310 P00665 1988 1170000 86500 7 84 - 92
01578310 P00665 1989 1920000 155000 8 85 - 93
01578310 P00665 1990 2210000 172000 8 86 - 94
01578310 P00665 1991 1140000 95700 8 87 - 95
01578310 P00665 1992 1130000 83900 7 88 - 96
01578310 P00665 1993 3330000 380000 11 89 - 97
01578310 P00665 1994 2470000 256000 10 90 - 98
01578310 P00665 1995 840000 86300 10 91 - 99
01578310 P00665 1996 4160000 555000 13 91 - 99
01578310 P00665 1997 870000 78700 9 91 - 99
01578310 P00665 1998 1920000 231000 12 91 - 99
01578310 P00665 1999 1060000 152000 14 91 - 99
01578310 P00666 1979 1200000 135000 11 79 - 87
01578310 P00666 1980 524000 50600 10 79 - 87
01578310 P00666 1981 558000 56700 10 79 - 87
01578310 P00666 1982 571000 62500 11 79 - 87
01578310 P00666 1983 680000 80200 12 79 - 87
01578310 P00666 1984 764000 87200 11 80 - 88
01578310 P00666 1985 495000 52900 11 81 - 89
01578310 P00666 1986 660000 65800 10 82 - 90
01578310 P00666 1987 471000 42600 9 83 - 91
01578310 P00666 1988 345000 31700 9 84 - 92
Appendix A 17
Appendix A Annual load estimates for the River Input monitoring stations on the Susquehanna Potomac Patuxent and Choptank RiversndashContinued
Standard Error of Prediction
Annual load +- +- ModelStation no Parameter Year (kgyr) (kgyr) Percent window
Susquehanna River at Conowingo Dam (01578310)mdashContinued
01578310 P00666 1989 489000 42600 9 85 - 93
01578310 P00666 1990 697000 61900 9 86 - 94
01578310 P00666 1991 323000 30000 9 87 - 95
01578310 P00666 1992 425000 34400 8 88 - 96
01578310 P00666 1993 698000 57200 8 89 - 97
01578310 P00666 1994 675000 58700 9 90 - 98
01578310 P00666 1995 350000 34300 10 91 - 99
01578310 P00666 1996 994000 87700 9 91 - 99
01578310 P00666 1997 370000 33800 9 91 - 99
01578310 P00666 1998 552000 57200 10 91 - 99
01578310 P00666 1999 350000 48200 14 91 - 99
01578310 P00671 1979 1070000 166000 16 79 - 87
01578310 P00671 1980 478000 65100 14 79 - 87
01578310 P00671 1981 524000 73200 14 79 - 87
01578310 P00671 1982 544000 81500 15 79 - 87
01578310 P00671 1983 617000 96900 16 79 - 87
01578310 P00671 1984 646000 103000 16 80 - 88
01578310 P00671 1985 348000 51300 15 81 - 89
01578310 P00671 1986 432000 56700 13 82 - 90
01578310 P00671 1987 337000 42900 13 83 - 91
01578310 P00671 1988 222000 29600 13 84 - 92
01578310 P00671 1989 291000 37000 13 85 - 93
01578310 P00671 1990 425000 55500 13 86 - 94
01578310 P00671 1991 202000 30800 15 87 - 95
01578310 P00671 1992 260000 34300 13 88 - 96
01578310 P00671 1993 424000 55500 13 89 - 97
01578310 P00671 1994 404000 55300 14 90 - 98
01578310 P00671 1995 255000 43800 17 91 - 99
01578310 P00671 1996 669000 103000 15 91 - 99
01578310 P00671 1997 259000 42000 16 91 - 99
01578310 P00671 1998 365000 65800 18 91 - 99
01578310 P00671 1999 180000 41200 23 91 - 99
01578310 P00680 1985 92400000 4900000 5 85 - 93
01578310 P00680 1986 135000000 5830000 4 85 - 93
01578310 P00680 1987 93900000 3170000 3 85 - 93
01578310 P00680 1988 75900000 2630000 3 85 - 93
A Revised Load Estimation Procedure for the Susquehanna Potomac Patuxent and Choptank Rivers 18
Appendix A Annual load estimates for the River Input monitoring stations on the Susquehanna Potomac Patuxent and Choptank RiversndashContinued
Standard Error of Prediction
Annual load +- +- ModelStation no Parameter Year (kgyr) (kgyr) Percent window
Susquehanna River at Conowingo Dam (01578310)mdashContinued
01578310 P00680 1989 134000000 5180000 4 85 - 93
01578310 P00680 1990 149000000 5320000 4 86 - 94
01578310 P00680 1991 80400000 2660000 3 87 - 95
01578310 P00680 1992 102000000 2970000 3 88 - 96
01578310 P00680 1993 218000000 8000000 4 89 - 97
01578310 P00680 1994 198000000 6730000 3 90 - 98
01578310 P00680 1995 83600000 3260000 4 91 - 99
01578310 P00680 1996 267000000 10600000 4 91 - 99
01578310 P00680 1997 85300000 3110000 4 91 - 99
01578310 P00680 1998 140000000 5980000 4 91 - 99
01578310 P00680 1999 76300000 4300000 6 91 - 99
Appendix A 19
Appendix A Annual load estimates for the River Input monitoring stations on the Susquehanna Potomac Patuxent and Choptank RiversndashContinued
Standard Error of Prediction
Annual load Annual load +- +- Model Station no Parameter Year (kgyr SiO2) (kgyr Si) (kgyr SiO2) Percent window
Susquehanna River at Conowingo Dam (01578310)ndashContinued
01578310 P00955 1979 194000000 90700000 16800000 9 79 - 87
01578310 P00955 1980 87600000 41000000 6580000 8 79 - 87
01578310 P00955 1981 89400000 41800000 6830000 8 79 - 87
01578310 P00955 1982 100000000 47000000 7910000 8 79 - 87
01578310 P00955 1983 130000000 60900000 11000000 8 79 - 87
01578310 P00955 1984 175000000 81700000 15300000 9 80 - 88
01578310 P00955 1985 107000000 50200000 8200000 8 81 - 89
01578310 P00955 1986 160000000 74900000 11600000 7 82 - 90
01578310 P00955 1987 112000000 52300000 6750000 6 83 - 91
01578310 P00955 1988 93700000 43800000 5860000 6 84 - 92
01578310 P00955 1989 139000000 64900000 8290000 6 85 - 93
01578310 P00955 1990 189000000 88200000 11600000 6 86 - 94
01578310 P00955 1991 101000000 47200000 7380000 7 87 - 95
01578310 P00955 1992 116000000 54100000 7280000 6 88 - 96
01578310 P00955 1993 204000000 95500000 15200000 7 89 - 97
01578310 P00955 1994 186000000 87100000 12900000 7 90 - 98
01578310 P00955 1995 94500000 44200000 8110000 9 91 - 99
01578310 P00955 1996 259000000 121000000 20400000 8 91 - 99
01578310 P00955 1997 91600000 42800000 7470000 8 91 - 99
01578310 P00955 1998 135000000 63300000 12600000 9 91 - 99
01578310 P00955 1999 72600000 33900000 8920000 12 91 - 99
A Revised Load Estimation Procedure for the Susquehanna Potomac Patuxent and Choptank Rivers 20
Appendix A Annual load estimates for the River Input monitoring stations on the Susquehanna Potomac Patuxent and Choptank RiversndashContinued
Standard Error of Prediction
Annual load +- +- ModelStation no Parameter Year (kgyr) (kgyr) Percent window
Susquehanna River at Conowingo Dam (01578310)ndashContinued
01578310 P80154 1979 2700000000 458000000 17 79 - 87
01578310 P80154 1980 878000000 95500000 11 79 - 87
01578310 P80154 1981 942000000 140000000 15 79 - 87
01578310 P80154 1982 938000000 107000000 11 79 - 87
01578310 P80154 1983 1730000000 236000000 14 79 - 87
01578310 P80154 1984 2850000000 467000000 16 80 - 88
01578310 P80154 1985 516000000 40700000 8 81 - 89
01578310 P80154 1986 1110000000 122000000 11 82 - 90
01578310 P80154 1987 535000000 43400000 8 83 - 91
01578310 P80154 1988 397000000 30100000 8 84 - 92
01578310 P80154 1989 942000000 67700000 7 85 - 93
01578310 P80154 1990 861000000 49800000 6 86 - 94
01578310 P80154 1991 419000000 27400000 7 87 - 95
01578310 P80154 1992 422000000 25300000 6 88 - 96
01578310 P80154 1993 3080000000 340000000 11 89 - 97
01578310 P80154 1994 1970000000 192000000 10 90 - 98
01578310 P80154 1995 397000000 34600000 9 91 - 99
01578310 P80154 1996 3680000000 584000000 16 91 - 99
01578310 P80154 1997 364000000 26400000 7 91 - 99
01578310 P80154 1998 1110000000 123000000 11 91 - 99
01578310 P80154 1999 349000000 44600000 13 91 - 99
Appendix A 21
Appendix A Annual load estimates for the River Input monitoring stations on the Susquehanna Potomac Patuxent and Choptank RiversndashContinued
Standard Error of Prediction
Annual load +- +- Model Station no Parameter Year (kgyr) (kgyr) Percent window
Potomac River at Chain Bridge (01646580)
01646580 P00600 1979 41100000 2220000 5 79 - 87
01646580 P00600 1980 20200000 812000 4 79 - 87
01646580 P00600 1981 10600000 386000 4 79 - 87
01646580 P00600 1982 22200000 842000 4 79 - 87
01646580 P00600 1983 34200000 1340000 4 79 - 87
01646580 P00600 1984 40300000 1780000 4 80 - 88
01646580 P00600 1985 27700000 1500000 5 81 - 89
01646580 P00600 1986 16400000 622000 4 82 - 90
01646580 P00600 1987 23200000 792000 3 83 - 91
01646580 P00600 1988 17200000 657000 4 84 - 92
01646580 P00600 1989 23500000 711000 3 85 - 93
01646580 P00600 1990 19400000 475000 2 86 - 94
01646580 P00600 1991 16600000 503000 3 87 - 95
01646580 P00600 1992 17700000 496000 3 88 - 96
01646580 P00600 1993 36700000 1200000 3 89 - 97
01646580 P00600 1994 33900000 992000 3 90 - 98
01646580 P00600 1995 17800000 443000 2 91 - 99
01646580 P00600 1996 60900000 1580000 3 91 - 99
01646580 P00600 1997 18700000 469000 3 91 - 99
01646580 P00600 1998 34700000 993000 3 91 - 99
01646580 P00600 1999 9770000 284000 3 91 - 99
01646580 P00608 1979 1480000 352000 24 79 - 87
01646580 P00608 1980 686000 104000 15 79 - 87
01646580 P00608 1981 353000 46800 13 79 - 87
01646580 P00608 1982 728000 104000 14 79 - 87
01646580 P00608 1983 1080000 165000 15 79 - 87
01646580 P00608 1984 1320000 240000 20 80 - 88
01646580 P00608 1985 863000 322000 37 81 - 89
01646580 P00608 1986 375000 79700 21 82 - 90
01646580 P00608 1987 586000 125000 21 83 - 91
01646580 P00608 1988 473000 115000 24 84 - 92
01646580 P00608 1989 484000 73100 15 85 - 93
01646580 P00608 1990 323000 51400 16 86 - 94
01646580 P00608 1991 288000 54000 19 87 - 95
01646580 P00608 1992 290000 44300 15 88 - 96
01646580 P00608 1993 829000 156000 19 89 - 97
A Revised Load Estimation Procedure for the Susquehanna Potomac Patuxent and Choptank Rivers 22
Appendix A Annual load estimates for the River Input monitoring stations on the Susquehanna Potomac Patuxent and Choptank RiversndashContinued
Standard Error of Prediction
Annual load +- +- Model Station no Parameter Year (kgyr) (kgyr) Percent window
Potomac River at Chain Bridge (01646580)mdashContinued
01646580 P00608 1994 736000 114000 16 90 - 98
01646580 P00608 1995 261000 28900 11 91 - 99
01646580 P00608 1996 1470000 263000 18 91 - 99
01646580 P00608 1997 359000 43300 12 91 - 99
01646580 P00608 1998 1040000 138000 13 91 - 99
01646580 P00608 1999 247000 29800 12 91 - 99
01646580 P00613 1985 135000 24400 18 85 - 93
01646580 P00613 1986 110000 15300 14 85 - 93
01646580 P00613 1987 157000 18600 12 85 - 93
01646580 P00613 1988 120000 15100 13 85 - 93
01646580 P00613 1989 154000 18500 12 85 - 93
01646580 P00613 1990 119000 12700 11 86 - 94
01646580 P00613 1991 123000 15600 13 87 - 95
01646580 P00613 1992 111000 9640 9 88 - 96
01646580 P00613 1993 263000 28600 11 89 - 97
01646580 P00613 1994 245000 23600 10 90 - 98
01646580 P00613 1995 134000 11800 9 91 - 99
01646580 P00613 1996 467000 41100 9 91 - 99
01646580 P00613 1997 147000 12600 9 91 - 99
01646580 P00613 1998 278000 270000 10 91 - 99
01646580 P00613 1999 82100 9260 11 91 - 99
01646580 P00623 1983 7490000 575000 8 83 - 91
01646580 P00623 1984 8180000 549000 7 83 - 91
01646580 P00623 1985 5150000 431000 8 83 - 91
01646580 P00623 1986 3090000 190000 6 83 - 91
01646580 P00623 1987 4230000 271000 6 83 - 91
01646580 P00623 1988 3030000 223000 7 84 - 92
01646580 P00623 1989 3590000 233000 6 85 - 93
01646580 P00623 1990 2550000 149000 6 86 - 94
01646580 P00623 1991 1860000 151000 8 87 - 95
01646580 P00623 1992 2020000 129000 6 88 - 96
01646580 P00623 1993 4210000 327000 8 89 - 97
01646580 P00623 1994 3890000 246000 6 90 - 98
01646580 P00623 1995 2020000 97500 5 91 - 99
01646580 P00623 1996 9140000 628000 7 91 - 99
01646580 P00623 1997 2480000 129000 5 91 - 99
Appendix A 23
Appendix A Annual load estimates for the River Input monitoring stations on the Susquehanna Potomac Patuxent and Choptank RiversndashContinued
Standard Error of Prediction
Annual load +- +- Model Station no Parameter Year (kgyr) (kgyr) Percent window
Potomac River at Chain Bridge (01646580)mdashContinued
01646580 P00623 1998 5580000 318000 6 91 - 99
01646580 P00623 1999 1900000 103000 5 91 - 99
01646580 P00625 1979 15000000 1420000 9 79 - 87
01646580 P00625 1980 7170000 485000 7 79 - 87
01646580 P00625 1981 3850000 229000 6 79 - 87
01646580 P00625 1982 8810000 611000 7 79 - 87
01646580 P00625 1983 14900000 1060000 7 79 - 87
01646580 P00625 1984 19800000 1780000 9 80 - 88
01646580 P00625 1985 13500000 2170000 16 81 - 89
01646580 P00625 1986 5780000 531000 9 82 - 90
01646580 P00625 1987 8870000 839000 9 83 - 91
01646580 P00625 1988 6710000 697000 10 84 - 92
01646580 P00625 1989 7130000 513000 7 85 - 93
01646580 P00625 1990 4000000 239000 6 86 - 94
01646580 P00625 1991 3300000 254000 8 87 - 95
01646580 P00625 1992 3700000 270000 7 88 - 96
01646580 P00625 1993 9720000 862000 9 89 - 97
01646580 P00625 1994 8160000 623000 8 90 - 98
01646580 P00625 1995 3680000 217000 6 91 - 99
01646580 P00625 1996 21700000 2120000 10 91 - 99
01646580 P00625 1997 4510000 304000 7 91 - 99
01646580 P00625 1998 11600000 789000 7 91 - 99
01646580 P00625 1999 2870000 180000 6 91 - 99
01646580 P00631 1979 27400000 2660000 10 79 - 87
01646580 P00631 1980 13800000 1040000 8 79 - 87
01646580 P00631 1981 7110000 479000 7 79 - 87
01646580 P00631 1982 14000000 950000 7 79 - 87
01646580 P00631 1983 20100000 1360000 7 79 - 87
01646580 P00631 1984 21200000 1460000 7 80 - 88
01646580 P00631 1985 16600000 1230000 7 81 - 89
01646580 P00631 1986 10600000 682000 6 82 - 90
01646580 P00631 1987 13900000 741000 5 83 - 91
01646580 P00631 1988 10300000 600000 6 84 - 92
01646580 P00631 1989 16700000 810000 5 85 - 93
01646580 P00631 1990 17300000 781000 5 86 - 94
01646580 P00631 1991 13500000 603000 4 87 - 95
A Revised Load Estimation Procedure for the Susquehanna Potomac Patuxent and Choptank Rivers 24
Appendix A Annual load estimates for the River Input monitoring stations on the Susquehanna Potomac Patuxent and Choptank RiversndashContinued
Standard Error of Prediction
Annual load +- +- Model Station no Parameter Year (kgyr) (kgyr) Percent window
Potomac River at Chain Bridge (01646580)mdashContinued
01646580 P00631 1992 14400000 541000 4 88 - 96
01646580 P00631 1993 26400000 996000 4 89 - 97
01646580 P00631 1994 24800000 836000 3 90 - 98
01646580 P00631 1995 15000000 490000 3 91 - 99
01646580 P00631 1996 41500000 1220000 3 91 - 99
01646580 P00631 1997 14300000 458000 3 91 - 99
01646580 P00631 1998 21600000 790000 4 91 - 99
01646580 P00631 1999 6730000 262000 4 91 - 99
01646580 P00665 1979 4010000 499000 12 79 - 87
01646580 P00665 1980 1410000 124000 9 79 - 87
01646580 P00665 1981 680000 53900 8 79 - 87
01646580 P00665 1982 1740000 167000 10 79 - 87
01646580 P00665 1983 3020000 286000 9 79 - 87
01646580 P00665 1984 3780000 456000 12 80 - 88
01646580 P00665 1985 3690000 1010000 27 81 - 89
01646580 P00665 1986 877000 111000 13 82 - 90
01646580 P00665 1987 1560000 213000 14 83 - 91
01646580 P00665 1988 1350000 228000 17 84 - 92
01646580 P00665 1989 1480000 154000 10 85 - 93
01646580 P00665 1990 954000 110000 11 86 - 94
01646580 P00665 1991 654000 82600 13 87 - 95
01646580 P00665 1992 800000 97400 12 88 - 96
01646580 P00665 1993 2390000 343000 14 89 - 97
01646580 P00665 1994 1800000 215000 12 90 - 98
01646580 P00665 1995 680000 67800 10 91 - 99
01646580 P00665 1996 7110000 1490000 21 91 - 99
01646580 P00665 1997 954000 140000 15 91 - 99
01646580 P00665 1998 3020000 328000 11 91 - 99
01646580 P00665 1999 659000 62400 9 91 - 99
01646580 P00666 1979 976000 116000 12 79 - 87
01646580 P00666 1980 424000 36400 9 79 - 87
01646580 P00666 1981 263000 20100 8 79 - 87
01646580 P00666 1982 547000 45100 8 79 - 87
01646580 P00666 1983 878000 79300 9 79 - 87
01646580 P00666 1984 955000 91900 10 80 - 88
01646580 P00666 1985 808000 139000 17 81 - 89
Appendix A 25
Appendix A Annual load estimates for the River Input monitoring stations on the Susquehanna Potomac Patuxent and Choptank RiversndashContinued
Standard Error of Prediction
Annual load +- +- Model Station no Parameter Year (kgyr) (kgyr) Percent window
Potomac River at Chain Bridge (01646580)mdashContinued
01646580 P00666 1986 342000 35400 10 82 - 90
01646580 P00666 1987 482000 50300 10 83 - 91
01646580 P00666 1988 363000 52000 14 84 - 92
01646580 P00666 1989 555000 55800 10 85 - 93
01646580 P00666 1990 541000 68100 13 86 - 94
01646580 P00666 1991 298000 41900 14 87 - 95
01646580 P00666 1992 371000 42700 12 88 - 96
01646580 P00666 1993 645000 88200 14 89 - 97
01646580 P00666 1994 530000 58600 11 90 - 98
01646580 P00666 1995 251000 23600 9 91 - 99
01646580 P00666 1996 1510000 223000 15 91 - 99
01646580 P00666 1997 353000 43000 12 91 - 99
01646580 P00666 1998 917000 95600 10 91 - 99
01646580 P00666 1999 397000 40000 10 91 - 99
01646580 P00671 1979 659000 106000 16 79 - 87
01646580 P00671 1980 291000 36100 12 79 - 87
01646580 P00671 1981 183000 19700 11 79 - 87
01646580 P00671 1982 382000 40400 11 79 - 87
01646580 P00671 1983 613000 66200 11 79 - 87
01646580 P00671 1984 633000 68300 11 80 - 88
01646580 P00671 1985 542000 99500 18 81 - 89
01646580 P00671 1986 218000 26200 12 82 - 90
01646580 P00671 1987 311000 34100 11 83 - 91
01646580 P00671 1988 238000 36300 15 84 - 92
01646580 P00671 1989 445000 47800 11 85 - 93
01646580 P00671 1990 587000 108000 18 86 - 94
01646580 P00671 1991 254000 41600 16 87 - 95
01646580 P00671 1992 308000 37200 12 88 - 96
01646580 P00671 1993 543000 76300 14 89 - 97
01646580 P00671 1994 455000 54500 12 90 - 98
01646580 P00671 1995 187000 18900 10 91 - 99
01646580 P00671 1996 1160000 196000 17 91 - 99
01646580 P00671 1997 244000 32000 13 91 - 99
01646580 P00671 1998 643000 72100 11 91 - 99
01646580 P00671 1999 242000 25700 11 91 - 99
A Revised Load Estimation Procedure for the Susquehanna Potomac Patuxent and Choptank Rivers 26
Appendix A Annual load estimates for the River Input monitoring stations on the Susquehanna Potomac Patuxent and Choptank RiversndashContinued
Standard Error of Prediction
Annual load +- +- Model Station no Parameter Year (kgyr) (kgyr) Percent window
Potomac River at Chain Bridge (01646580)mdashContinued
01646580 P00680 1988 38300000 3820000 10 88 - 96
01646580 P00680 1989 55100000 3470000 6 88 - 96
01646580 P00680 1990 48400000 2760000 6 88 - 96
01646580 P00680 1991 44300000 2920000 7 88 - 96
01646580 P00680 1992 44900000 2540000 6 88 - 96
01646580 P00680 1993 104000000 7250000 7 89 - 97
01646580 P00680 1994 81300000 4330000 5 90 - 98
01646580 P00680 1995 32300000 1370000 4 91 - 99
01646580 P00680 1996 166000000 11500000 7 91 - 99
01646580 P00680 1997 34600000 1710000 5 91 - 99
01646580 P00680 1998 78400000 3950000 5 91 - 99
01646580 P00680 1999 21500000 1030000 5 91 - 99
Appendix A 27
Appendix A Annual load estimates for the River Input monitoring stations on the Susquehanna Potomac Patuxent and Choptank RiversndashContinued
Standard Error of Prediction
Annual load Annual load +- +- Model Station no Parameter Year (kgyr SiO2) (kgyr Si) (kgyr SiO2) Percent window
Potomac River at Chain Bridge (01646580)mdashContinued
01646580 P00955 1979 155000000 72300000 30000000 19 79 - 87
01646580 P00955 1980 57000000 26700000 8700000 15 79 - 87
01646580 P00955 1981 29100000 13600000 4070000 14 79 - 87
01646580 P00955 1982 65000000 30400000 11100000 17 79 - 87
01646580 P00955 1983 107000000 49900000 18100000 17 79 - 87
01646580 P00955 1984 140000000 65300000 29400000 21 80 - 88
01646580 P00955 1985 140000000 65200000 62900000 45 81 - 89
01646580 P00955 1986 39700000 18600000 8330000 21 82 - 90
01646580 P00955 1987 68500000 32000000 13500000 20 83 - 91
01646580 P00955 1988 67800000 31700000 18800000 28 84 - 92
01646580 P00955 1989 95700000 44700000 15400000 16 85 - 93
01646580 P00955 1990 79200000 37000000 15000000 19 86 - 94
01646580 P00955 1991 49500000 23200000 8340000 17 87 - 95
01646580 P00955 1992 56900000 26600000 6730000 12 88 - 96
01646580 P00955 1993 104000000 48700000 15600000 15 89 - 97
01646580 P00955 1994 95700000 44700000 12800000 13 90 - 98
01646580 P00955 1995 46500000 21700000 5760000 12 91 - 99
01646580 P00955 1996 265000000 124000000 54600000 21 91 - 99
01646580 P00955 1997 50200000 23500000 7080000 14 91 - 99
01646580 P00955 1998 127000000 59500000 19400000 15 91 - 99
01646580 P00955 1999 29600000 13800000 4200000 14 91 - 99
A Revised Load Estimation Procedure for the Susquehanna Potomac Patuxent and Choptank Rivers 28
Appendix A Annual load estimates for the River Input monitoring stations on the Susquehanna Potomac Patuxent and Choptank RiversndashContinued
Standard Error of Prediction
Annual load +- +- Model Station no Parameter Year (kgyr) (kgyr) Percent window
Potomac River at Chain Bridge (01646580)mdashContinued
01646580 P80154 1979 4130000000 833000000 20 79 - 87
01646580 P80154 1980 1090000000 148000000 14 79 - 87
01646580 P80154 1981 369000000 56900000 15 79 - 87
01646580 P80154 1982 1480000000 322000000 22 79 - 87
01646580 P80154 1983 2980000000 564000000 19 79 - 87
01646580 P80154 1984 7450000000 3110000000 42 80 - 88
01646580 P80154 1985 7530000000 5480000000 73 81 - 89
01646580 P80154 1986 684000000 229000000 34 82 - 90
01646580 P80154 1987 2100000000 737000000 35 83 - 91
01646580 P80154 1988 3050000000 1080000000 35 84 - 92
01646580 P80154 1989 1880000000 435000000 23 85 - 93
01646580 P80154 1990 876000000 228000000 26 86 - 94
01646580 P80154 1991 534000000 115000000 22 87 - 95
01646580 P80154 1992 378000000 65800000 17 88 - 96
01646580 P80154 1993 2080000000 382000000 18 89 - 97
01646580 P80154 1994 1300000000 224000000 17 90 - 98
01646580 P80154 1995 284000000 43600000 15 91 - 99
01646580 P80154 1996 5420000000 1650000000 30 91 - 99
01646580 P80154 1997 312000000 59300000 19 91 - 99
01646580 P80154 1998 1240000000 219000000 18 91 - 99
01646580 P80154 1999 73500000 12400000 17 91 - 99
Appendix A 29
Appendix A Annual load estimates for the River Input monitoring stations on the Susquehanna Potomac Patuxent and Choptank RiversndashContinued
Standard Error of Prediction
Annual load +- +- ModelStation no Parameter Year (kgyr) (kgyr) Percent window
Patuxent River near Bowie (01594440)
01594440 P00600 1978 989000 69800 7 78 - 86
01594440 P00600 1979 1560000 102000 7 78 - 86
01594440 P00600 1980 952000 38300 4 78 - 86
01594440 P00600 1981 615000 27500 4 78 - 86
01594440 P00600 1982 812000 37400 5 78 - 86
01594440 P00600 1983 1390000 73100 5 79 - 87
01594440 P00600 1984 1330000 48900 4 80 - 88
01594440 P00600 1985 805000 23600 3 81 - 89
01594440 P00600 1986 778000 21000 3 82 - 90
01594440 P00600 1987 941000 23100 2 83 - 91
01594440 P00600 1988 887000 22000 2 84 - 92
01594440 P00600 1989 1160000 31700 3 85 - 93
01594440 P00600 1990 908000 24100 3 86 - 94
01594440 P00600 1991 679000 19700 3 87 - 95
01594440 P00600 1992 591000 17200 3 88 - 96
01594440 P00600 1993 838000 26000 3 89 - 97
01594440 P00600 1994 778000 21300 3 90 - 98
01594440 P00600 1995 480000 13300 3 91 - 99
01594440 P00600 1996 1040000 25800 2 91 - 99
01594440 P00600 1997 638000 17100 3 91 - 99
01594440 P00600 1998 676000 21400 3 91 - 99
01594440 P00600 1999 484000 20500 4 91 - 99
01594440 P00608 1980 210000 34200 16 80 - 88
01594440 P00608 1981 157000 18800 12 80 - 88
01594440 P00608 1982 162000 15400 10 80 - 88
01594440 P00608 1983 202000 20300 10 80 - 88
01594440 P00608 1984 172000 15500 9 80 - 88
01594440 P00608 1985 122000 8980 7 81 - 89
01594440 P00608 1986 106000 7520 7 82 - 90
01594440 P00608 1987 99700 6920 7 83 - 91
01594440 P00608 1988 76800 5980 8 84 - 92
01594440 P00608 1989 73900 5910 8 85 - 93
01594440 P00608 1990 57400 4410 8 86 - 94
01594440 P00608 1991 48900 4450 9 87 - 95
01594440 P00608 1992 40500 3520 9 88 - 96
01594440 P00608 1993 73700 7000 10 89 - 97
A Revised Load Estimation Procedure for the Susquehanna Potomac Patuxent and Choptank Rivers 30
Appendix A Annual load estimates for the River Input monitoring stations on the Susquehanna Potomac Patuxent and Choptank RiversndashContinued
Standard Error of Prediction
Annual load +- +- ModelStation no Parameter Year (kgyr) (kgyr) Percent window
Patuxent River near Bowie (01594440)mdashContinued
01594440 P00608 1994 74300 7570 10 90 - 98
01594440 P00608 1995 39600 4090 10 91 - 99
01594440 P00608 1996 82900 7650 9 91 - 99
01594440 P00608 1997 52800 5370 10 91 - 99
01594440 P00608 1998 51100 6020 12 91 - 99
01594440 P00608 1999 27500 3960 14 91 - 99
01594440 P00613 1985 24900 3110 13 85 - 93
01594440 P00613 1986 17500 1560 9 85 - 93
01594440 P00613 1987 14300 1060 7 85 - 93
01594440 P00613 1988 11700 915 8 85 - 93
01594440 P00613 1989 12600 1210 10 85 - 93
01594440 P00613 1990 8410 680 8 86 - 94
01594440 P00613 1991 7120 635 9 87 - 95
01594440 P00613 1992 5980 470 8 88 - 96
01594440 P00613 1993 11200 916 8 89 - 97
01594440 P00613 1994 11300 973 9 90 - 98
01594440 P00613 1995 6820 623 9 91 - 99
01594440 P00613 1996 15000 1200 8 91 - 99
01594440 P00613 1997 9450 850 9 91 - 99
01594440 P00613 1998 9310 972 10 91 - 99
01594440 P00613 1999 5250 700 13 91 - 99
01594440 P00623 1985 253000 18100 7 85 - 93
01594440 P00623 1986 233000 11700 5 85 - 93
01594440 P00623 1987 258000 10600 4 85 - 93
01594440 P00623 1988 241000 10200 4 85 - 93
01594440 P00623 1989 296000 14800 5 85 - 93
01594440 P00623 1990 219000 9610 4 86 - 94
01594440 P00623 1991 155000 8100 5 87 - 95
01594440 P00623 1992 132000 6640 5 88 - 96
01594440 P00623 1993 215000 11800 5 89 - 97
01594440 P00623 1994 193000 10300 5 90 - 98
01594440 P00623 1995 110000 6140 6 91 - 99
01594440 P00623 1996 269000 13800 5 91 - 99
01594440 P00623 1997 150000 8110 5 91 - 99
01594440 P00623 1998 161000 10400 6 91 - 99
01594440 P00623 1999 109000 9310 9 91 - 99
Appendix A 31
Appendix A Annual load estimates for the River Input monitoring stations on the Susquehanna Potomac Patuxent and Choptank RiversndashContinued
Standard Error of Prediction
Annual load +- +- ModelStation no Parameter Year (kgyr) (kgyr) Percent window
Patuxent River near Bowie (01594440)mdashContinued
01594440 P00625 1978 427000 53300 12 78 - 86
01594440 P00625 1979 736000 91200 12 78 - 86
01594440 P00625 1980 376000 24400 6 78 - 86
01594440 P00625 1981 223000 15800 7 78 - 86
01594440 P00625 1982 305000 22500 7 78 - 86
01594440 P00625 1983 581000 52700 9 79 - 87
01594440 P00625 1984 557000 34600 6 80 - 88
01594440 P00625 1985 293000 15300 5 81 - 89
01594440 P00625 1986 272000 13200 5 82 - 90
01594440 P00625 1987 336000 14200 4 83 - 91
01594440 P00625 1988 296000 12300 4 84 - 92
01594440 P00625 1989 423000 22300 5 85 - 93
01594440 P00625 1990 298000 14000 5 86 - 94
01594440 P00625 1991 199000 11300 6 87 - 95
01594440 P00625 1992 182000 10100 6 88 - 96
01594440 P00625 1993 304000 18400 6 89 - 97
01594440 P00625 1994 276000 15400 6 90 - 98
01594440 P00625 1995 150000 8580 6 91 - 99
01594440 P00625 1996 409000 21500 5 91 - 99
01594440 P00625 1997 213000 11600 5 91 - 99
01594440 P00625 1998 237000 15600 7 91 - 99
01594440 P00625 1999 169000 15500 9 91 - 99
01594440 P00631 1980 539000 39000 7 80 - 88
01594440 P00631 1981 394000 20600 5 80 - 88
01594440 P00631 1982 504000 21000 4 80 - 88
01594440 P00631 1983 773000 35200 5 80 - 88
01594440 P00631 1984 754000 30400 4 80 - 88
01594440 P00631 1985 510000 15900 3 81 - 89
01594440 P00631 1986 510000 14600 3 82 - 90
01594440 P00631 1987 607000 15800 3 83 - 91
01594440 P00631 1988 596000 15800 3 84 - 92
01594440 P00631 1989 733000 20800 3 85 - 93
01594440 P00631 1990 603000 16700 3 86 - 94
01594440 P00631 1991 480000 13800 3 87 - 95
01594440 P00631 1992 400000 12600 3 88 - 96
01594440 P00631 1993 528000 17700 3 89 - 97
01594440 P00631 1994 492000 14800 3 90 - 98
A Revised Load Estimation Procedure for the Susquehanna Potomac Patuxent and Choptank Rivers 32
Appendix A Annual load estimates for the River Input monitoring stations on the Susquehanna Potomac Patuxent and Choptank RiversndashContinued
Standard Error of Prediction
Annual load +- +- ModelStation no Parameter Year (kgyr) (kgyr) Percent window
Patuxent River near Bowie (01594440)mdashContinued
01594440 P00631 1995 332000 10500 3 91 - 99
01594440 P00631 1996 635000 17800 3 91 - 99
01594440 P00631 1997 424000 12900 3 91 - 99
01594440 P00631 1998 439000 15500 4 91 - 99
01594440 P00631 1999 320000 15300 5 91 - 99
01594440 P00665 1978 165000 21600 13 78 - 86
01594440 P00665 1979 332000 40000 12 78 - 86
01594440 P00665 1980 182000 14900 8 78 - 86
01594440 P00665 1981 103000 9420 9 78 - 86
01594440 P00665 1982 135000 12900 9 78 - 86
01594440 P00665 1983 265000 31000 12 79 - 87
01594440 P00665 1984 177000 14100 8 80 - 88
01594440 P00665 1985 72700 5390 7 81 - 89
01594440 P00665 1986 55100 3610 7 82 - 90
01594440 P00665 1987 65500 4150 6 83 - 91
01594440 P00665 1988 49500 2950 6 84 - 92
01594440 P00665 1989 81300 6110 8 85 - 93
01594440 P00665 1990 53800 3390 6 86 - 94
01594440 P00665 1991 33000 2360 7 87 - 95
01594440 P00665 1992 35000 2800 8 88 - 96
01594440 P00665 1993 55700 4730 9 89 - 97
01594440 P00665 1994 51600 3920 8 90 - 98
01594440 P00665 1995 29500 2600 9 91 - 99
01594440 P00665 1996 85700 7120 8 91 - 99
01594440 P00665 1997 36400 2930 8 91 - 99
01594440 P00665 1998 38400 3710 10 91 - 99
01594440 P00665 1999 32300 5370 17 91 - 99
01594440 P00666 1978 89000 10600 12 78 - 86
01594440 P00666 1979 142000 12700 9 78 - 86
01594440 P00666 1980 119000 9120 8 78 - 86
01594440 P00666 1981 90600 8190 9 78 - 86
01594440 P00666 1982 94900 8550 9 78 - 86
01594440 P00666 1983 108000 10700 10 79 - 87
01594440 P00666 1984 61300 5040 8 80 - 88
01594440 P00666 1985 29600 1960 7 81 - 89
01594440 P00666 1986 21600 1340 6 82 - 90
Appendix A 33
Appendix A Annual load estimates for the River Input monitoring stations on the Susquehanna Potomac Patuxent and Choptank RiversndashContinued
Standard Error of Prediction
Annual load +- +- ModelStation no Parameter Year (kgyr) (kgyr) Percent window
Patuxent River near Bowie (01594440)mdashContinued
01594440 P00666 1987 18600 1050 6 83 - 91
01594440 P00666 1988 14100 805 6 84 - 92
01594440 P00666 1989 17200 1160 7 85 - 93
01594440 P00666 1990 12900 733 6 86 - 94
01594440 P00666 1991 9360 575 6 87 - 95
01594440 P00666 1992 10500 729 7 88 - 96
01594440 P00666 1993 15600 1250 8 89 - 97
01594440 P00666 1994 15600 1220 8 90 - 98
01594440 P00666 1995 9730 854 9 91 - 99
01594440 P00666 1996 21600 1800 8 91 - 99
01594440 P00666 1997 10900 886 8 91 - 99
01594440 P00666 1998 10600 1030 10 91 - 99
01594440 P00666 1999 8490 1290 15 91 - 99
01594440 P00671 1982 109000 19300 18 82 - 90
01594440 P00671 1983 96800 12200 13 82 - 90
01594440 P00671 1984 59900 5440 9 82 - 90
01594440 P00671 1985 26600 1850 7 82 - 90
01594440 P00671 1986 17700 1190 7 82 - 90
01594440 P00671 1987 15400 961 6 83 - 91
01594440 P00671 1988 11000 672 6 84 - 92
01594440 P00671 1989 12900 857 7 85 - 93
01594440 P00671 1990 10300 637 6 86 - 94
01594440 P00671 1991 7280 424 6 87 - 95
01594440 P00671 1992 8620 573 7 88 - 96
01594440 P00671 1993 12400 912 7 89 - 97
01594440 P00671 1994 13000 843 6 90 - 98
01594440 P00671 1995 9580 686 7 91 - 99
01594440 P00671 1996 21000 1440 7 91 - 99
01594440 P00671 1997 10200 674 7 91 - 99
01594440 P00671 1998 9240 722 8 91 - 99
01594440 P00671 1999 6850 840 12 91 - 99
01594440 P00680 1985 1440000 78300 5 85 - 93
01594440 P00680 1986 1230000 47800 4 85 - 93
01594440 P00680 1987 1750000 57200 3 85 - 93
01594440 P00680 1988 1720000 57200 3 85 - 93
01594440 P00680 1989 3210000 142000 4 85 - 93
A Revised Load Estimation Procedure for the Susquehanna Potomac Patuxent and Choptank Rivers 34
Appendix A Annual load estimates for the River Input monitoring stations on the Susquehanna Potomac Patuxent and Choptank RiversndashContinued
Standard Error of Prediction
Annual load +- +- ModelStation no Parameter Year (kgyr) (kgyr) Percent window
Patuxent River near Bowie (01594440)mdashContinued
01594440 P00680 1990 1980000 58400 3 86 - 94
01594440 P00680 1991 1260000 42200 3 87 - 95
01594440 P00680 1992 1430000 57700 4 88 - 96
01594440 P00680 1993 2740000 104000 4 89 - 97
01594440 P00680 1994 2730000 93600 3 90 - 98
01594440 P00680 1995 1560000 62400 4 91 - 99
01594440 P00680 1996 4940000 180000 4 91 - 99
01594440 P00680 1997 2200000 81000 4 91 - 99
01594440 P00680 1998 2370000 106000 4 91 - 99
01594440 P00680 1999 1640000 116000 7 91 - 99
Appendix A 35
Appendix A Annual load estimates for the River Input monitoring stations on the Susquehanna Potomac Patuxent and Choptank RiversndashContinued
Standard Error of Prediction
Annual load Annual load +- +- ModelStation no Parameter Year (kgyr SiO2) (kgyr Si) (kgyr SiO2) Percent window
Patuxent River near Bowie (01594440)mdashContinued
01594440 P00955 1978 3270000 1530000 212000 6 78 - 86
01594440 P00955 1979 4710000 2200000 250000 5 78 - 86
01594440 P00955 1980 2760000 1290000 110000 4 78 - 86
01594440 P00955 1981 1440000 671000 62800 4 78 - 86
01594440 P00955 1982 1940000 905000 88600 5 78 - 86
01594440 P00955 1983 3160000 1480000 160000 5 79 - 87
01594440 P00955 1984 2760760 1290000 92000 3 80 - 88
01594440 P00955 1985 1460000 684000 46700 3 81 - 89
01594440 P00955 1986 1490000 698000 42700 3 82 - 90
01594440 P00955 1987 2020000 942000 54700 3 83 - 91
01594440 P00955 1988 2100000 982000 55700 3 84 - 92
01594440 P00955 1989 2980000 1390000 78500 3 85 - 93
01594440 P00955 1990 2550000 1190000 67400 3 86 - 94
01594440 P00955 1991 1880000 877000 50100 3 87 - 95
01594440 P00955 1992 1820000 850000 47100 3 88 - 96
01594440 P00955 1993 2680000 1250000 75600 3 89 - 97
01594440 P00955 1994 2810000 1310000 65400 2 90 - 98
01594440 P00955 1995 1980000 924000 47500 2 91 - 99
01594440 P00955 1996 4340000 2030000 94000 2 91 - 99
01594440 P00955 1997 2650000 1240000 61900 2 91 - 99
01594440 P00955 1998 2650000 1240000 72500 3 91 - 99
01594440 P00955 1999 1900000 887000 71000 4 91 - 99
A Revised Load Estimation Procedure for the Susquehanna Potomac Patuxent and Choptank Rivers 36
Appendix A Annual load estimates for the River Input monitoring stations on the Susquehanna Potomac Patuxent and Choptank RiversndashContinued
Standard Error of Prediction
Annual load +- +- ModelStation no Parameter Year (kgyr) (kgyr) Percent window
Patuxent River near Bowie (01594440)mdashContinued
01594440 P80154 1985 16300000 3480000 21 85 - 93
01594440 P80154 1986 10600000 1430000 13 85 - 93
01594440 P80154 1987 21800000 3040000 14 85 - 93
01594440 P80154 1988 22400000 3010000 13 85 - 93
01594440 P80154 1989 58500000 7990000 14 85 - 93
01594440 P80154 1990 24800000 3030000 12 86 - 94
01594440 P80154 1991 9900000 1340000 14 87 - 95
01594440 P80154 1992 13300000 2370000 18 88 - 96
01594440 P80154 1993 27500000 3990000 15 89 - 97
01594440 P80154 1994 24800000 3100000 13 90 - 98
01594440 P80154 1995 11700000 1900000 16 91 - 99
01594440 P80154 1996 53200000 6860000 13 91 - 99
01594440 P80154 1997 15500000 2090000 14 91 - 99
01594440 P80154 1998 17900000 2710000 15 91 - 99
01594440 P80154 1999 14100000 4890000 35 91 - 99
Appendix A 37
Appendix A Annual load estimates for the River Input monitoring stations on the Susquehanna Potomac Patuxent and Choptank RiversndashContinued
Standard Error of Prediction
Annual load +- +- ModelStation no Parameter Year (kgyr) (kgyr) Percent window
Choptank River near Greensboro (01491000)
01491000 P00600 1978 237000 17500 7 78 - 86
01491000 P00600 1979 314000 19700 6 78 - 86
01491000 P00600 1980 188000 7320 4 78 - 86
01491000 P00600 1981 107000 4370 4 78 - 86
01491000 P00600 1982 166000 7680 5 78 - 86
01491000 P00600 1983 329000 19400 6 79 - 87
01491000 P00600 1984 276000 14200 5 80 - 88
01491000 P00600 1985 113000 3760 3 81 - 89
01491000 P00600 1986 151000 5000 3 82 - 90
01491000 P00600 1987 167000 4980 3 83 - 91
01491000 P00600 1988 126000 3370 3 84 - 92
01491000 P00600 1989 355000 8260 2 85 - 93
01491000 P00600 1990 188000 4750 3 86 - 94
01491000 P00600 1991 156000 4370 3 87 - 95
01491000 P00600 1992 132000 3660 3 88 - 96
01491000 P00600 1993 177000 5700 3 89 - 97
01491000 P00600 1994 284000 9340 3 90 - 98
01491000 P00600 1995 133000 3750 3 91 - 99
01491000 P00600 1996 380000 10400 3 91 - 99
01491000 P00600 1997 201000 5360 3 91 - 99
01491000 P00600 1998 230000 7320 3 91 - 99
01491000 P00600 1999 183000 7680 4 91 - 99
01491000 P00608 1980 12300 3280 27 80 - 88
01491000 P00608 1981 6300 1220 19 80 - 88
01491000 P00608 1982 10800 1850 17 80 - 88
01491000 P00608 1983 29200 7250 25 80 - 88
01491000 P00608 1984 21000 5130 24 80 - 88
01491000 P00608 1985 3780 579 15 81 - 89
01491000 P00608 1986 5340 771 14 82 - 90
01491000 P00608 1987 6290 823 13 83 - 91
01491000 P00608 1988 3920 445 11 84 - 92
01491000 P00608 1989 17200 1890 11 85 - 93
01491000 P00608 1990 8380 1070 13 86 - 94
01491000 P00608 1991 7190 817 11 87 - 95
01491000 P00608 1992 5610 644 11 88 - 96
01491000 P00608 1993 10200 1340 13 89 - 97
A Revised Load Estimation Procedure for the Susquehanna Potomac Patuxent and Choptank Rivers 38
Appendix A Annual load estimates for the River Input monitoring stations on the Susquehanna Potomac Patuxent and Choptank RiversndashContinued
Standard Error of Prediction
Annual load +- +- ModelStation no Parameter Year (kgyr) (kgyr) Percent window
Choptank River near Greensboro (01491000)mdashContinued
01491000 P00608 1994 17000 3100 18 90 - 98
01491000 P00608 1995 4440 545 12 91 - 99
01491000 P00608 1996 18200 2230 12 91 - 99
01491000 P00608 1997 8280 1010 12 91 - 99
01491000 P00608 1998 10300 1450 14 91 - 99
01491000 P00608 1999 7410 1700 23 91 - 99
01491000 P00613 1985 698 104 15 85 - 93
01491000 P00613 1986 928 109 12 85 - 93
01491000 P00613 1987 1100 104 10 85 - 93
01491000 P00613 1988 877 79 9 85 - 93
01491000 P00613 1989 3100 265 9 85 - 93
01491000 P00613 1990 1560 143 9 86 - 94
01491000 P00613 1991 1380 130 9 87 - 95
01491000 P00613 1992 1040 110 11 88 - 96
01491000 P00613 1993 1320 152 12 89 - 97
01491000 P00613 1994 1670 199 12 90 - 98
01491000 P00613 1995 698 86 12 91 - 99
01491000 P00613 1996 2090 247 12 91 - 99
01491000 P00613 1997 1150 139 12 91 - 99
01491000 P00613 1998 1200 157 13 91 - 99
01491000 P00613 1999 921 148 16 91 - 99
01491000 P00623 1985 37200 3340 9 85 - 93
01491000 P00623 1986 49600 3580 7 85 - 93
01491000 P00623 1987 54400 3250 6 85 - 93
01491000 P00623 1988 37600 1940 5 85 - 93
01491000 P00623 1989 129000 6440 5 85 - 93
01491000 P00623 1990 54700 3020 6 86 - 94
01491000 P00623 1991 41400 2340 6 87 - 95
01491000 P00623 1992 32100 1750 5 88 - 96
01491000 P00623 1993 48300 3480 7 89 - 97
01491000 P00623 1994 84600 6570 8 90 - 98
01491000 P00623 1995 26900 1340 5 91 - 99
01491000 P00623 1996 104000 5500 5 91 - 99
01491000 P00623 1997 46900 2290 5 91 - 99
01491000 P00623 1998 60000 3570 6 91 - 99
01491000 P00623 1999 52300 5590 11 91 - 99
Appendix A 39
Appendix A Annual load estimates for the River Input monitoring stations on the Susquehanna Potomac Patuxent and Choptank RiversndashContinued
Standard Error of Prediction
Annual load +- +- ModelStation no Parameter Year (kgyr) (kgyr) Percent window
Choptank River near Greensboro (01491000)mdashContinued
01491000 P00625 1978 125000 23200 19 78 - 86
01491000 P00625 1979 159000 29000 18 78 - 86
01491000 P00625 1980 75400 7280 10 78 - 86
01491000 P00625 1981 35600 3400 10 78 - 86
01491000 P00625 1982 58000 6140 11 78 - 86
01491000 P00625 1983 143000 20100 14 79 - 87
01491000 P00625 1984 141000 18400 13 80 - 88
01491000 P00625 1985 49300 4710 10 81 - 89
01491000 P00625 1986 65100 5430 8 82 - 90
01491000 P00625 1987 70800 4800 7 83 - 91
01491000 P00625 1988 45100 2590 6 84 - 92
01491000 P00625 1989 167000 8880 5 85 - 93
01491000 P00625 1990 65100 3920 6 86 - 94
01491000 P00625 1991 44100 2540 6 87 - 95
01491000 P00625 1992 33900 1840 5 88 - 96
01491000 P00625 1993 59600 4400 7 89 - 97
01491000 P00625 1994 113000 9670 9 90 - 98
01491000 P00625 1995 31800 1770 6 91 - 99
01491000 P00625 1996 149000 9360 6 91 - 99
01491000 P00625 1997 63000 3490 6 91 - 99
01491000 P00625 1998 88900 6130 7 91 - 99
01491000 P00625 1999 90300 13300 15 91 - 99
01491000 P00631 1980 113000 9060 8 80 - 88
01491000 P00631 1981 69300 3870 6 80 - 88
01491000 P00631 1982 101000 5120 5 80 - 88
01491000 P00631 1983 161000 9220 6 80 - 88
01491000 P00631 1984 132000 7520 6 80 - 88
01491000 P00631 1985 64000 2510 4 81 - 89
01491000 P00631 1986 83500 3140 4 82 - 90
01491000 P00631 1987 95100 3360 4 83 - 91
01491000 P00631 1988 81600 2650 3 84 - 92
01491000 P00631 1989 194000 5510 3 85 - 93
01491000 P00631 1990 121000 3680 3 86 - 94
01491000 P00631 1991 114000 3910 3 87 - 95
01491000 P00631 1992 99900 3570 4 88 - 96
01491000 P00631 1993 118000 4750 4 89 - 97
01491000 P00631 1994 172000 7140 4 90 - 98
A Revised Load Estimation Procedure for the Susquehanna Potomac Patuxent and Choptank Rivers 40
Appendix A Annual load estimates for the River Input monitoring stations on the Susquehanna Potomac Patuxent and Choptank RiversndashContinued
Standard Error of Prediction
Annual load +- +- ModelStation no Parameter Year (kgyr) (kgyr) Percent window
Choptank River near Greensboro (01491000)mdashContinued
01491000 P00631 1995 100000 4070 4 91 - 99
01491000 P00631 1996 228000 8620 4 91 - 99
01491000 P00631 1997 137000 5170 4 91 - 99
01491000 P00631 1998 141000 6080 4 91 - 99
01491000 P00631 1999 112000 6020 5 91 - 99
01491000 P00665 1978 18200 4580 25 78 - 86
01491000 P00665 1979 29000 9580 33 78 - 86
01491000 P00665 1980 10800 1370 13 78 - 86
01491000 P00665 1981 4930 599 12 78 - 86
01491000 P00665 1982 7610 990 13 78 - 86
01491000 P00665 1983 30300 6090 20 79 - 87
01491000 P00665 1984 18900 3500 19 80 - 88
01491000 P00665 1985 5410 871 16 81 - 89
01491000 P00665 1986 6270 768 12 82 - 90
01491000 P00665 1987 6950 717 10 83 - 91
01491000 P00665 1988 4430 363 8 84 - 92
01491000 P00665 1989 20900 1670 8 85 - 93
01491000 P00665 1990 8380 811 10 86 - 94
01491000 P00665 1991 6840 592 9 87 - 95
01491000 P00665 1992 4870 400 8 88 - 96
01491000 P00665 1993 9350 1150 12 89 - 97
01491000 P00665 1994 19400 3030 16 90 - 98
01491000 P00665 1995 4180 434 10 91 - 99
01491000 P00665 1996 24700 3200 13 91 - 99
01491000 P00665 1997 9060 991 11 91 - 99
01491000 P00665 1998 13300 1770 13 91 - 99
01491000 P00665 1999 20100 7180 36 91 - 99
01491000 P00666 1978 4190 1000 24 78 - 86
01491000 P00666 1979 8010 2530 32 78 - 86
01491000 P00666 1980 3570 427 12 78 - 86
01491000 P00666 1981 1980 232 12 78 - 86
01491000 P00666 1982 2890 368 13 78 - 86
01491000 P00666 1983 8580 1810 21 79 - 87
01491000 P00666 1984 4590 796 17 80 - 88
01491000 P00666 1985 1790 297 17 81 - 89
01491000 P00666 1986 1640 185 11 82 - 90
Appendix A 41
Appendix A Annual load estimates for the River Input monitoring stations on the Susquehanna Potomac Patuxent and Choptank RiversndashContinued
Standard Error of Prediction
Annual load +- +- ModelStation no Parameter Year (kgyr) (kgyr) Percent window
Choptank River near Greensboro (01491000)mdashContinued
01491000 P00666 1987 1930 183 10 83 - 91
01491000 P00666 1988 1570 121 8 84 - 92
01491000 P00666 1989 8700 700 8 85 - 93
01491000 P00666 1990 3250 321 10 86 - 94
01491000 P00666 1991 2860 268 9 87 - 95
01491000 P00666 1992 2680 208 8 88 - 96
01491000 P00666 1993 4020 379 9 89 - 97
01491000 P00666 1994 9650 1110 11 90 - 98
01491000 P00666 1995 2480 195 8 91 - 99
01491000 P00666 1996 13200 1280 10 91 - 99
01491000 P00666 1997 4420 379 9 91 - 99
01491000 P00666 1998 4830 479 10 91 - 99
01491000 P00666 1999 5410 1420 26 91 - 99
01491000 P00671 1982 2860 772 27 82 - 90
01491000 P00671 1983 7140 1580 22 82 - 90
01491000 P00671 1984 4090 761 19 82 - 90
01491000 P00671 1985 1410 304 22 82 - 90
01491000 P00671 1986 1350 216 16 82 - 90
01491000 P00671 1987 1530 201 13 83 - 91
01491000 P00671 1988 1160 123 11 84 - 92
01491000 P00671 1989 6260 685 11 85 - 93
01491000 P00671 1990 2500 358 14 86 - 94
01491000 P00671 1991 2280 292 13 87 - 95
01491000 P00671 1992 2110 245 12 88 - 96
01491000 P00671 1993 2950 419 14 89 - 97
01491000 P00671 1994 6290 1090 17 90 - 98
01491000 P00671 1995 1690 204 12 91 - 99
01491000 P00671 1996 7600 1070 14 91 - 99
01491000 P00671 1997 2870 368 13 91 - 99
01491000 P00671 1998 3200 478 15 91 - 99
01491000 P00671 1999 3050 1070 35 91 - 99
01491000 P00680 1985 430000 25900 6 85 - 93
01491000 P00680 1986 622000 30600 5 85 - 93
01491000 P00680 1987 680000 27500 4 85 - 93
01491000 P00680 1988 426000 13900 3 85 - 93
01491000 P00680 1989 1850000 61300 3 85 - 93
A Revised Load Estimation Procedure for the Susquehanna Potomac Patuxent and Choptank Rivers 42
Appendix A Annual load estimates for the River Input monitoring stations on the Susquehanna Potomac Patuxent and Choptank RiversndashContinued
Standard Error of Prediction
Annual load +- +- ModelStation no Parameter Year (kgyr) (kgyr) Percent window
Choptank River near Greensboro (01491000)mdashContinued
01491000 P00680 1990 759000 29300 4 86 - 94
01491000 P00680 1991 596000 21000 4 87 - 95
01491000 P00680 1992 461000 16300 4 88 - 96
01491000 P00680 1993 903000 44800 5 89 - 97
01491000 P00680 1994 1880000 101000 5 90 - 98
01491000 P00680 1995 555000 22000 4 91 - 99
01491000 P00680 1996 2590000 114000 4 91 - 99
01491000 P00680 1997 1040000 40400 4 91 - 99
01491000 P00680 1998 1370000 66900 5 91 - 99
01491000 P00680 1999 1190000 121000 10 91 - 99
Appendix A 43
Appendix A Annual load estimates for the River Input monitoring stations on the Susquehanna Potomac Patuxent and Choptank RiversndashContinued
Standard Error of Prediction
Annual load Annual load +- +- ModelStation no Parameter Year (kgyr SiO2) (kgyr Si) (kgyr SiO2) Percent window
Choptank River near Greensboro (01491000)mdashContinued
01491000 P00955 1978 1760000 824000 139000 8 78 - 86
01491000 P00955 1979 2310000 1080000 126000 5 78 - 86
01491000 P00955 1980 1640000 768000 73200 4 78 - 86
01491000 P00955 1981 1060000 495000 51500 5 78 - 86
01491000 P00955 1982 1490000 695000 81500 5 78 - 86
01491000 P00955 1983 2280000 1070000 143000 6 79 - 87
01491000 P00955 1984 1870000 876000 112000 6 80 - 88
01491000 P00955 1985 903000 422000 36600 4 81 - 89
01491000 P00955 1986 1180000 552000 46100 4 82 - 90
01491000 P00955 1987 1350000 631000 48800 4 83 - 91
01491000 P00955 1988 1130000 528000 37300 3 84 - 92
01491000 P00955 1989 2610000 1220000 76200 3 85 - 93
01491000 P00955 1990 1560000 727000 50600 3 86 - 94
01491000 P00955 1991 1370000 642000 45700 3 87 - 95
01491000 P00955 1992 1190000 554000 38100 3 88 - 96
01491000 P00955 1993 1360000 637000 40700 3 89 - 97
01491000 P00955 1994 2120000 992000 63300 3 90 - 98
01491000 P00955 1995 1320000 615000 37600 3 91 - 99
01491000 P00955 1996 2910000 1360000 76600 3 91 - 99
01491000 P00955 1997 1790000 835000 47800 3 91 - 99
01491000 P00955 1998 1720000 806000 52000 3 91 - 99
01491000 P00955 1999 1420000 661000 54900 4 91 - 99
A Revised Load Estimation Procedure for the Susquehanna Potomac Patuxent and Choptank Rivers 44
Appendix A Annual load estimates for the River Input monitoring stations on the Susquehanna Potomac Patuxent and Choptank RiversndashContinued
Standard Error of Prediction
Annual load +- +- ModelStation no Parameter Year (kgyr) (kgyr) Percent window
Choptank River near Greensboro (01491000)mdashContinued
01491000 P80154 1978 3540000 1300000 37 78 - 86
01491000 P80154 1979 6680000 3400000 51 78 - 86
01491000 P80154 1980 1950000 362000 19 78 - 86
01491000 P80154 1981 730000 129000 18 78 - 86
01491000 P80154 1982 1370000 237000 17 78 - 86
01491000 P80154 1983 6790000 1530000 23 79 - 87
01491000 P80154 1984 3560000 729000 20 80 - 88
01491000 P80154 1985 901000 237000 26 81 - 89
01491000 P80154 1986 1560000 337000 22 82 - 90
01491000 P80154 1987 1770000 299000 17 83 - 91
01491000 P80154 1988 874000 119000 14 84 - 92
01491000 P80154 1989 5130000 660000 13 85 - 93
01491000 P80154 1990 1950000 334000 17 86 - 94
01491000 P80154 1991 1480000 200000 14 87 - 95
01491000 P80154 1992 733000 89300 12 88 - 96
01491000 P80154 1993 2200000 433000 20 89 - 97
01491000 P80154 1994 5850000 1580000 27 90 - 98
01491000 P80154 1995 742000 109000 15 91 - 99
01491000 P80154 1996 5090000 981000 19 91 - 99
01491000 P80154 1997 1420000 180000 13 91 - 99
01491000 P80154 1998 2940000 548000 19 91 - 99
01491000 P80154 1999 2820000 1310000 46 91 - 99
Appendix A 45
--------
--------
--------
--------
--------
--------
--------
--------
--------
--------
--------
--------
-----
A Revised Load Estimation Procedure for the Susquehanna Potomac Patuxent and Choptank Rivers
App
endi
x B
Pe
rcen
t diff
eren
ces b
etw
een
hist
oric
al a
nd re
vise
d lo
ad e
stim
ates
[Thi
s app
endi
x su
mm
ariz
es th
e pe
rcen
t diff
eren
ces b
etw
een
the
hist
oric
al lo
ad e
stim
ates
from
the
Riv
er In
put m
onito
ring
prog
ram
and
the
revi
sed
estim
ates
pro
vide
d in
A
ppen
dix
A -
- es
timat
es a
re n
ot a
vaila
ble
for c
ompa
rison
]
Rev
ised
est
imat
e -
His
tori
c es
tim
ate
Per
cent
dif
fere
nce
=
times 10
0
(R
evis
ed e
stim
ate
+ H
isto
ric
estim
ate )
2
Dis
solv
edTo
tal
Tota
lTo
tal
Diss
olve
d k
jeld
ahl
kjel
dahl
Diss
olve
dTo
tal
Diss
olve
dor
gani
cSu
spen
ded
nitr
ogen
am
mon
ia n
itrog
enni
trog
enni
trite
+ n
itrat
eph
osph
orus
phos
phor
usO
rtho
phos
phor
usca
rbon
sedi
men
tYe
ar (P
0060
0) (P
0060
8) (P
0062
3)
(P00
625)
(P
0063
1)
(P00
665)
(P
0066
6)
(P00
671)
(P
0068
0)
(P80
154)
Susq
ueha
nna
Riv
er a
t Con
owin
go D
am (0
1578
310)
1978
--
----
----
----
----
--
1979
-3
9
-18
7 --
-22
-1
4
-42
7
8 14
2
--3
4
1980
-1
1
-11
--
-09
2
2 -7
5
52
30
---3
0
1981
1
4 7
0 --
09
49
-57
8
4 -4
3
---1
1
1982
2
8 17
0
--1
8 5
8 -1
14
20
-10
5 --
-19
1983
4
2 20
2
--3
8 5
4 -1
16
-53
-1
15
--2
5
1984
6
3 10
7
--17
6
-29
-2
09
-13
5 -1
21
--5
6
1985
6
2 -5
3
-29
12
7
-08
-2
31
-58
-1
61
-13
9 -1
8
1986
2
3 -1
02
-02
2
2 -0
4
-32
8 -1
79
-32
-7
9
-12
7
1987
3
5 -5
8
23
25
23
-27
7 -2
94
219
-6
3
-81
1988
4
2 -2
3
95
56
35
-27
3 -4
93
290
1
0 -3
8
1989
-6
1
197
-6
4
-18
-9
0
-29
7 -6
69
181
15
0
-08
1990
-8
2
58
-18
8 -7
7
-10
8 -1
82
-28
4 24
8
81
-37
1991
-8
8
161
-2
59
-16
5 -9
5
-10
8 2
4 44
6
-16
-6
1
1992
-7
7
-62
-1
32
-13
1 -1
00
-19
8 3
5 7
1 3
2 -1
55
1993
-1
8
49
-71
-8
6
-33
-0
7
131
4
6 1
0 7
7
1994
-1
2
-48
-8
1
-12
6 0
6 -0
3
81
-35
0 0
0 9
8
1995
-1
7
-14
6 -1
51
-21
0 2
6 -6
3
206
-7
65
-84
-2
4
1996
-4
5
-16
9 -4
8
-41
-4
3
167
12
4
-15
6 -6
7
40
1997
-3
2
----
13
16
191
29
2
-52
--
-10
3
1998
0
0 -1
29
49
-14
0
9 17
6
112
-3
67
-13
8 1
0
46
App
endi
x B
Pe
rcen
t diff
eren
ces b
etw
een
hist
oric
al a
nd re
vise
d lo
ad e
stim
ates
mdashC
ontin
ued
Diss
olve
dTo
tal
Tota
l T
otal
Diss
olve
d k
jeld
ahl
kjel
dahl
Diss
olve
dTo
tal
Diss
olve
dor
gani
cSu
spen
ded
nitr
ogen
am
mon
ia n
itrog
enni
trog
enni
trite
+ n
itrat
eph
osph
orus
phos
phor
usO
rtho
phos
phor
usca
rbon
sedi
men
tYe
ar (P
0060
0) (P
0060
8) (P
0062
3)
(P00
625)
(P
0063
1)
(P00
665)
(P
0066
6)
(P00
671)
(P
0068
0)
(P80
154)
Poto
mac
Riv
er a
t Cha
in B
ridg
e (0
1646
580)
1978
--
----
----
----
----
--
1979
1
2 49
6
--0
2 -3
2
39
150
27
7
---2
12
1980
2
0 35
6
--0
4 -2
8
14
127
17
2
--7
0
1981
1
3 24
3
---1
6
-25
-3
5
98
92
--29
3
1982
1
7 13
8
---2
4
06
-37
2
8 5
3 --
265
1983
0
7 2
5 0
6 -3
0
14
-55
-4
3
07
--26
9
1984
0
7 -4
7
-77
0
5 -0
6
-77
-9
8
-68
--
528
1985
-5
3
-50
-2
09
-96
1
2 -1
03
-15
7 -5
6
--41
3
1986
-9
2
-24
5 -1
41
-13
6 -1
12
-26
3 -1
91
-24
3 --
119
1987
-8
8
-21
-1
24
-99
-1
61
-11
8 -1
49
-13
5 --
348
1988
-3
9
246
-5
7
-41
-1
25
59
33
120
-3
28
574
1989
-0
1
-13
6 8
8 4
8 -7
0
64
141
12
5
-16
27
2
1990
-9
7
-36
7 6
7 -2
93
-38
-2
12
274
40
8
-20
6 17
6
1991
-1
68
-32
6 7
3 -2
75
-24
1 -2
85
-14
0 -1
60
-89
-6
8
1992
-1
32
-31
0 20
6
-80
-2
63
-21
9 -1
79
-26
4 -2
93
-32
5
1993
-8
0
-01
16
8
-80
-1
31
-76
-4
8
-14
-1
3
-14
4
1994
-3
1
229
13
7
-57
-4
4
21
159
26
0
61
-15
7
1995
5
2 1
1 8
8 4
3 -2
0
-20
-8
4
-14
2 3
3 -7
6
1996
-1
10
-83
-0
7
-29
-1
47
114
13
4
156
-2
7
-18
4
1997
-7
1
----
-20
-1
05
136
29
1
106
--
152
1998
-5
5
-40
1
3 -2
4
-64
5
3 8
9 9
6 -3
3
71
Appendix B 47
A Revised Load Estimation Procedure for the Susquehanna Potomac Patuxent and Choptank Rivers
App
endi
x B
Pe
rcen
t diff
eren
ces b
etw
een
hist
oric
al a
nd re
vise
d lo
ad e
stim
ates
mdashC
ontin
ued
Diss
olve
dTo
tal
Tota
l T
otal
Diss
olve
d k
jeld
ahl
kjel
dahl
Diss
olve
dTo
tal
Diss
olve
dor
gani
cSu
spen
ded
nitr
ogen
am
mon
ia n
itrog
enni
trog
enni
trite
+ n
itrat
eph
osph
orus
phos
phor
usO
rtho
phos
phor
usca
rbon
sedi
men
tYe
ar (P
0060
0) (P
0060
8) (P
0062
3)
(P00
625)
(P
0063
1)
(P00
665)
(P
0066
6)
(P00
671)
(P
0068
0)
(P80
154)
Patu
xent
Riv
er n
ear
Bow
ie (0
1594
440)
1978
-2
1
----
-11
7 --
-48
3 -5
04
----
--
1979
-2
3
----
-10
7 --
-36
7 -2
43
----
--
1980
-2
5
156
--
-57
-4
2
-10
9 10
6
----
--
1981
-7
4
61
---2
1
-51
-4
9
316
--
----
1982
-4
3
-21
--
-24
-2
2
19
362
33
6
----
1983
-0
4
-10
--
-43
1
4 17
2
388
14
7
----
1984
3
9 -6
6
--8
3 1
7 7
1 3
6 -8
1
----
1985
-1
8
-37
4
8 2
5 -1
9
-10
0 -1
42
-31
9 6
9 28
8
1986
-3
2
-48
2
2 -2
2
-12
-1
30
-17
9 -3
68
66
82
1987
0
3 0
1 1
8 0
8 0
2 0
6 -2
74
-30
9 9
8 3
4
1988
-3
8
-53
2
2 -9
8
-10
-1
2
-27
1 -2
33
119
-1
72
1989
0
8 21
0
57
32
00
88
-25
3 -1
89
123
14
5
1990
1
2 36
1
110
11
4
-16
14
4
43
-17
11
5
173
1991
5
6 57
4
76
113
5
8 6
0 -1
87
-27
3 -7
4
217
1992
-1
3
239
-0
5
71
07
62
-18
3 -2
18
-10
0 29
3
1993
9
9 27
6
192
12
0
131
0
9 -2
64
-37
4 6
6 22
0
1994
12
0
76
193
3
6 14
5
-10
-2
73
-37
1 4
8 10
0
1995
12
1
-20
0 1
2 -9
9
169
-1
88
-44
7 -5
16
-11
0 -1
74
1996
0
4 -8
9
-33
-0
6
05
-57
-1
41
-22
8 -9
3
-10
4
1997
4
6 --
----
68
-14
0 -2
86
-45
7 --
-10
0
1998
8
2 -3
23
35
-65
16
6
-31
9 -6
91
-72
8 -1
64
-15
2
48
App
endi
x B
Pe
rcen
t diff
eren
ces b
etw
een
hist
oric
al a
nd re
vise
d lo
ad e
stim
ates
mdashC
ontin
ued
Diss
olve
dTo
tal
Tota
l T
otal
Diss
olve
d k
jeld
ahl
kjel
dahl
Diss
olve
dTo
tal
Diss
olve
dor
gani
cSu
spen
ded
nitr
ogen
am
mon
ia n
itrog
enni
trog
enni
trite
+ n
itrat
eph
osph
orus
phos
phor
usO
rtho
phos
phor
usca
rbon
sedi
men
tYe
ar (P
0060
0) (P
0060
8) (P
0062
3)
(P00
625)
(P
0063
1)
(P00
665)
(P
0066
6)
(P00
671)
(P
0068
0)
(P80
154)
Cho
ptan
k R
iver
nea
r G
reen
sbor
o (0
1491
000)
1978
-1
75
----
-22
--
98
41
----
-27
4
1979
-1
52
----
-13
4 --
162
21
4
----
-20
9
1980
-3
0
165
--
-56
-0
9
-11
6 4
6 --
---1
03
1981
1
9 11
8
---7
7
02
-16
3 7
5 --
--1
6
1982
1
0 11
1
---9
0
07
-16
1 12
3
-12
1 --
40
1983
-2
2
102
--
-22
8 -1
5
108
16
8
-85
--
-19
9
1984
4
5 12
5
--4
6 -0
9
13
-54
-7
9
---4
03
1985
8
3 -2
02
37
143
-0
1
-11
0 -8
9
-13
0 -1
25
-54
2
1986
-0
9
-10
0 -0
6
-03
-4
5
-13
0 -1
46
-09
-5
8
-29
9
1987
-2
1
103
-0
7
-70
0
2 -1
21
-17
8
7 -5
1
-26
3
1988
-0
3
352
1
6 -1
77
92
-15
9 13
5
123
-3
4
-35
2
1989
1
0 15
7
23
32
-03
-1
0
-13
-1
11
-52
-2
81
1990
-3
0
124
-4
0
-41
-6
8
-79
-9
8
-15
7 -1
6
-14
9
1991
-9
5
89
-67
-1
17
-89
-4
7
31
-10
0 -1
3
106
1992
-5
8
-16
0
3 -9
7
-68
-2
59
154
-1
58
62
115
1993
-8
5
-11
7 8
1 1
3 -8
7
-91
27
9
-32
9 4
1 2
3
1994
-1
7
-82
8
8 3
7 -1
1
98
22
-43
9 -4
4
146
1995
-2
8
-18
0
5 -1
73
18
-19
6 -2
46
-61
2 -2
1
10
1996
-1
8
-13
7 -0
5
49
-47
-3
5
-16
0 -1
16
-57
9
5
1997
-4
3
----
103
-8
5
71
-34
3
0 --
90
1998
2
0 2
8 6
5 7
0 10
0
-22
-7
7
-30
8 -3
0
117
Appendix B 49
- Contents
- Abstract
- Introduction
-
- Purpose and Scope
- Description of Study Area
- Acknowledgments
-
- Methods of Load Estimation
-
- Monitoring Record
- Regression Model
- Historical Load Estimates
-
- Revised Procedure for Load Estimation
-
- Background
- Description of Revised Methods
- Comparison of Historical and Revised Load Estimates
-
- Summary and Conclusions
- References Cited
-
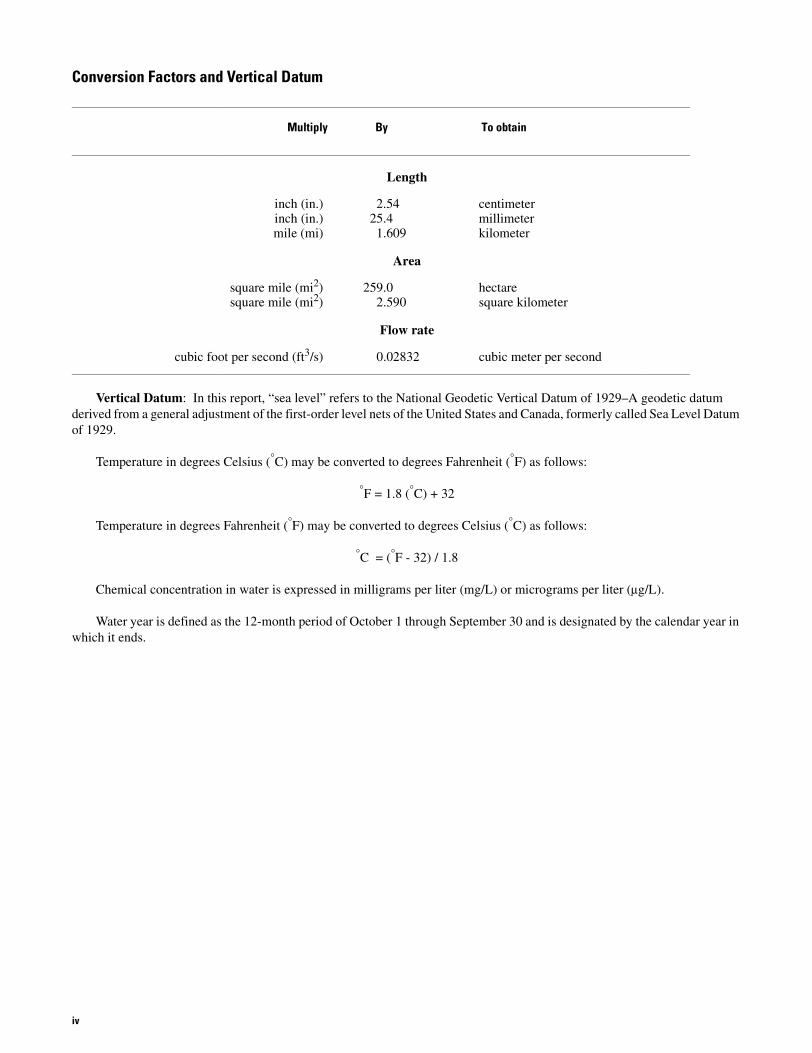
_____________________________________________________________________________________________________________________________________
_____________________________________________________________________________________________________________________________________
Conversion Factors and Vertical Datum
Multiply By To obtain
___________________________________________________________________________________
Length
__________________________________________________
inch (in) 254 centimeter inch (in) 254 millimeter mile (mi) 1609 kilometer
Area
square mile (mi2) square mile (mi2)
2590 2590
hectare square kilometer
Flow rate
cubic foot per second (ft3s) 002832 cubic meter per second
Vertical Datum In this report ldquosea levelrdquo refers to the National Geodetic Vertical Datum of 1929ndashA geodetic datum derived from a general adjustment of the first-order level nets of the United States and Canada formerly called Sea Level Datum of 1929
Temperature in degrees Celsius ( deg C) may be converted to degrees Fahrenheit ( deg F) as follows
deg F = 18 ( deg C) + 32
Temperature in degrees Fahrenheit ( deg F) may be converted to degrees Celsius ( deg C) as follows
deg C = ( deg F - 32) 18
Chemical concentration in water is expressed in milligrams per liter (mgL) or micrograms per liter (microgL)
Water year is defined as the 12-month period of October 1 through September 30 and is designated by the calendar year in which it ends
iv
A Revised Load Estimation Procedure for the Susquehanna Potomac Patuxent and Choptank Rivers
By Steven E Yochum
Abstract
The US Geological Surveyrsquos Chesapeake Bay River Input Program has updated the nutrient and suspended-sediment load data base for the Susquehanna Potomac Patuxent and Choptank Rivers using a multiple-window center-estimate regression methodology The revised method optimizes the seven-parameter regression approach that has been used historically by the program The revised method estimates load using the fifth or center year of a sliding 9-year window Each year a new model is run for each site and constituent the most recent year is added and the previous 4 years of estimates are updated The fifth year in the 9-year window is considered the best estimate and is kept in the data base The last year of estimation shows the most change from the previous yearrsquos estimate and this change approaches a minimum at the fifth year Differences between loads computed using this revised methodology and the loads populating the historical data base have been noted but the load estimates do not typically change drastically The data base resulting from the application of this revised methodology is populated by annual and monthly load estimates that are known with greater certainty than in the previous load data base
Introduction
Since 1985 the US Geological Survey (USGS) Maryland Chesapeake Bay River Input Program in a cooperative effort with the Maryland Department of Natural Resources and the Metropolitan Washington Council of Governments (MWCOG) has monitored streamflow nutrients and suspended-sediment concentrations in the Susquehanna Potomac Patuxent and Choptank Rivers just above the point of tidal influence (fig 1) These data are used to estimate nutrient and sediment loads entering the tidal waters of the Chesapeake Bay The USGS Virginia Chesapeake Bay River Input Program in cooperation with the Virginia Department of Environmental Quality monitors concentrations of nutrients and suspended sediments of five Virginia rivers just above the point of tidal influence The Maryland and Virginia programs jointly comprise the USGS River Input Program
Within the Maryland River Input Program 12 nutrient and suspended-sediment constituents are monitored at 4 stations Annual and monthly loads are estimated using a seven-parameter log-linear regression model This regression model known as Estimator was developed by the USGS and is widely used for load estimation During this program a historical data base of annual and monthly load estimates had been generated for each constituent from eleven 10- to 14-year model windows with the first window providing load estimates over its entire calibration window length and the remaining estimates extracted from the last year of calibration of each subsequent model These end-of-model-window estimates that have traditionally been provided by the monitoring program are not statistically preferred The preferred load estimates for any individual year (those with minimum uncertainty) are the ones computed in the center of the regression A new data base populated by loads estimated for the fifth or center year of 9-year calibration windows has been developed A 9-year window is preferred because it has a center (for the load estimation) and it is long enough to encompass a sufficient number of samples and a full range of wet to dry periods These center estimates have less uncertainty than the load estimates in the historical data base
Introduction 1
A Revised Load Estimation Procedure for the Susquehanna Potomac Patuxent and Choptank Rivers 2
Purpose and Scope The purpose of this report is to describe and provide
justification for a revised procedure implemented in the computation of nutrient and suspended-sediment loads at the Maryland River Input monitoring stations The revised annual loads at the monitoring stations are also presented This report limits its discussion to the load computations at the four Maryland River Input monitoring stations from 1978 through 1999 (a shorter period for some constituents and sites) and provides only a brief description of the monitoring program and study area
Description of Study Area The watersheds that drain to the four Maryland River
Input monitoring stations (fig 1) include a wide range of land cover geographic and geologic regions The watersheds encompass such diverse areas as the forested Appalachian Plateau of New York and Pennsylvania the Valley and Ridge of the West Virginia highlands as well as the agricultural regions of Pennsylvaniarsquos Lancaster County the Shenandoah Valley of Virginia and the flat lowlands of the Delmarva Peninsula
The Susquehanna River is monitored just downstream from Conowingo Dam Md and has a drainage area of 27100 mi2 (square miles) The Susquehanna is the largest tributary to the Chesapeake Bay and is the largest single source of total nitrogen and phosphorus (Darrell and others 1999) The Potomac River is the second largest contributor of streamflow to the Bay and the largest contributor of suspended sediment The Potomac is monitored at Chain Bridge and has a drainage area of 11570 mi2 The Patuxent River is monitored near Bowie Md at Governorrsquos Bridge and has a drainage area at the monitoring station of 348 mi2 The Choptank River is the smallest tributary monitored in the River Input Program The Choptank monitoring station is near Greensboro Md on the Delmarva Peninsula and has a contributing drainage area of 112 mi2
Acknowledgments The author gratefully acknowledges the many
technicians who collected the base-flow and stormflow samples used in the load computations for this study Much of these data were collected during long days weekends holidays and during adverse weather conditions Their dedication and expertise is much appreciated A special thanks is extended to David Brower of the USGS the hydrologic technician who currently collects samples for this project The author would also like to thank Joel Blomquist and Timothy Cohn of USGS who both helped develop the revised methodology and Brenda Majedi of USGS who provided much insight into the history of the River Input monitoring program The specialists and data base personnel in the Maryland-Delaware-DC District office of the USGS are also thanked for their advice and support
Harry Post of the Occoquan Watershed Monitoring Laboratory and Christine Becker of the Metropolitan Washington Council of Governments are thanked for their
monitoring efforts at the Potomac River at Chain Bridge The cooperation of the Philadelphia Electric Company in the Susquehanna River sampling and gaging at Conowingo Md is also appreciated
Methods of Load Estimation
A detailed description of the concentration data base used in the load computations is provided below The regression model Estimator the model that was used to compute loads for both the historical and revised methodologies is also discussed A description of the historical load data base is also provided
Monitoring Record Twelve nutrient and suspended-sediment constituents are
monitored at the four River Input monitoring stations These constituents are listed in table 1 Annual and monthly loads are estimated for all 12 of these constituents The table also indicates how each constituent is reported and the parameter numbers used for each constituent in the USGS National Water Information System (NWIS) water-quality data base and subsequently in the load computation process
Table 1 Constituents monitored in the River Input Program
[na not applicable]
Parameter ReportedConstituent number as
Total nitrogen (TN) P00600 N
Dissolved ammonia (NH3) P00608 N
Dissolved nitrite (NO2) P00613 N
Dissolved kjeldahl nitrogen (dissKN) P00623 N
Total kjeldahl ntrogen (TKN) P00625 N
Dissolved nitrite + nitrate (NO2 +NO3) P00631 N
Total phosphorus (TP) P00665 P
Dissolved phosphorus (dissP) P00666 P
Orthophosphorus (o-PO4) P00671 P
Total organic carbon (TOC) P00680 C
Dissolved silica (SiO2) P00955 SiO2
Suspended sediment P80154 na
Methods of Load Estimation 3
The Maryland River Input Program began in 1985 For this program 15 to 30 samples per year are collected (during both base-flow and stormflow conditions) using an equal-width-increment depth-integrated sampling procedure at the Susquehanna the Patuxent and the Choptank River sites The Potomac River is monitored by MWCOG through the Occoquan Watershed Monitoring Laboratory (OWML) OWML uses an automatic sampler at the Potomac River site Additionally the River Input Program periodically collects Potomac River storm samples using the equal-width-increment depth-integrated sampling procedure Nutrient and suspended-sediment data were collected by the USGS National Water-Quality Assessment (NAWQA) Program for the Susquehanna and Potomac Rivers from 1993 to the present and at the Choptank River from 1987ndash90 Additional samples were collected by the USGS National Stream-Quality Accounting Network (NASQAN) at all four of the sites until the midndash1990rsquos (Darrell and others 1999)
and a study by Lang (1982) populated the data base from 1979 through 1981 for the Potomac and Susquehanna Rivers
Except for the data collected by OWML for the Potomac River at Chain Bridge all of these data are the result of USGS collection and analysis and constitute the concentration data set used to estimate loads at the four Maryland River Input monitoring stations These data are available on the USGS River Input Program web site at httpwww-vausgsgovchesbayRIMP
The sampling record for the Susquehanna River at Conowingo Dam monitoring station began with the 1979 water year Figure 2a shows the sampling frequency at the dam for total phosphorus from 1978 through 1999 (Total phosphorus represents one of the more frequently sampled constituents in the record) The sampling frequencies for all constituents peaked between 1979 and 1981 during the study by Lang (1982) were at a minimum or were not analyzed for
A Revised Load Estimation Procedure for the Susquehanna Potomac Patuxent and Choptank Rivers 4
from 1982 through 1984 and then increased steadily to comparatively high levels from 1987 through 1990 Samples were collected less frequently in 1991 and 1992 as the NASQAN Program was phased out Sampling frequency increased again in 1993 when the NAWQA program entered a high-intensity phase in this river but then decreased to a minimal level as NAWQA passed into a low-intensity phase At present (2000) 25 to 35 samples per year are collected at this site (depending upon hydrologic conditions)
The sampling frequency for total phosphorus at the Potomac River station is shown in figure 2b Sampling at this site was also initiated at the beginning of the 1979 water year with an increasing frequency through 1981 for all 12 constituents during the Lang (1982) study Few water-quality data were collected in 1982 as Langrsquos sampling program ended but the sampling frequency for most constituents increased again in 1983 when MWCOG and OWML began water-quality monitoring at this site OWML does not analyze samples for nitrite and suspended sedimentmdashthese data sets have been populated since 1985 by only limited (usually monthly) USGS sampling As a result of this limited data availability estimates of nitrite and suspended-sediment loads have greater uncertainty (larger standard errors) than the other constituents Currently 60ndash80 samples per year are collected at this site (depending upon hydrologic conditions)
Sampling was relatively infrequent at the Patuxent River site from 1978ndash84 for most constituents (fig 2c) only the NASQAN Program collected samples during this period Maximum sampling frequency occurred after the River Input Program was initiated in 1985 and both the River Input and NASQAN Programs collected samples The sampling frequency decreased through the early 1990rsquos for all constituents after the River Input Program became the only program collecting samples at this site Currently 20 to 30 samples per year are collected at this site (depending upon hydrologic conditions)
Relatively low frequency sampling also occurred at the Choptank River site from 1978 through 1984 for most constituents (fig 2d) The sampling frequency was higher from 1985 through 1990 with both the River Input and NASQAN Programs sampling at this site Sampling frequency at this site peaked during the high flow year of 1989 Since 1990 the sampling frequency for all constituents has remained relatively constant with only the River Input Program sampling at this site Currently 20 to 30 samples per year are collected at this site (depending upon hydrologic conditions)
Regression Model A seven-parameter log-linear regression model is used to
characterize concentration data and estimate annual and monthly loads of nutrients and suspended sediment at the River Input monitoring stations This regression model (Estimator) incorporates a Minimum Variance Unbiased Estimator (MVUE) for correcting the bias induced by log transformation as well as an Adjusted Maximum Likelihood
Estimator (AMLE) for data sets containing censored observations (Darrell and others 1999) Descriptions of the Estimator model can be found in Darrell and others (1999) and Cohn and others (1992) The MVUE procedure is discussed in Gilroy and others (1990) Cohn and others (1989) and Bradu and Mundlak (1970) The AMLE procedure is discussed in Cohn and others (1992) and Cohn (1988)
The load estimation procedure involves two primary stepsmdashthe fitting of the model to the concentration data using ordinary least-squares regression and load estimation from the fit model (Darrell and others 1999) The model has the following form
ln[C] = β0+ β1ln (Q ) + Q β2[ln(Q )]2 + β3 (T-TQ ) +
β4 (T- )2 + β5 sin (2πT) + β6 cos (2πT) + ε (1)T
where
ln [] = natural logarithm function C = constituent concentration in milligrams per
liter (mgL) βrsquos = model coefficients Q = mean-daily streamflow in cubic feet per
second (ft3s) Q = centered streamflow T = time in decimal years T = centered time sin = sine function cos = cosine function and ε = independent random error
Daily concentration and load estimates are computed using the MVUE algorithm and the daily loads are summed to provide the monthly and annual fluxes (Darrell and others 1999) A standard error of prediction is also generated to indicate how well the estimated regression model fits a ldquotruerdquo regression model The standard error of prediction is a measure of the expected difference between an individual estimate and the estimated daily load (measured concentra-tion multiplied by the average daily discharge) This standard error of prediction is a function of the variability between the estimated and computed loads only on the days of measurement hence the standard error will be biased if there is any systematic sampling bias in the concentration data Also the standard error may not account for the variability on days without monitoring or from any systematic bias incorporated into the source concentration data set (Robertson and Roerish 1999) Possible sources of this bias include sampling techniques and designs that do not adequately represent the true environmental variability
Historical Load Estimates During the developmental period of these load-
estimation procedures it was known that the underlying principles of the model (the relation of concentration and
Methods of Load Estimation 5
streamflow) may change with time and that it would be inappropriate to assume that this relation would be constant over long periods On the basis of this observation and the amount of (monitoring) data available at that time a moving-window approach to load estimation for the years following these initial efforts was implemented (TA Cohn and JD Blomquist USGS oral and written communs 2000) A variation of this technique was employed and is described below
The historical load-estimation methodology is shown in figure 3 Each row represents a model calibration window and light-shaded boxes indicate years from which load estimates were recorded into a load data base The first model was calibrated over an 11-year period 1978 through 1988 and loads were predicted for all years During the following year a 10-year model was calibrated for 1980 through 1989 and the loads predicted for each constituent in 1989 the last year of the regression were entered into a data base with the 11 years of load estimates computed the year before This 10-year moving window approach was used for 6 years for model windows 1980ndash89 to 1985ndash94 and the loads estimated during the last year of each of these windows were recorded in the data base Starting with the 1985ndash95 model window each of the remaining Estimator models were calibrated using increasing window lengths with 1985 the reference year for the Chesapeake Bay Program as the base year for the model This method was used in the 1985ndash94 through the 1985ndash98 models Loads computed in
the last year of each of these calibration windows were entered into the load data base For each constituent the 1978 through 1998 historical load data base comprises annual and monthly load estimates from eleven 10- to 14-year model windows with the first window providing load estimates over its entire calibration window length and the remaining estimates extracted from the last year of calibration of each subsequent model
After differences between loads estimated throughout the 1985ndash98 14-year models and loads in the data base were noted a comparison between two overlapping but different regression window lengths was performed Annual loads for 11 constituents and all 4 Maryland River Input monitoring stations were computed for a 14-year 1985ndash98 model window and compared to loads estimated using a 10-year 1989ndash98 model window Annual loads were extracted from each group of models and percent differences were computed for the 11 constituents The differences between the load predictions from the two window lengths normally fell within the error bars of the standard error of prediction but the total phosphorus suspended-sediment ammonia and orthophosphorus models were found to give load predictions that were up to 50 percent different beyond the error bars of these models The greatest differences in load estimates were found at the edges of the 10-year window in 1989 and 1998 These differences indicated that a more systematic load computation procedure was required
A Revised Load Estimation Procedure for the Susquehanna Potomac Patuxent and Choptank Rivers 6
Revised Procedure for Load Estimation
The rationale for a more rigorous statistical approach in computing loads at the River Input monitoring stations is provided in this section A description of the revised procedure and a comparison of annual loads are also included
Background The concentration-discharge relation for some
constituents and rivers may change over time The Estimator model does not currently include a term allowing such flexibility however The model does allow the concentration-discharge relation to vary with time using the T and T 2 parameters but does not allow the slope of the Q and Q2 terms to change (β1 and β2 are constant) limiting the flexibility of the concentration-discharge relation over a given model window
After the model is fit to the raw concentration data within a calibration window each daily computed concentration is defined by the constant Q and Q2 parameters This relation is set by a specific decimal year value determining the T T 2 and seasonality parameters of the modelmdashthese parameters for any given day are constant Thus the concentration estimates for any given day are defined by the slope of the Q and Q2 parameters These slopes are the coefficients defined in the model fitting and are constant over a calibration window A ramification of this constancy is that for any given Estimator model the concentration-discharge relation for any particular date cannot change The T and T 2
terms can shift the curve through the model window but do not change the slope of the concentration-discharge relation With these defined concentrations the daily load estimates are computed using the MVUE algorithm (to account for the log-transformation bias) and summed and averaged to compute monthly and annual fluxes
Changes in the concentration-discharge relation (and time trends) can be caused by many things including changes in land use implementation of best management practices increases in sewage-effluent discharges improved sewage-treatment processes and climatic variation and change Long calibration windows have an increased chance of containing time periods with significantly different concentration-discharge relations Crossing through multiple concentration-discharge periods however will decrease the quality of the model fit therefore it is important to minimize the model calibration window length
Analyses of samples collected by the River Input Program at the Patuxent River indicated a large decrease in the concentrations of most constituents from the middle-to-late 1980rsquos to the early 1990rsquos which was probably due to the phosphorus detergent ban and sewage-treatment plant upgrades Before these changes occurred there was a strong inverse relation between concentration and discharge (as treatment-plant effluent was diluted during higher flows) This concentration-discharge relation likely changed however as urban and agricultural lands became more
important sources of nutrients in this basin Applying a single Estimator model to a period such as 1985 through 1998 will force the model to fit a constant concentration-discharge relation over a time period that has a varying relation
ldquoSteprdquo trends or rapid changes in concentration of nutrients or sediment over time can also present a problem for load estimation using the seven-parameter Estimator modelmdashparticularly when the model is calibrated over long periods Trends in concentration over time are fit using both the T and T 2 terms and offer a reasonable fit to gradual changes in concentration These two model terms are orthogonal and fit temporal variations evenly over the entire calibration period When a ldquosteprdquo change is encountered in the record this shift is actually represented by a gradual curvilinear relation with time The use of the T and T 2 terms is a considerable improvement over a simple linear trend because together they can provide a more suitable fit to the observed data and better estimates of actual loads The fitting of the T 2 term to a step trend however may cause inflation of estimates near the tails of the calibration window For the River Input monitoring stations the primary step trends are concentration and load decreases (from the mid 1980rsquos through the early 1990rsquos) that were most likely the result of the phosphorus detergent ban and incremental improvements in wastewater-treatment plants The effect of these trends on the estimated load is of primary concern Errors in load estimates are most likely to occur when a step trend occurs early in a long calibration window In this case loads are somewhat underestimated in early years and overestimated in later years
Several approaches to load estimation are possible where step trends are indicated The method chosen for this analysis shortens the calibration window in order to minimize the error in estimates at the tail of the calibration period This method is convenient because it can be standardized and can be applied without prior knowledge of changes in watershed management practices A second method attempts to identify step trends and calibrate separate models for pre- and post-step trend periods This method requires considerable knowledge of the forcing and timing of the step trends In most cases observed to date the precise timing of the response to management actions is unclear and may actually occur over a period of months to years It appears that phosphorus concentrations decreased signifi-cantly as a result of the phosphorus detergent ban for example however concentrations at some sites continued to decline for more than a year following the ban A third method develops additional variables and statistical tools using the current AMLEMVUE framework Such tools may fit step trends using separate model parameters (intercept terms) that are determined statistically rather than operationally Such tools should be investigated further as the period of water-quality record at the River Input monitoring stations expands to several decades
Multiple projects within the USGS have collected samples at the River Input monitoring stations and added
Revised Procedure for Load Estimation 7
data to the record As a result the sampling frequency throughout the period of record has varied considerably (fig 2) For the Susquehanna Patuxent and Choptank sites the sampling frequency reached a maximum in the late 1980rsquos by as much as two to three times the more recent sampling frequency thus placing inappropriate weight upon these years in the load estimates from a single Estimator model A moving calibration window gradually decreases and eventually eliminates the weight that these early measurements have on the load estimates
Two major conclusions can be drawn from this discussion The first is that load estimates near the tail of a calibration window have the greatest uncertainty As a result the end-of-model-window estimates that have traditionally been provided to the Chesapeake Bay scientific community by the program are not preferred The best load estimates for any individual yearmdashthose with minimum uncertaintymdashare those computed in the center of the regression The second major point is that the model window length needs to be minimized A 9-year window is considered optimal because the calibration data are nearly symmetrically distributed around the year for which estimated loads are needed while still providing sufficient length to encompass a reasonable number of samples and a full range of wet to dry periods
Description of Revised Methods The (revised) method consists of running multiple 9-year
calibration windows for each site and constituent An illustration of the procedure used to compute the revised loads is provided in figure 4 Each row represents a model window and the light-shaded boxes indicate the years in each calibration window from which load estimates were taken and entered into a data base For each constituent and site up to 14 models were run Load estimates were taken from the fifth (center) year of the calibration window and entered into a data base On the basis of the USGS concentration data base and the seven parameters in the model these estimates will have the least uncertainty
The first 4 years of estimates are in a tail of the calibration window and have greater uncertainty but are all the data allow Higher standard errors are usually observed during these first few years of estimates
The last 4 years of each model window are also in a tail of the calibration window have greater uncertainty and are considered preliminary and revised each year These estimates are marked by dark-shaded boxes in figure 4 When the last four years of load estimates are revised each year the greatest change can be expected for the last year of estimation from the previous year For example the load estimates from the last four years of the 1990ndash98 model
A Revised Load Estimation Procedure for the Susquehanna Potomac Patuxent and Choptank Rivers 8
windows (1995 through 1998) were compared to the loads predicted for these years in the 1991ndash99 model window For suspended sediment in the Choptank River the percent differences between the 1999 and 1998 model estimates were calculated to be -25 -16 6 and -04 percent for 1998 through 1995 respectively Likewise for dissolved nitrite plus nitrate in the Patuxent River percent differences were found to be 12 6 09 and 03 percent respectively This pattern supports the premise that the last year of load estimates in any calibration window has the greatest uncertainty
Comparison of Historical and Revised Load Estimates The annual load estimates for the four Maryland River
Input monitoring stations are provided in Appendix A The most up-to-date annual and monthly estimates can be accessed on the USGS River Input Program web site at httpwww-vausgsgovchesbayRIMP A comparison between the historical and revised load estimates is provided in Appendix B This table lists the percent differences between historical and revised annual load estimates for the four River Input monitoring sites and all available constituents
The historical and revised load estimates and error bars for a few selected constituents are shown in figure 5 These plots represent the full range of differences in estimates as well as both narrow and wide error bars As discussed earlier in this report these bars indicate the error in the regression but do not represent errors associated with sampling and laboratory analysis
In general it was found that the annual load estimates of total nitrogen at all four sites do not change considerably between methodologies As an example figure 5a shows a comparison of the revised and historical load estimates for total nitrogen (TN) at the Patuxent River near Bowie Md monitoring station The solid point and error bars represent the load value and standard error of the revised annual load estimate The error bars of the two sets of estimates usually overlap for this site and constituent despite the relatively narrow bar width For 1993 to 1995 however the revised method predicts loads with error bars that do not overlap the error bars of the historical values The load estimates for these 3 years were 10 to 12 percent different The error bars also decreased in size from 1978 to 1984 as estimates are taken progressively closer to the model centers and include
additional data points Finally the Patuxent River has shown significant reductions in concentrations of most constituents during the study period due predominantly to sewage-treatment plant upgrades The result of this point-source reduction effort can be seen in this plot as a downward trend in annual total nitrogen load estimates
Between methodologies estimates of annual loads of total kjeldahl nitrogen (TKN) typically show larger differences than estimates for TN Figure 5b shows a comparison of the load estimates and error bars for TKN in the Choptank River Differences between annual load estimates for TKN in the Choptank ranged from less than 1 to nearly 23 percent (see Appendix B) This consistency is typical at all four of the monitoring sites for this constituent The error bars for TKN tend to be wide and overlap for all but two of the years The error bars for the updated estimates become finer through the record then widen slightly during the last four years of estimates (the preliminary non-window-centered estimates)
The two methodologies estimated orthophosphorus (o-PO4) loads with the greatest differences among the 12 constituents Figure 5c shows the load estimates and error bars for o-PO4 at the Susquehanna River at Conwingo Dam monitoring station Differences between the load estimates vary from 3 to 77 percent with the greatest differences in 1994 and 1995 The error bars normally overlap but the variability may indicate limitations of this model in predicting o-PO4 loads especially o-PO4 loads discharging from the Susquehanna River at Conowingo Dam
Figure 5d shows a comparison of suspended-sediment load estimates for the Potomac River at Chain Bridge monitoring station This plot shows the large error bars that are typically computed for suspended-sediment estimates The largest estimate and bracket size was in 1985 a high discharge year Suspended-sediment concentrations vary a great deal in any river and a large number of samples are required for accurate estimates of load The current sampling program includes relatively few suspended-sediment samples from the Potomac River at Chain Bridge Considering that the Potomac River has been shown to provide the largest flux of sediment to the Chesapeake Bay (Darrell and others 1999) these large error bars are cause for concern
Revised Procedure for Load Estimation 9
A Revised Load Estimation Procedure for the Susquehanna Potomac Patuxent and Choptank Rivers 10
Summary and Conclusions
The US Geological Survey Chesapeake Bay River Input monitoring program has updated its data base for nutrient and suspended-sediment loads using an optimized methodology implementing the same seven-parameter log-linear regression model that has historically been used in the project This approach which uses a multiple-window center-estimate methodology was applied to the monitoring record of the River Input monitoring stations on the Susquehanna Potomac Patuxent and Choptank Rivers These four rivers have a wide range of watershed characteristics and include both the largest and smallest watersheds monitored in the program Concentrations of 12 nutrient and suspended-sediment constituents were included in the analysis and annual and monthly load estimates were revised
The regression model Estimator was used to compute loads in both the historical and revised methodologiesmdashthe new method merely optimizes the use of this model The historical load data base is composed of annual and monthly load estimates from eleven 10- to 14-year model windows with the first window providing load estimates over its entire calibration window length and the remaining estimates extracted from the last year of calibration of each subsequent model The revised methodology consists of multiple 9-year calibration windows For each site and constituent up to 14 models were computed Load estimates were taken from the fifth (center) year of each calibration window and entered into a data base The final four years of load estimates are preliminary and will be updated each year A new Estimator model is run annually for each site and constituent the most recent year is added and the previous four years of load estimates are revised The fifth year is considered the best estimate and kept in the data base The resulting data base is populated by load estimates that are known with more certainty than the historical load estimates
The new procedure was developed to minimize the effects that changing concentration-discharge relations in a river have on the regression Additionally the new methodology eliminates the use of end-of-regression load estimates which have been found to be overly sensitive to the fit of the time and time squared parameters and minimizes the effect of changing sampling frequencies in the monitoring record
It has been shown that the last year of estimates undergoes the most change from a previous year and this change usually decreases until made ldquofinalrdquo at the fifth year This finding is consistent with the premise that the last year of load estimates in any calibration window has the greatest uncertainty
A comparison between all of the historical and revised annual load estimates showed variable consistency The estimates for total nitrogen at all four sites are typically consistent and are within the error bars Total kjeldahl nitrogen and nitrite plus nitrate are also reasonably consistent Annual load estimates for suspended sediment
the three phosphorus species and ammonia have larger differences but these constituents also have wider error bars associated with them In general for some select years and monitoring stations the differences between load estimates are relatively large and are beyond the error bars but this is not commonmdashload estimates for these rivers do not change drastically when the new methodology is applied
This revised load computation methodology provides greater confidence in load estimates at the River Input Program monitoring stations Load estimation at these monitoring stations is an evolving process however This report documents various processes and shifting relations during the study period Load-estimation procedures will likely change in the future as the in-stream processes of these diverse rivers are more clearly understood and new statistical tools are implemented
References Cited
Bradu D and Mundlak Y 1970 Estimation of lognormal linear models Journal of the American Statistical Association 65 (329) p 198ndash211
Cohn TA 1988 Adjusted maximum likelihood estimation of the moments of lognormal populations from type I censored samples US Geological Survey Open-File Report 88ndash350 34 p
Cohn TA Delong LL Gilroy EJ Hirsch RM and Wells D 1989 Estimating constituent loads Water Resources Research v 25 no 5 p 937ndash942
Cohn TA Caulder DL Gilroy EJ Zynjuk LD and Summers RM 1992 The validity of a simple log-linear model for estimating fluvial constituent loads An empirical study involving nutrient loads entering Chesapeake Bay Water Resources Research v 28 no 9 p 2353ndash2364
Darrell LC Majedi BF Lizarraga JS and Blomquist JD 1999 Nutrient and suspended-sediment concentrations trends loads and yields from the nontidal part of the Susquehanna Potomac Patuxent and Choptank Rivers 1985ndash96 US Geological Survey Water-Resources Investigations Report 98ndash4177 38 p
Gilroy EJ Hirsch RM and Cohn TA 1990 Mean square error of regression-based constituent transport estimates Water Resources Research v 26 no 9 p 2069ndash2077
Lang DJ 1982 Water quality of the three major tributaries to the Chesapeake Bay the Susquehanna Potomac and James Rivers January 1979ndashApril 1981 US Geological Survey Water-Resources Investigations Report 82ndash32 64 p
Robertson DM and Roerish ED 1999 Influence of various water quality sampling strategies on load estimates for small streams Water Resources Research v 35 no 12 December p 3747ndash3759
Summary and Conclusions 11
APPENDIXES A AND B FOLLOW
A Revised Load Estimation Procedure for the Susquehanna Potomac Patuxent and Choptank Rivers 12
Appendix A Annual load estimates for the River Input monitoring stations on the Susquehanna Potomac Patuxent and Choptank Rivers
[kgyr kilograms per year +- plusminus the standard errors of prediction are also provided The standard error of prediction is a measure of the expected difference between an individual estimate and the estimated daily load Bold numbers indicate preliminary load estimates that will be revised For the most up-to-date annual and monthly load estimates see the USGS River Input Monitoring Program web site at httpwww-vausgsgovchesbayRIMP]
Parameter Constituent Reported as
P00600 Total nitrogen N
P00608 Dissolved ammonia N
P00613 Dissolved nitrite N
P00623 Dissolved kjeldahl nitrogen N
P00625 Total kjeldahl nitrogen N
P00631 Dissolved nitrite + nitrate N
P00665 Total phosphorus P
P00666 Dissolved phosphorus P
P00671 Orthophosphorus P
P00680 Total organic carbon C
P00955 Dissolved silica Si and SiO2
P80154 Suspended sediment not applicable
Appendix A 13
Appendix A Annual load estimates for the River Input monitoring stations on the Susquehanna Potomac Patuxent and Choptank RiversndashContinued
Standard Error of Prediction
Annual load +- +- ModelStation no Parameter Year (kgyr) (kgyr) Percent window
Susquehanna River at Conowingo Dam (01578310)
01578310 P00600 1979 76200000 3210000 4 79 - 87
01578310 P00600 1980 43400000 1560000 4 79 - 87
01578310 P00600 1981 50400000 1880000 4 79 - 87
01578310 P00600 1982 60200000 2480000 4 79 - 87
01578310 P00600 1983 77300000 3400000 4 79 - 87
01578310 P00600 1984 94500000 4070000 4 80 - 88
01578310 P00600 1985 58300000 2190000 4 81 - 89
01578310 P00600 1986 75700000 2360000 3 82 - 90
01578310 P00600 1987 57200000 1580000 3 83 - 91
01578310 P00600 1988 46700000 1360000 3 84 - 92
01578310 P00600 1989 64000000 1830000 3 85 - 93
01578310 P00600 1990 78300000 2210000 3 86 - 94
01578310 P00600 1991 48200000 1540000 3 87 - 95
01578310 P00600 1992 54100000 1470000 3 88 - 96
01578310 P00600 1993 82700000 2330000 3 89 - 97
01578310 P00600 1994 76100000 2060000 3 90 - 98
01578310 P00600 1995 41300000 1460000 4 91 - 99
01578310 P00600 1996 94500000 2810000 3 91 - 99
01578310 P00600 1997 43400000 1430000 3 91 - 99
01578310 P00600 1998 61300000 2160000 4 91 - 99
01578310 P00600 1999 40200000 1910000 5 91 - 99
01578310 P00608 1979 3320000 470000 14 79 - 87
01578310 P00608 1980 2450000 276000 11 79 - 87
01578310 P00608 1981 3160000 345000 11 79 - 87
01578310 P00608 1982 4150000 503000 12 79 - 87
01578310 P00608 1983 5490000 719000 13 79 - 87
01578310 P00608 1984 5980000 739000 12 80 - 88
01578310 P00608 1985 3210000 315000 10 81 - 89
01578310 P00608 1986 3970000 346000 9 82 - 90
01578310 P00608 1987 3010000 237000 8 83 - 91
01578310 P00608 1988 2470000 190000 8 84 - 92
01578310 P00608 1989 3360000 256000 8 85 - 93
01578310 P00608 1990 3570000 243000 7 86 - 94
01578310 P00608 1991 2520000 201000 8 87 - 95
01578310 P00608 1992 2540000 197000 8 88 - 96
01578310 P00608 1993 4420000 362000 8 89 - 97
A Revised Load Estimation Procedure for the Susquehanna Potomac Patuxent and Choptank Rivers 14
Appendix A Annual load estimates for the River Input monitoring stations on the Susquehanna Potomac Patuxent and Choptank RiversndashContinued
Standard Error of Prediction
Annual load +- +- ModelStation no Parameter Year (kgyr) (kgyr) Percent window
Susquehanna River at Conowingo Dam (01578310)mdashContinued
01578310 P00608 1994 3610000 283000 8 90 - 98
01578310 P00608 1995 1660000 151000 9 91 - 99
01578310 P00608 1996 3820000 325000 9 91 - 99
01578310 P00608 1997 1710000 148000 9 91 - 99
01578310 P00608 1998 2570000 247000 10 91 - 99
01578310 P00608 1999 1590000 202000 13 91 - 99
01578310 P00613 1985 661000 74900 11 85 - 93
01578310 P00613 1986 781000 62100 8 85 - 93
01578310 P00613 1987 677000 44700 7 85 - 93
01578310 P00613 1988 592000 41400 7 85 - 93
01578310 P00613 1989 774000 58500 8 85 - 93
01578310 P00613 1990 806000 58800 7 86 - 94
01578310 P00613 1991 554000 47900 9 87 - 95
01578310 P00613 1992 668000 60400 9 88 - 96
01578310 P00613 1993 694000 62000 9 89 - 97
01578310 P00613 1994 649000 65800 10 90 - 98
01578310 P00613 1995 407000 49100 12 91 - 99
01578310 P00613 1996 604000 64300 11 91 - 99
01578310 P00613 1997 414000 45800 11 91 - 99
01578310 P00613 1998 517000 64700 13 91 - 99
01578310 P00613 1999 479000 85200 18 91 - 99
01578310 P00623 1985 14700000 1200000 8 85 - 93
01578310 P00623 1986 19300000 1170000 6 85 - 93
01578310 P00623 1987 13800000 662000 5 85 - 93
01578310 P00623 1988 10800000 529000 5 85 - 93
01578310 P00623 1989 14200000 738000 5 85 - 93
01578310 P00623 1990 14500000 722000 5 86 - 94
01578310 P00623 1991 8000000 470000 6 87 - 95
01578310 P00623 1992 8050000 407000 5 88 - 96
01578310 P00623 1993 11900000 682000 6 89 - 97
01578310 P00623 1994 9770000 552000 6 90 - 98
01578310 P00623 1995 4730000 319000 7 91 - 99
01578310 P00623 1996 12100000 740000 6 91 - 99
01578310 P00623 1997 5010000 310000 6 91 - 99
01578310 P00623 1998 7740000 530000 7 91 - 99
01578310 P00623 1999 5350000 491000 9 91 - 99
Appendix A 15
Appendix A Annual load estimates for the River Input monitoring stations on the Susquehanna Potomac Patuxent and Choptank RiversndashContinued
Standard Error of Prediction
Annual load +- +- ModelStation no Parameter Year (kgyr) (kgyr) Percent window
Susquehanna River at Conowingo Dam (01578310)mdashContinued
01578310 P00625 1979 23100000 1870000 8 79 - 87
01578310 P00625 1980 14000000 984000 7 79 - 87
01578310 P00625 1981 17100000 1230000 7 79 - 87
01578310 P00625 1982 21200000 1680000 8 79 - 87
01578310 P00625 1983 28900000 2470000 9 79 - 87
01578310 P00625 1984 41100000 3280000 8 80 - 88
01578310 P00625 1985 21400000 1350000 6 81 - 89
01578310 P00625 1986 26200000 1450000 6 82 - 90
01578310 P00625 1987 18300000 912000 5 83 - 91
01578310 P00625 1988 14200000 709000 5 84 - 92
01578310 P00625 1989 19700000 1050000 5 85 - 93
01578310 P00625 1990 20100000 1020000 5 86 - 94
01578310 P00625 1991 10700000 610000 6 87 - 95
01578310 P00625 1992 11600000 540000 5 88 - 96
01578310 P00625 1993 19900000 1100000 6 89 - 97
01578310 P00625 1994 16300000 831000 5 90 - 98
01578310 P00625 1995 7230000 439000 6 91 - 99
01578310 P00625 1996 21700000 1290000 6 91 - 99
01578310 P00625 1997 8030000 453000 6 91 - 99
01578310 P00625 1998 13800000 902000 7 91 - 99
01578310 P00625 1999 9370000 814000 9 91 - 99
01578310 P00631 1979 54500000 2580000 5 79 - 87
01578310 P00631 1980 30200000 1230000 4 79 - 87
01578310 P00631 1981 34400000 1420000 4 79 - 87
01578310 P00631 1982 40200000 1830000 5 79 - 87
01578310 P00631 1983 49500000 2390000 5 79 - 87
01578310 P00631 1984 53700000 2510000 5 80 - 88
01578310 P00631 1985 35900000 1570000 4 81 - 89
01578310 P00631 1986 48600000 1840000 4 82 - 90
01578310 P00631 1987 38400000 1280000 3 83 - 91
01578310 P00631 1988 32600000 1140000 3 84 - 92
01578310 P00631 1989 44600000 1470000 3 85 - 93
01578310 P00631 1990 58900000 1830000 3 86 - 94
01578310 P00631 1991 38300000 1310000 3 87 - 95
01578310 P00631 1992 42300000 1240000 3 88 - 96
01578310 P00631 1993 61600000 1790000 3 89 - 97
01578310 P00631 1994 59100000 1640000 3 90 - 98
A Revised Load Estimation Procedure for the Susquehanna Potomac Patuxent and Choptank Rivers 16
Appendix A Annual load estimates for the River Input monitoring stations on the Susquehanna Potomac Patuxent and Choptank RiversndashContinued
Standard Error of Prediction
Annual load +- +- ModelStation no Parameter Year (kgyr) (kgyr) Percent window
Susquehanna River at Conowingo Dam (01578310)mdashContinued
01578310 P00631 1995 35400000 1340000 4 91 - 99
01578310 P00631 1996 74000000 2350000 3 91 - 99
01578310 P00631 1997 35800000 1280000 4 91 - 99
01578310 P00631 1998 46400000 1810000 4 91 - 99
01578310 P00631 1999 29500000 1560000 5 91 - 99
01578310 P00665 1979 4480000 551000 12 79 - 87
01578310 P00665 1980 1960000 195000 10 79 - 87
01578310 P00665 1981 2050000 230000 11 79 - 87
01578310 P00665 1982 2150000 220000 10 79 - 87
01578310 P00665 1983 2980000 353000 12 79 - 87
01578310 P00665 1984 3490000 424000 12 80 - 88
01578310 P00665 1985 1440000 127000 9 81 - 89
01578310 P00665 1986 2110000 178000 8 82 - 90
01578310 P00665 1987 1460000 104000 7 83 - 91
01578310 P00665 1988 1170000 86500 7 84 - 92
01578310 P00665 1989 1920000 155000 8 85 - 93
01578310 P00665 1990 2210000 172000 8 86 - 94
01578310 P00665 1991 1140000 95700 8 87 - 95
01578310 P00665 1992 1130000 83900 7 88 - 96
01578310 P00665 1993 3330000 380000 11 89 - 97
01578310 P00665 1994 2470000 256000 10 90 - 98
01578310 P00665 1995 840000 86300 10 91 - 99
01578310 P00665 1996 4160000 555000 13 91 - 99
01578310 P00665 1997 870000 78700 9 91 - 99
01578310 P00665 1998 1920000 231000 12 91 - 99
01578310 P00665 1999 1060000 152000 14 91 - 99
01578310 P00666 1979 1200000 135000 11 79 - 87
01578310 P00666 1980 524000 50600 10 79 - 87
01578310 P00666 1981 558000 56700 10 79 - 87
01578310 P00666 1982 571000 62500 11 79 - 87
01578310 P00666 1983 680000 80200 12 79 - 87
01578310 P00666 1984 764000 87200 11 80 - 88
01578310 P00666 1985 495000 52900 11 81 - 89
01578310 P00666 1986 660000 65800 10 82 - 90
01578310 P00666 1987 471000 42600 9 83 - 91
01578310 P00666 1988 345000 31700 9 84 - 92
Appendix A 17
Appendix A Annual load estimates for the River Input monitoring stations on the Susquehanna Potomac Patuxent and Choptank RiversndashContinued
Standard Error of Prediction
Annual load +- +- ModelStation no Parameter Year (kgyr) (kgyr) Percent window
Susquehanna River at Conowingo Dam (01578310)mdashContinued
01578310 P00666 1989 489000 42600 9 85 - 93
01578310 P00666 1990 697000 61900 9 86 - 94
01578310 P00666 1991 323000 30000 9 87 - 95
01578310 P00666 1992 425000 34400 8 88 - 96
01578310 P00666 1993 698000 57200 8 89 - 97
01578310 P00666 1994 675000 58700 9 90 - 98
01578310 P00666 1995 350000 34300 10 91 - 99
01578310 P00666 1996 994000 87700 9 91 - 99
01578310 P00666 1997 370000 33800 9 91 - 99
01578310 P00666 1998 552000 57200 10 91 - 99
01578310 P00666 1999 350000 48200 14 91 - 99
01578310 P00671 1979 1070000 166000 16 79 - 87
01578310 P00671 1980 478000 65100 14 79 - 87
01578310 P00671 1981 524000 73200 14 79 - 87
01578310 P00671 1982 544000 81500 15 79 - 87
01578310 P00671 1983 617000 96900 16 79 - 87
01578310 P00671 1984 646000 103000 16 80 - 88
01578310 P00671 1985 348000 51300 15 81 - 89
01578310 P00671 1986 432000 56700 13 82 - 90
01578310 P00671 1987 337000 42900 13 83 - 91
01578310 P00671 1988 222000 29600 13 84 - 92
01578310 P00671 1989 291000 37000 13 85 - 93
01578310 P00671 1990 425000 55500 13 86 - 94
01578310 P00671 1991 202000 30800 15 87 - 95
01578310 P00671 1992 260000 34300 13 88 - 96
01578310 P00671 1993 424000 55500 13 89 - 97
01578310 P00671 1994 404000 55300 14 90 - 98
01578310 P00671 1995 255000 43800 17 91 - 99
01578310 P00671 1996 669000 103000 15 91 - 99
01578310 P00671 1997 259000 42000 16 91 - 99
01578310 P00671 1998 365000 65800 18 91 - 99
01578310 P00671 1999 180000 41200 23 91 - 99
01578310 P00680 1985 92400000 4900000 5 85 - 93
01578310 P00680 1986 135000000 5830000 4 85 - 93
01578310 P00680 1987 93900000 3170000 3 85 - 93
01578310 P00680 1988 75900000 2630000 3 85 - 93
A Revised Load Estimation Procedure for the Susquehanna Potomac Patuxent and Choptank Rivers 18
Appendix A Annual load estimates for the River Input monitoring stations on the Susquehanna Potomac Patuxent and Choptank RiversndashContinued
Standard Error of Prediction
Annual load +- +- ModelStation no Parameter Year (kgyr) (kgyr) Percent window
Susquehanna River at Conowingo Dam (01578310)mdashContinued
01578310 P00680 1989 134000000 5180000 4 85 - 93
01578310 P00680 1990 149000000 5320000 4 86 - 94
01578310 P00680 1991 80400000 2660000 3 87 - 95
01578310 P00680 1992 102000000 2970000 3 88 - 96
01578310 P00680 1993 218000000 8000000 4 89 - 97
01578310 P00680 1994 198000000 6730000 3 90 - 98
01578310 P00680 1995 83600000 3260000 4 91 - 99
01578310 P00680 1996 267000000 10600000 4 91 - 99
01578310 P00680 1997 85300000 3110000 4 91 - 99
01578310 P00680 1998 140000000 5980000 4 91 - 99
01578310 P00680 1999 76300000 4300000 6 91 - 99
Appendix A 19
Appendix A Annual load estimates for the River Input monitoring stations on the Susquehanna Potomac Patuxent and Choptank RiversndashContinued
Standard Error of Prediction
Annual load Annual load +- +- Model Station no Parameter Year (kgyr SiO2) (kgyr Si) (kgyr SiO2) Percent window
Susquehanna River at Conowingo Dam (01578310)ndashContinued
01578310 P00955 1979 194000000 90700000 16800000 9 79 - 87
01578310 P00955 1980 87600000 41000000 6580000 8 79 - 87
01578310 P00955 1981 89400000 41800000 6830000 8 79 - 87
01578310 P00955 1982 100000000 47000000 7910000 8 79 - 87
01578310 P00955 1983 130000000 60900000 11000000 8 79 - 87
01578310 P00955 1984 175000000 81700000 15300000 9 80 - 88
01578310 P00955 1985 107000000 50200000 8200000 8 81 - 89
01578310 P00955 1986 160000000 74900000 11600000 7 82 - 90
01578310 P00955 1987 112000000 52300000 6750000 6 83 - 91
01578310 P00955 1988 93700000 43800000 5860000 6 84 - 92
01578310 P00955 1989 139000000 64900000 8290000 6 85 - 93
01578310 P00955 1990 189000000 88200000 11600000 6 86 - 94
01578310 P00955 1991 101000000 47200000 7380000 7 87 - 95
01578310 P00955 1992 116000000 54100000 7280000 6 88 - 96
01578310 P00955 1993 204000000 95500000 15200000 7 89 - 97
01578310 P00955 1994 186000000 87100000 12900000 7 90 - 98
01578310 P00955 1995 94500000 44200000 8110000 9 91 - 99
01578310 P00955 1996 259000000 121000000 20400000 8 91 - 99
01578310 P00955 1997 91600000 42800000 7470000 8 91 - 99
01578310 P00955 1998 135000000 63300000 12600000 9 91 - 99
01578310 P00955 1999 72600000 33900000 8920000 12 91 - 99
A Revised Load Estimation Procedure for the Susquehanna Potomac Patuxent and Choptank Rivers 20
Appendix A Annual load estimates for the River Input monitoring stations on the Susquehanna Potomac Patuxent and Choptank RiversndashContinued
Standard Error of Prediction
Annual load +- +- ModelStation no Parameter Year (kgyr) (kgyr) Percent window
Susquehanna River at Conowingo Dam (01578310)ndashContinued
01578310 P80154 1979 2700000000 458000000 17 79 - 87
01578310 P80154 1980 878000000 95500000 11 79 - 87
01578310 P80154 1981 942000000 140000000 15 79 - 87
01578310 P80154 1982 938000000 107000000 11 79 - 87
01578310 P80154 1983 1730000000 236000000 14 79 - 87
01578310 P80154 1984 2850000000 467000000 16 80 - 88
01578310 P80154 1985 516000000 40700000 8 81 - 89
01578310 P80154 1986 1110000000 122000000 11 82 - 90
01578310 P80154 1987 535000000 43400000 8 83 - 91
01578310 P80154 1988 397000000 30100000 8 84 - 92
01578310 P80154 1989 942000000 67700000 7 85 - 93
01578310 P80154 1990 861000000 49800000 6 86 - 94
01578310 P80154 1991 419000000 27400000 7 87 - 95
01578310 P80154 1992 422000000 25300000 6 88 - 96
01578310 P80154 1993 3080000000 340000000 11 89 - 97
01578310 P80154 1994 1970000000 192000000 10 90 - 98
01578310 P80154 1995 397000000 34600000 9 91 - 99
01578310 P80154 1996 3680000000 584000000 16 91 - 99
01578310 P80154 1997 364000000 26400000 7 91 - 99
01578310 P80154 1998 1110000000 123000000 11 91 - 99
01578310 P80154 1999 349000000 44600000 13 91 - 99
Appendix A 21
Appendix A Annual load estimates for the River Input monitoring stations on the Susquehanna Potomac Patuxent and Choptank RiversndashContinued
Standard Error of Prediction
Annual load +- +- Model Station no Parameter Year (kgyr) (kgyr) Percent window
Potomac River at Chain Bridge (01646580)
01646580 P00600 1979 41100000 2220000 5 79 - 87
01646580 P00600 1980 20200000 812000 4 79 - 87
01646580 P00600 1981 10600000 386000 4 79 - 87
01646580 P00600 1982 22200000 842000 4 79 - 87
01646580 P00600 1983 34200000 1340000 4 79 - 87
01646580 P00600 1984 40300000 1780000 4 80 - 88
01646580 P00600 1985 27700000 1500000 5 81 - 89
01646580 P00600 1986 16400000 622000 4 82 - 90
01646580 P00600 1987 23200000 792000 3 83 - 91
01646580 P00600 1988 17200000 657000 4 84 - 92
01646580 P00600 1989 23500000 711000 3 85 - 93
01646580 P00600 1990 19400000 475000 2 86 - 94
01646580 P00600 1991 16600000 503000 3 87 - 95
01646580 P00600 1992 17700000 496000 3 88 - 96
01646580 P00600 1993 36700000 1200000 3 89 - 97
01646580 P00600 1994 33900000 992000 3 90 - 98
01646580 P00600 1995 17800000 443000 2 91 - 99
01646580 P00600 1996 60900000 1580000 3 91 - 99
01646580 P00600 1997 18700000 469000 3 91 - 99
01646580 P00600 1998 34700000 993000 3 91 - 99
01646580 P00600 1999 9770000 284000 3 91 - 99
01646580 P00608 1979 1480000 352000 24 79 - 87
01646580 P00608 1980 686000 104000 15 79 - 87
01646580 P00608 1981 353000 46800 13 79 - 87
01646580 P00608 1982 728000 104000 14 79 - 87
01646580 P00608 1983 1080000 165000 15 79 - 87
01646580 P00608 1984 1320000 240000 20 80 - 88
01646580 P00608 1985 863000 322000 37 81 - 89
01646580 P00608 1986 375000 79700 21 82 - 90
01646580 P00608 1987 586000 125000 21 83 - 91
01646580 P00608 1988 473000 115000 24 84 - 92
01646580 P00608 1989 484000 73100 15 85 - 93
01646580 P00608 1990 323000 51400 16 86 - 94
01646580 P00608 1991 288000 54000 19 87 - 95
01646580 P00608 1992 290000 44300 15 88 - 96
01646580 P00608 1993 829000 156000 19 89 - 97
A Revised Load Estimation Procedure for the Susquehanna Potomac Patuxent and Choptank Rivers 22
Appendix A Annual load estimates for the River Input monitoring stations on the Susquehanna Potomac Patuxent and Choptank RiversndashContinued
Standard Error of Prediction
Annual load +- +- Model Station no Parameter Year (kgyr) (kgyr) Percent window
Potomac River at Chain Bridge (01646580)mdashContinued
01646580 P00608 1994 736000 114000 16 90 - 98
01646580 P00608 1995 261000 28900 11 91 - 99
01646580 P00608 1996 1470000 263000 18 91 - 99
01646580 P00608 1997 359000 43300 12 91 - 99
01646580 P00608 1998 1040000 138000 13 91 - 99
01646580 P00608 1999 247000 29800 12 91 - 99
01646580 P00613 1985 135000 24400 18 85 - 93
01646580 P00613 1986 110000 15300 14 85 - 93
01646580 P00613 1987 157000 18600 12 85 - 93
01646580 P00613 1988 120000 15100 13 85 - 93
01646580 P00613 1989 154000 18500 12 85 - 93
01646580 P00613 1990 119000 12700 11 86 - 94
01646580 P00613 1991 123000 15600 13 87 - 95
01646580 P00613 1992 111000 9640 9 88 - 96
01646580 P00613 1993 263000 28600 11 89 - 97
01646580 P00613 1994 245000 23600 10 90 - 98
01646580 P00613 1995 134000 11800 9 91 - 99
01646580 P00613 1996 467000 41100 9 91 - 99
01646580 P00613 1997 147000 12600 9 91 - 99
01646580 P00613 1998 278000 270000 10 91 - 99
01646580 P00613 1999 82100 9260 11 91 - 99
01646580 P00623 1983 7490000 575000 8 83 - 91
01646580 P00623 1984 8180000 549000 7 83 - 91
01646580 P00623 1985 5150000 431000 8 83 - 91
01646580 P00623 1986 3090000 190000 6 83 - 91
01646580 P00623 1987 4230000 271000 6 83 - 91
01646580 P00623 1988 3030000 223000 7 84 - 92
01646580 P00623 1989 3590000 233000 6 85 - 93
01646580 P00623 1990 2550000 149000 6 86 - 94
01646580 P00623 1991 1860000 151000 8 87 - 95
01646580 P00623 1992 2020000 129000 6 88 - 96
01646580 P00623 1993 4210000 327000 8 89 - 97
01646580 P00623 1994 3890000 246000 6 90 - 98
01646580 P00623 1995 2020000 97500 5 91 - 99
01646580 P00623 1996 9140000 628000 7 91 - 99
01646580 P00623 1997 2480000 129000 5 91 - 99
Appendix A 23
Appendix A Annual load estimates for the River Input monitoring stations on the Susquehanna Potomac Patuxent and Choptank RiversndashContinued
Standard Error of Prediction
Annual load +- +- Model Station no Parameter Year (kgyr) (kgyr) Percent window
Potomac River at Chain Bridge (01646580)mdashContinued
01646580 P00623 1998 5580000 318000 6 91 - 99
01646580 P00623 1999 1900000 103000 5 91 - 99
01646580 P00625 1979 15000000 1420000 9 79 - 87
01646580 P00625 1980 7170000 485000 7 79 - 87
01646580 P00625 1981 3850000 229000 6 79 - 87
01646580 P00625 1982 8810000 611000 7 79 - 87
01646580 P00625 1983 14900000 1060000 7 79 - 87
01646580 P00625 1984 19800000 1780000 9 80 - 88
01646580 P00625 1985 13500000 2170000 16 81 - 89
01646580 P00625 1986 5780000 531000 9 82 - 90
01646580 P00625 1987 8870000 839000 9 83 - 91
01646580 P00625 1988 6710000 697000 10 84 - 92
01646580 P00625 1989 7130000 513000 7 85 - 93
01646580 P00625 1990 4000000 239000 6 86 - 94
01646580 P00625 1991 3300000 254000 8 87 - 95
01646580 P00625 1992 3700000 270000 7 88 - 96
01646580 P00625 1993 9720000 862000 9 89 - 97
01646580 P00625 1994 8160000 623000 8 90 - 98
01646580 P00625 1995 3680000 217000 6 91 - 99
01646580 P00625 1996 21700000 2120000 10 91 - 99
01646580 P00625 1997 4510000 304000 7 91 - 99
01646580 P00625 1998 11600000 789000 7 91 - 99
01646580 P00625 1999 2870000 180000 6 91 - 99
01646580 P00631 1979 27400000 2660000 10 79 - 87
01646580 P00631 1980 13800000 1040000 8 79 - 87
01646580 P00631 1981 7110000 479000 7 79 - 87
01646580 P00631 1982 14000000 950000 7 79 - 87
01646580 P00631 1983 20100000 1360000 7 79 - 87
01646580 P00631 1984 21200000 1460000 7 80 - 88
01646580 P00631 1985 16600000 1230000 7 81 - 89
01646580 P00631 1986 10600000 682000 6 82 - 90
01646580 P00631 1987 13900000 741000 5 83 - 91
01646580 P00631 1988 10300000 600000 6 84 - 92
01646580 P00631 1989 16700000 810000 5 85 - 93
01646580 P00631 1990 17300000 781000 5 86 - 94
01646580 P00631 1991 13500000 603000 4 87 - 95
A Revised Load Estimation Procedure for the Susquehanna Potomac Patuxent and Choptank Rivers 24
Appendix A Annual load estimates for the River Input monitoring stations on the Susquehanna Potomac Patuxent and Choptank RiversndashContinued
Standard Error of Prediction
Annual load +- +- Model Station no Parameter Year (kgyr) (kgyr) Percent window
Potomac River at Chain Bridge (01646580)mdashContinued
01646580 P00631 1992 14400000 541000 4 88 - 96
01646580 P00631 1993 26400000 996000 4 89 - 97
01646580 P00631 1994 24800000 836000 3 90 - 98
01646580 P00631 1995 15000000 490000 3 91 - 99
01646580 P00631 1996 41500000 1220000 3 91 - 99
01646580 P00631 1997 14300000 458000 3 91 - 99
01646580 P00631 1998 21600000 790000 4 91 - 99
01646580 P00631 1999 6730000 262000 4 91 - 99
01646580 P00665 1979 4010000 499000 12 79 - 87
01646580 P00665 1980 1410000 124000 9 79 - 87
01646580 P00665 1981 680000 53900 8 79 - 87
01646580 P00665 1982 1740000 167000 10 79 - 87
01646580 P00665 1983 3020000 286000 9 79 - 87
01646580 P00665 1984 3780000 456000 12 80 - 88
01646580 P00665 1985 3690000 1010000 27 81 - 89
01646580 P00665 1986 877000 111000 13 82 - 90
01646580 P00665 1987 1560000 213000 14 83 - 91
01646580 P00665 1988 1350000 228000 17 84 - 92
01646580 P00665 1989 1480000 154000 10 85 - 93
01646580 P00665 1990 954000 110000 11 86 - 94
01646580 P00665 1991 654000 82600 13 87 - 95
01646580 P00665 1992 800000 97400 12 88 - 96
01646580 P00665 1993 2390000 343000 14 89 - 97
01646580 P00665 1994 1800000 215000 12 90 - 98
01646580 P00665 1995 680000 67800 10 91 - 99
01646580 P00665 1996 7110000 1490000 21 91 - 99
01646580 P00665 1997 954000 140000 15 91 - 99
01646580 P00665 1998 3020000 328000 11 91 - 99
01646580 P00665 1999 659000 62400 9 91 - 99
01646580 P00666 1979 976000 116000 12 79 - 87
01646580 P00666 1980 424000 36400 9 79 - 87
01646580 P00666 1981 263000 20100 8 79 - 87
01646580 P00666 1982 547000 45100 8 79 - 87
01646580 P00666 1983 878000 79300 9 79 - 87
01646580 P00666 1984 955000 91900 10 80 - 88
01646580 P00666 1985 808000 139000 17 81 - 89
Appendix A 25
Appendix A Annual load estimates for the River Input monitoring stations on the Susquehanna Potomac Patuxent and Choptank RiversndashContinued
Standard Error of Prediction
Annual load +- +- Model Station no Parameter Year (kgyr) (kgyr) Percent window
Potomac River at Chain Bridge (01646580)mdashContinued
01646580 P00666 1986 342000 35400 10 82 - 90
01646580 P00666 1987 482000 50300 10 83 - 91
01646580 P00666 1988 363000 52000 14 84 - 92
01646580 P00666 1989 555000 55800 10 85 - 93
01646580 P00666 1990 541000 68100 13 86 - 94
01646580 P00666 1991 298000 41900 14 87 - 95
01646580 P00666 1992 371000 42700 12 88 - 96
01646580 P00666 1993 645000 88200 14 89 - 97
01646580 P00666 1994 530000 58600 11 90 - 98
01646580 P00666 1995 251000 23600 9 91 - 99
01646580 P00666 1996 1510000 223000 15 91 - 99
01646580 P00666 1997 353000 43000 12 91 - 99
01646580 P00666 1998 917000 95600 10 91 - 99
01646580 P00666 1999 397000 40000 10 91 - 99
01646580 P00671 1979 659000 106000 16 79 - 87
01646580 P00671 1980 291000 36100 12 79 - 87
01646580 P00671 1981 183000 19700 11 79 - 87
01646580 P00671 1982 382000 40400 11 79 - 87
01646580 P00671 1983 613000 66200 11 79 - 87
01646580 P00671 1984 633000 68300 11 80 - 88
01646580 P00671 1985 542000 99500 18 81 - 89
01646580 P00671 1986 218000 26200 12 82 - 90
01646580 P00671 1987 311000 34100 11 83 - 91
01646580 P00671 1988 238000 36300 15 84 - 92
01646580 P00671 1989 445000 47800 11 85 - 93
01646580 P00671 1990 587000 108000 18 86 - 94
01646580 P00671 1991 254000 41600 16 87 - 95
01646580 P00671 1992 308000 37200 12 88 - 96
01646580 P00671 1993 543000 76300 14 89 - 97
01646580 P00671 1994 455000 54500 12 90 - 98
01646580 P00671 1995 187000 18900 10 91 - 99
01646580 P00671 1996 1160000 196000 17 91 - 99
01646580 P00671 1997 244000 32000 13 91 - 99
01646580 P00671 1998 643000 72100 11 91 - 99
01646580 P00671 1999 242000 25700 11 91 - 99
A Revised Load Estimation Procedure for the Susquehanna Potomac Patuxent and Choptank Rivers 26
Appendix A Annual load estimates for the River Input monitoring stations on the Susquehanna Potomac Patuxent and Choptank RiversndashContinued
Standard Error of Prediction
Annual load +- +- Model Station no Parameter Year (kgyr) (kgyr) Percent window
Potomac River at Chain Bridge (01646580)mdashContinued
01646580 P00680 1988 38300000 3820000 10 88 - 96
01646580 P00680 1989 55100000 3470000 6 88 - 96
01646580 P00680 1990 48400000 2760000 6 88 - 96
01646580 P00680 1991 44300000 2920000 7 88 - 96
01646580 P00680 1992 44900000 2540000 6 88 - 96
01646580 P00680 1993 104000000 7250000 7 89 - 97
01646580 P00680 1994 81300000 4330000 5 90 - 98
01646580 P00680 1995 32300000 1370000 4 91 - 99
01646580 P00680 1996 166000000 11500000 7 91 - 99
01646580 P00680 1997 34600000 1710000 5 91 - 99
01646580 P00680 1998 78400000 3950000 5 91 - 99
01646580 P00680 1999 21500000 1030000 5 91 - 99
Appendix A 27
Appendix A Annual load estimates for the River Input monitoring stations on the Susquehanna Potomac Patuxent and Choptank RiversndashContinued
Standard Error of Prediction
Annual load Annual load +- +- Model Station no Parameter Year (kgyr SiO2) (kgyr Si) (kgyr SiO2) Percent window
Potomac River at Chain Bridge (01646580)mdashContinued
01646580 P00955 1979 155000000 72300000 30000000 19 79 - 87
01646580 P00955 1980 57000000 26700000 8700000 15 79 - 87
01646580 P00955 1981 29100000 13600000 4070000 14 79 - 87
01646580 P00955 1982 65000000 30400000 11100000 17 79 - 87
01646580 P00955 1983 107000000 49900000 18100000 17 79 - 87
01646580 P00955 1984 140000000 65300000 29400000 21 80 - 88
01646580 P00955 1985 140000000 65200000 62900000 45 81 - 89
01646580 P00955 1986 39700000 18600000 8330000 21 82 - 90
01646580 P00955 1987 68500000 32000000 13500000 20 83 - 91
01646580 P00955 1988 67800000 31700000 18800000 28 84 - 92
01646580 P00955 1989 95700000 44700000 15400000 16 85 - 93
01646580 P00955 1990 79200000 37000000 15000000 19 86 - 94
01646580 P00955 1991 49500000 23200000 8340000 17 87 - 95
01646580 P00955 1992 56900000 26600000 6730000 12 88 - 96
01646580 P00955 1993 104000000 48700000 15600000 15 89 - 97
01646580 P00955 1994 95700000 44700000 12800000 13 90 - 98
01646580 P00955 1995 46500000 21700000 5760000 12 91 - 99
01646580 P00955 1996 265000000 124000000 54600000 21 91 - 99
01646580 P00955 1997 50200000 23500000 7080000 14 91 - 99
01646580 P00955 1998 127000000 59500000 19400000 15 91 - 99
01646580 P00955 1999 29600000 13800000 4200000 14 91 - 99
A Revised Load Estimation Procedure for the Susquehanna Potomac Patuxent and Choptank Rivers 28
Appendix A Annual load estimates for the River Input monitoring stations on the Susquehanna Potomac Patuxent and Choptank RiversndashContinued
Standard Error of Prediction
Annual load +- +- Model Station no Parameter Year (kgyr) (kgyr) Percent window
Potomac River at Chain Bridge (01646580)mdashContinued
01646580 P80154 1979 4130000000 833000000 20 79 - 87
01646580 P80154 1980 1090000000 148000000 14 79 - 87
01646580 P80154 1981 369000000 56900000 15 79 - 87
01646580 P80154 1982 1480000000 322000000 22 79 - 87
01646580 P80154 1983 2980000000 564000000 19 79 - 87
01646580 P80154 1984 7450000000 3110000000 42 80 - 88
01646580 P80154 1985 7530000000 5480000000 73 81 - 89
01646580 P80154 1986 684000000 229000000 34 82 - 90
01646580 P80154 1987 2100000000 737000000 35 83 - 91
01646580 P80154 1988 3050000000 1080000000 35 84 - 92
01646580 P80154 1989 1880000000 435000000 23 85 - 93
01646580 P80154 1990 876000000 228000000 26 86 - 94
01646580 P80154 1991 534000000 115000000 22 87 - 95
01646580 P80154 1992 378000000 65800000 17 88 - 96
01646580 P80154 1993 2080000000 382000000 18 89 - 97
01646580 P80154 1994 1300000000 224000000 17 90 - 98
01646580 P80154 1995 284000000 43600000 15 91 - 99
01646580 P80154 1996 5420000000 1650000000 30 91 - 99
01646580 P80154 1997 312000000 59300000 19 91 - 99
01646580 P80154 1998 1240000000 219000000 18 91 - 99
01646580 P80154 1999 73500000 12400000 17 91 - 99
Appendix A 29
Appendix A Annual load estimates for the River Input monitoring stations on the Susquehanna Potomac Patuxent and Choptank RiversndashContinued
Standard Error of Prediction
Annual load +- +- ModelStation no Parameter Year (kgyr) (kgyr) Percent window
Patuxent River near Bowie (01594440)
01594440 P00600 1978 989000 69800 7 78 - 86
01594440 P00600 1979 1560000 102000 7 78 - 86
01594440 P00600 1980 952000 38300 4 78 - 86
01594440 P00600 1981 615000 27500 4 78 - 86
01594440 P00600 1982 812000 37400 5 78 - 86
01594440 P00600 1983 1390000 73100 5 79 - 87
01594440 P00600 1984 1330000 48900 4 80 - 88
01594440 P00600 1985 805000 23600 3 81 - 89
01594440 P00600 1986 778000 21000 3 82 - 90
01594440 P00600 1987 941000 23100 2 83 - 91
01594440 P00600 1988 887000 22000 2 84 - 92
01594440 P00600 1989 1160000 31700 3 85 - 93
01594440 P00600 1990 908000 24100 3 86 - 94
01594440 P00600 1991 679000 19700 3 87 - 95
01594440 P00600 1992 591000 17200 3 88 - 96
01594440 P00600 1993 838000 26000 3 89 - 97
01594440 P00600 1994 778000 21300 3 90 - 98
01594440 P00600 1995 480000 13300 3 91 - 99
01594440 P00600 1996 1040000 25800 2 91 - 99
01594440 P00600 1997 638000 17100 3 91 - 99
01594440 P00600 1998 676000 21400 3 91 - 99
01594440 P00600 1999 484000 20500 4 91 - 99
01594440 P00608 1980 210000 34200 16 80 - 88
01594440 P00608 1981 157000 18800 12 80 - 88
01594440 P00608 1982 162000 15400 10 80 - 88
01594440 P00608 1983 202000 20300 10 80 - 88
01594440 P00608 1984 172000 15500 9 80 - 88
01594440 P00608 1985 122000 8980 7 81 - 89
01594440 P00608 1986 106000 7520 7 82 - 90
01594440 P00608 1987 99700 6920 7 83 - 91
01594440 P00608 1988 76800 5980 8 84 - 92
01594440 P00608 1989 73900 5910 8 85 - 93
01594440 P00608 1990 57400 4410 8 86 - 94
01594440 P00608 1991 48900 4450 9 87 - 95
01594440 P00608 1992 40500 3520 9 88 - 96
01594440 P00608 1993 73700 7000 10 89 - 97
A Revised Load Estimation Procedure for the Susquehanna Potomac Patuxent and Choptank Rivers 30
Appendix A Annual load estimates for the River Input monitoring stations on the Susquehanna Potomac Patuxent and Choptank RiversndashContinued
Standard Error of Prediction
Annual load +- +- ModelStation no Parameter Year (kgyr) (kgyr) Percent window
Patuxent River near Bowie (01594440)mdashContinued
01594440 P00608 1994 74300 7570 10 90 - 98
01594440 P00608 1995 39600 4090 10 91 - 99
01594440 P00608 1996 82900 7650 9 91 - 99
01594440 P00608 1997 52800 5370 10 91 - 99
01594440 P00608 1998 51100 6020 12 91 - 99
01594440 P00608 1999 27500 3960 14 91 - 99
01594440 P00613 1985 24900 3110 13 85 - 93
01594440 P00613 1986 17500 1560 9 85 - 93
01594440 P00613 1987 14300 1060 7 85 - 93
01594440 P00613 1988 11700 915 8 85 - 93
01594440 P00613 1989 12600 1210 10 85 - 93
01594440 P00613 1990 8410 680 8 86 - 94
01594440 P00613 1991 7120 635 9 87 - 95
01594440 P00613 1992 5980 470 8 88 - 96
01594440 P00613 1993 11200 916 8 89 - 97
01594440 P00613 1994 11300 973 9 90 - 98
01594440 P00613 1995 6820 623 9 91 - 99
01594440 P00613 1996 15000 1200 8 91 - 99
01594440 P00613 1997 9450 850 9 91 - 99
01594440 P00613 1998 9310 972 10 91 - 99
01594440 P00613 1999 5250 700 13 91 - 99
01594440 P00623 1985 253000 18100 7 85 - 93
01594440 P00623 1986 233000 11700 5 85 - 93
01594440 P00623 1987 258000 10600 4 85 - 93
01594440 P00623 1988 241000 10200 4 85 - 93
01594440 P00623 1989 296000 14800 5 85 - 93
01594440 P00623 1990 219000 9610 4 86 - 94
01594440 P00623 1991 155000 8100 5 87 - 95
01594440 P00623 1992 132000 6640 5 88 - 96
01594440 P00623 1993 215000 11800 5 89 - 97
01594440 P00623 1994 193000 10300 5 90 - 98
01594440 P00623 1995 110000 6140 6 91 - 99
01594440 P00623 1996 269000 13800 5 91 - 99
01594440 P00623 1997 150000 8110 5 91 - 99
01594440 P00623 1998 161000 10400 6 91 - 99
01594440 P00623 1999 109000 9310 9 91 - 99
Appendix A 31
Appendix A Annual load estimates for the River Input monitoring stations on the Susquehanna Potomac Patuxent and Choptank RiversndashContinued
Standard Error of Prediction
Annual load +- +- ModelStation no Parameter Year (kgyr) (kgyr) Percent window
Patuxent River near Bowie (01594440)mdashContinued
01594440 P00625 1978 427000 53300 12 78 - 86
01594440 P00625 1979 736000 91200 12 78 - 86
01594440 P00625 1980 376000 24400 6 78 - 86
01594440 P00625 1981 223000 15800 7 78 - 86
01594440 P00625 1982 305000 22500 7 78 - 86
01594440 P00625 1983 581000 52700 9 79 - 87
01594440 P00625 1984 557000 34600 6 80 - 88
01594440 P00625 1985 293000 15300 5 81 - 89
01594440 P00625 1986 272000 13200 5 82 - 90
01594440 P00625 1987 336000 14200 4 83 - 91
01594440 P00625 1988 296000 12300 4 84 - 92
01594440 P00625 1989 423000 22300 5 85 - 93
01594440 P00625 1990 298000 14000 5 86 - 94
01594440 P00625 1991 199000 11300 6 87 - 95
01594440 P00625 1992 182000 10100 6 88 - 96
01594440 P00625 1993 304000 18400 6 89 - 97
01594440 P00625 1994 276000 15400 6 90 - 98
01594440 P00625 1995 150000 8580 6 91 - 99
01594440 P00625 1996 409000 21500 5 91 - 99
01594440 P00625 1997 213000 11600 5 91 - 99
01594440 P00625 1998 237000 15600 7 91 - 99
01594440 P00625 1999 169000 15500 9 91 - 99
01594440 P00631 1980 539000 39000 7 80 - 88
01594440 P00631 1981 394000 20600 5 80 - 88
01594440 P00631 1982 504000 21000 4 80 - 88
01594440 P00631 1983 773000 35200 5 80 - 88
01594440 P00631 1984 754000 30400 4 80 - 88
01594440 P00631 1985 510000 15900 3 81 - 89
01594440 P00631 1986 510000 14600 3 82 - 90
01594440 P00631 1987 607000 15800 3 83 - 91
01594440 P00631 1988 596000 15800 3 84 - 92
01594440 P00631 1989 733000 20800 3 85 - 93
01594440 P00631 1990 603000 16700 3 86 - 94
01594440 P00631 1991 480000 13800 3 87 - 95
01594440 P00631 1992 400000 12600 3 88 - 96
01594440 P00631 1993 528000 17700 3 89 - 97
01594440 P00631 1994 492000 14800 3 90 - 98
A Revised Load Estimation Procedure for the Susquehanna Potomac Patuxent and Choptank Rivers 32
Appendix A Annual load estimates for the River Input monitoring stations on the Susquehanna Potomac Patuxent and Choptank RiversndashContinued
Standard Error of Prediction
Annual load +- +- ModelStation no Parameter Year (kgyr) (kgyr) Percent window
Patuxent River near Bowie (01594440)mdashContinued
01594440 P00631 1995 332000 10500 3 91 - 99
01594440 P00631 1996 635000 17800 3 91 - 99
01594440 P00631 1997 424000 12900 3 91 - 99
01594440 P00631 1998 439000 15500 4 91 - 99
01594440 P00631 1999 320000 15300 5 91 - 99
01594440 P00665 1978 165000 21600 13 78 - 86
01594440 P00665 1979 332000 40000 12 78 - 86
01594440 P00665 1980 182000 14900 8 78 - 86
01594440 P00665 1981 103000 9420 9 78 - 86
01594440 P00665 1982 135000 12900 9 78 - 86
01594440 P00665 1983 265000 31000 12 79 - 87
01594440 P00665 1984 177000 14100 8 80 - 88
01594440 P00665 1985 72700 5390 7 81 - 89
01594440 P00665 1986 55100 3610 7 82 - 90
01594440 P00665 1987 65500 4150 6 83 - 91
01594440 P00665 1988 49500 2950 6 84 - 92
01594440 P00665 1989 81300 6110 8 85 - 93
01594440 P00665 1990 53800 3390 6 86 - 94
01594440 P00665 1991 33000 2360 7 87 - 95
01594440 P00665 1992 35000 2800 8 88 - 96
01594440 P00665 1993 55700 4730 9 89 - 97
01594440 P00665 1994 51600 3920 8 90 - 98
01594440 P00665 1995 29500 2600 9 91 - 99
01594440 P00665 1996 85700 7120 8 91 - 99
01594440 P00665 1997 36400 2930 8 91 - 99
01594440 P00665 1998 38400 3710 10 91 - 99
01594440 P00665 1999 32300 5370 17 91 - 99
01594440 P00666 1978 89000 10600 12 78 - 86
01594440 P00666 1979 142000 12700 9 78 - 86
01594440 P00666 1980 119000 9120 8 78 - 86
01594440 P00666 1981 90600 8190 9 78 - 86
01594440 P00666 1982 94900 8550 9 78 - 86
01594440 P00666 1983 108000 10700 10 79 - 87
01594440 P00666 1984 61300 5040 8 80 - 88
01594440 P00666 1985 29600 1960 7 81 - 89
01594440 P00666 1986 21600 1340 6 82 - 90
Appendix A 33
Appendix A Annual load estimates for the River Input monitoring stations on the Susquehanna Potomac Patuxent and Choptank RiversndashContinued
Standard Error of Prediction
Annual load +- +- ModelStation no Parameter Year (kgyr) (kgyr) Percent window
Patuxent River near Bowie (01594440)mdashContinued
01594440 P00666 1987 18600 1050 6 83 - 91
01594440 P00666 1988 14100 805 6 84 - 92
01594440 P00666 1989 17200 1160 7 85 - 93
01594440 P00666 1990 12900 733 6 86 - 94
01594440 P00666 1991 9360 575 6 87 - 95
01594440 P00666 1992 10500 729 7 88 - 96
01594440 P00666 1993 15600 1250 8 89 - 97
01594440 P00666 1994 15600 1220 8 90 - 98
01594440 P00666 1995 9730 854 9 91 - 99
01594440 P00666 1996 21600 1800 8 91 - 99
01594440 P00666 1997 10900 886 8 91 - 99
01594440 P00666 1998 10600 1030 10 91 - 99
01594440 P00666 1999 8490 1290 15 91 - 99
01594440 P00671 1982 109000 19300 18 82 - 90
01594440 P00671 1983 96800 12200 13 82 - 90
01594440 P00671 1984 59900 5440 9 82 - 90
01594440 P00671 1985 26600 1850 7 82 - 90
01594440 P00671 1986 17700 1190 7 82 - 90
01594440 P00671 1987 15400 961 6 83 - 91
01594440 P00671 1988 11000 672 6 84 - 92
01594440 P00671 1989 12900 857 7 85 - 93
01594440 P00671 1990 10300 637 6 86 - 94
01594440 P00671 1991 7280 424 6 87 - 95
01594440 P00671 1992 8620 573 7 88 - 96
01594440 P00671 1993 12400 912 7 89 - 97
01594440 P00671 1994 13000 843 6 90 - 98
01594440 P00671 1995 9580 686 7 91 - 99
01594440 P00671 1996 21000 1440 7 91 - 99
01594440 P00671 1997 10200 674 7 91 - 99
01594440 P00671 1998 9240 722 8 91 - 99
01594440 P00671 1999 6850 840 12 91 - 99
01594440 P00680 1985 1440000 78300 5 85 - 93
01594440 P00680 1986 1230000 47800 4 85 - 93
01594440 P00680 1987 1750000 57200 3 85 - 93
01594440 P00680 1988 1720000 57200 3 85 - 93
01594440 P00680 1989 3210000 142000 4 85 - 93
A Revised Load Estimation Procedure for the Susquehanna Potomac Patuxent and Choptank Rivers 34
Appendix A Annual load estimates for the River Input monitoring stations on the Susquehanna Potomac Patuxent and Choptank RiversndashContinued
Standard Error of Prediction
Annual load +- +- ModelStation no Parameter Year (kgyr) (kgyr) Percent window
Patuxent River near Bowie (01594440)mdashContinued
01594440 P00680 1990 1980000 58400 3 86 - 94
01594440 P00680 1991 1260000 42200 3 87 - 95
01594440 P00680 1992 1430000 57700 4 88 - 96
01594440 P00680 1993 2740000 104000 4 89 - 97
01594440 P00680 1994 2730000 93600 3 90 - 98
01594440 P00680 1995 1560000 62400 4 91 - 99
01594440 P00680 1996 4940000 180000 4 91 - 99
01594440 P00680 1997 2200000 81000 4 91 - 99
01594440 P00680 1998 2370000 106000 4 91 - 99
01594440 P00680 1999 1640000 116000 7 91 - 99
Appendix A 35
Appendix A Annual load estimates for the River Input monitoring stations on the Susquehanna Potomac Patuxent and Choptank RiversndashContinued
Standard Error of Prediction
Annual load Annual load +- +- ModelStation no Parameter Year (kgyr SiO2) (kgyr Si) (kgyr SiO2) Percent window
Patuxent River near Bowie (01594440)mdashContinued
01594440 P00955 1978 3270000 1530000 212000 6 78 - 86
01594440 P00955 1979 4710000 2200000 250000 5 78 - 86
01594440 P00955 1980 2760000 1290000 110000 4 78 - 86
01594440 P00955 1981 1440000 671000 62800 4 78 - 86
01594440 P00955 1982 1940000 905000 88600 5 78 - 86
01594440 P00955 1983 3160000 1480000 160000 5 79 - 87
01594440 P00955 1984 2760760 1290000 92000 3 80 - 88
01594440 P00955 1985 1460000 684000 46700 3 81 - 89
01594440 P00955 1986 1490000 698000 42700 3 82 - 90
01594440 P00955 1987 2020000 942000 54700 3 83 - 91
01594440 P00955 1988 2100000 982000 55700 3 84 - 92
01594440 P00955 1989 2980000 1390000 78500 3 85 - 93
01594440 P00955 1990 2550000 1190000 67400 3 86 - 94
01594440 P00955 1991 1880000 877000 50100 3 87 - 95
01594440 P00955 1992 1820000 850000 47100 3 88 - 96
01594440 P00955 1993 2680000 1250000 75600 3 89 - 97
01594440 P00955 1994 2810000 1310000 65400 2 90 - 98
01594440 P00955 1995 1980000 924000 47500 2 91 - 99
01594440 P00955 1996 4340000 2030000 94000 2 91 - 99
01594440 P00955 1997 2650000 1240000 61900 2 91 - 99
01594440 P00955 1998 2650000 1240000 72500 3 91 - 99
01594440 P00955 1999 1900000 887000 71000 4 91 - 99
A Revised Load Estimation Procedure for the Susquehanna Potomac Patuxent and Choptank Rivers 36
Appendix A Annual load estimates for the River Input monitoring stations on the Susquehanna Potomac Patuxent and Choptank RiversndashContinued
Standard Error of Prediction
Annual load +- +- ModelStation no Parameter Year (kgyr) (kgyr) Percent window
Patuxent River near Bowie (01594440)mdashContinued
01594440 P80154 1985 16300000 3480000 21 85 - 93
01594440 P80154 1986 10600000 1430000 13 85 - 93
01594440 P80154 1987 21800000 3040000 14 85 - 93
01594440 P80154 1988 22400000 3010000 13 85 - 93
01594440 P80154 1989 58500000 7990000 14 85 - 93
01594440 P80154 1990 24800000 3030000 12 86 - 94
01594440 P80154 1991 9900000 1340000 14 87 - 95
01594440 P80154 1992 13300000 2370000 18 88 - 96
01594440 P80154 1993 27500000 3990000 15 89 - 97
01594440 P80154 1994 24800000 3100000 13 90 - 98
01594440 P80154 1995 11700000 1900000 16 91 - 99
01594440 P80154 1996 53200000 6860000 13 91 - 99
01594440 P80154 1997 15500000 2090000 14 91 - 99
01594440 P80154 1998 17900000 2710000 15 91 - 99
01594440 P80154 1999 14100000 4890000 35 91 - 99
Appendix A 37
Appendix A Annual load estimates for the River Input monitoring stations on the Susquehanna Potomac Patuxent and Choptank RiversndashContinued
Standard Error of Prediction
Annual load +- +- ModelStation no Parameter Year (kgyr) (kgyr) Percent window
Choptank River near Greensboro (01491000)
01491000 P00600 1978 237000 17500 7 78 - 86
01491000 P00600 1979 314000 19700 6 78 - 86
01491000 P00600 1980 188000 7320 4 78 - 86
01491000 P00600 1981 107000 4370 4 78 - 86
01491000 P00600 1982 166000 7680 5 78 - 86
01491000 P00600 1983 329000 19400 6 79 - 87
01491000 P00600 1984 276000 14200 5 80 - 88
01491000 P00600 1985 113000 3760 3 81 - 89
01491000 P00600 1986 151000 5000 3 82 - 90
01491000 P00600 1987 167000 4980 3 83 - 91
01491000 P00600 1988 126000 3370 3 84 - 92
01491000 P00600 1989 355000 8260 2 85 - 93
01491000 P00600 1990 188000 4750 3 86 - 94
01491000 P00600 1991 156000 4370 3 87 - 95
01491000 P00600 1992 132000 3660 3 88 - 96
01491000 P00600 1993 177000 5700 3 89 - 97
01491000 P00600 1994 284000 9340 3 90 - 98
01491000 P00600 1995 133000 3750 3 91 - 99
01491000 P00600 1996 380000 10400 3 91 - 99
01491000 P00600 1997 201000 5360 3 91 - 99
01491000 P00600 1998 230000 7320 3 91 - 99
01491000 P00600 1999 183000 7680 4 91 - 99
01491000 P00608 1980 12300 3280 27 80 - 88
01491000 P00608 1981 6300 1220 19 80 - 88
01491000 P00608 1982 10800 1850 17 80 - 88
01491000 P00608 1983 29200 7250 25 80 - 88
01491000 P00608 1984 21000 5130 24 80 - 88
01491000 P00608 1985 3780 579 15 81 - 89
01491000 P00608 1986 5340 771 14 82 - 90
01491000 P00608 1987 6290 823 13 83 - 91
01491000 P00608 1988 3920 445 11 84 - 92
01491000 P00608 1989 17200 1890 11 85 - 93
01491000 P00608 1990 8380 1070 13 86 - 94
01491000 P00608 1991 7190 817 11 87 - 95
01491000 P00608 1992 5610 644 11 88 - 96
01491000 P00608 1993 10200 1340 13 89 - 97
A Revised Load Estimation Procedure for the Susquehanna Potomac Patuxent and Choptank Rivers 38
Appendix A Annual load estimates for the River Input monitoring stations on the Susquehanna Potomac Patuxent and Choptank RiversndashContinued
Standard Error of Prediction
Annual load +- +- ModelStation no Parameter Year (kgyr) (kgyr) Percent window
Choptank River near Greensboro (01491000)mdashContinued
01491000 P00608 1994 17000 3100 18 90 - 98
01491000 P00608 1995 4440 545 12 91 - 99
01491000 P00608 1996 18200 2230 12 91 - 99
01491000 P00608 1997 8280 1010 12 91 - 99
01491000 P00608 1998 10300 1450 14 91 - 99
01491000 P00608 1999 7410 1700 23 91 - 99
01491000 P00613 1985 698 104 15 85 - 93
01491000 P00613 1986 928 109 12 85 - 93
01491000 P00613 1987 1100 104 10 85 - 93
01491000 P00613 1988 877 79 9 85 - 93
01491000 P00613 1989 3100 265 9 85 - 93
01491000 P00613 1990 1560 143 9 86 - 94
01491000 P00613 1991 1380 130 9 87 - 95
01491000 P00613 1992 1040 110 11 88 - 96
01491000 P00613 1993 1320 152 12 89 - 97
01491000 P00613 1994 1670 199 12 90 - 98
01491000 P00613 1995 698 86 12 91 - 99
01491000 P00613 1996 2090 247 12 91 - 99
01491000 P00613 1997 1150 139 12 91 - 99
01491000 P00613 1998 1200 157 13 91 - 99
01491000 P00613 1999 921 148 16 91 - 99
01491000 P00623 1985 37200 3340 9 85 - 93
01491000 P00623 1986 49600 3580 7 85 - 93
01491000 P00623 1987 54400 3250 6 85 - 93
01491000 P00623 1988 37600 1940 5 85 - 93
01491000 P00623 1989 129000 6440 5 85 - 93
01491000 P00623 1990 54700 3020 6 86 - 94
01491000 P00623 1991 41400 2340 6 87 - 95
01491000 P00623 1992 32100 1750 5 88 - 96
01491000 P00623 1993 48300 3480 7 89 - 97
01491000 P00623 1994 84600 6570 8 90 - 98
01491000 P00623 1995 26900 1340 5 91 - 99
01491000 P00623 1996 104000 5500 5 91 - 99
01491000 P00623 1997 46900 2290 5 91 - 99
01491000 P00623 1998 60000 3570 6 91 - 99
01491000 P00623 1999 52300 5590 11 91 - 99
Appendix A 39
Appendix A Annual load estimates for the River Input monitoring stations on the Susquehanna Potomac Patuxent and Choptank RiversndashContinued
Standard Error of Prediction
Annual load +- +- ModelStation no Parameter Year (kgyr) (kgyr) Percent window
Choptank River near Greensboro (01491000)mdashContinued
01491000 P00625 1978 125000 23200 19 78 - 86
01491000 P00625 1979 159000 29000 18 78 - 86
01491000 P00625 1980 75400 7280 10 78 - 86
01491000 P00625 1981 35600 3400 10 78 - 86
01491000 P00625 1982 58000 6140 11 78 - 86
01491000 P00625 1983 143000 20100 14 79 - 87
01491000 P00625 1984 141000 18400 13 80 - 88
01491000 P00625 1985 49300 4710 10 81 - 89
01491000 P00625 1986 65100 5430 8 82 - 90
01491000 P00625 1987 70800 4800 7 83 - 91
01491000 P00625 1988 45100 2590 6 84 - 92
01491000 P00625 1989 167000 8880 5 85 - 93
01491000 P00625 1990 65100 3920 6 86 - 94
01491000 P00625 1991 44100 2540 6 87 - 95
01491000 P00625 1992 33900 1840 5 88 - 96
01491000 P00625 1993 59600 4400 7 89 - 97
01491000 P00625 1994 113000 9670 9 90 - 98
01491000 P00625 1995 31800 1770 6 91 - 99
01491000 P00625 1996 149000 9360 6 91 - 99
01491000 P00625 1997 63000 3490 6 91 - 99
01491000 P00625 1998 88900 6130 7 91 - 99
01491000 P00625 1999 90300 13300 15 91 - 99
01491000 P00631 1980 113000 9060 8 80 - 88
01491000 P00631 1981 69300 3870 6 80 - 88
01491000 P00631 1982 101000 5120 5 80 - 88
01491000 P00631 1983 161000 9220 6 80 - 88
01491000 P00631 1984 132000 7520 6 80 - 88
01491000 P00631 1985 64000 2510 4 81 - 89
01491000 P00631 1986 83500 3140 4 82 - 90
01491000 P00631 1987 95100 3360 4 83 - 91
01491000 P00631 1988 81600 2650 3 84 - 92
01491000 P00631 1989 194000 5510 3 85 - 93
01491000 P00631 1990 121000 3680 3 86 - 94
01491000 P00631 1991 114000 3910 3 87 - 95
01491000 P00631 1992 99900 3570 4 88 - 96
01491000 P00631 1993 118000 4750 4 89 - 97
01491000 P00631 1994 172000 7140 4 90 - 98
A Revised Load Estimation Procedure for the Susquehanna Potomac Patuxent and Choptank Rivers 40
Appendix A Annual load estimates for the River Input monitoring stations on the Susquehanna Potomac Patuxent and Choptank RiversndashContinued
Standard Error of Prediction
Annual load +- +- ModelStation no Parameter Year (kgyr) (kgyr) Percent window
Choptank River near Greensboro (01491000)mdashContinued
01491000 P00631 1995 100000 4070 4 91 - 99
01491000 P00631 1996 228000 8620 4 91 - 99
01491000 P00631 1997 137000 5170 4 91 - 99
01491000 P00631 1998 141000 6080 4 91 - 99
01491000 P00631 1999 112000 6020 5 91 - 99
01491000 P00665 1978 18200 4580 25 78 - 86
01491000 P00665 1979 29000 9580 33 78 - 86
01491000 P00665 1980 10800 1370 13 78 - 86
01491000 P00665 1981 4930 599 12 78 - 86
01491000 P00665 1982 7610 990 13 78 - 86
01491000 P00665 1983 30300 6090 20 79 - 87
01491000 P00665 1984 18900 3500 19 80 - 88
01491000 P00665 1985 5410 871 16 81 - 89
01491000 P00665 1986 6270 768 12 82 - 90
01491000 P00665 1987 6950 717 10 83 - 91
01491000 P00665 1988 4430 363 8 84 - 92
01491000 P00665 1989 20900 1670 8 85 - 93
01491000 P00665 1990 8380 811 10 86 - 94
01491000 P00665 1991 6840 592 9 87 - 95
01491000 P00665 1992 4870 400 8 88 - 96
01491000 P00665 1993 9350 1150 12 89 - 97
01491000 P00665 1994 19400 3030 16 90 - 98
01491000 P00665 1995 4180 434 10 91 - 99
01491000 P00665 1996 24700 3200 13 91 - 99
01491000 P00665 1997 9060 991 11 91 - 99
01491000 P00665 1998 13300 1770 13 91 - 99
01491000 P00665 1999 20100 7180 36 91 - 99
01491000 P00666 1978 4190 1000 24 78 - 86
01491000 P00666 1979 8010 2530 32 78 - 86
01491000 P00666 1980 3570 427 12 78 - 86
01491000 P00666 1981 1980 232 12 78 - 86
01491000 P00666 1982 2890 368 13 78 - 86
01491000 P00666 1983 8580 1810 21 79 - 87
01491000 P00666 1984 4590 796 17 80 - 88
01491000 P00666 1985 1790 297 17 81 - 89
01491000 P00666 1986 1640 185 11 82 - 90
Appendix A 41
Appendix A Annual load estimates for the River Input monitoring stations on the Susquehanna Potomac Patuxent and Choptank RiversndashContinued
Standard Error of Prediction
Annual load +- +- ModelStation no Parameter Year (kgyr) (kgyr) Percent window
Choptank River near Greensboro (01491000)mdashContinued
01491000 P00666 1987 1930 183 10 83 - 91
01491000 P00666 1988 1570 121 8 84 - 92
01491000 P00666 1989 8700 700 8 85 - 93
01491000 P00666 1990 3250 321 10 86 - 94
01491000 P00666 1991 2860 268 9 87 - 95
01491000 P00666 1992 2680 208 8 88 - 96
01491000 P00666 1993 4020 379 9 89 - 97
01491000 P00666 1994 9650 1110 11 90 - 98
01491000 P00666 1995 2480 195 8 91 - 99
01491000 P00666 1996 13200 1280 10 91 - 99
01491000 P00666 1997 4420 379 9 91 - 99
01491000 P00666 1998 4830 479 10 91 - 99
01491000 P00666 1999 5410 1420 26 91 - 99
01491000 P00671 1982 2860 772 27 82 - 90
01491000 P00671 1983 7140 1580 22 82 - 90
01491000 P00671 1984 4090 761 19 82 - 90
01491000 P00671 1985 1410 304 22 82 - 90
01491000 P00671 1986 1350 216 16 82 - 90
01491000 P00671 1987 1530 201 13 83 - 91
01491000 P00671 1988 1160 123 11 84 - 92
01491000 P00671 1989 6260 685 11 85 - 93
01491000 P00671 1990 2500 358 14 86 - 94
01491000 P00671 1991 2280 292 13 87 - 95
01491000 P00671 1992 2110 245 12 88 - 96
01491000 P00671 1993 2950 419 14 89 - 97
01491000 P00671 1994 6290 1090 17 90 - 98
01491000 P00671 1995 1690 204 12 91 - 99
01491000 P00671 1996 7600 1070 14 91 - 99
01491000 P00671 1997 2870 368 13 91 - 99
01491000 P00671 1998 3200 478 15 91 - 99
01491000 P00671 1999 3050 1070 35 91 - 99
01491000 P00680 1985 430000 25900 6 85 - 93
01491000 P00680 1986 622000 30600 5 85 - 93
01491000 P00680 1987 680000 27500 4 85 - 93
01491000 P00680 1988 426000 13900 3 85 - 93
01491000 P00680 1989 1850000 61300 3 85 - 93
A Revised Load Estimation Procedure for the Susquehanna Potomac Patuxent and Choptank Rivers 42
Appendix A Annual load estimates for the River Input monitoring stations on the Susquehanna Potomac Patuxent and Choptank RiversndashContinued
Standard Error of Prediction
Annual load +- +- ModelStation no Parameter Year (kgyr) (kgyr) Percent window
Choptank River near Greensboro (01491000)mdashContinued
01491000 P00680 1990 759000 29300 4 86 - 94
01491000 P00680 1991 596000 21000 4 87 - 95
01491000 P00680 1992 461000 16300 4 88 - 96
01491000 P00680 1993 903000 44800 5 89 - 97
01491000 P00680 1994 1880000 101000 5 90 - 98
01491000 P00680 1995 555000 22000 4 91 - 99
01491000 P00680 1996 2590000 114000 4 91 - 99
01491000 P00680 1997 1040000 40400 4 91 - 99
01491000 P00680 1998 1370000 66900 5 91 - 99
01491000 P00680 1999 1190000 121000 10 91 - 99
Appendix A 43
Appendix A Annual load estimates for the River Input monitoring stations on the Susquehanna Potomac Patuxent and Choptank RiversndashContinued
Standard Error of Prediction
Annual load Annual load +- +- ModelStation no Parameter Year (kgyr SiO2) (kgyr Si) (kgyr SiO2) Percent window
Choptank River near Greensboro (01491000)mdashContinued
01491000 P00955 1978 1760000 824000 139000 8 78 - 86
01491000 P00955 1979 2310000 1080000 126000 5 78 - 86
01491000 P00955 1980 1640000 768000 73200 4 78 - 86
01491000 P00955 1981 1060000 495000 51500 5 78 - 86
01491000 P00955 1982 1490000 695000 81500 5 78 - 86
01491000 P00955 1983 2280000 1070000 143000 6 79 - 87
01491000 P00955 1984 1870000 876000 112000 6 80 - 88
01491000 P00955 1985 903000 422000 36600 4 81 - 89
01491000 P00955 1986 1180000 552000 46100 4 82 - 90
01491000 P00955 1987 1350000 631000 48800 4 83 - 91
01491000 P00955 1988 1130000 528000 37300 3 84 - 92
01491000 P00955 1989 2610000 1220000 76200 3 85 - 93
01491000 P00955 1990 1560000 727000 50600 3 86 - 94
01491000 P00955 1991 1370000 642000 45700 3 87 - 95
01491000 P00955 1992 1190000 554000 38100 3 88 - 96
01491000 P00955 1993 1360000 637000 40700 3 89 - 97
01491000 P00955 1994 2120000 992000 63300 3 90 - 98
01491000 P00955 1995 1320000 615000 37600 3 91 - 99
01491000 P00955 1996 2910000 1360000 76600 3 91 - 99
01491000 P00955 1997 1790000 835000 47800 3 91 - 99
01491000 P00955 1998 1720000 806000 52000 3 91 - 99
01491000 P00955 1999 1420000 661000 54900 4 91 - 99
A Revised Load Estimation Procedure for the Susquehanna Potomac Patuxent and Choptank Rivers 44
Appendix A Annual load estimates for the River Input monitoring stations on the Susquehanna Potomac Patuxent and Choptank RiversndashContinued
Standard Error of Prediction
Annual load +- +- ModelStation no Parameter Year (kgyr) (kgyr) Percent window
Choptank River near Greensboro (01491000)mdashContinued
01491000 P80154 1978 3540000 1300000 37 78 - 86
01491000 P80154 1979 6680000 3400000 51 78 - 86
01491000 P80154 1980 1950000 362000 19 78 - 86
01491000 P80154 1981 730000 129000 18 78 - 86
01491000 P80154 1982 1370000 237000 17 78 - 86
01491000 P80154 1983 6790000 1530000 23 79 - 87
01491000 P80154 1984 3560000 729000 20 80 - 88
01491000 P80154 1985 901000 237000 26 81 - 89
01491000 P80154 1986 1560000 337000 22 82 - 90
01491000 P80154 1987 1770000 299000 17 83 - 91
01491000 P80154 1988 874000 119000 14 84 - 92
01491000 P80154 1989 5130000 660000 13 85 - 93
01491000 P80154 1990 1950000 334000 17 86 - 94
01491000 P80154 1991 1480000 200000 14 87 - 95
01491000 P80154 1992 733000 89300 12 88 - 96
01491000 P80154 1993 2200000 433000 20 89 - 97
01491000 P80154 1994 5850000 1580000 27 90 - 98
01491000 P80154 1995 742000 109000 15 91 - 99
01491000 P80154 1996 5090000 981000 19 91 - 99
01491000 P80154 1997 1420000 180000 13 91 - 99
01491000 P80154 1998 2940000 548000 19 91 - 99
01491000 P80154 1999 2820000 1310000 46 91 - 99
Appendix A 45
--------
--------
--------
--------
--------
--------
--------
--------
--------
--------
--------
--------
-----
A Revised Load Estimation Procedure for the Susquehanna Potomac Patuxent and Choptank Rivers
App
endi
x B
Pe
rcen
t diff
eren
ces b
etw
een
hist
oric
al a
nd re
vise
d lo
ad e
stim
ates
[Thi
s app
endi
x su
mm
ariz
es th
e pe
rcen
t diff
eren
ces b
etw
een
the
hist
oric
al lo
ad e
stim
ates
from
the
Riv
er In
put m
onito
ring
prog
ram
and
the
revi
sed
estim
ates
pro
vide
d in
A
ppen
dix
A -
- es
timat
es a
re n
ot a
vaila
ble
for c
ompa
rison
]
Rev
ised
est
imat
e -
His
tori
c es
tim
ate
Per
cent
dif
fere
nce
=
times 10
0
(R
evis
ed e
stim
ate
+ H
isto
ric
estim
ate )
2
Dis
solv
edTo
tal
Tota
lTo
tal
Diss
olve
d k
jeld
ahl
kjel
dahl
Diss
olve
dTo
tal
Diss
olve
dor
gani
cSu
spen
ded
nitr
ogen
am
mon
ia n
itrog
enni
trog
enni
trite
+ n
itrat
eph
osph
orus
phos
phor
usO
rtho
phos
phor
usca
rbon
sedi
men
tYe
ar (P
0060
0) (P
0060
8) (P
0062
3)
(P00
625)
(P
0063
1)
(P00
665)
(P
0066
6)
(P00
671)
(P
0068
0)
(P80
154)
Susq
ueha
nna
Riv
er a
t Con
owin
go D
am (0
1578
310)
1978
--
----
----
----
----
--
1979
-3
9
-18
7 --
-22
-1
4
-42
7
8 14
2
--3
4
1980
-1
1
-11
--
-09
2
2 -7
5
52
30
---3
0
1981
1
4 7
0 --
09
49
-57
8
4 -4
3
---1
1
1982
2
8 17
0
--1
8 5
8 -1
14
20
-10
5 --
-19
1983
4
2 20
2
--3
8 5
4 -1
16
-53
-1
15
--2
5
1984
6
3 10
7
--17
6
-29
-2
09
-13
5 -1
21
--5
6
1985
6
2 -5
3
-29
12
7
-08
-2
31
-58
-1
61
-13
9 -1
8
1986
2
3 -1
02
-02
2
2 -0
4
-32
8 -1
79
-32
-7
9
-12
7
1987
3
5 -5
8
23
25
23
-27
7 -2
94
219
-6
3
-81
1988
4
2 -2
3
95
56
35
-27
3 -4
93
290
1
0 -3
8
1989
-6
1
197
-6
4
-18
-9
0
-29
7 -6
69
181
15
0
-08
1990
-8
2
58
-18
8 -7
7
-10
8 -1
82
-28
4 24
8
81
-37
1991
-8
8
161
-2
59
-16
5 -9
5
-10
8 2
4 44
6
-16
-6
1
1992
-7
7
-62
-1
32
-13
1 -1
00
-19
8 3
5 7
1 3
2 -1
55
1993
-1
8
49
-71
-8
6
-33
-0
7
131
4
6 1
0 7
7
1994
-1
2
-48
-8
1
-12
6 0
6 -0
3
81
-35
0 0
0 9
8
1995
-1
7
-14
6 -1
51
-21
0 2
6 -6
3
206
-7
65
-84
-2
4
1996
-4
5
-16
9 -4
8
-41
-4
3
167
12
4
-15
6 -6
7
40
1997
-3
2
----
13
16
191
29
2
-52
--
-10
3
1998
0
0 -1
29
49
-14
0
9 17
6
112
-3
67
-13
8 1
0
46
App
endi
x B
Pe
rcen
t diff
eren
ces b
etw
een
hist
oric
al a
nd re
vise
d lo
ad e
stim
ates
mdashC
ontin
ued
Diss
olve
dTo
tal
Tota
l T
otal
Diss
olve
d k
jeld
ahl
kjel
dahl
Diss
olve
dTo
tal
Diss
olve
dor
gani
cSu
spen
ded
nitr
ogen
am
mon
ia n
itrog
enni
trog
enni
trite
+ n
itrat
eph
osph
orus
phos
phor
usO
rtho
phos
phor
usca
rbon
sedi
men
tYe
ar (P
0060
0) (P
0060
8) (P
0062
3)
(P00
625)
(P
0063
1)
(P00
665)
(P
0066
6)
(P00
671)
(P
0068
0)
(P80
154)
Poto
mac
Riv
er a
t Cha
in B
ridg
e (0
1646
580)
1978
--
----
----
----
----
--
1979
1
2 49
6
--0
2 -3
2
39
150
27
7
---2
12
1980
2
0 35
6
--0
4 -2
8
14
127
17
2
--7
0
1981
1
3 24
3
---1
6
-25
-3
5
98
92
--29
3
1982
1
7 13
8
---2
4
06
-37
2
8 5
3 --
265
1983
0
7 2
5 0
6 -3
0
14
-55
-4
3
07
--26
9
1984
0
7 -4
7
-77
0
5 -0
6
-77
-9
8
-68
--
528
1985
-5
3
-50
-2
09
-96
1
2 -1
03
-15
7 -5
6
--41
3
1986
-9
2
-24
5 -1
41
-13
6 -1
12
-26
3 -1
91
-24
3 --
119
1987
-8
8
-21
-1
24
-99
-1
61
-11
8 -1
49
-13
5 --
348
1988
-3
9
246
-5
7
-41
-1
25
59
33
120
-3
28
574
1989
-0
1
-13
6 8
8 4
8 -7
0
64
141
12
5
-16
27
2
1990
-9
7
-36
7 6
7 -2
93
-38
-2
12
274
40
8
-20
6 17
6
1991
-1
68
-32
6 7
3 -2
75
-24
1 -2
85
-14
0 -1
60
-89
-6
8
1992
-1
32
-31
0 20
6
-80
-2
63
-21
9 -1
79
-26
4 -2
93
-32
5
1993
-8
0
-01
16
8
-80
-1
31
-76
-4
8
-14
-1
3
-14
4
1994
-3
1
229
13
7
-57
-4
4
21
159
26
0
61
-15
7
1995
5
2 1
1 8
8 4
3 -2
0
-20
-8
4
-14
2 3
3 -7
6
1996
-1
10
-83
-0
7
-29
-1
47
114
13
4
156
-2
7
-18
4
1997
-7
1
----
-20
-1
05
136
29
1
106
--
152
1998
-5
5
-40
1
3 -2
4
-64
5
3 8
9 9
6 -3
3
71
Appendix B 47
A Revised Load Estimation Procedure for the Susquehanna Potomac Patuxent and Choptank Rivers
App
endi
x B
Pe
rcen
t diff
eren
ces b
etw
een
hist
oric
al a
nd re
vise
d lo
ad e
stim
ates
mdashC
ontin
ued
Diss
olve
dTo
tal
Tota
l T
otal
Diss
olve
d k
jeld
ahl
kjel
dahl
Diss
olve
dTo
tal
Diss
olve
dor
gani
cSu
spen
ded
nitr
ogen
am
mon
ia n
itrog
enni
trog
enni
trite
+ n
itrat
eph
osph
orus
phos
phor
usO
rtho
phos
phor
usca
rbon
sedi
men
tYe
ar (P
0060
0) (P
0060
8) (P
0062
3)
(P00
625)
(P
0063
1)
(P00
665)
(P
0066
6)
(P00
671)
(P
0068
0)
(P80
154)
Patu
xent
Riv
er n
ear
Bow
ie (0
1594
440)
1978
-2
1
----
-11
7 --
-48
3 -5
04
----
--
1979
-2
3
----
-10
7 --
-36
7 -2
43
----
--
1980
-2
5
156
--
-57
-4
2
-10
9 10
6
----
--
1981
-7
4
61
---2
1
-51
-4
9
316
--
----
1982
-4
3
-21
--
-24
-2
2
19
362
33
6
----
1983
-0
4
-10
--
-43
1
4 17
2
388
14
7
----
1984
3
9 -6
6
--8
3 1
7 7
1 3
6 -8
1
----
1985
-1
8
-37
4
8 2
5 -1
9
-10
0 -1
42
-31
9 6
9 28
8
1986
-3
2
-48
2
2 -2
2
-12
-1
30
-17
9 -3
68
66
82
1987
0
3 0
1 1
8 0
8 0
2 0
6 -2
74
-30
9 9
8 3
4
1988
-3
8
-53
2
2 -9
8
-10
-1
2
-27
1 -2
33
119
-1
72
1989
0
8 21
0
57
32
00
88
-25
3 -1
89
123
14
5
1990
1
2 36
1
110
11
4
-16
14
4
43
-17
11
5
173
1991
5
6 57
4
76
113
5
8 6
0 -1
87
-27
3 -7
4
217
1992
-1
3
239
-0
5
71
07
62
-18
3 -2
18
-10
0 29
3
1993
9
9 27
6
192
12
0
131
0
9 -2
64
-37
4 6
6 22
0
1994
12
0
76
193
3
6 14
5
-10
-2
73
-37
1 4
8 10
0
1995
12
1
-20
0 1
2 -9
9
169
-1
88
-44
7 -5
16
-11
0 -1
74
1996
0
4 -8
9
-33
-0
6
05
-57
-1
41
-22
8 -9
3
-10
4
1997
4
6 --
----
68
-14
0 -2
86
-45
7 --
-10
0
1998
8
2 -3
23
35
-65
16
6
-31
9 -6
91
-72
8 -1
64
-15
2
48
App
endi
x B
Pe
rcen
t diff
eren
ces b
etw
een
hist
oric
al a
nd re
vise
d lo
ad e
stim
ates
mdashC
ontin
ued
Diss
olve
dTo
tal
Tota
l T
otal
Diss
olve
d k
jeld
ahl
kjel
dahl
Diss
olve
dTo
tal
Diss
olve
dor
gani
cSu
spen
ded
nitr
ogen
am
mon
ia n
itrog
enni
trog
enni
trite
+ n
itrat
eph
osph
orus
phos
phor
usO
rtho
phos
phor
usca
rbon
sedi
men
tYe
ar (P
0060
0) (P
0060
8) (P
0062
3)
(P00
625)
(P
0063
1)
(P00
665)
(P
0066
6)
(P00
671)
(P
0068
0)
(P80
154)
Cho
ptan
k R
iver
nea
r G
reen
sbor
o (0
1491
000)
1978
-1
75
----
-22
--
98
41
----
-27
4
1979
-1
52
----
-13
4 --
162
21
4
----
-20
9
1980
-3
0
165
--
-56
-0
9
-11
6 4
6 --
---1
03
1981
1
9 11
8
---7
7
02
-16
3 7
5 --
--1
6
1982
1
0 11
1
---9
0
07
-16
1 12
3
-12
1 --
40
1983
-2
2
102
--
-22
8 -1
5
108
16
8
-85
--
-19
9
1984
4
5 12
5
--4
6 -0
9
13
-54
-7
9
---4
03
1985
8
3 -2
02
37
143
-0
1
-11
0 -8
9
-13
0 -1
25
-54
2
1986
-0
9
-10
0 -0
6
-03
-4
5
-13
0 -1
46
-09
-5
8
-29
9
1987
-2
1
103
-0
7
-70
0
2 -1
21
-17
8
7 -5
1
-26
3
1988
-0
3
352
1
6 -1
77
92
-15
9 13
5
123
-3
4
-35
2
1989
1
0 15
7
23
32
-03
-1
0
-13
-1
11
-52
-2
81
1990
-3
0
124
-4
0
-41
-6
8
-79
-9
8
-15
7 -1
6
-14
9
1991
-9
5
89
-67
-1
17
-89
-4
7
31
-10
0 -1
3
106
1992
-5
8
-16
0
3 -9
7
-68
-2
59
154
-1
58
62
115
1993
-8
5
-11
7 8
1 1
3 -8
7
-91
27
9
-32
9 4
1 2
3
1994
-1
7
-82
8
8 3
7 -1
1
98
22
-43
9 -4
4
146
1995
-2
8
-18
0
5 -1
73
18
-19
6 -2
46
-61
2 -2
1
10
1996
-1
8
-13
7 -0
5
49
-47
-3
5
-16
0 -1
16
-57
9
5
1997
-4
3
----
103
-8
5
71
-34
3
0 --
90
1998
2
0 2
8 6
5 7
0 10
0
-22
-7
7
-30
8 -3
0
117
Appendix B 49
- Contents
- Abstract
- Introduction
-
- Purpose and Scope
- Description of Study Area
- Acknowledgments
-
- Methods of Load Estimation
-
- Monitoring Record
- Regression Model
- Historical Load Estimates
-
- Revised Procedure for Load Estimation
-
- Background
- Description of Revised Methods
- Comparison of Historical and Revised Load Estimates
-
- Summary and Conclusions
- References Cited
-
A Revised Load Estimation Procedure for the Susquehanna Potomac Patuxent and Choptank Rivers
By Steven E Yochum
Abstract
The US Geological Surveyrsquos Chesapeake Bay River Input Program has updated the nutrient and suspended-sediment load data base for the Susquehanna Potomac Patuxent and Choptank Rivers using a multiple-window center-estimate regression methodology The revised method optimizes the seven-parameter regression approach that has been used historically by the program The revised method estimates load using the fifth or center year of a sliding 9-year window Each year a new model is run for each site and constituent the most recent year is added and the previous 4 years of estimates are updated The fifth year in the 9-year window is considered the best estimate and is kept in the data base The last year of estimation shows the most change from the previous yearrsquos estimate and this change approaches a minimum at the fifth year Differences between loads computed using this revised methodology and the loads populating the historical data base have been noted but the load estimates do not typically change drastically The data base resulting from the application of this revised methodology is populated by annual and monthly load estimates that are known with greater certainty than in the previous load data base
Introduction
Since 1985 the US Geological Survey (USGS) Maryland Chesapeake Bay River Input Program in a cooperative effort with the Maryland Department of Natural Resources and the Metropolitan Washington Council of Governments (MWCOG) has monitored streamflow nutrients and suspended-sediment concentrations in the Susquehanna Potomac Patuxent and Choptank Rivers just above the point of tidal influence (fig 1) These data are used to estimate nutrient and sediment loads entering the tidal waters of the Chesapeake Bay The USGS Virginia Chesapeake Bay River Input Program in cooperation with the Virginia Department of Environmental Quality monitors concentrations of nutrients and suspended sediments of five Virginia rivers just above the point of tidal influence The Maryland and Virginia programs jointly comprise the USGS River Input Program
Within the Maryland River Input Program 12 nutrient and suspended-sediment constituents are monitored at 4 stations Annual and monthly loads are estimated using a seven-parameter log-linear regression model This regression model known as Estimator was developed by the USGS and is widely used for load estimation During this program a historical data base of annual and monthly load estimates had been generated for each constituent from eleven 10- to 14-year model windows with the first window providing load estimates over its entire calibration window length and the remaining estimates extracted from the last year of calibration of each subsequent model These end-of-model-window estimates that have traditionally been provided by the monitoring program are not statistically preferred The preferred load estimates for any individual year (those with minimum uncertainty) are the ones computed in the center of the regression A new data base populated by loads estimated for the fifth or center year of 9-year calibration windows has been developed A 9-year window is preferred because it has a center (for the load estimation) and it is long enough to encompass a sufficient number of samples and a full range of wet to dry periods These center estimates have less uncertainty than the load estimates in the historical data base
Introduction 1
A Revised Load Estimation Procedure for the Susquehanna Potomac Patuxent and Choptank Rivers 2
Purpose and Scope The purpose of this report is to describe and provide
justification for a revised procedure implemented in the computation of nutrient and suspended-sediment loads at the Maryland River Input monitoring stations The revised annual loads at the monitoring stations are also presented This report limits its discussion to the load computations at the four Maryland River Input monitoring stations from 1978 through 1999 (a shorter period for some constituents and sites) and provides only a brief description of the monitoring program and study area
Description of Study Area The watersheds that drain to the four Maryland River
Input monitoring stations (fig 1) include a wide range of land cover geographic and geologic regions The watersheds encompass such diverse areas as the forested Appalachian Plateau of New York and Pennsylvania the Valley and Ridge of the West Virginia highlands as well as the agricultural regions of Pennsylvaniarsquos Lancaster County the Shenandoah Valley of Virginia and the flat lowlands of the Delmarva Peninsula
The Susquehanna River is monitored just downstream from Conowingo Dam Md and has a drainage area of 27100 mi2 (square miles) The Susquehanna is the largest tributary to the Chesapeake Bay and is the largest single source of total nitrogen and phosphorus (Darrell and others 1999) The Potomac River is the second largest contributor of streamflow to the Bay and the largest contributor of suspended sediment The Potomac is monitored at Chain Bridge and has a drainage area of 11570 mi2 The Patuxent River is monitored near Bowie Md at Governorrsquos Bridge and has a drainage area at the monitoring station of 348 mi2 The Choptank River is the smallest tributary monitored in the River Input Program The Choptank monitoring station is near Greensboro Md on the Delmarva Peninsula and has a contributing drainage area of 112 mi2
Acknowledgments The author gratefully acknowledges the many
technicians who collected the base-flow and stormflow samples used in the load computations for this study Much of these data were collected during long days weekends holidays and during adverse weather conditions Their dedication and expertise is much appreciated A special thanks is extended to David Brower of the USGS the hydrologic technician who currently collects samples for this project The author would also like to thank Joel Blomquist and Timothy Cohn of USGS who both helped develop the revised methodology and Brenda Majedi of USGS who provided much insight into the history of the River Input monitoring program The specialists and data base personnel in the Maryland-Delaware-DC District office of the USGS are also thanked for their advice and support
Harry Post of the Occoquan Watershed Monitoring Laboratory and Christine Becker of the Metropolitan Washington Council of Governments are thanked for their
monitoring efforts at the Potomac River at Chain Bridge The cooperation of the Philadelphia Electric Company in the Susquehanna River sampling and gaging at Conowingo Md is also appreciated
Methods of Load Estimation
A detailed description of the concentration data base used in the load computations is provided below The regression model Estimator the model that was used to compute loads for both the historical and revised methodologies is also discussed A description of the historical load data base is also provided
Monitoring Record Twelve nutrient and suspended-sediment constituents are
monitored at the four River Input monitoring stations These constituents are listed in table 1 Annual and monthly loads are estimated for all 12 of these constituents The table also indicates how each constituent is reported and the parameter numbers used for each constituent in the USGS National Water Information System (NWIS) water-quality data base and subsequently in the load computation process
Table 1 Constituents monitored in the River Input Program
[na not applicable]
Parameter ReportedConstituent number as
Total nitrogen (TN) P00600 N
Dissolved ammonia (NH3) P00608 N
Dissolved nitrite (NO2) P00613 N
Dissolved kjeldahl nitrogen (dissKN) P00623 N
Total kjeldahl ntrogen (TKN) P00625 N
Dissolved nitrite + nitrate (NO2 +NO3) P00631 N
Total phosphorus (TP) P00665 P
Dissolved phosphorus (dissP) P00666 P
Orthophosphorus (o-PO4) P00671 P
Total organic carbon (TOC) P00680 C
Dissolved silica (SiO2) P00955 SiO2
Suspended sediment P80154 na
Methods of Load Estimation 3
The Maryland River Input Program began in 1985 For this program 15 to 30 samples per year are collected (during both base-flow and stormflow conditions) using an equal-width-increment depth-integrated sampling procedure at the Susquehanna the Patuxent and the Choptank River sites The Potomac River is monitored by MWCOG through the Occoquan Watershed Monitoring Laboratory (OWML) OWML uses an automatic sampler at the Potomac River site Additionally the River Input Program periodically collects Potomac River storm samples using the equal-width-increment depth-integrated sampling procedure Nutrient and suspended-sediment data were collected by the USGS National Water-Quality Assessment (NAWQA) Program for the Susquehanna and Potomac Rivers from 1993 to the present and at the Choptank River from 1987ndash90 Additional samples were collected by the USGS National Stream-Quality Accounting Network (NASQAN) at all four of the sites until the midndash1990rsquos (Darrell and others 1999)
and a study by Lang (1982) populated the data base from 1979 through 1981 for the Potomac and Susquehanna Rivers
Except for the data collected by OWML for the Potomac River at Chain Bridge all of these data are the result of USGS collection and analysis and constitute the concentration data set used to estimate loads at the four Maryland River Input monitoring stations These data are available on the USGS River Input Program web site at httpwww-vausgsgovchesbayRIMP
The sampling record for the Susquehanna River at Conowingo Dam monitoring station began with the 1979 water year Figure 2a shows the sampling frequency at the dam for total phosphorus from 1978 through 1999 (Total phosphorus represents one of the more frequently sampled constituents in the record) The sampling frequencies for all constituents peaked between 1979 and 1981 during the study by Lang (1982) were at a minimum or were not analyzed for
A Revised Load Estimation Procedure for the Susquehanna Potomac Patuxent and Choptank Rivers 4
from 1982 through 1984 and then increased steadily to comparatively high levels from 1987 through 1990 Samples were collected less frequently in 1991 and 1992 as the NASQAN Program was phased out Sampling frequency increased again in 1993 when the NAWQA program entered a high-intensity phase in this river but then decreased to a minimal level as NAWQA passed into a low-intensity phase At present (2000) 25 to 35 samples per year are collected at this site (depending upon hydrologic conditions)
The sampling frequency for total phosphorus at the Potomac River station is shown in figure 2b Sampling at this site was also initiated at the beginning of the 1979 water year with an increasing frequency through 1981 for all 12 constituents during the Lang (1982) study Few water-quality data were collected in 1982 as Langrsquos sampling program ended but the sampling frequency for most constituents increased again in 1983 when MWCOG and OWML began water-quality monitoring at this site OWML does not analyze samples for nitrite and suspended sedimentmdashthese data sets have been populated since 1985 by only limited (usually monthly) USGS sampling As a result of this limited data availability estimates of nitrite and suspended-sediment loads have greater uncertainty (larger standard errors) than the other constituents Currently 60ndash80 samples per year are collected at this site (depending upon hydrologic conditions)
Sampling was relatively infrequent at the Patuxent River site from 1978ndash84 for most constituents (fig 2c) only the NASQAN Program collected samples during this period Maximum sampling frequency occurred after the River Input Program was initiated in 1985 and both the River Input and NASQAN Programs collected samples The sampling frequency decreased through the early 1990rsquos for all constituents after the River Input Program became the only program collecting samples at this site Currently 20 to 30 samples per year are collected at this site (depending upon hydrologic conditions)
Relatively low frequency sampling also occurred at the Choptank River site from 1978 through 1984 for most constituents (fig 2d) The sampling frequency was higher from 1985 through 1990 with both the River Input and NASQAN Programs sampling at this site Sampling frequency at this site peaked during the high flow year of 1989 Since 1990 the sampling frequency for all constituents has remained relatively constant with only the River Input Program sampling at this site Currently 20 to 30 samples per year are collected at this site (depending upon hydrologic conditions)
Regression Model A seven-parameter log-linear regression model is used to
characterize concentration data and estimate annual and monthly loads of nutrients and suspended sediment at the River Input monitoring stations This regression model (Estimator) incorporates a Minimum Variance Unbiased Estimator (MVUE) for correcting the bias induced by log transformation as well as an Adjusted Maximum Likelihood
Estimator (AMLE) for data sets containing censored observations (Darrell and others 1999) Descriptions of the Estimator model can be found in Darrell and others (1999) and Cohn and others (1992) The MVUE procedure is discussed in Gilroy and others (1990) Cohn and others (1989) and Bradu and Mundlak (1970) The AMLE procedure is discussed in Cohn and others (1992) and Cohn (1988)
The load estimation procedure involves two primary stepsmdashthe fitting of the model to the concentration data using ordinary least-squares regression and load estimation from the fit model (Darrell and others 1999) The model has the following form
ln[C] = β0+ β1ln (Q ) + Q β2[ln(Q )]2 + β3 (T-TQ ) +
β4 (T- )2 + β5 sin (2πT) + β6 cos (2πT) + ε (1)T
where
ln [] = natural logarithm function C = constituent concentration in milligrams per
liter (mgL) βrsquos = model coefficients Q = mean-daily streamflow in cubic feet per
second (ft3s) Q = centered streamflow T = time in decimal years T = centered time sin = sine function cos = cosine function and ε = independent random error
Daily concentration and load estimates are computed using the MVUE algorithm and the daily loads are summed to provide the monthly and annual fluxes (Darrell and others 1999) A standard error of prediction is also generated to indicate how well the estimated regression model fits a ldquotruerdquo regression model The standard error of prediction is a measure of the expected difference between an individual estimate and the estimated daily load (measured concentra-tion multiplied by the average daily discharge) This standard error of prediction is a function of the variability between the estimated and computed loads only on the days of measurement hence the standard error will be biased if there is any systematic sampling bias in the concentration data Also the standard error may not account for the variability on days without monitoring or from any systematic bias incorporated into the source concentration data set (Robertson and Roerish 1999) Possible sources of this bias include sampling techniques and designs that do not adequately represent the true environmental variability
Historical Load Estimates During the developmental period of these load-
estimation procedures it was known that the underlying principles of the model (the relation of concentration and
Methods of Load Estimation 5
streamflow) may change with time and that it would be inappropriate to assume that this relation would be constant over long periods On the basis of this observation and the amount of (monitoring) data available at that time a moving-window approach to load estimation for the years following these initial efforts was implemented (TA Cohn and JD Blomquist USGS oral and written communs 2000) A variation of this technique was employed and is described below
The historical load-estimation methodology is shown in figure 3 Each row represents a model calibration window and light-shaded boxes indicate years from which load estimates were recorded into a load data base The first model was calibrated over an 11-year period 1978 through 1988 and loads were predicted for all years During the following year a 10-year model was calibrated for 1980 through 1989 and the loads predicted for each constituent in 1989 the last year of the regression were entered into a data base with the 11 years of load estimates computed the year before This 10-year moving window approach was used for 6 years for model windows 1980ndash89 to 1985ndash94 and the loads estimated during the last year of each of these windows were recorded in the data base Starting with the 1985ndash95 model window each of the remaining Estimator models were calibrated using increasing window lengths with 1985 the reference year for the Chesapeake Bay Program as the base year for the model This method was used in the 1985ndash94 through the 1985ndash98 models Loads computed in
the last year of each of these calibration windows were entered into the load data base For each constituent the 1978 through 1998 historical load data base comprises annual and monthly load estimates from eleven 10- to 14-year model windows with the first window providing load estimates over its entire calibration window length and the remaining estimates extracted from the last year of calibration of each subsequent model
After differences between loads estimated throughout the 1985ndash98 14-year models and loads in the data base were noted a comparison between two overlapping but different regression window lengths was performed Annual loads for 11 constituents and all 4 Maryland River Input monitoring stations were computed for a 14-year 1985ndash98 model window and compared to loads estimated using a 10-year 1989ndash98 model window Annual loads were extracted from each group of models and percent differences were computed for the 11 constituents The differences between the load predictions from the two window lengths normally fell within the error bars of the standard error of prediction but the total phosphorus suspended-sediment ammonia and orthophosphorus models were found to give load predictions that were up to 50 percent different beyond the error bars of these models The greatest differences in load estimates were found at the edges of the 10-year window in 1989 and 1998 These differences indicated that a more systematic load computation procedure was required
A Revised Load Estimation Procedure for the Susquehanna Potomac Patuxent and Choptank Rivers 6
Revised Procedure for Load Estimation
The rationale for a more rigorous statistical approach in computing loads at the River Input monitoring stations is provided in this section A description of the revised procedure and a comparison of annual loads are also included
Background The concentration-discharge relation for some
constituents and rivers may change over time The Estimator model does not currently include a term allowing such flexibility however The model does allow the concentration-discharge relation to vary with time using the T and T 2 parameters but does not allow the slope of the Q and Q2 terms to change (β1 and β2 are constant) limiting the flexibility of the concentration-discharge relation over a given model window
After the model is fit to the raw concentration data within a calibration window each daily computed concentration is defined by the constant Q and Q2 parameters This relation is set by a specific decimal year value determining the T T 2 and seasonality parameters of the modelmdashthese parameters for any given day are constant Thus the concentration estimates for any given day are defined by the slope of the Q and Q2 parameters These slopes are the coefficients defined in the model fitting and are constant over a calibration window A ramification of this constancy is that for any given Estimator model the concentration-discharge relation for any particular date cannot change The T and T 2
terms can shift the curve through the model window but do not change the slope of the concentration-discharge relation With these defined concentrations the daily load estimates are computed using the MVUE algorithm (to account for the log-transformation bias) and summed and averaged to compute monthly and annual fluxes
Changes in the concentration-discharge relation (and time trends) can be caused by many things including changes in land use implementation of best management practices increases in sewage-effluent discharges improved sewage-treatment processes and climatic variation and change Long calibration windows have an increased chance of containing time periods with significantly different concentration-discharge relations Crossing through multiple concentration-discharge periods however will decrease the quality of the model fit therefore it is important to minimize the model calibration window length
Analyses of samples collected by the River Input Program at the Patuxent River indicated a large decrease in the concentrations of most constituents from the middle-to-late 1980rsquos to the early 1990rsquos which was probably due to the phosphorus detergent ban and sewage-treatment plant upgrades Before these changes occurred there was a strong inverse relation between concentration and discharge (as treatment-plant effluent was diluted during higher flows) This concentration-discharge relation likely changed however as urban and agricultural lands became more
important sources of nutrients in this basin Applying a single Estimator model to a period such as 1985 through 1998 will force the model to fit a constant concentration-discharge relation over a time period that has a varying relation
ldquoSteprdquo trends or rapid changes in concentration of nutrients or sediment over time can also present a problem for load estimation using the seven-parameter Estimator modelmdashparticularly when the model is calibrated over long periods Trends in concentration over time are fit using both the T and T 2 terms and offer a reasonable fit to gradual changes in concentration These two model terms are orthogonal and fit temporal variations evenly over the entire calibration period When a ldquosteprdquo change is encountered in the record this shift is actually represented by a gradual curvilinear relation with time The use of the T and T 2 terms is a considerable improvement over a simple linear trend because together they can provide a more suitable fit to the observed data and better estimates of actual loads The fitting of the T 2 term to a step trend however may cause inflation of estimates near the tails of the calibration window For the River Input monitoring stations the primary step trends are concentration and load decreases (from the mid 1980rsquos through the early 1990rsquos) that were most likely the result of the phosphorus detergent ban and incremental improvements in wastewater-treatment plants The effect of these trends on the estimated load is of primary concern Errors in load estimates are most likely to occur when a step trend occurs early in a long calibration window In this case loads are somewhat underestimated in early years and overestimated in later years
Several approaches to load estimation are possible where step trends are indicated The method chosen for this analysis shortens the calibration window in order to minimize the error in estimates at the tail of the calibration period This method is convenient because it can be standardized and can be applied without prior knowledge of changes in watershed management practices A second method attempts to identify step trends and calibrate separate models for pre- and post-step trend periods This method requires considerable knowledge of the forcing and timing of the step trends In most cases observed to date the precise timing of the response to management actions is unclear and may actually occur over a period of months to years It appears that phosphorus concentrations decreased signifi-cantly as a result of the phosphorus detergent ban for example however concentrations at some sites continued to decline for more than a year following the ban A third method develops additional variables and statistical tools using the current AMLEMVUE framework Such tools may fit step trends using separate model parameters (intercept terms) that are determined statistically rather than operationally Such tools should be investigated further as the period of water-quality record at the River Input monitoring stations expands to several decades
Multiple projects within the USGS have collected samples at the River Input monitoring stations and added
Revised Procedure for Load Estimation 7
data to the record As a result the sampling frequency throughout the period of record has varied considerably (fig 2) For the Susquehanna Patuxent and Choptank sites the sampling frequency reached a maximum in the late 1980rsquos by as much as two to three times the more recent sampling frequency thus placing inappropriate weight upon these years in the load estimates from a single Estimator model A moving calibration window gradually decreases and eventually eliminates the weight that these early measurements have on the load estimates
Two major conclusions can be drawn from this discussion The first is that load estimates near the tail of a calibration window have the greatest uncertainty As a result the end-of-model-window estimates that have traditionally been provided to the Chesapeake Bay scientific community by the program are not preferred The best load estimates for any individual yearmdashthose with minimum uncertaintymdashare those computed in the center of the regression The second major point is that the model window length needs to be minimized A 9-year window is considered optimal because the calibration data are nearly symmetrically distributed around the year for which estimated loads are needed while still providing sufficient length to encompass a reasonable number of samples and a full range of wet to dry periods
Description of Revised Methods The (revised) method consists of running multiple 9-year
calibration windows for each site and constituent An illustration of the procedure used to compute the revised loads is provided in figure 4 Each row represents a model window and the light-shaded boxes indicate the years in each calibration window from which load estimates were taken and entered into a data base For each constituent and site up to 14 models were run Load estimates were taken from the fifth (center) year of the calibration window and entered into a data base On the basis of the USGS concentration data base and the seven parameters in the model these estimates will have the least uncertainty
The first 4 years of estimates are in a tail of the calibration window and have greater uncertainty but are all the data allow Higher standard errors are usually observed during these first few years of estimates
The last 4 years of each model window are also in a tail of the calibration window have greater uncertainty and are considered preliminary and revised each year These estimates are marked by dark-shaded boxes in figure 4 When the last four years of load estimates are revised each year the greatest change can be expected for the last year of estimation from the previous year For example the load estimates from the last four years of the 1990ndash98 model
A Revised Load Estimation Procedure for the Susquehanna Potomac Patuxent and Choptank Rivers 8
windows (1995 through 1998) were compared to the loads predicted for these years in the 1991ndash99 model window For suspended sediment in the Choptank River the percent differences between the 1999 and 1998 model estimates were calculated to be -25 -16 6 and -04 percent for 1998 through 1995 respectively Likewise for dissolved nitrite plus nitrate in the Patuxent River percent differences were found to be 12 6 09 and 03 percent respectively This pattern supports the premise that the last year of load estimates in any calibration window has the greatest uncertainty
Comparison of Historical and Revised Load Estimates The annual load estimates for the four Maryland River
Input monitoring stations are provided in Appendix A The most up-to-date annual and monthly estimates can be accessed on the USGS River Input Program web site at httpwww-vausgsgovchesbayRIMP A comparison between the historical and revised load estimates is provided in Appendix B This table lists the percent differences between historical and revised annual load estimates for the four River Input monitoring sites and all available constituents
The historical and revised load estimates and error bars for a few selected constituents are shown in figure 5 These plots represent the full range of differences in estimates as well as both narrow and wide error bars As discussed earlier in this report these bars indicate the error in the regression but do not represent errors associated with sampling and laboratory analysis
In general it was found that the annual load estimates of total nitrogen at all four sites do not change considerably between methodologies As an example figure 5a shows a comparison of the revised and historical load estimates for total nitrogen (TN) at the Patuxent River near Bowie Md monitoring station The solid point and error bars represent the load value and standard error of the revised annual load estimate The error bars of the two sets of estimates usually overlap for this site and constituent despite the relatively narrow bar width For 1993 to 1995 however the revised method predicts loads with error bars that do not overlap the error bars of the historical values The load estimates for these 3 years were 10 to 12 percent different The error bars also decreased in size from 1978 to 1984 as estimates are taken progressively closer to the model centers and include
additional data points Finally the Patuxent River has shown significant reductions in concentrations of most constituents during the study period due predominantly to sewage-treatment plant upgrades The result of this point-source reduction effort can be seen in this plot as a downward trend in annual total nitrogen load estimates
Between methodologies estimates of annual loads of total kjeldahl nitrogen (TKN) typically show larger differences than estimates for TN Figure 5b shows a comparison of the load estimates and error bars for TKN in the Choptank River Differences between annual load estimates for TKN in the Choptank ranged from less than 1 to nearly 23 percent (see Appendix B) This consistency is typical at all four of the monitoring sites for this constituent The error bars for TKN tend to be wide and overlap for all but two of the years The error bars for the updated estimates become finer through the record then widen slightly during the last four years of estimates (the preliminary non-window-centered estimates)
The two methodologies estimated orthophosphorus (o-PO4) loads with the greatest differences among the 12 constituents Figure 5c shows the load estimates and error bars for o-PO4 at the Susquehanna River at Conwingo Dam monitoring station Differences between the load estimates vary from 3 to 77 percent with the greatest differences in 1994 and 1995 The error bars normally overlap but the variability may indicate limitations of this model in predicting o-PO4 loads especially o-PO4 loads discharging from the Susquehanna River at Conowingo Dam
Figure 5d shows a comparison of suspended-sediment load estimates for the Potomac River at Chain Bridge monitoring station This plot shows the large error bars that are typically computed for suspended-sediment estimates The largest estimate and bracket size was in 1985 a high discharge year Suspended-sediment concentrations vary a great deal in any river and a large number of samples are required for accurate estimates of load The current sampling program includes relatively few suspended-sediment samples from the Potomac River at Chain Bridge Considering that the Potomac River has been shown to provide the largest flux of sediment to the Chesapeake Bay (Darrell and others 1999) these large error bars are cause for concern
Revised Procedure for Load Estimation 9
A Revised Load Estimation Procedure for the Susquehanna Potomac Patuxent and Choptank Rivers 10
Summary and Conclusions
The US Geological Survey Chesapeake Bay River Input monitoring program has updated its data base for nutrient and suspended-sediment loads using an optimized methodology implementing the same seven-parameter log-linear regression model that has historically been used in the project This approach which uses a multiple-window center-estimate methodology was applied to the monitoring record of the River Input monitoring stations on the Susquehanna Potomac Patuxent and Choptank Rivers These four rivers have a wide range of watershed characteristics and include both the largest and smallest watersheds monitored in the program Concentrations of 12 nutrient and suspended-sediment constituents were included in the analysis and annual and monthly load estimates were revised
The regression model Estimator was used to compute loads in both the historical and revised methodologiesmdashthe new method merely optimizes the use of this model The historical load data base is composed of annual and monthly load estimates from eleven 10- to 14-year model windows with the first window providing load estimates over its entire calibration window length and the remaining estimates extracted from the last year of calibration of each subsequent model The revised methodology consists of multiple 9-year calibration windows For each site and constituent up to 14 models were computed Load estimates were taken from the fifth (center) year of each calibration window and entered into a data base The final four years of load estimates are preliminary and will be updated each year A new Estimator model is run annually for each site and constituent the most recent year is added and the previous four years of load estimates are revised The fifth year is considered the best estimate and kept in the data base The resulting data base is populated by load estimates that are known with more certainty than the historical load estimates
The new procedure was developed to minimize the effects that changing concentration-discharge relations in a river have on the regression Additionally the new methodology eliminates the use of end-of-regression load estimates which have been found to be overly sensitive to the fit of the time and time squared parameters and minimizes the effect of changing sampling frequencies in the monitoring record
It has been shown that the last year of estimates undergoes the most change from a previous year and this change usually decreases until made ldquofinalrdquo at the fifth year This finding is consistent with the premise that the last year of load estimates in any calibration window has the greatest uncertainty
A comparison between all of the historical and revised annual load estimates showed variable consistency The estimates for total nitrogen at all four sites are typically consistent and are within the error bars Total kjeldahl nitrogen and nitrite plus nitrate are also reasonably consistent Annual load estimates for suspended sediment
the three phosphorus species and ammonia have larger differences but these constituents also have wider error bars associated with them In general for some select years and monitoring stations the differences between load estimates are relatively large and are beyond the error bars but this is not commonmdashload estimates for these rivers do not change drastically when the new methodology is applied
This revised load computation methodology provides greater confidence in load estimates at the River Input Program monitoring stations Load estimation at these monitoring stations is an evolving process however This report documents various processes and shifting relations during the study period Load-estimation procedures will likely change in the future as the in-stream processes of these diverse rivers are more clearly understood and new statistical tools are implemented
References Cited
Bradu D and Mundlak Y 1970 Estimation of lognormal linear models Journal of the American Statistical Association 65 (329) p 198ndash211
Cohn TA 1988 Adjusted maximum likelihood estimation of the moments of lognormal populations from type I censored samples US Geological Survey Open-File Report 88ndash350 34 p
Cohn TA Delong LL Gilroy EJ Hirsch RM and Wells D 1989 Estimating constituent loads Water Resources Research v 25 no 5 p 937ndash942
Cohn TA Caulder DL Gilroy EJ Zynjuk LD and Summers RM 1992 The validity of a simple log-linear model for estimating fluvial constituent loads An empirical study involving nutrient loads entering Chesapeake Bay Water Resources Research v 28 no 9 p 2353ndash2364
Darrell LC Majedi BF Lizarraga JS and Blomquist JD 1999 Nutrient and suspended-sediment concentrations trends loads and yields from the nontidal part of the Susquehanna Potomac Patuxent and Choptank Rivers 1985ndash96 US Geological Survey Water-Resources Investigations Report 98ndash4177 38 p
Gilroy EJ Hirsch RM and Cohn TA 1990 Mean square error of regression-based constituent transport estimates Water Resources Research v 26 no 9 p 2069ndash2077
Lang DJ 1982 Water quality of the three major tributaries to the Chesapeake Bay the Susquehanna Potomac and James Rivers January 1979ndashApril 1981 US Geological Survey Water-Resources Investigations Report 82ndash32 64 p
Robertson DM and Roerish ED 1999 Influence of various water quality sampling strategies on load estimates for small streams Water Resources Research v 35 no 12 December p 3747ndash3759
Summary and Conclusions 11
APPENDIXES A AND B FOLLOW
A Revised Load Estimation Procedure for the Susquehanna Potomac Patuxent and Choptank Rivers 12
Appendix A Annual load estimates for the River Input monitoring stations on the Susquehanna Potomac Patuxent and Choptank Rivers
[kgyr kilograms per year +- plusminus the standard errors of prediction are also provided The standard error of prediction is a measure of the expected difference between an individual estimate and the estimated daily load Bold numbers indicate preliminary load estimates that will be revised For the most up-to-date annual and monthly load estimates see the USGS River Input Monitoring Program web site at httpwww-vausgsgovchesbayRIMP]
Parameter Constituent Reported as
P00600 Total nitrogen N
P00608 Dissolved ammonia N
P00613 Dissolved nitrite N
P00623 Dissolved kjeldahl nitrogen N
P00625 Total kjeldahl nitrogen N
P00631 Dissolved nitrite + nitrate N
P00665 Total phosphorus P
P00666 Dissolved phosphorus P
P00671 Orthophosphorus P
P00680 Total organic carbon C
P00955 Dissolved silica Si and SiO2
P80154 Suspended sediment not applicable
Appendix A 13
Appendix A Annual load estimates for the River Input monitoring stations on the Susquehanna Potomac Patuxent and Choptank RiversndashContinued
Standard Error of Prediction
Annual load +- +- ModelStation no Parameter Year (kgyr) (kgyr) Percent window
Susquehanna River at Conowingo Dam (01578310)
01578310 P00600 1979 76200000 3210000 4 79 - 87
01578310 P00600 1980 43400000 1560000 4 79 - 87
01578310 P00600 1981 50400000 1880000 4 79 - 87
01578310 P00600 1982 60200000 2480000 4 79 - 87
01578310 P00600 1983 77300000 3400000 4 79 - 87
01578310 P00600 1984 94500000 4070000 4 80 - 88
01578310 P00600 1985 58300000 2190000 4 81 - 89
01578310 P00600 1986 75700000 2360000 3 82 - 90
01578310 P00600 1987 57200000 1580000 3 83 - 91
01578310 P00600 1988 46700000 1360000 3 84 - 92
01578310 P00600 1989 64000000 1830000 3 85 - 93
01578310 P00600 1990 78300000 2210000 3 86 - 94
01578310 P00600 1991 48200000 1540000 3 87 - 95
01578310 P00600 1992 54100000 1470000 3 88 - 96
01578310 P00600 1993 82700000 2330000 3 89 - 97
01578310 P00600 1994 76100000 2060000 3 90 - 98
01578310 P00600 1995 41300000 1460000 4 91 - 99
01578310 P00600 1996 94500000 2810000 3 91 - 99
01578310 P00600 1997 43400000 1430000 3 91 - 99
01578310 P00600 1998 61300000 2160000 4 91 - 99
01578310 P00600 1999 40200000 1910000 5 91 - 99
01578310 P00608 1979 3320000 470000 14 79 - 87
01578310 P00608 1980 2450000 276000 11 79 - 87
01578310 P00608 1981 3160000 345000 11 79 - 87
01578310 P00608 1982 4150000 503000 12 79 - 87
01578310 P00608 1983 5490000 719000 13 79 - 87
01578310 P00608 1984 5980000 739000 12 80 - 88
01578310 P00608 1985 3210000 315000 10 81 - 89
01578310 P00608 1986 3970000 346000 9 82 - 90
01578310 P00608 1987 3010000 237000 8 83 - 91
01578310 P00608 1988 2470000 190000 8 84 - 92
01578310 P00608 1989 3360000 256000 8 85 - 93
01578310 P00608 1990 3570000 243000 7 86 - 94
01578310 P00608 1991 2520000 201000 8 87 - 95
01578310 P00608 1992 2540000 197000 8 88 - 96
01578310 P00608 1993 4420000 362000 8 89 - 97
A Revised Load Estimation Procedure for the Susquehanna Potomac Patuxent and Choptank Rivers 14
Appendix A Annual load estimates for the River Input monitoring stations on the Susquehanna Potomac Patuxent and Choptank RiversndashContinued
Standard Error of Prediction
Annual load +- +- ModelStation no Parameter Year (kgyr) (kgyr) Percent window
Susquehanna River at Conowingo Dam (01578310)mdashContinued
01578310 P00608 1994 3610000 283000 8 90 - 98
01578310 P00608 1995 1660000 151000 9 91 - 99
01578310 P00608 1996 3820000 325000 9 91 - 99
01578310 P00608 1997 1710000 148000 9 91 - 99
01578310 P00608 1998 2570000 247000 10 91 - 99
01578310 P00608 1999 1590000 202000 13 91 - 99
01578310 P00613 1985 661000 74900 11 85 - 93
01578310 P00613 1986 781000 62100 8 85 - 93
01578310 P00613 1987 677000 44700 7 85 - 93
01578310 P00613 1988 592000 41400 7 85 - 93
01578310 P00613 1989 774000 58500 8 85 - 93
01578310 P00613 1990 806000 58800 7 86 - 94
01578310 P00613 1991 554000 47900 9 87 - 95
01578310 P00613 1992 668000 60400 9 88 - 96
01578310 P00613 1993 694000 62000 9 89 - 97
01578310 P00613 1994 649000 65800 10 90 - 98
01578310 P00613 1995 407000 49100 12 91 - 99
01578310 P00613 1996 604000 64300 11 91 - 99
01578310 P00613 1997 414000 45800 11 91 - 99
01578310 P00613 1998 517000 64700 13 91 - 99
01578310 P00613 1999 479000 85200 18 91 - 99
01578310 P00623 1985 14700000 1200000 8 85 - 93
01578310 P00623 1986 19300000 1170000 6 85 - 93
01578310 P00623 1987 13800000 662000 5 85 - 93
01578310 P00623 1988 10800000 529000 5 85 - 93
01578310 P00623 1989 14200000 738000 5 85 - 93
01578310 P00623 1990 14500000 722000 5 86 - 94
01578310 P00623 1991 8000000 470000 6 87 - 95
01578310 P00623 1992 8050000 407000 5 88 - 96
01578310 P00623 1993 11900000 682000 6 89 - 97
01578310 P00623 1994 9770000 552000 6 90 - 98
01578310 P00623 1995 4730000 319000 7 91 - 99
01578310 P00623 1996 12100000 740000 6 91 - 99
01578310 P00623 1997 5010000 310000 6 91 - 99
01578310 P00623 1998 7740000 530000 7 91 - 99
01578310 P00623 1999 5350000 491000 9 91 - 99
Appendix A 15
Appendix A Annual load estimates for the River Input monitoring stations on the Susquehanna Potomac Patuxent and Choptank RiversndashContinued
Standard Error of Prediction
Annual load +- +- ModelStation no Parameter Year (kgyr) (kgyr) Percent window
Susquehanna River at Conowingo Dam (01578310)mdashContinued
01578310 P00625 1979 23100000 1870000 8 79 - 87
01578310 P00625 1980 14000000 984000 7 79 - 87
01578310 P00625 1981 17100000 1230000 7 79 - 87
01578310 P00625 1982 21200000 1680000 8 79 - 87
01578310 P00625 1983 28900000 2470000 9 79 - 87
01578310 P00625 1984 41100000 3280000 8 80 - 88
01578310 P00625 1985 21400000 1350000 6 81 - 89
01578310 P00625 1986 26200000 1450000 6 82 - 90
01578310 P00625 1987 18300000 912000 5 83 - 91
01578310 P00625 1988 14200000 709000 5 84 - 92
01578310 P00625 1989 19700000 1050000 5 85 - 93
01578310 P00625 1990 20100000 1020000 5 86 - 94
01578310 P00625 1991 10700000 610000 6 87 - 95
01578310 P00625 1992 11600000 540000 5 88 - 96
01578310 P00625 1993 19900000 1100000 6 89 - 97
01578310 P00625 1994 16300000 831000 5 90 - 98
01578310 P00625 1995 7230000 439000 6 91 - 99
01578310 P00625 1996 21700000 1290000 6 91 - 99
01578310 P00625 1997 8030000 453000 6 91 - 99
01578310 P00625 1998 13800000 902000 7 91 - 99
01578310 P00625 1999 9370000 814000 9 91 - 99
01578310 P00631 1979 54500000 2580000 5 79 - 87
01578310 P00631 1980 30200000 1230000 4 79 - 87
01578310 P00631 1981 34400000 1420000 4 79 - 87
01578310 P00631 1982 40200000 1830000 5 79 - 87
01578310 P00631 1983 49500000 2390000 5 79 - 87
01578310 P00631 1984 53700000 2510000 5 80 - 88
01578310 P00631 1985 35900000 1570000 4 81 - 89
01578310 P00631 1986 48600000 1840000 4 82 - 90
01578310 P00631 1987 38400000 1280000 3 83 - 91
01578310 P00631 1988 32600000 1140000 3 84 - 92
01578310 P00631 1989 44600000 1470000 3 85 - 93
01578310 P00631 1990 58900000 1830000 3 86 - 94
01578310 P00631 1991 38300000 1310000 3 87 - 95
01578310 P00631 1992 42300000 1240000 3 88 - 96
01578310 P00631 1993 61600000 1790000 3 89 - 97
01578310 P00631 1994 59100000 1640000 3 90 - 98
A Revised Load Estimation Procedure for the Susquehanna Potomac Patuxent and Choptank Rivers 16
Appendix A Annual load estimates for the River Input monitoring stations on the Susquehanna Potomac Patuxent and Choptank RiversndashContinued
Standard Error of Prediction
Annual load +- +- ModelStation no Parameter Year (kgyr) (kgyr) Percent window
Susquehanna River at Conowingo Dam (01578310)mdashContinued
01578310 P00631 1995 35400000 1340000 4 91 - 99
01578310 P00631 1996 74000000 2350000 3 91 - 99
01578310 P00631 1997 35800000 1280000 4 91 - 99
01578310 P00631 1998 46400000 1810000 4 91 - 99
01578310 P00631 1999 29500000 1560000 5 91 - 99
01578310 P00665 1979 4480000 551000 12 79 - 87
01578310 P00665 1980 1960000 195000 10 79 - 87
01578310 P00665 1981 2050000 230000 11 79 - 87
01578310 P00665 1982 2150000 220000 10 79 - 87
01578310 P00665 1983 2980000 353000 12 79 - 87
01578310 P00665 1984 3490000 424000 12 80 - 88
01578310 P00665 1985 1440000 127000 9 81 - 89
01578310 P00665 1986 2110000 178000 8 82 - 90
01578310 P00665 1987 1460000 104000 7 83 - 91
01578310 P00665 1988 1170000 86500 7 84 - 92
01578310 P00665 1989 1920000 155000 8 85 - 93
01578310 P00665 1990 2210000 172000 8 86 - 94
01578310 P00665 1991 1140000 95700 8 87 - 95
01578310 P00665 1992 1130000 83900 7 88 - 96
01578310 P00665 1993 3330000 380000 11 89 - 97
01578310 P00665 1994 2470000 256000 10 90 - 98
01578310 P00665 1995 840000 86300 10 91 - 99
01578310 P00665 1996 4160000 555000 13 91 - 99
01578310 P00665 1997 870000 78700 9 91 - 99
01578310 P00665 1998 1920000 231000 12 91 - 99
01578310 P00665 1999 1060000 152000 14 91 - 99
01578310 P00666 1979 1200000 135000 11 79 - 87
01578310 P00666 1980 524000 50600 10 79 - 87
01578310 P00666 1981 558000 56700 10 79 - 87
01578310 P00666 1982 571000 62500 11 79 - 87
01578310 P00666 1983 680000 80200 12 79 - 87
01578310 P00666 1984 764000 87200 11 80 - 88
01578310 P00666 1985 495000 52900 11 81 - 89
01578310 P00666 1986 660000 65800 10 82 - 90
01578310 P00666 1987 471000 42600 9 83 - 91
01578310 P00666 1988 345000 31700 9 84 - 92
Appendix A 17
Appendix A Annual load estimates for the River Input monitoring stations on the Susquehanna Potomac Patuxent and Choptank RiversndashContinued
Standard Error of Prediction
Annual load +- +- ModelStation no Parameter Year (kgyr) (kgyr) Percent window
Susquehanna River at Conowingo Dam (01578310)mdashContinued
01578310 P00666 1989 489000 42600 9 85 - 93
01578310 P00666 1990 697000 61900 9 86 - 94
01578310 P00666 1991 323000 30000 9 87 - 95
01578310 P00666 1992 425000 34400 8 88 - 96
01578310 P00666 1993 698000 57200 8 89 - 97
01578310 P00666 1994 675000 58700 9 90 - 98
01578310 P00666 1995 350000 34300 10 91 - 99
01578310 P00666 1996 994000 87700 9 91 - 99
01578310 P00666 1997 370000 33800 9 91 - 99
01578310 P00666 1998 552000 57200 10 91 - 99
01578310 P00666 1999 350000 48200 14 91 - 99
01578310 P00671 1979 1070000 166000 16 79 - 87
01578310 P00671 1980 478000 65100 14 79 - 87
01578310 P00671 1981 524000 73200 14 79 - 87
01578310 P00671 1982 544000 81500 15 79 - 87
01578310 P00671 1983 617000 96900 16 79 - 87
01578310 P00671 1984 646000 103000 16 80 - 88
01578310 P00671 1985 348000 51300 15 81 - 89
01578310 P00671 1986 432000 56700 13 82 - 90
01578310 P00671 1987 337000 42900 13 83 - 91
01578310 P00671 1988 222000 29600 13 84 - 92
01578310 P00671 1989 291000 37000 13 85 - 93
01578310 P00671 1990 425000 55500 13 86 - 94
01578310 P00671 1991 202000 30800 15 87 - 95
01578310 P00671 1992 260000 34300 13 88 - 96
01578310 P00671 1993 424000 55500 13 89 - 97
01578310 P00671 1994 404000 55300 14 90 - 98
01578310 P00671 1995 255000 43800 17 91 - 99
01578310 P00671 1996 669000 103000 15 91 - 99
01578310 P00671 1997 259000 42000 16 91 - 99
01578310 P00671 1998 365000 65800 18 91 - 99
01578310 P00671 1999 180000 41200 23 91 - 99
01578310 P00680 1985 92400000 4900000 5 85 - 93
01578310 P00680 1986 135000000 5830000 4 85 - 93
01578310 P00680 1987 93900000 3170000 3 85 - 93
01578310 P00680 1988 75900000 2630000 3 85 - 93
A Revised Load Estimation Procedure for the Susquehanna Potomac Patuxent and Choptank Rivers 18
Appendix A Annual load estimates for the River Input monitoring stations on the Susquehanna Potomac Patuxent and Choptank RiversndashContinued
Standard Error of Prediction
Annual load +- +- ModelStation no Parameter Year (kgyr) (kgyr) Percent window
Susquehanna River at Conowingo Dam (01578310)mdashContinued
01578310 P00680 1989 134000000 5180000 4 85 - 93
01578310 P00680 1990 149000000 5320000 4 86 - 94
01578310 P00680 1991 80400000 2660000 3 87 - 95
01578310 P00680 1992 102000000 2970000 3 88 - 96
01578310 P00680 1993 218000000 8000000 4 89 - 97
01578310 P00680 1994 198000000 6730000 3 90 - 98
01578310 P00680 1995 83600000 3260000 4 91 - 99
01578310 P00680 1996 267000000 10600000 4 91 - 99
01578310 P00680 1997 85300000 3110000 4 91 - 99
01578310 P00680 1998 140000000 5980000 4 91 - 99
01578310 P00680 1999 76300000 4300000 6 91 - 99
Appendix A 19
Appendix A Annual load estimates for the River Input monitoring stations on the Susquehanna Potomac Patuxent and Choptank RiversndashContinued
Standard Error of Prediction
Annual load Annual load +- +- Model Station no Parameter Year (kgyr SiO2) (kgyr Si) (kgyr SiO2) Percent window
Susquehanna River at Conowingo Dam (01578310)ndashContinued
01578310 P00955 1979 194000000 90700000 16800000 9 79 - 87
01578310 P00955 1980 87600000 41000000 6580000 8 79 - 87
01578310 P00955 1981 89400000 41800000 6830000 8 79 - 87
01578310 P00955 1982 100000000 47000000 7910000 8 79 - 87
01578310 P00955 1983 130000000 60900000 11000000 8 79 - 87
01578310 P00955 1984 175000000 81700000 15300000 9 80 - 88
01578310 P00955 1985 107000000 50200000 8200000 8 81 - 89
01578310 P00955 1986 160000000 74900000 11600000 7 82 - 90
01578310 P00955 1987 112000000 52300000 6750000 6 83 - 91
01578310 P00955 1988 93700000 43800000 5860000 6 84 - 92
01578310 P00955 1989 139000000 64900000 8290000 6 85 - 93
01578310 P00955 1990 189000000 88200000 11600000 6 86 - 94
01578310 P00955 1991 101000000 47200000 7380000 7 87 - 95
01578310 P00955 1992 116000000 54100000 7280000 6 88 - 96
01578310 P00955 1993 204000000 95500000 15200000 7 89 - 97
01578310 P00955 1994 186000000 87100000 12900000 7 90 - 98
01578310 P00955 1995 94500000 44200000 8110000 9 91 - 99
01578310 P00955 1996 259000000 121000000 20400000 8 91 - 99
01578310 P00955 1997 91600000 42800000 7470000 8 91 - 99
01578310 P00955 1998 135000000 63300000 12600000 9 91 - 99
01578310 P00955 1999 72600000 33900000 8920000 12 91 - 99
A Revised Load Estimation Procedure for the Susquehanna Potomac Patuxent and Choptank Rivers 20
Appendix A Annual load estimates for the River Input monitoring stations on the Susquehanna Potomac Patuxent and Choptank RiversndashContinued
Standard Error of Prediction
Annual load +- +- ModelStation no Parameter Year (kgyr) (kgyr) Percent window
Susquehanna River at Conowingo Dam (01578310)ndashContinued
01578310 P80154 1979 2700000000 458000000 17 79 - 87
01578310 P80154 1980 878000000 95500000 11 79 - 87
01578310 P80154 1981 942000000 140000000 15 79 - 87
01578310 P80154 1982 938000000 107000000 11 79 - 87
01578310 P80154 1983 1730000000 236000000 14 79 - 87
01578310 P80154 1984 2850000000 467000000 16 80 - 88
01578310 P80154 1985 516000000 40700000 8 81 - 89
01578310 P80154 1986 1110000000 122000000 11 82 - 90
01578310 P80154 1987 535000000 43400000 8 83 - 91
01578310 P80154 1988 397000000 30100000 8 84 - 92
01578310 P80154 1989 942000000 67700000 7 85 - 93
01578310 P80154 1990 861000000 49800000 6 86 - 94
01578310 P80154 1991 419000000 27400000 7 87 - 95
01578310 P80154 1992 422000000 25300000 6 88 - 96
01578310 P80154 1993 3080000000 340000000 11 89 - 97
01578310 P80154 1994 1970000000 192000000 10 90 - 98
01578310 P80154 1995 397000000 34600000 9 91 - 99
01578310 P80154 1996 3680000000 584000000 16 91 - 99
01578310 P80154 1997 364000000 26400000 7 91 - 99
01578310 P80154 1998 1110000000 123000000 11 91 - 99
01578310 P80154 1999 349000000 44600000 13 91 - 99
Appendix A 21
Appendix A Annual load estimates for the River Input monitoring stations on the Susquehanna Potomac Patuxent and Choptank RiversndashContinued
Standard Error of Prediction
Annual load +- +- Model Station no Parameter Year (kgyr) (kgyr) Percent window
Potomac River at Chain Bridge (01646580)
01646580 P00600 1979 41100000 2220000 5 79 - 87
01646580 P00600 1980 20200000 812000 4 79 - 87
01646580 P00600 1981 10600000 386000 4 79 - 87
01646580 P00600 1982 22200000 842000 4 79 - 87
01646580 P00600 1983 34200000 1340000 4 79 - 87
01646580 P00600 1984 40300000 1780000 4 80 - 88
01646580 P00600 1985 27700000 1500000 5 81 - 89
01646580 P00600 1986 16400000 622000 4 82 - 90
01646580 P00600 1987 23200000 792000 3 83 - 91
01646580 P00600 1988 17200000 657000 4 84 - 92
01646580 P00600 1989 23500000 711000 3 85 - 93
01646580 P00600 1990 19400000 475000 2 86 - 94
01646580 P00600 1991 16600000 503000 3 87 - 95
01646580 P00600 1992 17700000 496000 3 88 - 96
01646580 P00600 1993 36700000 1200000 3 89 - 97
01646580 P00600 1994 33900000 992000 3 90 - 98
01646580 P00600 1995 17800000 443000 2 91 - 99
01646580 P00600 1996 60900000 1580000 3 91 - 99
01646580 P00600 1997 18700000 469000 3 91 - 99
01646580 P00600 1998 34700000 993000 3 91 - 99
01646580 P00600 1999 9770000 284000 3 91 - 99
01646580 P00608 1979 1480000 352000 24 79 - 87
01646580 P00608 1980 686000 104000 15 79 - 87
01646580 P00608 1981 353000 46800 13 79 - 87
01646580 P00608 1982 728000 104000 14 79 - 87
01646580 P00608 1983 1080000 165000 15 79 - 87
01646580 P00608 1984 1320000 240000 20 80 - 88
01646580 P00608 1985 863000 322000 37 81 - 89
01646580 P00608 1986 375000 79700 21 82 - 90
01646580 P00608 1987 586000 125000 21 83 - 91
01646580 P00608 1988 473000 115000 24 84 - 92
01646580 P00608 1989 484000 73100 15 85 - 93
01646580 P00608 1990 323000 51400 16 86 - 94
01646580 P00608 1991 288000 54000 19 87 - 95
01646580 P00608 1992 290000 44300 15 88 - 96
01646580 P00608 1993 829000 156000 19 89 - 97
A Revised Load Estimation Procedure for the Susquehanna Potomac Patuxent and Choptank Rivers 22
Appendix A Annual load estimates for the River Input monitoring stations on the Susquehanna Potomac Patuxent and Choptank RiversndashContinued
Standard Error of Prediction
Annual load +- +- Model Station no Parameter Year (kgyr) (kgyr) Percent window
Potomac River at Chain Bridge (01646580)mdashContinued
01646580 P00608 1994 736000 114000 16 90 - 98
01646580 P00608 1995 261000 28900 11 91 - 99
01646580 P00608 1996 1470000 263000 18 91 - 99
01646580 P00608 1997 359000 43300 12 91 - 99
01646580 P00608 1998 1040000 138000 13 91 - 99
01646580 P00608 1999 247000 29800 12 91 - 99
01646580 P00613 1985 135000 24400 18 85 - 93
01646580 P00613 1986 110000 15300 14 85 - 93
01646580 P00613 1987 157000 18600 12 85 - 93
01646580 P00613 1988 120000 15100 13 85 - 93
01646580 P00613 1989 154000 18500 12 85 - 93
01646580 P00613 1990 119000 12700 11 86 - 94
01646580 P00613 1991 123000 15600 13 87 - 95
01646580 P00613 1992 111000 9640 9 88 - 96
01646580 P00613 1993 263000 28600 11 89 - 97
01646580 P00613 1994 245000 23600 10 90 - 98
01646580 P00613 1995 134000 11800 9 91 - 99
01646580 P00613 1996 467000 41100 9 91 - 99
01646580 P00613 1997 147000 12600 9 91 - 99
01646580 P00613 1998 278000 270000 10 91 - 99
01646580 P00613 1999 82100 9260 11 91 - 99
01646580 P00623 1983 7490000 575000 8 83 - 91
01646580 P00623 1984 8180000 549000 7 83 - 91
01646580 P00623 1985 5150000 431000 8 83 - 91
01646580 P00623 1986 3090000 190000 6 83 - 91
01646580 P00623 1987 4230000 271000 6 83 - 91
01646580 P00623 1988 3030000 223000 7 84 - 92
01646580 P00623 1989 3590000 233000 6 85 - 93
01646580 P00623 1990 2550000 149000 6 86 - 94
01646580 P00623 1991 1860000 151000 8 87 - 95
01646580 P00623 1992 2020000 129000 6 88 - 96
01646580 P00623 1993 4210000 327000 8 89 - 97
01646580 P00623 1994 3890000 246000 6 90 - 98
01646580 P00623 1995 2020000 97500 5 91 - 99
01646580 P00623 1996 9140000 628000 7 91 - 99
01646580 P00623 1997 2480000 129000 5 91 - 99
Appendix A 23
Appendix A Annual load estimates for the River Input monitoring stations on the Susquehanna Potomac Patuxent and Choptank RiversndashContinued
Standard Error of Prediction
Annual load +- +- Model Station no Parameter Year (kgyr) (kgyr) Percent window
Potomac River at Chain Bridge (01646580)mdashContinued
01646580 P00623 1998 5580000 318000 6 91 - 99
01646580 P00623 1999 1900000 103000 5 91 - 99
01646580 P00625 1979 15000000 1420000 9 79 - 87
01646580 P00625 1980 7170000 485000 7 79 - 87
01646580 P00625 1981 3850000 229000 6 79 - 87
01646580 P00625 1982 8810000 611000 7 79 - 87
01646580 P00625 1983 14900000 1060000 7 79 - 87
01646580 P00625 1984 19800000 1780000 9 80 - 88
01646580 P00625 1985 13500000 2170000 16 81 - 89
01646580 P00625 1986 5780000 531000 9 82 - 90
01646580 P00625 1987 8870000 839000 9 83 - 91
01646580 P00625 1988 6710000 697000 10 84 - 92
01646580 P00625 1989 7130000 513000 7 85 - 93
01646580 P00625 1990 4000000 239000 6 86 - 94
01646580 P00625 1991 3300000 254000 8 87 - 95
01646580 P00625 1992 3700000 270000 7 88 - 96
01646580 P00625 1993 9720000 862000 9 89 - 97
01646580 P00625 1994 8160000 623000 8 90 - 98
01646580 P00625 1995 3680000 217000 6 91 - 99
01646580 P00625 1996 21700000 2120000 10 91 - 99
01646580 P00625 1997 4510000 304000 7 91 - 99
01646580 P00625 1998 11600000 789000 7 91 - 99
01646580 P00625 1999 2870000 180000 6 91 - 99
01646580 P00631 1979 27400000 2660000 10 79 - 87
01646580 P00631 1980 13800000 1040000 8 79 - 87
01646580 P00631 1981 7110000 479000 7 79 - 87
01646580 P00631 1982 14000000 950000 7 79 - 87
01646580 P00631 1983 20100000 1360000 7 79 - 87
01646580 P00631 1984 21200000 1460000 7 80 - 88
01646580 P00631 1985 16600000 1230000 7 81 - 89
01646580 P00631 1986 10600000 682000 6 82 - 90
01646580 P00631 1987 13900000 741000 5 83 - 91
01646580 P00631 1988 10300000 600000 6 84 - 92
01646580 P00631 1989 16700000 810000 5 85 - 93
01646580 P00631 1990 17300000 781000 5 86 - 94
01646580 P00631 1991 13500000 603000 4 87 - 95
A Revised Load Estimation Procedure for the Susquehanna Potomac Patuxent and Choptank Rivers 24
Appendix A Annual load estimates for the River Input monitoring stations on the Susquehanna Potomac Patuxent and Choptank RiversndashContinued
Standard Error of Prediction
Annual load +- +- Model Station no Parameter Year (kgyr) (kgyr) Percent window
Potomac River at Chain Bridge (01646580)mdashContinued
01646580 P00631 1992 14400000 541000 4 88 - 96
01646580 P00631 1993 26400000 996000 4 89 - 97
01646580 P00631 1994 24800000 836000 3 90 - 98
01646580 P00631 1995 15000000 490000 3 91 - 99
01646580 P00631 1996 41500000 1220000 3 91 - 99
01646580 P00631 1997 14300000 458000 3 91 - 99
01646580 P00631 1998 21600000 790000 4 91 - 99
01646580 P00631 1999 6730000 262000 4 91 - 99
01646580 P00665 1979 4010000 499000 12 79 - 87
01646580 P00665 1980 1410000 124000 9 79 - 87
01646580 P00665 1981 680000 53900 8 79 - 87
01646580 P00665 1982 1740000 167000 10 79 - 87
01646580 P00665 1983 3020000 286000 9 79 - 87
01646580 P00665 1984 3780000 456000 12 80 - 88
01646580 P00665 1985 3690000 1010000 27 81 - 89
01646580 P00665 1986 877000 111000 13 82 - 90
01646580 P00665 1987 1560000 213000 14 83 - 91
01646580 P00665 1988 1350000 228000 17 84 - 92
01646580 P00665 1989 1480000 154000 10 85 - 93
01646580 P00665 1990 954000 110000 11 86 - 94
01646580 P00665 1991 654000 82600 13 87 - 95
01646580 P00665 1992 800000 97400 12 88 - 96
01646580 P00665 1993 2390000 343000 14 89 - 97
01646580 P00665 1994 1800000 215000 12 90 - 98
01646580 P00665 1995 680000 67800 10 91 - 99
01646580 P00665 1996 7110000 1490000 21 91 - 99
01646580 P00665 1997 954000 140000 15 91 - 99
01646580 P00665 1998 3020000 328000 11 91 - 99
01646580 P00665 1999 659000 62400 9 91 - 99
01646580 P00666 1979 976000 116000 12 79 - 87
01646580 P00666 1980 424000 36400 9 79 - 87
01646580 P00666 1981 263000 20100 8 79 - 87
01646580 P00666 1982 547000 45100 8 79 - 87
01646580 P00666 1983 878000 79300 9 79 - 87
01646580 P00666 1984 955000 91900 10 80 - 88
01646580 P00666 1985 808000 139000 17 81 - 89
Appendix A 25
Appendix A Annual load estimates for the River Input monitoring stations on the Susquehanna Potomac Patuxent and Choptank RiversndashContinued
Standard Error of Prediction
Annual load +- +- Model Station no Parameter Year (kgyr) (kgyr) Percent window
Potomac River at Chain Bridge (01646580)mdashContinued
01646580 P00666 1986 342000 35400 10 82 - 90
01646580 P00666 1987 482000 50300 10 83 - 91
01646580 P00666 1988 363000 52000 14 84 - 92
01646580 P00666 1989 555000 55800 10 85 - 93
01646580 P00666 1990 541000 68100 13 86 - 94
01646580 P00666 1991 298000 41900 14 87 - 95
01646580 P00666 1992 371000 42700 12 88 - 96
01646580 P00666 1993 645000 88200 14 89 - 97
01646580 P00666 1994 530000 58600 11 90 - 98
01646580 P00666 1995 251000 23600 9 91 - 99
01646580 P00666 1996 1510000 223000 15 91 - 99
01646580 P00666 1997 353000 43000 12 91 - 99
01646580 P00666 1998 917000 95600 10 91 - 99
01646580 P00666 1999 397000 40000 10 91 - 99
01646580 P00671 1979 659000 106000 16 79 - 87
01646580 P00671 1980 291000 36100 12 79 - 87
01646580 P00671 1981 183000 19700 11 79 - 87
01646580 P00671 1982 382000 40400 11 79 - 87
01646580 P00671 1983 613000 66200 11 79 - 87
01646580 P00671 1984 633000 68300 11 80 - 88
01646580 P00671 1985 542000 99500 18 81 - 89
01646580 P00671 1986 218000 26200 12 82 - 90
01646580 P00671 1987 311000 34100 11 83 - 91
01646580 P00671 1988 238000 36300 15 84 - 92
01646580 P00671 1989 445000 47800 11 85 - 93
01646580 P00671 1990 587000 108000 18 86 - 94
01646580 P00671 1991 254000 41600 16 87 - 95
01646580 P00671 1992 308000 37200 12 88 - 96
01646580 P00671 1993 543000 76300 14 89 - 97
01646580 P00671 1994 455000 54500 12 90 - 98
01646580 P00671 1995 187000 18900 10 91 - 99
01646580 P00671 1996 1160000 196000 17 91 - 99
01646580 P00671 1997 244000 32000 13 91 - 99
01646580 P00671 1998 643000 72100 11 91 - 99
01646580 P00671 1999 242000 25700 11 91 - 99
A Revised Load Estimation Procedure for the Susquehanna Potomac Patuxent and Choptank Rivers 26
Appendix A Annual load estimates for the River Input monitoring stations on the Susquehanna Potomac Patuxent and Choptank RiversndashContinued
Standard Error of Prediction
Annual load +- +- Model Station no Parameter Year (kgyr) (kgyr) Percent window
Potomac River at Chain Bridge (01646580)mdashContinued
01646580 P00680 1988 38300000 3820000 10 88 - 96
01646580 P00680 1989 55100000 3470000 6 88 - 96
01646580 P00680 1990 48400000 2760000 6 88 - 96
01646580 P00680 1991 44300000 2920000 7 88 - 96
01646580 P00680 1992 44900000 2540000 6 88 - 96
01646580 P00680 1993 104000000 7250000 7 89 - 97
01646580 P00680 1994 81300000 4330000 5 90 - 98
01646580 P00680 1995 32300000 1370000 4 91 - 99
01646580 P00680 1996 166000000 11500000 7 91 - 99
01646580 P00680 1997 34600000 1710000 5 91 - 99
01646580 P00680 1998 78400000 3950000 5 91 - 99
01646580 P00680 1999 21500000 1030000 5 91 - 99
Appendix A 27
Appendix A Annual load estimates for the River Input monitoring stations on the Susquehanna Potomac Patuxent and Choptank RiversndashContinued
Standard Error of Prediction
Annual load Annual load +- +- Model Station no Parameter Year (kgyr SiO2) (kgyr Si) (kgyr SiO2) Percent window
Potomac River at Chain Bridge (01646580)mdashContinued
01646580 P00955 1979 155000000 72300000 30000000 19 79 - 87
01646580 P00955 1980 57000000 26700000 8700000 15 79 - 87
01646580 P00955 1981 29100000 13600000 4070000 14 79 - 87
01646580 P00955 1982 65000000 30400000 11100000 17 79 - 87
01646580 P00955 1983 107000000 49900000 18100000 17 79 - 87
01646580 P00955 1984 140000000 65300000 29400000 21 80 - 88
01646580 P00955 1985 140000000 65200000 62900000 45 81 - 89
01646580 P00955 1986 39700000 18600000 8330000 21 82 - 90
01646580 P00955 1987 68500000 32000000 13500000 20 83 - 91
01646580 P00955 1988 67800000 31700000 18800000 28 84 - 92
01646580 P00955 1989 95700000 44700000 15400000 16 85 - 93
01646580 P00955 1990 79200000 37000000 15000000 19 86 - 94
01646580 P00955 1991 49500000 23200000 8340000 17 87 - 95
01646580 P00955 1992 56900000 26600000 6730000 12 88 - 96
01646580 P00955 1993 104000000 48700000 15600000 15 89 - 97
01646580 P00955 1994 95700000 44700000 12800000 13 90 - 98
01646580 P00955 1995 46500000 21700000 5760000 12 91 - 99
01646580 P00955 1996 265000000 124000000 54600000 21 91 - 99
01646580 P00955 1997 50200000 23500000 7080000 14 91 - 99
01646580 P00955 1998 127000000 59500000 19400000 15 91 - 99
01646580 P00955 1999 29600000 13800000 4200000 14 91 - 99
A Revised Load Estimation Procedure for the Susquehanna Potomac Patuxent and Choptank Rivers 28
Appendix A Annual load estimates for the River Input monitoring stations on the Susquehanna Potomac Patuxent and Choptank RiversndashContinued
Standard Error of Prediction
Annual load +- +- Model Station no Parameter Year (kgyr) (kgyr) Percent window
Potomac River at Chain Bridge (01646580)mdashContinued
01646580 P80154 1979 4130000000 833000000 20 79 - 87
01646580 P80154 1980 1090000000 148000000 14 79 - 87
01646580 P80154 1981 369000000 56900000 15 79 - 87
01646580 P80154 1982 1480000000 322000000 22 79 - 87
01646580 P80154 1983 2980000000 564000000 19 79 - 87
01646580 P80154 1984 7450000000 3110000000 42 80 - 88
01646580 P80154 1985 7530000000 5480000000 73 81 - 89
01646580 P80154 1986 684000000 229000000 34 82 - 90
01646580 P80154 1987 2100000000 737000000 35 83 - 91
01646580 P80154 1988 3050000000 1080000000 35 84 - 92
01646580 P80154 1989 1880000000 435000000 23 85 - 93
01646580 P80154 1990 876000000 228000000 26 86 - 94
01646580 P80154 1991 534000000 115000000 22 87 - 95
01646580 P80154 1992 378000000 65800000 17 88 - 96
01646580 P80154 1993 2080000000 382000000 18 89 - 97
01646580 P80154 1994 1300000000 224000000 17 90 - 98
01646580 P80154 1995 284000000 43600000 15 91 - 99
01646580 P80154 1996 5420000000 1650000000 30 91 - 99
01646580 P80154 1997 312000000 59300000 19 91 - 99
01646580 P80154 1998 1240000000 219000000 18 91 - 99
01646580 P80154 1999 73500000 12400000 17 91 - 99
Appendix A 29
Appendix A Annual load estimates for the River Input monitoring stations on the Susquehanna Potomac Patuxent and Choptank RiversndashContinued
Standard Error of Prediction
Annual load +- +- ModelStation no Parameter Year (kgyr) (kgyr) Percent window
Patuxent River near Bowie (01594440)
01594440 P00600 1978 989000 69800 7 78 - 86
01594440 P00600 1979 1560000 102000 7 78 - 86
01594440 P00600 1980 952000 38300 4 78 - 86
01594440 P00600 1981 615000 27500 4 78 - 86
01594440 P00600 1982 812000 37400 5 78 - 86
01594440 P00600 1983 1390000 73100 5 79 - 87
01594440 P00600 1984 1330000 48900 4 80 - 88
01594440 P00600 1985 805000 23600 3 81 - 89
01594440 P00600 1986 778000 21000 3 82 - 90
01594440 P00600 1987 941000 23100 2 83 - 91
01594440 P00600 1988 887000 22000 2 84 - 92
01594440 P00600 1989 1160000 31700 3 85 - 93
01594440 P00600 1990 908000 24100 3 86 - 94
01594440 P00600 1991 679000 19700 3 87 - 95
01594440 P00600 1992 591000 17200 3 88 - 96
01594440 P00600 1993 838000 26000 3 89 - 97
01594440 P00600 1994 778000 21300 3 90 - 98
01594440 P00600 1995 480000 13300 3 91 - 99
01594440 P00600 1996 1040000 25800 2 91 - 99
01594440 P00600 1997 638000 17100 3 91 - 99
01594440 P00600 1998 676000 21400 3 91 - 99
01594440 P00600 1999 484000 20500 4 91 - 99
01594440 P00608 1980 210000 34200 16 80 - 88
01594440 P00608 1981 157000 18800 12 80 - 88
01594440 P00608 1982 162000 15400 10 80 - 88
01594440 P00608 1983 202000 20300 10 80 - 88
01594440 P00608 1984 172000 15500 9 80 - 88
01594440 P00608 1985 122000 8980 7 81 - 89
01594440 P00608 1986 106000 7520 7 82 - 90
01594440 P00608 1987 99700 6920 7 83 - 91
01594440 P00608 1988 76800 5980 8 84 - 92
01594440 P00608 1989 73900 5910 8 85 - 93
01594440 P00608 1990 57400 4410 8 86 - 94
01594440 P00608 1991 48900 4450 9 87 - 95
01594440 P00608 1992 40500 3520 9 88 - 96
01594440 P00608 1993 73700 7000 10 89 - 97
A Revised Load Estimation Procedure for the Susquehanna Potomac Patuxent and Choptank Rivers 30
Appendix A Annual load estimates for the River Input monitoring stations on the Susquehanna Potomac Patuxent and Choptank RiversndashContinued
Standard Error of Prediction
Annual load +- +- ModelStation no Parameter Year (kgyr) (kgyr) Percent window
Patuxent River near Bowie (01594440)mdashContinued
01594440 P00608 1994 74300 7570 10 90 - 98
01594440 P00608 1995 39600 4090 10 91 - 99
01594440 P00608 1996 82900 7650 9 91 - 99
01594440 P00608 1997 52800 5370 10 91 - 99
01594440 P00608 1998 51100 6020 12 91 - 99
01594440 P00608 1999 27500 3960 14 91 - 99
01594440 P00613 1985 24900 3110 13 85 - 93
01594440 P00613 1986 17500 1560 9 85 - 93
01594440 P00613 1987 14300 1060 7 85 - 93
01594440 P00613 1988 11700 915 8 85 - 93
01594440 P00613 1989 12600 1210 10 85 - 93
01594440 P00613 1990 8410 680 8 86 - 94
01594440 P00613 1991 7120 635 9 87 - 95
01594440 P00613 1992 5980 470 8 88 - 96
01594440 P00613 1993 11200 916 8 89 - 97
01594440 P00613 1994 11300 973 9 90 - 98
01594440 P00613 1995 6820 623 9 91 - 99
01594440 P00613 1996 15000 1200 8 91 - 99
01594440 P00613 1997 9450 850 9 91 - 99
01594440 P00613 1998 9310 972 10 91 - 99
01594440 P00613 1999 5250 700 13 91 - 99
01594440 P00623 1985 253000 18100 7 85 - 93
01594440 P00623 1986 233000 11700 5 85 - 93
01594440 P00623 1987 258000 10600 4 85 - 93
01594440 P00623 1988 241000 10200 4 85 - 93
01594440 P00623 1989 296000 14800 5 85 - 93
01594440 P00623 1990 219000 9610 4 86 - 94
01594440 P00623 1991 155000 8100 5 87 - 95
01594440 P00623 1992 132000 6640 5 88 - 96
01594440 P00623 1993 215000 11800 5 89 - 97
01594440 P00623 1994 193000 10300 5 90 - 98
01594440 P00623 1995 110000 6140 6 91 - 99
01594440 P00623 1996 269000 13800 5 91 - 99
01594440 P00623 1997 150000 8110 5 91 - 99
01594440 P00623 1998 161000 10400 6 91 - 99
01594440 P00623 1999 109000 9310 9 91 - 99
Appendix A 31
Appendix A Annual load estimates for the River Input monitoring stations on the Susquehanna Potomac Patuxent and Choptank RiversndashContinued
Standard Error of Prediction
Annual load +- +- ModelStation no Parameter Year (kgyr) (kgyr) Percent window
Patuxent River near Bowie (01594440)mdashContinued
01594440 P00625 1978 427000 53300 12 78 - 86
01594440 P00625 1979 736000 91200 12 78 - 86
01594440 P00625 1980 376000 24400 6 78 - 86
01594440 P00625 1981 223000 15800 7 78 - 86
01594440 P00625 1982 305000 22500 7 78 - 86
01594440 P00625 1983 581000 52700 9 79 - 87
01594440 P00625 1984 557000 34600 6 80 - 88
01594440 P00625 1985 293000 15300 5 81 - 89
01594440 P00625 1986 272000 13200 5 82 - 90
01594440 P00625 1987 336000 14200 4 83 - 91
01594440 P00625 1988 296000 12300 4 84 - 92
01594440 P00625 1989 423000 22300 5 85 - 93
01594440 P00625 1990 298000 14000 5 86 - 94
01594440 P00625 1991 199000 11300 6 87 - 95
01594440 P00625 1992 182000 10100 6 88 - 96
01594440 P00625 1993 304000 18400 6 89 - 97
01594440 P00625 1994 276000 15400 6 90 - 98
01594440 P00625 1995 150000 8580 6 91 - 99
01594440 P00625 1996 409000 21500 5 91 - 99
01594440 P00625 1997 213000 11600 5 91 - 99
01594440 P00625 1998 237000 15600 7 91 - 99
01594440 P00625 1999 169000 15500 9 91 - 99
01594440 P00631 1980 539000 39000 7 80 - 88
01594440 P00631 1981 394000 20600 5 80 - 88
01594440 P00631 1982 504000 21000 4 80 - 88
01594440 P00631 1983 773000 35200 5 80 - 88
01594440 P00631 1984 754000 30400 4 80 - 88
01594440 P00631 1985 510000 15900 3 81 - 89
01594440 P00631 1986 510000 14600 3 82 - 90
01594440 P00631 1987 607000 15800 3 83 - 91
01594440 P00631 1988 596000 15800 3 84 - 92
01594440 P00631 1989 733000 20800 3 85 - 93
01594440 P00631 1990 603000 16700 3 86 - 94
01594440 P00631 1991 480000 13800 3 87 - 95
01594440 P00631 1992 400000 12600 3 88 - 96
01594440 P00631 1993 528000 17700 3 89 - 97
01594440 P00631 1994 492000 14800 3 90 - 98
A Revised Load Estimation Procedure for the Susquehanna Potomac Patuxent and Choptank Rivers 32
Appendix A Annual load estimates for the River Input monitoring stations on the Susquehanna Potomac Patuxent and Choptank RiversndashContinued
Standard Error of Prediction
Annual load +- +- ModelStation no Parameter Year (kgyr) (kgyr) Percent window
Patuxent River near Bowie (01594440)mdashContinued
01594440 P00631 1995 332000 10500 3 91 - 99
01594440 P00631 1996 635000 17800 3 91 - 99
01594440 P00631 1997 424000 12900 3 91 - 99
01594440 P00631 1998 439000 15500 4 91 - 99
01594440 P00631 1999 320000 15300 5 91 - 99
01594440 P00665 1978 165000 21600 13 78 - 86
01594440 P00665 1979 332000 40000 12 78 - 86
01594440 P00665 1980 182000 14900 8 78 - 86
01594440 P00665 1981 103000 9420 9 78 - 86
01594440 P00665 1982 135000 12900 9 78 - 86
01594440 P00665 1983 265000 31000 12 79 - 87
01594440 P00665 1984 177000 14100 8 80 - 88
01594440 P00665 1985 72700 5390 7 81 - 89
01594440 P00665 1986 55100 3610 7 82 - 90
01594440 P00665 1987 65500 4150 6 83 - 91
01594440 P00665 1988 49500 2950 6 84 - 92
01594440 P00665 1989 81300 6110 8 85 - 93
01594440 P00665 1990 53800 3390 6 86 - 94
01594440 P00665 1991 33000 2360 7 87 - 95
01594440 P00665 1992 35000 2800 8 88 - 96
01594440 P00665 1993 55700 4730 9 89 - 97
01594440 P00665 1994 51600 3920 8 90 - 98
01594440 P00665 1995 29500 2600 9 91 - 99
01594440 P00665 1996 85700 7120 8 91 - 99
01594440 P00665 1997 36400 2930 8 91 - 99
01594440 P00665 1998 38400 3710 10 91 - 99
01594440 P00665 1999 32300 5370 17 91 - 99
01594440 P00666 1978 89000 10600 12 78 - 86
01594440 P00666 1979 142000 12700 9 78 - 86
01594440 P00666 1980 119000 9120 8 78 - 86
01594440 P00666 1981 90600 8190 9 78 - 86
01594440 P00666 1982 94900 8550 9 78 - 86
01594440 P00666 1983 108000 10700 10 79 - 87
01594440 P00666 1984 61300 5040 8 80 - 88
01594440 P00666 1985 29600 1960 7 81 - 89
01594440 P00666 1986 21600 1340 6 82 - 90
Appendix A 33
Appendix A Annual load estimates for the River Input monitoring stations on the Susquehanna Potomac Patuxent and Choptank RiversndashContinued
Standard Error of Prediction
Annual load +- +- ModelStation no Parameter Year (kgyr) (kgyr) Percent window
Patuxent River near Bowie (01594440)mdashContinued
01594440 P00666 1987 18600 1050 6 83 - 91
01594440 P00666 1988 14100 805 6 84 - 92
01594440 P00666 1989 17200 1160 7 85 - 93
01594440 P00666 1990 12900 733 6 86 - 94
01594440 P00666 1991 9360 575 6 87 - 95
01594440 P00666 1992 10500 729 7 88 - 96
01594440 P00666 1993 15600 1250 8 89 - 97
01594440 P00666 1994 15600 1220 8 90 - 98
01594440 P00666 1995 9730 854 9 91 - 99
01594440 P00666 1996 21600 1800 8 91 - 99
01594440 P00666 1997 10900 886 8 91 - 99
01594440 P00666 1998 10600 1030 10 91 - 99
01594440 P00666 1999 8490 1290 15 91 - 99
01594440 P00671 1982 109000 19300 18 82 - 90
01594440 P00671 1983 96800 12200 13 82 - 90
01594440 P00671 1984 59900 5440 9 82 - 90
01594440 P00671 1985 26600 1850 7 82 - 90
01594440 P00671 1986 17700 1190 7 82 - 90
01594440 P00671 1987 15400 961 6 83 - 91
01594440 P00671 1988 11000 672 6 84 - 92
01594440 P00671 1989 12900 857 7 85 - 93
01594440 P00671 1990 10300 637 6 86 - 94
01594440 P00671 1991 7280 424 6 87 - 95
01594440 P00671 1992 8620 573 7 88 - 96
01594440 P00671 1993 12400 912 7 89 - 97
01594440 P00671 1994 13000 843 6 90 - 98
01594440 P00671 1995 9580 686 7 91 - 99
01594440 P00671 1996 21000 1440 7 91 - 99
01594440 P00671 1997 10200 674 7 91 - 99
01594440 P00671 1998 9240 722 8 91 - 99
01594440 P00671 1999 6850 840 12 91 - 99
01594440 P00680 1985 1440000 78300 5 85 - 93
01594440 P00680 1986 1230000 47800 4 85 - 93
01594440 P00680 1987 1750000 57200 3 85 - 93
01594440 P00680 1988 1720000 57200 3 85 - 93
01594440 P00680 1989 3210000 142000 4 85 - 93
A Revised Load Estimation Procedure for the Susquehanna Potomac Patuxent and Choptank Rivers 34
Appendix A Annual load estimates for the River Input monitoring stations on the Susquehanna Potomac Patuxent and Choptank RiversndashContinued
Standard Error of Prediction
Annual load +- +- ModelStation no Parameter Year (kgyr) (kgyr) Percent window
Patuxent River near Bowie (01594440)mdashContinued
01594440 P00680 1990 1980000 58400 3 86 - 94
01594440 P00680 1991 1260000 42200 3 87 - 95
01594440 P00680 1992 1430000 57700 4 88 - 96
01594440 P00680 1993 2740000 104000 4 89 - 97
01594440 P00680 1994 2730000 93600 3 90 - 98
01594440 P00680 1995 1560000 62400 4 91 - 99
01594440 P00680 1996 4940000 180000 4 91 - 99
01594440 P00680 1997 2200000 81000 4 91 - 99
01594440 P00680 1998 2370000 106000 4 91 - 99
01594440 P00680 1999 1640000 116000 7 91 - 99
Appendix A 35
Appendix A Annual load estimates for the River Input monitoring stations on the Susquehanna Potomac Patuxent and Choptank RiversndashContinued
Standard Error of Prediction
Annual load Annual load +- +- ModelStation no Parameter Year (kgyr SiO2) (kgyr Si) (kgyr SiO2) Percent window
Patuxent River near Bowie (01594440)mdashContinued
01594440 P00955 1978 3270000 1530000 212000 6 78 - 86
01594440 P00955 1979 4710000 2200000 250000 5 78 - 86
01594440 P00955 1980 2760000 1290000 110000 4 78 - 86
01594440 P00955 1981 1440000 671000 62800 4 78 - 86
01594440 P00955 1982 1940000 905000 88600 5 78 - 86
01594440 P00955 1983 3160000 1480000 160000 5 79 - 87
01594440 P00955 1984 2760760 1290000 92000 3 80 - 88
01594440 P00955 1985 1460000 684000 46700 3 81 - 89
01594440 P00955 1986 1490000 698000 42700 3 82 - 90
01594440 P00955 1987 2020000 942000 54700 3 83 - 91
01594440 P00955 1988 2100000 982000 55700 3 84 - 92
01594440 P00955 1989 2980000 1390000 78500 3 85 - 93
01594440 P00955 1990 2550000 1190000 67400 3 86 - 94
01594440 P00955 1991 1880000 877000 50100 3 87 - 95
01594440 P00955 1992 1820000 850000 47100 3 88 - 96
01594440 P00955 1993 2680000 1250000 75600 3 89 - 97
01594440 P00955 1994 2810000 1310000 65400 2 90 - 98
01594440 P00955 1995 1980000 924000 47500 2 91 - 99
01594440 P00955 1996 4340000 2030000 94000 2 91 - 99
01594440 P00955 1997 2650000 1240000 61900 2 91 - 99
01594440 P00955 1998 2650000 1240000 72500 3 91 - 99
01594440 P00955 1999 1900000 887000 71000 4 91 - 99
A Revised Load Estimation Procedure for the Susquehanna Potomac Patuxent and Choptank Rivers 36
Appendix A Annual load estimates for the River Input monitoring stations on the Susquehanna Potomac Patuxent and Choptank RiversndashContinued
Standard Error of Prediction
Annual load +- +- ModelStation no Parameter Year (kgyr) (kgyr) Percent window
Patuxent River near Bowie (01594440)mdashContinued
01594440 P80154 1985 16300000 3480000 21 85 - 93
01594440 P80154 1986 10600000 1430000 13 85 - 93
01594440 P80154 1987 21800000 3040000 14 85 - 93
01594440 P80154 1988 22400000 3010000 13 85 - 93
01594440 P80154 1989 58500000 7990000 14 85 - 93
01594440 P80154 1990 24800000 3030000 12 86 - 94
01594440 P80154 1991 9900000 1340000 14 87 - 95
01594440 P80154 1992 13300000 2370000 18 88 - 96
01594440 P80154 1993 27500000 3990000 15 89 - 97
01594440 P80154 1994 24800000 3100000 13 90 - 98
01594440 P80154 1995 11700000 1900000 16 91 - 99
01594440 P80154 1996 53200000 6860000 13 91 - 99
01594440 P80154 1997 15500000 2090000 14 91 - 99
01594440 P80154 1998 17900000 2710000 15 91 - 99
01594440 P80154 1999 14100000 4890000 35 91 - 99
Appendix A 37
Appendix A Annual load estimates for the River Input monitoring stations on the Susquehanna Potomac Patuxent and Choptank RiversndashContinued
Standard Error of Prediction
Annual load +- +- ModelStation no Parameter Year (kgyr) (kgyr) Percent window
Choptank River near Greensboro (01491000)
01491000 P00600 1978 237000 17500 7 78 - 86
01491000 P00600 1979 314000 19700 6 78 - 86
01491000 P00600 1980 188000 7320 4 78 - 86
01491000 P00600 1981 107000 4370 4 78 - 86
01491000 P00600 1982 166000 7680 5 78 - 86
01491000 P00600 1983 329000 19400 6 79 - 87
01491000 P00600 1984 276000 14200 5 80 - 88
01491000 P00600 1985 113000 3760 3 81 - 89
01491000 P00600 1986 151000 5000 3 82 - 90
01491000 P00600 1987 167000 4980 3 83 - 91
01491000 P00600 1988 126000 3370 3 84 - 92
01491000 P00600 1989 355000 8260 2 85 - 93
01491000 P00600 1990 188000 4750 3 86 - 94
01491000 P00600 1991 156000 4370 3 87 - 95
01491000 P00600 1992 132000 3660 3 88 - 96
01491000 P00600 1993 177000 5700 3 89 - 97
01491000 P00600 1994 284000 9340 3 90 - 98
01491000 P00600 1995 133000 3750 3 91 - 99
01491000 P00600 1996 380000 10400 3 91 - 99
01491000 P00600 1997 201000 5360 3 91 - 99
01491000 P00600 1998 230000 7320 3 91 - 99
01491000 P00600 1999 183000 7680 4 91 - 99
01491000 P00608 1980 12300 3280 27 80 - 88
01491000 P00608 1981 6300 1220 19 80 - 88
01491000 P00608 1982 10800 1850 17 80 - 88
01491000 P00608 1983 29200 7250 25 80 - 88
01491000 P00608 1984 21000 5130 24 80 - 88
01491000 P00608 1985 3780 579 15 81 - 89
01491000 P00608 1986 5340 771 14 82 - 90
01491000 P00608 1987 6290 823 13 83 - 91
01491000 P00608 1988 3920 445 11 84 - 92
01491000 P00608 1989 17200 1890 11 85 - 93
01491000 P00608 1990 8380 1070 13 86 - 94
01491000 P00608 1991 7190 817 11 87 - 95
01491000 P00608 1992 5610 644 11 88 - 96
01491000 P00608 1993 10200 1340 13 89 - 97
A Revised Load Estimation Procedure for the Susquehanna Potomac Patuxent and Choptank Rivers 38
Appendix A Annual load estimates for the River Input monitoring stations on the Susquehanna Potomac Patuxent and Choptank RiversndashContinued
Standard Error of Prediction
Annual load +- +- ModelStation no Parameter Year (kgyr) (kgyr) Percent window
Choptank River near Greensboro (01491000)mdashContinued
01491000 P00608 1994 17000 3100 18 90 - 98
01491000 P00608 1995 4440 545 12 91 - 99
01491000 P00608 1996 18200 2230 12 91 - 99
01491000 P00608 1997 8280 1010 12 91 - 99
01491000 P00608 1998 10300 1450 14 91 - 99
01491000 P00608 1999 7410 1700 23 91 - 99
01491000 P00613 1985 698 104 15 85 - 93
01491000 P00613 1986 928 109 12 85 - 93
01491000 P00613 1987 1100 104 10 85 - 93
01491000 P00613 1988 877 79 9 85 - 93
01491000 P00613 1989 3100 265 9 85 - 93
01491000 P00613 1990 1560 143 9 86 - 94
01491000 P00613 1991 1380 130 9 87 - 95
01491000 P00613 1992 1040 110 11 88 - 96
01491000 P00613 1993 1320 152 12 89 - 97
01491000 P00613 1994 1670 199 12 90 - 98
01491000 P00613 1995 698 86 12 91 - 99
01491000 P00613 1996 2090 247 12 91 - 99
01491000 P00613 1997 1150 139 12 91 - 99
01491000 P00613 1998 1200 157 13 91 - 99
01491000 P00613 1999 921 148 16 91 - 99
01491000 P00623 1985 37200 3340 9 85 - 93
01491000 P00623 1986 49600 3580 7 85 - 93
01491000 P00623 1987 54400 3250 6 85 - 93
01491000 P00623 1988 37600 1940 5 85 - 93
01491000 P00623 1989 129000 6440 5 85 - 93
01491000 P00623 1990 54700 3020 6 86 - 94
01491000 P00623 1991 41400 2340 6 87 - 95
01491000 P00623 1992 32100 1750 5 88 - 96
01491000 P00623 1993 48300 3480 7 89 - 97
01491000 P00623 1994 84600 6570 8 90 - 98
01491000 P00623 1995 26900 1340 5 91 - 99
01491000 P00623 1996 104000 5500 5 91 - 99
01491000 P00623 1997 46900 2290 5 91 - 99
01491000 P00623 1998 60000 3570 6 91 - 99
01491000 P00623 1999 52300 5590 11 91 - 99
Appendix A 39
Appendix A Annual load estimates for the River Input monitoring stations on the Susquehanna Potomac Patuxent and Choptank RiversndashContinued
Standard Error of Prediction
Annual load +- +- ModelStation no Parameter Year (kgyr) (kgyr) Percent window
Choptank River near Greensboro (01491000)mdashContinued
01491000 P00625 1978 125000 23200 19 78 - 86
01491000 P00625 1979 159000 29000 18 78 - 86
01491000 P00625 1980 75400 7280 10 78 - 86
01491000 P00625 1981 35600 3400 10 78 - 86
01491000 P00625 1982 58000 6140 11 78 - 86
01491000 P00625 1983 143000 20100 14 79 - 87
01491000 P00625 1984 141000 18400 13 80 - 88
01491000 P00625 1985 49300 4710 10 81 - 89
01491000 P00625 1986 65100 5430 8 82 - 90
01491000 P00625 1987 70800 4800 7 83 - 91
01491000 P00625 1988 45100 2590 6 84 - 92
01491000 P00625 1989 167000 8880 5 85 - 93
01491000 P00625 1990 65100 3920 6 86 - 94
01491000 P00625 1991 44100 2540 6 87 - 95
01491000 P00625 1992 33900 1840 5 88 - 96
01491000 P00625 1993 59600 4400 7 89 - 97
01491000 P00625 1994 113000 9670 9 90 - 98
01491000 P00625 1995 31800 1770 6 91 - 99
01491000 P00625 1996 149000 9360 6 91 - 99
01491000 P00625 1997 63000 3490 6 91 - 99
01491000 P00625 1998 88900 6130 7 91 - 99
01491000 P00625 1999 90300 13300 15 91 - 99
01491000 P00631 1980 113000 9060 8 80 - 88
01491000 P00631 1981 69300 3870 6 80 - 88
01491000 P00631 1982 101000 5120 5 80 - 88
01491000 P00631 1983 161000 9220 6 80 - 88
01491000 P00631 1984 132000 7520 6 80 - 88
01491000 P00631 1985 64000 2510 4 81 - 89
01491000 P00631 1986 83500 3140 4 82 - 90
01491000 P00631 1987 95100 3360 4 83 - 91
01491000 P00631 1988 81600 2650 3 84 - 92
01491000 P00631 1989 194000 5510 3 85 - 93
01491000 P00631 1990 121000 3680 3 86 - 94
01491000 P00631 1991 114000 3910 3 87 - 95
01491000 P00631 1992 99900 3570 4 88 - 96
01491000 P00631 1993 118000 4750 4 89 - 97
01491000 P00631 1994 172000 7140 4 90 - 98
A Revised Load Estimation Procedure for the Susquehanna Potomac Patuxent and Choptank Rivers 40
Appendix A Annual load estimates for the River Input monitoring stations on the Susquehanna Potomac Patuxent and Choptank RiversndashContinued
Standard Error of Prediction
Annual load +- +- ModelStation no Parameter Year (kgyr) (kgyr) Percent window
Choptank River near Greensboro (01491000)mdashContinued
01491000 P00631 1995 100000 4070 4 91 - 99
01491000 P00631 1996 228000 8620 4 91 - 99
01491000 P00631 1997 137000 5170 4 91 - 99
01491000 P00631 1998 141000 6080 4 91 - 99
01491000 P00631 1999 112000 6020 5 91 - 99
01491000 P00665 1978 18200 4580 25 78 - 86
01491000 P00665 1979 29000 9580 33 78 - 86
01491000 P00665 1980 10800 1370 13 78 - 86
01491000 P00665 1981 4930 599 12 78 - 86
01491000 P00665 1982 7610 990 13 78 - 86
01491000 P00665 1983 30300 6090 20 79 - 87
01491000 P00665 1984 18900 3500 19 80 - 88
01491000 P00665 1985 5410 871 16 81 - 89
01491000 P00665 1986 6270 768 12 82 - 90
01491000 P00665 1987 6950 717 10 83 - 91
01491000 P00665 1988 4430 363 8 84 - 92
01491000 P00665 1989 20900 1670 8 85 - 93
01491000 P00665 1990 8380 811 10 86 - 94
01491000 P00665 1991 6840 592 9 87 - 95
01491000 P00665 1992 4870 400 8 88 - 96
01491000 P00665 1993 9350 1150 12 89 - 97
01491000 P00665 1994 19400 3030 16 90 - 98
01491000 P00665 1995 4180 434 10 91 - 99
01491000 P00665 1996 24700 3200 13 91 - 99
01491000 P00665 1997 9060 991 11 91 - 99
01491000 P00665 1998 13300 1770 13 91 - 99
01491000 P00665 1999 20100 7180 36 91 - 99
01491000 P00666 1978 4190 1000 24 78 - 86
01491000 P00666 1979 8010 2530 32 78 - 86
01491000 P00666 1980 3570 427 12 78 - 86
01491000 P00666 1981 1980 232 12 78 - 86
01491000 P00666 1982 2890 368 13 78 - 86
01491000 P00666 1983 8580 1810 21 79 - 87
01491000 P00666 1984 4590 796 17 80 - 88
01491000 P00666 1985 1790 297 17 81 - 89
01491000 P00666 1986 1640 185 11 82 - 90
Appendix A 41
Appendix A Annual load estimates for the River Input monitoring stations on the Susquehanna Potomac Patuxent and Choptank RiversndashContinued
Standard Error of Prediction
Annual load +- +- ModelStation no Parameter Year (kgyr) (kgyr) Percent window
Choptank River near Greensboro (01491000)mdashContinued
01491000 P00666 1987 1930 183 10 83 - 91
01491000 P00666 1988 1570 121 8 84 - 92
01491000 P00666 1989 8700 700 8 85 - 93
01491000 P00666 1990 3250 321 10 86 - 94
01491000 P00666 1991 2860 268 9 87 - 95
01491000 P00666 1992 2680 208 8 88 - 96
01491000 P00666 1993 4020 379 9 89 - 97
01491000 P00666 1994 9650 1110 11 90 - 98
01491000 P00666 1995 2480 195 8 91 - 99
01491000 P00666 1996 13200 1280 10 91 - 99
01491000 P00666 1997 4420 379 9 91 - 99
01491000 P00666 1998 4830 479 10 91 - 99
01491000 P00666 1999 5410 1420 26 91 - 99
01491000 P00671 1982 2860 772 27 82 - 90
01491000 P00671 1983 7140 1580 22 82 - 90
01491000 P00671 1984 4090 761 19 82 - 90
01491000 P00671 1985 1410 304 22 82 - 90
01491000 P00671 1986 1350 216 16 82 - 90
01491000 P00671 1987 1530 201 13 83 - 91
01491000 P00671 1988 1160 123 11 84 - 92
01491000 P00671 1989 6260 685 11 85 - 93
01491000 P00671 1990 2500 358 14 86 - 94
01491000 P00671 1991 2280 292 13 87 - 95
01491000 P00671 1992 2110 245 12 88 - 96
01491000 P00671 1993 2950 419 14 89 - 97
01491000 P00671 1994 6290 1090 17 90 - 98
01491000 P00671 1995 1690 204 12 91 - 99
01491000 P00671 1996 7600 1070 14 91 - 99
01491000 P00671 1997 2870 368 13 91 - 99
01491000 P00671 1998 3200 478 15 91 - 99
01491000 P00671 1999 3050 1070 35 91 - 99
01491000 P00680 1985 430000 25900 6 85 - 93
01491000 P00680 1986 622000 30600 5 85 - 93
01491000 P00680 1987 680000 27500 4 85 - 93
01491000 P00680 1988 426000 13900 3 85 - 93
01491000 P00680 1989 1850000 61300 3 85 - 93
A Revised Load Estimation Procedure for the Susquehanna Potomac Patuxent and Choptank Rivers 42
Appendix A Annual load estimates for the River Input monitoring stations on the Susquehanna Potomac Patuxent and Choptank RiversndashContinued
Standard Error of Prediction
Annual load +- +- ModelStation no Parameter Year (kgyr) (kgyr) Percent window
Choptank River near Greensboro (01491000)mdashContinued
01491000 P00680 1990 759000 29300 4 86 - 94
01491000 P00680 1991 596000 21000 4 87 - 95
01491000 P00680 1992 461000 16300 4 88 - 96
01491000 P00680 1993 903000 44800 5 89 - 97
01491000 P00680 1994 1880000 101000 5 90 - 98
01491000 P00680 1995 555000 22000 4 91 - 99
01491000 P00680 1996 2590000 114000 4 91 - 99
01491000 P00680 1997 1040000 40400 4 91 - 99
01491000 P00680 1998 1370000 66900 5 91 - 99
01491000 P00680 1999 1190000 121000 10 91 - 99
Appendix A 43
Appendix A Annual load estimates for the River Input monitoring stations on the Susquehanna Potomac Patuxent and Choptank RiversndashContinued
Standard Error of Prediction
Annual load Annual load +- +- ModelStation no Parameter Year (kgyr SiO2) (kgyr Si) (kgyr SiO2) Percent window
Choptank River near Greensboro (01491000)mdashContinued
01491000 P00955 1978 1760000 824000 139000 8 78 - 86
01491000 P00955 1979 2310000 1080000 126000 5 78 - 86
01491000 P00955 1980 1640000 768000 73200 4 78 - 86
01491000 P00955 1981 1060000 495000 51500 5 78 - 86
01491000 P00955 1982 1490000 695000 81500 5 78 - 86
01491000 P00955 1983 2280000 1070000 143000 6 79 - 87
01491000 P00955 1984 1870000 876000 112000 6 80 - 88
01491000 P00955 1985 903000 422000 36600 4 81 - 89
01491000 P00955 1986 1180000 552000 46100 4 82 - 90
01491000 P00955 1987 1350000 631000 48800 4 83 - 91
01491000 P00955 1988 1130000 528000 37300 3 84 - 92
01491000 P00955 1989 2610000 1220000 76200 3 85 - 93
01491000 P00955 1990 1560000 727000 50600 3 86 - 94
01491000 P00955 1991 1370000 642000 45700 3 87 - 95
01491000 P00955 1992 1190000 554000 38100 3 88 - 96
01491000 P00955 1993 1360000 637000 40700 3 89 - 97
01491000 P00955 1994 2120000 992000 63300 3 90 - 98
01491000 P00955 1995 1320000 615000 37600 3 91 - 99
01491000 P00955 1996 2910000 1360000 76600 3 91 - 99
01491000 P00955 1997 1790000 835000 47800 3 91 - 99
01491000 P00955 1998 1720000 806000 52000 3 91 - 99
01491000 P00955 1999 1420000 661000 54900 4 91 - 99
A Revised Load Estimation Procedure for the Susquehanna Potomac Patuxent and Choptank Rivers 44
Appendix A Annual load estimates for the River Input monitoring stations on the Susquehanna Potomac Patuxent and Choptank RiversndashContinued
Standard Error of Prediction
Annual load +- +- ModelStation no Parameter Year (kgyr) (kgyr) Percent window
Choptank River near Greensboro (01491000)mdashContinued
01491000 P80154 1978 3540000 1300000 37 78 - 86
01491000 P80154 1979 6680000 3400000 51 78 - 86
01491000 P80154 1980 1950000 362000 19 78 - 86
01491000 P80154 1981 730000 129000 18 78 - 86
01491000 P80154 1982 1370000 237000 17 78 - 86
01491000 P80154 1983 6790000 1530000 23 79 - 87
01491000 P80154 1984 3560000 729000 20 80 - 88
01491000 P80154 1985 901000 237000 26 81 - 89
01491000 P80154 1986 1560000 337000 22 82 - 90
01491000 P80154 1987 1770000 299000 17 83 - 91
01491000 P80154 1988 874000 119000 14 84 - 92
01491000 P80154 1989 5130000 660000 13 85 - 93
01491000 P80154 1990 1950000 334000 17 86 - 94
01491000 P80154 1991 1480000 200000 14 87 - 95
01491000 P80154 1992 733000 89300 12 88 - 96
01491000 P80154 1993 2200000 433000 20 89 - 97
01491000 P80154 1994 5850000 1580000 27 90 - 98
01491000 P80154 1995 742000 109000 15 91 - 99
01491000 P80154 1996 5090000 981000 19 91 - 99
01491000 P80154 1997 1420000 180000 13 91 - 99
01491000 P80154 1998 2940000 548000 19 91 - 99
01491000 P80154 1999 2820000 1310000 46 91 - 99
Appendix A 45
--------
--------
--------
--------
--------
--------
--------
--------
--------
--------
--------
--------
-----
A Revised Load Estimation Procedure for the Susquehanna Potomac Patuxent and Choptank Rivers
App
endi
x B
Pe
rcen
t diff
eren
ces b
etw
een
hist
oric
al a
nd re
vise
d lo
ad e
stim
ates
[Thi
s app
endi
x su
mm
ariz
es th
e pe
rcen
t diff
eren
ces b
etw
een
the
hist
oric
al lo
ad e
stim
ates
from
the
Riv
er In
put m
onito
ring
prog
ram
and
the
revi
sed
estim
ates
pro
vide
d in
A
ppen
dix
A -
- es
timat
es a
re n
ot a
vaila
ble
for c
ompa
rison
]
Rev
ised
est
imat
e -
His
tori
c es
tim
ate
Per
cent
dif
fere
nce
=
times 10
0
(R
evis
ed e
stim
ate
+ H
isto
ric
estim
ate )
2
Dis
solv
edTo
tal
Tota
lTo
tal
Diss
olve
d k
jeld
ahl
kjel
dahl
Diss
olve
dTo
tal
Diss
olve
dor
gani
cSu
spen
ded
nitr
ogen
am
mon
ia n
itrog
enni
trog
enni
trite
+ n
itrat
eph
osph
orus
phos
phor
usO
rtho
phos
phor
usca
rbon
sedi
men
tYe
ar (P
0060
0) (P
0060
8) (P
0062
3)
(P00
625)
(P
0063
1)
(P00
665)
(P
0066
6)
(P00
671)
(P
0068
0)
(P80
154)
Susq
ueha
nna
Riv
er a
t Con
owin
go D
am (0
1578
310)
1978
--
----
----
----
----
--
1979
-3
9
-18
7 --
-22
-1
4
-42
7
8 14
2
--3
4
1980
-1
1
-11
--
-09
2
2 -7
5
52
30
---3
0
1981
1
4 7
0 --
09
49
-57
8
4 -4
3
---1
1
1982
2
8 17
0
--1
8 5
8 -1
14
20
-10
5 --
-19
1983
4
2 20
2
--3
8 5
4 -1
16
-53
-1
15
--2
5
1984
6
3 10
7
--17
6
-29
-2
09
-13
5 -1
21
--5
6
1985
6
2 -5
3
-29
12
7
-08
-2
31
-58
-1
61
-13
9 -1
8
1986
2
3 -1
02
-02
2
2 -0
4
-32
8 -1
79
-32
-7
9
-12
7
1987
3
5 -5
8
23
25
23
-27
7 -2
94
219
-6
3
-81
1988
4
2 -2
3
95
56
35
-27
3 -4
93
290
1
0 -3
8
1989
-6
1
197
-6
4
-18
-9
0
-29
7 -6
69
181
15
0
-08
1990
-8
2
58
-18
8 -7
7
-10
8 -1
82
-28
4 24
8
81
-37
1991
-8
8
161
-2
59
-16
5 -9
5
-10
8 2
4 44
6
-16
-6
1
1992
-7
7
-62
-1
32
-13
1 -1
00
-19
8 3
5 7
1 3
2 -1
55
1993
-1
8
49
-71
-8
6
-33
-0
7
131
4
6 1
0 7
7
1994
-1
2
-48
-8
1
-12
6 0
6 -0
3
81
-35
0 0
0 9
8
1995
-1
7
-14
6 -1
51
-21
0 2
6 -6
3
206
-7
65
-84
-2
4
1996
-4
5
-16
9 -4
8
-41
-4
3
167
12
4
-15
6 -6
7
40
1997
-3
2
----
13
16
191
29
2
-52
--
-10
3
1998
0
0 -1
29
49
-14
0
9 17
6
112
-3
67
-13
8 1
0
46
App
endi
x B
Pe
rcen
t diff
eren
ces b
etw
een
hist
oric
al a
nd re
vise
d lo
ad e
stim
ates
mdashC
ontin
ued
Diss
olve
dTo
tal
Tota
l T
otal
Diss
olve
d k
jeld
ahl
kjel
dahl
Diss
olve
dTo
tal
Diss
olve
dor
gani
cSu
spen
ded
nitr
ogen
am
mon
ia n
itrog
enni
trog
enni
trite
+ n
itrat
eph
osph
orus
phos
phor
usO
rtho
phos
phor
usca
rbon
sedi
men
tYe
ar (P
0060
0) (P
0060
8) (P
0062
3)
(P00
625)
(P
0063
1)
(P00
665)
(P
0066
6)
(P00
671)
(P
0068
0)
(P80
154)
Poto
mac
Riv
er a
t Cha
in B
ridg
e (0
1646
580)
1978
--
----
----
----
----
--
1979
1
2 49
6
--0
2 -3
2
39
150
27
7
---2
12
1980
2
0 35
6
--0
4 -2
8
14
127
17
2
--7
0
1981
1
3 24
3
---1
6
-25
-3
5
98
92
--29
3
1982
1
7 13
8
---2
4
06
-37
2
8 5
3 --
265
1983
0
7 2
5 0
6 -3
0
14
-55
-4
3
07
--26
9
1984
0
7 -4
7
-77
0
5 -0
6
-77
-9
8
-68
--
528
1985
-5
3
-50
-2
09
-96
1
2 -1
03
-15
7 -5
6
--41
3
1986
-9
2
-24
5 -1
41
-13
6 -1
12
-26
3 -1
91
-24
3 --
119
1987
-8
8
-21
-1
24
-99
-1
61
-11
8 -1
49
-13
5 --
348
1988
-3
9
246
-5
7
-41
-1
25
59
33
120
-3
28
574
1989
-0
1
-13
6 8
8 4
8 -7
0
64
141
12
5
-16
27
2
1990
-9
7
-36
7 6
7 -2
93
-38
-2
12
274
40
8
-20
6 17
6
1991
-1
68
-32
6 7
3 -2
75
-24
1 -2
85
-14
0 -1
60
-89
-6
8
1992
-1
32
-31
0 20
6
-80
-2
63
-21
9 -1
79
-26
4 -2
93
-32
5
1993
-8
0
-01
16
8
-80
-1
31
-76
-4
8
-14
-1
3
-14
4
1994
-3
1
229
13
7
-57
-4
4
21
159
26
0
61
-15
7
1995
5
2 1
1 8
8 4
3 -2
0
-20
-8
4
-14
2 3
3 -7
6
1996
-1
10
-83
-0
7
-29
-1
47
114
13
4
156
-2
7
-18
4
1997
-7
1
----
-20
-1
05
136
29
1
106
--
152
1998
-5
5
-40
1
3 -2
4
-64
5
3 8
9 9
6 -3
3
71
Appendix B 47
A Revised Load Estimation Procedure for the Susquehanna Potomac Patuxent and Choptank Rivers
App
endi
x B
Pe
rcen
t diff
eren
ces b
etw
een
hist
oric
al a
nd re
vise
d lo
ad e
stim
ates
mdashC
ontin
ued
Diss
olve
dTo
tal
Tota
l T
otal
Diss
olve
d k
jeld
ahl
kjel
dahl
Diss
olve
dTo
tal
Diss
olve
dor
gani
cSu
spen
ded
nitr
ogen
am
mon
ia n
itrog
enni
trog
enni
trite
+ n
itrat
eph
osph
orus
phos
phor
usO
rtho
phos
phor
usca
rbon
sedi
men
tYe
ar (P
0060
0) (P
0060
8) (P
0062
3)
(P00
625)
(P
0063
1)
(P00
665)
(P
0066
6)
(P00
671)
(P
0068
0)
(P80
154)
Patu
xent
Riv
er n
ear
Bow
ie (0
1594
440)
1978
-2
1
----
-11
7 --
-48
3 -5
04
----
--
1979
-2
3
----
-10
7 --
-36
7 -2
43
----
--
1980
-2
5
156
--
-57
-4
2
-10
9 10
6
----
--
1981
-7
4
61
---2
1
-51
-4
9
316
--
----
1982
-4
3
-21
--
-24
-2
2
19
362
33
6
----
1983
-0
4
-10
--
-43
1
4 17
2
388
14
7
----
1984
3
9 -6
6
--8
3 1
7 7
1 3
6 -8
1
----
1985
-1
8
-37
4
8 2
5 -1
9
-10
0 -1
42
-31
9 6
9 28
8
1986
-3
2
-48
2
2 -2
2
-12
-1
30
-17
9 -3
68
66
82
1987
0
3 0
1 1
8 0
8 0
2 0
6 -2
74
-30
9 9
8 3
4
1988
-3
8
-53
2
2 -9
8
-10
-1
2
-27
1 -2
33
119
-1
72
1989
0
8 21
0
57
32
00
88
-25
3 -1
89
123
14
5
1990
1
2 36
1
110
11
4
-16
14
4
43
-17
11
5
173
1991
5
6 57
4
76
113
5
8 6
0 -1
87
-27
3 -7
4
217
1992
-1
3
239
-0
5
71
07
62
-18
3 -2
18
-10
0 29
3
1993
9
9 27
6
192
12
0
131
0
9 -2
64
-37
4 6
6 22
0
1994
12
0
76
193
3
6 14
5
-10
-2
73
-37
1 4
8 10
0
1995
12
1
-20
0 1
2 -9
9
169
-1
88
-44
7 -5
16
-11
0 -1
74
1996
0
4 -8
9
-33
-0
6
05
-57
-1
41
-22
8 -9
3
-10
4
1997
4
6 --
----
68
-14
0 -2
86
-45
7 --
-10
0
1998
8
2 -3
23
35
-65
16
6
-31
9 -6
91
-72
8 -1
64
-15
2
48
App
endi
x B
Pe
rcen
t diff
eren
ces b
etw
een
hist
oric
al a
nd re
vise
d lo
ad e
stim
ates
mdashC
ontin
ued
Diss
olve
dTo
tal
Tota
l T
otal
Diss
olve
d k
jeld
ahl
kjel
dahl
Diss
olve
dTo
tal
Diss
olve
dor
gani
cSu
spen
ded
nitr
ogen
am
mon
ia n
itrog
enni
trog
enni
trite
+ n
itrat
eph
osph
orus
phos
phor
usO
rtho
phos
phor
usca
rbon
sedi
men
tYe
ar (P
0060
0) (P
0060
8) (P
0062
3)
(P00
625)
(P
0063
1)
(P00
665)
(P
0066
6)
(P00
671)
(P
0068
0)
(P80
154)
Cho
ptan
k R
iver
nea
r G
reen
sbor
o (0
1491
000)
1978
-1
75
----
-22
--
98
41
----
-27
4
1979
-1
52
----
-13
4 --
162
21
4
----
-20
9
1980
-3
0
165
--
-56
-0
9
-11
6 4
6 --
---1
03
1981
1
9 11
8
---7
7
02
-16
3 7
5 --
--1
6
1982
1
0 11
1
---9
0
07
-16
1 12
3
-12
1 --
40
1983
-2
2
102
--
-22
8 -1
5
108
16
8
-85
--
-19
9
1984
4
5 12
5
--4
6 -0
9
13
-54
-7
9
---4
03
1985
8
3 -2
02
37
143
-0
1
-11
0 -8
9
-13
0 -1
25
-54
2
1986
-0
9
-10
0 -0
6
-03
-4
5
-13
0 -1
46
-09
-5
8
-29
9
1987
-2
1
103
-0
7
-70
0
2 -1
21
-17
8
7 -5
1
-26
3
1988
-0
3
352
1
6 -1
77
92
-15
9 13
5
123
-3
4
-35
2
1989
1
0 15
7
23
32
-03
-1
0
-13
-1
11
-52
-2
81
1990
-3
0
124
-4
0
-41
-6
8
-79
-9
8
-15
7 -1
6
-14
9
1991
-9
5
89
-67
-1
17
-89
-4
7
31
-10
0 -1
3
106
1992
-5
8
-16
0
3 -9
7
-68
-2
59
154
-1
58
62
115
1993
-8
5
-11
7 8
1 1
3 -8
7
-91
27
9
-32
9 4
1 2
3
1994
-1
7
-82
8
8 3
7 -1
1
98
22
-43
9 -4
4
146
1995
-2
8
-18
0
5 -1
73
18
-19
6 -2
46
-61
2 -2
1
10
1996
-1
8
-13
7 -0
5
49
-47
-3
5
-16
0 -1
16
-57
9
5
1997
-4
3
----
103
-8
5
71
-34
3
0 --
90
1998
2
0 2
8 6
5 7
0 10
0
-22
-7
7
-30
8 -3
0
117
Appendix B 49
- Contents
- Abstract
- Introduction
-
- Purpose and Scope
- Description of Study Area
- Acknowledgments
-
- Methods of Load Estimation
-
- Monitoring Record
- Regression Model
- Historical Load Estimates
-
- Revised Procedure for Load Estimation
-
- Background
- Description of Revised Methods
- Comparison of Historical and Revised Load Estimates
-
- Summary and Conclusions
- References Cited
-
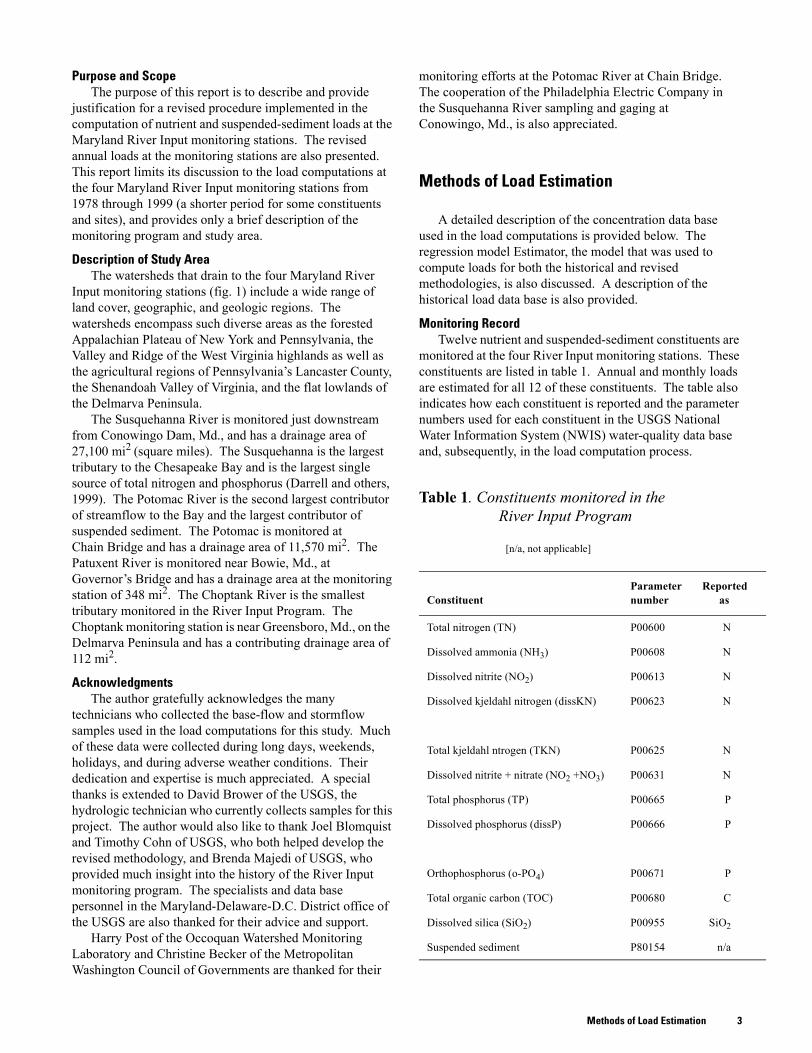
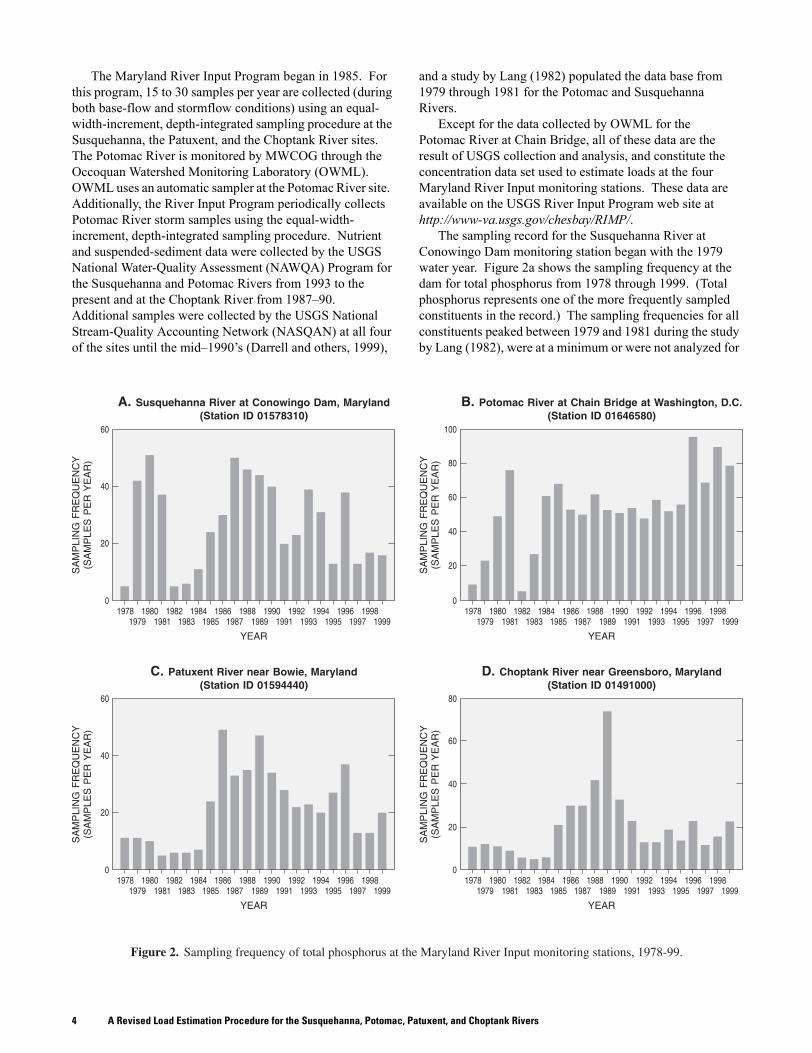
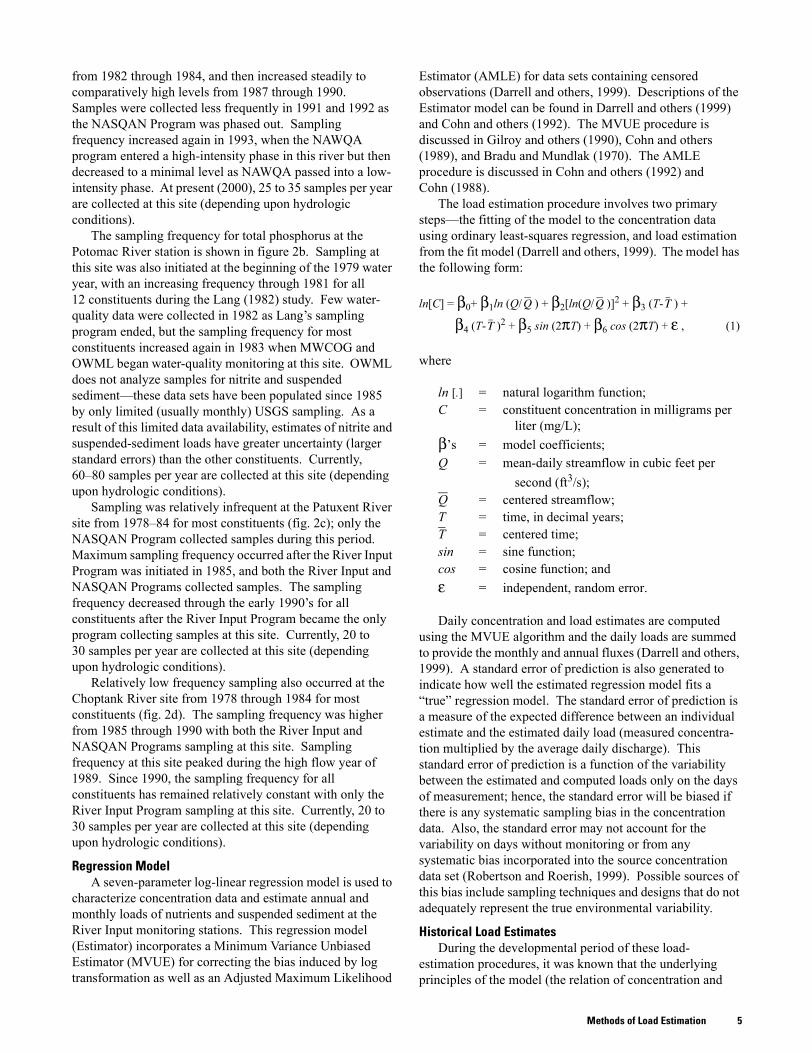
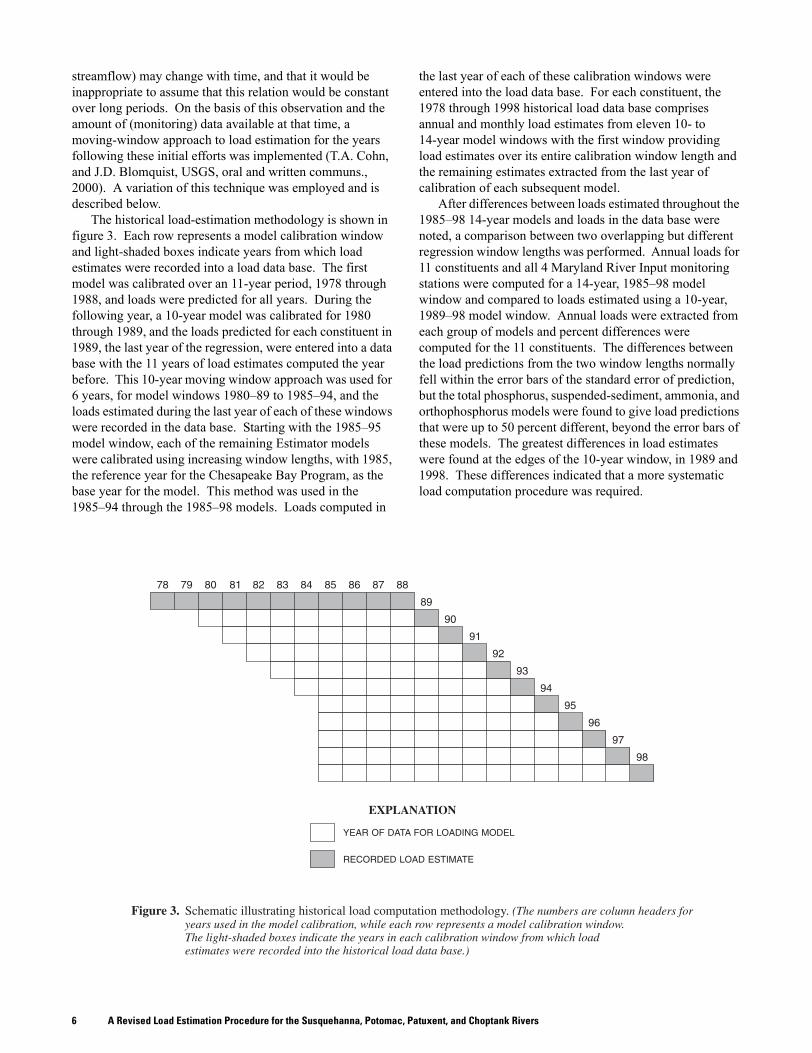