a revolution in equity investing
TRANSCRIPT
ab
A revolution in equity investingA deeper dive into non nancial data
July 2015
UBS Global Asset Management, Sustainable Investors Team
2
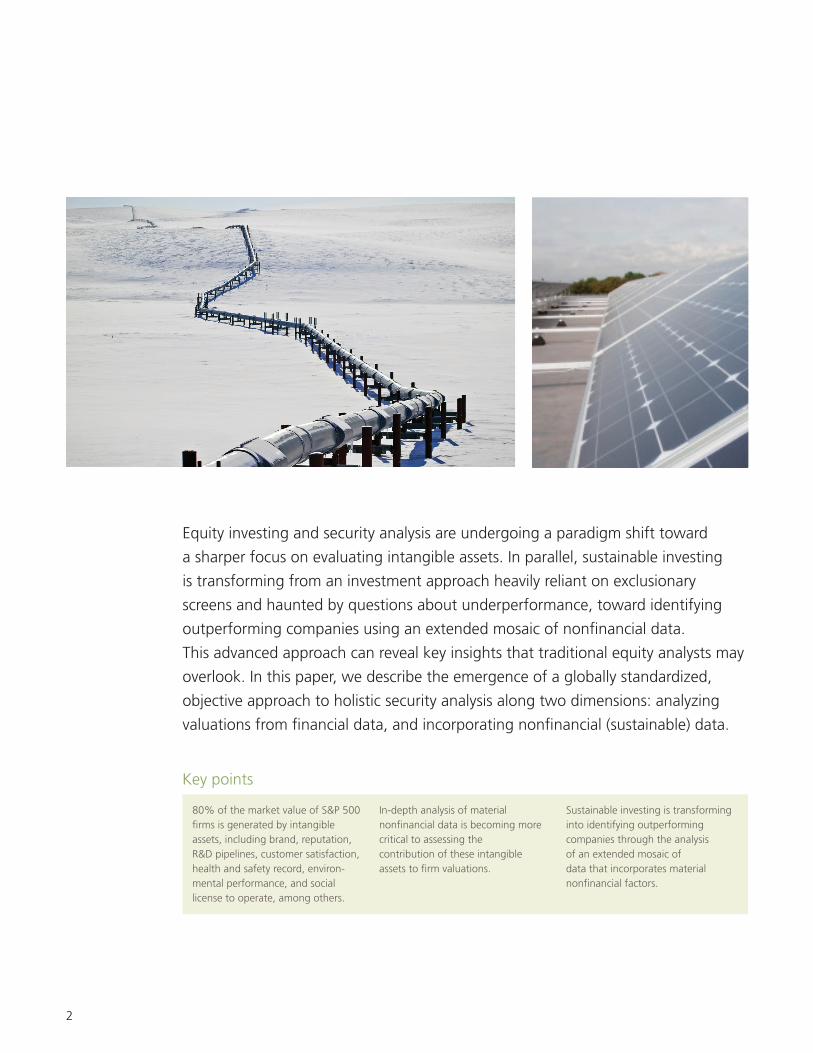
Equity investing and security analysis are undergoing a paradigm shift toward a sharper focus on evaluating intangible assets. In parallel, sustainable investing is transforming from an investment approach heavily reliant on exclusionary screens and haunted by questions about underperformance, toward identifying outperforming companies using an extended mosaic of nonfinancial data. This advanced approach can reveal key insights that traditional equity analysts may overlook. In this paper, we describe the emergence of a globally standardized, objective approach to holistic security analysis along two dimensions: analyzing valuations from financial data, and incorporating nonfinancial (sustainable) data.
80% of the market value of S&P 500 firms is generated by intangible assets, including brand, reputation, R&D pipelines, customer satisfaction, health and safety record, environ-mental performance, and social license to operate, among others.
In-depth analysis of material nonfinancial data is becoming more critical to assessing the contribution of these intangible assets to firm valuations.
Sustainable investing is transforming into identifying outperforming companies through the analysis of an extended mosaic of data that incorporates material nonfinancial factors.
Key points
3
A revolution in equity investing: A deeper dive into nonfinancial data
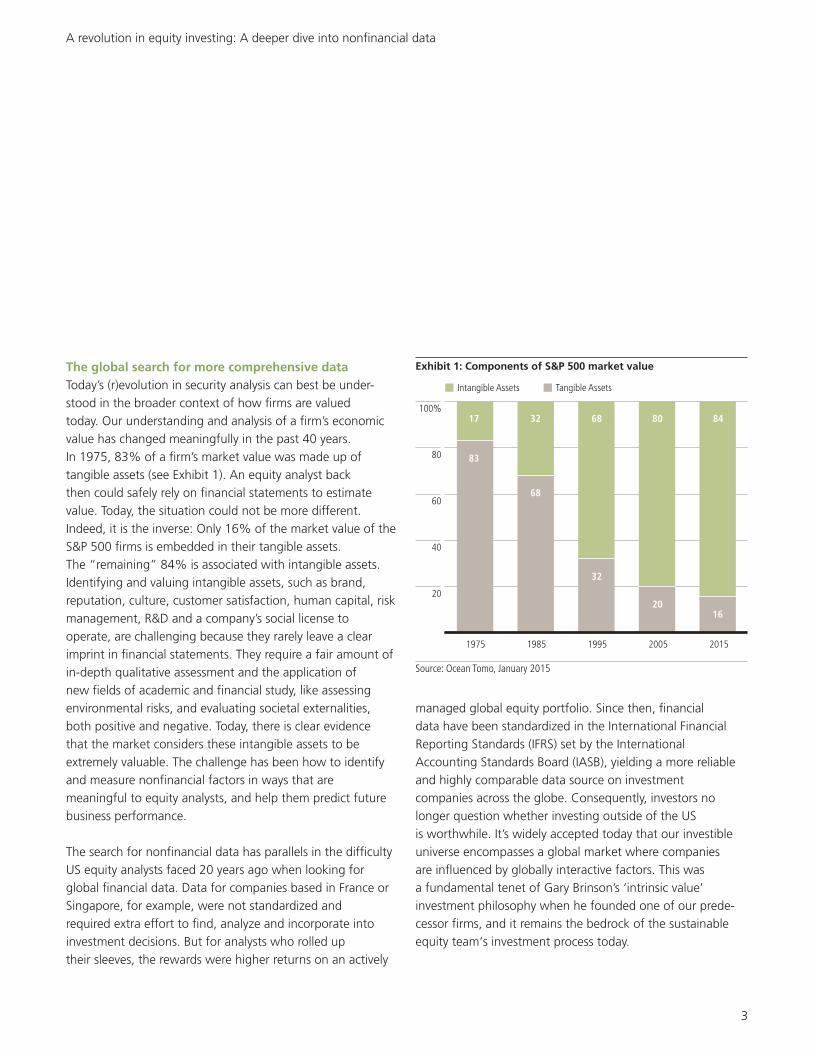
The global search for more comprehensive data Today’s (r)evolution in security analysis can best be under-stood in the broader context of how firms are valued today. Our understanding and analysis of a firm’s economic value has changed meaningfully in the past 40 years. In 1975, 83% of a firm’s market value was made up of tangible assets (see Exhibit 1). An equity analyst back then could safely rely on financial statements to estimate value. Today, the situation could not be more different. Indeed, it is the inverse: Only 16% of the market value of the S&P 500 firms is embedded in their tangible assets. The “remaining” 84% is associated with intangible assets. Identifying and valuing intangible assets, such as brand, reputation, culture, customer satisfaction, human capital, risk management, R&D and a company’s social license to operate, are challenging because they rarely leave a clear imprint in financial statements. They require a fair amount of in-depth qualitative assessment and the application of new fields of academic and financial study, like assessing environmental risks, and evaluating societal externalities, both positive and negative. Today, there is clear evidence that the market considers these intangible assets to be extremely valuable. The challenge has been how to identify and measure nonfinancial factors in ways that are meaningful to equity analysts, and help them predict future business performance. The search for nonfinancial data has parallels in the difficulty US equity analysts faced 20 years ago when looking for global financial data. Data for companies based in France or Singapore, for example, were not standardized and required extra effort to find, analyze and incorporate into investment decisions. But for analysts who rolled up their sleeves, the rewards were higher returns on an actively
managed global equity portfolio. Since then, financial data have been standardized in the International Financial Reporting Standards (IFRS) set by the International Accounting Standards Board (IASB), yielding a more reliable and highly comparable data source on investment companies across the globe. Consequently, investors no longer question whether investing outside of the US is worthwhile. It’s widely accepted today that our investible universe encompasses a global market where companies are influenced by globally interactive factors. This was a fundamental tenet of Gary Brinson’s ‘intrinsic value’ investment philosophy when he founded one of our prede-cessor firms, and it remains the bedrock of the sustainable equity team‘s investment process today.
Exhibit 1: Components of S&P 500 market value
Source: Ocean Tomo, January 2015
20
40
60
80
100%17 32 68 80 84
83
68
32
2016
1975 1985 1995 2005 2015
Intangible Assets Tangible Assets
4
A revolution in equity investing: A deeper dive into nonfinancial data
Nonfinancial data are going through the same evolution and standardization process that has made global financial data so easy to access and use today. Over the past 15 years, the world’s largest corporations have started to voluntarily disclose nonfinancial (sustainability) data on supply chain risks, health and safety records, and environmental pollution, in accordance with guidance from the Global Reporting Initiative (GRI). Today, the GRI lists over 400 indicators on corporate nonfinancial performance. In 2011, the Sustainability Accounting Standards Board (SASB) was launched to identify which environmental, social and governance (ESG) issues are most likely to be material for individual industry sectors. Going forward, the European Union has mandated disclosure of nonfinancial information as of 2017 for all public companies with over 500 employees. Our central belief is that by considering this new and evolving set of nonfinancial data, equity analysts can deliver a more accurate and comprehensive view of a company’s opportunities and risks. As equity investors, our job is to build the most complete mosaic of data possible to craft an informed opinion of a company’s future growth prospects. For decades, we, like many investors, captured investment opportunities by identifying discrepancies between the price the market places on a security and estimates of long-term value. Today, by incorporating nonfinancial data into security analysis, we believe investors can paint a more accurate picture of a company’s future profitability, identify risks to its value chain, and evaluate its ability to innovate and grow.
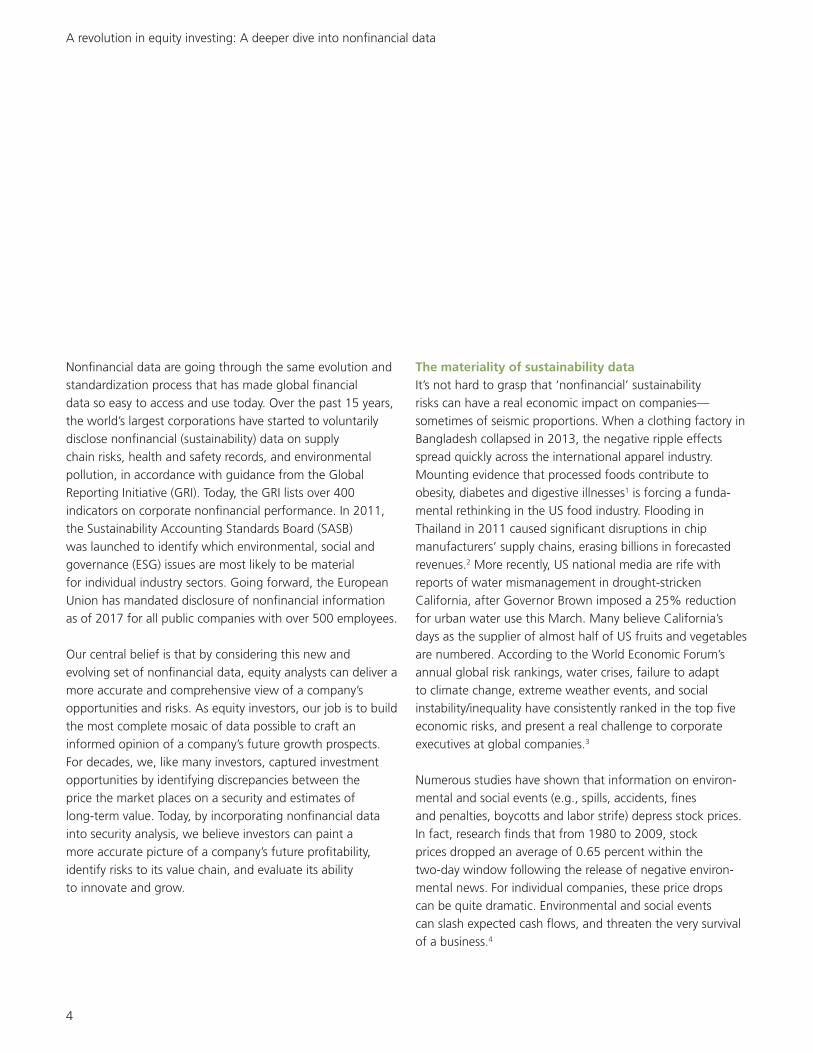
The materiality of sustainability data It’s not hard to grasp that ‘nonfinancial’ sustainability risks can have a real economic impact on companies— sometimes of seismic proportions. When a clothing factory in Bangladesh collapsed in 2013, the negative ripple effects spread quickly across the international apparel industry. Mounting evidence that processed foods contribute to obesity, diabetes and digestive illnesses1 is forcing a funda-mental rethinking in the US food industry. Flooding in Thailand in 2011 caused significant disruptions in chip manufacturers’ supply chains, erasing billions in forecasted revenues.2 More recently, US national media are rife with reports of water mismanagement in drought-stricken California, after Governor Brown imposed a 25% reduction for urban water use this March. Many believe California’s days as the supplier of almost half of US fruits and vegetables are numbered. According to the World Economic Forum’s annual global risk rankings, water crises, failure to adapt to climate change, extreme weather events, and social instability/inequality have consistently ranked in the top five economic risks, and present a real challenge to corporate executives at global companies.3 Numerous studies have shown that information on environ-mental and social events (e.g., spills, accidents, fines and penalties, boycotts and labor strife) depress stock prices. In fact, research finds that from 1980 to 2009, stock prices dropped an average of 0.65 percent within the two-day window following the release of negative environ-mental news. For individual companies, these price drops can be quite dramatic. Environmental and social events can slash expected cash flows, and threaten the very survival of a business.4

5
A revolution in equity investing: A deeper dive into nonfinancial data
Shareholders aren’t the only actors driving companies to change. Edward Freedman posited that a broader coalition of ‘stakeholders’ is often the most effective change agent, comprised of employees, customers, suppliers, communities, government bodies, and a range of political and labor groups.5 These stakeholders typically target large companies in consumer products that are financially sound, but are heavy polluters. Stakeholders often repeatedly pressure an exposed company, especially if it has a strong brand and reputation.6 Once tainted, companies can become more susceptible to the negative effects of media attention and are more likely to accede to stakeholder demands, even if their sales have not been negatively affected and there is no material cash flow impact.7 In other words, a targeted
company may be compelled to act (e.g., investing in pollution reduction or signing up to an environmental standard) to repair its reputation. When media get involved, the impact is amplified given how humans respond to bad news. A good rule of thumb is that one negative story is the equivalent of five positive stories.8 For example, stakeholder protests targeting labor (e.g., fair labor practices) or consumer issues (e.g., product safety or performance) with more media coverage tend to have a greater negative effect on stock returns than do boycotts alone.9 If an equity analyst believes that a company’s economic value remains unimpaired by poor publicity, a price plunge may pose an attractive buying opportunity. Conversely, the disclosure of serious problems that leads to fines, sanctions or lost brand equity may cause real and long-lasting financial damage. Controlling risks and creating value No company and no technology is completely risk-free. Whether it is using a new technology, such as driving an electric car, making the car battery that contains heavy metals, or disposing of the toxic plastics in the car at the junk yard—each phase of a green car’s “life-cycle” presents risks to human lives and to the ecosystem. Whether or how these risks are mitigated or exacerbated often depends on the actions or inactions of large corporate entities. For example, years ago the largest producer of chlorofluorocarbons (CFCs)—which destroy the Earth’s protective ozone layer—was DuPont. Once the company agreed to end production of CFCs and shifted to a higher margin substitute of hydrofluorocarbons, governments had a better chance of agreeing to enact the Montreal Protocol in 1989, setting standards to protect the global ozone layer.10 Decades of scientific discovery have revealed
6
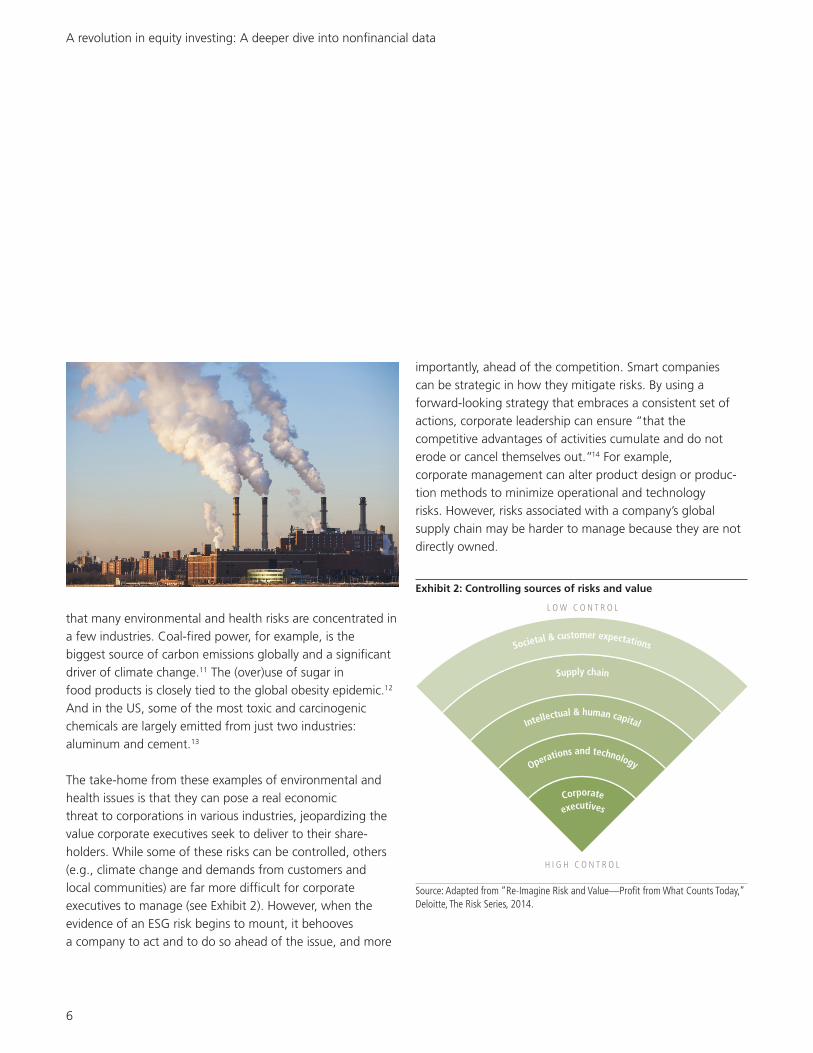
A revolution in equity investing: A deeper dive into nonfinancial data
that many environmental and health risks are concentrated in a few industries. Coal-fired power, for example, is the biggest source of carbon emissions globally and a significant driver of climate change.11 The (over)use of sugar in food products is closely tied to the global obesity epidemic.12 And in the US, some of the most toxic and carcinogenic chemicals are largely emitted from just two industries: aluminum and cement.13 The take-home from these examples of environmental and health issues is that they can pose a real economic threat to corporations in various industries, jeopardizing the value corporate executives seek to deliver to their share-holders. While some of these risks can be controlled, others (e.g., climate change and demands from customers and local communities) are far more difficult for corporate executives to manage (see Exhibit 2). However, when the evidence of an ESG risk begins to mount, it behooves a company to act and to do so ahead of the issue, and more
importantly, ahead of the competition. Smart companies can be strategic in how they mitigate risks. By using a forward-looking strategy that embraces a consistent set of actions, corporate leadership can ensure “that the competitive advantages of activities cumulate and do not erode or cancel themselves out.”14 For example, corporate management can alter product design or produc-tion methods to minimize operational and technology risks. However, risks associated with a company’s global supply chain may be harder to manage because they are not directly owned.
Supply chain
H I G H C O N T R O L
L O W C O N T R O L
Societal & customer expectations
Intellectual & human capital
Operations and technology
Corporate
executives
Exhibit 2: Controlling sources of risks and value
Source: Adapted from “Re-Imagine Risk and Value—Profit from What Counts Today,” Deloitte, The Risk Series, 2014.
7
A revolution in equity investing: A deeper dive into nonfinancial data
Some supply chain risks can actually represent an opportunity and not just a liability, given shareholder and community stakeholder demands. For example, while some apparel companies dropped suppliers that employed child labor, others partnered with their suppliers to keep children in school. This is one of many examples where companies successfully built shared value within their nearby communi-ties. Consideration of these risks (and opportunities) can help a company compete within its industry, creating value not only for its shareholders, but also value for its broader community. Conversely, corporate executives who ignore tangible risks can create uncertainties that eventually threaten cash flows, and drive stock prices down.
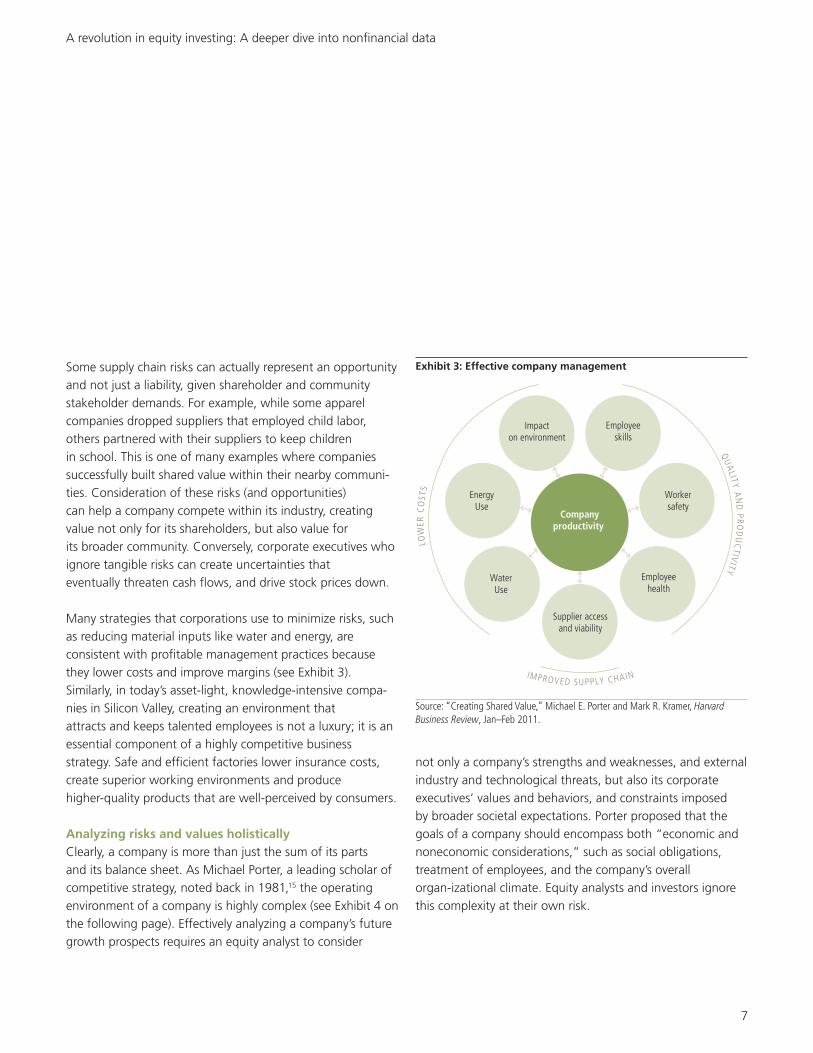
Many strategies that corporations use to minimize risks, such as reducing material inputs like water and energy, are consistent with profitable management practices because they lower costs and improve margins (see Exhibit 3). Similarly, in today’s asset-light, knowledge-intensive compa-nies in Silicon Valley, creating an environment that attracts and keeps talented employees is not a luxury; it is an essential component of a highly competitive business strategy. Safe and efficient factories lower insurance costs, create superior working environments and produce higher-quality products that are well-perceived by consumers.
Analyzing risks and values holistically Clearly, a company is more than just the sum of its parts and its balance sheet. As Michael Porter, a leading scholar of competitive strategy, noted back in 1981,15 the operating environment of a company is highly complex (see Exhibit 4 on the following page). Effectively analyzing a company’s future growth prospects requires an equity analyst to consider
not only a company’s strengths and weaknesses, and external industry and technological threats, but also its corporate executives’ values and behaviors, and constraints imposed by broader societal expectations. Porter proposed that the goals of a company should encompass both “economic and noneconomic considerations,” such as social obligations, treatment of employees, and the company’s overall organ-izational climate. Equity analysts and investors ignore this complexity at their own risk.
IMPROVED SUPPLY CHAIN
LOW
ER C
OST
S
QUALITY A
ND
PROD
UC
TIVITY
Companyproductivity
EnergyUse
Impacton environment
Employeeskills
Workersafety
Employeehealth
Supplier accessand viability
WaterUse
Exhibit 3: Effective company management
Source: “Creating Shared Value,” Michael E. Porter and Mark R. Kramer, Harvard Business Review, Jan–Feb 2011.
8
Research on gold mines helps us understand how a proactive response to what Porter termed “societal expectations” can impact security valuations. It turns out that gold mines with a track record of positive engagement with local community stakeholders enjoy a significantly lower cash flow discount rate at 12% than those with contentious relations
(72% discount rate). Why? Regulators and local community activists can inflict crippling production delays if a mine operator ignores them. It turns out that the value of positive relationships was worth twice as much as the gold controlled by the mines.16
Nonfinancial indicators of success are not obvious, and quite hard to find in financial statements. That is precisely why they can be a differentiator for active investment managers that know how to identify and measure them. Many are fundamental factors that help illuminate whether company executives are managing their assets smartly— both tangible and intangible (e.g., physical, intellectual and reputational)—and driving shareholder value upwards. Rather than detracting from returns, security analysis that incorporates nonfinancial sustainability factors and a broader mosaic of data helps equity analysts identify truly competitive business models and companies that can generate attractive financial results.
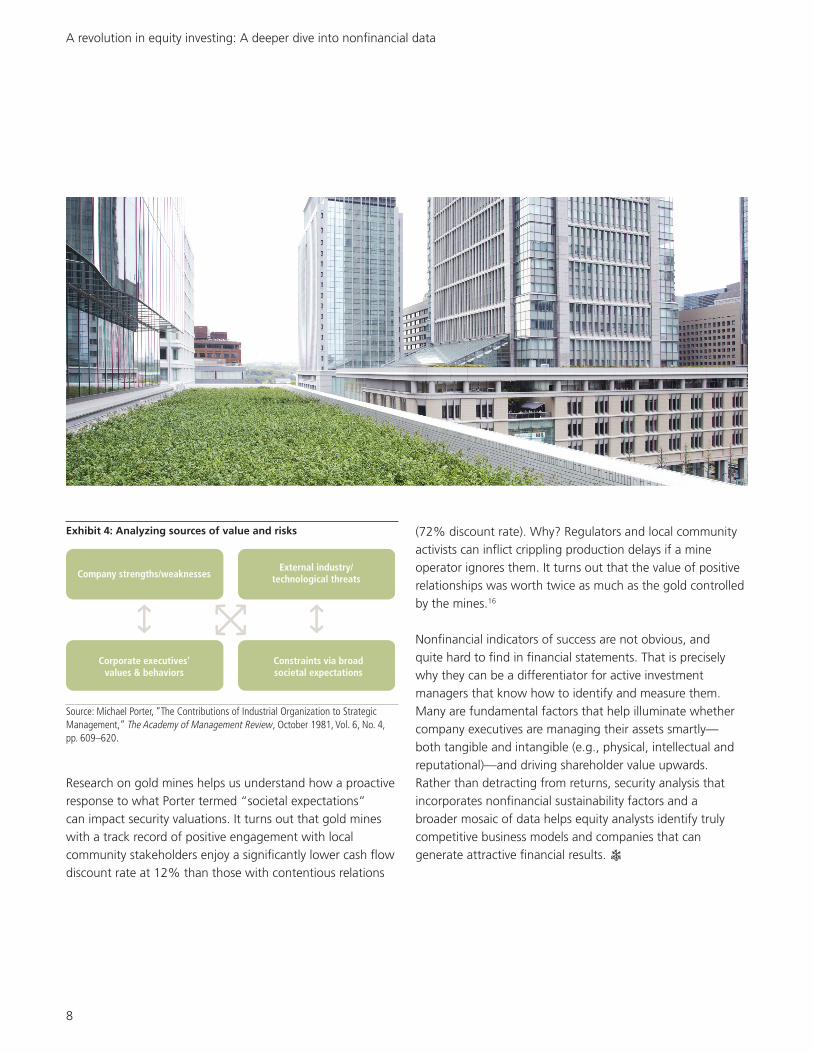
Exhibit 4: Analyzing sources of value and risks
Company strengths/weaknesses
Corporate executives’values & behaviors
Constraints via broadsocietal expectations
External industry/technological threats
Source: Michael Porter, “The Contributions of Industrial Organization to Strategic Management,“ The Academy of Management Review, October 1981, Vol. 6, No. 4, pp. 609–620.
A revolution in equity investing: A deeper dive into nonfinancial data

9
Footnotes1 http://www.hsph.harvard.edu/nutritionsource/sugary-drinks-fact-sheet/; http://www.hsph.harvard.edu/nutritionsource/healthy-drinks/soft-drinks-and-disease/;
http://www.lfpress.com/2015/03/08/autisms-bacteria-link-gains-credence. 2 The New York Times, December 14, 2011, reported that Intel announced that its fourth-quarter revenue would be $13.4 billion to $14 billion, down from a previous
forecast of $14.2 billion to $15.2 billion because of supply shortages of hard disk drives, as a result of flood damage to factories in Thailand. Shares of Intel lost 4% to close at $24.
3 WEF Global Risks 2015 Report, January 2015.4 Dinah A. Koehler and Eric J. Hespenheide, “Finding the value in environmental, social and governance performance,” Deloitte University Press, 2013; Caroline Flammer,
“Corporate Social Responsibility and Shareholder Reaction: The Environmental Awareness of Investors,” Academy of Management Journal, 2013, 56 (3), pp. 758–781. From 1980 to 1990, the average abnormal return associated with negative environmental news was -0.42%, increased to -0.66% during 1990–2000, and increased further to -1.12% during 2000–2009.
5 R. Edward Freeman, Strategic Management: A stakeholder approach, Boston: Pitman, 1984.6 Michael E. Conroy, “Branded: How the ‘certification revolution’ is transforming global corporations,” New Society Publishers, 2007; Michael Lenox and Charles Easley,
“Private environmental activism and the selection and response of firm targets,” Journal of Economics Management and Strategy, 2009, p.18, no. 1; Sam Gupta and Robert Innes, “Determinants and environmental impact of private politics: An empirical analysis,” University of Arizona, 2009.
7 Brayden G. King, “A political mediation model of corporate response to social movement activism,” Administrative Science Quarterly , 2008, p.53. 8 Roy F. Baumeister et al., “Bad is stronger than good,” Review of General Psychology 5, 2001, no. 4; Paul Rozin and Edward D. Royzman, “Negativity bias, negativity
dominance, and contagion,” Personality and Social Psychology Review 5, 2001, no. 4.9 Brayden G. King and Sarah A. Soule, “Social movements as extra-institutional entrepreneurs: The effect of protests on stock price returns,” Administrative Science Quarterly,
2007, p. 52.10 https://eng.ucmerced.edu/people/awesterling/copy_of_ESS141.2010/Assignments/DuPont.11 Trends in Global CO2 Emissions Report, 2014; PBL Netherlands Environmental Assessment Agency.12 http://www.hsph.harvard.edu/nutritionsource/sugary-drinks-fact-sheet.13 Dinah A. Koehler, Deborah H. Bennett, Gregory A. Norris, and John D. Spengler, “Rethinking Environmental Performance from a Public Health Perspective—A Comparative
Industry Analysis,” Journal of Industrial Ecology, 2005, Volume 9, Number 3, pp. 143–167. 14 Michael Porter, “What is strategy,” Harvard Business Review, November–December 1996, pp. 61–78.15 Michael Porter, “The Contributions of Industrial Organization to Strategic Management,“ The Academy of Management Review, October 1981, Vol. 6, No. 4, pp. 609–620. 16 Witold J. Henisz, Sinziana Dorobantu and Lite J. Nartey, “Spinning gold: The financial returns to stakeholder engagement,” Strategic Management Journal, 2013,
Vol 35:12, pp. 1727–1748.
A revolution in equity investing: A deeper dive into nonfinancial data
10
Sustainable Equity Team
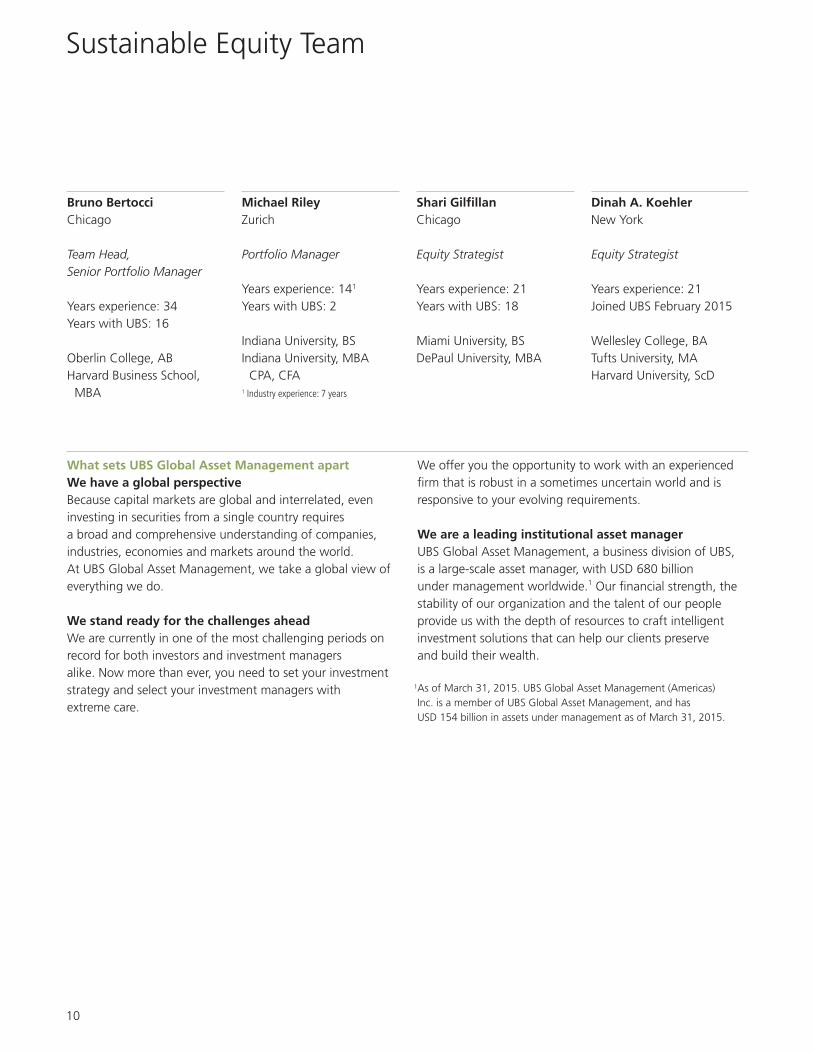
Bruno BertocciChicago
Team Head,Senior Portfolio Manager
Years experience: 34Years with UBS: 16
Oberlin College, ABHarvard Business School,
MBA
Michael RileyZurich
Portfolio Manager
Years experience: 141
Years with UBS: 2
Indiana University, BSIndiana University, MBA
CPA, CFA1 Industry experience: 7 years
Shari GilfillanChicago
Equity Strategist
Years experience: 21Years with UBS: 18
Miami University, BS DePaul University, MBA
Dinah A. KoehlerNew York
Equity Strategist
Years experience: 21Joined UBS February 2015
Wellesley College, BATufts University, MAHarvard University, ScD
What sets UBS Global Asset Management apart We have a global perspectiveBecause capital markets are global and interrelated, even investing in securities from a single country requires a broad and comprehensive understanding of companies, industries, economies and markets around the world. At UBS Global Asset Management, we take a global view of everything we do.
We stand ready for the challenges aheadWe are currently in one of the most challenging periods on record for both investors and investment managers alike. Now more than ever, you need to set your investment strategy and select your investment managers with extreme care.
We offer you the opportunity to work with an experienced firm that is robust in a sometimes uncertain world and is responsive to your evolving requirements.
We are a leading institutional asset manager UBS Global Asset Management, a business division of UBS, is a large-scale asset manager, with USD 680 billion under management worldwide.1 Our financial strength, the stability of our organization and the talent of our people provide us with the depth of resources to craft intelligent investment solutions that can help our clients preserve and build their wealth.
1As of March 31, 2015. UBS Global Asset Management (Americas) Inc. is a member of UBS Global Asset Management, and has USD 154 billion in assets under management as of March 31, 2015.
ab
UBS Global Asset Management (Americas) Inc.UBS TowerOne North Wacker DriveChicago, Illinois 60606 312-525 7100
©UBS 2015. All rights reserved.C15-0255 7/15www.ubs.com/globalam-us
UBS Global Asset Management (Americas) Inc. is a subsidiary of UBS AG.
DisclosureThe views expressed are as of March 31, 2015 and are a general guide to the views of UBS Global Asset Management. This document does not replace portfolio and fund-specific materials. Commentary is at a macro or strategy level and is not with reference to any registered or other mutual fund. This document is intended for limited distribution to the clients and associates of UBS Global Asset Management. Use or distribution by any other person is prohibited. Copying any part of this publication without the written permission of UBS Global Asset Management is prohibited. Care has been taken to ensure the accuracy of its content but no responsibility is accepted for any errors or omissions herein. Please note that past performance is not a guide to the future. Potential for profit is accompanied by the possibility of loss. The value of investments and the income from them may go down as well as up and investors may not get back the original amount invested.
This document is a marketing communication. Any market or investment views expressed are not intended to be investment research. The document has not been prepared in line with the requirements of any jurisdiction designed to promote the independence of investment research and is not subject to any prohibition on dealing ahead of the dissemination of investment research.
The information contained in this document does not constitute a distribution, nor should it be considered a recommendation to purchase or sell any particular security or fund. The information and opinions contained in this document have been compiled or arrived at based upon information obtained from sources believed to be reliable and in good faith. All such information and opinions are subject to change without notice.
A number of the comments in this document are based on current expectations and are considered “forward-looking statements.” Actual future results, however, may prove to be different from expectations. The opinions expressed are a reflection of UBS Global Asset Management’s best judgment at the time this document is compiled and any obligation to update or alter forward-looking statements as a result of new information, future events, or otherwise is disclaimed. Furthermore, these views are not intended to predict or guarantee the future performance of any individual security, asset class or market generally, nor are they intended to predict the future performance of any UBS Global Asset Management account, portfolio or fund.
Services to US clients for any strategy herein are provided by UBS Global Asset Management (Americas) Inc. (“Americas”). Americas is registered as an investment adviser with the US Securities and Exchange Commission (“SEC”) under the Investment Advisers Act of 1940.
Indices referenced herein are not available for direct investment. For a detailed description of the indices referenced and further definitions of terms, please visit: http://www.ubs.com/us/en/asset_management/individual_investors/mutual_fund.html