a rise in wealth for the wealthy; declines for the … · april 23, 2013 . an uneven recovery,...
TRANSCRIPT

APRIL 23, 2013
An Uneven Recovery, 2009-2011
A Rise in Wealth for the Wealthy; Declines for the Lower 93%
FOR FURTHER INFORMATION, CONTACT
Pew Research Center
1615 L St., N.W., Suite 700
Washington, D.C. 20036
Media Inquiries:
202.419.4372
www.pewresearch.org

About the Pew Research Center’s Social & Demographic Trends Project Pew Research Center is a nonpartisan source of data analysis. It does not take advocacy positions. Its Social & Demographic Trends project studies behaviors and attitudes of Americans in key realms of their lives, including family, community, finance, work and identity. All of the Social & Demographic Trends project reports are available at www.pewsocialtrends.org. Pew Research Center is a subsidiary of The Pew Charitable Trusts, a Philadelphia-based public charity. The staff of the Pew Research Center’s Social & Demographic Trends project is:
Paul Taylor, Director
Kim Parker, Associate Director
Richard Fry, Senior Research Associate
Gretchen Livingston, Senior Researcher
D’Vera Cohn, Senior Writer
Rich Morin, Senior Editor
Wendy Wang, Research Associate
Anna Brown, Research Assistant
Eileen Patten, Research Assistant
Mary Seaborn, Administrative Manager

Table of Contents
PAGE
Overview 1
About the Report 4
Chapter 1: The Uneven Wealth Recovery Among the Nation’s Households 6
Chapter 2: Explaining the Differential Wealth Recovery 9
Chapter 3: Background on Changes in Major Asset Prices from 2009 to 2011
13
Chapter 4: Comparison of the Census Wealth Tabulations to the Fed’s Flow Of Funds Net Worth Data
16
References 17
Appendix 1: Census Wealth and Asset Ownership Data 18

1
PEW RESEARCH CENTER
www.pewresearch.org
A Rise in Wealth for the Wealthy; Declines for the Lower 93% By Richard Fry and Paul Taylor OVERVIEW During the first two years of the nation’s economic recovery, the mean net worth of households in the upper 7% of the wealth distribution rose by an estimated 28%, while the mean net worth of households in the lower 93% dropped by 4%, according to a Pew Research Center analysis of newly released Census Bureau data. From 2009 to 2011, the mean wealth of the 8 million households in the more affluent group rose to an estimated $3,173,895 from an estimated $2,476,244, while the mean wealth of the 111 million households in the less affluent group fell to an estimated $133,817 from an estimated $139,896. These wide variances were driven by the fact that the stock and bond market rallied during the 2009 to 2011 period while the housing market remained flat. Affluent households typically have their assets concentrated in stocks and other financial holdings, while less affluent households typically have their wealth more heavily concentrated in the value of their home. From the end of the recession in 2009 through 2011 (the last year for which Census Bureau wealth data are available), the 8 million households in the U.S. with a net worth above $836,033 saw their aggregate wealth rise by an estimated $5.6 trillion, while the 111 million

2
A Rise in Wealth for the Wealthy; Declines for the Lower 93%
www.pewresearch.org
households with a net worth at or below that level saw their aggregate wealth decline by an estimated $0.6 trillion.1
Because of these differences, wealth inequality increased during the first two years of the recovery. The upper 7% of households saw their aggregate share of the nation’s overall household wealth pie rise to 63% in 2011, up from 56% in 2009. On an individual household basis, the mean wealth of households in this more affluent group was almost 24 times that of those in the less affluent group in 2011. At the start of the recovery in 2009, that ratio had been less than 18-to-1. (The focus in this report on the upper 7% of households rather than some other share of high wealth households reflects the limits of the tabulations published by the Census Bureau. The boundaries of its wealth categories dictated the split of households analyzed in this report.) Overall, the wealth of America’s households rose by $5 trillion, or 14%, during this period, from $35.2 trillion in 2009 to $40.2 trillion in 2011.2
Household wealth is the sum of all assets, such as a home, car, real property, a 401(k), stocks and other financial holdings, minus the sum of all debts, such as a mortgage, car loan, credit card debt and student loans.
During the period under study, the S&P 500 rose by 34% (and has since risen by an additional 26%), while the S&P/Case-Shiller home price index fell by 5%, continuing a steep slide that began with the crash of the housing market in 2006. (Housing prices have slowly started to rebound in the past year but remain 29% below their 2006 peak.) The different performance of financial asset and housing markets from 2009 to 2011 explains virtually all of the variances in the trajectories of wealth holdings among affluent and less affluent households during this period. Among households with net worth of $500,000 or
1 Unless otherwise noted, dollar amounts are adjusted for inflation and reported in 2011 dollars. 2 The Census tabulations are based on the Survey of Income and Program Participation (SIPP). For 2010 this data source indicated that total household wealth was $39.4 trillion. An alternative source of data on household wealth, the Federal Reserve Board’s Survey of Consumer Finances (SCF), indicates that 2010 wealth totaled $60.0 trillion. Some of the discrepancy may be due to differences in each survey’s universe. The SIPP is restricted to the household population, while the SCF includes families living in group quarters. The SCF is also more comprehensive in the assets it covers. SIPP does not include the cash value of life insurance policies and the value of household furnishings such as antiques, art and jewelry. Since the SCF oversamples high net worth families, estimates of mean net worth and aggregate net worth based on it are preferred (Orzechowski and Sepielli, 2003). However, no post-recession SCF data are yet available.

3
PEW RESEARCH CENTER
www.pewresearch.org
more, 65% of their wealth comes from financial holdings, such as stocks, bonds and 401(k) accounts, and 17% comes from their home. Among households with net worth of less than $500,000, just 33% of their wealth comes from financial assets and 50% comes from their home. The Census Bureau data also indicate that among less affluent households, fewer directly owned stocks and mutual fund shares in 2011 (13%) than in 2009 (16%), meaning a smaller share enjoyed the fruits of the stock market rally. Likewise, fewer had individual retirement accounts (IRAs) or Keogh accounts (22% in 2011 versus 24% in 2009) and the same share had 401(k) or Thrift Savings Plan accounts (39% in both years). Among affluent households, there was also a decline in the share directly owning stock and mutual fund shares during this period (59% in 2011 versus 62% in 2009), but a slight increase in the share with IRAs or Keogh accounts (70% versus 68%) and a larger increase in the share with 401(k) or Thrift Savings Plan accounts (65% versus 61%). Overall, net worth per household in the U.S. in 2011 made up nearly all the ground it had lost since 2005—$338,950 versus $340,252 in 2005, the latest pre-recession data published by the Census Bureau. (Total household wealth doubtless rose for a period after 2005 before falling precipitously during the Great Recession of 2007-2009 and rebounding since then. However, no household wealth data are available from the Census Bureau for the years between 2005 and 2009, so it is not possible to pinpoint when, or at what level, the peak in wealth per household occurred.) Looking at the period from 2005 to 2009, Census Bureau data show that mean net worth declined by 12% for households as a whole but remained unchanged for households with a net

4
A Rise in Wealth for the Wealthy; Declines for the Lower 93%
www.pewresearch.org
worth of $500,000 and over. Households in that top wealth category had a mean of $1,590,075 in wealth in 2005, $1,585,441 in 2009 and $1,920,956 in 2011.3
About the Report Much of the original analysis in this report is based on published tabulations of household wealth and asset ownership by the U.S. Census Bureau. Estimates of the 2011 level and composition of household wealth were released by the Census Bureau on March 21, 2013. The data can be downloaded from http://www.census.gov/people/wealth/data/dtables.html. The Census Bureau’s wealth tabulations are based on its long-running longitudinal household survey called the Survey of Income and Program Participation (SIPP). The Census Bureau has published comparable wealth tabulations based on SIPP since 1984 (the data were collected in 1984; the report publication date was July 1986). SIPP is among the nation’s most prominent sources of data on the wealth of American households. The Board of Governors of the Federal Reserve System also publishes periodic estimates of the aggregate net worth of the nation’s households and nonprofit organizations. The most recent Federal Reserve System estimates are for the fourth quarter of 2012. However, these “flow of funds accounts” estimates provide no demographic information; that is, they do not illuminate which households own the nation’s wealth, only the total amount of that wealth. SIPP provides detailed demographic information on the ownership of wealth, and the 2011 wealth estimates provided by the Census Bureau are the most recent estimates available on which households own the nation’s wealth.4
The estimates are based on responses from a sample of the population and may differ from the actual values because of sampling variability and other factors.
The terms “wealth” and “net worth” are used interchangeably. “Household net worth” refers to the value of the household’s assets minus the value of household liabilities, or the value of what it owns minus the value of what it owes. “Net worth” includes the value of nonfinancial assets owned, such as equity in one’s own home and a motor vehicle, as well the value of financial assets such as bank accounts, defined-contribution retirement accounts, savings bonds and directly owned stocks, bonds and securities. Net worth as measured by the Survey of Income
3 However, price inflation makes this comparison more tenuous as the years go by. In other words, $500,000 was worth considerably more in 2005 than 2011. In terms of constant purchasing power, households with a net worth of $500,000 and over in 2005 should be compared with households with a net worth of $576,052 or more in 2011. Clearly the share of households in this upper net worth category fell from 2005 to 2011. In 2005 15% of households had a net worth of $500,000 or more. By 2011, 13.5% of households had a net worth of $500,000 or more, so a lower share would have had $576,052 or more. 4 Another prominent source of data on wealth is the Survey of Consumer Finances, collected by the Board of Governors of the Federal Reserve System. The most recent Survey of Consumer Finances was collected in 2010. It is a triennial survey; the next Survey of Consumer Finances data, for 2013, will be available in 2015.

5
PEW RESEARCH CENTER
www.pewresearch.org
and Program Participation does not include the value of traditional pensions (defined-benefit retirement plans) or present or future benefit streams tied to Social Security. Unless otherwise noted, dollar amounts are adjusted for inflation and reported in 2011 dollars. The inflation adjustment utilizes the Bureau of Labor Statistics’ Consumer Price Index Research Series (CPI-U-RS) as published in DeNavas-Walt, Proctor and Smith (2012). This is the price index series used by the U.S. Census Bureau to deflate the data it publishes on household income. Additional details on the Census Bureau wealth estimates are provided in the Appendix. This report was conceived and researched by Richard Fry, senior economist with the Pew Research Center’s Social & Demographic Trends project. The report was written by Fry and Paul Taylor, executive vice president of the Pew Research Center and director of the Social & Demographic Trends project. Research assistant Eileen Patten provided expert assistance with the preparation of charts and formatting the report. Research assistants Patten and Anna Brown number-checked the report. It was copy-edited by Marcia Kramer. The authors appreciate the insights on the distribution of wealth provided by Rakesh Kochhar, senior researcher with the Pew Research Center.

6
A Rise in Wealth for the Wealthy; Declines for the Lower 93%
www.pewresearch.org
CHAPTER 1: THE UNEVEN WEALTH RECOVERY AMONG THE NATION’S HOUSEHOLDS The net worth of the nation’s households increased from 2009 to 2011, but the increase in wealth was far from widely distributed among households. The vast majority of the nation’s households experienced a decline in net worth.
Recently released Census Bureau net worth figures indicate that mean net worth, or net worth per household, increased from $297,729 in 2009 to $338,950 in 2011, a 14% increase. Detailed net worth figures are available for nine categories of net worth, stretching from negative or zero net worth to a net worth level of $500,000 or more. Households in all eight net worth categories from negative or zero to $250,000 to $499,999 of net worth experienced a decline in mean net worth from 2009 to 2011. Only households with a net worth of $500,000 or more experienced an increase in mean net worth, from $1,585,441 in 2009 to $1,920,956 in 2011, or 21%. These wealth statistics do not imply that all households with a net worth below $500,000 lost wealth from 2009 to 2011. There were no doubt some gainers. But the decline in mean net worth means that the losses of the losers trumped the gains of the gainers.
Mean Net Worth by Household Net Worth Category, 2009 and 2011
% of 2011 households
Mean net worth (in 2011 dollars)
2009 2011 % change
2009 to 2011 All 100% $297,729 $338,950 +14% Net worth group Negative or zero 18% -$34,777 -$35,472 -2% $1 to $4,999 9% $2,016 $1,899 -6% $5,000 to $9,999 5% $7,433 $7,248 -2% $10,000 to $24,999 7% $17,342 $16,586 -4% $25,000 to $49,999 7% $38,740 $36,878 -5% $50,000 to $99,999 10% $77,028 $73,099 -5% $100,000 to $249,999 18% $173,100 $164,345 -5% $250,000 to $499,999 13% $370,148 $354,668 -4% $500,000 and over 13% $1,585,441 $1,920,956 +21%
Source: Pew Research Center tabulations of Survey of Income and Program Participation wealth data.
PEW RESEARCH CENTER

7
PEW RESEARCH CENTER
www.pewresearch.org
In both 2009 and 2011 about 13.5% of households had a net worth of at least $500,000. However, even though the category had the same number of households in both years, some individual households moved up into the category during the period under study, and some fell out. This is true for all the wealth categories shown above.5
High Net Worth Households Even though households with net worth of $500,000 or above saw their mean net worth increase from 2009 to 2011, this group’s median net worth decreased during the same period—to $836,033 in 2011 from $889,275 in 2009. The median refers to the midpoint of a group—in this case, households at the 93.25 percentile of wealth (halfway between the 86.5th percentile and the 100th percentile). A simultaneous rise in the mean and decline in the median implies that aggregate net worth increased only among households above the median—that is, the 8 million households with net worth of $836,033 or more in 2011. Those upper 7% of households had an estimated aggregate wealth gain of 28% from 2009 to 2011, while the estimated aggregate wealth of households in the $500,000 to $836,033 range fell by 4%.
5 The available Census Bureau tabulations do not reveal the change in wealth for the subset of households with $500,000 or more in net worth in both 2009 and 2011. SIPP is longitudinal in nature and hence follows the same households in the survey over time. In principle an analyst could determine the net worth of households in both 2009 and 2011 using SIPP. In practice, it is not a straightforward analysis with the data made available for public use because net worth was top-coded in wave 10 of the 2008 panel but not in wave 4 of the panel.

8
A Rise in Wealth for the Wealthy; Declines for the Lower 93%
www.pewresearch.org
$35.2
$15.4 $19.8
$40.2
$14.8
$25.4
All Lower 93% Upper 7%
2009 2011
$5.0 trillion
increase
$0.6 trillion
decrease
$5.6 trillion
increase
The Changing Distribution of Household Wealth The total stock of household wealth in the U.S. increased $5.0 trillion from 2009 ($35.2 trillion) to 2011 ($40.2 trillion);6 all of these aggregate gains, and more, went to households in the upper 7%. In 2009 households with a net worth of $889,275 and below (the lower 93%) had an estimated $15.4 trillion in wealth.7
6 See Gottschalck, Vornovytskyy and Smith (2013) for a discussion of aggregate net worth in 2000 and 2011.
By 2011, households in the lower 93% had $14.8 trillion in wealth. Meanwhile, at the top of the wealth pyramid, the aggregate wealth of the upper 7% rose from an estimated $19.8 trillion in 2009 to $25.4 trillion in 2011 (a $5.6 trillion increase). As a result, the upper 7% of households owned 63% of the nation’s total household wealth in 2011, up from 56% in 2009.
7 On the basis of the means published by the Census Bureau, it is simple math to calculate the aggregate wealth of households with $499,999 or less of net worth. To estimate the aggregate wealth of households in the lower 93%, one needs the mean wealth of households between $500,000 and $889,275 in net worth. The $15.4 trillion estimate is based on assuming that wealth is uniformly distributed over the households in the $500,000 to $889,275 category or that their mean net worth was $694,638. A similar assumption was used to estimate aggregate wealth of the lower 93% in 2011. While an assumption is needed to estimate the aggregate wealth owned, the Census Bureau data unambiguously indicate that total wealth increased from 2009 to 2011 but that wealth declined among the lower 87% of households.
Aggregate Net Worth of Households, 2009 and 2011 In trillions of 2011 dollars
Note: In 2011 lower 93% refers to households with a net worth at or below $836,033. In 2009 lower 93% refers to households with a net worth at or below $889,275.
Source: Pew Research Center tabulations of Survey of Income and Program Participation wealth data
PEW RESEARCH CENTER

9
PEW RESEARCH CENTER
www.pewresearch.org
CHAPTER 2: EXPLAINING THE DIFFERENTIAL WEALTH RECOVERY Wealthier households tended to gain most of the wealth created from 2009 to 2011 because they were much more likely to own the assets that rose the most in value. From 2009 to 2011, average net worth per household rose 14% overall. However, average net worth excluding home equity rose 31%, from $195,650 in 2009 to $255,843 in 2011. Much of the nation’s net worth excluding home equity is in financial assets, and the nation’s households with at least $500,000 of net worth were more likely to own financial assets, particularly the financial assets that rose the most in value from 2009 to 2011.
Mean Value of Assets by Type of Asset Owned, 2009 and 2011 In 2011 dollars
2009 2011 % change
2009 to 2011 Net worth $297,729 $338,950 +14% Net worth (excluding equity in own home) $195,650 $255,843 +31% Interest-earning assets at financial institutions $27,275 $22,170 -19% Other interest-earning assets1 $164,342 $803,641 +389% Regular checking accounts $2,437 $2,659 +9% Stocks and mutual fund shares $151,507 $228,643 +51% Equity in business or profession $158,163 $180,046 +14% Equity in motor vehicles $7,731 $8,418 +9% Equity in own home $150,771 $127,290 -16% Rental property equity $547,462 $370,013 -32% Other real estate equity $175,109 $171,529 -2% U.S. saving bonds $5,740 $6,103 +6% IRAs or Keogh accounts $153,785 $166,451 +8% 401(k) and Thrift Savings Plan accounts $76,086 $119,799 +57% Other assets2 $123,240 $154,524 +25%
Notes: Mean value is calculated only over households that own the asset. 1Includes U.S. government securities and municipal or corporate bonds. 2Includes mortgages held for sale of real estate, amount due from sale of business property, and other financial assets.
Source: Pew Research Center tabulations of Survey of Income and Program Participation wealth data
PEW RESEARCH CENTER

10
A Rise in Wealth for the Wealthy; Declines for the Lower 93%
www.pewresearch.org
In 2009 households with at least $500,000 of net worth owned 72% of the nation’s aggregate net worth but 81% of the nation’s aggregate financial assets. The Census Bureau reports the average value for specific assets among the households that own that specific asset. Very large gains in average holdings were reported for specific categories of financial assets. For example, the average value of 401(k) and Thrift Savings Plan accounts rose 57% from 2009 ($76,086) to 2011 ($119,799). The mean value of directly owned stocks and mutual funds rose 51% from 2009 to 2011. Among households owning assets in the category of “other interest-earning assets,” or direct owners of government securities or municipal and corporate bonds, the average holdings of those securities and bonds rose nearly fivefold from 2009 ($164,342) to 2011 ($803,641).
Asset Ownership Rates by Type of Asset and Household Net Worth Category, 2009 and 2011 %
2009 2011
All
Net worth $499,999
or less
Net worth $500,000 or
more
All
Net worth $499,999
or less
Net worth $500,000 or
more Interest-earning assets at financial institutions 71 67 93 70 66 93 Other interest-earning assets1 3 1 14 3 1 13 Regular checking accounts 32 32 29 29 29 26 Stocks and mutual fund shares 22 16 62 20 13 59 Equity in business or profession 15 12 30 14 11 29 Equity in motor vehicles 84 83 94 85 83 95 Equity in own home 66 62 95 65 61 96 Rental property equity 6 3 21 5 3 21 Other real estate equity 6 4 19 5 3 17 U.S. saving bonds 11 9 24 9 8 22 IRAs or Keogh accounts 30 24 68 29 22 70 401(k) and Thrift Savings Plan accounts 42 39 61 42 39 65 Other assets2 4 3 12 4 3 12
Notes: 1Includes U.S. government securities and municipal or corporate bonds. 2Includes mortgages held for sale of real estate, amount due from sale of business property, and other financial assets.
Source: Pew Research Center tabulations of Survey of Income and Program Participation wealth data
PEW RESEARCH CENTER

11
PEW RESEARCH CENTER
www.pewresearch.org
Average gains in other important asset categories paled by comparison. Reflecting the decline in house values nationally from 2009 to 2011, average equity in one’s own home fell 16%. The mean value of rental properties tumbled 32% from 2009 to 2011, and the value of “other real estate equity” (vacation homes and other real estate) declined 2%. Most households (70%) own an interest-bearing account at a bank or other financial institution, such as a certificate of deposit, savings account or money market deposit account. The average value of these accounts fell 19% from 2009 ($27,275) to 2011 ($22,170). Turning to asset ownership rates, households with a net worth of at least $500,000 were much more likely to own the financial asset categories that experienced large gains in average value. In 2011, households with a net worth of at least $500,000 were about 13 times as likely as households with less than $500,000 in net worth to directly own government securities and municipal and corporate bonds: 13% for high net worth households versus 1% for lower net worth households. Differences in the likelihood of ownership were also pronounced for other high-performing financial asset categories. For example, 59% of households with a net worth of at least $500,000 directly own stocks or mutual fund shares. By comparison, only 13% of lower net worth households directly own these assets. Almost two-thirds of households with at least $500,000 of net worth owned a 401(k) or Thrift Savings Plan retirement account in 2011. Among households with less than $500,000 in net worth, only 39% owned one of these assets. In the aggregate, all of the total $5.0 trillion increase in household wealth from 2009 to 2011 was the result of increases in various types of financial assets. These gains were heavily concentrated among the affluent. For example, the value of wealth in government securities and corporate and municipal bonds rose $2.2 trillion from 2009 ($0.6 trillion) to 2011 ($2.8 trillion). The value of such assets held by households with at least $500,000 in net worth rose $2.2 trillion and hence high net worth households were the sole gainers in that lucrative asset class. The value of directly owned stock and mutual funds rose $1.4 trillion. The value of direct stock holdings owned by high net worth households rose $1.4 trillion. Wealth in 401(k) and Thrift Savings Plan accounts rose $2.2 trillion. The value of such holdings among households with at least $500,000 in net worth rose $2.1 trillion.

12
A Rise in Wealth for the Wealthy; Declines for the Lower 93%
www.pewresearch.org
By contrast, the asset classes that experienced declines since 2009 were more widely held and thus the decline in value was not solely concentrated among households with at least $500,000 in net worth. For example, equity in own home tumbled $1.9 trillion from 2009 to 2011, but equity in own home among high net worth households declined only $1.1 trillion.
Aggregate Value of Specific Assets by Household Net Worth Category, 2009 and 2011 In trillions of 2011 dollars
2009 2011 Change
2009 to 2011
Net worth
$499,999 or less
Net worth
$500,000 or more
Net worth
$499,999 or less
Net worth
$500,000 or more
Net worth
$499,999 or less
Net worth
$500,000 or more
Interest-earning assets at financial institutions 0.88 1.40 0.79 1.05 -0.09 -0.35 Other interest-earning assets1 0.04 0.58 0.04 2.80 0.00 +2.22 Regular checking accounts 0.07 0.03 0.06 0.03 0.00 0.00 Stocks and mutual fund shares 0.45 3.46 0.42 4.88 -0.03 +1.42 Equity in business or profession 0.35 2.39 0.43 2.52 +0.08 +0.13 Equity in motor vehicles 0.52 0.25 0.61 0.24 +0.09 -0.01 Equity in own home 5.56 6.24 4.71 5.15 -0.85 -1.09 Rental property equity 0.35 3.22 0.37 2.03 +0.02 -1.19 Other real estate equity 0.27 0.91 0.24 0.76 -0.04 -0.14 U.S. saving bonds 0.04 0.04 0.03 0.03 0.00 0.00 IRAs or Keogh accounts 0.92 4.51 0.97 4.75 +0.05 +0.24 401(k) and Thrift Savings Plan accounts 1.70 2.07 1.85 4.14 +0.15 +2.07 Other assets2 0.10 0.46 0.10 0.60 0.00 +0.13
Notes: 1Includes U.S. government securities and municipal or corporate bonds. 2Includes mortgages held for sale of real estate, amount due from sale of business property, and other financial assets.
Source: Pew Research Center tabulations of Survey of Income and Program Participation wealth data
PEW RESEARCH CENTER

13
PEW RESEARCH CENTER
www.pewresearch.org
132
126
135
100
110
120
130
140
150
2009 Q1 2010 Q1 2011 Q1 2012 Q1 2012 Q4
CHAPTER 3: BACKGROUND ON CHANGES IN MAJOR ASSET PRICES FROM 2009 TO 2011 The nation began its recovery from the Great Recession in June 2009. From mid-2009 until the end of 2011, the price or value of major classes of assets has not followed a uniform trajectory.8
Generally prices in bond and equity markets have risen significantly since the beginning of the economic recovery, while national home prices continued to decline.
Home Prices According to the S&P/Case-Shiller home price index, home prices peaked nationally in the first quarter of 2006 at 191. From the peak until the second quarter of 2009, home prices declined 31%. Though the economic recovery commenced in June 2009, hemorrhaging in the national housing market continued. Home prices fell an additional 5% from the second quarter of 2009 until the fourth quarter of 2011. National home prices bottomed out at the end of 2011; during 2012 they recovered the declines sustained since the start of the economic recovery, but they remain below the 2006 peak.
8 The Census Bureau wealth data were collected over September to December in both 2009 and 2011. Respondents reported on their assets and liabilities as the last day of the prior month, so the wealth snapshots are from August to November in both years. In this chapter, in order to align the discussion with the official dating of the Great Recession according to the National Bureau of Economic Research, the course of asset prices is described from June 2009 (or the second quarter of 2009) to December 2011 (or the fourth quarter of 2011).
S&P/Case-Shiller Home Price Index, 2009 to 2012 1987 Q1= 62
Note: Dates labeled in the chart are 2009 Q2, 2011 Q4 and 2012 Q4.
Source: Seasonally adjusted quarterly national index of home prices, available at http://www.standardandpoors.com/indices/sp-case-shiller-home-price-indices/en/us/?indexId=spusa-cashpidff--p-us----
PEW RESEARCH CENTER

14
A Rise in Wealth for the Wealthy; Declines for the Lower 93%
www.pewresearch.org
926
1,243
1,422
500
700
900
1100
1300
1500
Jan. 2009 Jan. 2010 Jan. 2011 Jan. 2012 Dec. 2012
Stock Prices Despite some fits and starts, U.S. equity markets have generally been on an upward trajectory during the economic recovery. For example, the S&P 500 stock index reached a bottom in March 2009 (at 677 on March 9). From June 2009 until December 2011 the S&P 500 rose 317 points (from 926 to 1,243), or 34%. More recently, stocks have gone on to reach new highs. In March 2013 the S&P surpassed the prior high of 1,565 attained on Oct. 9, 2007.
S&P 500 Index, 2009 to 2012
(1941–43=10)
Note: Dates labeled in the chart are June 2009, December 2011 and December 2012.
Source: 2013 Economic Report of the President, Table B-96
PEW RESEARCH CENTER
15
PEW RESEARCH CENTER
www.pewresearch.org
3.72
1.98 1.72
5.61
3.93 3.65
0
1
2
3
4
5
6
7
Jan. 2009 Jan. 2010 Jan. 2011 Jan. 2012
10-year U.S. Treasury security Aaa corporate bonds (Moody's)
Dec. 2012
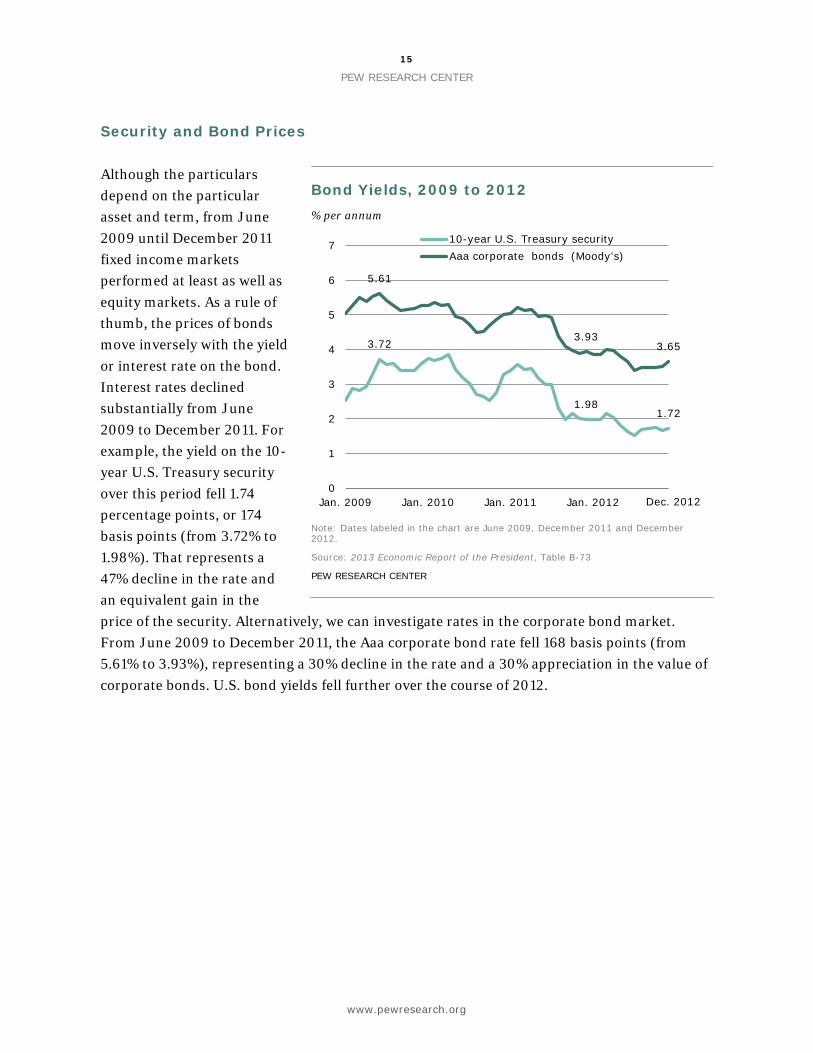
Security and Bond Prices Although the particulars depend on the particular asset and term, from June 2009 until December 2011 fixed income markets performed at least as well as equity markets. As a rule of thumb, the prices of bonds move inversely with the yield or interest rate on the bond. Interest rates declined substantially from June 2009 to December 2011. For example, the yield on the 10-year U.S. Treasury security over this period fell 1.74 percentage points, or 174 basis points (from 3.72% to 1.98%). That represents a 47% decline in the rate and an equivalent gain in the price of the security. Alternatively, we can investigate rates in the corporate bond market. From June 2009 to December 2011, the Aaa corporate bond rate fell 168 basis points (from 5.61% to 3.93%), representing a 30% decline in the rate and a 30% appreciation in the value of corporate bonds. U.S. bond yields fell further over the course of 2012.
Bond Yields, 2009 to 2012 % per annum
Note: Dates labeled in the chart are June 2009, December 2011 and December 2012.
Source: 2013 Economic Report of the President, Table B-73
PEW RESEARCH CENTER

16
A Rise in Wealth for the Wealthy; Declines for the Lower 93%
www.pewresearch.org
$23.8
$45.8
$69.6
$13.9
$55.7
$23.4
$50.6
$74.0
$13.4
$60.6
Nonfinancial assets
Financial assets
Total assets Total liabilities
Net worth
2009 2011Q:4
CHAPTER 4: COMPARISON OF THE CENSUS WEALTH TABULATIONS TO THE FED’S FLOW OF FUNDS NET WORTH DATA The Federal Reserve Bank measures household wealth in a somewhat different way than does the U.S. Census Bureau, but its reports provide corroboration of the picture emerging from recently released Census wealth tabulations. As with the Census Bureau data, the Fed data show that all of the growth in aggregate wealth from 2009 to 2011 can be accounted for by the increase in the value of financial assets. There are a number of differences between the Federal Reserve data and the Census Bureau tabulations. Among these differences, the Fed data refer to the assets and liabilities owned by the nation’s nonprofit organizations as well as households. In addition, they are in nominal dollars and not adjusted for inflation. However, as with the Census data, the Fed data show a rise in wealth from 2009 to the fourth quarter of 2011. Likewise, the Fed data indicate that most of the growth in the nation’s wealth during that period was due to an increase in the value of financial assets. From 2009 to the fourth quarter of 2011, financial assets increased in value by $4.8 trillion (from $45.8 trillion to $50.6 trillion), accounting for nearly all of the $4.9 trillion increase in the nation’s net worth of households and nonprofit organizations.
Aggregate Assets, Liabilities and Net Worth of Households and Nonprofit Organizations, 2009 to 2011:Q4 In trillions of dollars
Note: 2009 data are in 2009 dollars; 2011 data are in 2011 dollars.
Source: Federal Reserve Board Flow of Funds Accounts, March 7, 2013 release, table B.100
PEW RESEARCH CENTER

17
PEW RESEARCH CENTER
www.pewresearch.org
REFERENCES DeNavas-Walt, Carmen, Bernadette D. Proctor, and Jessica C. Smith. 2012. “Income, Poverty,
and Health Insurance Coverage in the United States: 2011.” Current Population Reports, Consumer Income, P60-243. Washington, DC: U.S. Census Bureau, September. http://www.census.gov/prod/2012pubs/p60-243.pdf
Gottschalck, Alfred O. 2008. Net Worth and the Assets of Households: 2002. Current Population Report P70-115. Washington, DC: U.S. Census Bureau, April. http://www.census.gov/prod/2008pubs/p70-115.pdf
Gottschalck, Alfred, Marina Vornovytskyy, and Adam Smith. 2012. Household Wealth in the
U.S.: 2000 to 2011. Washington, DC: U.S. Census Bureau, March. http://www.census.gov/people/wealth/files/Wealth%20Highlights%202011.pdf#zoom=100
Orzechowski, Shawna, and Peter Sepielli. 2003. Net Worth and Asset Ownership of
Households: 1998 and 2000. Current Population Report P70-88. Washington, DC: U.S. Census Bureau, May. http://www.census.gov/prod/2003pubs/p70-88.pdf

18
A Rise in Wealth for the Wealthy; Declines for the Lower 93%
www.pewresearch.org
APPENDIX 1: CENSUS WEALTH AND ASSET OWNERSHIP DATA The Census Bureau collects ongoing data on the nation’s wealth and ownership of assets in the Survey of Income and Program Participation (SIPP). Modules on wealth have existed since 1984, and for many years the Census Bureau published wealth reports in its SIPP P-70 report series. Gottschalk (2008) is a good introduction to the wealth data based on SIPP. The most recent SIPP wealth collection occurred as part of wave 10 of the 2008 SIPP panel. Interviews occurred over September to December 2011 and refer to assets and liabilities as of the last day of the prior month. The 2009 data (wave 4 of the 2008 SIPP panel) were collected in similar fashion and hence the two wealth snapshots presented in this report are representative of the nation’s wealth in August to November of 2009 and 2011. The 2011 data were based on interviews with about 31,000 households. The wealth tabulations in this report are based on tabulations of the SIPP data published by the Census Bureau. The 2011 tabulations were published by the Census Bureau on March 21, 2013. Most of the dollar figures are adjusted for inflation and expressed in 2011 dollars. The nine household net worth categories available in the Census tabulations are, however, in nominal dollars. In both 2009 and 2011, about 16.0 million households had a net worth of at least $500,000. In 2009 the $500,000 refers to $500,000 in 2009 dollars, while the $500,000 in 2011 refers to $500,000 in 2011 dollars. Since $500,000 was worth more in 2009 than it was in 2011, implicitly it became easier for a household to be included in the $500,000 or more net worth category in 2011 than in 2009. In each year about 13.5% of households had $500,000 of net worth in nominal terms. But because of inflation, a smaller share of households had $500,000 in real purchasing power in 2011 than in 2009.