a safety and health management tool - owca · a safety and health management tool prepared by: mark...
TRANSCRIPT

The Benefits of SHARP A Safety and Health Management Tool
Prepared by: Mark E. Hurliman, CSHM
VPP/SHARP Program Manager

OR-OSHA A Four Pronged Approach
• Enforcement
• Technical
• Training
• Consultation

Consultation Philosophy
• To work with employers to enable their organization to complete future prevention efforts independently of the consultant.
• To increase the self-sufficiency of Oregon employers in the field of safety and health program management.
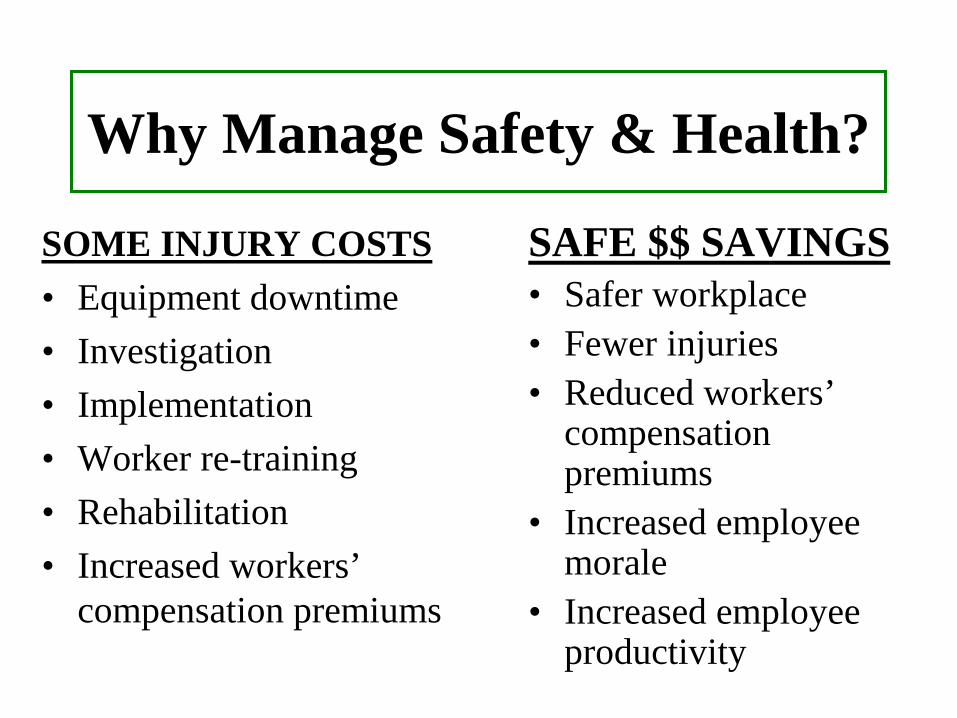
Why Manage Safety & Health?
SOME INJURY COSTS • Equipment downtime • Investigation • Implementation • Worker re-training • Rehabilitation • Increased workers’
compensation premiums
SAFE $$ SAVINGS • Safer workplace • Fewer injuries • Reduced workers’
compensation premiums
• Increased employee morale
• Increased employee productivity
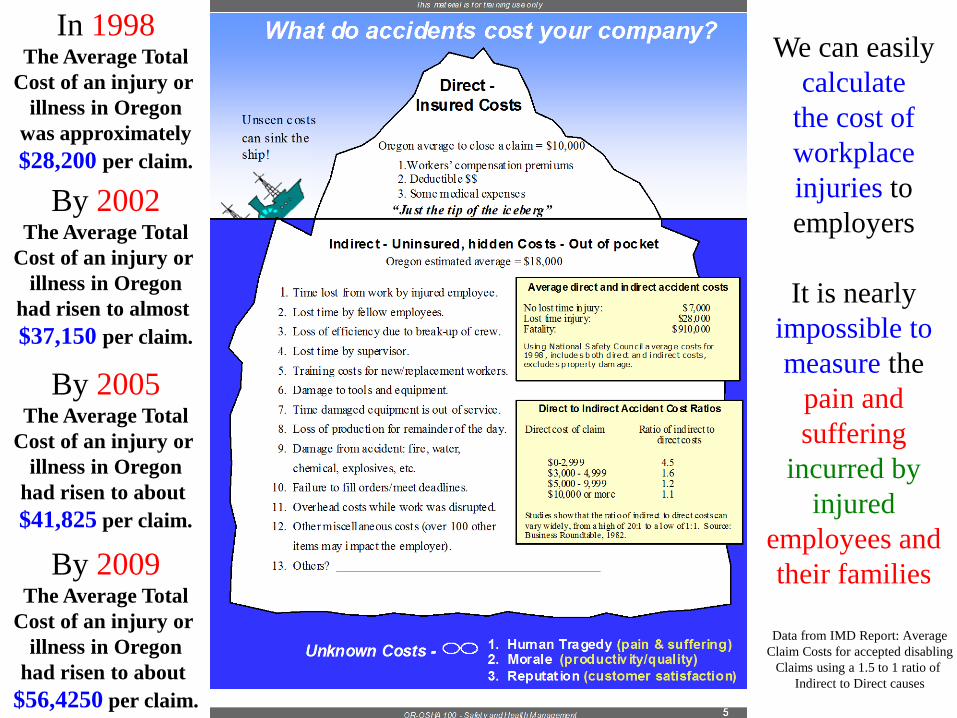
In 1998 The Average Total
Cost of an injury or illness in Oregon
was approximately $28,200 per claim.
By 2002 The Average Total
Cost of an injury or illness in Oregon
had risen to almost $37,150 per claim.
We can easily calculate
the cost of workplace injuries to employers
It is nearly
impossible to measure the
pain and suffering
incurred by injured
employees and their families
By 2005 The Average Total
Cost of an injury or illness in Oregon
had risen to about $41,825 per claim.
By 2009 The Average Total
Cost of an injury or illness in Oregon
had risen to about $56,4250 per claim.
Data from IMD Report: Average Claim Costs for accepted disabling
Claims using a 1.5 to 1 ratio of Indirect to Direct causes

Managing Safety and Health: $$ Saved = $$ Made
• Money spent on an effective safety & health program is an investment, not an expense Time + Material + Dollars =
Lower Costs & Higher Productivity
• The average injury cost in 2006 was $43,000 per claim. Using a 4% profit margin, the employer would have to recover $1,025,000.00 in new gross revenue to offset one injury.

Safety Management
• Management must install a management system which encompasses every aspect of how we perform our tasks and measure our performance.
• Management must instill a system of reviews, oversights, critiques, and self-audits.
• The system should cover how we communicate.

Safety & Health Management System (SHMS) • A system of managing
systems • Within the system
– 3 Components
– 7 Subcomponents
methodical structured
established approach
systems doctrines
policies procedures
programs principles
to managing
Intended to explain the
arrangement or working of a whole
S&H Management
System

Three Components of a SHMS • Operational (Find/Fix, Field/Facility) • Managerial (Programs/Policies/Procedures)
• Cultural (How We Do the Work) – All three components are interrelated and together
they transform safety and health into an organizational safety and health management system
– Every OSHA mandate program contains operational, managerial and cultural elements
– A safety and health system is much broader than all the mandated programs combined.
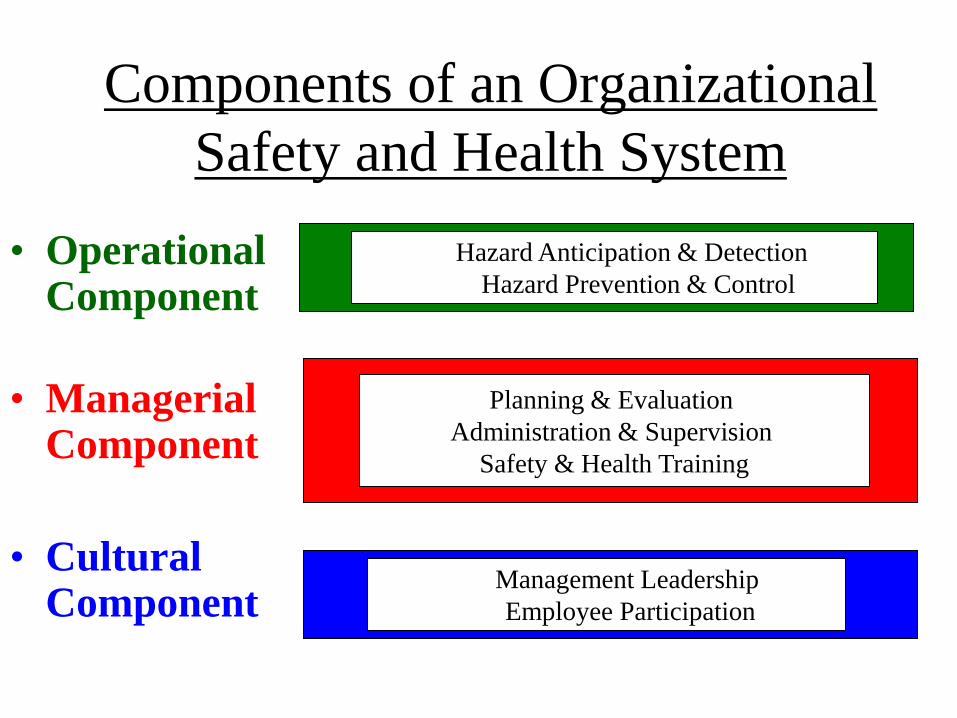
Components of an Organizational Safety and Health System
• Operational Component
• Managerial Component
• Cultural Component
The Way We Do It Here
Managing the Work
Finding and Fixing Hazard Anticipation & Detection Hazard Prevention & Control
Planning & Evaluation Administration & Supervision
Safety & Health Training
Management Leadership Employee Participation
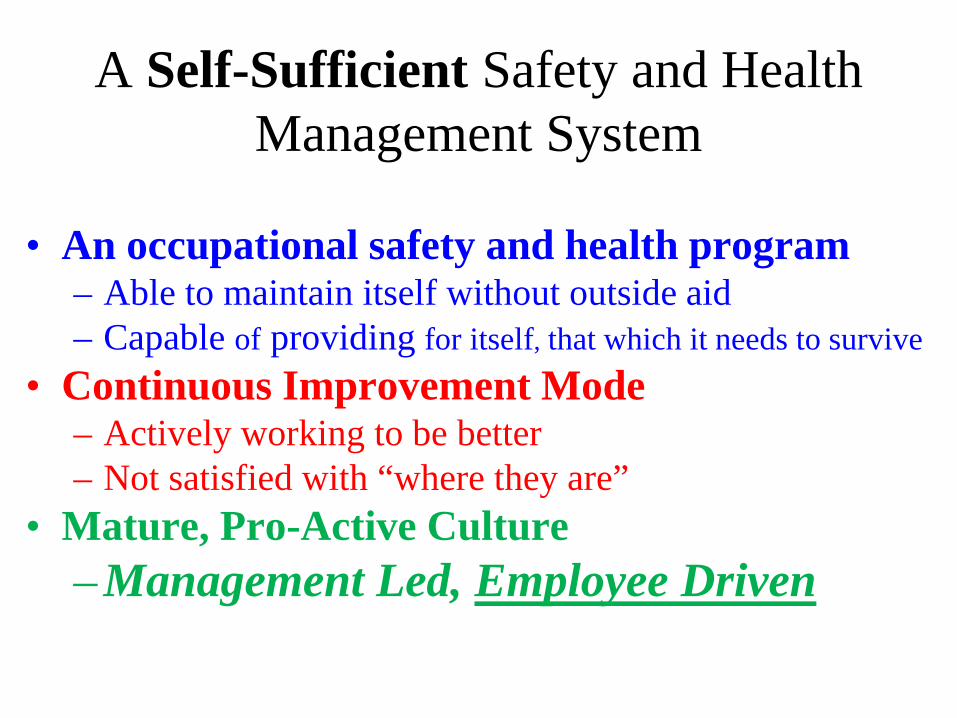
A Self-Sufficient Safety and Health Management System
• An occupational safety and health program – Able to maintain itself without outside aid – Capable of providing for itself, that which it needs to survive
• Continuous Improvement Mode – Actively working to be better – Not satisfied with “where they are”
• Mature, Pro-Active Culture – Management Led, Employee Driven

Making Employee Involvement Work • Supported by management
– Trained & educated employees used to their potential – Encourage Ownership
• Supported by policies
– Provide & document employee involvement avenues
• Enable employees to Continuously Improve – Themselves (training, skills, productivity, teamwork) – Conditions (hazard ID & control, problem resolution, flow) – Process/Procedures (JSA, SOP, program review,) – Quality (work, product, communication, feedback)

Manage to Succeed!
• Good safety management programs go beyond OR-OSHA standards to protect employees.
• The strongest safety programs are usually
management led, but employee driven. • History behind SHARP.

Hazard Anticipation and Detection
Planning & Evaluation
Management Leadership
Hazard Prevention & Control
Safety & Health Management
Program
Safety & Health Training Administration
& Supervision
Employee Participation (Involvement)
Creating a World-Class Safety Culture

SHARP: A Process
• Encourages work toward self-sufficiency
• Utilize OR-OSHA consultation staff
• Initially
– Recognition program – Aimed at smaller companies
that need more help
VPP Level
Majority
of Oregon
Employers
Targeted by Enforcement
SHARP Level

Comprehensive Consultation (S-H-E, all operations)
• Records review
• Program review
• Safety committee evaluation
• Hazard assessment
• Safety and health program assessment

Action Planning (Goal Setting)
• Essential to SHARP – Moving from where you are
to where you want to be
• Plan – Do – Check – Act – W. Edwards Demming – 1950’s
• A job well planned is a job well done! – Plan the Work, Work the Plan

SHARP Process Flowchart Company requests initial SHARP assessment intake completed / consultation scheduled
Follow-up comprehensive consultation with program assessment, completed and sent
Qualified for SHARP Not qualified for SHARP
Action plan developed
Action plan implemented
Company requests follow-up assessment
Initial comprehensive consultation with program assessment, completed and sent
Qualified for SHARP Not qualified for SHARP
First year SHARP awarded

Renewing Sharp
• SHARP company requests annual renewal – Consultant(s) will conduct a comprehensive
assessment – If verified as operating effectively, employer is
renewed as SHARP participant. – If not operating effectively, or significant
backslide: Termination or Conditional year

Graduating from SHARP • Eligible after completion of 4th year in SHARP
– May use one-year conditional approval if consultant feels they are not qualified/ready to graduate
• Consultant(s) conducts a Comprehensive Assessment; and if verified as operating effectively, employer is renewed as SHARP participant.
• Graduation Ceremony – Plaque and Flag

OR-OSHA Expectations for a SHARP Employer
• Has and uses mandatory written programs • Has a system for identifying and correcting hazards • Management and employees have ownership in the
company’s Safety and Health program • Employees and management are trained in safety,
health and ergonomic issues • Program and trends are evaluated
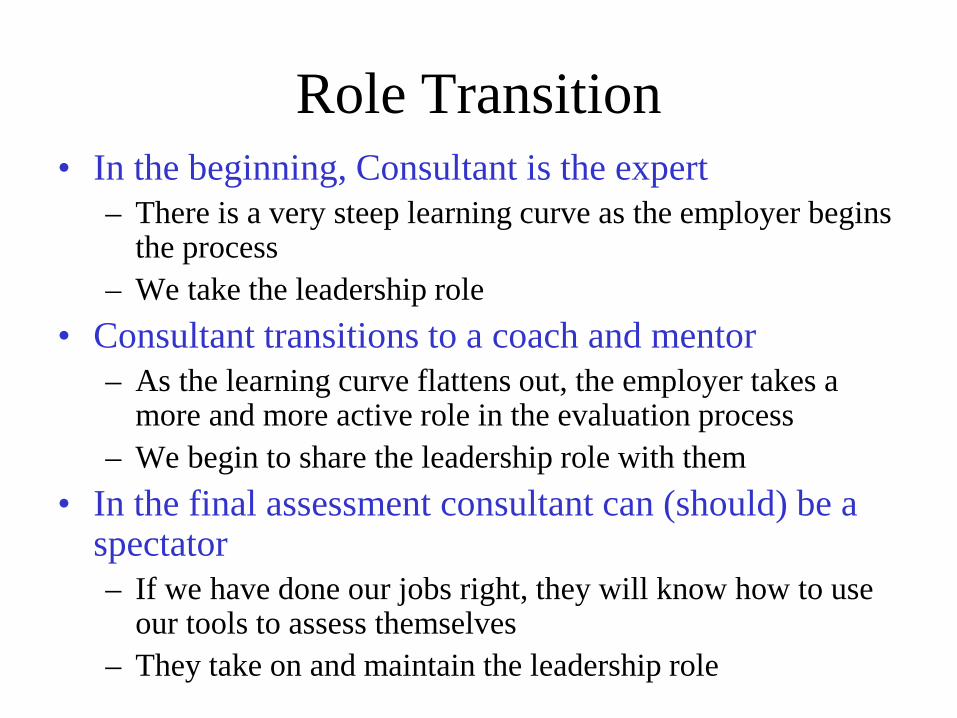
Role Transition • In the beginning, Consultant is the expert
– There is a very steep learning curve as the employer begins the process
– We take the leadership role • Consultant transitions to a coach and mentor
– As the learning curve flattens out, the employer takes a more and more active role in the evaluation process
– We begin to share the leadership role with them • In the final assessment consultant can (should) be a
spectator – If we have done our jobs right, they will know how to use
our tools to assess themselves – They take on and maintain the leadership role

Inspection Exemptions (Exemption from scheduled inspections only, not iminent danger,
fatality/catastrophe, accidents, complaints or referrals)
• Consultation Exemption – Consultative visits are considered “in progress” from
7 days prior to the opening meeting through 60 days (30 days for mobile worksites) after the report is issued. A consultation in progress has priority over scheduled compliance inspections.
• SHARP Exemption – Employers who achieve second and subsequent
SHARP approval may be deferred annually from scheduled OR-OSHA inspections.

Resources
• Oregon OSHA – www.orosha.org
• Oregon SHARP Companies
– www.orosha.org/consult/sharppar.htm
• Oregon SHARP Alliance – www.sharpalliance.org


SHARP Alliance Activities
• Promoting SHARP • Promoting Alliance membership • Mentoring • Networking • Training • Input to Oregon-OSHA • Assist new sites working toward SHARP

What have these companies gained?
• Willamette Landscape Services (60 employees) – During the five years leading to their SHARP
designation, reduced the number of lost-time workplace injuries and illnesses by 75%
– Achieved a DART rate that is 55% below statewide industry average.
– “SHARP has helped us become a better company. We are a more conscientous employer now, and I feel great knowing that we can offer safe and productive employment to anybody who would like to work with us” Matt Triplett, VP

Quotes from 2 SHARP Graduates
"The service from Oregon OSHA's Consultation Services' is outstanding! Our savings on claims costs have been enormous. Annual claims costs have dropped 64 percent and lost workdays have fallen 79 percent." City of Portland, Columbia Wastewater Treatment Plant
Our Oregon OSHA consultants were wonderful!! They never pushed, only encouraged. Never criticized, only motivated. They were our cheerleaders as well as our coaches. Our Lost Workday Cases Incident Rate went from 28.99 in 2000 to 0.00 in 2002." Mid-Valley Healthcare

• SHARP since 2003 – Doing 10 times the volume
of business, experiencing ½ the number of injuries
– Estimated cost = $10,000 – Retro refunds = $108,861.47 – EMR
• 02 = 0.5 • 03 = 0.45 • 04 = 0.5 • 05 = 0.47 • 06 = 0.41
• 2003 – 10 years without a lost time
accident • 2004
– Million Man Hours
• OSHA incidence rate – 72% below industry average
• Workers Compensation Cost – Decreased by 80%
• Employee involvement
– Up 30%
Philomath Operations
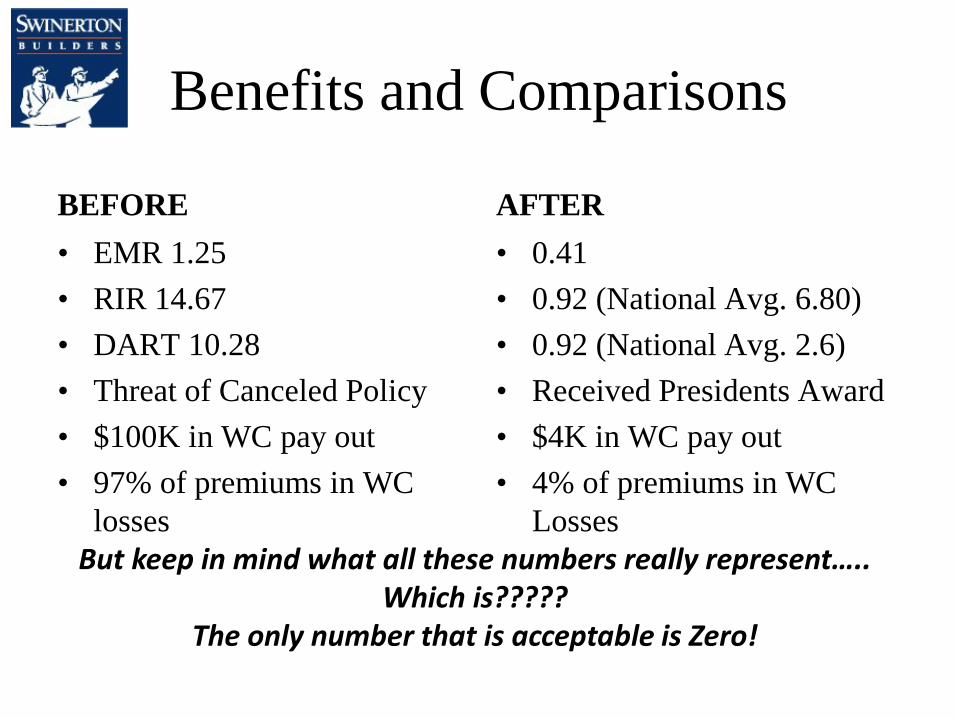
Benefits and Comparisons
BEFORE • EMR 1.25 • RIR 14.67 • DART 10.28 • Threat of Canceled Policy • $100K in WC pay out • 97% of premiums in WC
losses
AFTER • 0.41 • 0.92 (National Avg. 6.80) • 0.92 (National Avg. 2.6) • Received Presidents Award • $4K in WC pay out • 4% of premiums in WC
Losses But keep in mind what all these numbers really represent…..
Which is????? The only number that is acceptable is Zero!

What has SHARP done for us: • Given us the focus we didn’t have • Provided a road map for improvement • Helped us establish a baseline of which we could
measure that improvement • Helped to give all our employees a “piece of the
action”

Sustained Improvement possible with culture change
0.01.02.03.04.05.06.07.08.09.0
10.011.012.013.014.015.016.017.018.019.020.0
1993
1994
1995
1996
1997
1998
1999
2000
2001
2002
2003
2004
2005
2006
2007
2008
2009
2010
2011
2012
Ave DART
Plant DART
Working SHARP VPP

• 1997 – 1,367 Time Loss Days – $224,171 Claim Costs
• 2004
– 54 Time Loss Days – $40,980 Claim Costs
• 1996-1998 – 12 recordable injuries – $129,795 Claim costs – Product Quality 10%
• 2002-2004
– 4 recordable injuries – $12,193 Claim Costs – Product quality 1.2%

Then vs. Now
2005 • DART Rate – 12.62 • Near Miss Reports – 0 • Recordable Injuries – 41 • Lost Time Injuries – 4 • No OSHA Partnership • No Awards Programs
2013 • DART Rate – 0 • Near Miss Reports – 20 • Recordable Injuries – 3 • Lost Time Injuries – 0 • OR-OSHA SHARP
Graduate • Multiple State and National
Awards • 93% Reduction in RIR

SHARP Benefits the “Bottom Line”
• Improved safety and health management systems and performance – Decline in injury, illness, days away and days restricted – Increased program efficiency
• Enhances labor and management relations
– Higher morale, increased ownership, improved communications, “all on the same team”
• Creates economic benefits – Reduction in: workplace injuries; insurance premiums;
compensation costs; re-work and customer loss; absenteeism rates;
– Improvements in: productivity; teamwork, quality; communication; and understanding
Bottom Line
• SHARP works because – Techniques learned are successful – Successful techniques are repeated – Repeated techniques become habit
• Positive Culture Change is Inevitable – Success breeds success – Safety improvements foster improvements in
production, quality, teamwork and satisfaction

Questions? Comments? Concerns?