a sas macro to generate high quality enhanced kaplan … 2013 cs presentations/cs03.pdf · 12...
TRANSCRIPT

A SAS Macro to Generate High Quality Enhanced Kaplan-Meier Plots using Graphic Template Language Konrad Żywno, inVentiv Health Clinical & Bartosz Kutyła, SAS Institute 14 October 2013
2
• Kaplan-Meier plots › Are used in the pharmaceutical industry to
analyse time to event data › Since SAS® 9.2 it has been possible to create
high quality graphs using the newly introduced Graphic Template Language (GTL)
Kaplan-Meier plots
3
• What does using GTL mean? › More possibilities for enhancements › New way of programming renders most
existing graphic macros and related tools obsolete • some of these will need to be reworked to
make use of the new technology • others will no longer be necessary
Kaplan-Meier plots
4
• Ways of producing Kaplan-Meier plots: › Directly from the LIFETEST procedure › Modifying the default templates for the
LIFETEST procedure › Creating a completely new macro which uses
the TEMPLATE procedure to produce the figure
Ways of producing Kaplan-Meier plots
5
• The dataset used for this presentation is a CDISC ADTTE dataset, where: › AVAL contains time to event value › CNSR contains censor and event information › A censored record is flagged CNSR = 1 › TRTAN is the grouping variable
Dummy dataset used in the presentation
6
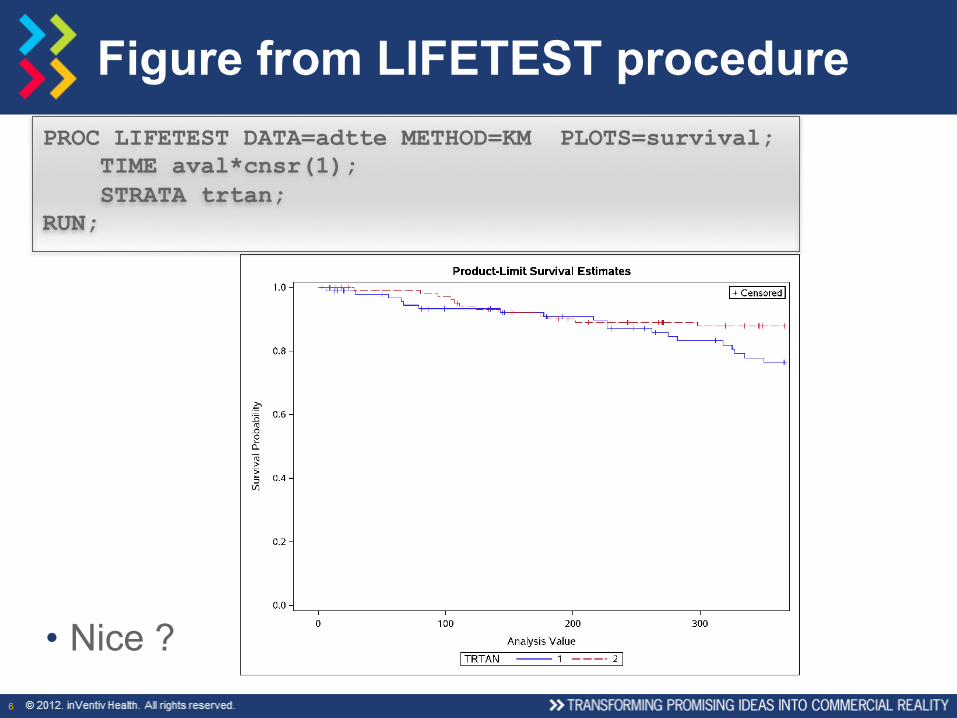
• Nice ?
Figure from LIFETEST procedure PROC LIFETEST DATA=adtte METHOD=KM PLOTS=survival; TIME aval*cnsr(1); STRATA trtan; RUN;
7
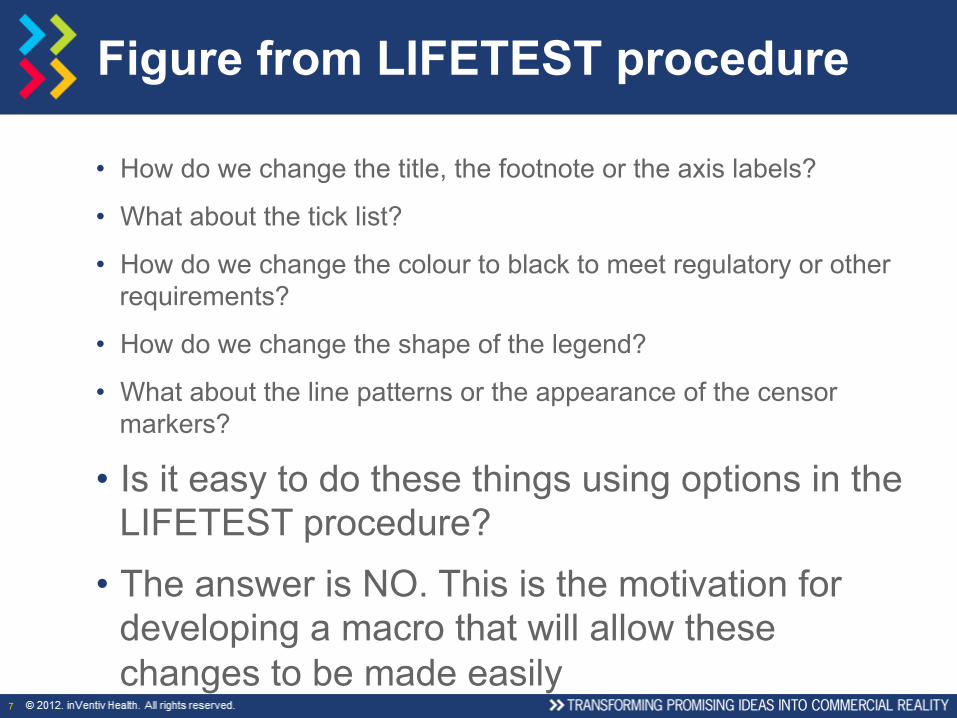
• How do we change the title, the footnote or the axis labels?
• What about the tick list?
• How do we change the colour to black to meet regulatory or other requirements?
• How do we change the shape of the legend?
• What about the line patterns or the appearance of the censor markers?
• Is it easy to do these things using options in the LIFETEST procedure?
• The answer is NO. This is the motivation for developing a macro that will allow these changes to be made easily
Figure from LIFETEST procedure
8
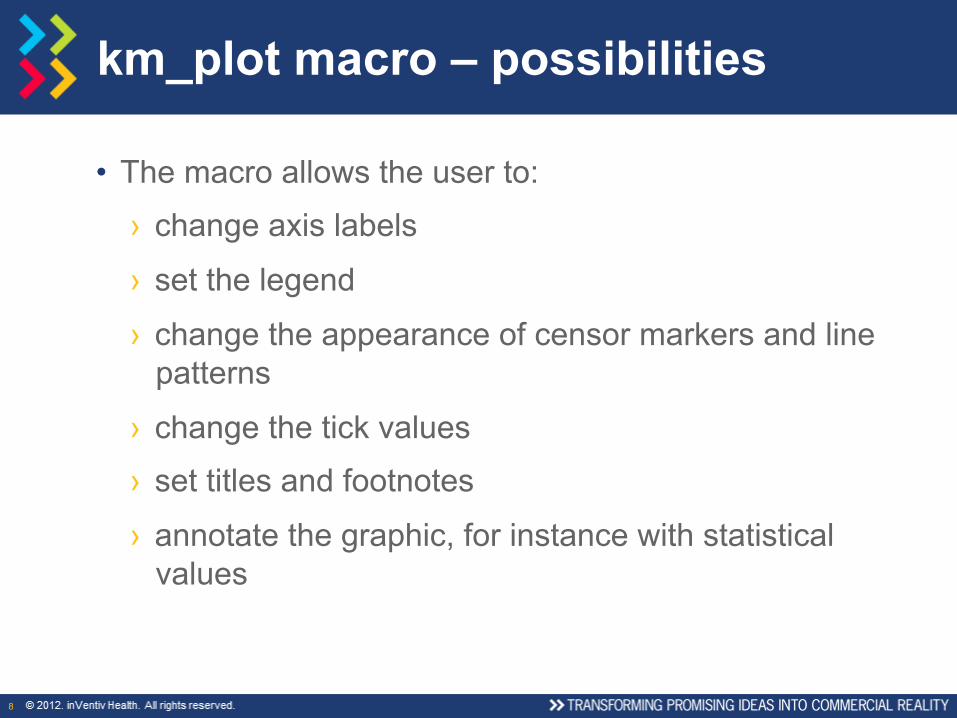
• The macro allows the user to:
› change axis labels
› set the legend
› change the appearance of censor markers and line patterns
› change the tick values
› set titles and footnotes
› annotate the graphic, for instance with statistical values
km_plot macro – possibilities
9
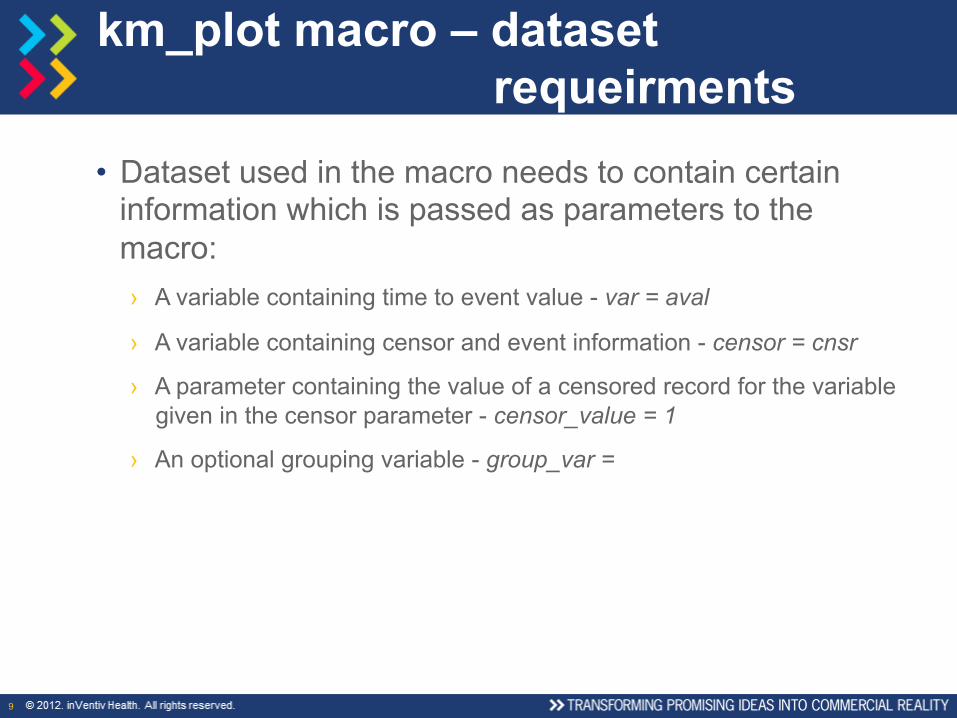
• Dataset used in the macro needs to contain certain information which is passed as parameters to the macro: › A variable containing time to event value - var = aval
› A variable containing censor and event information - censor = cnsr
› A parameter containing the value of a censored record for the variable given in the censor parameter - censor_value = 1
› An optional grouping variable - group_var =
km_plot macro – dataset requeirments
10
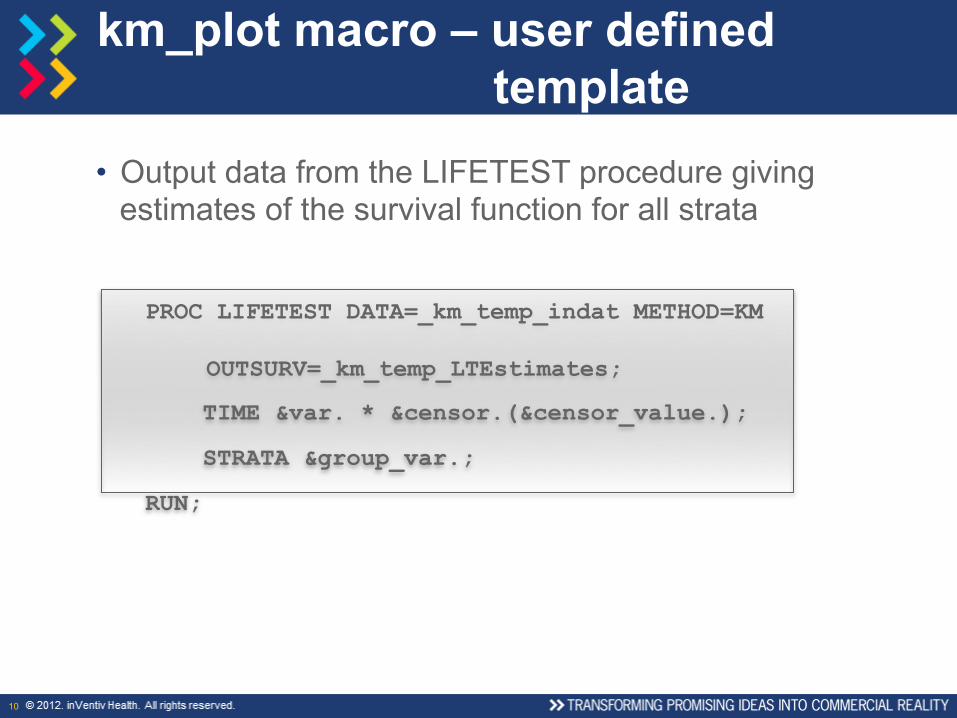
• Output data from the LIFETEST procedure giving estimates of the survival function for all strata
km_plot macro – user defined template
PROC LIFETEST DATA=_km_temp_indat METHOD=KM OUTSURV=_km_temp_LTEstimates;
TIME &var. * &censor.(&censor_value.);
STRATA &group_var.;
RUN;
11
• The dataset with the calculated survival function from the procedure needs to be customised a little: › It does not contain values of the survival function for all time points
› We need to create a separate variable with the value of the survival function for censored observations
km_plot macro – user defined template
12
km_plot macro – user defined template
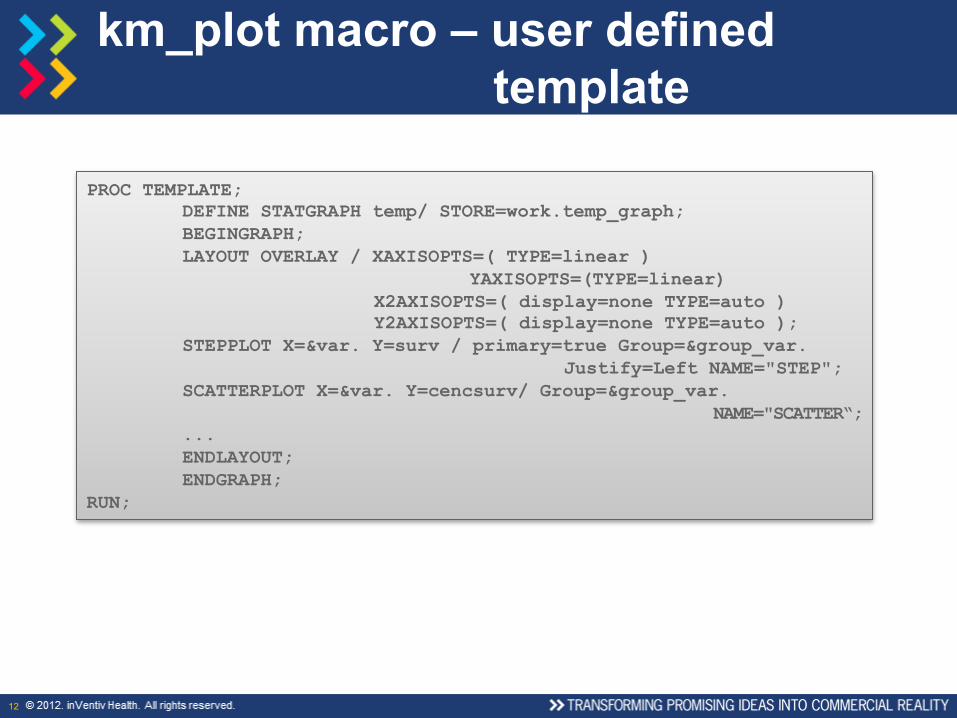
PROC TEMPLATE; DEFINE STATGRAPH temp/ STORE=work.temp_graph; BEGINGRAPH; LAYOUT OVERLAY / XAXISOPTS=( TYPE=linear ) YAXISOPTS=(TYPE=linear) X2AXISOPTS=( display=none TYPE=auto ) Y2AXISOPTS=( display=none TYPE=auto ); STEPPLOT X=&var. Y=surv / primary=true Group=&group_var. Justify=Left NAME="STEP"; SCATTERPLOT X=&var. Y=cencsurv/ Group=&group_var. NAME="SCATTER“; ... ENDLAYOUT; ENDGRAPH;
RUN;
13
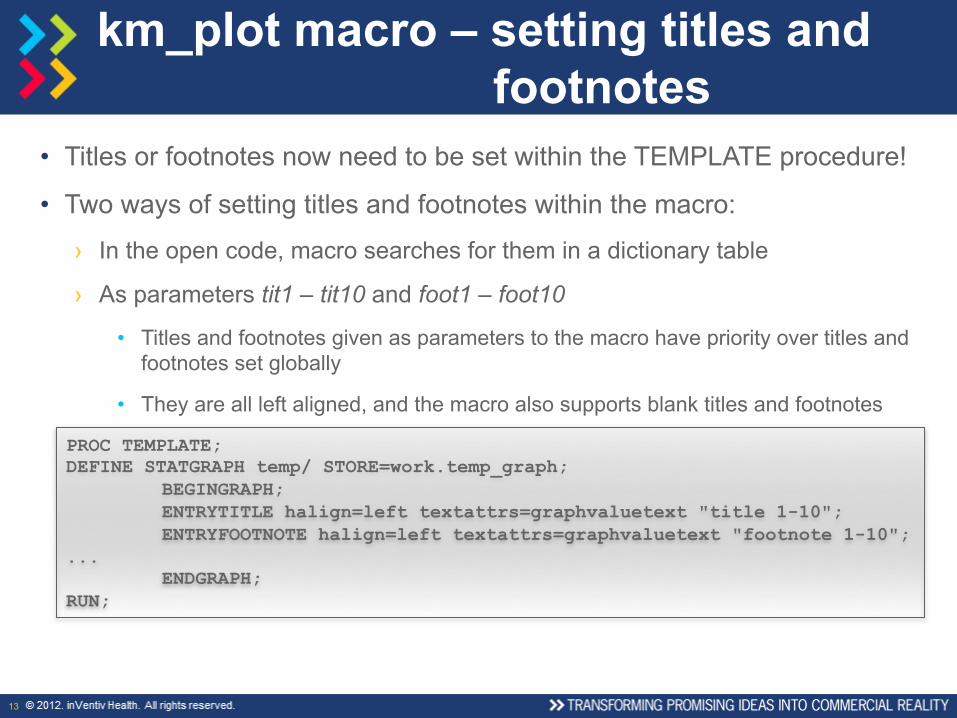
• Titles or footnotes now need to be set within the TEMPLATE procedure!
• Two ways of setting titles and footnotes within the macro:
› In the open code, macro searches for them in a dictionary table
› As parameters tit1 – tit10 and foot1 – foot10
• Titles and footnotes given as parameters to the macro have priority over titles and footnotes set globally
• They are all left aligned, and the macro also supports blank titles and footnotes
km_plot macro – setting titles and footnotes
PROC TEMPLATE; DEFINE STATGRAPH temp/ STORE=work.temp_graph;
BEGINGRAPH; ENTRYTITLE halign=left textattrs=graphvaluetext "title 1-10"; ENTRYFOOTNOTE halign=left textattrs=graphvaluetext "footnote 1-10";
... ENDGRAPH;
RUN;
14
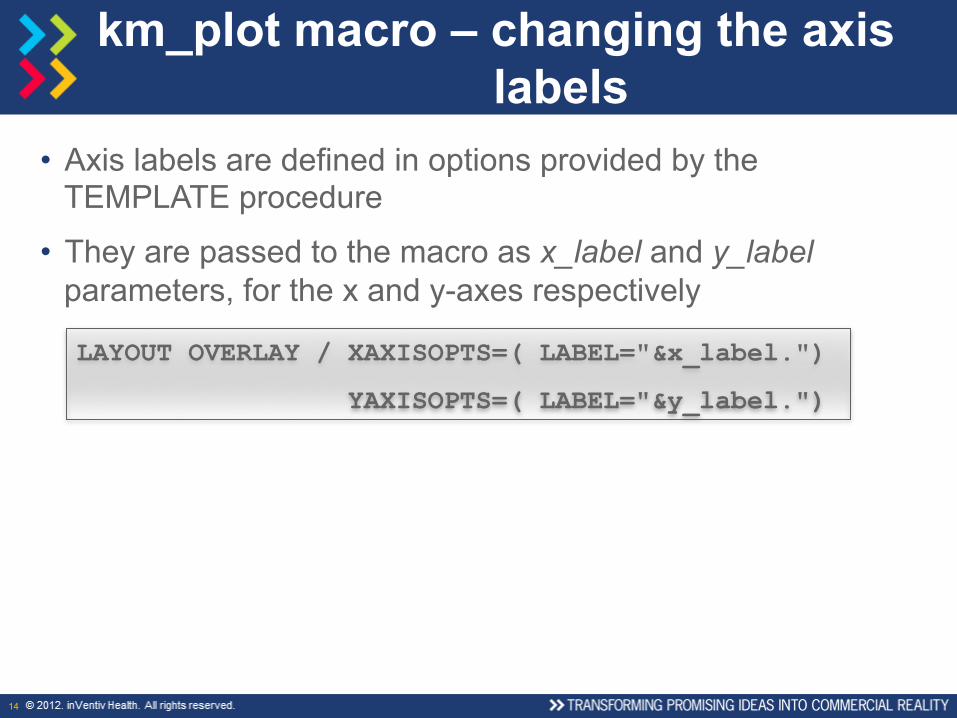
• Axis labels are defined in options provided by the TEMPLATE procedure
• They are passed to the macro as x_label and y_label parameters, for the x and y-axes respectively
km_plot macro – changing the axis labels
LAYOUT OVERLAY / XAXISOPTS=( LABEL="&x_label.")
YAXISOPTS=( LABEL="&y_label.")
15
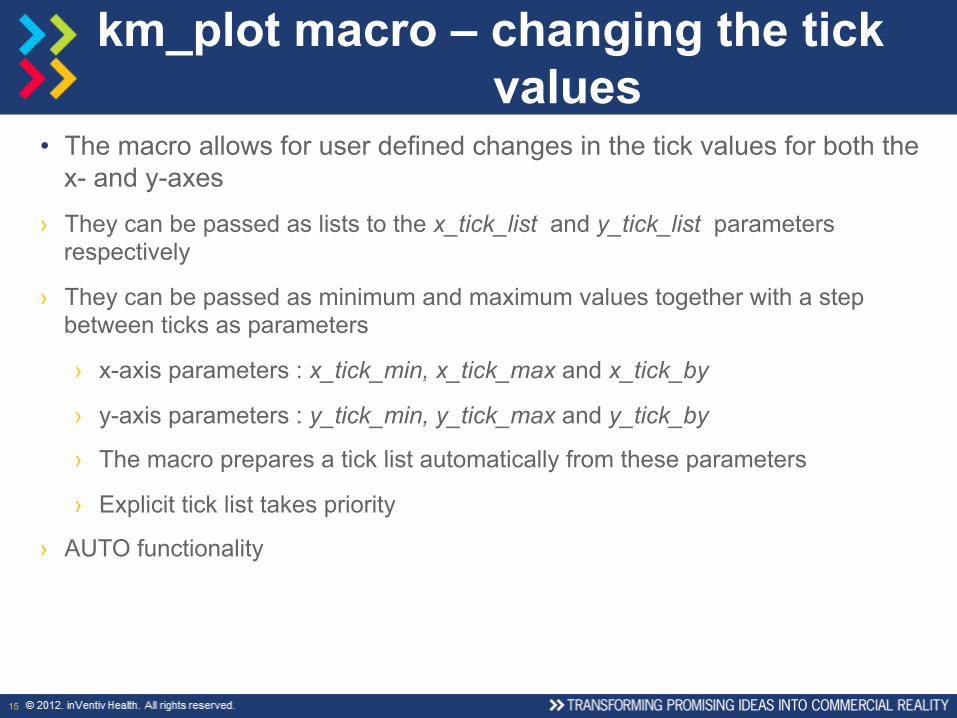
• The macro allows for user defined changes in the tick values for both the x- and y-axes
› They can be passed as lists to the x_tick_list and y_tick_list parameters respectively
› They can be passed as minimum and maximum values together with a step between ticks as parameters
› x-axis parameters : x_tick_min, x_tick_max and x_tick_by
› y-axis parameters : y_tick_min, y_tick_max and y_tick_by
› The macro prepares a tick list automatically from these parameters
› Explicit tick list takes priority
› AUTO functionality
km_plot macro – changing the tick values
16
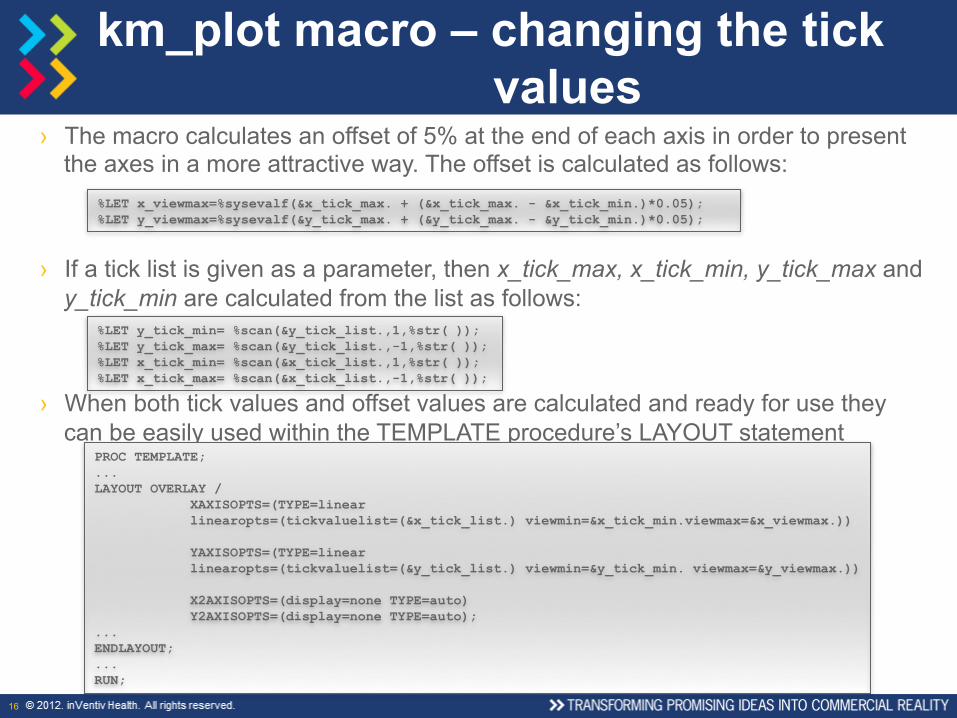
› The macro calculates an offset of 5% at the end of each axis in order to present the axes in a more attractive way. The offset is calculated as follows:
› If a tick list is given as a parameter, then x_tick_max, x_tick_min, y_tick_max and y_tick_min are calculated from the list as follows:
› When both tick values and offset values are calculated and ready for use they can be easily used within the TEMPLATE procedure’s LAYOUT statement
km_plot macro – changing the tick values
%LET x_viewmax=%sysevalf(&x_tick_max. + (&x_tick_max. - &x_tick_min.)*0.05); %LET y_viewmax=%sysevalf(&y_tick_max. + (&y_tick_max. - &y_tick_min.)*0.05);
PROC TEMPLATE; ... LAYOUT OVERLAY /
XAXISOPTS=(TYPE=linear linearopts=(tickvaluelist=(&x_tick_list.) viewmin=&x_tick_min.viewmax=&x_viewmax.))
YAXISOPTS=(TYPE=linear linearopts=(tickvaluelist=(&y_tick_list.) viewmin=&y_tick_min. viewmax=&y_viewmax.))
X2AXISOPTS=(display=none TYPE=auto) Y2AXISOPTS=(display=none TYPE=auto);
... ENDLAYOUT; ... RUN;
%LET y_tick_min= %scan(&y_tick_list.,1,%str( )); %LET y_tick_max= %scan(&y_tick_list.,-1,%str( )); %LET x_tick_min= %scan(&x_tick_list.,1,%str( )); %LET x_tick_max= %scan(&x_tick_list.,-1,%str( ));
17
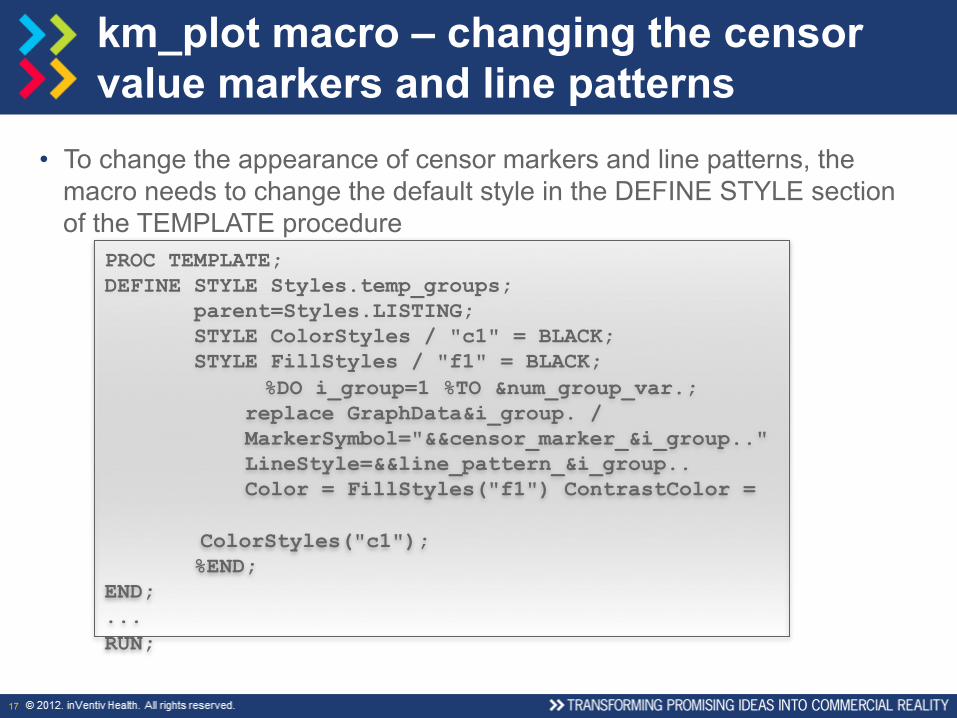
• To change the appearance of censor markers and line patterns, the macro needs to change the default style in the DEFINE STYLE section of the TEMPLATE procedure
km_plot macro – changing the censor value markers and line patterns
PROC TEMPLATE; DEFINE STYLE Styles.temp_groups; parent=Styles.LISTING; STYLE ColorStyles / "c1" = BLACK; STYLE FillStyles / "f1" = BLACK;
%DO i_group=1 %TO &num_group_var.; replace GraphData&i_group. / MarkerSymbol="&&censor_marker_&i_group.." LineStyle=&&line_pattern_&i_group.. Color = FillStyles("f1") ContrastColor =
ColorStyles("c1");
%END; END; ... RUN;
18
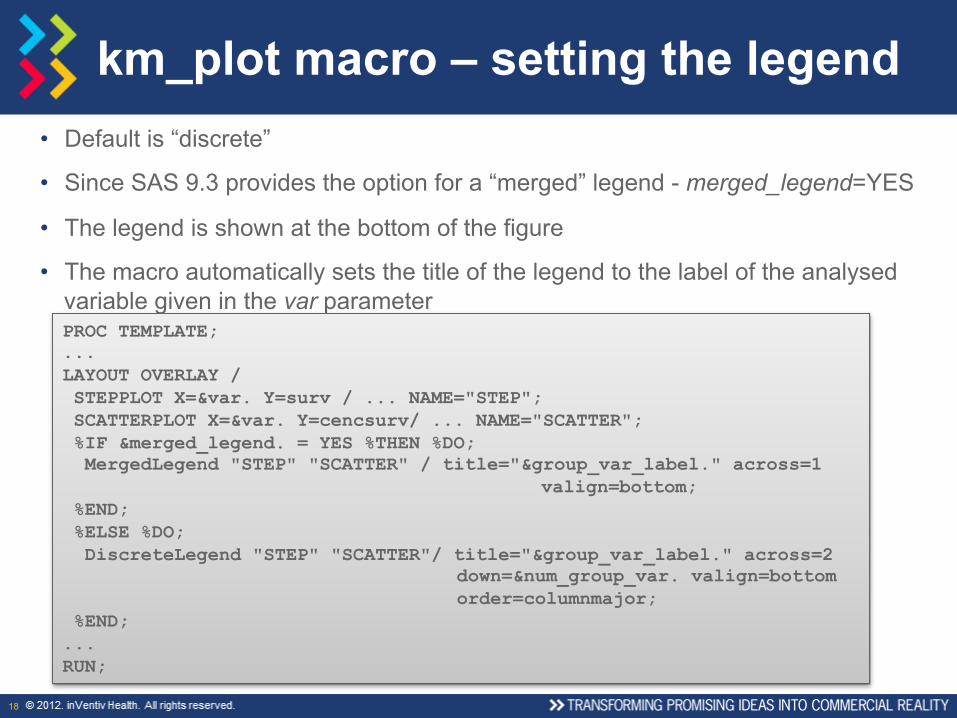
• Default is “discrete”
• Since SAS 9.3 provides the option for a “merged” legend - merged_legend=YES
• The legend is shown at the bottom of the figure
• The macro automatically sets the title of the legend to the label of the analysed variable given in the var parameter
km_plot macro – setting the legend
PROC TEMPLATE; ... LAYOUT OVERLAY / STEPPLOT X=&var. Y=surv / ... NAME="STEP"; SCATTERPLOT X=&var. Y=cencsurv/ ... NAME="SCATTER"; %IF &merged_legend. = YES %THEN %DO; MergedLegend "STEP" "SCATTER" / title="&group_var_label." across=1
valign=bottom; %END; %ELSE %DO; DiscreteLegend "STEP" "SCATTER"/ title="&group_var_label." across=2
down=&num_group_var. valign=bottom order=columnmajor;
%END; ... RUN;
19
• Since SAS 9.3 it is possible to annotate graphics using GTL
• SAS 9.4 introduced a new option, SGANNO, to the SGRENDER procedure permitting the use of annotation datasets
• The last decision to be made is where to put the annotation?
km_plot macro – annotating the graphic
20
• The macro uses two parameters for annotation purposes:
› ANNOTATE (YES|NO) – The default value is NO
› ANNO_DS (AUTO|user’s dataset) – The default value is AUTO
km_plot macro – annotating the graphic
21
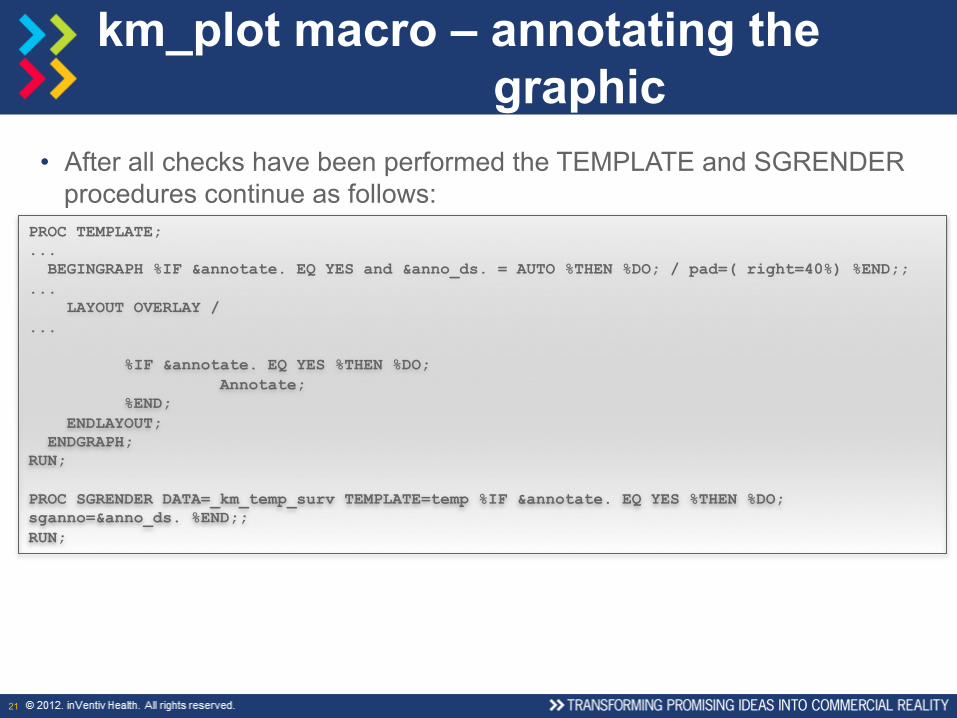
• After all checks have been performed the TEMPLATE and SGRENDER procedures continue as follows:
km_plot macro – annotating the graphic
PROC TEMPLATE; ... BEGINGRAPH %IF &annotate. EQ YES and &anno_ds. = AUTO %THEN %DO; / pad=( right=40%) %END;; ... LAYOUT OVERLAY / ...
%IF &annotate. EQ YES %THEN %DO; Annotate; %END;
ENDLAYOUT; ENDGRAPH; RUN; PROC SGRENDER DATA=_km_temp_surv TEMPLATE=temp %IF &annotate. EQ YES %THEN %DO; sganno=&anno_ds. %END;; RUN;
22
• figure_format - the default value is PNG
• file_path
• filename
km_plot macro – further macro parameters
23
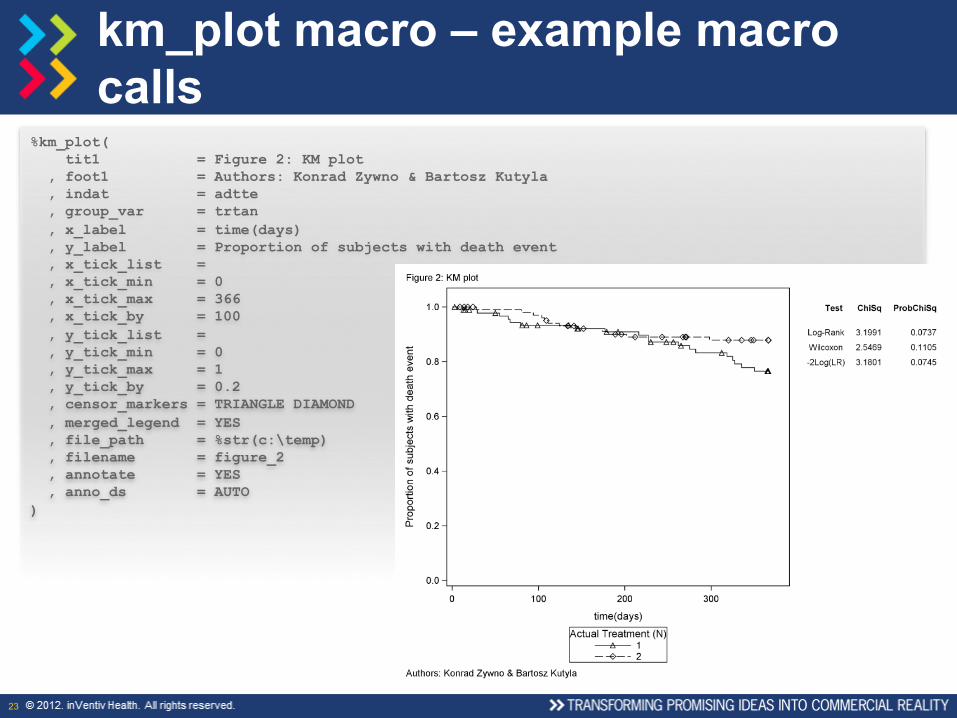
km_plot macro – example macro calls
%km_plot( tit1 = Figure 2: KM plot , foot1 = Authors: Konrad Zywno & Bartosz Kutyla , indat = adtte , group_var = trtan , x_label = time(days) , y_label = Proportion of subjects with death event , x_tick_list = , x_tick_min = 0 , x_tick_max = 366 , x_tick_by = 100 , y_tick_list = , y_tick_min = 0 , y_tick_max = 1 , y_tick_by = 0.2 , censor_markers = TRIANGLE DIAMOND , merged_legend = YES , file_path = %str(c:\temp) , filename = figure_2 , annotate = YES , anno_ds = AUTO )
24
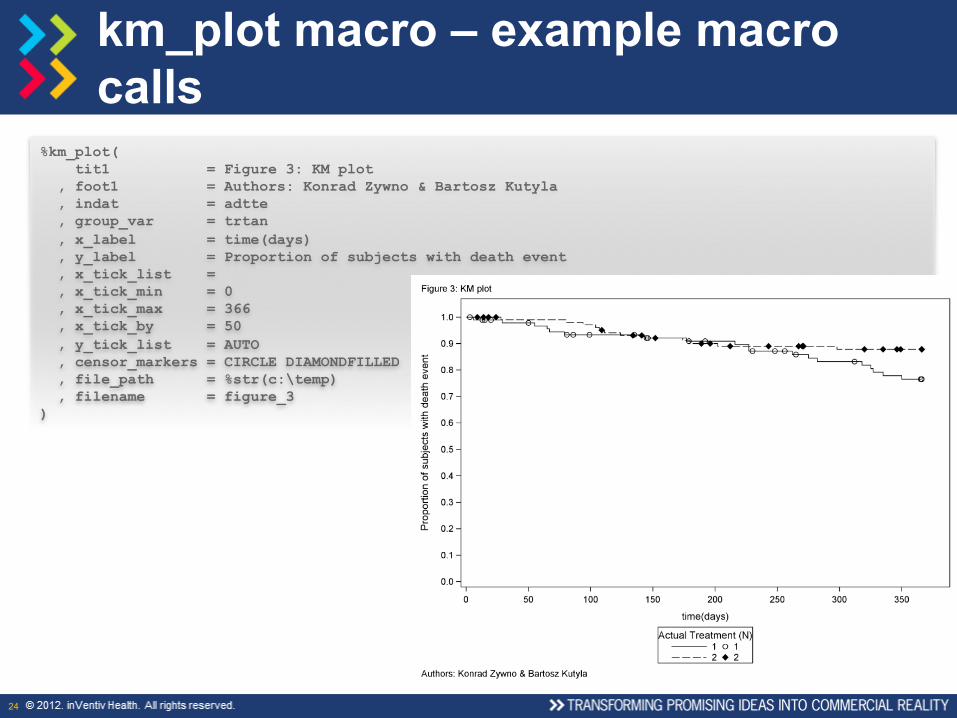
km_plot macro – example macro calls
%km_plot( tit1 = Figure 3: KM plot , foot1 = Authors: Konrad Zywno & Bartosz Kutyla , indat = adtte , group_var = trtan , x_label = time(days) , y_label = Proportion of subjects with death event , x_tick_list = , x_tick_min = 0 , x_tick_max = 366 , x_tick_by = 50 , y_tick_list = AUTO , censor_markers = CIRCLE DIAMONDFILLED , file_path = %str(c:\temp) , filename = figure_3 )
25
• Difficult to modify the appearance of the output from the LIFETEST procedure
• The user is often forced to change the default template or style
• That is why our %km_plot macro is so powerful
• New features can be added using the annotation facility
Conclusion

Questions ?

Your comments and questions are valued and encouraged. Contact the author at: Konrad Zywno, M.Sc. inVentiv Health Clinical Joachimstaler Str. 10-12 10719 Berlin Germany Email: [email protected] Or co-author at: Bartosz Kutyla SAS Institute ul. Gdańska 27/31 01-633 Warszawa Poland Email: [email protected]