a schematic figure showing stage 1, stage 2 and ... · 1 supplementary figure 1 flow diagram of...
TRANSCRIPT
1
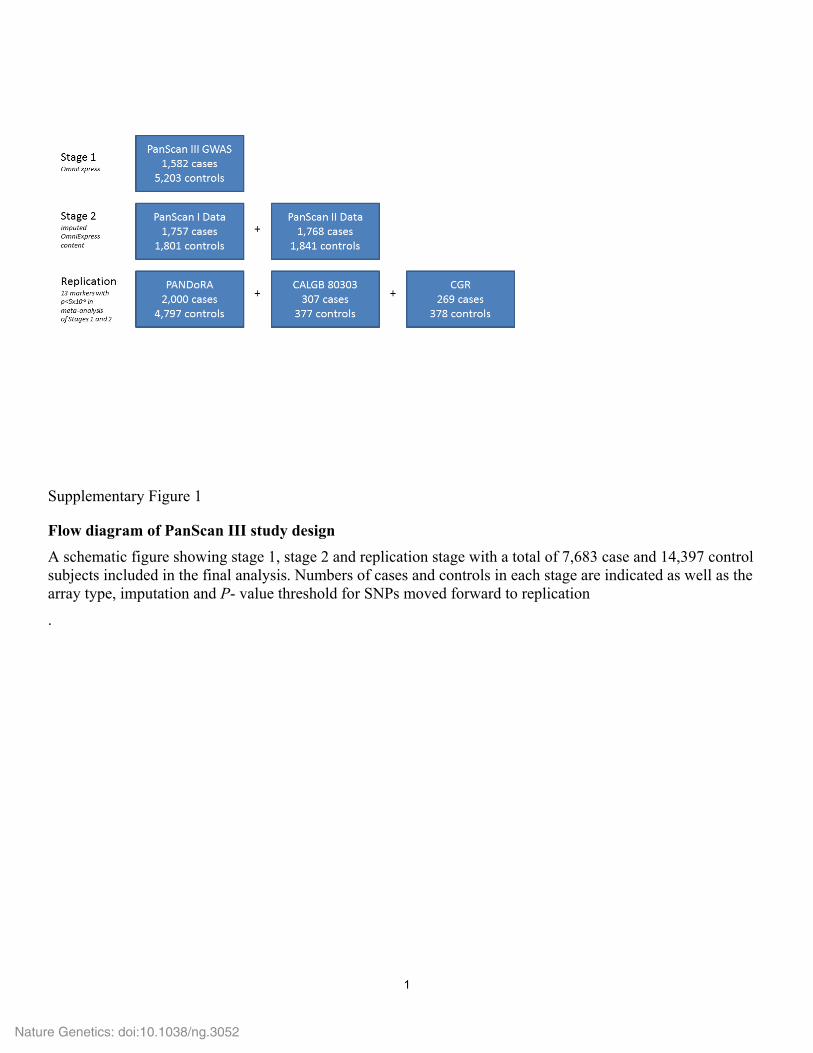
Supplementary Figure 1
Flow diagram of PanScan III study design
A schematic figure showing stage 1, stage 2 and replication stage with a total of 7,683 case and 14,397 control subjects included in the final analysis. Numbers of cases and controls in each stage are indicated as well as the array type, imputation and P- value threshold for SNPs moved forward to replication
.
Nature Genetics: doi:10.1038/ng.3052
2
Nature Genetics: doi:10.1038/ng.3052

3
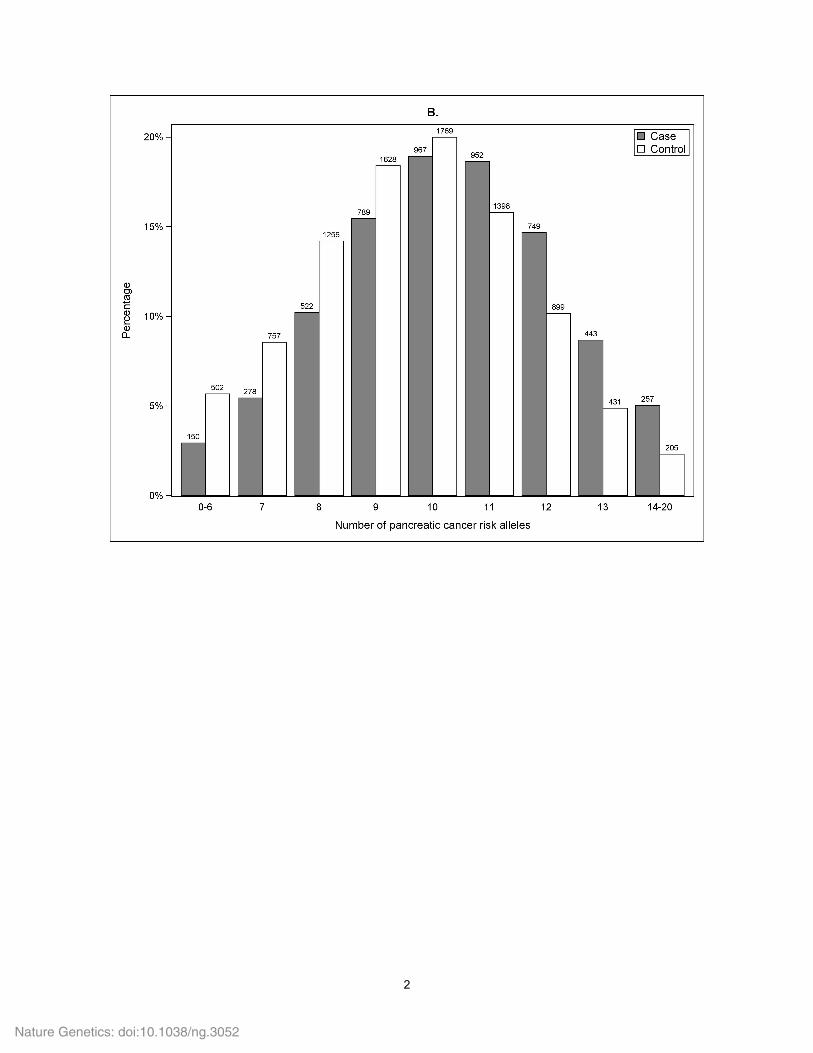
Supplementary Figure 2
Risk allele counts (a) and odds ratios (95% confidence intervals) (b) for pancreatic cancer for a geneticrisk score of the ten susceptibility loci identified in PanScan I, II, and III.
(a) Percentage of cases and controls with each total number of risk alleles. Absolute number of participants provided above each vertical bar. (b) Results from unconditional logistic regression of the pancreatic cancergenotype score in participants from Stage 1 and Stage 2 of the PanScan III GWAS. For stage 1, model adjustedfor age, sex, geographic region, and significant principal components. For stage 2, model adjusted for age, sex,study, and significant principal components. Referent is the most prevalent risk allele count in controls (n=10risk alleles).
Nature Genetics: doi:10.1038/ng.3052
4
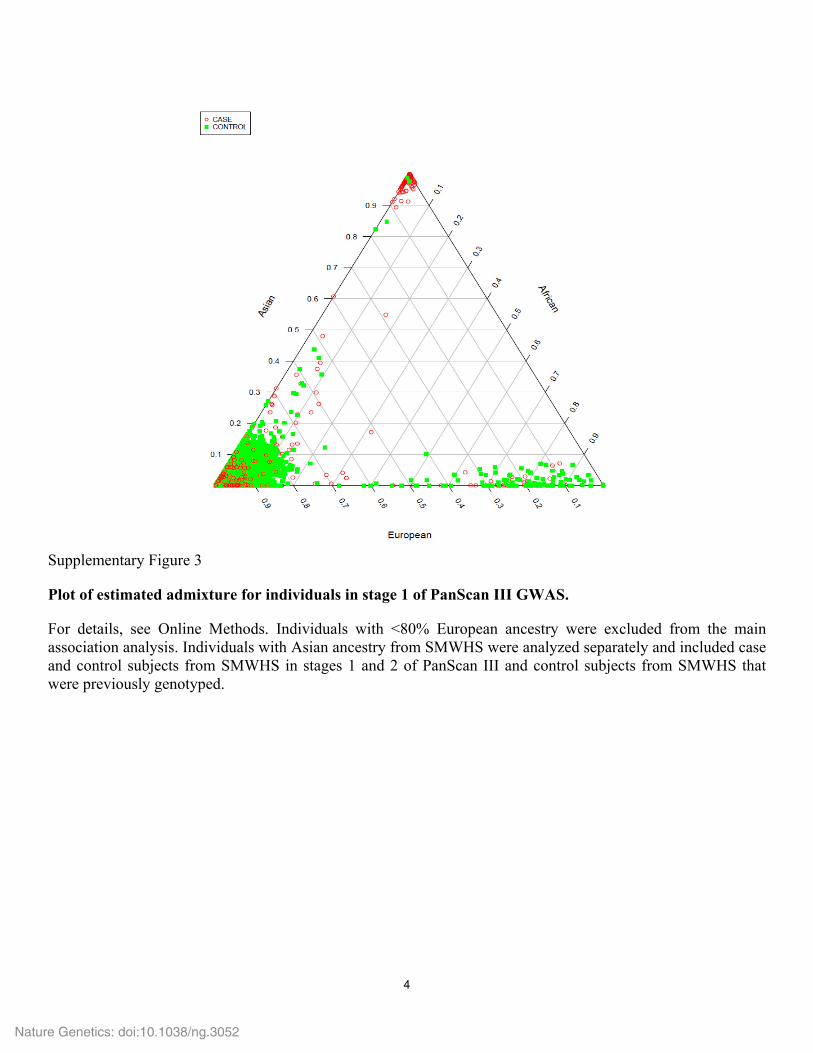
Supplementary Figure 3
Plot of estimated admixture for individuals in stage 1 of PanScan III GWAS.
For details, see Online Methods. Individuals with <80% European ancestry were excluded from the mainassociation analysis. Individuals with Asian ancestry from SMWHS were analyzed separately and included case and control subjects from SMWHS in stages 1 and 2 of PanScan III and control subjects from SMWHS thatwere previously genotyped.
Nature Genetics: doi:10.1038/ng.3052

5
Supplementary Figure 4
Plot of top eigenvectors from stage 1 of PanScan III GWAS based on principal components analysis.
For details, see Online Methods.
Nature Genetics: doi:10.1038/ng.3052

6
Supplementary Figure 5
Quantile-quantile (Q-Q) plot of the association results in stages 1 and 2 of the PanScan III GWAS
Nature Genetics: doi:10.1038/ng.3052
7
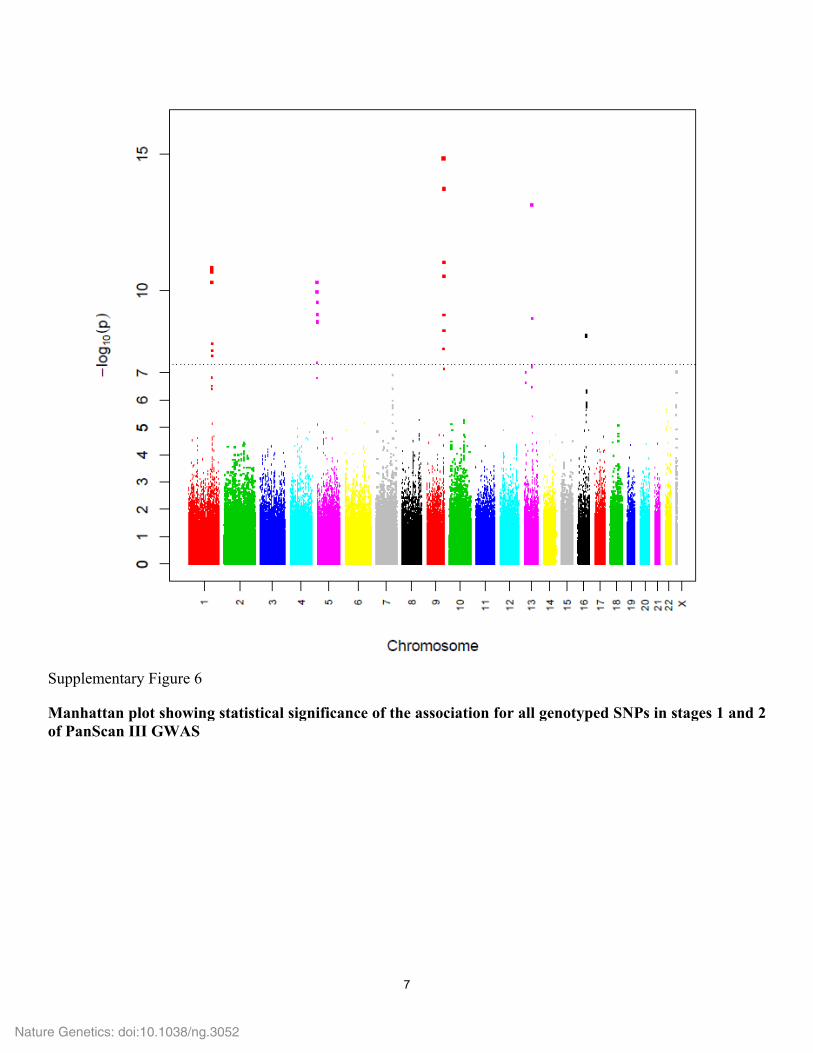
Supplementary Figure 6
Manhattan plot showing statistical significance of the association for all genotyped SNPs in stages 1 and 2of PanScan III GWAS
Nature Genetics: doi:10.1038/ng.3052

Genome-wide association study identifies multiple susceptibility loci for
pancreatic cancer
Brian M. Wolpin1, 2
*, Cosmeri Rizzato3*, Peter Kraft
4, 5*, Charles Kooperberg
6*, Gloria M.
Petersen7*, Zhaoming Wang
8, 9, Alan A. Arslan
10, 11, 12, Laura Beane-Freeman
8, Paige M.
Bracci13
, Julie Buring14,15
, Federico Canzian3, Eric J. Duell
16, Steven Gallinger
17, Graham G.
Giles18, 19, 20
, Gary E. Goodman6, Phyllis J. Goodman
21, Eric J. Jacobs
22, Aruna Kamineni
23,
Alison P. Klein24, 25
, Laurence N. Kolonel26
, Matthew H. Kulke1, Donghui Li
27, Núria Malats
28,
Sara H. Olson29
, Harvey A. Risch30
, Howard D. Sesso4, 14, 15
, Kala Visvanathan31
, Emily White32,
33, Wei Zheng
34, 35, Christian C. Abnet
8, Demetrius Albanes
8, Gabriella Andreotti
8, Melissa A.
Austin33
, Richard Barfield5, Daniela Basso
36, Sonja I. Berndt
8, Marie-Christine Boutron-Ruault
37,
38, 39, Michelle Brotzman
40, Markus W. Büchler
41, H. Bas Bueno-de-Mesquita
42, 43, 44, Peter
Bugert45
, Laurie Burdette8, 9
, Daniele Campa46
, Neil E. Caporaso8, Gabriele Capurso
47, Charles
Chung8, 9
, Michelle Cotterchio48, 49
, Eithne Costello50
, Joanne Elena51
, Niccola Funel52
, J.
Michael Gaziano14, 15, 53
, Nathalia A. Giese41
, Edward L. Giovannucci4, 54, 55
, Michael Goggins56,
57, 58, Megan J. Gorman
1, Myron Gross
59, Christopher A. Haiman
60, Manal Hassan
27, Kathy J.
Helzlsouer61
, Brian E. Henderson62
, Elizabeth A. Holly13
, Nan Hu8, David J. Hunter
2, 63, 64,
Federico Innocenti65
, Mazda Jenab66
, Rudolf Kaaks46
, Timothy J. Key67
, Kay-Tee Khaw68
, Eric
A. Klein69
, Manolis Kogevinas70, 71, 72
, Vittorio Krogh73
, Juozas Kupcinskas74
, Robert C. Kurtz75
,
Andrea LaCroix6, Maria T. Landi
8, Stefano Landi
76, Loic Le Marchand
77, Andrea Mambrini
78,
Satu Mannisto79
, Roger L. Milne18, 19
, Yusuke Nakamura80
, Ann L. Oberg81
, Kouros Owzar82
,
Alpa V. Patel22
, Petra H. M. Peeters83, 84
, Ulrike Peters85
, Raffaele Pezzilli86
, Ada Piepoli87
,
Miquel Porta71, 88, 89
, Francisco X. Real90, 91
, Elio Riboli44
, Nathaniel Rothman8, Aldo Scarpa
92,
Xiao-Ou Shu34, 35
, Debra T. Silverman8, Pavel Soucek
93, Malin Sund
94, Renata Talar-
Wojnarowska95
, Philip R. Taylor8, George E. Theodoropoulos
96, Mark Thornquist
6, Anne
Tjønneland97
, Geoffrey S. Tobias8, Dimitrios Trichopoulos
4, 98, 99, Pavel Vodicka
100, Jean
Wactawski-Wende101
, Nicolas Wentzensen8, Chen Wu
4, Herbert Yu
77, Kai Yu
8, Anne Zeleniuch-
Jacquotte11, 12
, Robert Hoover8, Patricia Hartge
8†, Charles Fuchs
1, 54†, Stephen J. Chanock
8, 9†,
Rachael S. Stolzenberg-Solomon8†‡
, Laufey T. Amundadottir8†‡
SUPPLEMENTARY INFORMATION
1. SUPPLEMENTARY TABLES
Supplementary Table 1. Description of studies included in stage 1 and replication stage of PanScan III
Supplementary Table 2. Stage 1 subjects genotyped, quality control exclusions, and subjects included in
the European ancestry analysis
Supplementary Table 3. Characteristics of stage 1 cases and controls included for GWAS
Supplementary Table 4. Association results for 13 SNPs in stages 1 and 2 with combined P<5x10⁻⁵
Supplementary Table 5. Characteristics of cases and controls from studies included in the replication
stage (5A), Subjects genotyped, quality control exclusions, and subjects included in the European
ancestry analysis (5B)
Supplementary Table 6. Association results for the 13 SNPs in the replication studies
Nature Genetics: doi:10.1038/ng.3052
Supplementary Table 7: Chromosomal regions of newly implicated pancreatic cancer susceptibility loci
Supplementary Table 8: Association results for five new pancreatic cancer susceptibility loci and one
suggestive locus stratified by geographic region
Supplementary Table 9: Association results for five new pancreatic cancer susceptibility loci and one
suggestive locus stratified by smoking status
Supplementary Table 10. Association results for PanScan susceptibility loci among Asian subjects from
SMWHS
Supplementary Table 11. Association results for Chinese and Japanese pancreatic cancer risk loci in
participants of European descent in PanScan stages 1 and 2
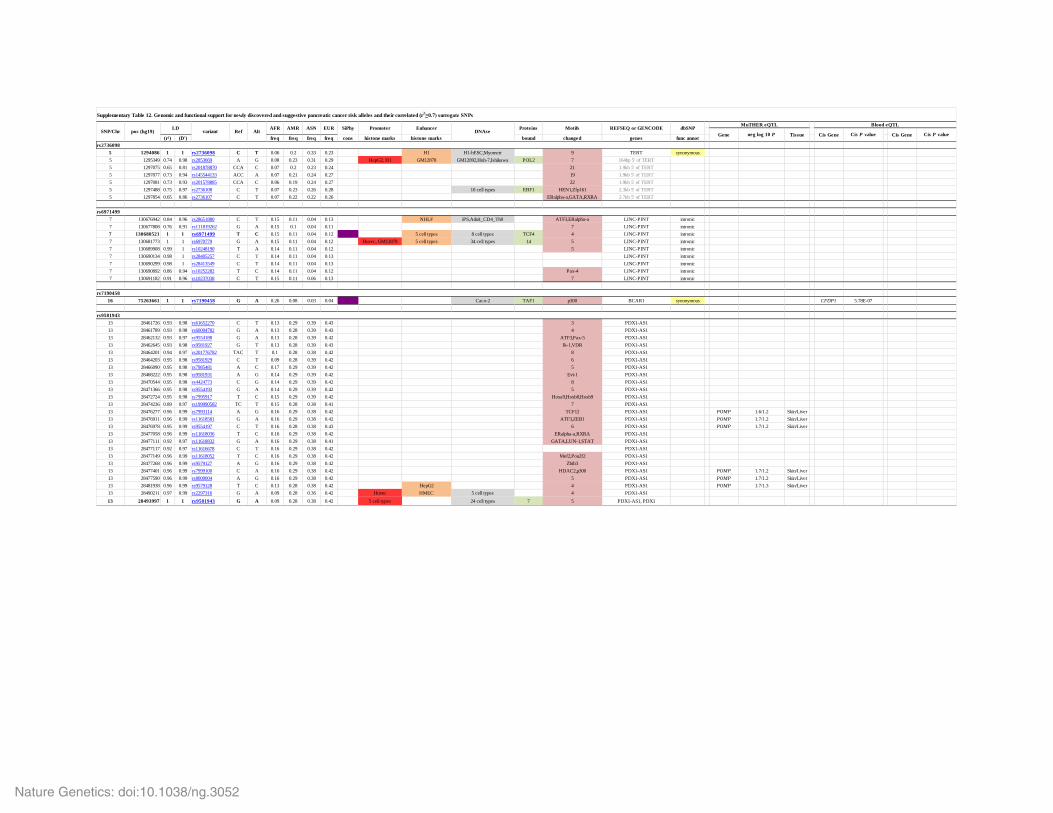
Supplementary Table 12. Genomic and functional support for newly discovered and suggestive pancreatic
cancer risk alleles and their correlated (r2≥0.7) surrogate SNPs
Nature Genetics: doi:10.1038/ng.3052

Supplemental Table 1. Description of studies included in PanScan III
Study No. of
cases
No. of
controls
Location Source of cases Study reference
STAGE 1: PanScan III GWAS
Stage 1 Cohort Studies
Agricultural Health
Study (AHS)
27 USA Linkage to state
cancer registries.
Alavanja MC, et al. Cancer and
noncancer risk to women in
agriculture and pest control: the
Agricultural Health Study. J Occup
Med. 1994Nov;36(11):1247-50.
[PMID: 7532217]
The Alpha-Tocopherol,
Beta-Carotene
Prevention Study
(ATBC)
44 217 Finland Linkage to Finnish
Cancer registry
The alpha-tocopherol, beta-carotene
lung cancer prevention study:
design, methods, participant
characteristics, and compliance. The
ATBC Cancer Prevention Study
Group. Ann Epidemiol. 1994
Jan;4(1):1-10.
[PMID: 8205268]
Cancer Prevention Study
(CPS-II)
158 214 USA Identified through
self-report on
biannual
questionnaires
starting in 1997 or
through linkage
with the National
Death Index.
Verified by medical
records or linkage
to state cancer
registries.
Calle EE. et al. The American
Cancer Society Cancer Prevention
Study II Nutrition Cohort: rationale,
study design, and baseline
characteristics. Cancer. Cancer
2002;94:2490-501.
[PMID:11900235]
European Prospective
Investigation Into Cancer
and Nutrition Study
(EPIC)
174 263 Europe Cancer registries in
participating
countries
(Denmark, Italy,
The Netherlands,
Norway, Spain,
Sweden and the
UK) and through
health insurance
records, cancer and
pathology registries,
and active follow-
up of study subjects
and next of kin
(France, Germany,
and Greece)
Riboli E. et al. The EPIC Project:
rationale and study design.
European Prospective Investigation
into Cancer and Nutrition. Int J
Epidemiol. Int J of Epidemiol
1997;26(1):S6-14.
[PMID:9126529] Riboli E. et al. European
Prospective Investigation into
Cancer and Nutrition (EPIC): study
populations and data collection.
Public Health Nutr. Public Health
Nutr 2002;5(6B):1113-24.
[PMID:12639222]
Health Professionals
Follow-up Study (HFPS)
25 84 USA Identified through
self-report on
biannual
questionnaires or
through linkage
with the National
Death Index.
Verified by medical
records or linkage
to state cancer
registries.
Rimm E. et al. Prospective study of
alcohol consumption and risk of
coronary disease in men. Lancet.
Lancet 1991;338:464-8.
[PMID: 1678444]
Nature Genetics: doi:10.1038/ng.3052

The Melbourne
Collaborative Cohort
Study (MCCS)
77 75 Australia Linkage to national
cancer registries.
Giles GG. et al. The Melbourne
Collaborative Cohort Study. IARC
Sci Publ. IARC Sci Publ
2002;156:69-70.
[PMID: 12484128]
Multiethnic Cohort Study
of Diet and Health
(MEC)
28 200 USA Linkage to the
Hawaii Tumor
Registry, the
Cancer Surveillance
Program of Los
Angeles County,
and the California
State Cancer
Registry
Kolonel LN et al. A multiethnic
cohort in Hawaii and Los Angeles:
baseline characteristics. Am J
Epidemiol. 2000 Feb 15;151(4):346-
57.
[PMID:10695593]
Nurse's Health Study
(NHS)
29 437 USA Identified through
self-report on
biannual
questionnaires or
through linkage
with the National
Death Index.
Verified by medical
records or linkage
to state cancer
registries.
Colditz GA. et al. The Nurses'
Health Study: lifestyle and health
among women. Nat Rev Cancer.
Nat Rev Cancer 2005;5:388-96.
[PMID: 15864280]
Physicians Health Study
(PHS)
15 USA Identified through
self-report on
biannual
questionnaires or
through linkage
with the National
Death Index.
Verified by medical
records or linkage
to state cancer
registries.
Manson JE et al. Aspirin in the
primary prevention of angina
pectoris in a randomized trial of
United States physicians. Am J Med.
1990;89(6):772–776.
[PMID:2252045]
Prostate, Lung,
Colorectal, Ovarian
Cancer Screening Trial
(PLCO)
91 3042 USA Self-report through
annual
questionnaires.
Confirmed by
pathology reports
and medical
records.
Hayes RB et al. Methods for
etiologic and early marker
investigations in the PLCO trial.
Mutat Res. Mutat Res
2005;592:147-54.
[PMID: 16054167]
Selenium and Vitamin E
Cancer Prevention Trial
(SELECT)
54 USA Self-report through
bi-annual clinic
visits during the
trial. Confirmed by
pathology reports.
Lippman SM et al. Designing the
Selenium and Vitamin E Cancer
Prevention Trial (SELECT). J Natl
Cancer Inst. 2005 Jan 19;97(2):94-
102.
[PMID: 15657339]
Vitamins and Lifestyle
Study (VITAL)
48 USA Linkage to the
western
Washington state
SEER registry
White E et al. VITamins And
Lifestyle cohort study: study design
and characteristics of supplement
users. Am J Epidemiol.
2004;159:83–93.
[PMID:14693663]
Women’s Health
Initiative (WHI)
169 226 USA Self-report through
semi-annual clinic
visits or annual
Anderson GL, et al. Implementation
of the Women's Health Initiative
study design. Ann Epidemiol. 2003
Nature Genetics: doi:10.1038/ng.3052

contact. Verified
through medical
records.
Oct;13(9 Suppl):S5-17.
[PMID: 14575938]
Total stage 1 cohort
studies
939 4,758
Stage 1 Case series or
case-control studies
Gastrointestinal Cancer
Clinic of Dana-Farber
Cancer Institute Study
(DFCI-GCC)
360 USA Pathologically-
confirmed cases
sequentially
identified from an
outpatient
gastrointestinal
cancer clinic
PANcreatic Disease
ReseArch (PANDoRA)
consortium, Heidelberg
194 Germany Confirmed cases
from Heidelberg
University Hospital
Campa D et al. Genetic
susceptibility to pancreatic cancer
and its functional characterisation:
the PANcreatic Disease ReseArch
(PANDoRA) consortium. Dig Liver
Dis. 2013 Feb;45(2):95-9.
[PMID: 23206934]
PANKRAS-II 89 445 Spain Hospital-based,
confirmed by
oncologist review
Porta M et al; PANKRAS II Study
Group. Timing of blood extraction
in epidemiologic and proteomic
studies: results and proposals from
the PANKRAS II Study. Eur J
Epidemiol. 2007;22(9):577-88.
Epub 2007 Jul 18. Erratum in: Eur J
Epidemiol. 2008;23(1):77.
[PMID: 17636417]
Total stage 1 case series
or case-control studies
643 445
TOTAL STAGE 1
GWAS
1,582 5,203
STAGE 2: PanScan I and II GWAS
Stage 2 Cohort studies
The Alpha-Tocopherol,
Beta-Carotene
Prevention Study
(ATBC)
194 206 Finland Linkage to Finnish
Cancer registry
The alpha-tocopherol, beta-carotene
lung cancer prevention study:
design, methods, participant
characteristics, and compliance. The
ATBC Cancer Prevention Study
Group. Ann Epidemiol. 1994
Jan;4(1):1-10.
[PMID: 8205268]
Give Us a Clue to Cancer
and Heart Disease Study
(CLUEII)
67 70 Washington County MD,
USA
Washington County
Cancer Registry,
Maryland State
Cancer Registry
Gallicchio,L. et al. Single
nucleotide polymorphisms in
inflammation-related genes and
mortality in a community-based
cohort in Washington County,
Maryland. Am J Epidemiol. 2008
Apr 1;167(7):807-13. [PMID:
18263601]
Cancer Prevention Study
(CPS II)
115 115 USA Identified through
self-report on
biannual
questionnaires
Calle EE. et al. The American
Cancer Society Cancer Prevention
Study II Nutrition Cohort: rationale,
study design, and baseline
Nature Genetics: doi:10.1038/ng.3052

starting in 1997 or
through linkage
with the National
Death Index.
Verified by medical
records or linkage
to state cancer
registries.
characteristics. Cancer. Cancer
2002;94:2490-501.
[PMID:11900235]
European Prospective
Investigation Into Cancer
and Nutrition Study
(EPIC)
418 432 Europe
Cancer registries in
participating
countries
(Denmark, Italy,
The Netherlands,
Norway, Spain,
Sweden and the
UK) and through
health insurance
records, cancer and
pathology registries,
and active follow-
up of study subjects
and next of kin
(France, Germany,
and Greece)
Riboli E. et al. The EPIC Project:
rationale and study design.
European Prospective Investigation
into Cancer and Nutrition. Int J
Epidemiol. Int J of Epidemiol
1997;26(1):S6-14.
[PMID:9126529] Riboli E. et al. European
Prospective Investigation into
Cancer and Nutrition (EPIC): study
populations and data collection.
Public Health Nutr. Public Health
Nutr 2002;5(6B):1113-24.
[PMID:12639222]
Health Professionals
Follow-up Study (HFPS)
52 49 USA Identified through
self-report on
biannual
questionnaires or
through linkage
with the National
Death Index.
Verified by medical
records or linkage
to state cancer
registries.
Rimm E. et al. Prospective study of
alcohol consumption and risk of
coronary disease in men. Lancet.
Lancet 1991;338:464-8.
[PMID: 1678444]
Nurse's Health Study
(NHS)
81 83 USA Identified through
self-report on
biannual
questionnaires or
through linkage
with the National
Death Index.
Verified by medical
records or linkage
to state cancer
registries.
Colditz GA. et al. The Nurses'
Health Study: lifestyle and health
among women. Nat Rev Cancer.
Nat Rev Cancer 2005;5:388-96.
[PMID: 15864280]
The New York
University Women’s
Health Study (NYU-
WHS)
10 11 USA Self-report through
questionnaires
every 2-4 years,
confirmed by
medical and
pathology records;
and linkages to
tumor registries of
NY, NJ and Florida
and NDI
Zeleniuch-Jacquotte A, et al.
Postmenopausal levels of sex
hormones and risk of breast
carcinoma in situ: results of a
prospective study. Int J Cancer.
2005 Mar 20;114(2):323-7.
[PMID:15540225]
Physicians Health Study
(PHS)
46 53 USA Identified through
self-report on
biannual
questionnaires or
through linkage
Manson JE et al. Aspirin in the
primary prevention of angina
pectoris in a randomized trial of
United States physicians. Am J Med.
1990;89(6):772–776.
Nature Genetics: doi:10.1038/ng.3052

with the National
Death Index.
Verified by medical
records or linkage
to state cancer
registries.
[PMID:2252045]
Prostate, Lung,
Colorectal, Ovarian
Cancer Screening Trial
(PLCO)
180 201 USA Self-report through
annual
questionnaires.
Confirmed by
pathology reports
and medical
records.
Hayes RB et al. Methods for
etiologic and early marker
investigations in the PLCO trial.
Mutat Res. 2005;592:147-54.
[PMID: 16054167]
Women’s Health
Initiative (WHI)
206 208 USA Self-report through
semi-annual clinic
visits or annual
contact. Verified
through medical
records.
Anderson GL, et al. Implementation
of the Women's Health Initiative
study design. Ann Epidemiol. 2003
Oct;13(9 Suppl):S5-17.
[PMID: 14575938]
Womens' Heath Study
(WHS)
25 31 USA Self report or death
follow-up.
Rexrode KM, et al. Baseline
characteristics of participants in the
Women's Health Study. J Womens
Health Gend Based Med. 2000
Jan-Feb;9(1):19-27.
[PMID: 10718501]
Wolpin BM, et al. Hyperglycemia,
insulin resistance, impaired
pancreatic β-cell function, and risk
of pancreatic cancer. J Natl Cancer
Inst. 2013 Jul 17;105(14):1027-35.
[PMID: PMC3714020]
Total stage 2 cohort
studies
1,394 1,459
Stage 2 Case-Control
studies
Johns Hopkins Hospital
178 175 USA JHU Clinic
Controls spouse (in-Law) of pancreatic
cancer patient, no
history pancreatic cancer
Mayo Clinic Molecular
Epidemiology Case-
Control Study
635 617 Upper Mid-
West: Minn.,
Iowa, Wisconsin,
USA
Clinic
Controls General
Medical Evaluation (primary care)
patients, no personal
history of cancer (except non-melanoma
of skin)
McWilliams RR, et al.
Polymorphisms in DNA repair
genes, smoking, and pancreatic
adenocarcinoma risk. Cancer Res.
2008 Jun 15;68(12):4928-35.
[PMID: PMC2652067]
Memorial Sloan
Kettering
126 134 NYC, USA Clinic
Controls spouses of
patients; visitors accompanying
patients, no personal history of cancer
(except non-melanoma
of skin)
Olson SH, et al. Allergies, variants
in IL-4 and IL-4R alpha genes, and
risk of pancreatic cancer. Cancer
Detect Prev. 2007;31(5):345-51.
[PMID: 18031948]
MD Anderson 256 266 Texas, USA Hospital
Controls friends and spouses of non-
pancreatic cancer
Hassan MM, et al. Risk factors for
pancreatic cancer:case-control
study. Am J Gastroenterol. 2007
Nature Genetics: doi:10.1038/ng.3052

patients at MDA, no
personal history of
cancer (except non-
melanoma of skin)
Dec;102(12):2696-70.
[PMID: PMC2423805]
PACIFIC Study 246 241
Seattle, WA
and Northern
California, USA
Group Health (Seattle
Pufet Sound) and
Kaiser Permanente
Toronto 278 259 Ontario
(cases)
Greater Toronto
(controls), Canada
Population-based
cancer registry
Controls Ontario population-based case
control study of colorectal cancer,
ARCTIC
Eppel A, et al. Allergies are
associated with reduced pancreas
cancer risk: A population-based
case-control study in Ontario,
Canada. Int J Cancer. 2007 Nov
15;121(10):2241-5.
[PMID: 17582608]
UCSF 206 212 San
Francisco Bay Area,
USA
Population-based
cancer registry/ Controls random digit-
dial within six SF Bay
Area counties, no history pancreatic
cancer
Duell EJ, et al. Detecting pathway-
based gene-gene and gene-
environment interactions in
pancreatic cancer.Cancer Epidemiol
Biomarkers Prev. 2008
Jun;17(6):1470-9.
[PMID: 18559563]
Yale 206 279 Connecticut,
USA
Population-based
cancer registry Controls block list-
directed Random
digit-dial, no personal history of cancer
(except non-melanoma
of skin)
Risch HA. Etiology of pancreatic
cancer, with a hypothesis
concerning the role of N-nitroso
compounds and excess gastric
acidity. J Natl Cancer Inst. 2003
Jul2;95(13):948-60. [PMID:
12837831]
Total stage 2 case-
control studies
2,131 2,183
TOTAL STAGE 2
GWAS
3,525 3,642
STAGE 3:
REPLICATION
PANDoRA
2000 4797 Europe Clinic based caes
from 15 basic
and/or clinical
research groups,
across six European
countries
Campa D et al. Genetic
susceptibility to pancreatic cancer
and its functional characterisation:
the PANcreatic Disease Research
(PANDoRA) consortium. Dig Liver
Dis. 2013 Feb;45(2):95-9.
[PMID: 23206934]
Cancer and Leukemia
Group B (CALGB) study
80303
307 USA Phase III multi-
institution clinical
trial of
bevacizumab and
gemcitabine. Cases
histologically
confirmed. Cancer
not amenable to
curative surgery.
Innocenti Fet al. A genome-wide
association study of overall survival
in pancreatic cancer patients treated
with gemcitabine in CALGB 80303.
Clin Cancer Res. 2012 Jan
15;18(2):577-84.
[PMC3412624]
PLCO 755 USA Self-report through
annual
questionnaires.
Confirmed by
pathology reports
and medical
records.
Hayes RB et al. Methods for
etiologic and early marker
investigations in the PLCO trial.
Mutat Res. Mutat Res
2005;592:147-54.
[PMID: 16054167]
Nature Genetics: doi:10.1038/ng.3052

Carotene and Retinol
Efficacy Trial (CARET)
and samples from studies
with DNA that was
inadequate for GWAS*
274 USA Self-report to the
Coordinating
Center at the
Hutchinson Cancer
Center. Verified
through pathology
reports and medical
records.
Thornquist MD et al. Statistical
design and monitoring of the
Carotene and Retinol Efficacy Trial
(CARET). Control Clin Trials. 1993
Aug;14(4):308-24.
[PMID: 8365195]
TOTAL STAGE 3
REPLICATION
2,576 5,552
GRAND TOTAL
STAGE 1, 2, 3
7,683 14,397
* Cases from studies without adequate DNA for participation in the GWAS were used in the replication stage. These
cases were drawn from: AHS, ATBC, CPS-II, DFCI, EPIC, HPFS, MCCS, MEC, PHS, PLCO, VITAL, and WHI.
Nature Genetics: doi:10.1038/ng.3052
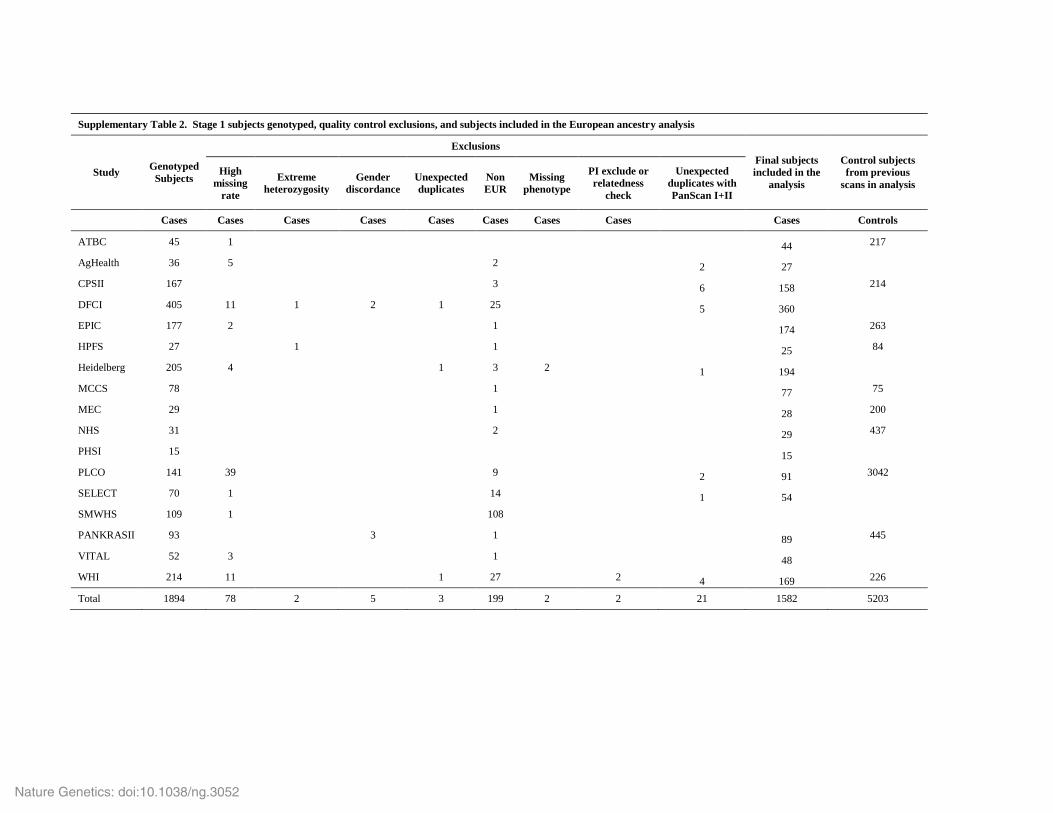
Supplementary Table 2. Stage 1 subjects genotyped, quality control exclusions, and subjects included in the European ancestry analysis
Study Genotyped
Subjects
Exclusions
Final subjects
included in the
analysis
Control subjects
from previous
scans in analysis
High
missing
rate
Extreme
heterozygosity
Gender
discordance
Unexpected
duplicates
Non
EUR
Missing
phenotype
PI exclude or
relatedness
check
Unexpected
duplicates with
PanScan I+II
Cases Cases Cases Cases Cases Cases Cases Cases Cases Controls
ATBC 45 1
44 217
AgHealth 36 5
2 2 27
CPSII 167
3 6 158 214
DFCI 405 11 1 2 1 25 5 360
EPIC 177 2
1
174 263
HPFS 27
1
1
25 84
Heidelberg 205 4
1 3 2 1 194
MCCS 78
1
77 75
MEC 29
1
28 200
NHS 31
2
29 437
PHSI 15
15
PLCO 141 39
9 2 91 3042
SELECT 70 1
14 1 54
SMWHS 109 1
108
PANKRASII 93
3
1
89 445
VITAL 52 3
1
48
WHI 214 11
1 27
2 4 169 226
Total 1894 78 2 5 3 199 2 2 21 1582 5203
Nature Genetics: doi:10.1038/ng.3052
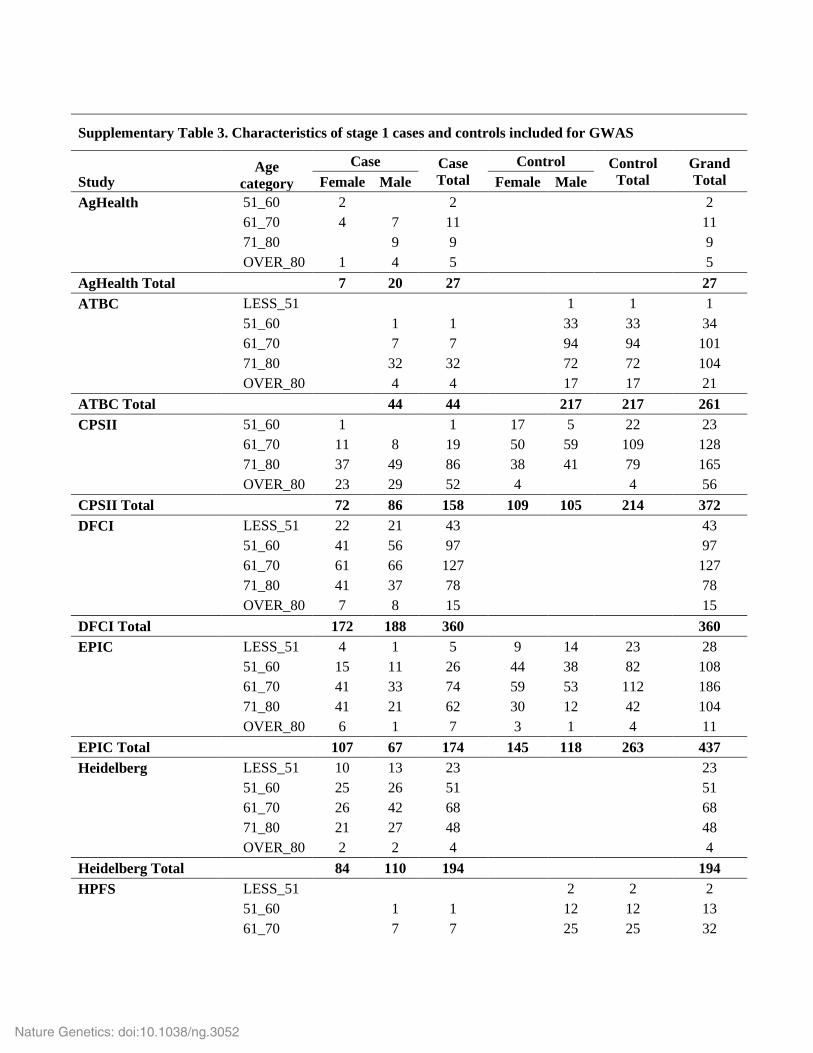
Supplementary Table 3. Characteristics of stage 1 cases and controls included for GWAS
Age
category
Case Case
Total
Control Control
Total
Grand
Total Study Female Male Female Male
AgHealth 51_60 2 2 2
61_70 4 7 11
11
71_80
9 9
9
OVER_80 1 4 5
5
AgHealth Total 7 20 27 27
ATBC LESS_51
1 1 1
51_60
1 1
33 33 34
61_70
7 7
94 94 101
71_80
32 32
72 72 104
OVER_80
4 4
17 17 21
ATBC Total 44 44 217 217 261
CPSII 51_60 1 1 17 5 22 23
61_70 11 8 19 50 59 109 128
71_80 37 49 86 38 41 79 165
OVER_80 23 29 52 4
4 56
CPSII Total 72 86 158 109 105 214 372
DFCI LESS_51 22 21 43
43
51_60 41 56 97
97
61_70 61 66 127
127
71_80 41 37 78
78
OVER_80 7 8 15
15
DFCI Total 172 188 360 360
EPIC LESS_51 4 1 5 9 14 23 28
51_60 15 11 26 44 38 82 108
61_70 41 33 74 59 53 112 186
71_80 41 21 62 30 12 42 104
OVER_80 6 1 7 3 1 4 11
EPIC Total 107 67 174 145 118 263 437
Heidelberg LESS_51 10 13 23
23
51_60 25 26 51
51
61_70 26 42 68
68
71_80 21 27 48
48
OVER_80 2 2 4
4
Heidelberg Total 84 110 194 194
HPFS LESS_51
2 2 2
51_60
1 1
12 12 13
61_70
7 7
25 25 32
Nature Genetics: doi:10.1038/ng.3052

71_80
8 8
37 37 45
OVER_80
9 9
8 8 17
HPFS Total 25 25 84 84 109
MCCS 51_60 4 4 8 4 6 10 18
61_70 12 10 22 13 14 27 49
71_80 19 22 41 12 17 29 70
OVER_80 3 3 6 7 2 9 15
MCCS Total 38 39 77 36 39 75 152
MEC LESS_51 1
1 46
46 47
51_60
2 2 71
71 73
61_70 3 2 5 60
60 65
71_80 5 4 9 23
23 32
OVER_80 5 6 11
11
MEC Total 14 14 28 200 200 228
NHS LESS_51
32
32 32
51_60 1
1 142
142 143
61_70 4
4 169
169 173
71_80 16
16 89
89 105
OVER_80 8
8 5
5 13
NHS Total 29 29 437 437 466
PHS 61_70 2 2 2
71_80
9 9
9
OVER_80
4 4
4
PHS Total 15 15 15
PLCO 51_60
1 1 15 316 331 332
61_70 15 11 26 67 1624 1691 1717
71_80 17 25 42 44 944 988 1030
OVER_80 12 10 22
32 32 54
PLCO Total 44 47 91 126 2916 3042 3133
PANCRASII/SBCS LESS_51 2 5 7 3 40 43 50
51_60 7 14 21 5 97 102 123
61_70 8 15 23 23 137 160 183
71_80 13 14 27 27 112 139 166
OVER_80 9 2 11
1 1 12
PANCRASII/SBCS
Total 39 50 89 58 387 445 534
SELECT 51_60
2 2
2
61_70
32 32
32
71_80
15 15
15
OVER_80
5 5
5
SELECT Total 54 54 54
VITAL 51_60 2 2 2
Nature Genetics: doi:10.1038/ng.3052

61_70 6 12 18
18
71_80 14 11 25
25
OVER_80 2 1 3
3
VITAL Total 24 24 48 48
WHI 51_60 4
4
4
61_70 29
29 226
226 255
71_80 95
95
95
OVER_80 41
41
41
WHI Total 169 169 226 226 395
Grand Total LESS_51 39 40 79 90 57 147 226
51_60 102 118 220 298 507 805 1025
61_70 220 254 474 667 2006 2673 3147
71_80 319 283 602 263 1235 1498 2100
OVER_80 119 88 207 19 61 80 287
Grand Total 799 783 1582 1337 3866 5203 6785
Nature Genetics: doi:10.1038/ng.3052
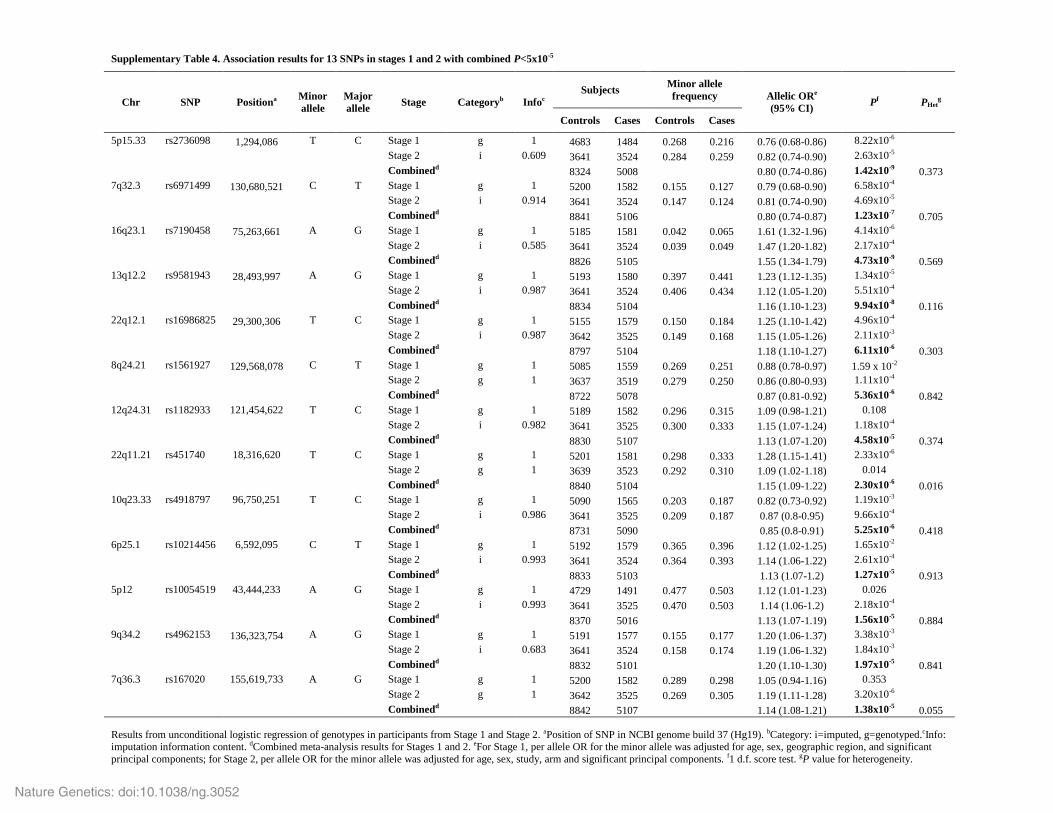
Supplementary Table 4. Association results for 13 SNPs in stages 1 and 2 with combined P<5x10⁻⁵
Chr SNP Positiona Minor
allele
Major
allele Stage Categoryb Infoc
Subjects Minor allele
frequency Allelic ORe
(95% CI) Pf PHet
g
Controls Cases Controls Cases
5p15.33 rs2736098 1,294,086 T C Stage 1 g 1 4683 1484 0.268 0.216 0.76 (0.68-0.86) 8.22x10⁻⁶
Stage 2 i 0.609 3641 3524 0.284 0.259 0.82 (0.74-0.90) 2.63x10⁻⁵
Combinedd
8324 5008
0.80 (0.74-0.86) 1.42x10⁻⁹ 0.373
7q32.3 rs6971499 130,680,521 C T Stage 1 g 1 5200 1582 0.155 0.127 0.79 (0.68-0.90) 6.58x10⁻⁴
Stage 2 i 0.914 3641 3524 0.147 0.124 0.81 (0.74-0.90) 4.69x10⁻⁵
Combinedd
8841 5106
0.80 (0.74-0.87) 1.23x10⁻⁷ 0.705
16q23.1 rs7190458 75,263,661 A G Stage 1 g 1 5185 1581 0.042 0.065 1.61 (1.32-1.96) 4.14x10⁻⁶
Stage 2 i 0.585 3641 3524 0.039 0.049 1.47 (1.20-1.82) 2.17x10⁻⁴
Combinedd
8826 5105
1.55 (1.34-1.79) 4.73x10⁻⁹ 0.569
13q12.2 rs9581943 28,493,997 A G Stage 1 g 1 5193 1580 0.397 0.441 1.23 (1.12-1.35) 1.34x10⁻⁵
Stage 2 i 0.987 3641 3524 0.406 0.434 1.12 (1.05-1.20) 5.51x10⁻⁴
Combinedd
8834 5104
1.16 (1.10-1.23) 9.94x10⁻⁸ 0.116
22q12.1 rs16986825 29,300,306 T C Stage 1 g 1 5155 1579 0.150 0.184 1.25 (1.10-1.42) 4.96x10⁻⁴
Stage 2 i 0.987 3642 3525 0.149 0.168 1.15 (1.05-1.26) 2.11x10⁻³
Combinedd
8797 5104
1.18 (1.10-1.27) 6.11x10⁻⁶ 0.303
8q24.21 rs1561927 129,568,078 C T Stage 1 g 1 5085 1559 0.269 0.251 0.88 (0.78-0.97) 1.59 x 10⁻²
Stage 2 g 1 3637 3519 0.279 0.250 0.86 (0.80-0.93) 1.11x10⁻⁴
Combinedd
8722 5078
0.87 (0.81-0.92) 5.36x10⁻⁶ 0.842
12q24.31 rs1182933 121,454,622 T C Stage 1 g 1 5189 1582 0.296 0.315 1.09 (0.98-1.21) 0.108
Stage 2 i 0.982 3641 3525 0.300 0.333 1.15 (1.07-1.24) 1.18x10⁻⁴
Combinedd 8830 5107
1.13 (1.07-1.20) 4.58x10⁻⁵ 0.374
22q11.21 rs451740 18,316,620 T C Stage 1 g 1 5201 1581 0.298 0.333 1.28 (1.15-1.41) 2.33x10⁻⁶
Stage 2 g 1 3639 3523 0.292 0.310 1.09 (1.02-1.18) 0.014
Combinedd
8840 5104
1.15 (1.09-1.22) 2.30x10⁻⁶ 0.016
10q23.33 rs4918797 96,750,251 T C Stage 1 g 1 5090 1565 0.203 0.187 0.82 (0.73-0.92) 1.19x10⁻³
Stage 2 i 0.986 3641 3525 0.209 0.187 0.87 (0.8-0.95) 9.66x10⁻⁴
Combinedd
8731 5090
0.85 (0.8-0.91) 5.25x10⁻⁶ 0.418
6p25.1 rs10214456 6,592,095 C T Stage 1 g 1 5192 1579 0.365 0.396 1.12 (1.02-1.25) 1.65x10⁻²
Stage 2 i 0.993 3641 3524 0.364 0.393 1.14 (1.06-1.22) 2.61x10⁻⁴
Combinedd
8833 5103
1.13 (1.07-1.2) 1.27x10⁻⁵ 0.913
5p12 rs10054519 43,444,233 A G Stage 1 g 1 4729 1491 0.477 0.503 1.12 (1.01-1.23) 0.026
Stage 2 i 0.993 3641 3525 0.470 0.503 1.14 (1.06-1.2) 2.18x10⁻⁴
Combinedd
8370 5016
1.13 (1.07-1.19) 1.56x10⁻⁵ 0.884
9q34.2 rs4962153 136,323,754 A G Stage 1 g 1 5191 1577 0.155 0.177 1.20 (1.06-1.37) 3.38x10⁻³
Stage 2 i 0.683 3641 3524 0.158 0.174 1.19 (1.06-1.32) 1.84x10⁻³
Combinedd
8832 5101
1.20 (1.10-1.30) 1.97x10⁻⁵ 0.841
7q36.3 rs167020 155,619,733 A G Stage 1 g 1 5200 1582 0.289 0.298 1.05 (0.94-1.16) 0.353
Stage 2 g 1 3642 3525 0.269 0.305 1.19 (1.11-1.28) 3.20x10⁻⁶
Combinedd 8842 5107
1.14 (1.08-1.21) 1.38x10⁻⁵ 0.055
Results from unconditional logistic regression of genotypes in participants from Stage 1 and Stage 2. aPosition of SNP in NCBI genome build 37 (Hg19). bCategory: i=imputed, g=genotyped.cInfo: imputation information content. dCombined meta-analysis results for Stages 1 and 2. eFor Stage 1, per allele OR for the minor allele was adjusted for age, sex, geographic region, and significant
principal components; for Stage 2, per allele OR for the minor allele was adjusted for age, sex, study, arm and significant principal components. f1 d.f. score test. gP value for heterogeneity.
Nature Genetics: doi:10.1038/ng.3052

Supplementary Table 5A. Characteristics of cases and controls from studies included in the replication stage
Group A (CGR) Age category Case
Case Total Control Control
Total Grand Total
Female Male Female Male
AgHealth 61_70 3 2 5 5
OVER_70
2 2
2
AgHealth Total 3 4 7 7
CARET LESS_60 2 4 6
6
61_70 3 19 22
22
OVER_70 5 13 18
18
CARET Total 10 36 46 46
CPSII OVER_70 1 2 3
3
CPSII Total
1 2 3
3
DFCI LESS_60 3 3 3
61_70 3 4 7
7
OVER_70 1 1 2
2
DFCI Total 4 8 12 12
EPIC LESS_60
1 1
1
61_70
1 1
1
EPIC Total
2 2
2
Heidelberg LESS_60 5 10 15 15
61_70 5 11 16
16
OVER_70 6 3 9
9
Heidelberg Total 16 24 40 40
HPFS 61_70
1 1
1
HPFS Total
1 1
1
MCCS LESS_60 1 7 8 8
61_70 15 9 24
24
OVER_70 15 17 32
32
MCCS Total 31 33 64 64
MEC LESS_60 1
1
1
61_70 3 3 6
6
OVER_70 3 4 7
7
MEC Total
7 7 14
14
PHS 61_70 1 1 1
OVER_70
12 12
12
Nature Genetics: doi:10.1038/ng.3052

PHS Total 13 13 13
PLCO LESS_60
31 45 76 76
61_70 3 3 6 111 138 249 255
OVER_70 9 19 28 14 39 53 81
PLCO Total 12 22 34 156 222 378 412
VITAL LESS_60
2 2
2
61_70 4 6 10
10
OVER_70 4 3 7
7
VITAL Total
8 11 19
19
WHI 61_70 2 2 2
OVER_70 12
12
12
WHI Total 14 14 14
Grand Total LESS_60 9 27 36 31 45 76 112
61_70 41 60 101 111 138 249 350
OVER_70 56 76 132 14 39 53 185
Grand Total Grand Total 106 163 269 156 222 378 647
Group B Age category Case
Case Total Control Control
Total Grand Total
Female Male Female Male
PANDoRA LESS_40 13 17 30 211 247 458 488
40_50 51 95 146 329 460 789 935
50_60 179 264 443 648 703 1351 1794
60_70 322 418 740 570 863 1433 2173
OVER_70 285 356 641 379 387 766 1407
PANDoRA
Total 850 1150 2000 2137 2660 4797 6797
Group C Age category Case
Case Total Control Control
Total Grand Total
Female Male Female Male
CALGB LESS_60 39 49 88 88
60_69 43 47 90
90
OVER_70 57 72 129 129
CALGB Total 139 168 307 307
PLCO LESS_60 38 43 81 81
60_69
103 130 233 233
OVER_70
27 36 63 63
PLCO Total 168 209 377 377
Nature Genetics: doi:10.1038/ng.3052
CALGB/PLCO
Total 139 168 307 168 209 377 684
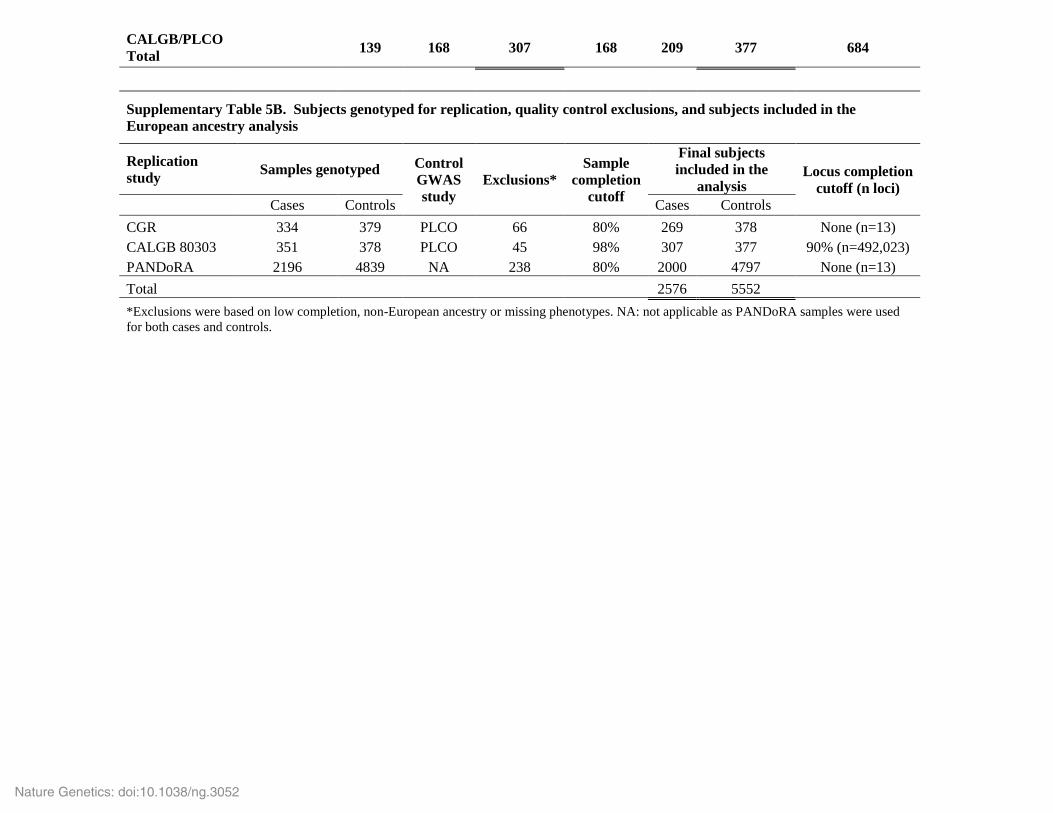
Supplementary Table 5B. Subjects genotyped for replication, quality control exclusions, and subjects included in the
European ancestry analysis
Replication
study Samples genotyped Control
GWAS
study
Exclusions*
Sample
completion
cutoff
Final subjects
included in the
analysis Locus completion
cutoff (n loci)
Cases Controls Cases Controls
CGR 334 379 PLCO 66 80% 269 378 None (n=13)
CALGB 80303 351 378 PLCO 45 98% 307 377 90% (n=492,023)
PANDoRA 2196 4839 NA 238 80% 2000 4797 None (n=13)
Total 2576 5552
*Exclusions were based on low completion, non-European ancestry or missing phenotypes. NA: not applicable as PANDoRA samples were used
for both cases and controls.
Nature Genetics: doi:10.1038/ng.3052

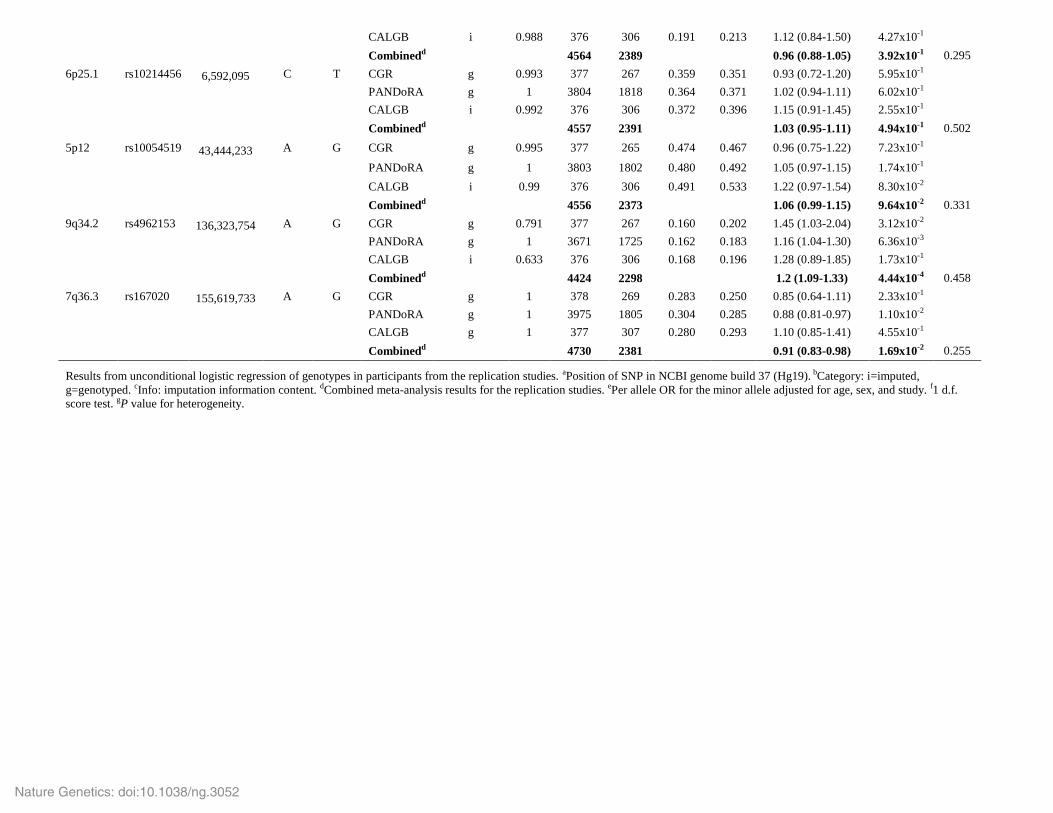
Supplementary Table 6. Association results for the 13 SNPs in the replication studies
Chr SNP Positiona Minor
allele
Major
allele Study Categoryb Infoc
Subjects Minor allele
frequency Allelic ORe
(95% CI) Pf PHet
g
Controls Cases Controls Cases
5p15.33 rs2736098 1,294,086 T C CGR g 0.703 377 267 0.287 0.213 0.66 (0.49-0.88) 4.98x10⁻³
PANDoRA g 1 4044 1613 0.266 0.243 0.86 (0.78-0.95) 3.15x10⁻³
CALGB i 0.499 376 306 0.330 0.261 0.60 (0.42-0.84) 3.43x10⁻³
Combinedd
4797 2186
0.81 (0.74-0.89) 1.36x10⁻⁵ 0.045
7q32.3 rs6971499 130,680,521 C T CGR g 0.937 377 268 0.162 0.104 0.58 (0.41-0.83) 2.44x10⁻³
PANDoRA g 1 3695 1750 0.145 0.117 0.79 (0.7.0-0.89) 2.49x10⁻⁴
CALGB i 0.884 376 306 0.146 0.139 0.82 (0.58-1.16) 2.64x10⁻¹
Combinedd
4448 2324
0.77 (0.69-0.86) 4.37x10⁻⁶ 0.257
16q23.1 rs7190458 75,263,661 A G CGR g 0.716 377 245 0.040 0.046 1.14 (0.56-2.27) 7.19x10⁻¹
PANDoRA g 1 3712 1751 0.037 0.047 1.33 (1.08-1.64) 7.28x10⁻³
CALGB i 0.529 376 306 0.047 0.058 1.67 (0.83-3.33) 1.55x10⁻¹
Combinedd
4465 2302
1.33 (1.10-1.61) 3.14x10⁻³ 0.744
13q12.2 rs9581943 28,493,997 A G CGR g 0.992 377 267 0.392 0.427 1.16 (0.91-1.49) 2.29x10⁻¹
PANDoRA g 1 3699 1733 0.410 0.438 1.11 (1.02-1.22) 1.36x10⁻²
CALGB i 0.985 376 306 0.419 0.435 1.10 (0.86-1.39) 4.52x10⁻¹
Combinedd
4452 2306
1.11 (1.03-1.20) 4.80x10⁻³ 0.933
22q12.1 rs16986825 29,300,306 T C CGR g 0.987 378 265 0.170 0.196 1.28 (0.95-1.73) 1.10x10⁻¹
PANDoRA g 1 3644 1732 0.179 0.198 1.15 (1.03-1.27) 1.27x10⁻²
CALGB i 0.983 377 307 0.150 0.205 1.42 (1.06-1.91) 1.99x10⁻²
Combinedd
4399 2304
1.18 (1.08-1.30) 5.13x10⁻⁴ 0.351
8q24.21 rs1561927 129,568,078 C T CGR g 1 378 263 0.245 0.261 0.99 (0.75-1.32) 9.48x10⁻¹
PANDoRA g 1 3798 1834 0.278 0.258 0.91 (0.83-0.99) 3.77x10⁻²
CALGB i 0.943 376 306 0.283 0.233 0.71 (0.55-0.93) 1.00x10⁻²
Combinedd
4552 2403
0.89 (0.82-0.97) 6.44x10⁻³ 0.171
12q24.31 rs1182933 121,454,622 T C CGR g 0.99 378 266 0.292 0.316 1.06 (0.82-1.37) 6.41x10⁻¹
PANDoRA g 1 3810 1821 0.327 0.346 1.11 (1.02-1.21) 1.57x10⁻²
CALGB i 0.979 376 306 0.296 0.329 1.15 (0.90-1.49) 2.62x10⁻¹
Combinedd
4564 2393
1.11 (1.03-1.20) 7.74x10⁻³ 0.902
22q11.21 rs451740 18,316,620 T C CGR g 1 378 269 0.306 0.314 1.05 (0.81-1.35) 7.10x10⁻¹
PANDoRA g 1 3797 1827 0.293 0.291 0.98 (0.89-1.07) 6.35x10⁻¹
CALGB g 1 377 307 0.296 0.301 1.11 (0.87-1.41) 4.02x10⁻¹
Combinedd
4552 2403
1.00 (0.92-1.08) 9.81x10⁻¹ 0.588
10q23.33 rs4918797 96,750,251 T C CGR g 0.986 377 269 0.192 0.175 0.80 (0.59-1.09) 1.62x10⁻¹
PANDoRA g 1 3811 1814 0.202 0.201 0.96 (0.87-1.06) 4.41x10⁻¹
Nature Genetics: doi:10.1038/ng.3052
CALGB i 0.988 376 306 0.191 0.213 1.12 (0.84-1.50) 4.27x10⁻¹
Combinedd
4564 2389
0.96 (0.88-1.05) 3.92x10⁻¹ 0.295
6p25.1 rs10214456 6,592,095 C T CGR g 0.993 377 267 0.359 0.351 0.93 (0.72-1.20) 5.95x10⁻¹
PANDoRA g 1 3804 1818 0.364 0.371 1.02 (0.94-1.11) 6.02x10⁻¹
CALGB i 0.992 376 306 0.372 0.396 1.15 (0.91-1.45) 2.55x10⁻¹
Combinedd
4557 2391
1.03 (0.95-1.11) 4.94x10⁻¹ 0.502
5p12 rs10054519 43,444,233 A G CGR g 0.995 377 265 0.474 0.467 0.96 (0.75-1.22) 7.23x10⁻¹
PANDoRA g 1 3803 1802 0.480 0.492 1.05 (0.97-1.15) 1.74x10⁻¹
CALGB i 0.99 376 306 0.491 0.533 1.22 (0.97-1.54) 8.30x10⁻²
Combinedd
4556 2373
1.06 (0.99-1.15) 9.64x10⁻² 0.331
9q34.2 rs4962153 136,323,754 A G CGR g 0.791 377 267 0.160 0.202 1.45 (1.03-2.04) 3.12x10⁻²
PANDoRA g 1 3671 1725 0.162 0.183 1.16 (1.04-1.30) 6.36x10⁻³
CALGB i 0.633 376 306 0.168 0.196 1.28 (0.89-1.85) 1.73x10⁻¹
Combinedd
4424 2298
1.2 (1.09-1.33) 4.44x10⁻⁴ 0.458
7q36.3 rs167020 155,619,733 A G CGR g 1 378 269 0.283 0.250 0.85 (0.64-1.11) 2.33x10⁻¹
PANDoRA g 1 3975 1805 0.304 0.285 0.88 (0.81-0.97) 1.10x10⁻²
CALGB g 1 377 307 0.280 0.293 1.10 (0.85-1.41) 4.55x10⁻¹
Combinedd 4730 2381 0.91 (0.83-0.98) 1.69x10⁻² 0.255
Results from unconditional logistic regression of genotypes in participants from the replication studies. aPosition of SNP in NCBI genome build 37 (Hg19). bCategory: i=imputed,
g=genotyped. cInfo: imputation information content. dCombined meta-analysis results for the replication studies. ePer allele OR for the minor allele adjusted for age, sex, and study. f1 d.f.
score test. gP value for heterogeneity.
Nature Genetics: doi:10.1038/ng.3052

Supplemental Table 7. Chromosomal regions of newly implicated pancreatic cancer susceptibility loci
Chr Index
SNP Positiona Nearest geneb
Genes located within chromosomal
regionc
Genes
implicated in
glucose
homeostasis
Previously identified GWAS
SNPs within chromosomal
region and r2>0.2 with index
SNPd
r2 with index
SNPe Associated disease or traitd
5p15.33 rs2736098 1,294,086 TERT (synonymous)
ZDHHC11, BRD9, TRIP13, LOC100506688, NKD2, SLC12A7,
MIR4635, SLC6A19, SLC6A18,
TERT, MIR4457, CLPTM1L, SLC6A3, LPCAT1, SDHAP3,
LOC728613, MIR4277
rs2853677
rs4975616 rs401681
0.229
0.236 0.216
Lung adenocarcinoma
Lung cancer Melanoma, PSA level,
Bladder cancer, Pancreatic
cancer, Lung cancer
7q32.3 rs6971499 130,680,521 LINC-PINT (intronic)
COPG2, TSGA13, KLF14, MIR29A,
MIR29B1, LOC646329, LINC-PINT,
MKLN1
KLF1419
16q23.1 rs7190458 75,263,661 BCAR1 (synonymous)
FA2H, WDR59, ZNFR1, LDHD, ZFP1, CTRB2, CTRB1, BCAR1,
CFDP1, TMEM170A, CHST6,
CHST5, TMEM231, GABARAPL2, ADAT1, KARS, TERF21P
rs7202877 0.322 Type 1 diabetes
13q12.2 rs9581943 28,493,997 PDX1 (171 bp)
GSX1, PDX1-AS1, PDX1, ATP5EP2,
CDX2, URAD, FLT3, PAN3-AS1,
PAN3
PDX-131-33 rs2293941 0.201 Fasting glucose related traits
22q12.1 rs16986825 29,300,306 ZNRF3 (intronic)
TTC28, CHEK2, HSCB, CCDC117,
XBP1, ZNRF3, ZNRF3-AS1,
C22orf31, KREMEN1, EMID1, RHBDD3, EWSR1, GAS2L1,
RASL10A, AP1B1, MIR3653,
SNORD125
XBP179 rs2239815 rs4823006
0.486 0.221
Esophageal SCC Waist-hip ratio
8q24.21 rs1561927 129,568,078 MIR1208 (406 kb) PVT1, MIR1208 rs10088218 rs6651252
0.373 0.373
Ovarian cancer Crohn's disease
aPosition of SNP in NCBI Genome Build 37 (Hg19). bThe RefSeq gene within which the index SNP is located. For SNPs not located within a gene, the nearest gene is provided with distance to index SNP in parentheses. cGenes within the chromosomal region of 1 MB flanking the index SNP. dData from the NHGRI GWAS catalogue and UCSC Genome Browser. er2 LD values from 1000 Genomes Project CEU data.
Chr: chromosome and band.
Nature Genetics: doi:10.1038/ng.3052

Supplementary Table 8. Association results for five new pancreatic cancer susceptibility loci and one
suggestive locus stratified by geographic region
SNP Chr Subgroupa Cases Controls OR (95% CI) Pc PHet I2
rs2736098 5p15.33 Region US 3907 7146 0.79 (0.73-0.86) 4.50 x 10⁻⁸
Region CNE 1100 1177 0.84 (0.71-1.00) 0.051
Region SEb
Combined 5007 8323 0.80 (0.74-0.86) 8.06 x 10⁻⁹ 0.499 0
rs6971499 7q32.3 Region US 3916 7203 0.79 (0.71-0.86) 2.88 x 10⁻⁷
Region CNE 1100 1192 0.78 (0.64-0.96) 0.020
Region SE 89 445 0.99 (0.56-1.75) 0.982
Combined 5105 8840 0.79 (0.72-0.85) 2.43 x 10⁻⁸ 0.731 0
rs7190458 16q23.1 Region US 3915 7191 1.52 (1.27-1.82) 4.56 x 10⁻⁶
Region CNE 1100 1190 1.49 (1.08-2.08) 0.016
Region SE 89 445 1.72 (0.85-3.57) 0.130
Combined 5104 8826 1.52 (1.30-1.75) 7.25 x 10⁻⁸ 0.928 0
rs9581943 13q12.2 Region US 3914 7197 1.18 (1.11-1.27) 2.10 x 10⁻⁷
Region CNE 1100 1191 1.05 (0.93-1.19) 0.434
Region SE 89 445 1.10 (0.76-1.59) 0.611
Combined 5103 8833 1.15 (1.09-1.22) 5.22 x 10⁻⁷ 0.265 24.63
rs16986825 22q12.1 Region US 3914 7161 1.17 (1.08-1.28) 2.00 x 10⁻⁴
Region CNE 1101 1191 1.18 (0.99-1.39) 0.059
Region SE 89 445 1.67 (1.07-2.60) 0.025
Combined 5104 8797 1.19 (1.10-1.28) 7.20 x 10⁻⁶ 0.320 12.28
rs1561927 8q24.21 Region US 3896 7121 0.85 (0.79-0.91) 7.86 x 10⁻⁶
Region CNE 1094 1158 0.93 (0.80-1.08) 0.317
Region SE 88 443 1.06 (0.71-1.59) 0.757
Combined 5078 8722 0.87 (0.81-0.93) 1.37 x 10⁻⁵ 0.340 7.28
Results from unconditional logistic regression of genotypes in participants from Stage 1 and Stage 2 stratified by geographic region. aRegions include, US: The United States, CNE: Central and Northern Europe and SE: Southern
Europe. Participants from Region SE were only available from stage 1. brs2736098 was not polymorphic in subjects
from Region SE. c1 d.f. score test. Chr: chromosome and band; OR, per-allele OR for the minor allele adjusted for age, sex and significant principal components for Stage 1; per-allele OR adjusted for age, sex and significant
principal components for Stage 2. The analysis was performed separately in subjects from each geographic region
followed by meta-analysis (results shown in bold). PHet: heterogeneity P-value; I2: heterogeneity statistic.
Nature Genetics: doi:10.1038/ng.3052

Supplementary Table 9: Association results for five new pancreatic cancer susceptibility loci and one suggestive locus
stratified by smoking status.
SNP Chr Subgroupa Cases Controls OR (95% CI) Pb PHet I2 PInt
rs2736098 5p15.33 Smoker 2580 4177 0.86 (0.78-0.96) 6.56 x 10⁻³
Nonsmoker 1601 3035 0.79 (0.70-0.90) 3.16 x 10⁻⁴
Combined 4181 7212 0.83 (0.77-0.90) 1.11 x 10⁻⁵ 0.305 5.00 0.355
rs6971499 7q32.3 Smoker 2633 4539 0.83 (0.74-0.93) 1.94 x 10⁻³
Nonsmoker 1642 3185 0.79 (0.69-0.91) 1.05 x 10⁻³
Combined 4275 7724 0.81 (0.75-0.89) 7.18 x 10⁻⁶ 0.663 0 0.469
rs7190458 16q23.1 Smoker 2633 4534 1.49 (1.20-1.82) 1.88 x 10⁻⁴
Nonsmoker 1641 3179 1.79 (1.41-2.33) 4.17 x 10⁻⁶
Combined 4274 7713 1.61 (1.37-1.89) 6.13 x 10⁻⁹ 0.247 25.37 0.262
rs9581943 13q12.2 Smoker 2632 4537 1.15 (1.06-1.23) 5.94 x 10⁻⁴
Nonsmoker 1641 3180 1.14 (1.04-1.25) 6.74 x 10⁻³
Combined 4273 7717 1.15 (1.08-1.22) 1.23 x 10⁻⁵ 0.924 0 0.894
rs16986825 22q12.1 Smoker 2632 4516 1.19 (1.08-1.32) 8.46 x 10⁻⁴
Nonsmoker 1641 3164 1.21 (1.06-1.37) 3.75 x 10⁻³
Combined 4273 7680 1.20 (1.11-1.30) 1.00 x 10⁻⁵ 0.878 0 0.941
rs1561927 8q24.21 Smoker 2620 4479 0.89 (0.81-0.97) 0.011
Nonsmoker 1633 3131 0.86 (0.77-0.95) 5.54 x 10⁻³ Combined 4253 7610 0.88 (0.82-0.94) 2.00 x 10⁻⁴ 0.604 0 0.499
Results from unconditional logistic regression of genotypes in participants from Stage 1 and Stage 2 stratified by smoking status. aSmoker: current and past smokers; Nonsmoker: never smokers. b1 d.f. score test. Chr: chromosome and band; OR,
per-allele OR for the minor allele adjusted for age, sex, geographic region and significant principal components for Stage 1;
per-allele OR adjusted for age, sex, study, arm and significant principal components for Stage 2. The analysis was performed separately in smokers and nonsmokers followed by meta-analysis (results shown in bold). PHet: heterogeneity P-value; I2:
heterogeneity statistic; PInt: interaction P-value.
Nature Genetics: doi:10.1038/ng.3052
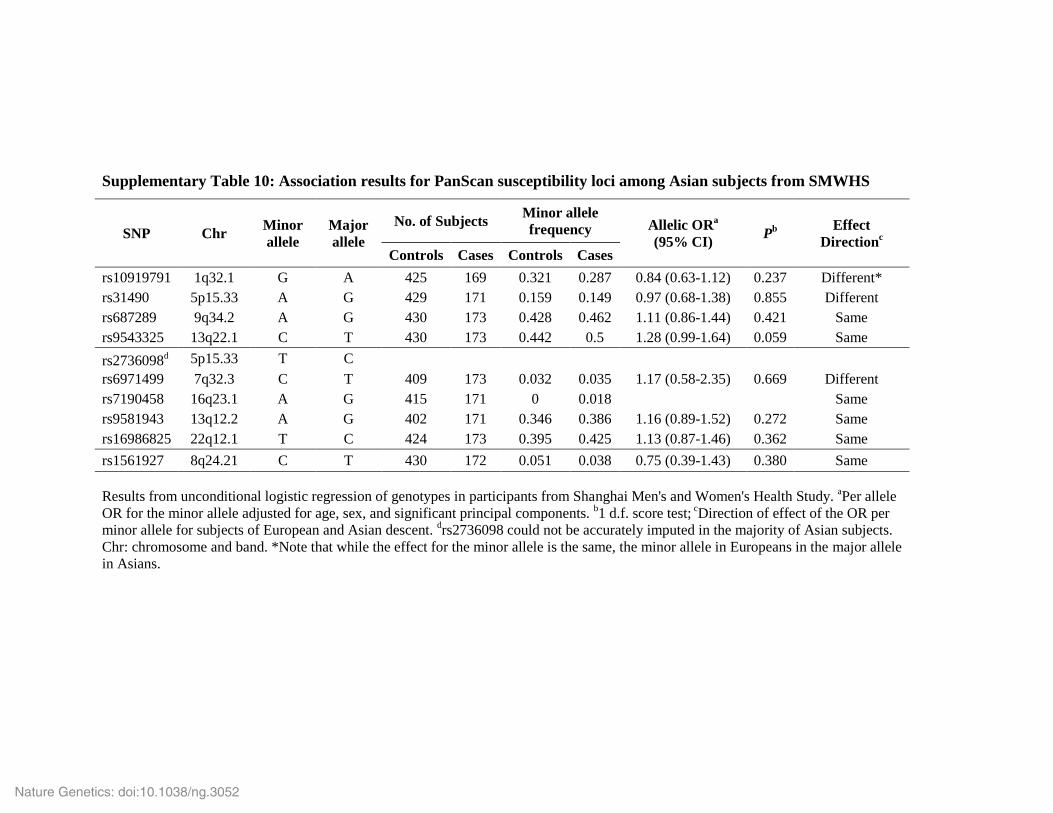
Supplementary Table 10: Association results for PanScan susceptibility loci among Asian subjects from SMWHS
SNP Chr Minor
allele
Major
allele
No. of Subjects Minor allele
frequency Allelic ORa
(95% CI) P
b
Effect
Directionc
Controls Cases Controls Cases
rs10919791 1q32.1 G A 425 169 0.321 0.287 0.84 (0.63-1.12) 0.237 Different*
rs31490 5p15.33 A G 429 171 0.159 0.149 0.97 (0.68-1.38) 0.855 Different
rs687289 9q34.2 A G 430 173 0.428 0.462 1.11 (0.86-1.44) 0.421 Same
rs9543325 13q22.1 C T 430 173 0.442 0.5 1.28 (0.99-1.64) 0.059 Same
rs2736098d 5p15.33 T C
rs6971499 7q32.3 C T 409 173 0.032 0.035 1.17 (0.58-2.35) 0.669 Different
rs7190458 16q23.1 A G 415 171 0 0.018
Same
rs9581943 13q12.2 A G 402 171 0.346 0.386 1.16 (0.89-1.52) 0.272 Same
rs16986825 22q12.1 T C 424 173 0.395 0.425 1.13 (0.87-1.46) 0.362 Same
rs1561927 8q24.21 C T 430 172 0.051 0.038 0.75 (0.39-1.43) 0.380 Same
Results from unconditional logistic regression of genotypes in participants from Shanghai Men's and Women's Health Study. aPer allele
OR for the minor allele adjusted for age, sex, and significant principal components. b1 d.f. score test;
cDirection of effect of the OR per
minor allele for subjects of European and Asian descent. drs2736098 could not be accurately imputed in the majority of Asian subjects.
Chr: chromosome and band. *Note that while the effect for the minor allele is the same, the minor allele in Europeans in the major allele
in Asians.
Nature Genetics: doi:10.1038/ng.3052
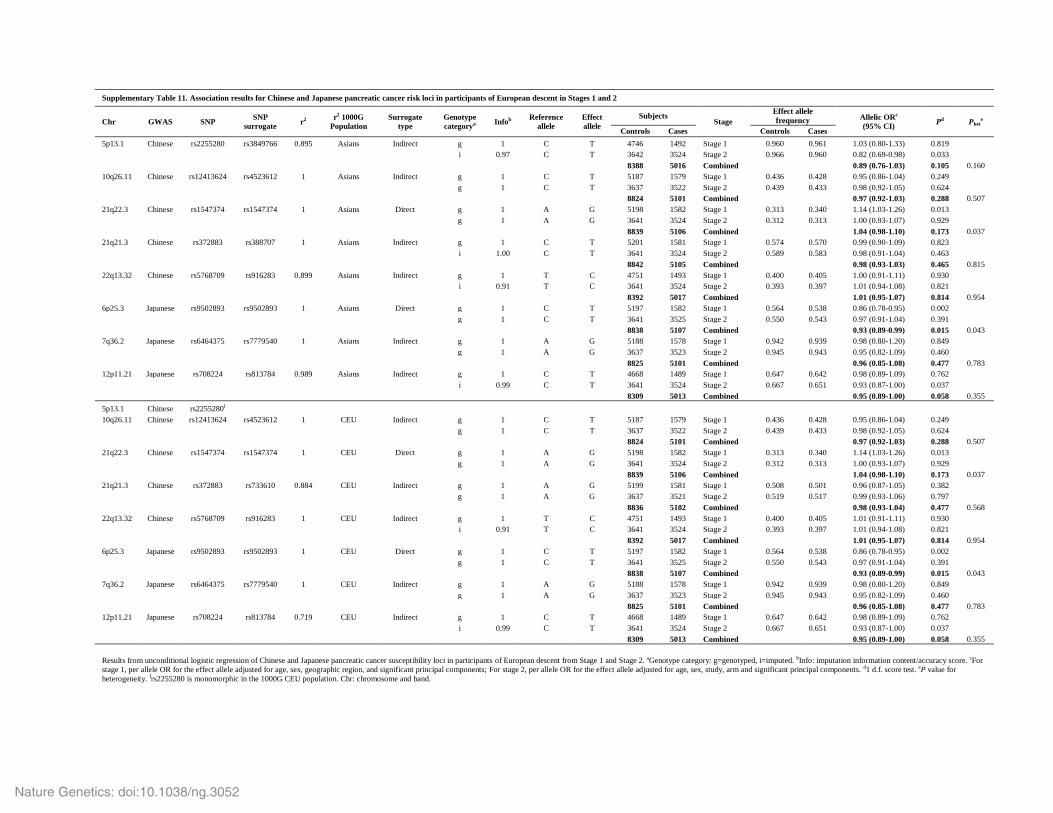
Supplementary Table 11. Association results for Chinese and Japanese pancreatic cancer risk loci in participants of European descent in Stages 1 and 2
Chr GWAS SNP SNP
surrogate r2
r2 1000G
Population
Surrogate
type
Genotype
categorya Infob
Reference
allele
Effect
allele
Subjects Stage
Effect allele
frequency Allelic ORc
(95% CI) Pd Phet
e
Controls Cases Controls Cases
5p13.1 Chinese rs2255280 rs3849766 0.895 Asians Indirect g 1 C T 4746 1492 Stage 1 0.960 0.961 1.03 (0.80-1.33) 0.819
i 0.97 C T 3642 3524 Stage 2 0.966 0.960 0.82 (0.69-0.98) 0.033
8388 5016 Combined
0.89 (0.76-1.03) 0.105 0.160
10q26.11 Chinese rs12413624 rs4523612 1 Asians Indirect g 1 C T 5187 1579 Stage 1 0.436 0.428 0.95 (0.86-1.04) 0.249
g 1 C T 3637 3522 Stage 2 0.439 0.433 0.98 (0.92-1.05) 0.624
8824 5101 Combined
0.97 (0.92-1.03) 0.288 0.507
21q22.3 Chinese rs1547374 rs1547374 1 Asians Direct g 1 A G 5198 1582 Stage 1 0.313 0.340 1.14 (1.03-1.26) 0.013
g 1 A G 3641 3524 Stage 2 0.312 0.313 1.00 (0.93-1.07) 0.929
8839 5106 Combined
1.04 (0.98-1.10) 0.173 0.037
21q21.3 Chinese rs372883 rs388707 1 Asians Indirect g 1 C T 5201 1581 Stage 1 0.574 0.570 0.99 (0.90-1.09) 0.823
i 1.00 C T 3641 3524 Stage 2 0.589 0.583 0.98 (0.91-1.04) 0.463
8842 5105 Combined
0.98 (0.93-1.03) 0.465 0.815
22q13.32 Chinese rs5768709 rs916283 0.899 Asians Indirect g 1 T C 4751 1493 Stage 1 0.400 0.405 1.00 (0.91-1.11) 0.930
i 0.91 T C 3641 3524 Stage 2 0.393 0.397 1.01 (0.94-1.08) 0.821
8392 5017 Combined
1.01 (0.95-1.07) 0.814 0.954
6p25.3 Japanese rs9502893 rs9502893 1 Asians Direct g 1 C T 5197 1582 Stage 1 0.564 0.538 0.86 (0.78-0.95) 0.002
g 1 C T 3641 3525 Stage 2 0.550 0.543 0.97 (0.91-1.04) 0.391
8838 5107 Combined
0.93 (0.89-0.99) 0.015 0.043
7q36.2 Japanese rs6464375 rs7779540 1 Asians Indirect g 1 A G 5188 1578 Stage 1 0.942 0.939 0.98 (0.80-1.20) 0.849
g 1 A G 3637 3523 Stage 2 0.945 0.943 0.95 (0.82-1.09) 0.460
8825 5101 Combined
0.96 (0.85-1.08) 0.477 0.783
12p11.21 Japanese rs708224 rs813784 0.989 Asians Indirect g 1 C T 4668 1489 Stage 1 0.647 0.642 0.98 (0.89-1.09) 0.762
i 0.99 C T 3641 3524 Stage 2 0.667 0.651 0.93 (0.87-1.00) 0.037
8309 5013 Combined 0.95 (0.89-1.00) 0.058 0.355
5p13.1 Chinese rs2255280f
10q26.11 Chinese rs12413624 rs4523612 1 CEU Indirect g 1 C T 5187 1579 Stage 1 0.436 0.428 0.95 (0.86-1.04) 0.249
g 1 C T 3637 3522 Stage 2 0.439 0.433 0.98 (0.92-1.05) 0.624
8824 5101 Combined
0.97 (0.92-1.03) 0.288 0.507
21q22.3 Chinese rs1547374 rs1547374 1 CEU Direct g 1 A G 5198 1582 Stage 1 0.313 0.340 1.14 (1.03-1.26) 0.013
g 1 A G 3641 3524 Stage 2 0.312 0.313 1.00 (0.93-1.07) 0.929
8839 5106 Combined
1.04 (0.98-1.10) 0.173 0.037
21q21.3 Chinese rs372883 rs733610 0.884 CEU Indirect g 1 A G 5199 1581 Stage 1 0.508 0.501 0.96 (0.87-1.05) 0.382
g 1 A G 3637 3521 Stage 2 0.519 0.517 0.99 (0.93-1.06) 0.797
8836 5102 Combined
0.98 (0.93-1.04) 0.477 0.568
22q13.32 Chinese rs5768709 rs916283 1 CEU Indirect g 1 T C 4751 1493 Stage 1 0.400 0.405 1.01 (0.91-1.11) 0.930
i 0.91 T C 3641 3524 Stage 2 0.393 0.397 1.01 (0.94-1.08) 0.821
8392 5017 Combined
1.01 (0.95-1.07) 0.814 0.954
6p25.3 Japanese rs9502893 rs9502893 1 CEU Direct g 1 C T 5197 1582 Stage 1 0.564 0.538 0.86 (0.78-0.95) 0.002
g 1 C T 3641 3525 Stage 2 0.550 0.543 0.97 (0.91-1.04) 0.391
8838 5107 Combined
0.93 (0.89-0.99) 0.015 0.043
7q36.2 Japanese rs6464375 rs7779540 1 CEU Indirect g 1 A G 5188 1578 Stage 1 0.942 0.939 0.98 (0.80-1.20) 0.849
g 1 A G 3637 3523 Stage 2 0.945 0.943 0.95 (0.82-1.09) 0.460
8825 5101 Combined
0.96 (0.85-1.08) 0.477 0.783
12p11.21 Japanese rs708224 rs813784 0.719 CEU Indirect g 1 C T 4668 1489 Stage 1 0.647 0.642 0.98 (0.89-1.09) 0.762
i 0.99 C T 3641 3524 Stage 2 0.667 0.651 0.93 (0.87-1.00) 0.037
8309 5013 Combined 0.95 (0.89-1.00) 0.058 0.355
Results from unconditional logistic regression of Chinese and Japanese pancreatic cancer susceptibility loci in participants of European descent from Stage 1 and Stage 2. aGenotype category: g=genotyped, i=imputed. bInfo: imputation information content/accuracy score. cFor
stage 1, per allele OR for the effect allele adjusted for age, sex, geographic region, and significant principal components; For stage 2, per allele OR for the effect allele adjusted for age, sex, study, arm and significant principal components. d1 d.f. score test. eP value for
heterogeneity. frs2255280 is monomorphic in the 1000G CEU population. Chr: chromosome and band.
Nature Genetics: doi:10.1038/ng.3052
(r²) (D') freq freq freq freq cons histone marks histone marks bound changed genes func annot
5 1294086 1 1 rs2736098 C T 0.06 0.2 0.33 0.23 H1 H1-hESC,Myometr 9 TERT synonymous
5 1295349 0.74 0.98 rs2853669 A G 0.08 0.23 0.31 0.29 HepG2, H1 GM12878 GM12892,Huh-7,Ishikawa POL2 7 164bp 5' of TERT
5 1297075 0.65 0.81 rs201878870 CCA C 0.07 0.2 0.23 0.24 21 1.9kb 5' of TERT
5 1297077 0.73 0.94 rs145544133 ACC A 0.07 0.21 0.24 0.27 19 1.9kb 5' of TERT
5 1297081 0.73 0.93 rs201578885 CCA C 0.06 0.19 0.24 0.27 22 1.9kb 5' of TERT
5 1297488 0.75 0.97 rs2736108 C T 0.07 0.23 0.26 0.28 10 cell types EBF1 HEN1,Zfp161 2.3kb 5' of TERT
5 1297854 0.65 0.86 rs2736107 C T 0.07 0.22 0.22 0.26 ERalpha-a,GATA,RXRA 2.7kb 5' of TERT
7 130676942 0.84 0.96 rs28651880 C T 0.15 0.11 0.04 0.13 NHLF iPS,Adult_CD4_Th0 ATF3,ERalpha-a LINC-PINT intronic
7 130677808 0.76 0.91 rs111819262 G A 0.15 0.1 0.04 0.11 7 LINC-PINT intronic
7 130680521 1 1 rs6971499 T C 0.15 0.11 0.04 0.12 5 cell types 8 cell types TCF4 4 LINC-PINT intronic
7 130681773 1 1 rs6970779 G A 0.15 0.11 0.04 0.12 Huvec, GM12878 5 cell types 34 cell types 14 5 LINC-PINT intronic
7 130689908 0.99 1 rs10248190 T A 0.14 0.11 0.04 0.12 5 LINC-PINT intronic
7 130690134 0.98 1 rs28405257 C T 0.14 0.11 0.04 0.13 LINC-PINT intronic
7 130690299 0.98 1 rs28413549 C T 0.14 0.11 0.04 0.13 LINC-PINT intronic
7 130690892 0.86 0.94 rs10252282 T C 0.14 0.11 0.04 0.12 Pax-4 LINC-PINT intronic
7 130691182 0.91 0.96 rs10237038 C T 0.15 0.11 0.06 0.13 7 LINC-PINT intronic
16 75263661 1 1 rs7190458 G A 0.26 0.08 0.03 0.04 Caco-2 TAF1 p300 BCAR1 synonymous CFDP1 5.78E-07
13 28461726 0.93 0.98 rs61652270 C T 0.13 0.29 0.39 0.43 3 PDX1-AS1
13 28461789 0.93 0.98 rs60004782 G A 0.13 0.28 0.39 0.43 4 PDX1-AS1
13 28462132 0.93 0.97 rs9554188 G A 0.13 0.28 0.39 0.42 ATF3,Pax-5 PDX1-AS1
13 28462645 0.93 0.98 rs9581927 G T 0.13 0.28 0.39 0.43 Ik-1,VDR PDX1-AS1
13 28464201 0.94 0.97 rs201776782 TAC T 0.1 0.28 0.38 0.42 8 PDX1-AS1
13 28464203 0.95 0.98 rs9581929 C T 0.09 0.28 0.39 0.42 6 PDX1-AS1
13 28466090 0.95 0.98 rs7985481 A C 0.17 0.29 0.39 0.42 5 PDX1-AS1
13 28468222 0.95 0.98 rs9581931 A G 0.14 0.29 0.39 0.42 Evi-1 PDX1-AS1
13 28470544 0.95 0.98 rs4424773 C G 0.14 0.29 0.39 0.42 8 PDX1-AS1
13 28471366 0.95 0.98 rs9554193 G A 0.14 0.29 0.39 0.42 5 PDX1-AS1
13 28472724 0.95 0.98 rs7995917 T C 0.15 0.29 0.39 0.42 Hoxa9,Hoxb8,Hoxb9 PDX1-AS1
13 28474236 0.89 0.97 rs199990582 TC T 0.15 0.28 0.38 0.41 7 PDX1-AS1
13 28476277 0.96 0.99 rs7993114 A G 0.16 0.29 0.38 0.42 TCF12 PDX1-AS1 POMP 1.6/1.2 Skin/Liver
13 28476911 0.96 0.99 rs11618581 G A 0.16 0.29 0.38 0.42 ATF3,ZEB1 PDX1-AS1 POMP 1.7/1.2 Skin/Liver
13 28476978 0.95 0.99 rs9554197 C T 0.16 0.28 0.38 0.43 6 PDX1-AS1 POMP 1.7/1.2 Skin/Liver
13 28477058 0.96 0.99 rs11618036 T C 0.16 0.29 0.38 0.42 ERalpha-a,RXRA PDX1-AS1
13 28477111 0.92 0.97 rs11618832 G A 0.16 0.29 0.38 0.41 GATA,LUN-1,STAT PDX1-AS1
13 28477117 0.92 0.97 rs11616678 C T 0.16 0.29 0.38 0.42 PDX1-AS1
13 28477149 0.96 0.99 rs11618052 T C 0.16 0.29 0.38 0.42 Mef2,Pou2f2 PDX1-AS1
13 28477268 0.96 0.99 rs9579127 A G 0.16 0.29 0.38 0.42 Zbtb3 PDX1-AS1
13 28477401 0.96 0.99 rs7999100 C A 0.16 0.29 0.38 0.42 HDAC2,p300 PDX1-AS1 POMP 1.7/1.2 Skin/Liver
13 28477590 0.96 0.99 rs8000004 A G 0.16 0.29 0.38 0.42 5 PDX1-AS1 POMP 1.7/1.2 Skin/Liver
13 28481938 0.96 0.99 rs9579128 T C 0.13 0.28 0.38 0.42 HepG2 4 PDX1-AS1 POMP 1.7/1.3 Skin/Liver
13 28490211 0.97 0.99 rs2297316 G A 0.09 0.28 0.36 0.42 Huvec HMEC 5 cell types 4 PDX1-AS1
13 28493997 1 1 rs9581943 G A 0.09 0.28 0.38 0.42 5 cell types 24 cell types 7 5 PDX1-AS1, PDX1
Supplementary Table 12. Genomic and functional support for newly discovered and suggestive pancreatic cancer risk alleles and their correlated (r2≥0.7) surrogate SNPs
dbSNPREFSEQ or GENCODEMotifsProteinsDNAse
PromoterSiPhyAFR
Cis Gene
Blood eQTL
Cis P value Cis P value
ASN EURRefpos (hg19)SNP/Chr
AMRMuTHER eQTL
Cis GeneAltvariant
Enhancer
Gene neg log 10 P Tissue
LD
rs2736098
rs6971499
rs7190458
rs9581943
Nature Genetics: doi:10.1038/ng.3052

22 29178856 0.65 0.86 rs5752796 G A 0.03 0.08 0.17 0.14 HepG2 9 CCDC117 intronic
22 29181302 0.65 0.87 rs5762794 G A 0.01 0.08 0.2 0.14 HepG2 LUN-1 CCDC117 intronic
22 29185096 0.65 0.87 rs140242933 TAAG T 0.03 0.08 0.17 0.14 6 CCDC117
22 29185113 0.65 0.87 rs1222 A C 0.04 0.08 0.17 0.14 Foxd3,Maf,NRSF CCDC117 3'-UTR CCDC117 5 Liver CCDC117 9.93E-09 XBP1 1.37E-05
22 29190471 0.65 0.87 rs2267131 T C 0.03 0.08 0.17 0.14 Medullo,CMK POL2 4 71bp 3' of XBP1 CCDC117 4.9 Liver CCDC117 9.08E-09 XBP1 1.14E-05
22 29194797 0.65 0.87 rs34718288 C G 0.03 0.08 0.17 0.14 5 cell types 4 cell types GM12878,CMK AIRE,Ets,NF-kappaB XBP1 intronic
22 29196843 0.67 0.89 rs2269578 G C 0.01 0.08 0.17 0.14 9 cell types 18 cell types 9 TCF12 CTA-292E10.6
22 29200117 0.67 0.89 rs5762812 T C 0.01 0.08 0.17 0.14 HepG2 DMRT2,Sox CTA-292E10.6
22 29203964 0.67 0.89 rs5762814 G A 0.08 0.09 0.17 0.14 HepG2 LNCaP CTA-292E10.6 CCDC117 5.1 Liver CCDC117 9.03E-09 XBP1 1.17E-05
22 29204608 0.67 0.89 rs5752802 A G 0.03 0.08 0.17 0.14 HepG2, K562, Huvec 10 CTA-292E10.6
22 29205004 0.67 0.89 rs5752803 G A 0.03 0.08 0.17 0.14 HepG2, Huvec 3 cell types 13 7 CTA-292E10.6 CCDC117 4.8 Liver CCDC117 9.95E-09 XBP1 1.24E-05
22 29206209 0.67 0.89 rs5762816 T C 0.01 0.08 0.17 0.14 3 cell types HMG-IY CTA-292E10.6 CCDC117 4.8 Liver CCDC117 1.00E-08 XBP1 1.24E-05
22 29207296 0.67 0.89 rs5762817 G A 0.11 0.09 0.17 0.14 Huvec 4 cell types 8 cell types 9 NRSF,SETDB1 CTA-292E10.6
22 29208975 0.67 0.89 rs16987024 A G 0.03 0.08 0.17 0.14 HepG2, GM12878 LRH1 CTA-292E10.6
22 29211435 0.67 0.89 rs5762818 C T 0.03 0.08 0.17 0.14 HepG2 4 CTA-292E10.6
22 29212198 0.66 0.88 rs71327317 C T 0.03 0.08 0.17 0.14 HepG2 18 CTA-292E10.6
22 29213034 0.67 0.89 rs28458474 A G 0.03 0.08 0.17 0.14 HepG2, GM12878 EBF,HDAC2 CTA-292E10.6
22 29214606 0.67 0.89 rs2301428 G C 0.01 0.08 0.17 0.14 4 cell types 16 cell types 12 11 CTA-292E10.6 CCDC117 4.8 Liver CCDC117 1.02E-08 XBP1 1.14E-05
22 29215703 0.67 0.89 rs16987027 G A 0.03 0.09 0.17 0.14 HepG2, GM12878 9 cell types 15 6 CTA-292E10.6
22 29215803 0.67 0.89 rs66471734 G A 0.03 0.08 0.17 0.14 HepG2, GM12878 5 cell types 12 STAT,TCF12 CTA-292E10.6
22 29216585 0.67 0.89 rs35017742 C T 0.02 0.08 0.17 0.14 GM12878, HepG2 Zbtb3 CTA-292E10.6
22 29216776 0.67 0.89 rs5762819 G A 0.03 0.08 0.17 0.14 GM12878, HepG2 Nkx2,Pax-2 CTA-292E10.6
22 29216813 0.67 0.89 rs5762820 C T 0.04 0.09 0.17 0.14 GM12878, HepG2 CHOP::CEBPalpha,YY1 CTA-292E10.6
22 29219472 0.67 0.89 rs5762821 G A 0.03 0.08 0.17 0.14 3 cell types NH-A Zec CTA-292E10.6
22 29220483 0.67 0.89 rs5752806 G T 0.01 0.08 0.17 0.14 HepG2 7 CTA-292E10.6
22 29220758 0.67 0.89 rs5762823 C G 0.03 0.08 0.17 0.14 HepG2 LXR,Zbtb3 CTA-292E10.6
22 29225592 0.68 0.9 rs5752811 C G 0.03 0.08 0.17 0.14 HepG2 91 cell types 16 CTA-292E10.6
22 29234537 0.68 0.9 rs2881634 A G 0.01 0.07 0.17 0.14 AP-1 CTA-292E10.6
22 29235973 0.68 0.9 rs5752816 G A 0.01 0.08 0.17 0.14 HepG2 Irf,SP1,THAP1 CTA-292E10.6
22 29237958 0.68 0.9 rs60468718 C G 0.01 0.08 0.17 0.14 Hoxa5,SP1,Znf143 CTA-292E10.6
22 29247097 0.75 0.94 rs5762857 A G 0.01 0.08 0.17 0.14 COMP1,Foxl1,GR 2.5kb 3' of CTA CCDC117 4.7 Liver CCDC117 6.70E-09 XBP1 1.13E-05
22 29250505 0.65 0.96 rs5762861 T G 0.48 0.22 0.53 0.21 Dobox4,IRC900814 6kb 3' of CTA CCDC117 9.07E-05 XBP1 5.08E-25
22 29252732 0.65 0.96 rs5762862 G A 0.47 0.22 0.53 0.21 HepG2, K562 HCT-116 Ets,Nkx6-2,Pax-4 8.2kb 3' of CTA CCDC117 5.51E-05 XBP1 1.65E-19
22 29256093 0.74 0.94 rs34206997 T A 0.01 0.07 0.17 0.13 ERalpha-a,HNF4,RFX5 12kb 3' of CTA
22 29258140 0.68 0.88 rs9625612 T A 0.17 0.08 0.23 0.14 13 14kb 3' of CTA
22 29259102 0.74 0.94 rs13053879 T A 0.01 0.07 0.16 0.13 HepG2 15kb 3' of CTA CCDC117 4.9 Liver CCDC117 2.15E-08 XBP1 5.82E-06
22 29264953 0.82 0.99 rs2347448 C T 0.01 0.07 0.16 0.13 Pax-4,SIRT6,p53 15kb 5' of ZNRF3
22 29271088 0.82 0.99 rs73170679 G T 0.01 0.07 0.16 0.13 HepG2 3 cell types 4 8.5kb 5' of ZNRF3
22 29273966 0.82 0.99 rs13058031 G A 0.01 0.08 0.16 0.13 LNCaP,CD34+_Mobilized 5 5.6kb 5' of ZNRF3 CCDC117 5 Liver CCDC117 1.10E-07 XBP1 5.05E-06
22 29285148 0.82 0.99 rs35814864 T C 0.01 0.07 0.16 0.13 FAC1 ZNRF3 intronic
22 29286405 0.82 0.99 rs35050306 G A 0.01 0.07 0.16 0.13 4 ZNRF3 intronic
22 29293162 0.83 1 rs59224170 G C 0.01 0.07 0.16 0.13 4 cell types Myf ZNRF3 intronic
22 29293369 0.83 1 rs59203761 C T 0.01 0.07 0.16 0.13 4 cell types 4 ZNRF3 intronic
22 29300306 1 1 rs16986825 C T 0.01 0.17 0.4 0.16 NHEK, HMEC, NHLF 27 cell types Hsf,Nkx2 ZNRF3 intronic CCDC117 3.9 Liver CCDC117 5.99E-05 XBP1 3.40E-10
22 29308414 0.99 1 rs916332 C T 0.01 0.17 0.41 0.16 K562, HepG2, NHLF 8 cell types TCF4 4 ZNRF3 intronic
22 29311271 0.99 1 rs739196 G A 0.01 0.17 0.41 0.16 HepG2 Osteobl 4 ZNRF3 intronic CCDC117 3.8 Liver CCDC117 5.68E-05 XBP1 7.71E-10
22 29312578 0.99 1 rs16986838 C T 0.01 0.17 0.41 0.16 HepG2 3 cell types 4 ZNRF3 intronic CCDC117 3.8 Liver CCDC117 4.95E-05 XBP1 2.76E-10
22 29327347 0.72 0.94 rs71327329 A G 0.01 0.07 0.15 0.13 HepG2 Dlx2,Irf,Msx2 ZNRF3 intronic
22 29338656 0.88 0.95 rs28360615 G C 0.01 0.17 0.41 0.16 HepG2 Fibrobl FXR ZNRF3 intronic
22 29343188 0.88 0.95 rs16986861 G C 0.01 0.17 0.41 0.16 Osteobl SETDB1 ZNRF3 intronic CCDC117 3.8 Liver CCDC117 5.65E-05 XBP1 2.21E-09
22 29347215 0.88 0.95 rs34578331 G T 0.01 0.17 0.41 0.16 CTCF RXRA ZNRF3 intronic
22 29349306 0.88 0.95 rs13056243 C T 0.01 0.17 0.41 0.16 HepG2, H1 ZNRF3 intronic CCDC117 3.8 Liver CCDC117 5.79E-05 XBP1 2.27E-09
22 29350911 0.88 0.95 rs16986864 G T 0.01 0.17 0.41 0.16 Th1 4 ZNRF3 intronic CCDC117 3.8 Liver CCDC117 4.67E-05 XBP1 1.35E-08
22 29352495 0.85 0.93 rs4055 A C 0.01 0.17 0.42 0.16 GM12878 GM12878,8988T SIX5 ZNRF3 intronic CCDC117 3.7 Liver CCDC117 4.55E-05 XBP1 1.46E-08
22 29353630 0.83 0.91 rs13058453 T C 0.02 0.17 0.42 0.16 GR ZNRF3 intronic
8 129534534 0.68 -0.83 rs72724789 G A 0.47 0.27 0.01 0.25 9
8 129535877 0.78 -0.93 rs199804567 G 10-mer 0.65 0.31 0.03 0.27 4
8 129538595 0.78 -0.93 rs6995732 T C 0.65 0.31 0.03 0.27 HepG2 6
8 129547378 0.78 0.98 rs12676584 G A 0.36 0.69 0.97 0.71 CTCF,Rad21
8 129552344 0.93 -0.98 rs7824269 C T 0.63 0.3 0.03 0.25 5 cell types 4 cell types USF1 FXR,Pou3f1 PVT1 1.5 Adipose
8 129558351 0.97 -0.99 rs7819154 C A 0.61 0.3 0.03 0.25 COMP1 PVT1 1.6 Adipose
8 129568078 1 1 rs1561927 C T 0.39 0.71 0.97 0.75 4 cell types HEY1 Pou2f2 PVT1 1.4 Adipose
8 129569999 1 1 rs4733612 G A 0.38 0.71 0.97 0.75 HepG2, K562 TCF4 Nkx2,Nkx3,PLZF PVT1 1.4 Adipose
HaploReg, MuTHER and the Blood eQTL databases were used for this analysis. Note that no Trans-eQTLs were noted in the Blood eQTL database.
rs1561927
rs16986825
Supplementary Table 12 (continued). Genomic and functional support for newly discovered and suggestive pancreatic cancer risk alleles and their correlated (r2≥0.7) surrogate SNPs
Nature Genetics: doi:10.1038/ng.3052

2. SUPPLEMENTARY FIGURES
Supplementary Figure 1. Flow diagram of PanScan III GWAS study design
Supplementary Figure 2. Risk allele counts (a) and odds ratios (95% confidence intervals) (b) for pancreatic
cancer for a genetic risk score of the ten susceptibility loci identified in PanScan I, II, and III.
Supplementary Figure 3. Plot of estimated admixture for individuals in stage 1 of PanScan III GWAS
Supplementary Figure 4. Plot of top eigenvectors from stage 1 of PanScan III GWAS based on principal
components analysis
Supplementary Figure 5. Quantile-quantile (Q-Q) plot of the association results in stages 1 and 2 of the PanScan
III GWAS
Supplementary Figure 6. Manhattan plot showing statistical significance of the association for all genotyped SNPs
in stages 1 and 2 of PanScan III GWAS
Nature Genetics: doi:10.1038/ng.3052

3. SUPPLEMENTARY NOTE
ACKNOWLEDGEMENTS
Major support for PanScan III sample identification and processing was provided by the Lustgarten Foundation
for Pancreatic Cancer Research.
Additional support from NIH/NCI K07 CA140790, American Society of Clinical Oncology Conquer Cancer
Foundation, Howard Hughes Medical Institute, Lustgarten Foundation, Robert T. and Judith B. Hale Fund for
Pancreatic Cancer Research, and Promises for Purple to Dr. Brian Wolpin.
The NYU Women’s Health Study is supported by research grants R01CA034588, R01CA098661, center grant
P30CA016087 from the NCI and the center grant ES000260 from the National Institute of Environmental Health
Sciences.
The WHI program is funded by the National Heart, Lung, and Blood Institute, National Institutes of Health, U.S.
Department of Health and Human Services through contracts HHSN268201100046C, HHSN268201100001C,
HHSN268201100002C, HHSN268201100003C, HHSN268201100004C, and HHSN271201100004C.” The
authors thank the WHI investigators and staff for their dedication, and the study participants for making the
program possible. A full listing of WHI investigators can be found at:
https://cleo.whi.org/researchers/Documents%20%20Write%20a%20Paper/WHI%20Investigator%20Short%20Lis
t.pdf
The NHS and HPFS are supported by the National Cancer Institute, National Institutes of Health (Grants No. P01
CA87969, P01 CA55075, U54 CA155626, P50 CA127003, R01 CA124908, R01 CA49449, 1UM1 CA167552).
The PHS was supported by grants CA 97193, CA 34944, CA 40360, HL 26490, and HL 34595 from the National
Institutes of Health (Bethesda, MD).
The WHS is supported by grants CA047988, HL043851, and HL080467 from the National Institutes of Health
(Bethesda, MD).
The Shanghai Men’s Health Study was supported by the National Cancer Institute extramural research grant [R01
CA82729]. The Shanghai Women’s Health Study was supported by the National Cancer Institute extramural
research grant [R37 CA70867] and, partially for biological sample collection, by the Intramural Research
Program of National Cancer Institute (Division of Cancer Epidemiology and Genetics).We are in debt to the
contributions of Drs. Yu-Tang Gao and Yong-Bing Xiang in these two cohort studies. The studies would not be
possible without the continuing support and devotion from the study participants and staff of the SMHS and
SWHS.
PLCO was supported by the Intramural Research Program of the Division of Cancer Epidemiology and Genetics
and by contracts from the Division of Cancer Prevention, National Cancer Institute, NIH, DHHS. The authors
thank Drs. Christine Berg and Philip Prorok, Division of Cancer Prevention, National Cancer Institute, the
Screening Center investigators and staff of the Prostate, Lung, Colorectal, and Ovarian (PLCO) Cancer Screening
Trial, and Craig Williams, Michael Furr and staff at Information Management Services, Inc. Most importantly, we
acknowledge the study participants for their contributions to making this study possible.
The ATBC Study was supported by U.S. Public Health Service contracts N01-CN-45165, N01-RC-45035, N01-
RC-37004, and HHSN261201000006C from the National Cancer Institute, Department of Health and Human
Nature Genetics: doi:10.1038/ng.3052

Services, and by funding from the Intramural Research Program of the National Cancer Institute. Additional
support to Dr. Satu Mannisto from the Academy of Finland (#136895 and 263836).
For the EPIC cohorts, all coauthors coordinated the initial recruitment and management of the studies. All authors
contributed to the final paper. The authors thank all of the participants who took part in this research and the
funders and support and technical staff who made this study possible. The coordination of EPIC is financially
supported by the European Commission (DG-SANCO) and the International Agency for Research on Cancer. The
national cohorts are supported by Danish Cancer Society (Denmark); Liguecontre le Cancer, Société 3M,
MutuelleGénérale de l’EducationNationale, Institut National de la Santé et de la RechercheMedicale (France);
Deutsche Krebshilfe, DeutschesKrebsforschungszentrum and Federal Ministry of Education and Research
(Germany); Stavros Niarchos Foundation and Hellenic Health Foundation (Greece); Italian Association for
Research on Cancer (AIRC) and National Research Council (Italy); Dutch Ministry of Public Health, Welfare and
Sports (VWS), Netherlands Cancer Registry (NKR), LK Research Funds, Dutch Prevention Funds, Dutch ZON
(ZorgOnderzoek Nederland), World Cancer Research Fund (WCRF), Statistics Netherlands (The Netherlands);
Health Research Fund (FIS), Regional Governments of Andalucía, Asturias, Basque Country, Murcia and
Navarra, ISCIII RETIC (RD06/0020) (Spain); Swedish Cancer Society, Swedish Scientific Council and Regional
Government of Skåne and Västerbotten (Sweden); Cancer Research UK, Medical Research Council (United
Kingdom).
CLUE II was supported by National Institute of Aging grant (5U01AG018033) and National Cancer Institute
grants (CA105069, CA73790). The authors express their appreciation to the participants of the CLUE II cohort,
and thank the staff at the George W. Comstock Center for Public Health Research and Prevention for their
dedication and contributions to the study: Judy Hoffman-Bolton, Clara Krumpe, Kitty Spoonire and Betty
Miner.Cancer incidence data have been provided by the Maryland Cancer Registry, Center for Cancer
Surveillance and Control, Department of Health and Mental Hygiene, 201 W. Preston Street, Room 400,
Baltimore, MD 21201, www.fha.state.md.us/cancer/ registry/, 410-767-4055. We acknowledge the State of
Maryland, the Maryland Cigarette Restitution Fund, and the National Program of Cancer Registries (NPCR) of
the Centers for Disease Control and Prevention (CDC) for the funds that helped support the availability of the
cancer registry data.
The CPS-II is supported by the American Cancer Society. The authors thank all of the men and women in the
Cancer Prevention Study II Nutrition Cohort for their many years of dedicated participation in the study. The
authors acknowledge the contribution to this study of the central cancer registries supported through the Centers
for Disease Control and Prevention National Program of Cancer Registries, and the cancer registries supported by
the National Cancer Institute Surveillance Epidemiology and End Results program.
The MCCS recruitment was funded by VicHealth and Cancer Council Victoria and obtains core recurrent funding
from Cancer Council Victoria and grants from the NHMRC (#209057, #251533, #396414). The investigators
would like to express their gratitude to the many thousands of Melbourne residents who continue to participate in
the study.
SELECT is funded by Public Health Service grant CA37429 from the National Cancer Institute, Division of
Cancer Prevention. The authors thank the site investigators and staff, the members of the Data and Safety
Monitoring and Steering Committees and most importantly the 35,533 participants from SELECT who donated
their time to the trial.
The VITAL study is supported by K05CA154337 from the National Cancer Institute and the Office of Dietary
Supplements.
The work at Johns Hopkins University was supported by the NCI (Grants P50CA62924 and R01CA97075) and
the Lustgarten Foundation for Pancreatic Cancer Research. Under a licensing agreement between Myriad
Nature Genetics: doi:10.1038/ng.3052
Genetics, Inc., and the Johns Hopkins University, M.G. and A.P.K. are entitled to a share of royalty received by
the University on sales of products related to PALB2. The terms of this arrangement are managed by the Johns
Hopkins University in accordance with its conflict-of-interest policies.
The Mayo Clinic Molecular Epidemiology of Pancreatic Cancer study is supported by the Mayo Clinic SPORE in
Pancreatic Cancer (P50 CA102701).
The work at MD Anderson Cancer Center was supported by NIH grant R01 CA98380.
The Memorial Sloan-Kettering Cancer Center Pancreatic Cancer Registry is supported by the Prevention Control
and Population Research Goldstein Award; the Society of MSKCC; and the Geoffrey Beene Cancer Research
Fund.
The PACIFIC study was supported by grant R01 CA102765 from the National Cancer Institute.
The UCSF study was supported in part by National Cancer Institute grants CA59706, CA108370, CA109767,
CA89726 (E.A. Holly, PI) and CA98889 (E.J. Duell, PI) and by the Rombauer Pancreatic Cancer Research Fund.
The University of Toronto study was supported by grants from the NIH (R01 CA97075, as part of the PACGENE
consortium), The Lustgarten Foundation for Pancreatic Cancer Research and the Ontario Cancer Research
Network. We acknowledge the Pancreatic Cancer Canada Foundation (www.pancreaticcancercanada.ca) for their
continued support of research into the early detection of pancreatic cancer, and the Pancreas Cancer Screening
Study at Mount Sinai Hospital and Princess Margaret Hospital.
The Yale University study was supported by grant number 5R01CA098870 from the NCI, NIH. The cooperation
of 30 Connecticut hospitals, including Stamford Hospital, in allowing patient access in the Connecticut Pancreas
Cancer Study is gratefully acknowledged. This study was approved by the State of Connecticut Department of
Public Health Human Investigation Committee. Certain data used in this study were obtained from the
Connecticut Tumor Registry in the Connecticut Department of Public Health. The authors assume full
responsibility for analyses and interpretation of these data.
The research for Alliance/CALGB 80303 was supported, in part, by grants from the National Cancer Institute
(CA31946) to the Alliance for Clinical Trials in Oncology (Monica M. Bertagnolli, M.D., Chair) and to the
Alliance Statistics and Data Center (Daniel J. Sargent, Ph.D., CA33601). This study was also supported by K07-
CA140390-01, T32 MH200065-06, 5K24-CA113755, CA60138, the U01 GM61393, and the BioBank Japan
Project that is funded by the Ministry of Education, Culture, Sports, Science and Technology of the Japanese
government. This study was supported by the NIH Pharmacogenomics Research Network (PGRN)–RIKEN
Center for Genomic Medicine (CGM) Strategic Alliance. The CALGB investigators acknowledge the
contributions of the following individuals: Cox NL, Kubo M, Zembutsu H, Mushiroda T, Giacomini KM,
McLeod HL, Kindler HL, Goldberg R, Ratain MJ.
The DFCI study was supported in part by NIH/NCI P50 CA127003, the Robert T. and Judith B. Hale Fund for
Pancreatic Cancer Research, and the Lustgarten Foundation.
The PANKRAS II and SBC/EPICURO studies were partially supported by RTICC (#RD12/0036/0050),
Consolíder ONCOBIO and FIS Grants (#PI05-1436, #PI09-02102, #PI12-00815), MINECO, Madrid, Spain; EU
7FP_HELATH CANCERALIA (#259737) and European Cooperation in Science and Technology (COST Action
#BM1204: EU_Pancreas); and Intramural Research Program of the National Institutes of Health, National Cancer
Institute, Division of Cancer Epidemiology and Genetics (Contract NCI NO2-CP-11015).
Nature Genetics: doi:10.1038/ng.3052

The PANDoRA Consortium was supported by the National Institute for Health Research Liverpool Pancreas
Biomedical Research Unit, UK (University of Liverpool); the Czech Science Foundation (No. P301/12/1734) and
Internal Grant Agency of the Czech Ministry of Health (IGA NT 13 263) (Czech Republic); the Italian “5x1000”
voluntary contribution, grants from the Italian Ministry of Health (RC1203GA57, RC1303GA53, RC1303GA54,
RC1303GA50), the Italian Association for Research on Cancer (AIRC n. 12182) the Italian Ministry of Research
(FIRB - RBAP10AHJB), the Italian FIMP-Ministry of Health (CUP_J33G13000210001) (Italy); Federal Ministry
of Education and Research (BMBF) grant 01GS08114, Heidelberger Stiftung Chirurgie, and the PancoBank of
European Pancreas Centre (EPZ) (University Hospital Heidelberg). ARC-NET also acknowledges the
contributions of the following individuals: Lawlor RT, Bassi C, Butturini G, Malleo G, Sperandio N. University
Hospital Heidelberg also acknowledges the contributions made by the EPZ staff, U. Hinz, M. Meinhardt, J.
Kleeff, C. Tjaden, J. Werner, O. Strobel, T. Hackert.
The authors acknowledge the contribution of the staff of the Cancer Genomics Research Laboratory (CGR).
Specifically, we would like to thank Aurelie Vogt, Xiang Deng, Belynda Hicks and Amy Hutchinson as well as
the CGR Infinium and CGR Production Genotyping teams including Salma Chowdhury, Kedest Teshome, Kerrie
Lashley, Herbert Higson and Michelle Manning for their invaluable help throughout the project.
This project has been funded in whole or in part with federal funds from the National Cancer Institute, National
Institutes of Health, under Contract No. HHSN261200800001E. The content of this publication does not
necessarily reflect the views or policies of the Department of Health and Human Services, nor does mention of
trade names, commercial products, or organizations imply endorsement by the U.S. Government.
Nature Genetics: doi:10.1038/ng.3052