a school of life sciences, university of nottingham, nottingham,...
TRANSCRIPT

Physiological, but not fitness, effects of two interacting haemoparasitic infections in a wild rodent 1
2
Christopher H. Taylor a,*, Klara M. Wanelik b, Ida M. Friberg c, Ann Lowe a, Amy J. Hall a , Catriona Ralli 3
a, 1, Richard J. Birtles c, Mike Begon b , Steve Paterson b, Joseph A. Jackson c, Janette E. Bradley a 4
a School of Life Sciences, University of Nottingham, Nottingham, NG7 2RD, UK 5
b Institute of Integrative Biology, University of Liverpool, Liverpool, L69 7ZB, UK 6
c School of Environment and Life Sciences, University of Salford, Salford, M5 4WT, UK 7
1 Present affiliation: School of Education, University of Nottingham, Nottingham, NG7 2RD, UK 8
9
*Corresponding author. Christopher H. Taylor, School of Life Sciences, University of Nottingham, 10
University Park, Life Sciences Building, Nottingham, NG7 2RD, UK. 11
Tel.: +44 (0)115 8232041. 12
E-mail address: [email protected] 13
14
15
Abstract 16
In contrast to the conditions in most laboratory studies, wild animals are routinely challenged by 17
multiple infections at once, and these infections can interact in complex ways. This means that the 18
impact of a parasite on its host’s physiology and fitness cannot be fully assessed in isolation, and 19
requires consideration of the interactions with other co-infections. Here we examine the impact of 20
two common blood parasites in the field vole (Microtus agrestis): Babesia microti and Bartonella 21
spp., both of which have zoonotic potential. We collected longitudinal and cross-sectional data from 22
four populations of individually tagged wild field voles. This included data on biometrics, life history, 23
ectoparasite counts, presence/absence of microparasites, immune markers and, for a subset of 24
voles, more detailed physiological and immunological measurements. This allowed us to monitor 25
infections over time and to estimate components of survival and fecundity. We confirm, as reported 26
previously, that B. microti has a preventative effect on infection with Bartonella spp., but that the 27
reverse is not true. We observed gross splenomegaly following B. microti infection, and an increase 28
in IL-10 production together with some weight loss following Bartonella spp. infection. However, 29
these animals appeared otherwise healthy and we detected no impact of infection on survival or 30
fecundity due to the two haemoparasite taxa. This is particularly remarkable in the case of B. microti 31
which induces apparently drastic long-term changes to spleen sizes, but without major adverse 32
effects. Our work sheds light on the ecologies of these important zoonotic agents, and more 33
generally on the influence that interactions among multiple parasites have on their hosts in the wild. 34
35
Keywords: Disease ecology; Co-infection; Immunology; Babesia microti; Bartonella; Microtus agrestis 36
37
1. Introduction 38
An individual animal in its natural environment is likely to harbour multiple parasitic 39
infections (Petney and Andrews, 1998; Cox, 2001). These parasites can interact with one another in 40
complex ways, meaning that even low virulence infections can indirectly influence the host’s 41
physiology and fitness by changing the course of more virulent infections (Randall et al., 2013). 42
Understanding how parasites interact in a natural setting provides a vital complement to more 43
controlled, laboratory-based studies (Pedersen and Babayan, 2011), and in particular it allows us to 44
study parasites in the context of the natural co-infections which may occur. 45
Two parasites may interact with one another in several distinct ways. Commonly, one 46
parasite may adversely affect the host’s condition, or cause a shift in immunity, that then makes it 47
easier for another to invade, or to increase in abundance (Cox, 2001). Alternatively, one infection 48
can make it harder for a second to become established (van Duivenvoorde et al., 2010; Randall et 49
al., 2013), for example through direct competition for resources (Johnson and Buller, 2011), cross-50
reactivity of antibodies (Naus et al., 2003), or a shift in host cytokine production (Graham et al., 51
2007). These interactions can give counter-intuitive outcomes for the host: one type of infection 52
(particularly if it has low virulence) may have a net positive effect on host fitness if it reduces the 53
abundance or prevalence of a second pathogen (Randall et al., 2013; Wuerthner et al., 2017). These 54
indirect effects are important when considering treatment or removal of a parasite during disease 55
management, and species or strains of pathogen should not be considered in isolation. It is vital to 56
understand any changes in susceptibility to other parasites due to the intervention that might lead 57
to unintended negative consequences (Graham, 2008; Fenton, 2013; Johnson et al., 2015). 58
In wild field voles, Microtus agrestis, a negative interaction has been described between two 59
common taxa of blood parasites, Babesia microti and Bartonella spp. (Telfer et al., 2010; Sherlock et 60
al., 2013). The protozoan B. microti infects a number of rodent species, often without obvious 61
symptoms. It is transmitted by ixodid ticks, which can also spread the infection to humans, causing 62
babesiosis (Telford et al., 1993; Homer et al., 2000). The course of an infection varies, but a typical 63
sequence in rodents consists of acute and chronic phases. The acute phase lasts several weeks, 64
during which time B. microti infects the red blood cells (RBCs) of the host and may cause severe 65
anaemia. Between 20 and 50% of the RBCs can be infected, the packed cell volume (PCV) may be 66
reduced to as little as 20%, and the spleen becomes greatly enlarged (Van Peenen and Healy, 1970; 67
Cullen and Levine, 1987; Watkins et al., 1991). Mortality in otherwise healthy animals is low, 68
however, and after 3-4 weeks most have little or no evidence of infection in the blood. Nonetheless, 69
previously infected animals retain a chronic carrier status (Lykins et al., 1975; Homer et al., 2000) 70
and B. microti remains detectable by PCR indefinitely (Bown et al., 2008). 71
Bartonella is a genus of gram-negative bacteria that infects a wide range of mammalian 72
hosts (Breitschwerdt and Kordick, 2000). It is transmitted by blood-sucking arthropods, primarily 73
fleas (Bown et al., 2004; Gutiérrez et al., 2015), and invades the RBCs of the host (Breitschwerdt and 74
Kordick, 2000). Similar to B. microti, some Bartonella spp. can be transmitted to humans via 75
arthropod vectors, where they cause several different diseases including bartonellosis and cat 76
scratch disease (Anderson and Neuman, 1997; Oksi et al., 2013; Vayssier-Taussat et al., 2016). 77
In field voles, Bartonella spp. (henceforth “Bartonella”) and B. microti show a negative 78
interaction, with few animals showing coinfection despite relatively high prevalence of the individual 79
infections (Telfer et al., 2010). This interaction appears to be unidirectional; that is, B. microti 80
reduces the chance of infection with Bartonella, but the reverse is not the case (Sherlock et al., 81
2013). Particularly in light of the zoonotic potential of the two infections, it is valuable to study them 82
in combination to understand the fitness effects on the host, and to learn more about the dynamics 83
of their interaction. 84
Here, we aim to explore the consequences of Bartonella and B. microti infections for wild-caught 85
field voles. We make use of longitudinal data from multiple captures of the same individuals to 86
examine infection sequences and changes in immunology over time to help separate cause from 87

effect. We also use more detailed physiological and immunological data taken from destructive 88
cross-sectional sampling. We confirm the findings of Sherlock et al. (2013) that B. microti reduces 89
susceptibility to Bartonella, but not the reverse. We find major physiological changes in the case of 90
B. microti infection (characterised by splenomegaly) but, surprisingly, no evidence of adverse fitness 91
consequences. Finally, we are unable to find any support for the hypothesis that B. microti infection 92
has any indirect, positive effect on the host via its negative interaction with Bartonella. 93
2. Materials and methods 94
95
This paper uses data that have been previously analysed in Jackson et al. (2011) and Jackson 96
et al. (2014). Here we give a short summary of the data collection methods; for more details see the 97
two references above. We carried out all procedures under UK Home Office licence regulations. 98
2.1. Fieldwork 99
Wild field voles were trapped at four different sites in Kielder Forest, Northumbria, UK: two 100
sites in 2008-2009 and a further two in 2009-2010. At each site, 150 Ugglan small mammal traps 101
(Grahnab, Sweden) were laid out in a grid spaced approximately 3-5 m apart. During monthly 102
trapping sessions, traps were checked five times over the course of 3 days, and newly trapped field 103
voles were injected with a Passive Integrated Transponder (PIT) tag (AVID, UK) for unique 104
identification. This approach allowed us to build up a longitudinal record for voles that were caught 105
across multiple sessions. On capture, we recorded sex and body mass of the voles, as well as 106
reproductive status (males were considered to be reproductively active if they had descended 107
testes; females if they were pregnant or had perforate vaginas). We also conducted a thorough 108
visual inspection of the fur to count ectoparasites including ticks and fleas, and took a drop of blood 109
from the tail into 500 µl of RNAlater (Fisher Scientific, UK), for use in pathogen detection and 110
immune assays (see 2.3 and 2.4 below). 111
2.2. Cross-sectional data 112
At each trapping session we also retained a small number of individuals (up to 20) that were 113
transported to the laboratory. These individuals were killed and dissected in order to collect more 114
detailed, invasive measurements. For this component of the study, we focused on male voles only: 115
we did not wish to remove pregnant females from the wild population, and data collected from non-116
pregnant females would therefore represent a biased sample. 117
Voles were killed by an overdose of chloroform, following which they were immediately 118
weighed and then exsanguinated. The resulting blood samples were divided into two aliquots: one 119
was used in pathogen detection (see Section 2.3), and the other for estimation of PCV. The latter 120
blood sample was spun for 3 min in a microhaematocrit centrifuge (Hawksley, UK) to separate cells 121
from plasma and the ratio of the two (PCV) was calculated. We measured body length from snout to 122
vent (SVL), removed the spleen and measured its wet mass before setting up splenocyte cultures 123
(see Section 2.5). We conducted a thorough search of the fur for ectoparasites. 124
2.3. Pathogen detection 125
We extracted DNA from blood samples and amplified pathogen-specific sequences using 126
PCR. See Bown et al. (2008) for details of B. microti detection and Telfer et al. (2005) for Bartonella. 127
For longitudinal samples, we used an aliquot of the tail blood samples and extracted DNA using 128
isopropyl alcohol precipitation (see Jackson et al., 2014 for details). For cross-sectional samples in 129
2008, we used blood collected on filter paper and DNA extraction using Tris-EDTA buffer, as 130
described in Bereczky et al. (2005). As this method appeared to have a lower sensitivity than 131
expected, in 2009 we switched to extracting from pelleted RBCs after centrifugation, using alkaline 132
digestion as described in Bown et al. (2003). 133
2.4. Blood immunology 134
We used two-step reverse transcription quantitative PCR to estimate the expression levels of 135
the genes Interferon gamma (IFNγ), Gata3 and IL-10 in peripheral blood samples. Having only a 136

limited volume of blood from each individual, we selected these three genes as broadly 137
representative of Th1 (IFNγ), Th2 (Gata3) and regulatory/anti-inflammatory (IL-10) immune 138
responses. Samples were run in duplicate, and each 96-well plate included no-template controls. 139
Expression was standardised against Ywhaz and Sdha as endogenous control genes, which were 140
identified by geNorm analysis (Vandesompele et al., 2002) as the most stably expressed in the blood 141
samples from a panel of seven candidate house-keeping genes. Expression values were normalised 142
relative to a calibrator sample, using the ΔΔCT method (Livak and Schmittgen, 2001). 143
2.5. Splenocyte cultures 144
After disaggregating spleen cells and lysing RBCs, we incubated the splenocytes (at a 145
concentration of 2 x 10⁶ cells per ml, total volume 300 µl) for 96 h in two assays: one stimulated with 146
the mitogen phytohaemagglutinin-M (40 µg per ml; Sigma, UK), and the other an unstimulated 147
control. Assays for each individual and condition were replicated four times. After the incubation 148
period, we estimated gene expression levels using two-step reverse transcription quantitative PCR, 149
amplifying the sequences for IFNγ, IL-2 and T-box transcription factor TBX21 (T-bet) as markers for 150
the Th1 immune response. Ywhaz was selected as the endogenous control gene in this case, being 151
the most stably expressed in the splenocytes out of seven candidate house-keeping genes. Detailed 152
methodology can be found in Jackson et al. (2011). 153
2.6. Statistical analysis 154
Prior to statistical modelling, we transformed (natural log + 1) gene expression variables and 155
quantitative parasite measures, and removed any rows containing missing values relevant to the 156
model in question. Because different models used different sets of variables, this led to varying 157
sample sizes (see Table 1). 158
All models included fixed effects of season and site (with “year” also implicitly accounted for, 159
as site is nested within year), and for reproductive status and sex in cases where both factor levels 160
were present. Further predictors are listed separately under individual models and in Table 1. We 161

modelled season as a sinusoid curve with a period of one year, using one sine and one cosine curve 162
combined, following previous evidence that several infections show periodic variation in prevalence 163
over the course of the year (Telfer et al., 2010). During model selection, these two curves were 164
treated as a single unit. 165
We calculated an index of body condition as the residual values from a linear model of body 166
mass against SVL, with the inclusion of second and third order polynomial terms (as allometry 167
predicts a cubic relationship between length and mass). This index represents how much lighter or 168
heavier an individual is compared with a prediction based on its length, with greater mass likely to 169
indicate greater energy reserves and hence better condition (Schulte-Hostedde et al., 2005). 170
For model selection, a full sub-model set was generated and models were ranked according 171
to their AICc (Akaike Information Criterion, with correction for small sample size) values. Models 172
with ΔAIC < 2 relative to the lowest value were considered to be equally supported as the best 173
models to explain the data and were averaged. “Full” (as opposed to “conditional”) coefficients are 174
quoted in the final model, meaning that any terms not appearing in a given component model were 175
assigned a coefficient of zero before averaging. 176
Since previous work indicates that B. microti infection reduces the chance of acquiring 177
Bartonella (Sherlock et al., 2013; also see section 3.5 in this paper), we tested for indirect effects of 178
B. microti on expression of selected genes, condition and fitness measures, via its effect on 179
Bartonella. For models in which both B. microti and Bartonella were predictors, and Bartonella was 180
found to be significant, we ran a further model in which we excluded Bartonella as a predictor. Our 181
hypothesis was that, if the removal of Bartonella from the model caused a clear change in the size or 182
direction of effects of B. microti infection, then this would be evidence of an indirect effect. 183
2.6.1. Spleen mass, PCV and body mass 184
Each of spleen mass, PCV and body mass were modelled using similar Generalised Linear 185
Models (GLMs), with predictors including Bartonella and B. microti infection status, SVL (3rd order 186

polynomial) and, except in the body mass model, condition. Due to the way in which we defined 187
condition (see Section 2.6 above), if it were included as a predictor in the body mass model it would 188
create a circular argument as, together with SVL, it would explain 100% of the variation in body 189
mass. Due to the slight change in extraction method described in Section 2.3, we also included 190
interaction terms of B. microti and Bartonella with year. 191
2.6.2. Immunology from spleen cultures 192
We created a summary measure for the expression levels of genes coding for our three Th1-193
associated cytokines (IFNγ, Tbet and IL-2) by Principal Components analysis. The first Principal 194
Component represented 42.6% of the variation and correlated positively with all three gene 195
expression variables, so we used this as our Th1 index. To test for an association between Th1 196
cytokines and haemoparasite infection, we ran a GLM with the Th1 index as the response variable. 197
Predictors included presence/absence of B. microti and Bartonella, and their interactions with year 198
(see Section 2.6.1 above), 199
2.6.3. Immunology from peripheral blood 200
We used the longitudinal data to investigate the immunological changes that followed 201
infection. We constructed three separate models of the changes in expression for Gata3, IL-10 and 202
IFNγ, respectively, based on the tail blood samples. We selected all intervals for which an individual 203
was captured in successive trapping sessions (i.e. less than 5 weeks apart) and was free from the 204
infection in question at the start of the interval. For individuals with more than one such interval, we 205
selected one interval at random in order to avoid pseudoreplication (we had previously attempted a 206
mixed modelling approach, with individual as a random factor to allow the inclusion of all intervals, 207
but the models did not converge because many individuals had only one valid interval). In order to 208
verify that results were robust to the subsample obtained, we obtained models from 100 different 209
random subsamples and recorded the proportion of these in which each predictor was significant 210
(i.e. the 95% confidence interval for the given model coefficient did not overlap with 0). 211
We modelled the change in gene expression over the sampling interval (natural log(x2/x1) / 212
interval length, where x1 is the expression at the start of the interval and x2 is the expression at the 213
end) as our response variable. Predictors included the infection status for both B. microti and 214
Bartonella (N = uninfected, B = infected) at both the start and end of the interval. This resulted in 215
four possibilities: NN (uninfected), NB (acute infection, acquired during the interval), BB (chronic 216
infection, acquired previously) and BN (cleared infection, for Bartonella only). As B. microti is known 217
to persist indefinitely (Lykins et al., 1975; Telford et al., 1993; Bown et al., 2008), we excluded three 218
intervals in which B. microti was apparently cleared (BN), on the assumption that these represented 219
technical errors. Body mass was also included as a predictor, with a quadratic term to allow for a 220
non-linear relationship. 221
2.6.4. Susceptibility to infection 222
Using the longitudinal data, the effect of immunology on the acquisition of infection was 223
evaluated. In two separate models, we examined the probability of an individual acquiring either 224
Bartonella or B. microti during a given time interval. We selected time intervals as described in 225
Section 2.6.3 above. The outcome of whether or not the individual became infected during the focal 226
interval was modelled using a binomial GLM. Predictors included the level of tick and flea 227
infestation, body mass (with a quadratic term) and expression of Gata3, IL10 and IFNγ, all measured 228
at the start of the interval in question. 229
2.6.5. Mortality 230
We analysed mortality rates within the longitudinal samples, excluding individuals that were 231
only captured on a single occasion, on the assumption that many of these would have been non-232
resident. Recapture rates were very high: a simple Capture-Mark-Recapture (CMR) model (Cormack-233
Jolly-Seber) with constant values for recapture and survival gave a mean recapture rate of 0.89 (95% 234
confidence limits 0.85 – 0.92). As a result, we judged that to calculate separate recapture and 235
survival probabilities for each model term would greatly increase the number of model parameters 236
for little ultimate gain in accuracy. Therefore, we decided against fitting a full CMR model and made 237
the simplifying assumption that an individual had died if it was released and never recaptured at 238
subsequent sampling sessions. Although we used all time intervals in order to classify survival, we 239
excluded intervals of more than one session (> 5 weeks) from the final model, on the basis that 240
infection status is more likely to change (undetected) during longer intervals. 241
Survival was modelled using a Cox proportional hazards model, with predictors including B. 242
microti and Bartonella infection status and body mass (with a quadratic term), all measured from the 243
start of the sampling interval. Assessment of the proportional hazards assumption using Schoenfeld 244
residuals (Schoenfeld, 1982) showed that hazards for the “site” term were not constant over time. 245
We therefore stratified by site, after which all remaining terms showed proportional hazards. 246
2.6.6. Fecundity 247
We used pregnancy rates to estimate fecundity among adult females. Again, our analysis 248
was based on intervals between two consecutive sessions (excluding those from February and 249
November, which are outside the breeding season), with predictors taken from the start of the 250
interval and the outcome (pregnancy) measured at the end of the interval. Pregnancy was modelled 251
using a Cox proportional hazards model, with the inclusion of a “cluster” term which adjusts variance 252
estimates to allow for individuals with multiple pregnancy events. Given that the vole gestation 253
period is approximately 3 weeks (Ranson, 1934), it is safe to assume that a female recorded as 254
pregnant at two consecutive sampling sessions has had two different pregnancies. Predictors 255
included B. microti and Bartonella infection status and body mass (with a quadratic term). 256
2.6.7. Software 257
We carried out all analysis in R version 3.3.1 (R Core Team, 2016. R: A language and 258
environment for statistical computing. R Foundation for Statistical Computing, Vienna, Austria), 259
making use of the following packages: “tidyverse” for data processing and visualisation (Wickham, 260
2016. tidyverse: Easily Install and Load "Tidyverse" Packages. R package version 1.0.0); “MuMIn” for 261
model averaging (Barton, 2016. MuMIn: Multi-Model Inference. R package version 1.15.6); and 262
“survival” for Cox proportional hazards models (Therneau, 2015. A Package for Survival Analysis in S. 263
R package version 2.38). 264
3. Results 265
3.1. Both Bartonella and B. microti were prevalent in the sample populations 266
A total of 920 voles were tagged over the course of the longitudinal study, with a total of 267
1665 trapping instances, yielding between one and seven records per individual (mean = 1.8 268
captures). In addition, 345 male voles were destructively sampled, forming the cross-sectional 269
dataset. Bartonella infections were highly prevalent within our study animals. Of the individuals 270
captured three or more times, 91% were infected with Bartonella at some point during their capture 271
history. In the same set of individuals, B. microti had a lower, but still considerable, prevalence of 272
37% during the course of the study (Table 2). 273
3.2. Babesia microti is associated with splenomegaly, and Bartonella with a 274
reduction in body mass 275
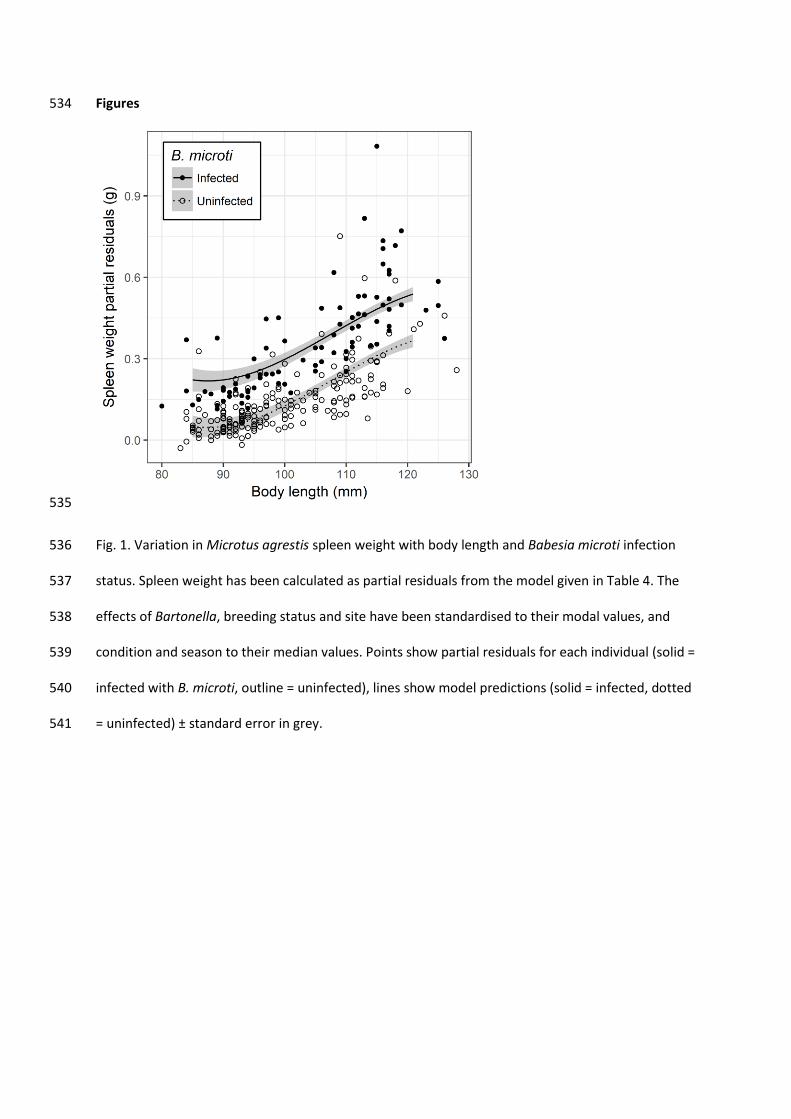
There was a strong, positive association between spleen mass and B. microti infection, with 276
spleens of infected animals predicted to be 0.17 g heavier (95% Confidence Interval (CI) = 0.14-0.20) 277
than those of uninfected individuals, which had a mean mass of 0.14 g (Table 3, Fig. 1, 278
Supplementary Table S1). 279
PCV was not associated with either B. microti or Bartonella infections (Table 3, 280
Supplementary Table S1). 281
We found an association between Bartonella and body mass, with infected voles 1.1 g 282
lighter (95% CI = 0.1-2.1) than uninfected voles at the same time of year and at the same site (Table 283
3, Supplementary Table S1). Babesia microti did not feature as a predictor in the final model, even if 284
the Bartonella term was excluded (Supplementary Table S2). 285
3.3. Haemoparasitic infection was not associated with changes in the Th1 immune 286
response 287
Our index measuring expression of genes coding for Th1-associated proteins was not 288
significantly associated with either B. microti or Bartonella infections (Table 4, Supplementary Table 289
S3). 290
3.4. An increase in IL10 expression follows Bartonella infection 291
Expression of IL10 increased significantly upon initial infection with Bartonella (0.636 log 292
units per 30 days, 95% CI = 0.87 – 3.36; significant in 81% of subsamples; a change of 0.636 log units 293
corresponds to a 1.89-fold increase; Fig. 2). Expression then appeared to decline (relative to 294
uninfected animals), both in individuals that remained infected (BB) and those that cleared the 295
infection (BN), although the 95% CI for both of these changes included zero (Table 5, Supplementary 296
Table S4). Babesia microti did not feature as a predictor in the final model, even if the Bartonella 297
term was excluded (Supplementary Table S5). Neither Gata3 nor IFNγ expression were significantly 298
influenced by infection status (Table 5). 299
3.5. Babesia microti reduces infection rates by Bartonella, but not vice versa 300
Susceptibility to Bartonella was significantly lower in individuals that had a pre-existing B. 301
microti infection (odds ratio (OR) = 0.33, 95% CI = 0.14 – 0.76; significant in 94% of subsamples; 302
Table 6, Supplementary Table S6). The reverse was not true; Bartonella infection did not influence 303
an individual’s susceptibility to B. microti. Males were more susceptible than females to B. microti 304
infection (OR = 4.01, 95% CI = 1.65 – 9.78; significant in 100% of subsamples; Table 6, Supplementary 305
Table S6). 306
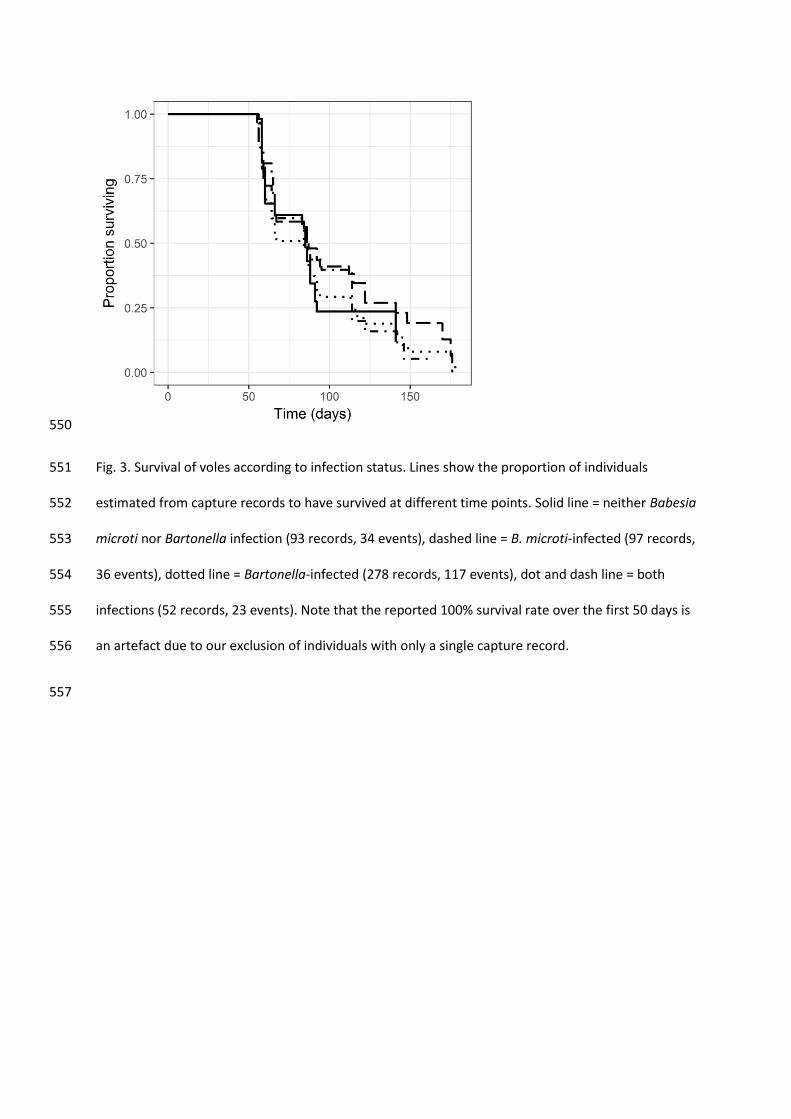
3.6. No loss of fitness was detected from infections 307
Neither B. microti nor Bartonella infections significantly influenced the estimated vole 308
mortality rates (Bartonella OR = 1.03, 95% CI = 0.85 – 1.26; B. microti OR = 0.97, 95% CI = 0.79 – 309
1.18; Table 7, Supplementary Table S7, Fig. 3), nor did they affect female fecundity, measured as the 310
probability of pregnancy over time (Bartonella OR = 0.99, 95% CI = 0.84 – 1.16; B. microti OR = 0.96, 311
95% CI = 0.80 – 1.15; Table 8, Supplementary Table S8, Fig. 4). 312
4. Discussion 313
Babesia microti and Bartonella infections appear to have little impact on the fitness of field 314
voles, despite provoking clear physiological changes. A substantial proportion of the vole population 315
has greatly enlarged spleens due to B. microti infection, and yet has similar rates of mortality and 316
pregnancy to uninfected animals. While Bartonella infection is associated with a reduction in body 317
mass, this poorer condition does not translate to any detectable loss of fitness in the two measures 318
that we examined. 319
It is notable that the voles can support these infections with apparently little deleterious 320
impact, given the associated physiological changes. Most conspicuously, we find that B. microti-321
infected field voles have highly enlarged spleens compared with uninfected voles, as has been 322
recorded in many other host species (Lykins et al., 1975; Cullen and Levine, 1987; Watkins et al., 323
1991; Telford et al., 1993; Homer et al., 2000). Given that splenomegaly affects B. microti-positive 324
individuals almost universally (Fig. 1), we infer that it is not restricted to the initial, acute phase of 325
infection, but rather it affects the animal throughout the full course of infection, including when the 326
vole has carrier status. An enlarged spleen indicates proliferation of lymphocytes, and/or that large 327
numbers of RBCs are being recycled from the blood (Eichner, 1979; Jiao et al., 2001), presumably to 328
remove the pathogen-containing cells. Despite this, we find no evidence of anaemia associated with 329
B. microti, meaning it is likely that new RBCs are also being produced at an elevated rate to make up 330
for those being removed. A study in another vole species, Microtus montanus, found a similar 331
pattern of splenomegaly without anaemia in B. microti-infected individuals, and showed that 332
erythrocytes were on average younger in these individuals (Watkins et al., 1991). We would expect 333

such energetic expenditure to have a negative impact on the animal’s condition or fitness, and yet, 334
despite substantial sample sizes, we have not found evidence for any such impact. 335
We did not find any increase in expression of genes coding for Th1-related cytokines such as 336
IFNγ associated with either of the focal infections. One might predict stimulation of the Th1 pathway 337
in response to infections such as these, in accordance with its function in targeting intracellular 338
parasites (Abbas et al., 1996). Indeed, in the laboratory, B. microti has been shown to stimulate 339
increased expression of IFNγ and IL-2 in mice during a period 1 - 3 weeks p.i. (Chen et al., 2000). 340
Similarly, mice experimentally infected with Bartonella henselae show an increase in secretion of 341
IFNγ indicative of a Th1 response (Arvand et al., 2001; Kabeya et al., 2007), and in cats, a stronger 342
Th1 response leads to reduction in B. henselae bacteraemia (Kabeya et al., 2009). 343
By contrast, we observed an increase in expression of IL-10 following initial infection with 344
Bartonella. IL-10 is a regulatory cytokine that reduces inflammatory responses, and in other host-345
pathogen systems it has been shown to play a role in tissue damage associated with inflammation 346
(Hunter et al., 1997; Brown et al., 1999; Sanni et al., 2004). Kabeya et al. (2007) observed an increase 347
in IL-10 secretion following B. henselae infection, which acted to reduce the strength of the Th1 348
response. The induction of IL-10 production by Bartonella may therefore help the parasite to persist 349
in its host (Kabeya et al., 2007) but, given the lack of detectable fitness cost in our study, it is also 350
possible that IL-10 might minimise negative impacts on host health by reducing inflammation. The 351
addition of data on parasite loads would allow more detailed investigation of this possibility. 352
Our study provides independent corroboration of the finding of Sherlock et al. (2013), that 353
B. microti protects against Bartonella infection, but that the reverse is not true. To date we have 354
been unable to establish a mechanism for the inhibition. One possibility is that B. microti might 355
cause changes in immunology that then make the individual better able to resist initial infections 356
with Bartonella. Immunological changes are a common way for concurrent infections to interact 357
(Cox, 2001). For example, increased production of cytokines such as Tumour Necrosis Factor has 358
been credited for mediating protection against protozoan diseases such as malaria and B. microti 359
after infection with tuberculosis (Clark, 2001). However, on the basis of the genes examined in this 360
study, we found no evidence that B. microti induces changes in immune status, nor that immune 361
status influences Bartonella acquisition. We note, however, that levels of gene expression do not 362
necessarily correlate directly with concentrations of their protein products (Vogel and Marcotte, 363
2012), and therefore direct data on circulating cytokines would allow us to investigate these 364
immunological interactions more thoroughly. 365
Alternatively, the interaction between B. microti and Bartonella might be physiological. The 366
most conspicuous feature of B. microti infection is splenomegaly, and this is associated with an 367
increased number of reticulocytes in the blood compared with mature erythrocytes (Watkins et al., 368
1991). There is some evidence that both B. microti (Borggraefe et al., 2006) and Bartonella (Scheff et 369
al., 1956) are less likely to infect reticulocytes than mature erythrocytes. Therefore, by maintaining 370
high reticulocyte populations, B. microti-infected individuals may limit the capacity of Bartonella and 371
B. microti to reproduce, hence lowering the probability of the infections establishing/re-establishing. 372
In cases of negative interactions between two different parasites, we might predict an 373
indirect, positive effect of one infection on the host via a reduction in abundance or prevalence of 374
the other. For example, Wuerthner et al. (2017) found that a trematode infection in amphibians can 375
have a positive fitness effect by reducing ranaviral loads. However we found no evidence of a similar 376
positive effect of B. microti in the current study. For example, although we found that Bartonella 377
causes a reduction in body mass, this did not translate into a positive effect of B. microti on mass on 378
exclusion of Bartonella from the model. This may simply be because the impacts of Bartonella on an 379
individual’s health are relatively small, and therefore any indirect effects conferred are too small to 380
be detected. 381
While we found little evidence for negative health consequences of these infections in the 382
voles, it is plausible that our sampling method overlooked the most acutely infected individuals. In 383

theory, an individual that was recorded as free of infection could subsequently become infected and 384
die before recapture. In this case, the infection would not be observed, making it impossible to 385
ascribe that death to the parasite. Given the high prevalence of both parasites among the sampled 386
populations, we can be confident that our conclusions apply to a sizable number of infected 387
individuals, but we cannot rule out that some individuals are more acutely affected. It is also 388
possible that we missed some fitness consequences of infection (e.g. effects on number of offspring) 389
by focusing on mortality and pregnancy rates. 390
Overall, our study shows that B. microti and Bartonella have little negative impact on their 391
field vole hosts, despite provoking clear immunological and physiological changes that, at least in the 392
case of B. microti, appear to persist for long periods of time. This demonstrates the importance of 393
using direct measures of fitness components wherever possible to assess the impact of parasites in 394
natural populations, rather than relying on assumptions based on pathology or prevalence of 395
infection. 396
Acknowledgements 397
We would like to thank the Forestry Commission, England, UK for permission to carry out 398
fieldwork in Kielder Forest, UK; Alex Stewart for design of Gata3 primers for the longitudinal blood 399
samples; and Malgorzata Zawadzka for technical support. This work was supported by the Natural 400
Environment Research Council of the UK (award NE/E015131/1). 401
402
References 403
Abbas, A.K., Murphy, K.M., Sher, A., 1996. Functional diversity of helper T lymphocytes. Nature 383, 404
787-793. 405
Anderson, B.E., Neuman, M.A., 1997. Bartonella spp. as emerging human pathogens. Clin. Microbiol. 406
Rev. 10, 203-219. 407
Arvand, M., Ignatius, R., Regnath, T., Hahn, H., Mielke, M.E.A., 2001. Bartonella henselae-specific 408
cell-mediated immune responses display a predominantly Th1 phenotype in experimentally 409
infected C57BL/6 mice. Infect. Immun. 69, 6427-6433. 410
Bereczky, S., Mårtensson, A., Gil, J.P., Färnert, A., 2005. Rapid DNA extraction from archive blood 411
spots on filter paper for genotyping of Plasmodium falciparum. Am. J. Trop. Med. Hyg. 72, 412
249-251. 413
Borcard, D., Gillet, F., Legendre, P., 2011. Numerical Ecology with R. Springer, New York. 414
Borggraefe, I., Yuan, J., Telford, S.R., Menon, S., Hunter, R., Shah, S., Spielman, A., Gelfand, J.A., 415
Wortis, H.H., Vannier, E., 2006. Babesia microti primarily invades mature erythrocytes in 416
mice. Infect. Immun. 74, 3204-3212. 417
Bown, K.J., Begon, M., Bennett, M., Woldehiwet, Z., Ogden, N.H., 2003. Seasonal dynamics of 418
Anaplasma phagocytophila in a rodent-tick (Ixodes trianguliceps) system, United Kingdom. 419
Emerging Infect. Dis. 9, 63-70. 420
Bown, K.J., Bennett, M., Begon, M., 2004. Flea-borne Bartonella grahamii and Bartonella taylorii in 421
bank voles. Emerging Infect. Dis. 10, 684-687. 422
Bown, K.J., Lambin, X., Telford, G.R., Ogden, N.H., Telfer, S., Woldehiwet, Z., Birtles, R.J., 2008. 423
Relative importance of Ixodes ricinus and Ixodes trianguliceps as vectors for Anaplasma 424
phagocytophilum and Babesia microti in field vole (Microtus agrestis) populations. Appl. 425
Environ. Microbiol. 74, 7118-7125. 426
Breitschwerdt, E.B., Kordick, D.L., 2000. Bartonella infection in animals: carriership, reservoir 427
potential, pathogenicity, and zoonotic potential for human infection. Clin. Microbiol. Rev. 13, 428
428-438. 429
Brown, J.P., Zachary, J.F., Teuscher, C., Weis, J.J., Wooten, R.M., 1999. Dual role of Interleukin-10 in 430
murine Lyme disease: regulation of arthritis severity and host defense. Infect. Immun. 67, 431
5142-5150. 432
Chen, D., Copeman, D.B., Burnell, J., Hutchinson, G.W., 2000. Helper T cell and antibody responses to 433
infection of CBA mice with Babesia microti. Parasite Immunol. 22, 81-88. 434
Clark, I.A., 2001. Heterologous immunity revisited. Parasitology 122, S51-S59. 435
Cox, F.E.G., 2001. Concomitant infections, parasites and immune responses. Parasitology 122, S23-436
S38. 437
Cullen, J.M., Levine, J.F., 1987. Pathology of experimental Babesia microti infection in the Syrian 438
hamster. Lab. Anim. Sci. 37, 640-643. 439
Eichner, E.R., 1979. Splenic function: normal, too much and too little. Am. J. Med. 66, 311-320. 440
Fenton, A., 2013. Dances with worms: the ecological and evolutionary impacts of deworming on 441
coinfecting pathogens. Parasitology 140, 1119-1132. 442
Graham, A.L., 2008. Ecological rules governing helminth–microparasite coinfection. Proc. Natl. Acad. 443
Sci. USA 105, 566-570. 444
Graham, A.L., Cattadori, I.M., Lloyd-Smith, J.O., Ferrari, M.J., Bjørnstad, O.N., 2007. Transmission 445
consequences of coinfection: cytokines writ large? Trends Parasitol. 23, 284-291. 446
Gutiérrez, R., Krasnov, B., Morick, D., Gottlieb, Y., Khokhlova, I.S., Harrus, S., 2015. Bartonella 447
infection in rodents and their flea ectoparasites: an overview. Vector Borne Zoonotic Dis. 15, 448
27-39. 449
Homer, M.J., Aguilar-Delfin, I., Telford, S.R., Krause, P.J., Persing, D.H., 2000. Babesiosis. Clin. 450
Microbiol. Rev. 13, 451-469. 451
Hunter, C.A., Ellis-Neyes, L.A., Slifer, T., Kanaly, S., Grünig, G., Fort, M., Rennick, D., Araujo, F.G., 452
1997. IL-10 is required to prevent immune hyperactivity during infection with Trypanosoma 453
cruzi. J. Immunol. 158, 3311-3316. 454
Jackson, J.A., Begon, M., Birtles, R., Paterson, S., Friberg, I.M., Hall, A., Lowe, A., Ralli, C., Turner, A., 455
Zawadzka, M., Bradley, J.E., 2011. The analysis of immunological profiles in wild animals: a 456
case study on immunodynamics in the field vole, Microtus agrestis. Mol. Ecol. 20, 893-909. 457
Jackson, J.A., Hall, A.J., Friberg, I.M., Ralli, C., Lowe, A., Zawadzka, M., Turner, A.K., Stewart, A., 458
Birtles, R.J., Paterson, S., Bradley, J.E., Begon, M., 2014. An immunological marker of 459
tolerance to infection in wild rodents. PLoS Biol. 12, e1001901. 460
Jiao, Y.-F., Okumiya, T., Saibara, T., Kudo, Y., Sugiura, T., 2001. Erythrocyte creatine as a marker of 461
excessive erythrocyte destruction due to hypersplenism in patients with liver cirrhosis. Clin. 462
Biochem. 34, 395-398. 463
Johnson, P.T.J., Buller, I.D., 2011. Parasite competition hidden by correlated coinfection: using 464
surveys and experiments to understand parasite interactions. Ecology 92, 535-541. 465
Johnson, P.T.J., de Roode, J.C., Fenton, A., 2015. Why infectious disease research needs community 466
ecology. Science 349. 467
Kabeya, H., Umehara, T., Okanishi, H., Tasaki, I., Kamiya, M., Misawa, A., Mikami, T., Maruyama, S., 468
2009. Experimental infection of cats with Bartonella henselae resulted in rapid clearance 469
associated with T helper 1 immune responses. Microb. Infect. 11, 716-720. 470
Kabeya, H., Yamasaki, A., Ikariya, M., Negishi, R., Chomel, B.B., Maruyama, S., 2007. Characterization 471
of Th1 activation by Bartonella henselae stimulation in BALB/c mice: Inhibitory activities of 472
interleukin-10 for the production of interferon-γ in spleen cells. Vet. Microbiol. 119, 290-296. 473
Livak, K.J., Schmittgen, T.D., 2001. Analysis of relative gene expression data using real-time 474
quantitative PCR and the 2−ΔΔCT method. Methods 25, 402-408. 475
Lykins, J.D., Ristic, M., Weisiger, R.M., Huxsoll, D.L., 1975. Babesia microti: pathogenesis of parasite 476
of human origin in the hamster. Exp. Parasitol. 37, 388-397. 477
Naus, C.W.A., Jones, F.M., Satti, M.Z., Joseph, S., Riley, E.M., Kimani, G., Mwatha, J.K., Kariuki, C.H., 478
Ouma, J.H., Kabatereine, N.B., Vennervald, B.J., Dunne, D.W., 2003. Serological responses 479
among individuals in areas where both schistosomiasis and malaria are endemic: cross-480
reactivity between Schistosoma mansoni and Plasmodium falciparum. J. Infect. Dis. 187, 481
1272-1282. 482
Oksi, J., Rantala, S., Kilpinen, S., Silvennoinen, R., Vornanen, M., Veikkolainen, V., Eerola, E., 483
Pulliainen, A.T., 2013. Cat scratch disease caused by Bartonella grahamii in an 484
immunocompromised patient. J. Clin. Microbiol. 51, 2781-2784. 485
Pedersen, A.B., Babayan, S.A., 2011. Wild immunology. Mol. Ecol. 20, 872-880. 486
Petney, T.N., Andrews, R.H., 1998. Multiparasite communities in animals and humans: frequency, 487
structure and pathogenic significance. Int. J. Parasitol. 28, 377-393. 488
Råberg, L., 2014. How to live with the enemy: understanding tolerance to parasites. PLoS Biol. 12, 489
e1001989. 490
Randall, J., Cable, J., Guschina, I.A., Harwood, J.L., Lello, J., 2013. Endemic infection reduces 491
transmission potential of an epidemic parasite during co-infection. Proc. R. Soc. Lond. B 280. 492
Ranson, R.M., 1934. The field vole (Microtus) as a laboratory animal. J. Anim. Ecol. 3, 70-76. 493
Sanni, L.A., Jarra, W., Li, C., Langhorne, J., 2004. Cerebral edema and cerebral hemorrhages in 494
Interleukin-10-deficient mice infected with Plasmodium chabaudi. Infect. Immun. 72, 3054-495
3058. 496
Scheff, G.J., Scheff, I.M., Eiseman, G., 1956. Concerning the mechanism of Bartonella anemia in 497
splenectomized rats. J. Infect. Dis. 98, 113-120. 498
Schoenfeld, D., 1982. Partial residuals for the proportional hazards regression model. Biometrika 69, 499
239-241. 500
Schulte-Hostedde, A.I., Zinner, B., Millar, J.S., Hickling, G.J., 2005. Restitution of mass-size residuals: 501
validating body condition indices. Ecology 86, 155-163. 502
Sherlock, C., Xifara, T., Telfer, S., Begon, M., 2013. A coupled hidden Markov model for disease 503
interactions. J. Roy. Stat. Soc. Ser. C. (Appl. Stat.) 62, 609-627. 504
Telfer, S., Bown, K.J., Sekules, R., Begon, M., Hayden, T., Birtles, R., 2005. Disruption of a host-505
parasite system following the introduction of an exotic host species. Parasitology 130, 661-506
668. 507
Telfer, S., Lambin, X., Birtles, R., Beldomenico, P., Burthe, S., Paterson, S., Begon, M., 2010. Species 508
interactions in a parasite community drive infection risk in a wildlife population. Science 330, 509
243-246. 510
Telford, S.R., Gorenflot, A., Brasseur, P., Spielman, A., 1993. Babesial infections in humans and 511
wildlife, in: Kreier, J.P., Baker, J.R. (Eds.), Parasitic Protozoa, 2nd Ed, Vol. 5, 2nd ed. Academic 512
Press, New York, pp. 1-47. 513
van Duivenvoorde , L.M., Voorberg-van der Wel, A., van der Werff, N.M., Braskamp, G., Remarque, 514
E.J., Kondova, I., Kocken, C.H.M., Thomas, A.W., 2010. Suppression of Plasmodium cynomolgi 515
in rhesus macaques by coinfection with Babesia microti. Infect. Immun. 78, 1032-1039. 516
Van Peenen, P.F.D., Healy, G.R., 1970. Infection of Microtus ochrogaster with piroplasms isolated 517
from man. J. Parasitol. 56, 1029-1031. 518
Vandesompele, J., De Preter, K., Pattyn, F., Poppe, B., Van Roy, N., De Paepe, A., Speleman, F., 2002. 519
Accurate normalization of real-time quantitative RT-PCR data by geometric averaging of 520
multiple internal control genes. Genome Biol. 3, research0034.1. 521
Vayssier-Taussat, M., Moutailler, S., Féménia, F., Raymond, P., Croce, O., La Scola, B., Fournier, P.-E., 522
Raoult, D., 2016. Identification of novel zoonotic activity of Bartonella spp., France. Emerging 523
Infect. Dis. 22, 457-462. 524
Vogel, C., Marcotte, E.M., 2012. Insights into the regulation of protein abundance from proteomic 525
and transcriptomic analyses. Nat. Rev. Genet. 13, 227-232. 526

Watkins, R.A., Moshier, S.E., O'Dell, W.D., Pinter, A.J., 1991. Splenomegaly and reticulocytosis caused 527
by Babesia microti infections in natural populations of the montane vole, Microtus 528
montanus. J. Protozool. 38, 573-576. 529
Wuerthner, V.P., Hua, J., Hoverman, J.T., 2017. The benefits of coinfection: Trematodes alter disease 530
outcomes associated with virus infection. J. Anim. Ecol. 86, 921-931. 531
532
533
Figures 534
535
Fig. 1. Variation in Microtus agrestis spleen weight with body length and Babesia microti infection 536
status. Spleen weight has been calculated as partial residuals from the model given in Table 4. The 537
effects of Bartonella, breeding status and site have been standardised to their modal values, and 538
condition and season to their median values. Points show partial residuals for each individual (solid = 539
infected with B. microti, outline = uninfected), lines show model predictions (solid = infected, dotted 540
= uninfected) ± standard error in grey. 541

542
Fig. 2. Fold changes in IL-10 expression in vole splenocytes according to Bartonella infection status. 543
Changes are standardised for a typical sampling interval (30 days) and plotted on a log scale. Values 544
have been converted to partial residuals using the model given in Table 5. The effects of Babesia 545
microti, sex, breeding status and site have been standardised to their modal values, and weight 546
change and season to their median values. Boxes show the inter-quartile range (IQR) with a thick 547
horizontal line for the median. Whiskers extend to the smallest/largest values that are within 1.5 x 548
IQR of the box, and values beyond that are shown as individual points. 549
550
Fig. 3. Survival of voles according to infection status. Lines show the proportion of individuals 551
estimated from capture records to have survived at different time points. Solid line = neither Babesia 552
microti nor Bartonella infection (93 records, 34 events), dashed line = B. microti-infected (97 records, 553
36 events), dotted line = Bartonella-infected (278 records, 117 events), dot and dash line = both 554
infections (52 records, 23 events). Note that the reported 100% survival rate over the first 50 days is 555
an artefact due to our exclusion of individuals with only a single capture record. 556
557
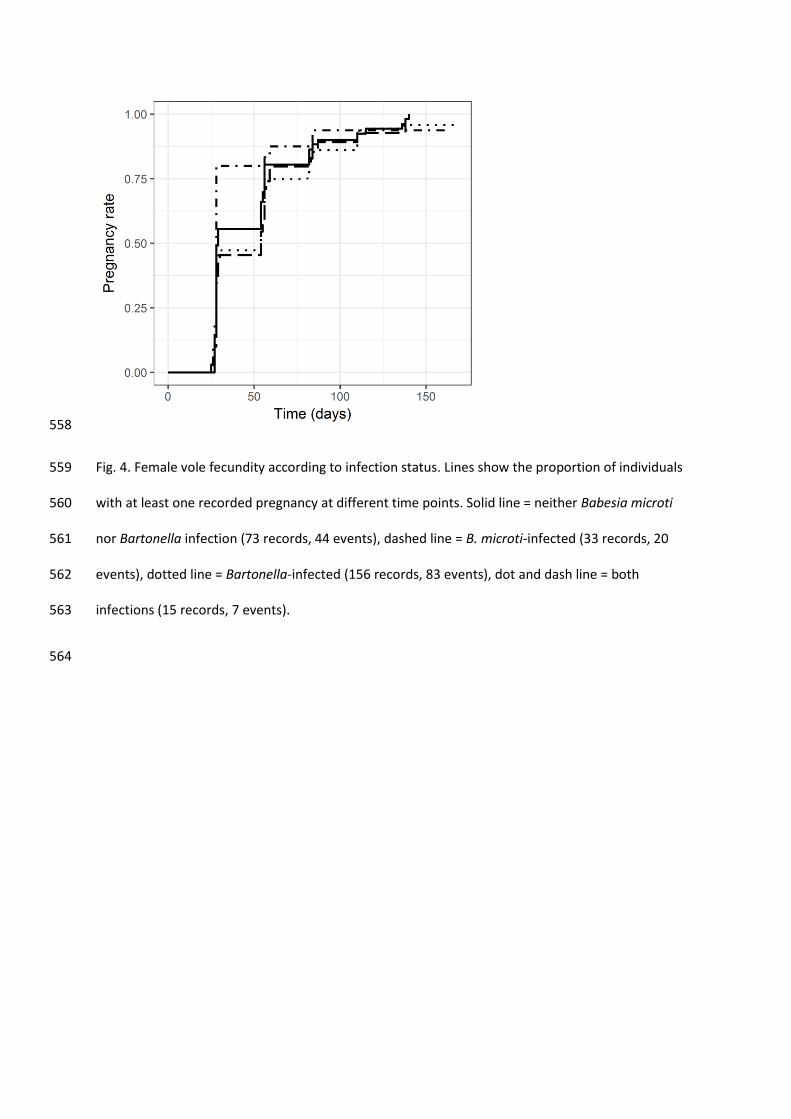
558
Fig. 4. Female vole fecundity according to infection status. Lines show the proportion of individuals 559
with at least one recorded pregnancy at different time points. Solid line = neither Babesia microti 560
nor Bartonella infection (73 records, 44 events), dashed line = B. microti-infected (33 records, 20 561
events), dotted line = Bartonella-infected (156 records, 83 events), dot and dash line = both 562
infections (15 records, 7 events). 563
564
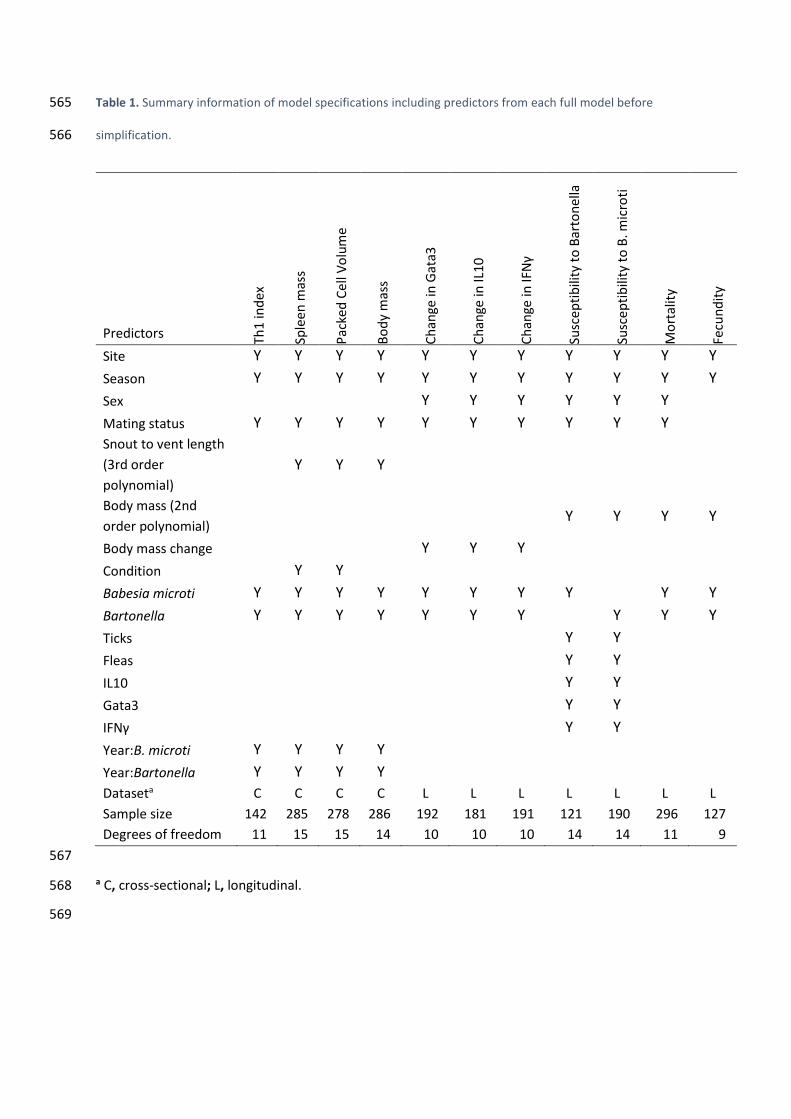
Table 1. Summary information of model specifications including predictors from each full model before 565
simplification. 566
Predictors Th1
ind
ex
Sple
en m
ass
Pac
ked
Cel
l Vo
lum
e
Bo
dy
mas
s
Ch
ange
in G
ata3
Ch
ange
in IL
10
Ch
ange
in IF
Nγ
Susc
ep
tib
ility
to
Bar
ton
ella
Susc
ep
tib
ility
to
B. m
icro
ti
Mo
rtal
ity
Fecu
nd
ity
Site Y Y Y Y Y Y Y Y Y Y Y
Season Y Y Y Y Y Y Y Y Y Y Y
Sex Y Y Y Y Y Y
Mating status Y Y Y Y Y Y Y Y Y Y
Snout to vent length
(3rd order
polynomial)
Y Y Y
Body mass (2nd
order polynomial)
Y Y Y Y
Body mass change Y Y Y
Condition Y Y
Babesia microti Y Y Y Y Y Y Y Y
Y Y
Bartonella Y Y Y Y Y Y Y
Y Y Y
Ticks Y Y
Fleas Y Y
IL10 Y Y
Gata3 Y Y
IFNγ Y Y
Year:B. microti Y Y Y Y
Year:Bartonella Y Y Y Y
Dataseta C C C C L L L L L L L
Sample size 142 285 278 286 192 181 191 121 190 296 127
Degrees of freedom 11 15 15 14 10 10 10 14 14 11 9
567
a C, cross-sectional; L, longitudinal. 568
569
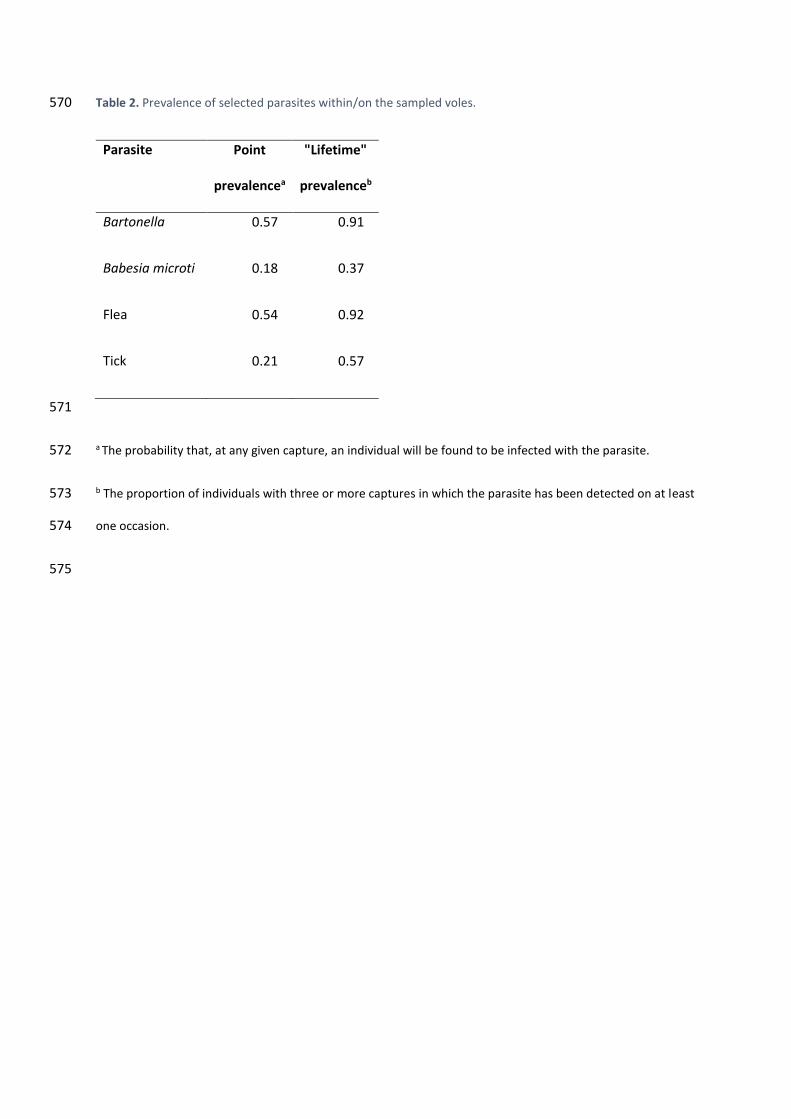
Table 2. Prevalence of selected parasites within/on the sampled voles. 570
Parasite Point
prevalencea
"Lifetime"
prevalenceb
Bartonella 0.57 0.91
Babesia microti 0.18 0.37
Flea 0.54 0.92
Tick 0.21 0.57
571
a The probability that, at any given capture, an individual will be found to be infected with the parasite. 572
b The proportion of individuals with three or more captures in which the parasite has been detected on at least 573
one occasion. 574
575
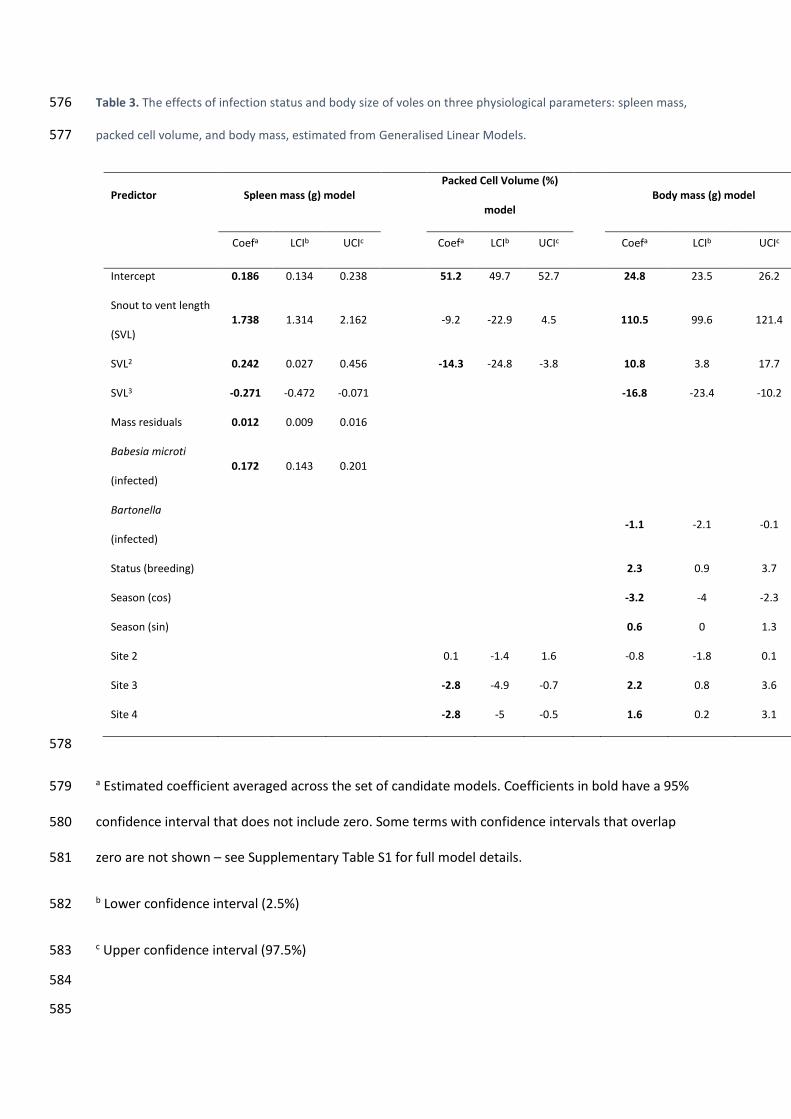
Table 3. The effects of infection status and body size of voles on three physiological parameters: spleen mass, 576
packed cell volume, and body mass, estimated from Generalised Linear Models. 577
Predictor Spleen mass (g) model Packed Cell Volume (%)
model
Body mass (g) model
Coefa LCIb UCIc Coefa LCIb UCIc Coefa LCIb UCIc
Intercept 0.186 0.134 0.238 51.2 49.7 52.7 24.8 23.5 26.2
Snout to vent length
(SVL) 1.738 1.314 2.162
-9.2 -22.9 4.5
110.5 99.6 121.4
SVL2 0.242 0.027 0.456 -14.3 -24.8 -3.8 10.8 3.8 17.7
SVL3 -0.271 -0.472 -0.071 -16.8 -23.4 -10.2
Mass residuals 0.012 0.009 0.016
Babesia microti
(infected) 0.172 0.143 0.201
Bartonella
(infected)
-1.1 -2.1 -0.1
Status (breeding) 2.3 0.9 3.7
Season (cos) -3.2 -4 -2.3
Season (sin) 0.6 0 1.3
Site 2 0.1 -1.4 1.6 -0.8 -1.8 0.1
Site 3 -2.8 -4.9 -0.7 2.2 0.8 3.6
Site 4 -2.8 -5 -0.5 1.6 0.2 3.1
578
a Estimated coefficient averaged across the set of candidate models. Coefficients in bold have a 95% 579
confidence interval that does not include zero. Some terms with confidence intervals that overlap 580
zero are not shown – see Supplementary Table S1 for full model details. 581
b Lower confidence interval (2.5%) 582
c Upper confidence interval (97.5%) 583
584
585
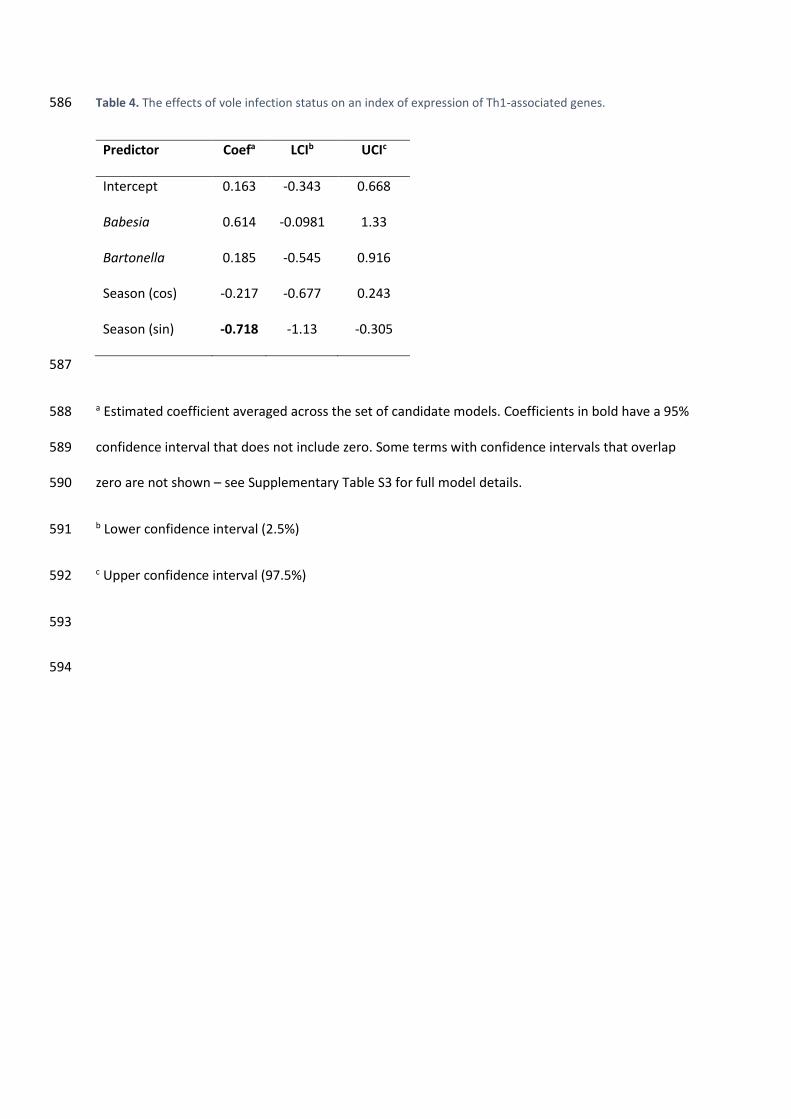
Table 4. The effects of vole infection status on an index of expression of Th1-associated genes. 586
Predictor Coefa LCIb UCIc
Intercept 0.163 -0.343 0.668
Babesia 0.614 -0.0981 1.33
Bartonella 0.185 -0.545 0.916
Season (cos) -0.217 -0.677 0.243
Season (sin) -0.718 -1.13 -0.305
587
a Estimated coefficient averaged across the set of candidate models. Coefficients in bold have a 95% 588
confidence interval that does not include zero. Some terms with confidence intervals that overlap 589
zero are not shown – see Supplementary Table S3 for full model details. 590
b Lower confidence interval (2.5%) 591
c Upper confidence interval (97.5%) 592
593
594
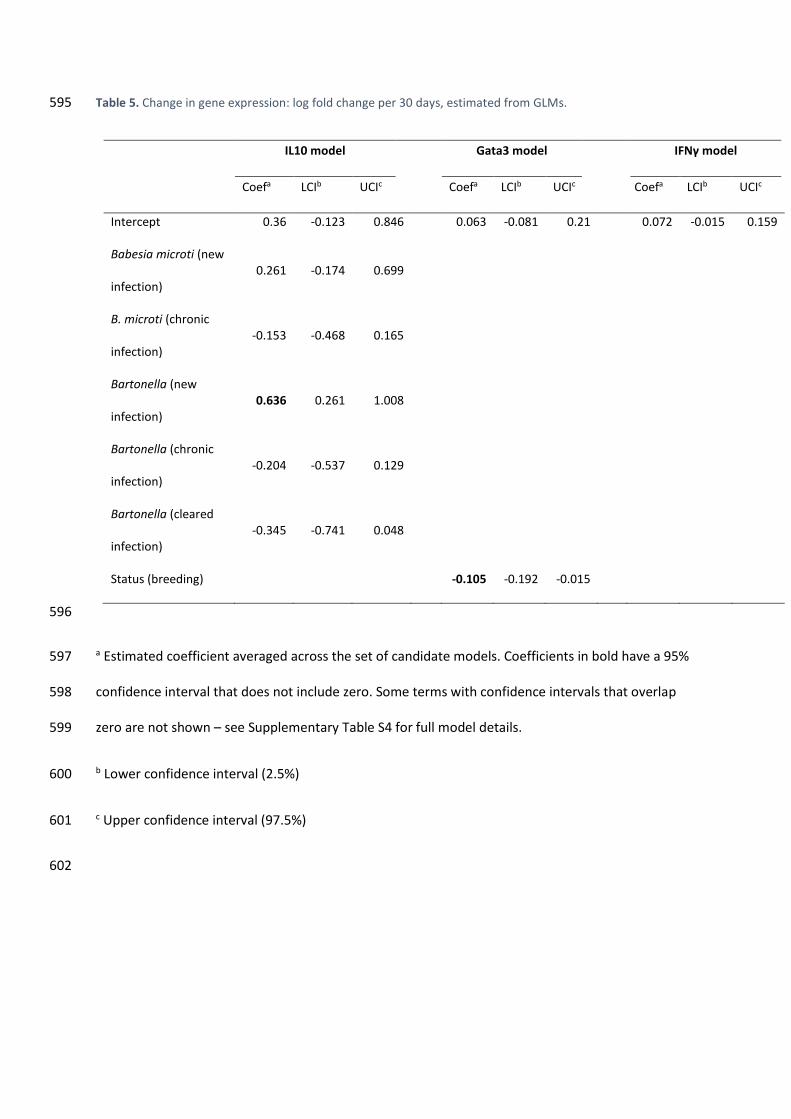
Table 5. Change in gene expression: log fold change per 30 days, estimated from GLMs. 595
IL10 model Gata3 model IFNγ model
Coefa LCIb UCIc Coefa LCIb UCIc Coefa LCIb UCIc
Intercept 0.36 -0.123 0.846 0.063 -0.081 0.21 0.072 -0.015 0.159
Babesia microti (new
infection) 0.261 -0.174 0.699
B. microti (chronic
infection) -0.153 -0.468 0.165
Bartonella (new
infection) 0.636 0.261 1.008
Bartonella (chronic
infection) -0.204 -0.537 0.129
Bartonella (cleared
infection) -0.345 -0.741 0.048
Status (breeding) -0.105 -0.192 -0.015
596
a Estimated coefficient averaged across the set of candidate models. Coefficients in bold have a 95% 597
confidence interval that does not include zero. Some terms with confidence intervals that overlap 598
zero are not shown – see Supplementary Table S4 for full model details. 599
b Lower confidence interval (2.5%) 600
c Upper confidence interval (97.5%) 601
602

Table 6. Susceptibility of voles to Babesia microti and Bartonella infections: estimated log odds ratios from 603
binomial Generalised Linear Model. 604
Bartonella model B. microti model
Coef
a LCIb UCIc
Coef LCI UCI
Intercept 0.88 -0.71 2.48 -2.56 -3.73 -1.38
B. microti (infected) -1.12 -1.96 -0.27
Bartonella (infected) -0.06 -0.51 0.39
Sex (M) 0.1 -0.43 0.62 1.39 0.5 2.28
Body mass 3.24 -1.69 8.16
Body mass2 7.6 2.52 12.7
605
a Estimated coefficient averaged across the set of candidate models. Coefficients in bold have a 95% 606
confidence interval that does not include zero. The binomial model returns log odds ratios, so odds 607
ratio = ecoef. Some terms with confidence intervals that overlap zero are not shown – see 608
Supplementary Table S6 for full model details. 609
b Lower confidence interval (2.5%) 610
c Upper confidence interval (97.5%) 611
612
613
614
615
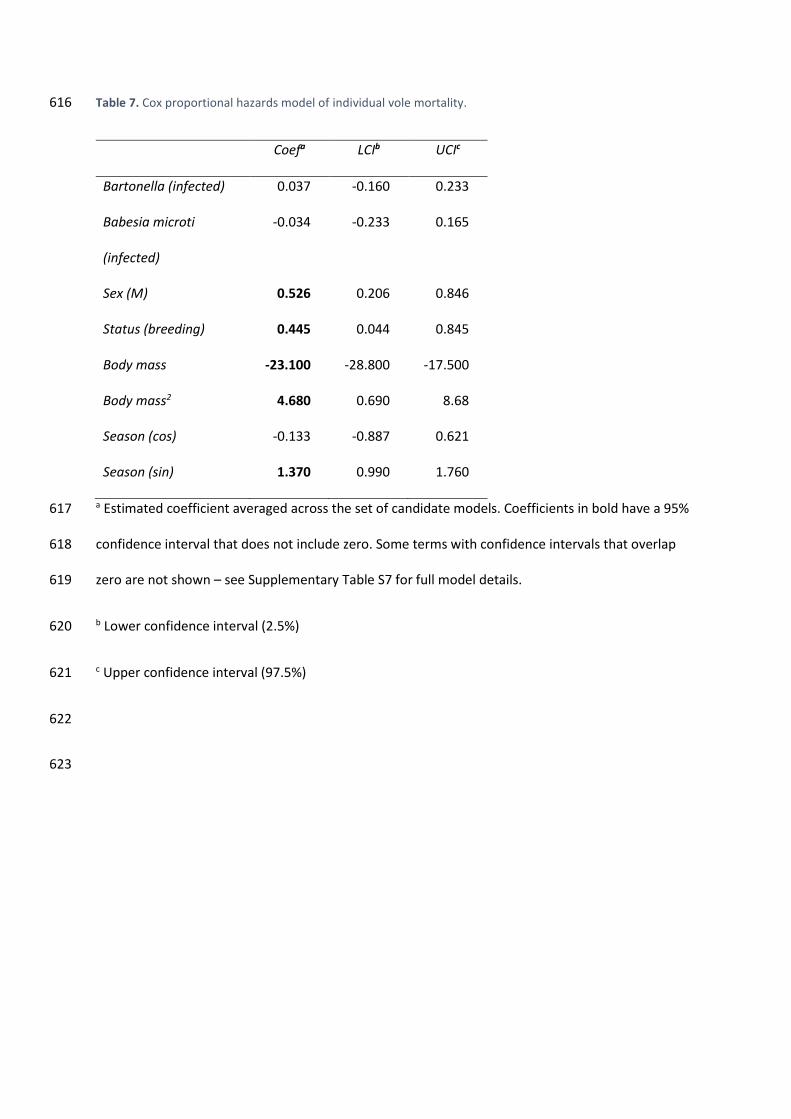
Table 7. Cox proportional hazards model of individual vole mortality. 616
Coefa LCIb UCIc
Bartonella (infected) 0.037 -0.160 0.233
Babesia microti
(infected)
-0.034 -0.233 0.165
Sex (M) 0.526 0.206 0.846
Status (breeding) 0.445 0.044 0.845
Body mass -23.100 -28.800 -17.500
Body mass2 4.680 0.690 8.68
Season (cos) -0.133 -0.887 0.621
Season (sin) 1.370 0.990 1.760
a Estimated coefficient averaged across the set of candidate models. Coefficients in bold have a 95% 617
confidence interval that does not include zero. Some terms with confidence intervals that overlap 618
zero are not shown – see Supplementary Table S7 for full model details. 619
b Lower confidence interval (2.5%) 620
c Upper confidence interval (97.5%) 621
622
623

Table 8. Cox proportional hazards model of female vole fecundity. 624
Coefa LCIb UCIc
Babesia microti
(infected)
-0.01 -0.18 0.15
Bartonella (infected) -0.04 -0.22 0.14
Body mass -3.97 -7.58 -0.35
Body mass2 -3.84 -6.76 -0.91
Season (cos) -0.64 -1.09 -0.19
Season (sin) 0.09 -0.24 0.43
a Estimated coefficient averaged across the set of candidate models. Coefficients in bold have a 95% 625
confidence interval that does not include zero. Some terms with confidence intervals that overlap 626
zero are not shown – see Supplementary Table S8 for full model details. 627
b Lower confidence interval (2.5%) 628
c Upper confidence interval (97.5%) 629
630
631