a scientometric profile on dublin core in scopus
TRANSCRIPT

International Journal of Library and Information Studies Vol.8(2) Apr-Jun, 2018 ISSN: 2231-4911
UGC Approved/Jr.No.64344 --- http://www.ijlis.org 142 | P a g e
A Scientometric Profile on Dublin Core in SCOPUS
Akulwar Mahesh Satish
M.Phil. Research Scholar Dept .of Library & Information Science
Dr. Babasaheb Ambedkar Marathwada University Aurangabad. (MS)India
e-mail : [email protected]
Vaishali Khaparde Professor and Head
Dept .of Library & Information Science Dr. Babasaheb Ambedkar Marathwada University
Aurangabad. (MS) India e-mail: [email protected]
Abstract - The present study is based on the Scientometricis analysis of 266 research article published in SCOPUS on Dublin Core during the period of 2012-2016. This Study will review on year-wise distribution, Authorship pattern of contributions, Author wise distribution, Institution wise distribution, country-wise distribution, reference of the article, Length of Article wise distribution. The findings must reveal various aspects of the characteristics and patterns of contributions of the study. Keywords: Scientometrics, Dublin Core, SCOPUS, Authorship pattern
1. INTRODUCTION Scientometrics is a branch of the science ‘Science of Science’. Haitun treats ‘Scientometrics’, as scientific disciplines, which performs reproducible measurements of scientific activity. (Haitun, 1983). Now a day’s scientometrics is one of the truly interdisciplinary research fields extended to almost all scientific fields. Scientometrics applications are used to measure scientific activities, mainly by producing statistics on scientific publications indexed in databases. Scientometrics is the branch of science that describes the output traits in terms of organizational research structure, resource inputs and outputs, develops benchmarks to evaluate the quality of information output. Also Scientometric studies characterize the disciplines using the growth pattern and other attributes. These applications are extremely valuable methods for evaluating research output, to know about the author productivity and citation analysis in science and technology. Further Scientometric tools can be used to measure and describe countries, universities, research institutes, journals, specific research topics and specific disciplines (Singh, 2014). 2. Scientometrics: According to bankapur, M.B. and Kumabar, (1993) “Scientometrics is a more general that Bibliometrics. It is interesting to know, that both disciplines have a large overlap. It is surprised to learn certain comments stating that both disciplines have a large overlap. It is surprised to learn certain comments stating that Scientometrics, using Bibliometrics techniques id a part of Bibliometrics”. According to Wouters (2006) a cart intension has always existed between academic Scientometrics and political /practical, Scientometrics, the letter of which has been described as a hybrid of social science and bur rerate expertise.

International Journal of Library and Information Studies Vol.8(2) Apr-Jun, 2018 ISSN: 2231-4911
UGC Approved/Jr.No.64344 --- http://www.ijlis.org 143 | P a g e
3. SCOPUS: Scopus is Elsevier’s abstract and citation database launched in 2004. In 2009, the Content Selection and Advisory Board (CSAB) was formed to develop an objective system of evaluation and validation of peer-reviewed journals for inclusion or exclusion in Scopus against transparent and fair criteria. Covers nearly 36,377 titles (22,794 active titles and 13,583 Inactive titles) from approximately 11,678 publishers, of which 34,346 are peer-reviewed journals in top-level subject fields Life Sciences, Social Sciences, Physical Sciences and Health Sciences. It covers three types of sources: Book Series, Journals, and Trade Journals. All journals covered in the Scopus database, regardless of who they are published under, are reviewed each year to ensure high-quality standards are maintained. Searches in Scopus also incorporate searches of patent databases. It gives four types of quality measure for each title, those are h-Index, CiteScore, SJR (SCImago Journal Rank) and SNIP (Source Normalized Impact per Paper). Anyone can find all titles on the Scimago Journal Ranking website. According to the Scimago Journal Rankings, Nature has the highest h-index (1011 as of 2016), and CA - A Cancer Journal for Clinicians has the highest SJR (39.285 as of 2016) and CiteScore 2016 (89.23 in the 99th percentile). Scimagojr.com used to give country ranking based on Total Published Documents, Citable documents, Citations, Self-Citations, Citations per Document and h-index. As per this website USA (h-index: 1965) is in first place, UK (h-index : 1213) is in the second place and Germany (h-index : 1059) is in third place based on national h-index 4. LITERATURE REVIEW: Khaparde & Pawar (2013) studied the authorship pattern and author’s collaborative research in Information Technology with a sample of 17917 articles collect from LISA during 2000-2009.The average number of authors per article is 1.80. In the study the degree of collaboration (C) during the overall 10 years (2000-2009) is 0.71 but the year wise degree of collaboration is almost same in all the years of mean value 0.49. According to 10 years of period, the multi- authorship articles are higher and predominant on single authorship. The study found that the researches in Information Technology are keep toward team research or group research rather than solo research. Khaparde (2013) the paper studied the Bibliometric Analysis of Research Publication of Department of Chemistry, Dr. Babasaheb Ambedkar Marathwada University, from 1975 to 2012. It analyzed all the 774research publications from the 144 journals. It examines year- wise distribution of papers, authorship pattern, journal in which author publish, it revealed that the number of publications has increased consistently from the year 1975 to the year 2012. 25% of the total publications have been made in 2009, 2010, and 2011. And the majority of the publications are made with 4 authors. And also the majority of the research paper published in journal of heterocyclic chemistry. Alhamdi, Khaparde& Kanekar (2014) they attempted on bibliometric analysis of ten volumes (57-66) in the field of journal of Documentation. It is based on the references appended to International Journal of “Journal of Documentation” during 2001-2010. The present study is based on 15150 references appended to 364 articles contributed by the authors in Journal of Documentation. It was found that Journals Citations are more in number than other citations. In Authorship pattern it was found that Solo Researchers are Predominant than Collaborative Researchers. The extent of collaboration was not much popular among the Journal of Documentation. The mean relative growth for articles and citation in the first five years 2001 to 2005 is reduced according to the last five years 2006 to 2010.The value of group co-efficient (gp) was only 0.46. It was seen that researchers cited latest documents. Universities are the major contributors. The study shows the UK, USA, Finland, and Denmark, have the

International Journal of Library and Information Studies Vol.8(2) Apr-Jun, 2018 ISSN: 2231-4911
UGC Approved/Jr.No.64344 --- http://www.ijlis.org 144 | P a g e
majority of most cited records in Journal of Documentation. Out of 364 articles there are 175 articles have pages length from 11 to 20. Alhamdi, Khaparde & Wankhede Raju, (2014) The present study deals a Scientometric analysis of 56 papers published in the Library and Information science & Technical Abstract (LISTA) on internet use in the subject of library &Information science during the period 2004 - 2013. Data is collected and analyzed by using the SPSS software. The study focused on various aspects: such as document types, growth Rate (GR) and doubling time (DT) of publications and citations, year-wise, authorship pattern, institutions involved, most prolific authors of the journal. The study revealed that most of the papers (71.4%) of papers were contributed by multiple authors. USA is the top producing country with 8 (14.3%) publications of the total output. All the articles were published in English language. The mean doubling time for the first five years (i.e. 2004 to 2008) is only (1.05) which is increased to (6.07) during the last five years (2009 to 2013). Maximum 35 (62.5%) out of 56 of the authors are not mentioned their email address in the paper. (Khaparde V.S 2011). Bibliometric encompasses the measurements of properties of documents, &document related process. It uses mathematical & statistical methods to analysis & measure the output of scientific publications. (Khaparde V.S 2011) Bibliometrics is an emerging trust area of research in the field of Library & Information science. Bibliometrics analysis is now considered as an active area of bibliometric research. (Khaparde V.S 2011). Today information is the most vital resources for any kind of activity. The internet has an access to valuable resources scattered in various forms in different parts of the world. (Khaparde V.S 2011). Scientometrics is to provide quantitative characterization of scientific activity. Scientometric is branch of Library &Information Science. Fawaz Alhamdi and Vaishali Khaparde (2015) Analyzed Authorship pattern in cloud computing research in LISTA . They collect 108 articles during the year 2009 to 2013.In this study The number of contributions found to be the highest is 24 in the year of 2012. The rate of growth of publication highly decreased from the rate of 0.693 in 2010 to0.193 .in2013 Whereas the corresponding the Doubling time for different years gradually increased from 1 in 2010 to 3.95 in 2013. 5. OBJECTIVE OF THE STUDY:
To study the year-wise distribution of publishing and citation. To study the growth Rate (GR) and doubling time (DT) of publications To find out the authorship and degree of collaboration pattern in the publication To identify the length of Article. To find out organization-wise distribution of publication. To find out country-wise distribution of publication.
6. SCOPE AND LIMITATION OF THE STUDY: The present study is based on the Scientometrics Profiles of Dublin Core in SCOPUS. The present study is based on over all 266 contributions during 2012-2016. 7. DATA COLLECTION Data can be numerically expressed that is quantified quantifiable or objective (Fasibs off and Dely, 1990) the data was collected from SCOPUS, with the help of excel and spss. Total 266 contributions during 2012-2016.

International Journal of Library and Information Studies Vol.8(2) Apr-Jun, 2018 ISSN: 2231-4911
UGC Approved/Jr.No.64344 --- http://www.ijlis.org 145 | P a g e
8. DATA ANALYSIS AND INTERPRETATION: Scientometrics analysis is a branch of bibliometrics. It is an important research tools for understanding of the subject it aims at measuring the utility of documents and relationship between documents and fields. The present study is based on the Scientometric profile of Dublin Core in SCOPUS 2012-2016 DATA INTERPRETATION: In views of the objectives of the present study, analysis the terms “Dublin Core” in the database “SCOPUS” on during 2012-2016.
Table-1.Year Wise Distribution Of Papers Sr. No. Year Frequency Percentage
01 2012 46 17.29 02 2013 64 24.06 03 2014 68 25.56 04 2015 62 23.31 05 2016 26 9.77
Total 266 100.00
Fig-1.Year Wise Distribution of Papers
Table-1 and fig.-1 shows the year-wise distribution of papers on in “Dublin Core ” in SCOPUs during 2012-2016. The highest numbers of papers were published in the year of 2014 contributing 68 (25.56 %) papers, followed by 64(24.06 %) papers in 2013, 62(23.31%) papers in 2015, and 46(17.29%) papers in 2012. The minimum numbers 26(9.77%) of papers were published in 2016.
0
10
20
30
40
50
60
70
2012 2013 2014 2015 2016
46
6468
62
26

International Journal of Library and Information Studies Vol.8(2) Apr-Jun, 2018 ISSN: 2231-4911
UGC Approved/Jr.No.64344 --- http://www.ijlis.org 146 | P a g e
Table-2 Authorship pattern Year 2012 2013 2014 2015 2016 Total
Single Author 10 16 10 11 4 51 Two Authors 10 14 22 18 6 70 Three Authors 14 12 13 18 6 63 Four Authers 5 8 12 5 3 33 Five Authors 4 6 5 1 3 19 Six Author 0 2 1 2 1 6 More than Six Authors 1 3 1 6 2 13 NA 2 3 4 1 1 11
Total 46 64 68 62 26 266 Table-2 show the authorship pattern of the papers published during the period of study. The highest numbers of articles had been published by two authors 70. This is followed by 63 authors in three author. The minimum numbers of authors is six author of 6. MOST PRODUCTIVE AUTHORS:
Table -3 Most Productive Author Sr. No Authors Total %
1 Baptista A.A. 6 0.79 2 Da MattaVegi L.F. 5 0.66 3 Lisboa-Filho J. 5 0.66 4 Ribeiro C. 5 0.66 5 Eckert K. 4 0.53 6 Sugimoto S. 4 0.53 7 Asserson A. 3 0.40 8 Beall J. 3 0.40 9 Borba C.F. 3 0.40 10 Bosch T. 3 0.40 11 Correa P.L.P. 3 0.40 12 da Silva J.R. 3 0.40 13 Gonçalves, J. 3 0.40 14 Greenberg J. 3 0.40 15 Jeffery K.G. 3 0.40 16 Khoo M. 3 0.40 17 Liu X. 3 0.40 18 Malta M.C. 3 0.40 19 Phillips M. 3 0.40 20 Tarver H. 3 0.40 21 Tudhope D. 3 0.40 22 Author Publishing Two (2x71) 142 18.73 23 Author Publishing Single (1x531) 531 70.05 24 No author name available 11 1.45
Total 758 100 It can be observed from Table-3 that, the most productive authors are Baptista A.A. who had contributed 6 papers. And this followed by Da MattaVegi L.F., Lisboa-Filho J. and

International Journal of Library and Information Studies Vol.8(2) Apr-Jun, 2018 ISSN: 2231-4911
UGC Approved/Jr.No.64344 --- http://www.ijlis.org 147 | P a g e
RibeiroC.had each contributed 5 papers. The rest 531 (70.05 %) authors each published one article.
Table-4 Institute-Wise Distribution of Articles Published Sr. No. Institution Frequency Percentage
1 Departamento de Informática, Universidade Federal de, Brazil 11 1.45 2 University of North Texas, United States 11 1.45 3 University of Illinois, Urbana-Champaign, United States 10 1.32 4 Research Programs Section Fixed, Hellenic Telecommunications
Organization (OTE), SA 99 Kifissias Avenue, Athens, Greece 8 1.06
5 Algoritmi Center, University of Minho, Portugal 7 0.92 6 GESIS, Leibniz Institute for the Social Sciences, Germany 7 0.92 7 Departamento de Informacion y Comunicación, Universidad de
Granada, Granada, Spain 6 0.79
8 Department of Computer Science, VU University Amsterdam, De Boelelaan 1081a, 1081 HV Amsterdam, Netherlands, Europeana, KoninklijkeBibliotheek, Prins Willem-Alexanderhof 5,, Netherlands
6 0.79
9 German Aerospace Center, Germany 6 0.79 10 Ghent University, IMinds, Data Science Lab, Belgium, University of
Sao Paulo, ICMC, Sao Carlos, Brazil 6 0.79
11 Graphics, Multimedia and GIS System Lab, Computer Engineering and Informatics Department, University of Patras, Rio Patras, Greece
6 0.79
12 University of Houston, United States 6 0.79 13 University of Sao Paulo, ICMC, Sao Carlos, Brazil 6 0.79 14 Five Institution Publication 5x14 70 9.23 15 Fore Institution Publication 4 x22 88 11.61 16 Three Institution Publication 3 x 37 111 14.64 17 Two Institution Publication 2x95 190 25.07 18 Single Institution Publication 1x192 192 25.33 19 NA 11 1.45
Total 758 100
Institution is a society or organization for the promotion of science, education etc. An institute is a permanent organizational body created for a certain purpose. Often it is a research organization (research institution) created to do research on specific topics. An institute can also be a professional body. In some countries institutes can be part of a university or other institution of higher education, either as a group of departments or an autonomous educational institution without a classic full university status such as a University Institute.
Table-5 Country-Wise Distribution of Articles Sr.No Country Total %
1 United States 173 22.82 2 Greece 59 7.78 3 Brazil 58 7.65 4 Ireland 42 5.54 5 Germany 40 5.28 6 Portugal 40 5.28 7 China 33 4.35
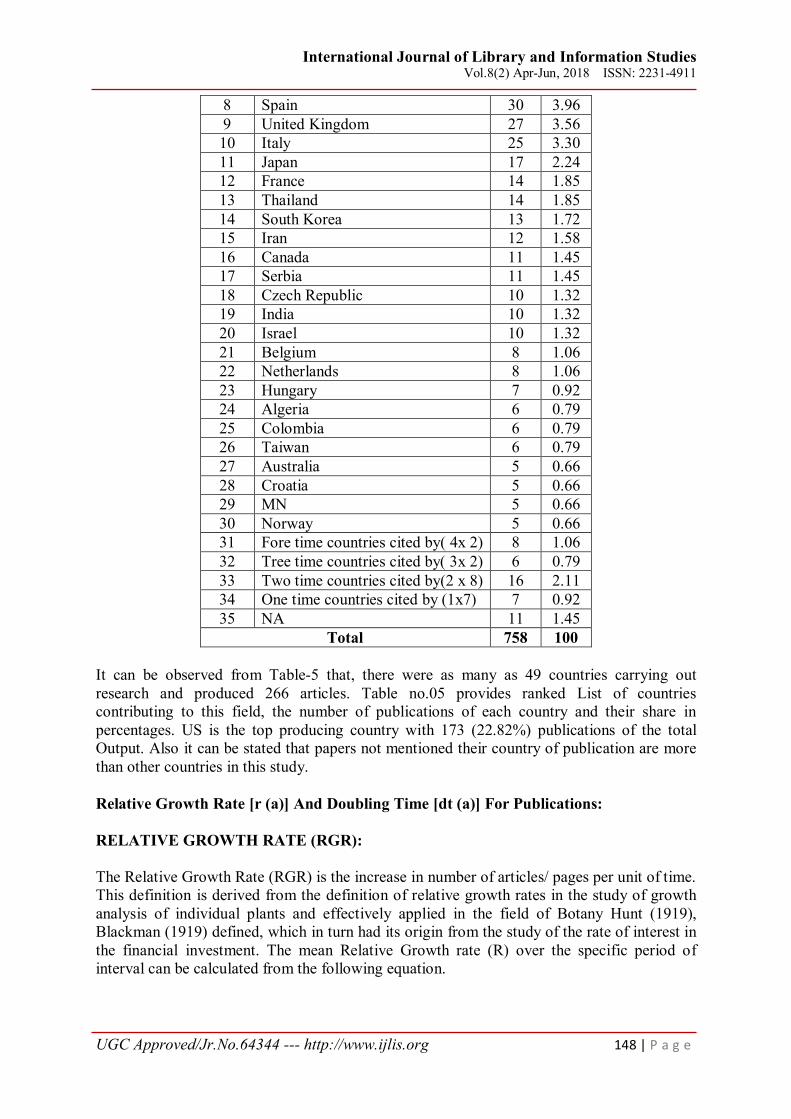
International Journal of Library and Information Studies Vol.8(2) Apr-Jun, 2018 ISSN: 2231-4911
UGC Approved/Jr.No.64344 --- http://www.ijlis.org 148 | P a g e
8 Spain 30 3.96 9 United Kingdom 27 3.56 10 Italy 25 3.30 11 Japan 17 2.24 12 France 14 1.85 13 Thailand 14 1.85 14 South Korea 13 1.72 15 Iran 12 1.58 16 Canada 11 1.45 17 Serbia 11 1.45 18 Czech Republic 10 1.32 19 India 10 1.32 20 Israel 10 1.32 21 Belgium 8 1.06 22 Netherlands 8 1.06 23 Hungary 7 0.92 24 Algeria 6 0.79 25 Colombia 6 0.79 26 Taiwan 6 0.79 27 Australia 5 0.66 28 Croatia 5 0.66 29 MN 5 0.66 30 Norway 5 0.66 31 Fore time countries cited by( 4x 2) 8 1.06 32 Tree time countries cited by( 3x 2) 6 0.79 33 Two time countries cited by(2 x 8) 16 2.11 34 One time countries cited by (1x7) 7 0.92 35 NA 11 1.45
Total 758 100 It can be observed from Table-5 that, there were as many as 49 countries carrying out research and produced 266 articles. Table no.05 provides ranked List of countries contributing to this field, the number of publications of each country and their share in percentages. US is the top producing country with 173 (22.82%) publications of the total Output. Also it can be stated that papers not mentioned their country of publication are more than other countries in this study. Relative Growth Rate [r (a)] And Doubling Time [dt (a)] For Publications: RELATIVE GROWTH RATE (RGR): The Relative Growth Rate (RGR) is the increase in number of articles/ pages per unit of time. This definition is derived from the definition of relative growth rates in the study of growth analysis of individual plants and effectively applied in the field of Botany Hunt (1919), Blackman (1919) defined, which in turn had its origin from the study of the rate of interest in the financial investment. The mean Relative Growth rate (R) over the specific period of interval can be calculated from the following equation.

International Journal of Library and Information Studies Vol.8(2) Apr-Jun, 2018 ISSN: 2231-4911
UGC Approved/Jr.No.64344 --- http://www.ijlis.org 149 | P a g e
R 1-2 = Loge 2 W - loge IW Whereas, 1-2 R = mean relative growth rate over the specific period of interval. Loge IW = log of initial number of Articles. Loge 2 W = log of final number of articles after a specific period of interval. 2 T - 1 T = the unit difference between the initial time and final time. The year can be taken here as the unit of time. The RGR for articles is hereby circulated. Therefore, 1-2 (aa-1 year-1) can represent the mean relative growth rate per unit of year over a specific period of interval. DOUBLING TIME (DT) There exists a direct equivalence between the relative growth rate and the doubling time. If the numbers of articles/pages of subject double during a given period then the difference the logarithms of numbers at the beginning and end of this period must be logarithms of number 2. If natural logarithm is used this difference has a value of 0.693. Thus the corresponding doubling time for each specific period of interval and for both articles and pages can be calculated by the formula, Doubling time (Dt) = 0.693/ R (A) Therefore, Doubling time for articles D(t) = 0.693/1-2 R (aa-1 year-1)
Table-6: Relative Growth Rate and Doubling Time of Publication Year No of
Articles Cumulative Frequency W1 W2 RGR Mean[R(A)] DT(A) Mean
DT(A) 2012 45 45 3.8
0.342
2.306 2013 64 109 3.8 4.69 0.89 0.78 2014 67 176 4.69 5.17 0.48 1.44 2015 46 222 5.17 5.4 0.23 3.01 2016 26 248 5.4 5.51 0.11 6.3
From the table -6 no, it noticed that the mean relative growth for the first five years 2012 to 2016 is (0.342). While the Doubling time for different years [DT (A)] gradually increased from (2.306).Thus as the rate of growth of publication was decreased, the corresponding Doubling Time was increased.
Table-7 Number of Page wise Distribution of the Article Year 1 To 5 6 To 10 11 To 15 16 To 20 21 To 25 > 26 Total 2012 8 16 9 4 4 1 42 2013 5 20 17 6 3 5 56 2014 9 28 11 3 2 2 55 2015 14 17 14 6 2 1 54 2016 3 5 7 3 1 1 20 Total 39 86 58 22 12 10 227
It can be observed from Table-7, that the highest number of 86 articles contains 6 To 10 pages, followed by 58 articles contain 11 To15 pages.

International Journal of Library and Information Studies Vol.8(2) Apr-Jun, 2018 ISSN: 2231-4911
UGC Approved/Jr.No.64344 --- http://www.ijlis.org 150 | P a g e
Table-8: Language-wise Distribution of Art Sr. No Name of Language Total %
1 English 255 95.86 2 Persian 4 1.50 3 Portuguese 3 1.13 4 Spanish 3 1.13 5 Catalan 1 0.38
Total 266 100.00
From table 8 show that, the language wise distribution of Article on SCOPUS. Total 266 Article were published in “Dublin Core” from 2012 to 2016. The 255 (95.86%) the articles were published in English language.
Table-9: Number of References wise Distribution of the Article
Year Print References Web References Total References
2012 785 430 1215 2013 919 532 1451 2014 862 610 1472 2015 681 518 1199 2016 200 483 683 Total 3447 2573 6020
It can be observed from the table no 09 and figure no 03 also majority articles are from print references. The total 3447 were print references. And 2573 were web references during the period of five year. During the period of five year the majority print references in the year of 2013 were 919. And then during the period of five year the minimum references are from web references total 200 web references in the duration of 2012 to 2016.during the period of five year majority web references in the year of 2014 is 610 web references are given there. 8 FINDINGS :
The highest numbers 68 (25.56 %) of papers were published in 2014 contributing. The highest numbers of articles has been published by three authors 67. Most productive authors are Baptista A.A. who had contributed 6 papers. Only University of Federal de Brazil contributed 11(1.45) times. 49 countries carrying out research and produced 266 articles. United States is the top
producing country with 173 (22.82%) publications of the total output. The 255 (95.86%) articles were published in English Language. The highest number of 86 articles contains 6 to 10 pages. The majority print references in the year of 2013 were 919 and majority of web
references in the year of 2014 were 610. 9 CONCLUSION: Scientometrics relatively new subject of information. It helps to evaluate information & to handle the information in libraries and information centers by the quantitative analyzed

International Journal of Library and Information Studies Vol.8(2) Apr-Jun, 2018 ISSN: 2231-4911
UGC Approved/Jr.No.64344 --- http://www.ijlis.org 151 | P a g e
information. It deals with the mathematical and statistical analysis. This is an umbrella term used for many studies where quantitative method or techniques are used to investigate various aspect of written document. We concluded that the present study is based on Dublin Core. During the period of five years in the SCOPUS. This study is completed with the help of Excel. this study is helpful for researches as well as information scientists. it is good and informative for the researcher. REFERENCES:
1. Alhamdi, F. A., Khaparde, V., & Kanekar, B. V. (2014). Journal of Documentation: A Bibliometric Study (2001-2010). Excel’s International Journal of Social Science & Humanities,1(2).57-70.
2. Blackman VH( 2005). The compound interest law and plant growth. Annals of Botany, 33. 353-360.
3. Haitun D. (1983). Scientometrics: State and Perspectives, Science, 8, 48-54. 4. Kademani, B. S., Sagar, A., Kumar, A., Kumar, V. (2008). Scientometric mapping of
vacuum research in nuclear science & technology: A Global perspective, Journal of Physics: Conference Series, 114. 32
5. Khaparde, V S (2013) . Bibliometric Analysis of Research Publication of Department of Chemistry, Dr. Babasaheb Ambedkar Marathwada University, Aurangabad. Journal of Computer Science & Information Technology. 1 (1). 65-73.51.
6. Khaparde V.S.(2011) E journals in library and information sciences and information science: A Bibliometric study .International journals of Humanities and Social Sciences., Vol. 1(12) Center for promoting Ideas,USA.
7. Khaparde V.S..(2011) Pattern of information use by researchers in library and nformation science:.International journals of Humanities and Social Sciences.,Vol. 1(12) Center for promoting Ideas,USA.
8. Khaparde V.S. .(2011) Use of Information by Library Science Professionals : A Bibliometric Study. British Journal of Humanities and Social Science. Vol.1(2), London, United Kingdom, 78-90 ISSN 2048 – 1268.
9. Khaparde, V. and Pawar .S. Authorship Pattern and Degree of Collaboration in Information Technology. Journal of Computer Science & Information Technology. 2013.1 (1), 46-54.
10. LISTA. Accessed on 01, November, 2014. From: : http://lista.org/ 11. Saha, N. C., Das, S. K, and Sharma, a. k. Contributions in the Proceedings of Planner
(2006-2010): A Bibliometric Study. IASLIC Bulletin. 2013. 58 (2). 93-107. 12. Singh, J. K. (2014). Research Journal of Library Sciences, 1(2). 7-12.