a sea of change: biogeochemical variability in the north
TRANSCRIPT
MINIREVIEWS
A Sea of Change: BiogeochemicalVariability in the North Pacific
Subtropical Gyre
David M. Karl
School of Ocean and Earth Science and Technology, Department of Oceanography, University of Hawaii, Honolulu, Hawaii 96822
ABSTRACTThe North Pacific Subtropical Gyre (NPSG) is thelargest ecosystem on our planet. However, thisexpansive habitat is also remote, poorly sampled,and therefore not well understood. For example,the most abundant oxygenic phototroph in theNPSG, Prochlorococcus, was described only a decadeago. Other novel Bacteria, Archaea and Eukarya,recently identified by nucleic acid sequence analy-sis, have not been isolated. In October 1988, anocean time-series research program was establishedto study ecosystem processes in the gyre, includingrates and pathways of carbon and energy flow,spatial and temporal scales of variability, and cou-pling of ocean physics to biogeochemical processes.
After a decade of ecosystem surveillance, this senti-nel observatory has produced an unprecedenteddata set and some new views of an old ocean.Foremost is evidence for dramatic changes in micro-bial community structure and in mechanisms ofnutrient cycling in response to large-scale ocean–atmosphere interactions. These and other observa-tions demand reassessment of current views ofphysical-biogeochemical processes in this and otheropen-ocean ecosystems.
Key words: oceanography; microbial ecology; nu-trients; climate; biodiversity; food webs; microbiol-ogy.
INTRODUCTION
Approximately one-half of global primary produc-tion, an amount equivalent to 500 3 1015 g ofcarbon per annum, is supported by the photosyn-thetic activities of microscopic plankton in theworld’s oceans (Falkowski 1994). Within the ma-rine environment, oceanic provinces far removedfrom land account for most of the primary produc-tion. These open-ocean regions, termed subtropicalgyres, collectively occupy approximately 40% of thesurface of the Earth. The most extensive of thesegyres is the North Pacific Subtropical Gyre (NPSG),which at the ocean’s surface extends from approxi-mately 15°N to 35°N latitude and 135°E to 135°W
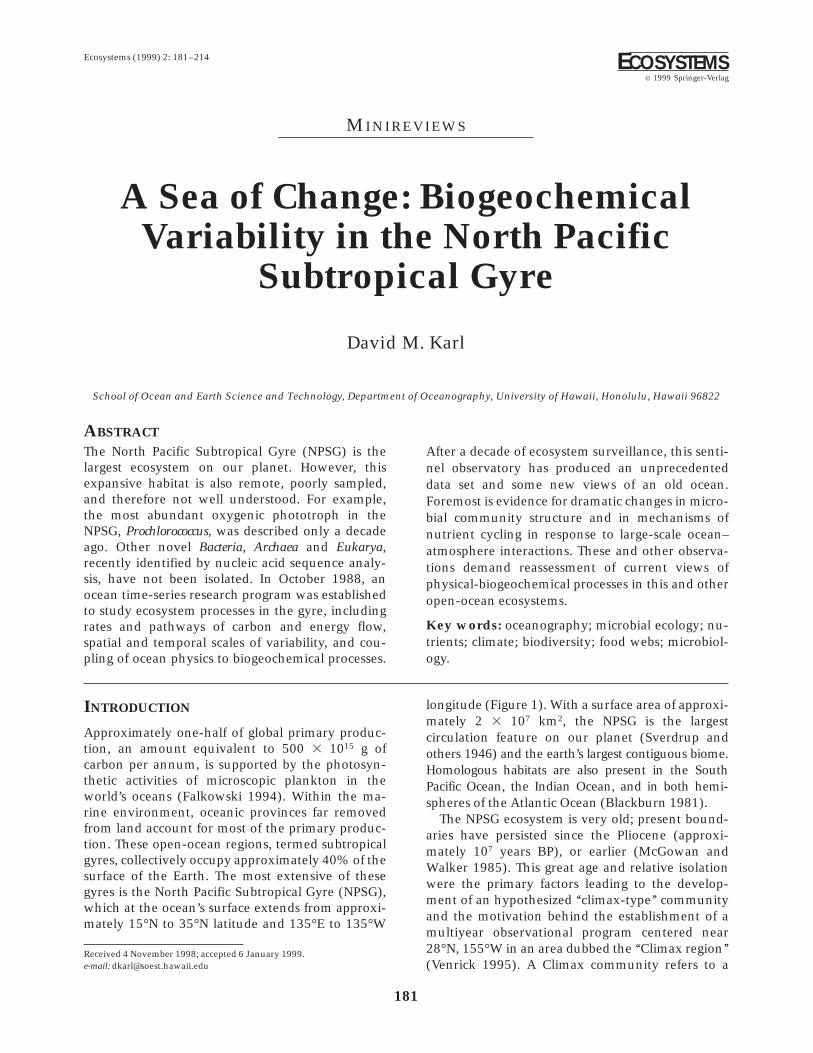
longitude (Figure 1). With a surface area of approxi-mately 2 3 107 km2, the NPSG is the largestcirculation feature on our planet (Sverdrup andothers 1946) and the earth’s largest contiguous biome.Homologous habitats are also present in the SouthPacific Ocean, the Indian Ocean, and in both hemi-spheres of the Atlantic Ocean (Blackburn 1981).
The NPSG ecosystem is very old; present bound-aries have persisted since the Pliocene (approxi-mately 107 years BP), or earlier (McGowan andWalker 1985). This great age and relative isolationwere the primary factors leading to the develop-ment of an hypothesized ‘‘climax-type’’ communityand the motivation behind the establishment of amultiyear observational program centered near28°N, 155°W in an area dubbed the ‘‘Climax region’’(Venrick 1995). A Climax community refers to a
Received 4 November 1998; accepted 6 January 1999.e-mail: [email protected]
Ecosystems (1999) 2: 181–214 ECOSYSTEMSr 1999 Springer-Verlag
181
more or less permanent and final stage of successionthat is inseparably connected with both habitatcharacteristics and climate (Clements 1916, 1936).Climate affects the seascape and, hence, communitystructure and dynamics.
Because of the role of the ocean as a potential sinkfor the increasing burden of atmospheric CO2, it isimperative that ecological processes in open-oceanecosystems are understood. Nevertheless, few com-prehensive investigations of the NPSG have everbeen attempted. Once thought to be a homoge-neous, static habitat, there is increasing evidencethat the NPSG exhibits substantial physical, chemi-cal, and biological variability on a variety of timeand space scales. Wind-forced currents and meso-scale eddies interact to produce vigorous verticalmotions (Lee and others 1994) that can delivershort-lived pulses of nutrients, without warning, tohabitats that are otherwise nutrient starved. Recentfield results, obtained largely during the HawaiiOcean Time-series (HOT) research program (Karland Lukas 1996), have raised provocative questionsconcerning ecosystem structure, function, and tem-
poral variability. The old adage, ‘‘nothing is constantbut change,’’ now appears to be a reasonable de-scription of biogeochemical processes in theNPSG. The more that is learned about this interest-ing and remote habitat, the less appears to beunderstood.
This review contrasts the historical perspec-tive of the NPSG ecosystem with the emerg-ing views of this very old ocean. Foremostin importance are recent data indicating the numeri-cal dominance of two separate groups of pro-karyotic photoautotrophs not even known toexist before 1980, the role of microbial foodwebs, and the existence of a broad spectrum ofmesoscale physical variability. The latter includesdiscrete eddies, near-inertial water motions, andinternal tides, all of which can cause mixing ofwater masses with resultant impacts on eco-system dynamics. Consideration is also givento the hypothesis that interdecadal changes in cli-mate, perhaps resulting from accumulation of green-house gases, may result in coupled changesin plankton community structure and biogeochemi-
Figure 1. Map of the NorthPacific Ocean showing sev-eral important features ofthe NPSG. Top Dynamic to-pography of the sea surfacein dyn-cm relative to 1000dbar based on historical hy-drographic observations.Arrows show the directionof geostrophic flow. Re-drawn from Wyrtki (1975).Bottom Major circulationfeatures in the North Pacificthat collectively define theapproximate boundaries ofthe NPSG. Also shown is theestimated range of centralPacific Ocean meso-zooplankton based on ananalysis of the fidelity ofmesozooplankton species.The dark area is the core ofthe Central Pacific fauna(100% fidelity) and thelighter shade defines the60% fidelity boundary. Re-drawn from McGowan(1974). Note that Stas.ALOHA (j) and CLIMAX(m) are both located in thecore region.
182 D.M. Karl
cal processes. A revised ecological model for theNPSG accommodates these new data sets and pro-vides a research prospectus for the future.
CHARTING THE COURSE TOWARDS A
GENERAL ECOLOGICAL UNDERSTANDING
OF THE NPSGSimilar to most fields of study, present ecologicalunderstanding of the NPSG is based upon the resultsof many discrete scientific contributions over sev-eral decades. It is important to emphasize that themotivation for studies of open ocean ecosystems haschanged dramatically with time. The earliest investi-gations documented the distributions and abun-dances of planktonic assemblages. Later, an empha-sis was placed on rates and controls of photosynthesisand fish production. More modern studies focus onbiodiversity and the effects of climate on ecosystemdynamics. Although many of the truly pioneeringresearch efforts were flawed due to improper meth-odology or lack of scientific understanding aboutthe habitat or populations under investigation, theysuccessfully planted the seeds of curiosity for futuregenerations of oceanographers.
The worldwide voyage of the HMS Challenger(1872–1876) is generally considered to mark thebeginning of oceanography as a scientific discipline.Two explicit goals of the Challenger Expedition were(a) to determine the chemical composition of seawa-ter and the organic matter in suspension and (b) tostudy the distribution and abundance of variouscommunities of organisms. These well-formulatedobjectives are as relevant today as they were morethan a century ago.
In 1875, on the leg from Yokohama to Honolulu,Challenger occupied several stations in the NPSG andcollected plant and animal specimens as well asnumerous seawater samples. Much of this researcheffort was, ironically, dedicated to study of thedeep-sea habitats (greater than 1000 m) rather thanmuch more accessible surface waters. This situationwas due in large part to the great scientific debatesof the day, including the hypothesis of an ‘‘azoic’’zone at great depths (Hedgpeth 1957), and thenature of a recently described deep-sea slime, Bathy-bius haeckelii (Huxley 1900). Both were eventuallyproven to be incorrect based, in large part, on resultsfrom the Challenger Expedition.
In 1929, the research vessel Carnegie, built andoperated by the Department of Terrestrial Magne-tism of the Carnegie Institute of Washington, con-ducted the first detailed plankton investigation ofthe NPSG. Unfortunately, this expedition wasabruptly terminated when the vessel was destroyedby fire in Apia, Samoa. The biological program on
the San Francisco-to-Samoa leg included the collec-tion of plankton samples in the upper 100 m of theNPSG water column by using nets and pumps.Discrete water samples were also collected for mea-surements of dissolved nutrients and oxygen. Thedata from this Pacific Ocean transect clearly docu-mented coherence of discrete plankton assemblageswith water types that could be identified by com-mon chemical characteristics (Graham 1941). Forexample, a positive correlation was shown betweenplankton biomass and surface-water phosphate con-centration. It was also demonstrated that regardlessof latitude, the presence of ‘‘new water’’ (that is,upwelled waters enriched in phosphate) resulted inincreased plankton production.
The ‘‘modern’’ era of oceanographic studies in theNorth Pacific did not begin until about 1950, duringthe postwar period of rapid growth and expansionof the Scripps Institution of Oceanography (SIO). In1950, Roger Revelle led a two-ship expedition,‘‘Operation Mid-Pacific,’’ to study many of the previ-ously unexplored portions of the central and west-ern North Pacific Ocean. In 1953, the ‘‘TranspacExpedition’’ collected water and plankton samplesat 141 stations across the North Pacific. Later thatdecade, Joseph Reid organized one of the mostambitious oceanographic expeditions ever at-tempted; the ‘‘North Pacific Expedition’’ or NOR-PAC. NORPAC involved 21 research vessels from 14institutions and provided a nearly synoptic view ofconditions in the Pacific Ocean, north of approxi-mately 20°N latitude for summer 1955 (NORPACCommittee 1955). The excitement and adventure ofthese and other pathfinding ocean voyages arepresented in the historical accounts by Raitt andMoulton (1967) and Shor (1978).
During this same period, the worldwide DanishGalathea Deep-Sea Expedition (1950–52) made amajor contribution to our understanding of theoceanic carbon cycle. Although the focus of thisexpedition was on life in the deep sea, especiallyocean trenches, a secondary objective was the mea-surement of rates of photosynthetic production inthe surface waters of the ocean. On the San Fran-cisco-to-Honolulu leg, Steemann Nielsen (1956)made the first modern measurements of photosyn-thesis in the NPSG. His new 14C tracer method(Steemann Nielsen 1956) was crucial for detectingthe relatively low rates of organic matter productionin the gyre, a value that he reported as approxi-mately 200 mg C m-2 d21 for 24-h incubations.Based on measurements subsequently obtained inall major ocean basins during the Galathea Expedi-tion, it was concluded that organic matter produc-tion in the sea was approximately equal to that onland. This unexpected result is now well confirmed.
The North Pacific Gyre 183
Despite these heroic field efforts, there was verylittle observational basis for the development of acomprehensive ecological or biogeochemical under-standing of the NPSG biome. Even the most acces-sible epipelagic habitat remained aqua incognitathrough the early 1960s when progress toward thisgoal was first made during the ‘‘Ursa Major’’ (Aug–Oct 1964) and ‘‘Zetes’’ (Jan 1966) expeditions orga-nized by scientists from SIO (SIO Ref. #67–5, SIORef. #70–5). Data obtained on the plant and animalpopulations marked the beginning of what wouldbecome a two-decade long series of cruises to theNPSG (Hayward and others 1983). Observationsmade during this series of ‘‘Climax-region’’ (Figure2) cruises provided an unprecedented view of theNPSG habitat and served as the basis for an initialconceptual model of ecosystem structure and dy-namics.
By making repeat measurements of key physical,chemical, and biological parameters, invaluable in-formation on scales of ocean variability and on therelationships of organisms to physical forcing wasobtained. However, of the 18 cruises conductedbetween 1971 and 1985, 70% occurred in summer(June–Sept) and 35% in August. Consequently,habitat sampling was seasonally biased. Further-
more, elucidation of low frequency variability(greater than 1 year) also may have been compro-mised because no observations were made in 1970,1975, 1978–79, 1981, or 1984 (Hayward 1987).Despite these and several other sampling limita-tions, the Climax program data sets continue toprovide high-quality information on the NPSG eco-system and serve as a crucial benchmark for compari-son to contemporary data sets.
In parallel, but not in conjunction, with thesemostly SIO-based investigations, extensive ecologi-cal field studies were conducted by scientists fromthe Institute of Oceanology, USSR Academy ofSciences. In certain respects these latter studieswere more comprehensive especially in their focuson microbial assemblages, that is, bacteria, phyto-plankton and protozoans, carbon and energy fluxpathways and rates (Kriss 1962; Vinogradov andShushkina 1989; Vinogradov and others 1997), andecosystem modeling (Vinogradov and others 1973).
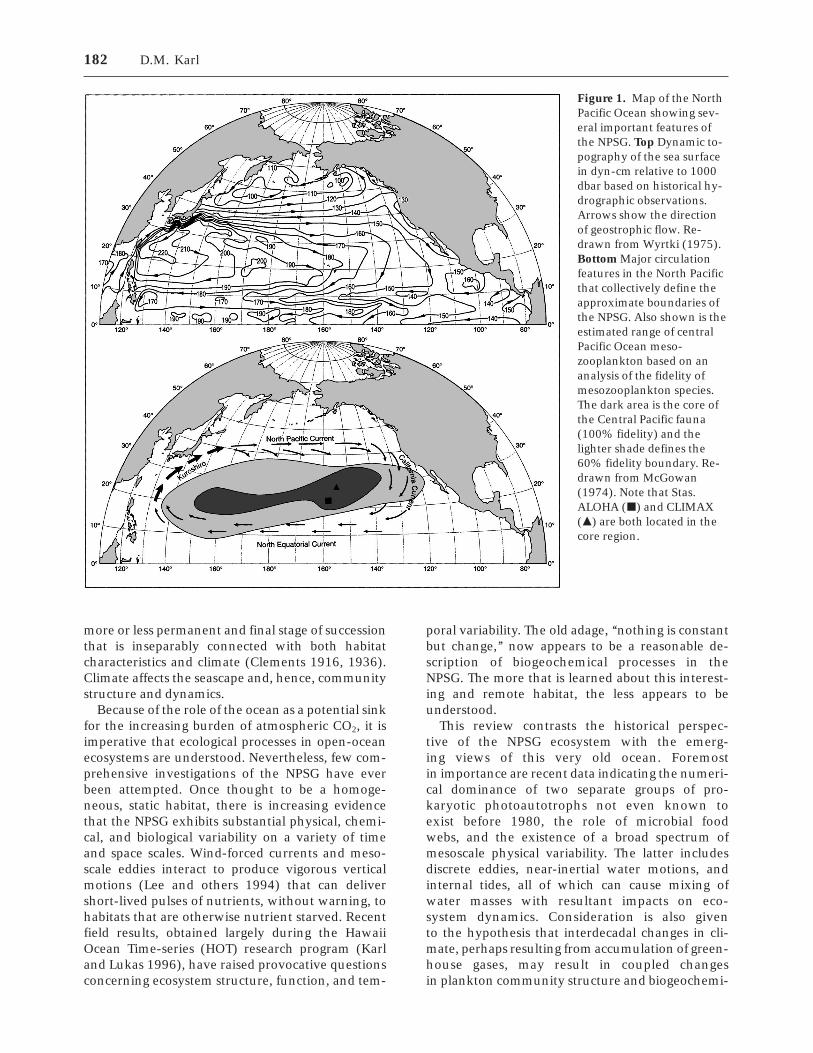
In addition to the Climax-region study alreadymentioned, several other unrelated biogeochemicaltime-series research programs were initiated duringthe past few decades; however, only one remainsactive. From January 1969 to June 1970, a deep-ocean hydrostation (Sta. Gollum), patterned afterthe successful hydrostation ‘‘S’’ near Bermuda, wasestablished by scientists at the University of Hawaiiat a location 47 km north of Oahu (22°108N,158°008W; Figure 2). The water depth (4760 m) andlocation were selected to be beyond the biogeo-chemical influences of the Hawaiian Ridge (Dotyand Oguri 1956). Approximately monthly, 13 2-dresearch cruises were conducted to observe andinterpret variations in particulate organic matterdistributions in the water column and other physi-cal and chemical parameters (Gordon 1970).
During a series of related cruises from 1969 to1972 conducted under the code name ‘‘Bug Safari,’’K. Gundersen and colleagues from the University ofHawaii began a systematic investigation of microbialprocesses in the NPSG. This was the first comprehen-sive, biogeochemical investigation conducted in theNPSG, with separate research components on op-tics, dissolved gases, trace metals, inorganic andorganic nutrients, and microorganisms (phytoplank-ton, cyanobacteria, heterotrophic and chemolitho-autotrophic bacteria, protozoa, and fungi). Thesecomplementary field measurements focused on ni-trogen and carbon transformations, including ratesof primary production, respiration, nitrification, anddinitrogen (N2) fixation (Gundersen and others1976) and were, in many regards, ahead of their time.
In 1986, a biogeochemical time-series station wasestablished near the northeastern boundary of the
Figure 2. Map of a portion of the NPSG showing theHawaiian Islands relative to the locations where past andpresent research activities have been conducted, includ-ing: Sta. ALOHA (A), the CLIMAX ‘‘region’’ (shaded box)and Sta. Climax (C), Sta. GOLLUM (G), the MOBY–SeaWIFS buoy (j), HALE–ALOHA buoy (m), and thenetwork of NOAA–NDBC meteorological buoys (r). ThePRPOOS and VERTEX-5 ocean stations were colocatedwith Sta. Climax at 28°N, 155°W.
184 D.M. Karl
NPSG (33°N, 139°W) as one component of theVERtical Transport and EXchange (VERTEX) re-search program. A major objective of VERTEX wasto investigate seasonality in carbon export from theeuphotic zone in relation to contemporaneous ratesof primary production. During an 18-month period(October 1986 to May 1988), the station was occu-pied for seven 1-week periods at approximately3-month intervals. In addition to standard hydro-graphic surveys, samples also were collected tomeasure dissolved and particulate inorganic andorganic matter, trace metals, plankton populations,microbial food web processes and rates of primaryproduction, and nitrogen assimilation (Knauer andothers 1990; Harrison and others 1992). Significanttemporal variability was documented for primaryproduction and particle flux, but no clear relation-ships were observed between primary productionand physical processes. Despite the comprehensivescope and intensity of the VERTEX project, thesampling frequency was deemed inadequate toresolve much of the natural variability in thisoligotrophic oceanic ecosystem.
Based on data collected during this first century ofexploration and research of the NPSG (circa 1880–1980), a basic scientific understanding of ecologicalprocesses in this habitat, sufficient to formulatemeaningful hypotheses for future investigation, wasdeveloped. In response to growing awareness of theocean’s role in climate and global environmentalchange, and the need for additional and morecomprehensive oceanic time-series measurements,the Board on Ocean Science and Policy of theNational Research Council sponsored a workshopon ‘‘Global Ocean Flux Study’’ (GOFS), which servedas an eventual blueprint for the Joint-GOFS (orJGOFS) program (National Research Council 1984).In 1986, the International Council of ScientificUnions established the International Geosphere–Biosphere Programme: A Study of Global Change(IGBP), and the following year JGOFS was designedas a Core Project of IGBP. US–JGOFS research effortsfocus on the oceanic carbon cycle, its sensitivity tochange, and the regulation of the atmosphere–ocean CO2 balance (Brewer and others 1986). Thebroad objectives of US–JGOFS were to determineand understand on a global scale the time-varyingfluxes of carbon and associated biogenic elements inthe ocean, and to evaluate the related exchanges ofthese elements with the atmosphere, the sea floorand the continental boundaries (Scientific Commit-tee on Ocean Research 1990). To achieve thesegoals, the committee defined four separate programelements: (a) process studies to capture key regularevents, (b) long-term time-series observations atstrategic sites, (c) a global survey of relevant oceanic
properties (for example, CO2), and (d) a vigorousdata interpretation and modeling effort to dissemi-nate knowledge and generate testable hypotheses.
In 1988, a deep ocean station was establishednorth of Hawaii within the NPSG to address thesescientific goals and needs (Karl and Winn 1991; Karland Lukas 1996). In 1998, the still ongoing HawaiiOcean Time-series (HOT) program completed 100separate research cruises to Sta. ALOHA (22°458N,158°W; Figure 2) with comprehensive seasonalcoverage. The HOT program has already assembledthe largest and most comprehensive ecological dataset for the NPSG, and is scheduled to continue intothe next millennium. These new measurements,with a focus on microbial rates and processes haveyielded unexpected results that challenge certainpast views of NPSG biogeochemical cycles.
NORTH PACIFIC SUBTROPICAL GYRE:HABITAT CHARACTERISTICS
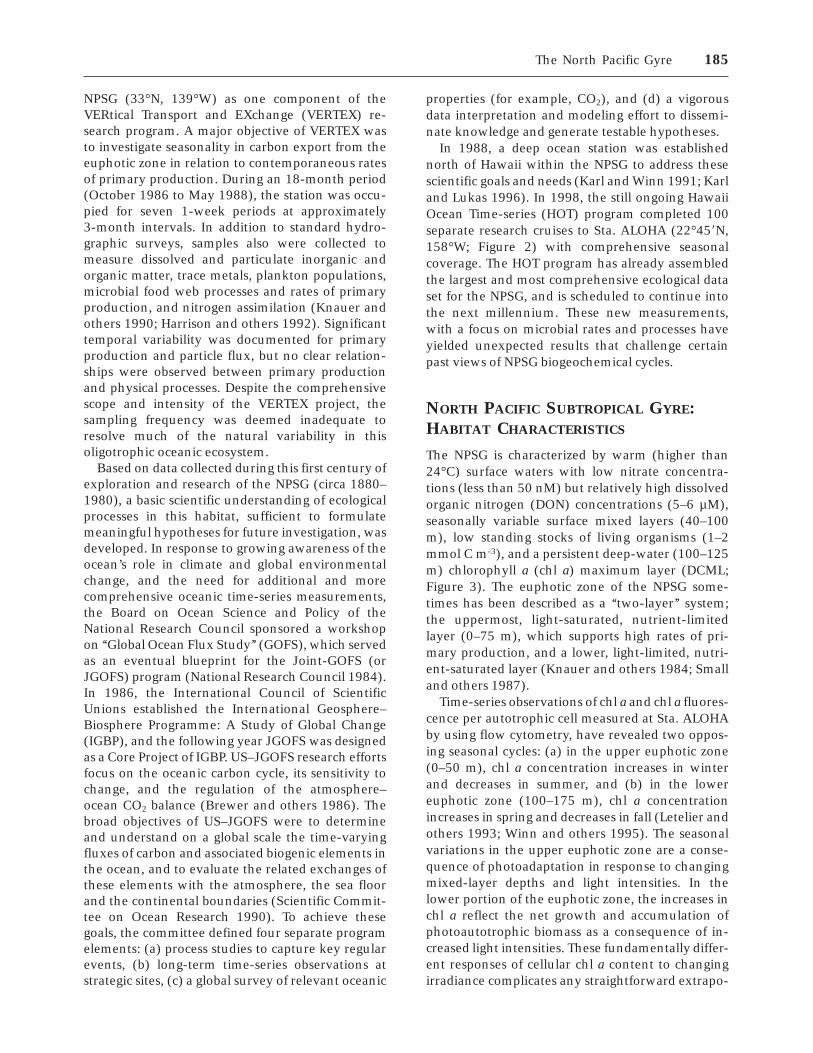
The NPSG is characterized by warm (higher than24°C) surface waters with low nitrate concentra-tions (less than 50 nM) but relatively high dissolvedorganic nitrogen (DON) concentrations (5–6 µM),seasonally variable surface mixed layers (40–100m), low standing stocks of living organisms (1–2mmol C m-3), and a persistent deep-water (100–125m) chlorophyll a (chl a) maximum layer (DCML;Figure 3). The euphotic zone of the NPSG some-times has been described as a ‘‘two-layer’’ system;the uppermost, light-saturated, nutrient-limitedlayer (0–75 m), which supports high rates of pri-mary production, and a lower, light-limited, nutri-ent-saturated layer (Knauer and others 1984; Smalland others 1987).
Time-series observations of chl a and chl a fluores-cence per autotrophic cell measured at Sta. ALOHAby using flow cytometry, have revealed two oppos-ing seasonal cycles: (a) in the upper euphotic zone(0–50 m), chl a concentration increases in winterand decreases in summer, and (b) in the lowereuphotic zone (100–175 m), chl a concentrationincreases in spring and decreases in fall (Letelier andothers 1993; Winn and others 1995). The seasonalvariations in the upper euphotic zone are a conse-quence of photoadaptation in response to changingmixed-layer depths and light intensities. In thelower portion of the euphotic zone, the increases inchl a reflect the net growth and accumulation ofphotoautotrophic biomass as a consequence of in-creased light intensities. These fundamentally differ-ent responses of cellular chl a content to changingirradiance complicates any straightforward extrapo-
The North Pacific Gyre 185
lation of chl a to biomass (Karl and Dobbs 1998),including satellite remote sensing.
Within the NPSG, the major pathways for nutri-ent recharge are from below, via vertical eddydiffusion, and by horizontal transport from adja-cent, nutrient-rich systems (Reid and others 1978).Because the combined flux of nutrients from theseprocesses is small, surface waters of the NPSG arechronically nutrient impoverished. Furthermore,the near-zero nutrient concentration gradient rou-tinely observed in the upper 100 m of the watercolumn (Figure 3) suggests that continuous vertical
nutrient flux cannot be the primary source ofdissolved inorganic nutrients (for example, nitrateand phosphate) to the upper euphotic zone (Hay-ward 1991).
Large-scale characterization of the NPSG, basedon surface dynamic height relative to 1000 m,places the center of the gyre at 20°N (Figure 1, top).The western portion of the NPSG (west of 180°longitude) has greater physical variability than theeastern portion (Kenyon 1978; Shulenberger 1978),a feature also reflected in satellite-derived, sea-surface topographic measurements (Munch 1996).These latter data provide support for the possibleexistence of two separate central gyral systems inthe North Pacific Ocean (Sverdrup and others 1946).Because of the large dimensions of the NPSG it islikely that atmosphere–ocean climate forcing mayaffect subregions differently. For example, El NinoSouthern Oscillation (ENSO) impacts might be ex-pected to have a strong zonal gradient.
Surface circulation (above 50 m) is driven bywind and maintained by mass distribution. Thegeostrophic nature of the major clockwise (anticy-clonic) circulation assures wind-driven convergenceof surface waters in the NPSG (Reid and others1978). It serves to isolate these relatively large gyreecosystems and to restrict exchanges with adjacentcurrent systems (Figure 1). The advective fieldsuggests horizontal currents less than 4 cm s-1 andimplies, by Ekman convergence, a mean verticaldownwelling of 2–3 cm d21 through the mainthermocline (Niiler and Reynolds 1984).
Zonal and meridional transects across the NPSGhave documented low, or nonexistent, horizontalgradients in most physical and biological characteris-tics, especially compared with other marine ecosys-tems (Venrick 1971, 1979; McGowan and Williams1973; Shulenberger 1978; Hayward and others 1983;Hayward and McGowan 1985; Matrai 1986; Hay-ward 1987). As a consequence of these circulationfeatures, the NPSG is thought to be a semienclosed,stable and relatively homogeneous habitat. Theseresults suggest that serial observations from a strate-gically located site may be extrapolated to the largerregion of interest. This assumption underlies estab-lishment of Sta. ALOHA (22°458N, 158°W) as aNPSG benchmark (Karl and Winn 1991; Karl andLukas 1996).
Each winter, extratropical cyclones track acrossthe North Pacific from west to east, approximatelyevery 5–7 d. The strong winds associated with thesestorms impulsively force the upper ocean, resultingin a deepening of the upper mixed layer and acooling associated with both enhanced evaporationand entrainment of cooler waters from below (Karl
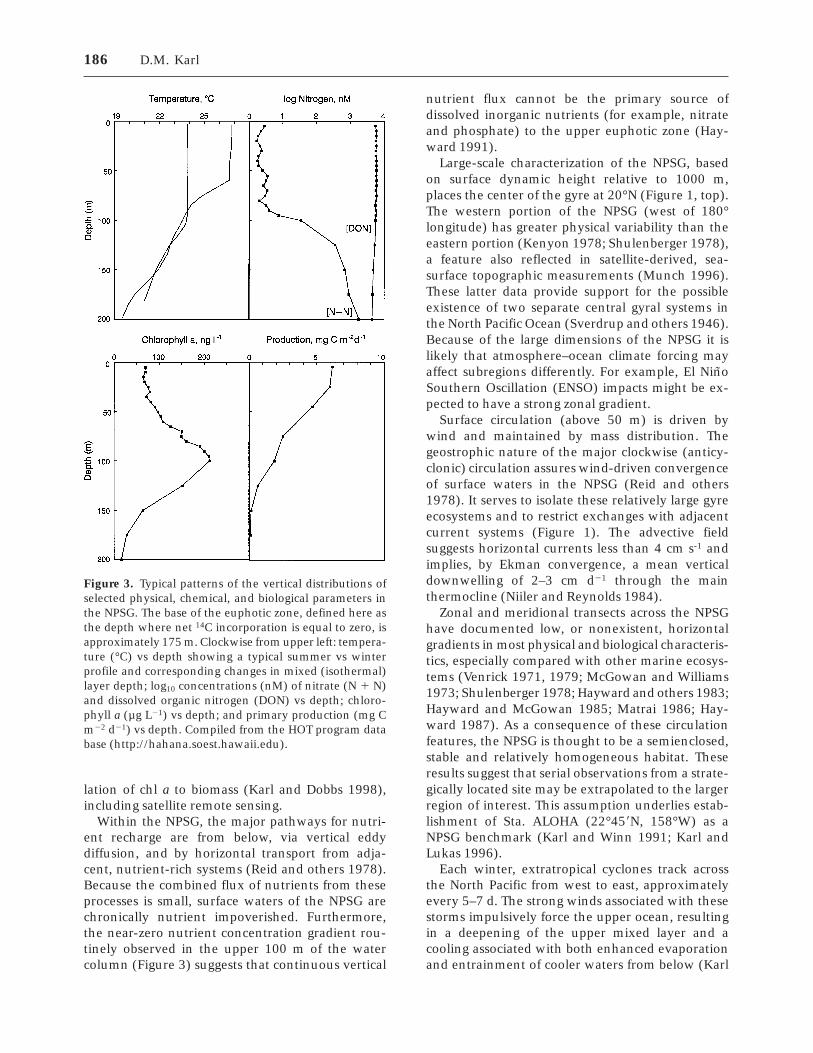
Figure 3. Typical patterns of the vertical distributions ofselected physical, chemical, and biological parameters inthe NPSG. The base of the euphotic zone, defined here asthe depth where net 14C incorporation is equal to zero, isapproximately 175 m. Clockwise from upper left: tempera-ture (°C) vs depth showing a typical summer vs winterprofile and corresponding changes in mixed (isothermal)layer depth; log10 concentrations (nM) of nitrate (N 1 N)and dissolved organic nitrogen (DON) vs depth; chloro-phyll a (µg L21) vs depth; and primary production (mg Cm22 d21) vs depth. Compiled from the HOT program database (http://hahana.soest.hawaii.edu).
186 D.M. Karl
and Lukas 1996). This intermittent local forcing isimportant in determining the annual cycle in thesurface waters of the NPSG habitat.
Recent studies have documented that the NPSGcontains a vigorous field of mesoscale variability,including discrete eddies, near-inertial motions, andinternal tides (Venrick 1990). They can cause signifi-cant lifting of water into the euphotic zone and canmodify conditions in the upper ocean. Lateral het-erogeneity also has been reported for the NPSG inwinter; for example, Gregg (1976) reported a mixedlayer of 110 m that was separated by a few kilome-ters from one only 10 m deep. Furthermore, and incontrast to the large-scale view, variable horizontalcurrents with time scales of 1–30 d and space scalesof 1–200 km are nearly tenfold greater than ex-pected, implying vertical circulations two orders ofmagnitude greater than the mean for this region(Niiler and Hall 1988). These unsteady conditionshave implications for resupply of nutrients and forthe distribution, abundance, and metabolic activi-ties of plankton populations in the NPSG.
Finally, there is ample evidence to suggest thatmajor changes in the structure of the NPSG habitatcan occur over interannual to decadal time periods.For example, Levitus and Antonov (1995) docu-mented relatively large changes in the upper-oceantemperature (up to 0.5°C) over periods as short as 3years. It also has been shown that major andsometimes abrupt ‘‘regime shifts’’ can result fromchanges in the position of atmospheric (for ex-ample, Aleutian Low) or oceanic (for example, WestWind Drift) features (McGowan and others 1998),and it is even possible for the boundaries of theNPSG to shift accordingly. These habitat changes allcan have profound effects on biological and biogeo-chemical processes. Unfortunately, lack of system-atic time series of sufficient length to observe thesedecadal (or longer) disturbances precludes compre-hensive ecological understanding at present.
NUTRIENT DYNAMICS: ROLE OF
STOCHASTIC PHYSICAL PROCESSES
Broad-scale descriptions of general ocean circula-tion and major biogeochemical cycles, summarizedabove, ignore many potentially important but morestochastic events that may affect the local resupplyof nutrients to the surface ocean. The previousperception of the NPSG as a marine desert sup-ported by steady diffusional supply of essentialnutrients from beneath the thermocline is no longertenable.
Based on systematic analysis of steady state nutri-ent flux versus nutrient demand, Hayward (1987,
1991) hypothesized that episodic mixing eventsmust occur in the NPSG. Unfortunately, historicalmeasurements were insufficient for resolving thenutrient budget discrepancies, and the theory ofpotential physical mechanisms to sustain these en-hanced nutrient inputs was not well developed.These smaller scale, physical processes generally arelumped together into the term ‘‘turbulence’’ (Gar-gett 1997; Moum 1997). Large-scale budget equa-tions consistently require more turbulent mixing inthe main thermocline and below than is typicallyobserved (Moum 1997), suggesting an incompleteunderstanding of these crucial turbulent mixingprocesses.
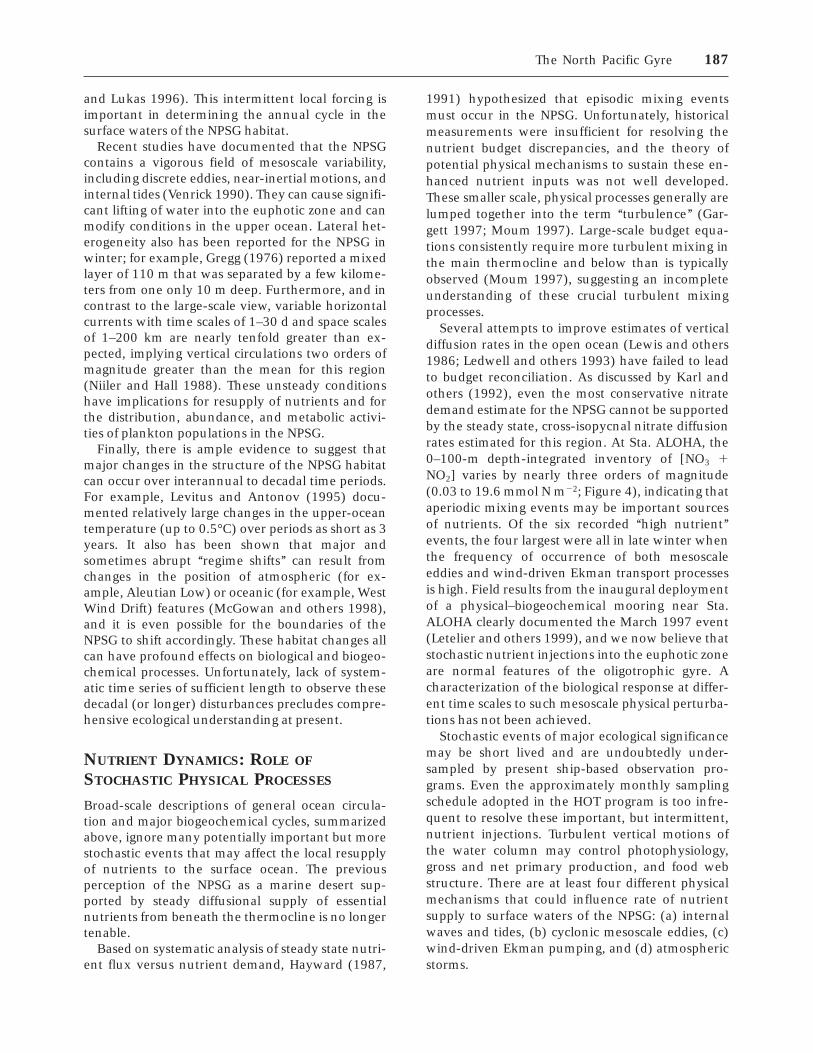
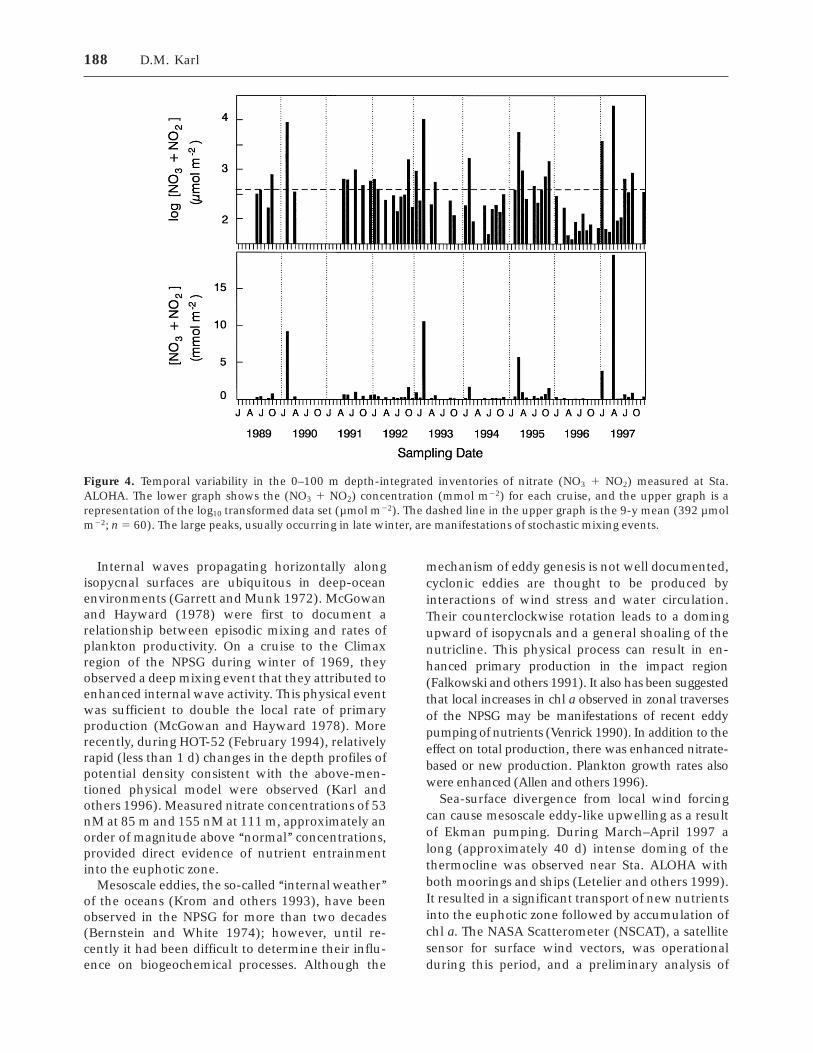
Several attempts to improve estimates of verticaldiffusion rates in the open ocean (Lewis and others1986; Ledwell and others 1993) have failed to leadto budget reconciliation. As discussed by Karl andothers (1992), even the most conservative nitratedemand estimate for the NPSG cannot be supportedby the steady state, cross-isopycnal nitrate diffusionrates estimated for this region. At Sta. ALOHA, the0–100-m depth-integrated inventory of [NO3 1NO2] varies by nearly three orders of magnitude(0.03 to 19.6 mmol N m22; Figure 4), indicating thataperiodic mixing events may be important sourcesof nutrients. Of the six recorded ‘‘high nutrient’’events, the four largest were all in late winter whenthe frequency of occurrence of both mesoscaleeddies and wind-driven Ekman transport processesis high. Field results from the inaugural deploymentof a physical–biogeochemical mooring near Sta.ALOHA clearly documented the March 1997 event(Letelier and others 1999), and we now believe thatstochastic nutrient injections into the euphotic zoneare normal features of the oligotrophic gyre. Acharacterization of the biological response at differ-ent time scales to such mesoscale physical perturba-tions has not been achieved.
Stochastic events of major ecological significancemay be short lived and are undoubtedly under-sampled by present ship-based observation pro-grams. Even the approximately monthly samplingschedule adopted in the HOT program is too infre-quent to resolve these important, but intermittent,nutrient injections. Turbulent vertical motions ofthe water column may control photophysiology,gross and net primary production, and food webstructure. There are at least four different physicalmechanisms that could influence rate of nutrientsupply to surface waters of the NPSG: (a) internalwaves and tides, (b) cyclonic mesoscale eddies, (c)wind-driven Ekman pumping, and (d) atmosphericstorms.
The North Pacific Gyre 187
Internal waves propagating horizontally alongisopycnal surfaces are ubiquitous in deep-oceanenvironments (Garrett and Munk 1972). McGowanand Hayward (1978) were first to document arelationship between episodic mixing and rates ofplankton productivity. On a cruise to the Climaxregion of the NPSG during winter of 1969, theyobserved a deep mixing event that they attributed toenhanced internal wave activity. This physical eventwas sufficient to double the local rate of primaryproduction (McGowan and Hayward 1978). Morerecently, during HOT-52 (February 1994), relativelyrapid (less than 1 d) changes in the depth profiles ofpotential density consistent with the above-men-tioned physical model were observed (Karl andothers 1996). Measured nitrate concentrations of 53nM at 85 m and 155 nM at 111 m, approximately anorder of magnitude above ‘‘normal’’ concentrations,provided direct evidence of nutrient entrainmentinto the euphotic zone.
Mesoscale eddies, the so-called ‘‘internal weather’’of the oceans (Krom and others 1993), have beenobserved in the NPSG for more than two decades(Bernstein and White 1974); however, until re-cently it had been difficult to determine their influ-ence on biogeochemical processes. Although the
mechanism of eddy genesis is not well documented,cyclonic eddies are thought to be produced byinteractions of wind stress and water circulation.Their counterclockwise rotation leads to a domingupward of isopycnals and a general shoaling of thenutricline. This physical process can result in en-hanced primary production in the impact region(Falkowski and others 1991). It also has been suggestedthat local increases in chl a observed in zonal traversesof the NPSG may be manifestations of recent eddypumping of nutrients (Venrick 1990). In addition to theeffect on total production, there was enhanced nitrate-based or new production. Plankton growth rates alsowere enhanced (Allen and others 1996).
Sea-surface divergence from local wind forcingcan cause mesoscale eddy-like upwelling as a resultof Ekman pumping. During March–April 1997 along (approximately 40 d) intense doming of thethermocline was observed near Sta. ALOHA withboth moorings and ships (Letelier and others 1999).It resulted in a significant transport of new nutrientsinto the euphotic zone followed by accumulation ofchl a. The NASA Scatterometer (NSCAT), a satellitesensor for surface wind vectors, was operationalduring this period, and a preliminary analysis of
Figure 4. Temporal variability in the 0–100 m depth-integrated inventories of nitrate (NO3 1 NO2) measured at Sta.ALOHA. The lower graph shows the (NO3 1 NO2) concentration (mmol m22) for each cruise, and the upper graph is arepresentation of the log10 transformed data set (µmol m22). The dashed line in the upper graph is the 9-y mean (392 µmolm22; n 5 60). The large peaks, usually occurring in late winter, are manifestations of stochastic mixing events.
188 D.M. Karl
these data by M. Freilich suggested upward verticalvelocities in excess of 5 m d21.
Direct field observations during storm events alsohave implicated wind forcing as an important mech-anism for enhanced nutrient supply to the euphoticzone. DiTullio and Laws (1991) reported increasesin a variety of planktonic rate processes after anintense low pressure disturbance in the NPSG. Arealchl a concentration doubled relative to prestormvalues, and primary production and new produc-tion both increased substantially, in the case of newproduction by 400% (DiTullio and Laws 1991).Coincident pigment analyses indicated that all ma-jor phytoplankton groups except cyanobacteria in-creased immediately after passage of the low-pressure disturbance. In response to this samestochastic event, total microbial biomass [as mea-sured by particulate adenosine triphosphate (ATP)concentration] increased fivefold, and the rate ofparticulate matter export from the euphotic zoneincreased threefold (Taylor 1989). Interestingly, themechanism invoked to accommodate the field obser-vations was wet deposition (by precipitation) ofNO3
2 and iron from the atmosphere, rather thanvertical mixing of nutrients from below. Atmo-spheric dust deposition measured during this sameobservation period confirmed a large event coinci-dent with the storm.
In more than 100 cruises to Sta. ALOHA over thepast decade during all seasons, we have neverobserved surface–ocean enrichments of NO3
2 thatwere within even an order of magnitude of DiTullioand Laws’ (1991) reported value of 600 nM. Thisdisparity demonstrates the potential importance ofrare, short events in understanding of coupledphysical–biogeochemical processes in the NPSG.These field observations may help to reconcilepreviously reported ecosystem nutrient imbalancesmeasured for the subtropical North Pacific (Hay-ward 1987; Karl and others 1992) and perhapsother geochemical anomalies elsewhere in the worldocean. If these stochastic events are characteristic ofthe NPSG in general, and I believe that they are,then mass balance will never be achieved unless acomprehensive time-series program is implemented,preferably with continuous measurements. Thissituation is not unique to the NPSG. Recent fieldstudies in the North Atlantic subtropical gyre also havedocumented the role of mesoscale eddies for the supplyof nutrients (McGillicuddy and others 1998).
MICROBIAL LOOP PROCESSES
Microorganisms generally are classified on the basisof size, nutritional, and physiological characteristics
or phylogeny. Regardless of the criterion used,broad diversity is revealed. The microscopic, photo-synthetic organisms in the ocean traditionally havebeen referred to as phytoplankton (‘‘plant’’ plank-ton), a term initially reserved for eukaryotic algae(Strickland 1965). This terminology is dated but isstill used extensively in the scientific literature.Biologists now recognize three major lines of evolu-tion or domains: Bacteria, Archaea, and Eukarya(Woese 1994; Pace 1997). Although the terms‘‘bacteria’’ and ‘‘algae’’ have been used to refer to the‘‘heterotrophic bacteria’’ (bacterioplankton) and the‘‘photosynthetic eukaryotic algae’’ (phytoplankton),it is now well known that most of the algae in theNPSG are actually Bacteria (that is, cyanobacteria,formerly known as blue-green algae).
Johnson and Sieburth (1979) first described Syn-echococcus and another unknown phototroph (calledtype II cells) from ultrastructure. The type II cellswere, nearly a decade later, shown by flow cytomet-ric, pigment, and ultrastructure analyses to beProchlorococcus (Chisholm and others 1988, 1992).In the NPSG, these two groups of Bacteria accountfor a majority of the photoautotrophic standingstock (Campbell and Vaulot 1993; Campbell andothers 1994) and nearly all of the primary produc-tion (Liu and others 1997). Based on 16S rRNA genesequence analysis, Prochlorococcus and Synechococcusbelong to a single clade (96–98% identical in their16S rRNA), with two deeply branching lineages ofProchlorococcus and three for Synechococcus (Urbachand others 1998). Prochlorococcus strains are furtherdivided into high-light-adapted and low-light-adapted groups (Moore and others 1998). Withineach group there appears to be a high diversity inboth phylogeny and photophysiology. While thepresence of pigments suggests a photoautotrophicmode of nutrition, neither photoheterotrophy (as-similation of organic substrates by using light en-ergy) nor mixotrophy (combined autotrophic andheterotrophic metabolism) can be ruled out. Conse-quently, for the NPSG, the previous conceptual viewof ‘‘phytoplankton–bacterial interactions’’ must nowbe replaced by ‘‘bacterial–bacterial interactions,’’which may include all currently known modes ofmetabolism. This issue is not merely semantics, it isoligotrophic ocean ecology and evolution par excel-lence.
Representatives of the domain Archaea are alsoknown to be widely distributed in the marineenvironment and may even be a significant constitu-ent of microbial biomass in selected habitats (De-Long and others 1994). Most previous analyses of‘‘heterotrophic bacteria,’’ for example, by directmicroscopy, inadvertently included both Archaea
The North Pacific Gyre 189
and phototrophic Bacteria. This previous misrepre-sentation of fundamentally different phylogeneticand physiological groups underscores the diversityand complexity of natural microbial communitiesand demonstrates how our ecological interpreta-tions are governed to a large extent by methodol-ogy.
With regard to nutrition, one also can anticipate abroad range of characteristics. Ecological role rever-sals, such as algal phagotrophy, bacterial predation,and protozoan osmotrophy, as well as other meta-bolic adaptations for living in a fluctuating environ-ment (for example, multiphasic transport systemsand diet switching) may be commonplace in theNPSG. Furthermore, the recent discovery of novelArchaea genes (Bult and others 1996) suggests thatadditional diversity exists and may have importantimplications for models of global carbon-pool dy-namics. As Karl and Dobbs (1998) recently la-mented, ‘‘One might legitimately ask, what elsedon’t we know?’’
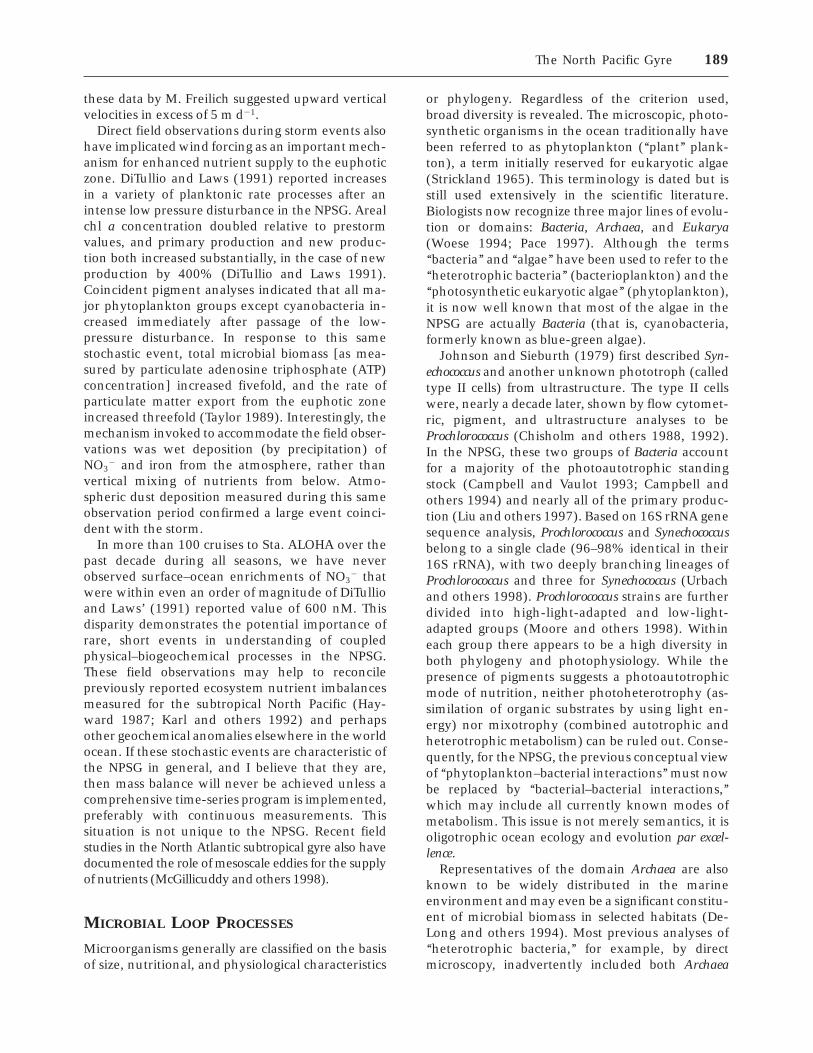
Characterizations of plankton on the basis of cellsize have been used extensively in marine ecology(Sieburth and others 1978; Figure 5). The use of
these arbitrary size classifications (picoplankton,0.2–2 µm; nanoplankton, 2–20 µm; microplankton,20–200 µm; mesoplankton, 0.2–2 mm) is appealingdue to ease of experimental manipulation. Raven(1986) has summarized numerous physiologicalconsequences of cell size, many of which relate tothe fitness of the organism in a given habitat.Foremost among them is the competitive advantageof resource (nutrients and light) acquisition as meancell size decreases. Even among Eukarya, tiny coc-coid morphology confers adaptive advantage in thesea, but this reduction in size also hides the signifi-cant genetic diversity that otherwise occurs in theselittle ‘‘balls’’ of pigmented biomass (Potter and oth-ers 1997).
Before 1978, photoautotrophic plankton popula-tions in the NPSG were thought to be dominated byeukaryotic microorganisms, especially monads,flagellates, and to a lesser extent diatoms (Beers andothers 1975, 1982). The primary consumers werethought to be relatively large, mesozooplankton(less than 200 µm). This traditional view of an activeeukaryotic phytoplankton–herbivore grazing foodchain has changed radically during the past 2decades (Glover 1991) and is still evolving.
Based on the abundance of class-specific photosyn-thetic pigments and direct electron microscopicobservations of water samples collected from Sta.ALOHA, Prochlorococcus-like microorganisms consti-tute approximately 50% of total chl a. Anotherprokaryote, Synechococcus, and two picoeukaryoticalgal groups, Prymnesiophytes and Pelagophytes,together accounted for most of the remainder of thestanding stock of phototrophic cells (Andersen andothers 1996). Cells larger than 8 µm (for example,diatoms and dinoflagellates) were rare. Neverthe-less, under certain conditions these larger species ofEukarya are abundant in the NPSG, especially insurface waters during summer (Scharek and others1999a). In the contemporary view of the NPSG, thephotoautotrophic picoplankton-supported micro-bial food web is always present, whereas the largereukaryote-grazer food chain is ephemeral. Time andspace integration are crucial for assessing the rela-tive roles of these independent production pro-cesses.
Several fundamental discoveries, beginning withmicroscopic evidence for the presence of a largepopulation of heterotrophic bacteria (Daley andHobbie 1975; Hobbie and others 1977), have re-sulted in a revolution in thinking about carbon andenergy flow in open-ocean ecosystems. Pomeroy(1974) first articulated a revised trophic role forheterotrophic marine bacteria by emphasizing thepotential importance of microbially based food webs.
Figure 5. Representative classification of planktonic or-ganisms by size showing the diversity of various autotro-phic and heterotrophic groups based on the organizationscheme of Sieburth and others (1978). Size, per se, cannotbe used to separate autotrophs from heterotrophs inNPSG plankton assemblages. Courtesy of Albert Calbet.
190 D.M. Karl
In this new paradigm, microbial production fueledby assimilation of dissolved organic matter (DOM)sustains a supplemental pathway for carbon andenergy flow to higher trophic levels (Figure 6). Itwas initially thought that DOM was too dilute to beused efficiently by microorganisms. However, de-spite low bulk concentrations of individual organiccompounds (pM to nM range), bacteria readilytransport and assimilate selected substrates (Fuhr-man 1992).
Growth efficiency (GE) of picoheterotrophs (thatis, production of biomass scaled to consumption offood, usually expressed as percentage of carbon) isof great importance in quantitative assessment ofmicrobial secondary production. If GE of consumercommunities is high (greater than or equal to 60%),then secondary production can exceed contempora-neous primary production (Winn and Karl 1984;Strayer 1988). For example, in a simple trophic-level model with three consumers each operating at60% GE, 100 g of primary production could supporta total of nearly 120 g of secondary production (thatis, [100 3 0.6] 5 60 plus [60 3 0.6] 5 36 plus [36 30.6] 5 21.6), with additional carbon and energy
remaining for assimilation (Strayer 1988). Althoughrespiration (CO2 production) cannot exceed pri-mary production (CO2 fixation) at steady state,heterotrophic production (organic matter produc-tion), in theory, can. However, as Scavia (1988) hasemphasized, heterotrophic bacteria do not fit easilyinto most conceptual models of trophodynamicsbecause the DOM that supports them is derivedfrom all trophic levels (Figure 6).
Although the microbial loop has received muchattention during the intervening years, includingdetailed biological studies of bacteria, viruses, algae,protozoans, and their interactions (for example,Williams 1981; Azam and others 1983; Fenchel1988; Fuhrman 1992; Hobbie 1994; Azam 1998),many important aspects are still unresolved. Fore-most are questions pertaining to both total rate andoverall efficiency of transfer of carbon and energythrough the open-ocean microbial food web andcontrols on microheterotrophic production. Micro-bially based food webs initially were thought tooperate with high efficiency of mass transfer (Wil-liams 1981), but more recent and direct analysessuggest that the GE of microheterotrophs on dis-
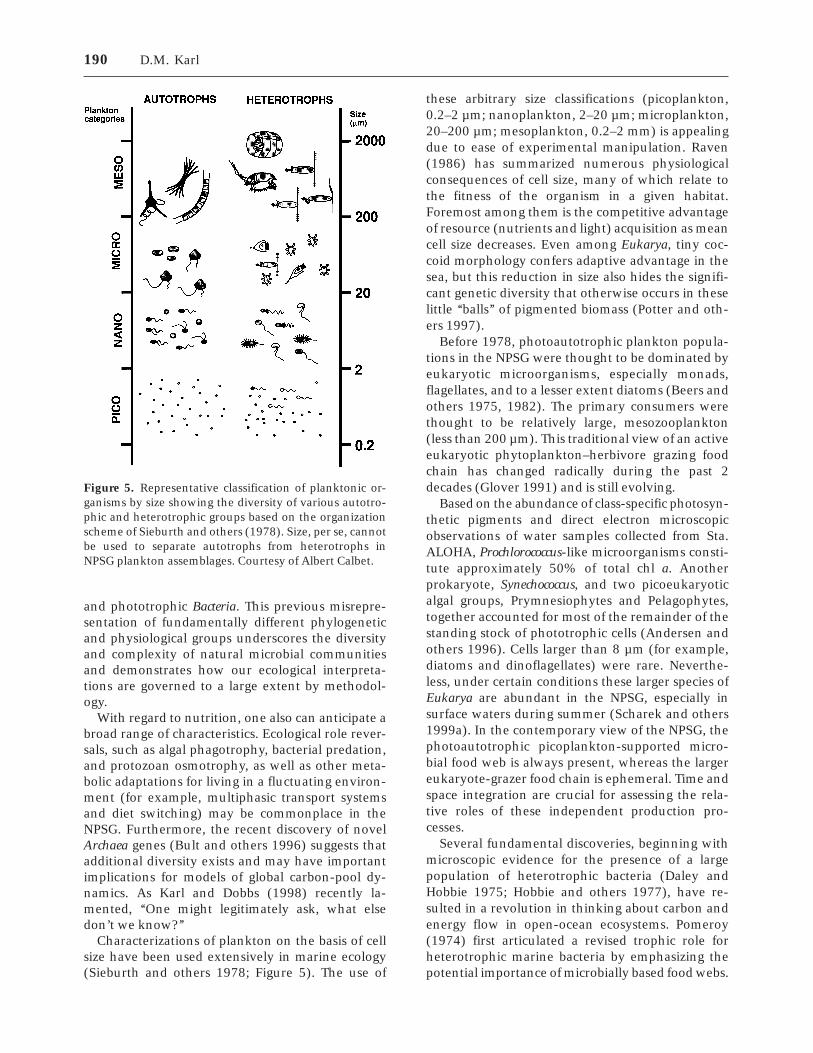
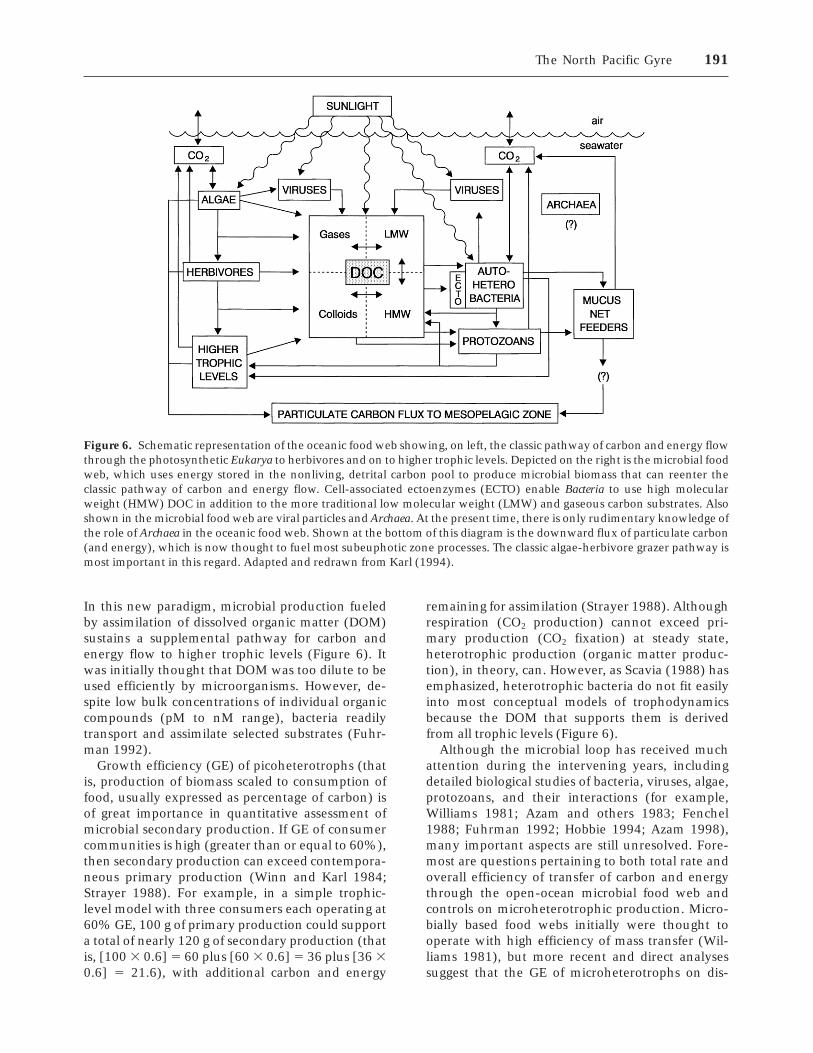
Figure 6. Schematic representation of the oceanic food web showing, on left, the classic pathway of carbon and energy flowthrough the photosynthetic Eukarya to herbivores and on to higher trophic levels. Depicted on the right is the microbial foodweb, which uses energy stored in the nonliving, detrital carbon pool to produce microbial biomass that can reenter theclassic pathway of carbon and energy flow. Cell-associated ectoenzymes (ECTO) enable Bacteria to use high molecularweight (HMW) DOC in addition to the more traditional low molecular weight (LMW) and gaseous carbon substrates. Alsoshown in the microbial food web are viral particles and Archaea. At the present time, there is only rudimentary knowledge ofthe role of Archaea in the oceanic food web. Shown at the bottom of this diagram is the downward flux of particulate carbon(and energy), which is now thought to fuel most subeuphotic zone processes. The classic algae-herbivore grazer pathway ismost important in this regard. Adapted and redrawn from Karl (1994).
The North Pacific Gyre 191
solved organic matter in open-ocean ecosystems isin the range of 10–20% (Carlson and Ducklow1996). Given the fact that at least two trophictransfers, and usually more, are required to channelmicroheterotrophic production back into the tradi-tional food web (Figure 6), it now appears that themicrobial food web acts largely as a sink for carbonand energy. The ecological significance appears to becentered on remineralization, including respiration,rather than biomass production. As Fenchel (1988)correctly observed, ecosystems are always sinks andtend to favor remineralization.
From an ecological perspective, important yetunresolved aspects of the microbial loop hypothesisconcern controls on bacterial abundance, includingboth production and removal. Traditionally, ‘‘bacte-ria’’ were thought to be strict chemoorganohet-erotrophs supported by the large and chemicallydiverse pool of DOM (Azam and others 1983).However, Bacteria in the NPSG also are known tofunction as photolithoautotrophs, so major revisionof this paradigm is necessary (Figure 6). It is conceiv-able, even likely, that mixotrophic metabolism (thatis, the simultaneous expression of autotrophic andheterotrophic modes) is selected for in situ. Organicnutrients can play a dual metabolic role, supplyingboth essential bioelements (C, N, P) and energy. Thefact that organic nutrient assimilation is commonamong photoautotrophs is not well appreciatedfrom an ecological perspective (Bonin and Maestrini1981). Furthermore, without additional informa-tion on the ecological role of planktonic Archaea(pure cultures do not exist) and on the potentialmetabolic versatility of Prochlorococcus (pure culturesare only recently available), it may be premature tocomment further on the potential flows of carbonand energy through these complex microbial foodwebs. Even for the more well-studied Eukarya, mostof the laboratory culture work has been conductedusing coastal, not open-ocean, isolates. Consequently,present knowledge of microbial loop processes is aflexible outline, rather than a rigid dogma.
The distribution and abundance of microorgan-isms is controlled by both bottom-up (that is, re-source control, including both inorganic and or-ganic nutrients) and top-down (that is, predatorcontrol, including phagotrophic protozoans, preda-tory bacteria, and virus infection) processes. DOM isproduced by a number of distinct metabolic andecological processes including direct (deliberate andinadvertent) release from photoautotrophs, ineffi-cient grazing (‘‘sloppy feeding’’), excretion, defeca-tion, and death (Figure 6). Among the other morewell-established pathways, viral infection and subse-quent cell lysis are now recognized as potentially
important processes of DOM production in pelagichabitats (Figure 6). Each process might be expectedto produce a separate list of organic compoundswith variable residence times. The more refractorycompounds would accumulate and eventually domi-nate ambient DOM pools. Consequently, steadystate DOM concentration per se may provide little ifany ecological information regarding individual com-pound bioavailability or potential for supportingmicrobial growth.
For the NPSG, the mean age of the surface DOMpool, based on direct 14C measurements, is approxi-mately 1500 y (Williams and Druffel 1987; Druffeland Williams 1990). By comparison, the surface-ocean particulate carbon pool (which includes bothliving cells and nonliving particulate detritus) ap-pears to be in 14C:12C isotopic equilibrium with thedissolved inorganic carbon pool and thus relativelyyoung (Druffel and Williams 1990). These data onnatural 14C abundances place a major constraint onthe rates and pathways of DOM production and usein the surface ocean. Inability to characterize thelarge and dynamic DOM reservoir and to quantifymost trophic transfer efficiencies precludes seriousefforts to model the open-ocean microbial food web.
Several things do seem certain with regard tomicrobial food web dynamics in the NPSG (Figure6): (a) prokaryotes, and especially Bacteria, domi-nate both standing stocks (Table 1) and fluxes ofcarbon and energy, (b) heterotrophic microbial foodwebs provide only a negligible particulate mattersubsidy to the ‘‘classic’’ food web, and (c) thephylogenetic and physiological diversities of prokary-otic assemblages are essential for sustaining thecycles of major and trace bioelements.
THE OCEANIC CARBON CYCLE: PRIMARY
PRODUCTION AND RESPIRATION
The large and dynamic oceanic reservoir of carbon,approximately 4 3 1019 g distributed unequallyamong dissolved and particulate constituents withvarious redox states, plays an important role inglobal biogeochemical cycles (Table 1). The twolargest pools are dissolved inorganic carbon (DIC)and the less oxidized pool of mostly uncharacter-ized, dissolved organic carbon (DOC). Chemicaldisequilibrium between DIC and organic matter isproduced and maintained by numerous, mostlybiologically mediated, conversions between dis-solved and particulate carbon pools. These processesdefine the oceanic carbon cycle.
Primary conversion of oxidized DIC to reducedorganic matter is generally restricted to the euphoticzone of the world ocean via photosynthesis. The
192 D.M. Karl
supply of reduced carbon and energy required tosupport subeuphotic zone metabolic processes isultimately derived from the upper ocean and istransported down by advection and diffusion ofdissolved organic matter (Toggweiler 1989), gravita-tional settling of particulate matter (McCave 1975),and by vertical migrations of pelagic animals (Long-hurst and Harrison 1989) and phytoplankton (Villar-eal and others 1993). Each of these processes,
collectively termed the ‘‘biological pump’’ (Volk andHoffert 1985), operates under the control of bothphysical (light, temperature, and turbulence) andbiological (species composition, growth rate, andfood web structure) processes. For open-ocean eco-systems like the NPSG, relative contributions ofthese processes are poorly known.
Accurate and precise estimation of primary pro-ductivity in the marine environment is required for
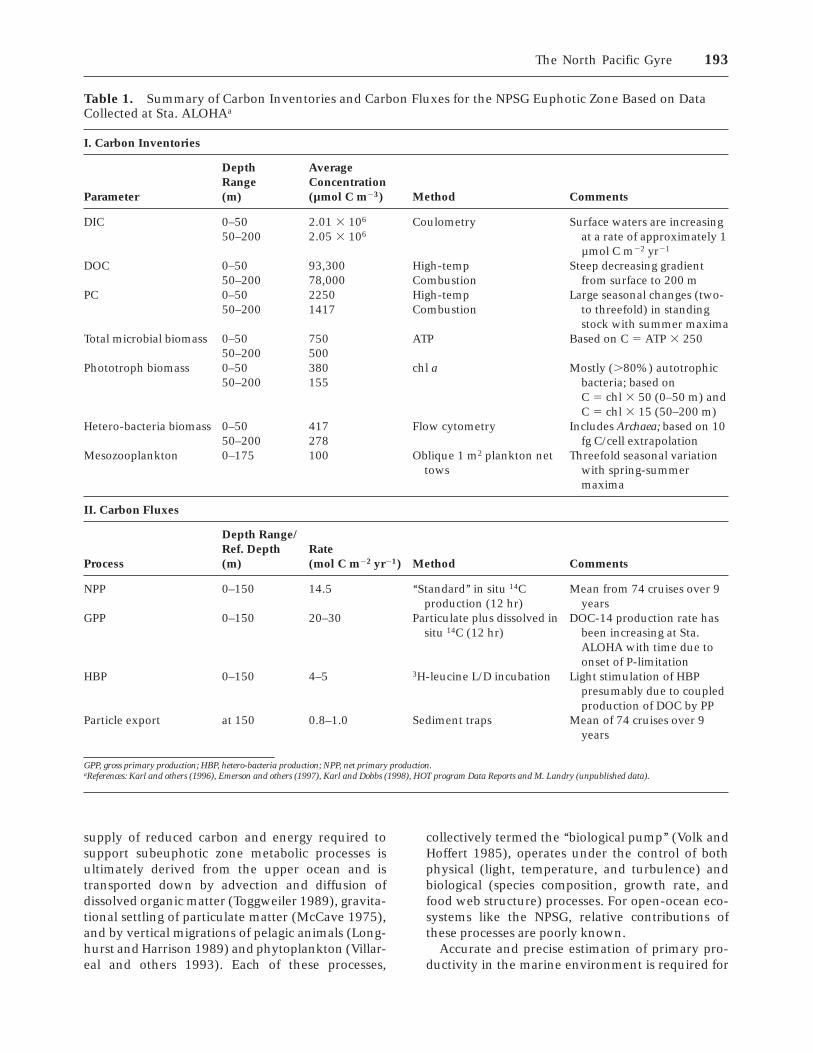
Table 1. Summary of Carbon Inventories and Carbon Fluxes for the NPSG Euphotic Zone Based on DataCollected at Sta. ALOHAa
I. Carbon Inventories
Parameter
DepthRange(m)
AverageConcentration(µmol C m23) Method Comments
DIC 0–5050–200
2.01 3 106
2.05 3 106
Coulometry Surface waters are increasingat a rate of approximately 1µmol C m22 yr21
DOC 0–5050–200
93,30078,000
High-tempCombustion
Steep decreasing gradientfrom surface to 200 m
PC 0–5050–200
22501417
High-tempCombustion
Large seasonal changes (two-to threefold) in standingstock with summer maxima
Total microbial biomass 0–5050–200
750500
ATP Based on C 5 ATP 3 250
Phototroph biomass 0–5050–200
380155
chl a Mostly (.80%) autotrophicbacteria; based onC 5 chl 3 50 (0–50 m) andC 5 chl 3 15 (50–200 m)
Hetero-bacteria biomass 0–5050–200
417278
Flow cytometry Includes Archaea; based on 10fg C/cell extrapolation
Mesozooplankton 0–175 100 Oblique 1 m2 plankton nettows
Threefold seasonal variationwith spring-summermaxima
II. Carbon Fluxes
Process
Depth Range/Ref. Depth(m)
Rate(mol C m22 yr21) Method Comments
NPP 0–150 14.5 ‘‘Standard’’ in situ 14Cproduction (12 hr)
Mean from 74 cruises over 9years
GPP 0–150 20–30 Particulate plus dissolved insitu 14C (12 hr)
DOC-14 production rate hasbeen increasing at Sta.ALOHA with time due toonset of P-limitation
HBP 0–150 4–5 3H-leucine L/D incubation Light stimulation of HBPpresumably due to coupledproduction of DOC by PP
Particle export at 150 0.8–1.0 Sediment traps Mean of 74 cruises over 9years
GPP, gross primary production; HBP, hetero-bacteria production; NPP, net primary production.aReferences: Karl and others (1996), Emerson and others (1997), Karl and Dobbs (1998), HOT program Data Reports and M. Landry (unpublished data).
The North Pacific Gyre 193
understanding of both contemporary and past car-bon cycles. The low-nutrient, open-ocean habitatsof our planet are sometimes considered analogues ofterrestrial deserts owing to their low standing stocksof living organisms and presumed low rates oforganic carbon production. This traditional view ofoligotrophic ocean biogeochemistry is now chang-ing because of the long-term studies conducted atSta. ALOHA in the North Pacific Ocean (Karl andothers 1996) and at a sister station near Bermuda inthe North Atlantic Ocean (Michaels and Knap 1996).
To understand biologically mediated carbon fluxesin the pelagic environment, it is important to differ-entiate between gross primary production (GPP),net primary production (NPP equals GPP minusphotoautotrophic respiration), and net communityproduction (NCP equals GPP minus both photoauto-trophic and heterotrophic respiration). These arevery different ecosystem properties (Williams 1993).Even in waters seemingly depleted in inorganicnutrients, both nutrient assimilation and GPP occurat substantial rates as a result of rapid nutrientcycling. This ‘‘spinning wheel’’ pelagic ecosystem(Goldman 1984) may be supported by the presenceof aggregates of particulate organic matter thatprovide microenvironments that are enriched inrequired inorganic and organic nutrients.
Shulenberger and Reid (1981) noted that a subsur-face oxygen (O2) supersaturation maximum devel-ops each summer in the NPSG; the magnitude ofthis feature can be used to constrain the rate of NPP.Based largely on data collected in the Climax region,they concluded that the implied O2 productionestimates were significantly greater (up to 5.4 times)than estimates derived from 14C uptake (Shulen-berger and Reid 1981). This provocative conclusionthat the production of organic matter in the NPSGmay have been ‘‘seriously underestimated’’ waschallenged by Platt (1984) on both theoretical andanalytical grounds. Platt (1984) concluded that itmay be misleading to compare fluxes that aremeasured on different time and space scales.
Reid and Shulenberger (1986) countered with adefense of their initial interpretation and a rebuttalof Platt’s (1984) main criticisms. They ended theirletter to the editor with the statement, ‘‘Platt’snumbers support our case.’’ In their second formalcorrespondence on this matter, Platt and Harrison(1986) emphasized that ‘‘the would-be iconoclastmust bear the burden of proof’’ given the potentialecological and biogeochemical implications of theirconclusion.
Motivated, in part, by these conflicting estimatesof primary production, R. Eppley and colleagues(Eppley 1982; Laws and others 1984) conducted
two field studies in the NPSG during August 1982.The Plankton Rate Processes in Oligotrophic Oceans(PRPOOS) program confirmed that previous fieldmeasurements may have underestimated rates ofprimary production by two to threefold. However,in the absence of a more comprehensive time-seriesstudy, it was impossible to derive an accurate esti-mate of annual production for this region or even todistinguish methodological change from ecosystemchange.
Because the NPSG is a large habitat, with exten-sive temporal and spatial scales of variability, it isunlikely that a precise global survey of primaryproduction will ever be achieved by direct measure-ment. Consequently, one must rely upon regionalproductivity compilations of uneven measurementdensity (Longhurst and others 1995). In the mostcommonly referenced global map of primary produc-tion (Koblentz-Mishke and others 1970), NPSGvalues are reported as less than 36 g C m22 yr21.Even the more recent data compilations of Eppleyand Peterson (1979) and Berger (1989) list primaryproduction values of 26 and 15–35 g C m22 yr21,respectively, for the NPSG.
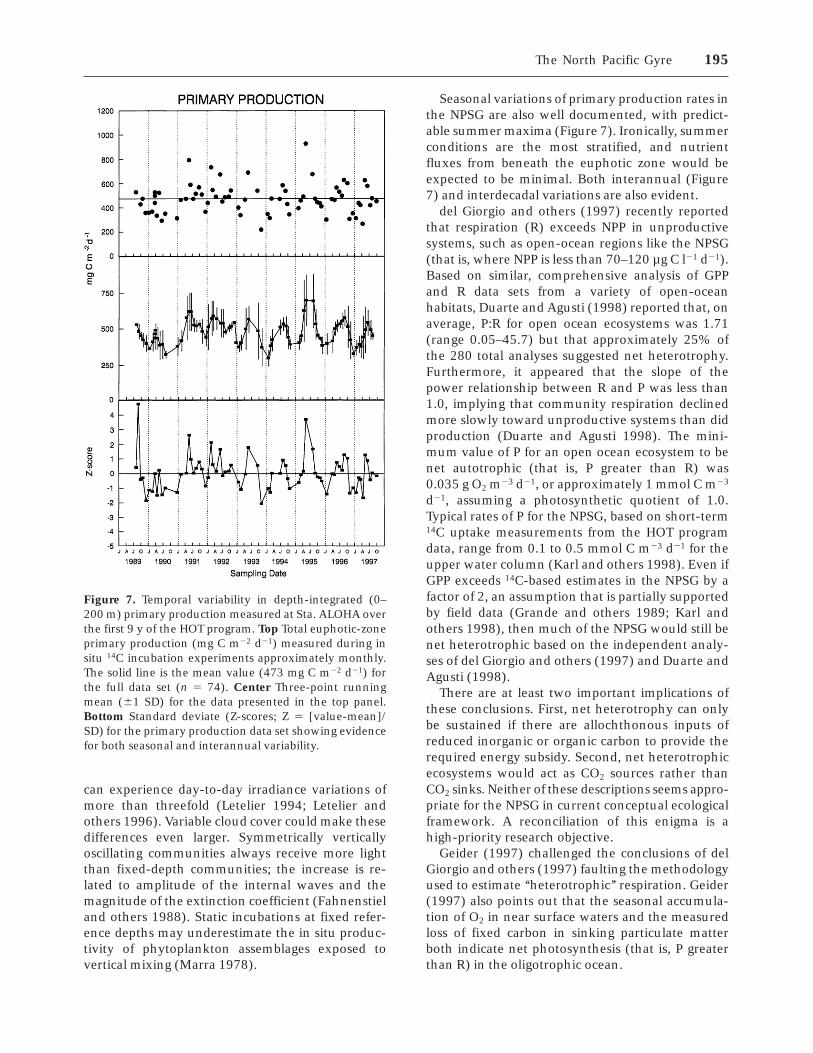
Based on the nearly decade-long set of observa-tions and measurements at Sta. ALOHA, it nowappears that present rates of primary production inthese low biomass regions and therefore in theocean as a whole are much greater than had beenconsidered in field studies conducted before themid-1980s. Primary production rates measured atSta. ALOHA approximately monthly during theperiod October 1988 to December 1997 varied from219 to 1055 mg C m22 d21 based on the in situ 14Ctechnique. The 9-y mean of 473 mg C m22 d21
(standard deviation 5 123 mg C m22 d21; median 5471; n 5 74) is two to three times greater than mostprevious measurements in this region (Figure 7).
Photosynthesis in the NPSG can vary significantlyon time scales ranging from daily to interdecadal.Karl and others (1996) have reported a greater thanthreefold range in daily irradiance (from 17.9 to58.2 mol quanta m22 d21) at Sta. ALOHA due to acombination of seasonal and local meteorological(that is, clouds) effects. Even under conditions ofconstant surface irradiance, vertical oscillations ofisopycnals as a result of inertial-period internalwaves can have a major effect on photosynthesis.These vertical displacements can cause transientchanges in the chl a per unit irradiance in theeuphotic zone and changes in the nutrient concen-trations at the base of the euphotic zone. Given the31-h inertial period at Sta. ALOHA and assuming aconservative internal wave amplitude of 18 m,populations at the DCML (approximately 100 m)
194 D.M. Karl
can experience day-to-day irradiance variations ofmore than threefold (Letelier 1994; Letelier andothers 1996). Variable cloud cover could make thesedifferences even larger. Symmetrically verticallyoscillating communities always receive more lightthan fixed-depth communities; the increase is re-lated to amplitude of the internal waves and themagnitude of the extinction coefficient (Fahnenstieland others 1988). Static incubations at fixed refer-ence depths may underestimate the in situ produc-tivity of phytoplankton assemblages exposed tovertical mixing (Marra 1978).
Seasonal variations of primary production rates inthe NPSG are also well documented, with predict-able summer maxima (Figure 7). Ironically, summerconditions are the most stratified, and nutrientfluxes from beneath the euphotic zone would beexpected to be minimal. Both interannual (Figure7) and interdecadal variations are also evident.
del Giorgio and others (1997) recently reportedthat respiration (R) exceeds NPP in unproductivesystems, such as open-ocean regions like the NPSG(that is, where NPP is less than 70–120 µg C l21 d21).Based on similar, comprehensive analysis of GPPand R data sets from a variety of open-oceanhabitats, Duarte and Agusti (1998) reported that, onaverage, P:R for open ocean ecosystems was 1.71(range 0.05–45.7) but that approximately 25% ofthe 280 total analyses suggested net heterotrophy.Furthermore, it appeared that the slope of thepower relationship between R and P was less than1.0, implying that community respiration declinedmore slowly toward unproductive systems than didproduction (Duarte and Agusti 1998). The mini-mum value of P for an open ocean ecosystem to benet autotrophic (that is, P greater than R) was0.035 g O2 m23 d21, or approximately 1 mmol C m23
d21, assuming a photosynthetic quotient of 1.0.Typical rates of P for the NPSG, based on short-term14C uptake measurements from the HOT programdata, range from 0.1 to 0.5 mmol C m23 d21 for theupper water column (Karl and others 1998). Even ifGPP exceeds 14C-based estimates in the NPSG by afactor of 2, an assumption that is partially supportedby field data (Grande and others 1989; Karl andothers 1998), then much of the NPSG would still benet heterotrophic based on the independent analy-ses of del Giorgio and others (1997) and Duarte andAgusti (1998).
There are at least two important implications ofthese conclusions. First, net heterotrophy can onlybe sustained if there are allochthonous inputs ofreduced inorganic or organic carbon to provide therequired energy subsidy. Second, net heterotrophicecosystems would act as CO2 sources rather thanCO2 sinks. Neither of these descriptions seems appro-priate for the NPSG in current conceptual ecologicalframework. A reconciliation of this enigma is ahigh-priority research objective.
Geider (1997) challenged the conclusions of delGiorgio and others (1997) faulting the methodologyused to estimate ‘‘heterotrophic’’ respiration. Geider(1997) also points out that the seasonal accumula-tion of O2 in near surface waters and the measuredloss of fixed carbon in sinking particulate matterboth indicate net photosynthesis (that is, P greaterthan R) in the oligotrophic ocean.
Figure 7. Temporal variability in depth-integrated (0–200 m) primary production measured at Sta. ALOHA overthe first 9 y of the HOT program. Top Total euphotic-zoneprimary production (mg C m22 d21) measured during insitu 14C incubation experiments approximately monthly.The solid line is the mean value (473 mg C m22 d21) forthe full data set (n 5 74). Center Three-point runningmean (61 SD) for the data presented in the top panel.Bottom Standard deviate (Z-scores; Z 5 [value-mean]/SD) for the primary production data set showing evidencefor both seasonal and interannual variability.
The North Pacific Gyre 195
Williams (1998) was also incredulous that open-ocean regions, such as the NPSG, could be sustainedas net heterotrophic systems and used an indepen-dent analysis to suggest that the del Giorgio andothers (1997) conclusions may be flawed. Themajor difference in the treatment of these experi-mental data is that Williams (1998) used 0–100-mdepth-integrated estimates whereas del Giorgio andothers (1997) used separate volumetric determina-tions. Although there were systematic depth-dependent trends in the P:R ratio for the NPSG datasets, the mean 0–100-m depth-integrated net com-munity production (NCP) was –0.9 6 43 mmol O2
m22 d21, a value that was indistinguishable frommetabolic balance (Williams 1998). In the absenceof time-series data, instantaneous photosynthesisand respiration measurements may mask a succes-sion or alternation of periods of net autotrophy vsnet heterotrophy on seasonal to decadal time scales(for example, Sherr and Sherr 1996) and thereforemay be subject to misinterpretations. Furthermore,the very small net fluxes of oxygen, despite highrates of photosynthesis and respiration, present anunique analytical challenge.
THE OCEANIC CARBON CYCLE: NEW AND
EXPORT PRODUCTION
There are at least two major sources of nutrientsused to support plankton rate processes in theeuphotic zone: (a) the local regeneration of simpleforms of elements (for example, NH4
1) resultingfrom the combined metabolic activities of metazoanand microbial processes, and (b) the influx ofdistantly produced ‘‘new’’ nutrients (generally NO3
2)imported to the euphotic zone from greater oceandepths by upward advection and diffusion, by hori-zontal transport (Falkowski and Raven 1997), or byatmospheric deposition. In 1967, Dugdale and Goer-ing formalized their now unifying concept of newand regenerated nutrients and therefore new andregenerated primary production of organic matterin the sea.
In their original presentation, Dugdale and Goer-ing (1967) were very explicit on several key issues:(a) new nutrients can be derived from multiplesources (atmosphere, land, and deep water) that areall dependent upon fundamentally different re-newal mechanisms, (b) any one of several elementscould be used as the common currency, and (c) withregard to N-based considerations, if bacterial N2
fixation (N2 = NH41 = organic N) or bacterial
nitrification (NH41 = NO2
2/NO32) were found to be
quantitatively important N flux pathways, therewould need to be a reconsideration of new and
regenerated controls. Platt and others (1992) haverecently presented a thoughtful review of the newproduction formalism complete with ecological im-plications ranging from paleo to modern habitats.
If it is assumed that phytoplankton production inthe NPSG is N limited, and that rates of bacterial N2
fixation and nitrification and horizontal transport ofnutrients are all negligible relative to rates of grossorganic N production, then total N assimilation canbe treated as the sum of [NH4
1] plus [NO32] uptake
and can be measured using appropriate 15N-labeledisotopic tracers. This simplification also assumes thatorganically bound dissolved N (for example, ureaand amino acids) is not readily assimilated byprimary producers and that heterotrophic bacteriado not assimilate inorganic nitrogen compounds;neither assumption is true for the NPSG (Laws andothers 1985; Sahlsten 1987).
The fraction of the total N assimilation that issupported by new nutrients, in this example, therate of NO3
2 uptake [that is, f 5 (NO3—N)/(NO3
—N1NH4
12N)], also is referred to as the ‘‘f-ratio’’ (Eppleyand Peterson 1979). The f-ratio is one measure ofthe efficiency of ecosystem function (Quinones andPlatt 1991). In the NPSG, regenerated primaryproduction is typically 10–20 times greater thannew primary production (f 5 0.05–0.10), indicativeof a very inefficient system with regard to newproduction.
The new production paradigm has provided aconceptual framework for studies linking primaryproduction and particle export. If biological steadystate is assumed, or if primary and new productionmeasurements are compared over sufficiently longperiods (months to years), then new production in agiven ecosystem is equivalent to the amount ofprimary production that is available for export, avalue that is quantitatively balanced by resupply ofproduction rate–limiting nutrients (Eppley and Pe-terson 1979; Eppley and others 1982; Eppley 1989;Knauer and others 1990).
In theory, export production would include lossesof both dissolved and particulate matter. However,as Margalef (1978) has so eloquently stated, ‘‘anyatom is more likely to travel downwards when in aparticle than in solution;’’ and this predicts a moresignificant role for processes that favor export ofparticulate matter. Aggregation and mass sedimen-tation of living phytoplankton must be consideredthe epitome of export production. This mechanismis responsible for the rapid delivery of ‘‘fresh,’’biodegradable organic matter to the deep-sea ben-thos (Billett and others 1983; Smith and others1996). Most models of the biological pump assumethat short grazing food chains lead to high new
196 D.M. Karl
production (f . 0.5) and high export, whereascomplex microbial food webs lead to high recycling(f , 0.1) and low export.
For the NPSG, Michaels and Silver (1988) haveshown that the size distribution of pelagic primaryproducers and the trophic structure of the consumerpopulations determine both the composition andmagnitude of the exported particulate materials.Community structure controls all. As H. B. Bigelowso aptly noted, ‘‘all fish is diatoms’’ (cited by Dugdaleand Wilkerson 1992). A modern assessment mightstate that new production, that is, that portion ofgross primary production supported by allochtho-nous nutrients and that at steady state is availablefor export to higher trophic levels including fishes, isdependent largely on the growth of diatoms andother large, eukaryotic phytoplankton. A majorconceptual problem, however, is that diatom bio-mass is a relatively minor component of the stand-ing stock of phytoplankton in the NPSG (Ondrusekand others 1991; Letelier and others 1993). Thesetwo opposing viewpoints can be reconciled if oneinvokes stochastic processes as major factors incontrol of new and export production.
Existence of both external and internal pulses isthe general rule in natural ecosystems (Odum andothers 1995), and in this regard the NPSG does notappear exceptional. Both seasonal and stochasticforces may be important for stimulating otherwiseinefficient or dormant components of the ecosys-tem. These, in turn, could lead to periods of en-hanced ecosystem production, biomass accumula-tion, or predator–prey oscillations.
The classic marine grazing food chain—algae,zooplankton, and fish—can now be considered as avariable phenomenon in a sea of microbes. Al-though the flow of carbon and energy through thistraditional pathway is relatively small comparedwith the more dominant and complex microbialfood web, the aperiodic stimulation of the classicgrazing food chain may be important for control ofexport production and for biological sequestrationof atmospheric CO2. Results from the HOT programhave documented a complex temporal pattern ofparticle export that suggests two major events perannum; one in late winter and a second in latesummer (Karl and others 1996). Based on thenitrogen isotopic abundance of sinking particlescollected in a bottom-moored sediment trap de-ployed at Sta. ALOHA, Karl and others (1997) havesuggested that the two events are derived fromfundamentally different ecological processes. Thewinter pulse (with a mean d15N 5 4.83) is hypoth-esized to be largely supported by nitrate (d15N 5 6.5)supplied by stochastic upwelling events. By con-
trast, the late summer pulse (with a mean d15N 51.53) is largely supported by nitrogen supplied bybacterial N2 fixation (d15N 5 0).
The sudden pulses of inorganic nutrients fromaperiodic intrusions of nutricline water into theeuphotic zone select for the diatom-copepod-fishfood chain and result in a coupled export of particu-late matter. Although the microbial food web contin-ues to be active, it is ‘‘overprinted’’ by the growth ofeukaryotic algae that respond quickly to the alloch-thonous supply of nutrients. It is essential to studythe signal, as well as the background. Each summer,as stratification intensifies, there is selection forN2-fixing organisms and a pulse of N2-supportednew production. Near the end of the summer, asecond pulse of nutrients that appears to be derivedfrom death and autolysis of near-surface planktonfuels another rapid bloom of eukaryotic algae andsubsequent export pulse of particulate matter (Karland others 1996). It should be emphasized that bothstrong and weak mixing can enhance new andexport production, the former by import of NO3
2
and the latter by providing a habitat conducive forN2-fixing organisms in surface waters (Karl andothers 1992, 1995).
Wiegert and Penas-Lado (1995) compared theeffects of upwelled pulses of nutrients with a con-stant supply of an equivalent annual flux. In theirsimulation model of an open-ocean pelagic commu-nity, nutrient pulsing produced a rich dynamicalbehavior and complex trophic structure that wasobliterated under constant nutrient supply. Theseecosystem pulses are inherently transient and sto-chastic and therefore difficult to observe and study.From investigations conducted elsewhere in theworld ocean, diatoms are known to be important inmediating particle export directly as aggregated, senes-cent cells or indirectly as a result of macrozooplanktongrazing (Peinert and others 1989), even if they rarelydominate the standing stocks of phytoplankton cells.
The role of the ocean as a net sink in the globalcarbon cycle is dependent largely upon the balancebetween the export flux of planktonic primaryproduction (Eppley and Peterson 1979; Williamsand von Bodungen 1989) and the rate of dissolvednutrient resupply by upward eddy diffusion. Whenparticulate export is expressed as a percentage ofcontemporaneous primary production, this value istermed the export ratio (Baines and others 1994).Results from broad-scale, cross-ecosystem analysessuggest that the export ratio in oceanic habitats is apositive, nonlinear function of total integrated pri-mary production (Suess 1980; Martin and others1987; Pace and others 1987; Wassman 1990), withvalues ranging from less than 10% in oligotrophic
The North Pacific Gyre 197
waters to less than 50% in productive coastalregions. It should be emphasized, however, that thefield data from which the existing export productionmodels were derived are extremely limited and thatopen-ocean habitats like the NPSG are underrepre-sented (Baines and others 1994). Because a major-ity of global ocean primary and export productionoccurs in subtropical gyre habitats (Martin andothers 1987), it is important to understand themechanisms that control the biological pump tomake accurate and meaningful predictions of theresponse of the oceanic carbon cycle to globalenvironmental change.
When the new production concept was devel-oped by Dugdale and Goering (1967), accuratemeasurements of marine nitrification rates were notavailable. Nevertheless, they stated, ‘‘If nitrificationrates are eventually shown to be sufficiently higherthan has been assumed, the assumption that nitrateis a nonregenerated nutrient form in the euphoticzone would have to be modified’’ (Dugdale andGoering 1967, p. 205). Recent improvements intechniques for measurement of nitrification rates inthe sea indicate a significant role for this process(Olson 1981; Ward and others 1982); the validity ofthe new production concept as it is commonlyapplied has come into question (Ward and others1989; Dore and Karl 1996). Furthermore, if theNPSG was actually N limited, one might expect thatN2-fixing bacteria would be selected for, forcing theecosystem to limitation by the next least abundantrequired nutrient, relative to plankton populationrequirements (von Liebig’s Law; in the case of theNPSG, most likely P or one of several trace metals).
Recent results have indicated that N2 fixation inthe NPSG may presently supply up to 50% of new N(Karl and others 1997). Both conceptually andecologically, N2-supported new production is funda-mentally different from NO3-supported new produc-tion even though the two were considered togetherin the original new vs regenerated model of Dugdaleand Goering (1967). When NO3
2 enters the eu-photic zone from below by vertical advection anddiffusion, it is delivered with a suite of other re-quired major (for example, C, P, and Si) and trace(for example, Fe) elements in the proper stoichiom-etry to sustain biological activity. However theprocess of N2 fixation serves to decouple exportfrom new nutrient import, which can lead to changesin the elemental stoichiometry of surface-oceanparticulate and dissolved organic matter and selec-tion for or against certain groups of microorganisms(Karl and others 1997). Significant rates of N2-basednew production eventually would result in severe Pand perhaps Si limitation because, in the NPSG,
these vital nutrients are supplied from below. Fur-thermore, selective separation of the otherwisecoupled N-P-Si cycles by vertically migrating micro-bial assemblages (Karl and others 1992; Villarealand others 1993) or positively buoyant particulatematter may further complicate these mass-balanceconsiderations. These observations suggest that itmay be inappropriate to assume that biogeochemi-cal processes in the NPSG conform to the currentnew vs regenerated dichotomy; a revised paradigmmay be required.
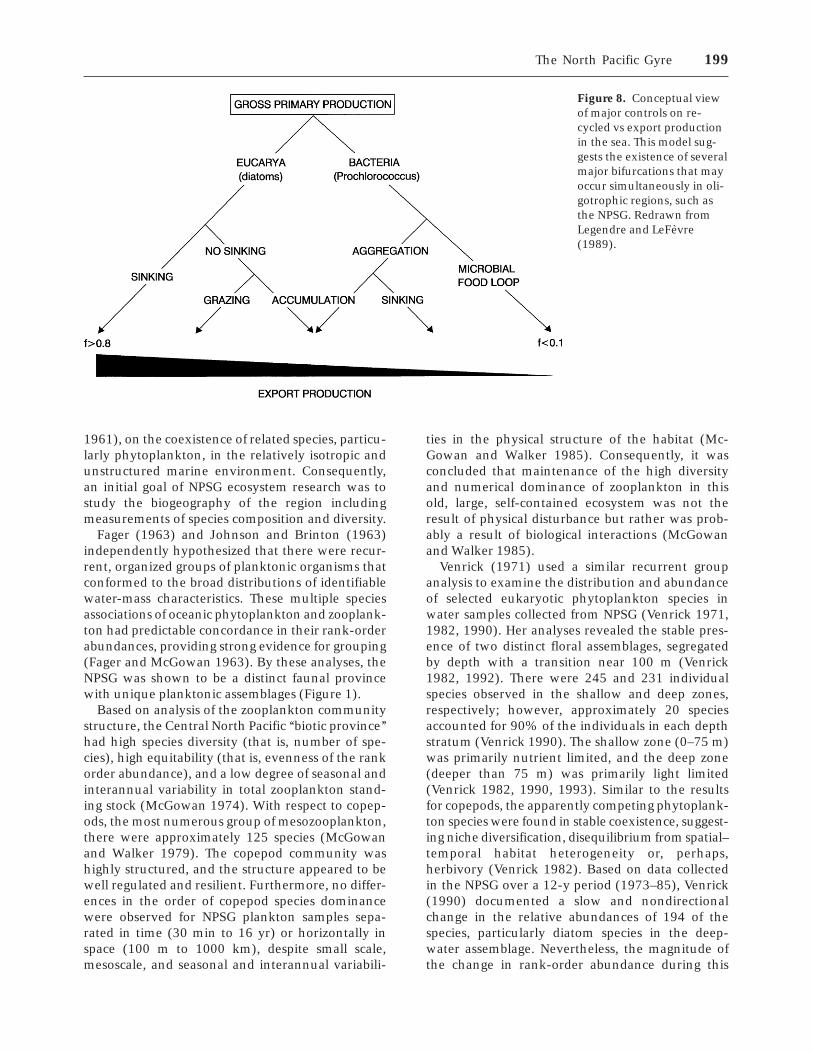
The critical role of large, eukaryotic phytoplank-ton in the production of exportable particulatematter cannot be overstated, and in this context theimportance of aperiodic, pulsed events is para-mount. However, Legendre and Le Fevre (1989)have shown that there is no a priori direct equiva-lence between the new production and exportproduction concepts. The former concerns particu-late matter production by photoautotrophs and thelatter is controlled by numerous trophic levels. Intheir bifurcation model (Figure 8), they emphasizethe importance of primary production—export pro-cesses for large vs small photoautotrophic cells andthe critical role of gravitational sinking, which maypartially be controlled by hydrodynamics. For ex-ample, export production is maximized if largephototrophs grow, aggregate, and then sink. At theopposite end of the continuum, export is minimizedwhen phototrophic picoplankton fuel a complexmicrobial food web. At Sta. ALOHA, there appearsto be an episodic diatom aggregation-sinking eventin late summer (Scharek and others 1999a, 1999b)that could be the manifestation of a N2-supported‘‘echo’’ bloom after disappearance, by autolysis, ofthe seasonally accumulated, N2-fixing Trichodes-mium population, as suggested by the 15N isotopicsignatures of sinking organic matter (Karl and oth-ers 1997). A large proportion of the exported diatomcells are full of cytoplasm, contain chl a and other-wise appear to be healthy. The aggregates sinkrelatively rapidly (greater than 200 m d21) andreach the 5000-m seabed as ‘‘bioavailable’’ organicmatter. This and other evidence not summarizedhere clearly documents the importance of episodicexport in the NPSG, and the complexities of model-ing an ecosystem where high-export cell aggrega-tion and low-export microbial loop processes canoccur simultaneously.
SPATIAL AND TEMPORAL PATTERNS IN
PLANKTON COMMUNITY STRUCTURE
In 1961 G. E. Hutchinson published his now classicpaper, the ‘‘Paradox of the Plankton’’ (Hutchinson
198 D.M. Karl
1961), on the coexistence of related species, particu-larly phytoplankton, in the relatively isotropic andunstructured marine environment. Consequently,an initial goal of NPSG ecosystem research was tostudy the biogeography of the region includingmeasurements of species composition and diversity.
Fager (1963) and Johnson and Brinton (1963)independently hypothesized that there were recur-rent, organized groups of planktonic organisms thatconformed to the broad distributions of identifiablewater-mass characteristics. These multiple speciesassociations of oceanic phytoplankton and zooplank-ton had predictable concordance in their rank-orderabundances, providing strong evidence for grouping(Fager and McGowan 1963). By these analyses, theNPSG was shown to be a distinct faunal provincewith unique planktonic assemblages (Figure 1).
Based on analysis of the zooplankton communitystructure, the Central North Pacific ‘‘biotic province’’had high species diversity (that is, number of spe-cies), high equitability (that is, evenness of the rankorder abundance), and a low degree of seasonal andinterannual variability in total zooplankton stand-ing stock (McGowan 1974). With respect to copep-ods, the most numerous group of mesozooplankton,there were approximately 125 species (McGowanand Walker 1979). The copepod community washighly structured, and the structure appeared to bewell regulated and resilient. Furthermore, no differ-ences in the order of copepod species dominancewere observed for NPSG plankton samples sepa-rated in time (30 min to 16 yr) or horizontally inspace (100 m to 1000 km), despite small scale,mesoscale, and seasonal and interannual variabili-
ties in the physical structure of the habitat (Mc-Gowan and Walker 1985). Consequently, it wasconcluded that maintenance of the high diversityand numerical dominance of zooplankton in thisold, large, self-contained ecosystem was not theresult of physical disturbance but rather was prob-ably a result of biological interactions (McGowanand Walker 1985).
Venrick (1971) used a similar recurrent groupanalysis to examine the distribution and abundanceof selected eukaryotic phytoplankton species inwater samples collected from NPSG (Venrick 1971,1982, 1990). Her analyses revealed the stable pres-ence of two distinct floral assemblages, segregatedby depth with a transition near 100 m (Venrick1982, 1992). There were 245 and 231 individualspecies observed in the shallow and deep zones,respectively; however, approximately 20 speciesaccounted for 90% of the individuals in each depthstratum (Venrick 1990). The shallow zone (0–75 m)was primarily nutrient limited, and the deep zone(deeper than 75 m) was primarily light limited(Venrick 1982, 1990, 1993). Similar to the resultsfor copepods, the apparently competing phytoplank-ton species were found in stable coexistence, suggest-ing niche diversification, disequilibrium from spatial–temporal habitat heterogeneity or, perhaps,herbivory (Venrick 1982). Based on data collectedin the NPSG over a 12-y period (1973–85), Venrick(1990) documented a slow and nondirectionalchange in the relative abundances of 194 of thespecies, particularly diatom species in the deep-water assemblage. Nevertheless, the magnitude ofthe change in rank-order abundance during this
Figure 8. Conceptual viewof major controls on re-cycled vs export productionin the sea. This model sug-gests the existence of severalmajor bifurcations that mayoccur simultaneously in oli-gotrophic regions, such asthe NPSG. Redrawn fromLegendre and LeFevre(1989).
The North Pacific Gyre 199
12-y period was small relative to differences ob-served between the two depth strata on any givencruise. Her observations supported the previousconclusions of high stability in population structure(Venrick 1990).
It is important to emphasize that the zooplanktonand phytoplankton species analyzed in these studiescollectively represent less than 10% of the totalstanding stock of living organisms (Table 1 andFigure 5). It is now well documented that the NPSGis a ‘‘microbial ecosystem,’’ and no comprehensivephylogenetic study of the dominant NPSG assem-blages has been conducted. In the absence of thesecritical phylogenetic data sets, Li (1997) has sug-gested that autotrophic marine picoplankton couldbe categorized, instead, by their cellular bio-opticalproperties by using flow cytometry. The resultant‘‘cytometric’’ diversity, based largely on cell size andpigment composition, may be as relevant to ecologi-cal studies as conventional taxonomic classification.
Despite present inability to map picoplankton(including Bacteria, Archaea, and small Eukarya)species assemblages in the NPSG over large spaceand time scales, it seems reasonable to assume thatcoherent patterns corresponding to the water mass–dependent distributions of mesozooplankton and oflarger eukaryotic photoautotrophs eventually mightbe revealed. It is certain that the most abundantphotoautotrophic and chemoheterotrophic speciesin the NPSG have eluded pure culture, which is asobering commentary on the level of understandingof the largest biome on Earth!
THE ‘‘GREENING’’ OF THE NPSGThe influence of climate variability on oceanicbiogeochemical cycles, especially that which occurson decade-to-century time scales, is not well under-stood. Because of their large thermal inertia, theoceans are expected to play a major role in climatevariations on time scales of decades to centuries(Deser and others 1996). If community stabilizationis a universal tendency under ruling climate (that is,the Climax community theory), then communitychange can be expected during variations in climate.Although there are several case studies document-ing impacts of climatic variability on structure andfunction of selected marine ecosystems, especiallyfisheries (Mysak 1986; Polovina and others 1994;Mantua and others 1997; McGowan and others1998), few data exist on changes in new or exportproduction pathways or rates that could be incorpo-rated into global carbon sequestration models. Onemajor obstacle is the potential lag between physicalperturbation and ecological response and the gen-eral resiliency of natural communities to external
physical forcing. One might predict an abrupt,threshold response that may be time lagged ratherthan slow, gradual ecological change.
When trade winds persist for several years, theyaccumulate surface water in the western Pacific,and upper-layer heat storage, or upper-ocean vol-ume, is increased in a hydrographic region calledthe ‘‘warm pool’’ (Barber 1992). To track the totalheat storage, Wyrtki (1985) developed an upper-layer volume index (Figure 9, top) that may providediagnostic information on the El Nino and La Ninastates of these low-latitude regions. The HOT pro-gram began when this index was at a decade-longminimum and has made most of its field observa-tions during a period of unprecedented and more-or-less continuous change (Figure 9).
The coupled interactions between tropical andmidlatitude climate in the North Pacific, that is,teleconnections, have been known since the classicwork of Sir Gilbert Walker nearly 75 years ago(Bjerknes 1969). The El Nino Southern Oscillation(ENSO), with alternating episodes of warm and coldwater in the equatorial Pacific, is one of the betterknown phenomena (Figure 9). Dramatic changes inthis and other ENSO-related indices (for example,Cold Tongue Index, Southern Oscillation Index;Zhang and others 1997) document the importanceof decadal habitat variability. Furthermore, bothfrequency and duration of El Nino–favorable condi-tions have increased over the past several decades(Trenberth and Hoar 1997), especially during theperiod of the HOT program (Figure 9). It remains tobe seen if these variations in coupled ocean–atmosphere processes in the equatorial Pacific propa-gate to and impact NPSG ecosystems and whetherthe increasing burden of atmospheric carbon diox-ide will interact with these complex global oceanprocesses. These are but a few exciting challengesfor the future.
A major and abrupt shift in the North Pacificclimate system occurred during 1976–77, manifest-ing itself as an intensification and eastward shift ofthe Aleutian low-pressure system during winter(Trenberth 1990; see Figure 10). Both changesmeant that the counterclockwise circulation aroundthe low-pressure system was pumping more warmair northwards to Alaska while sending anoma-lously cold air to the south (Kerr 1992). This patternresulted in a decade-long cooling phase in the seasurface of the NPSG. Over the midlatitudes of theNorth Pacific, the regime shift also was marked bymore vigorous winter circulation and southwestextension of the prevailing westerlies for the periodfollowing 1975–76 (Graham 1994). Concident withthese sea-surface anomalies, subsurface (100–125
200 D.M. Karl
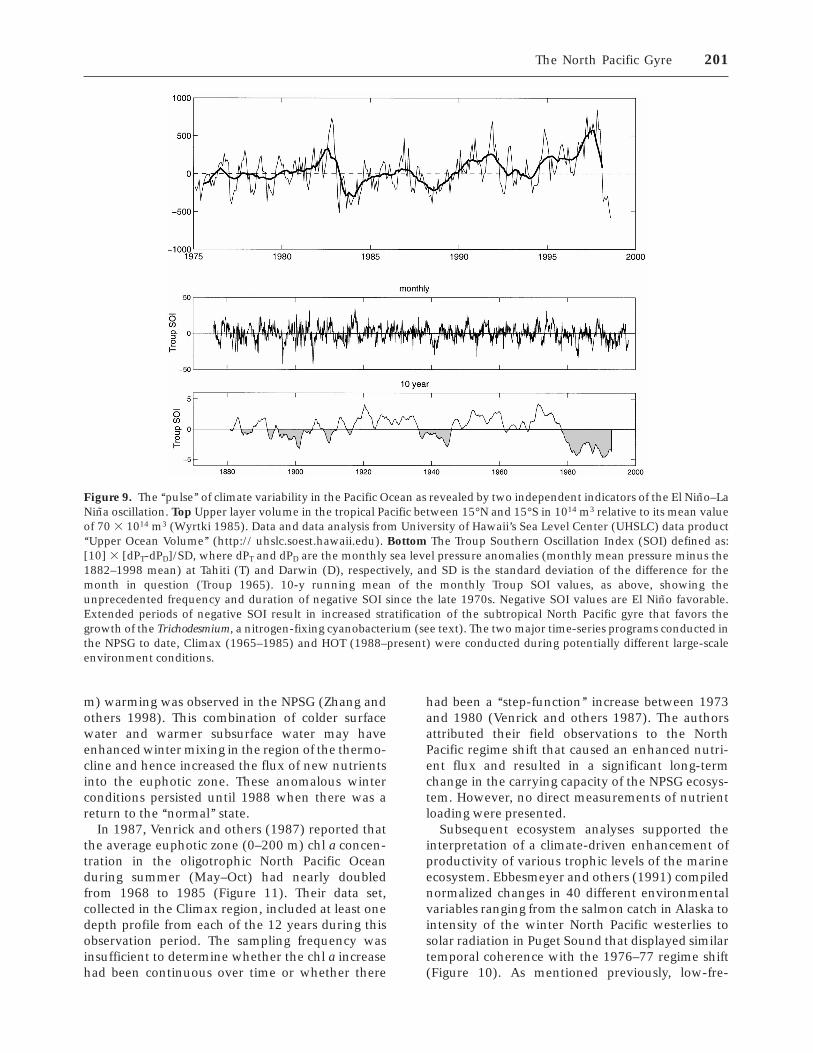
m) warming was observed in the NPSG (Zhang andothers 1998). This combination of colder surfacewater and warmer subsurface water may haveenhanced winter mixing in the region of the thermo-cline and hence increased the flux of new nutrientsinto the euphotic zone. These anomalous winterconditions persisted until 1988 when there was areturn to the ‘‘normal’’ state.
In 1987, Venrick and others (1987) reported thatthe average euphotic zone (0–200 m) chl a concen-tration in the oligotrophic North Pacific Oceanduring summer (May–Oct) had nearly doubledfrom 1968 to 1985 (Figure 11). Their data set,collected in the Climax region, included at least onedepth profile from each of the 12 years during thisobservation period. The sampling frequency wasinsufficient to determine whether the chl a increasehad been continuous over time or whether there
had been a ‘‘step-function’’ increase between 1973and 1980 (Venrick and others 1987). The authorsattributed their field observations to the NorthPacific regime shift that caused an enhanced nutri-ent flux and resulted in a significant long-termchange in the carrying capacity of the NPSG ecosys-tem. However, no direct measurements of nutrientloading were presented.
Subsequent ecosystem analyses supported theinterpretation of a climate-driven enhancement ofproductivity of various trophic levels of the marineecosystem. Ebbesmeyer and others (1991) compilednormalized changes in 40 different environmentalvariables ranging from the salmon catch in Alaska tointensity of the winter North Pacific westerlies tosolar radiation in Puget Sound that displayed similartemporal coherence with the 1976–77 regime shift(Figure 10). As mentioned previously, low-fre-
Figure 9. The ‘‘pulse’’ of climate variability in the Pacific Ocean as revealed by two independent indicators of the El Nino–LaNina oscillation. Top Upper layer volume in the tropical Pacific between 15°N and 15°S in 1014 m3 relative to its mean valueof 70 3 1014 m3 (Wyrtki 1985). Data and data analysis from University of Hawaii’s Sea Level Center (UHSLC) data product‘‘Upper Ocean Volume’’ (http:// uhslc.soest.hawaii.edu). Bottom The Troup Southern Oscillation Index (SOI) defined as:[10] 3 [dPT-dPD]/SD, where dPT and dPD are the monthly sea level pressure anomalies (monthly mean pressure minus the1882–1998 mean) at Tahiti (T) and Darwin (D), respectively, and SD is the standard deviation of the difference for themonth in question (Troup 1965). 10-y running mean of the monthly Troup SOI values, as above, showing theunprecedented frequency and duration of negative SOI since the late 1970s. Negative SOI values are El Nino favorable.Extended periods of negative SOI result in increased stratification of the subtropical North Pacific gyre that favors thegrowth of the Trichodesmium, a nitrogen-fixing cyanobacterium (see text). The two major time-series programs conducted inthe NPSG to date, Climax (1965–1985) and HOT (1988–present) were conducted during potentially different large-scaleenvironment conditions.
The North Pacific Gyre 201
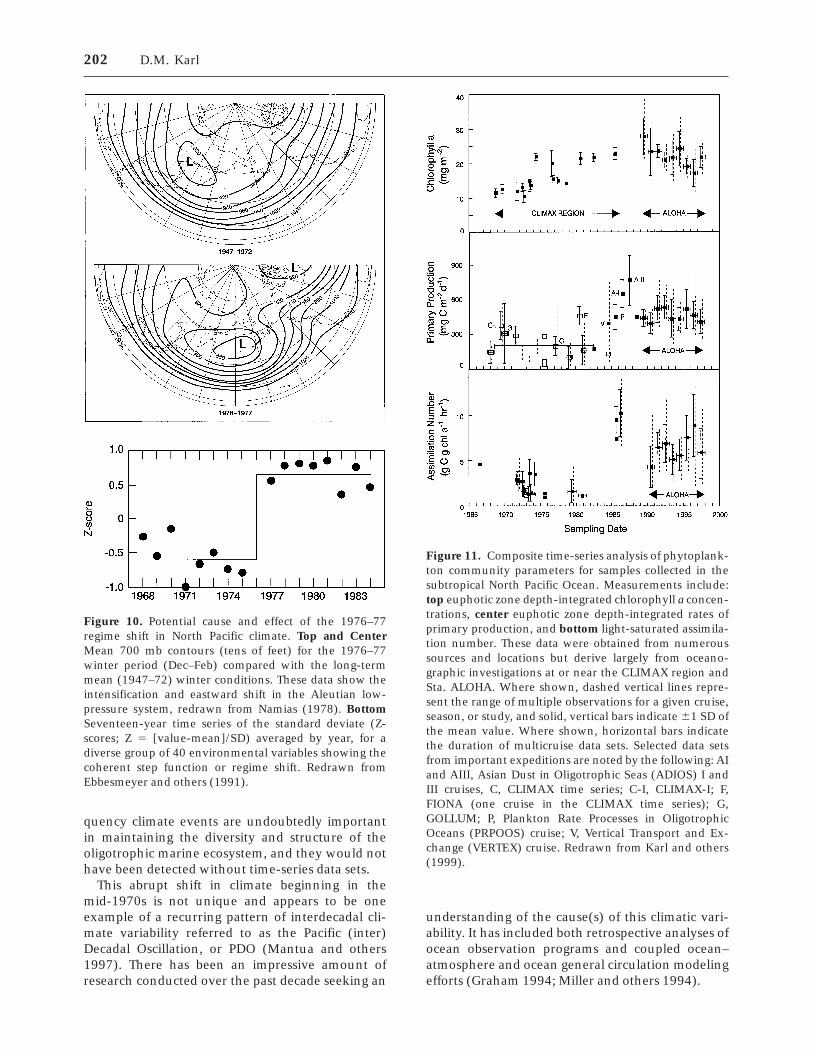
quency climate events are undoubtedly importantin maintaining the diversity and structure of theoligotrophic marine ecosystem, and they would nothave been detected without time-series data sets.
This abrupt shift in climate beginning in themid-1970s is not unique and appears to be oneexample of a recurring pattern of interdecadal cli-mate variability referred to as the Pacific (inter)Decadal Oscillation, or PDO (Mantua and others1997). There has been an impressive amount ofresearch conducted over the past decade seeking an
understanding of the cause(s) of this climatic vari-ability. It has included both retrospective analyses ofocean observation programs and coupled ocean–atmosphere and ocean general circulation modelingefforts (Graham 1994; Miller and others 1994).
Figure 10. Potential cause and effect of the 1976–77regime shift in North Pacific climate. Top and CenterMean 700 mb contours (tens of feet) for the 1976–77winter period (Dec–Feb) compared with the long-termmean (1947–72) winter conditions. These data show theintensification and eastward shift in the Aleutian low-pressure system, redrawn from Namias (1978). BottomSeventeen-year time series of the standard deviate (Z-scores; Z 5 [value-mean]/SD) averaged by year, for adiverse group of 40 environmental variables showing thecoherent step function or regime shift. Redrawn fromEbbesmeyer and others (1991).
Figure 11. Composite time-series analysis of phytoplank-ton community parameters for samples collected in thesubtropical North Pacific Ocean. Measurements include:top euphotic zone depth-integrated chlorophyll a concen-trations, center euphotic zone depth-integrated rates ofprimary production, and bottom light-saturated assimila-tion number. These data were obtained from numeroussources and locations but derive largely from oceano-graphic investigations at or near the CLIMAX region andSta. ALOHA. Where shown, dashed vertical lines repre-sent the range of multiple observations for a given cruise,season, or study, and solid, vertical bars indicate 61 SD ofthe mean value. Where shown, horizontal bars indicatethe duration of multicruise data sets. Selected data setsfrom important expeditions are noted by the following: AIand AIII, Asian Dust in Oligotrophic Seas (ADIOS) I andIII cruises, C, CLIMAX time series; C-I, CLIMAX-I; F,FIONA (one cruise in the CLIMAX time series); G,GOLLUM; P, Plankton Rate Processes in OligotrophicOceans (PRPOOS) cruise; V, Vertical Transport and Ex-change (VERTEX) cruise. Redrawn from Karl and others(1999).
202 D.M. Karl
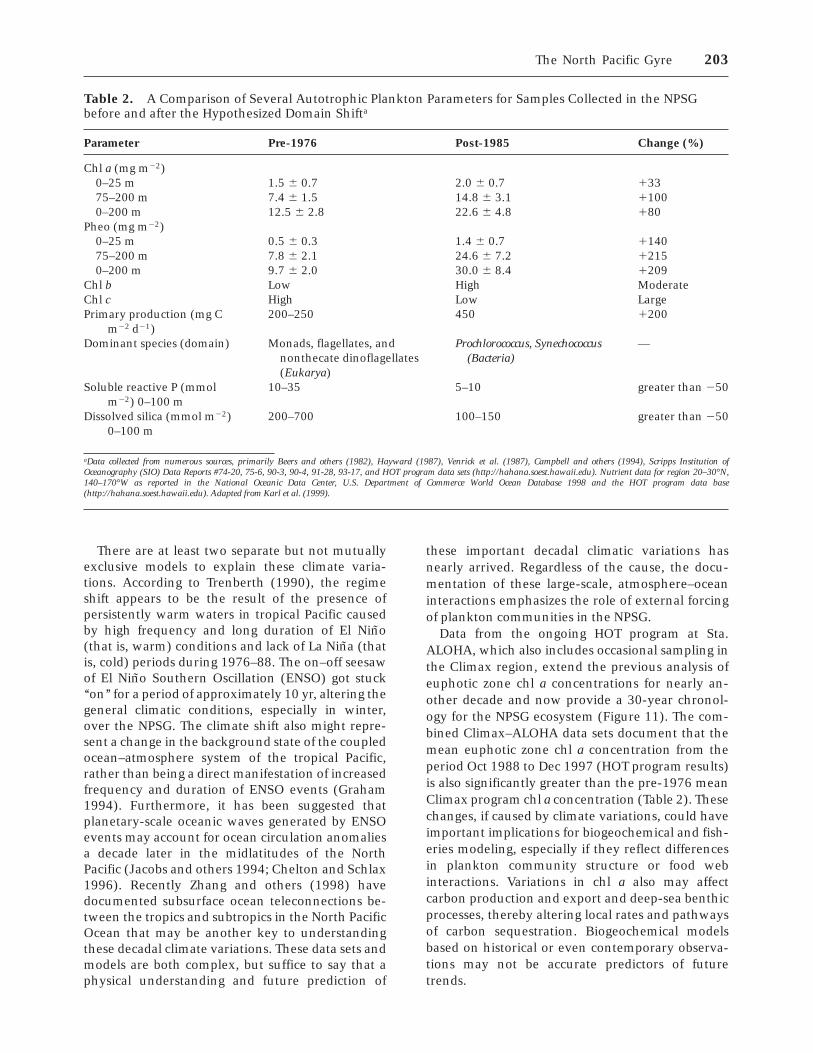
There are at least two separate but not mutuallyexclusive models to explain these climate varia-tions. According to Trenberth (1990), the regimeshift appears to be the result of the presence ofpersistently warm waters in tropical Pacific causedby high frequency and long duration of El Nino(that is, warm) conditions and lack of La Nina (thatis, cold) periods during 1976–88. The on–off seesawof El Nino Southern Oscillation (ENSO) got stuck‘‘on’’ for a period of approximately 10 yr, altering thegeneral climatic conditions, especially in winter,over the NPSG. The climate shift also might repre-sent a change in the background state of the coupledocean–atmosphere system of the tropical Pacific,rather than being a direct manifestation of increasedfrequency and duration of ENSO events (Graham1994). Furthermore, it has been suggested thatplanetary-scale oceanic waves generated by ENSOevents may account for ocean circulation anomaliesa decade later in the midlatitudes of the NorthPacific (Jacobs and others 1994; Chelton and Schlax1996). Recently Zhang and others (1998) havedocumented subsurface ocean teleconnections be-tween the tropics and subtropics in the North PacificOcean that may be another key to understandingthese decadal climate variations. These data sets andmodels are both complex, but suffice to say that aphysical understanding and future prediction of
these important decadal climatic variations hasnearly arrived. Regardless of the cause, the docu-mentation of these large-scale, atmosphere–oceaninteractions emphasizes the role of external forcingof plankton communities in the NPSG.
Data from the ongoing HOT program at Sta.ALOHA, which also includes occasional sampling inthe Climax region, extend the previous analysis ofeuphotic zone chl a concentrations for nearly an-other decade and now provide a 30-year chronol-ogy for the NPSG ecosystem (Figure 11). The com-bined Climax–ALOHA data sets document that themean euphotic zone chl a concentration from theperiod Oct 1988 to Dec 1997 (HOT program results)is also significantly greater than the pre-1976 meanClimax program chl a concentration (Table 2). Thesechanges, if caused by climate variations, could haveimportant implications for biogeochemical and fish-eries modeling, especially if they reflect differencesin plankton community structure or food webinteractions. Variations in chl a also may affectcarbon production and export and deep-sea benthicprocesses, thereby altering local rates and pathwaysof carbon sequestration. Biogeochemical modelsbased on historical or even contemporary observa-tions may not be accurate predictors of futuretrends.
Table 2. A Comparison of Several Autotrophic Plankton Parameters for Samples Collected in the NPSGbefore and after the Hypothesized Domain Shifta
Parameter Pre-1976 Post-1985 Change (%)
Chl a (mg m22)0–25 m 1.5 6 0.7 2.0 6 0.7 13375–200 m 7.4 6 1.5 14.8 6 3.1 11000–200 m 12.5 6 2.8 22.6 6 4.8 180
Pheo (mg m22)0–25 m 0.5 6 0.3 1.4 6 0.7 114075–200 m 7.8 6 2.1 24.6 6 7.2 12150–200 m 9.7 6 2.0 30.0 6 8.4 1209
Chl b Low High ModerateChl c High Low LargePrimary production (mg C
m22 d21)200–250 450 1200
Dominant species (domain) Monads, flagellates, andnonthecate dinoflagellates(Eukarya)
Prochlorococcus, Synechococcus(Bacteria)
—
Soluble reactive P (mmolm22) 0–100 m
10–35 5–10 greater than 250
Dissolved silica (mmol m22)0–100 m
200–700 100–150 greater than 250
aData collected from numerous sources, primarily Beers and others (1982), Hayward (1987), Venrick et al. (1987), Campbell and others (1994), Scripps Institution ofOceanography (SIO) Data Reports #74-20, 75-6, 90-3, 90-4, 91-28, 93-17, and HOT program data sets (http://hahana.soest.hawaii.edu). Nutrient data for region 20–30°N,140–170°W as reported in the National Oceanic Data Center, U.S. Department of Commerce World Ocean Database 1998 and the HOT program data base(http://hahana.soest.hawaii.edu). Adapted from Karl et al. (1999).
The North Pacific Gyre 203
In addition to chl a variability, there is also a 30-ychronology of primary production and mixed-layer(0–25 m) assimilation numbers (that is, the light-saturated, chl a-normalized rate of autotrophic car-bon fixation). Compared with the 17-y Climaxprogram mean of approximately 200 mg C m22 d21,the average rate of primary production measuredduring the HOT program is more than twice as high(Figure 11). Likewise, the assimilation number insurface waters increased at least threefold since theearly 1980s. While it is impossible to estimate theconsequences of methodological improvements overthis 30-y observation period, I believe that theseplanktonic rate processes, along with the pigmentdata discussed previously, result from fundamentalchanges in phytoplankton community structurethat ultimately derive from climate-related habitatvariations.
Wind stress, heat, and water exchange, in addi-tion to variations in gyre circulation are all biogeo-chemically relevant physical determinants. The char-acteristics of the rate of supply of major nutrientsand trace elements, as well as light quality andquantity, ultimately establish ecosystem structure,including carrying capacity and productivity. Slightor even subtle alterations of the habitat can result inlarge changes in, for example, vertical eddy-diffusivity rates and hence nutrient recharge andproductivity (Falkowski and others 1991; McGilli-cuddy and Robinson 1997). Both Venrick and oth-ers (1987) and Polovina and others (1994) sug-gested that changes in the subtropical North Pacificafter the 1976 climate step were a result of increasedmixed-layer depths and a higher frequency of deepmixing events due especially to an intensification ofthe Aleutian low-pressure system in late winter.This vigorous mixing might be expected to enhancenutrient input to the euphotic zone and stimulateecosystem productivity. However, it is important toemphasize that the Aleutian low-pressure systemreturned to its normal, pre-1976, condition in 1988just at the start of the HOT program. The chl a, onthe other hand, has remained at the elevated ‘‘re-gime-shift’’ concentrations (Figure 11 and Table 2).Given the rapid growth rates of microorganisms inthe NPSG (1–2 d-1) and relatively rapid turnover ofparticulate organic matter pools (10–20 d) it isunlikely that the oceanic biogeochemical responseto climate forcing or relaxation would have a decadallag.
The PDO phenomenon covaries with the South-ern Oscillation Index (SOI) and the Cold TongueIndex (CTI), two independent climate features thatcorrelate with El Nino–La Nina cycles (Mantua andothers 1997). Because increased nutrient flux is
predicted to occur during the positive PDO phase ofthe North Pacific climate cycle, the marine ecologi-cal response might be expected to be a classic‘‘bottom-up’’ response, increased inorganic resourcesupply, leading to increased photoautotrophic bio-mass, followed by increases in the production ofhigher trophic levels. In their comprehensive re-view of this topic, Mantua and colleagues (1997)suggest that recurrent ocean–atmosphere variationscentered over the midlatitude North Pacific basinmay act to constrain interannual ENSO variability,rather than vice versa. Both mechanisms wouldlead to correlations between the indices but withpotentially fundamentally different predictions forbiogeochemical processes.
Based on an analysis of available instrumentaldata combined with air temperature reconstructedfrom North American tree rings, Minobe (1997) hasrecently documented a 50–70 y North Pacific cli-mate oscillation that has existed for at least 300 yr. Itis conceivable that this oscillation and the inter-decadal PDO, with an approximately 20–30 y fre-quency, are superimposed onto higher frequencyinterannual and seasonal habitat variations result-ing in a complex, time-varying mosaic. Some biologi-cal changes (for example, enhanced nutrient up-take) are rapid, while others require growth andreproduction or even natural selection over manygenerations. Depending on the phase of these inde-pendently timed cycles, these interactions couldcreate a spectrum of dynamical behavior that mightborder on chaos; hence, an understanding of causeand effect may be difficult to achieve. As Sir GilbertWalker stated more than half a century ago, ‘‘I thinkthe relationships of world weather are so complexthat our only chance of explaining them is toaccumulate the facts empirically’’ (cited in Horel andWallace 1981). I believe this is also an accurateassessment of complex ecological and biogeochemi-cal processes in the NPSG.
NEW VIEWS OF AN OLD OCEAN: THE
EMERGING HOT PROGRAM LEGACY
Long-term ecological studies are predicated on thestraightforward assertion that certain processes, suchas succession, climate change, and other habitatdisturbances, are long-term processes and must bestudied as such (Strayer and others 1986). Indeedthere are many examples in the scientific literaturewhere interpretations from short-term ecologicalstudies are at odds with similar data sets collectedover much longer time scales. Because it is difficultto observe slow or abrupt environmental changesdirectly, much less to understand the fundamental
204 D.M. Karl
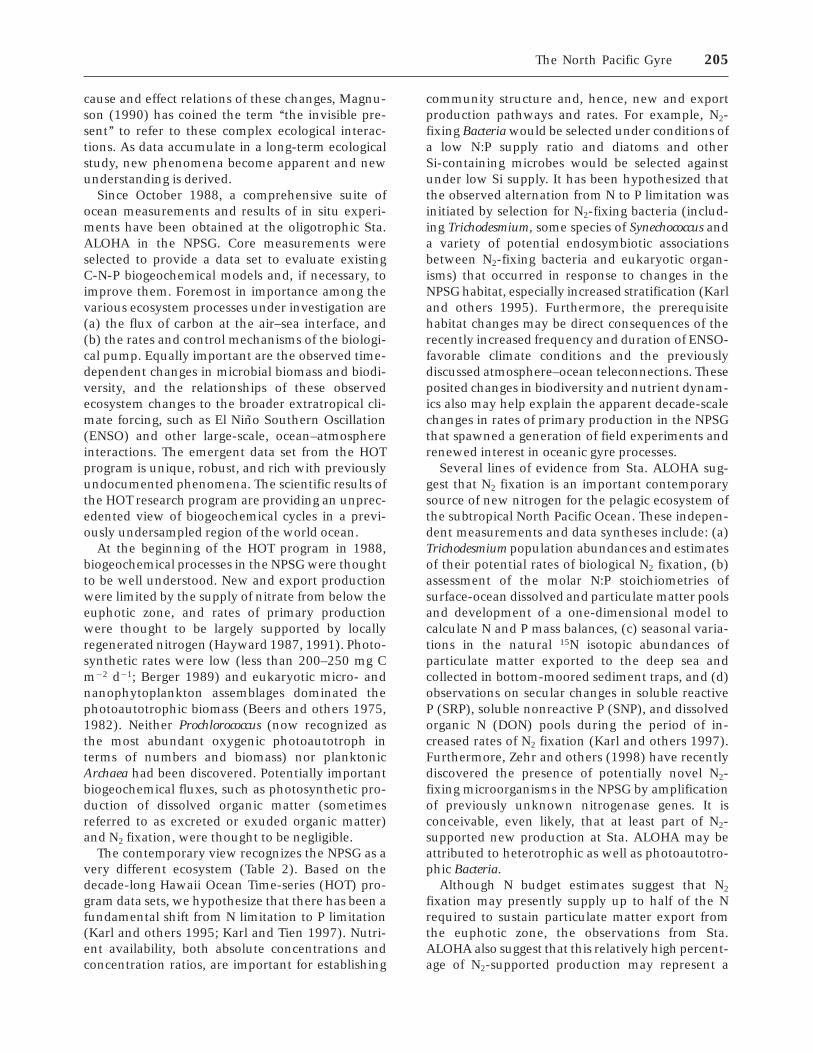
cause and effect relations of these changes, Magnu-son (1990) has coined the term ‘‘the invisible pre-sent’’ to refer to these complex ecological interac-tions. As data accumulate in a long-term ecologicalstudy, new phenomena become apparent and newunderstanding is derived.
Since October 1988, a comprehensive suite ofocean measurements and results of in situ experi-ments have been obtained at the oligotrophic Sta.ALOHA in the NPSG. Core measurements wereselected to provide a data set to evaluate existingC-N-P biogeochemical models and, if necessary, toimprove them. Foremost in importance among thevarious ecosystem processes under investigation are(a) the flux of carbon at the air–sea interface, and(b) the rates and control mechanisms of the biologi-cal pump. Equally important are the observed time-dependent changes in microbial biomass and biodi-versity, and the relationships of these observedecosystem changes to the broader extratropical cli-mate forcing, such as El Nino Southern Oscillation(ENSO) and other large-scale, ocean–atmosphereinteractions. The emergent data set from the HOTprogram is unique, robust, and rich with previouslyundocumented phenomena. The scientific results ofthe HOT research program are providing an unprec-edented view of biogeochemical cycles in a previ-ously undersampled region of the world ocean.
At the beginning of the HOT program in 1988,biogeochemical processes in the NPSG were thoughtto be well understood. New and export productionwere limited by the supply of nitrate from below theeuphotic zone, and rates of primary productionwere thought to be largely supported by locallyregenerated nitrogen (Hayward 1987, 1991). Photo-synthetic rates were low (less than 200–250 mg Cm22 d21; Berger 1989) and eukaryotic micro- andnanophytoplankton assemblages dominated thephotoautotrophic biomass (Beers and others 1975,1982). Neither Prochlorococcus (now recognized asthe most abundant oxygenic photoautotroph interms of numbers and biomass) nor planktonicArchaea had been discovered. Potentially importantbiogeochemical fluxes, such as photosynthetic pro-duction of dissolved organic matter (sometimesreferred to as excreted or exuded organic matter)and N2 fixation, were thought to be negligible.
The contemporary view recognizes the NPSG as avery different ecosystem (Table 2). Based on thedecade-long Hawaii Ocean Time-series (HOT) pro-gram data sets, we hypothesize that there has been afundamental shift from N limitation to P limitation(Karl and others 1995; Karl and Tien 1997). Nutri-ent availability, both absolute concentrations andconcentration ratios, are important for establishing
community structure and, hence, new and exportproduction pathways and rates. For example, N2-fixing Bacteria would be selected under conditions ofa low N:P supply ratio and diatoms and otherSi-containing microbes would be selected againstunder low Si supply. It has been hypothesized thatthe observed alternation from N to P limitation wasinitiated by selection for N2-fixing bacteria (includ-ing Trichodesmium, some species of Synechococcus anda variety of potential endosymbiotic associationsbetween N2-fixing bacteria and eukaryotic organ-isms) that occurred in response to changes in theNPSG habitat, especially increased stratification (Karland others 1995). Furthermore, the prerequisitehabitat changes may be direct consequences of therecently increased frequency and duration of ENSO-favorable climate conditions and the previouslydiscussed atmosphere–ocean teleconnections. Theseposited changes in biodiversity and nutrient dynam-ics also may help explain the apparent decade-scalechanges in rates of primary production in the NPSGthat spawned a generation of field experiments andrenewed interest in oceanic gyre processes.
Several lines of evidence from Sta. ALOHA sug-gest that N2 fixation is an important contemporarysource of new nitrogen for the pelagic ecosystem ofthe subtropical North Pacific Ocean. These indepen-dent measurements and data syntheses include: (a)Trichodesmium population abundances and estimatesof their potential rates of biological N2 fixation, (b)assessment of the molar N:P stoichiometries ofsurface-ocean dissolved and particulate matter poolsand development of a one-dimensional model tocalculate N and P mass balances, (c) seasonal varia-tions in the natural 15N isotopic abundances ofparticulate matter exported to the deep sea andcollected in bottom-moored sediment traps, and (d)observations on secular changes in soluble reactiveP (SRP), soluble nonreactive P (SNP), and dissolvedorganic N (DON) pools during the period of in-creased rates of N2 fixation (Karl and others 1997).Furthermore, Zehr and others (1998) have recentlydiscovered the presence of potentially novel N2-fixing microorganisms in the NPSG by amplificationof previously unknown nitrogenase genes. It isconceivable, even likely, that at least part of N2-supported new production at Sta. ALOHA may beattributed to heterotrophic as well as photoautotro-phic Bacteria.
Although N budget estimates suggest that N2
fixation may presently supply up to half of the Nrequired to sustain particulate matter export fromthe euphotic zone, the observations from Sta.ALOHA also suggest that this relatively high percent-age of N2-supported production may represent a
The North Pacific Gyre 205
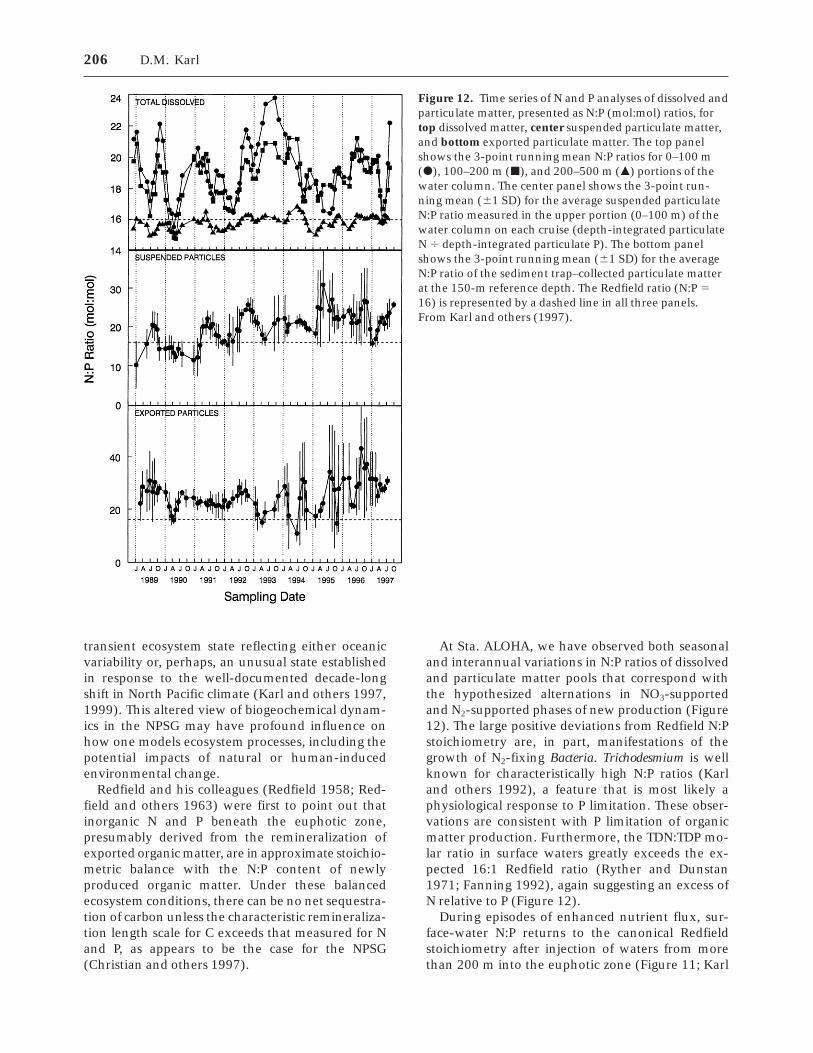
transient ecosystem state reflecting either oceanicvariability or, perhaps, an unusual state establishedin response to the well-documented decade-longshift in North Pacific climate (Karl and others 1997,1999). This altered view of biogeochemical dynam-ics in the NPSG may have profound influence onhow one models ecosystem processes, including thepotential impacts of natural or human-inducedenvironmental change.
Redfield and his colleagues (Redfield 1958; Red-field and others 1963) were first to point out thatinorganic N and P beneath the euphotic zone,presumably derived from the remineralization ofexported organic matter, are in approximate stoichio-metric balance with the N:P content of newlyproduced organic matter. Under these balancedecosystem conditions, there can be no net sequestra-tion of carbon unless the characteristic remineraliza-tion length scale for C exceeds that measured for Nand P, as appears to be the case for the NPSG(Christian and others 1997).
At Sta. ALOHA, we have observed both seasonaland interannual variations in N:P ratios of dissolvedand particulate matter pools that correspond withthe hypothesized alternations in NO3-supportedand N2-supported phases of new production (Figure12). The large positive deviations from Redfield N:Pstoichiometry are, in part, manifestations of thegrowth of N2-fixing Bacteria. Trichodesmium is wellknown for characteristically high N:P ratios (Karland others 1992), a feature that is most likely aphysiological response to P limitation. These obser-vations are consistent with P limitation of organicmatter production. Furthermore, the TDN:TDP mo-lar ratio in surface waters greatly exceeds the ex-pected 16:1 Redfield ratio (Ryther and Dunstan1971; Fanning 1992), again suggesting an excess ofN relative to P (Figure 12).
During episodes of enhanced nutrient flux, sur-face-water N:P returns to the canonical Redfieldstoichiometry after injection of waters from morethan 200 m into the euphotic zone (Figure 11; Karl
Figure 12. Time series of N and P analyses of dissolved andparticulate matter, presented as N:P (mol:mol) ratios, fortop dissolved matter, center suspended particulate matter,and bottom exported particulate matter. The top panelshows the 3-point running mean N:P ratios for 0–100 m(d), 100–200 m (j), and 200–500 m (m) portions of thewater column. The center panel shows the 3-point run-ning mean (61 SD) for the average suspended particulateN:P ratio measured in the upper portion (0–100 m) of thewater column on each cruise (depth-integrated particulateN 4 depth-integrated particulate P). The bottom panelshows the 3-point running mean (61 SD) for the averageN:P ratio of the sediment trap–collected particulate matterat the 150-m reference depth. The Redfield ratio (N:P 516) is represented by a dashed line in all three panels.From Karl and others (1997).
206 D.M. Karl

and others 1997). This shift could have importantconsequences for nutrient control of ecosystemprocesses and implications for modeling carbonsequestration in the subtropical North Pacific gyre.If the C:P ratio of exported matter exceeds the C:Pratio of imported nutrients, as it does in the NPSGduring episodes of P limitation, then there will benet sequestration of carbon to the interior of theocean. Furthermore, these pulsed inputs and ex-ports also may play a key role in the maintenance ofcommunity diversity (Hutchinson 1941, 1961; Mar-galef 1978; Harris 1986).
An increased turnover rate of P, relative to N, isprobably insufficient to satisfy P demands duringthe periods of enhanced N2 fixation. There must besome specific mechanism responsible for spatiallyuncoupling P from N in the water column and forconcentrating P near the sea surface. Processes suchas upwelling, eddy diffusion, and deep verticalmixing do not selectively transport P into the sur-face ocean and therefore would not be expected tostimulate N2 fixation. Furthermore, N2-fixing Trich-odesmium blooms are generally observed duringperiods of extreme calm (Carpenter and Price 1976;Karl and others 1992, 1995) when turbulent mixingprocesses would be at a minimum. Atmosphericdeposition would likewise appear to be ineffectivefor stimulating N2 fixation because the N:P ratio ofboth wet and dry deposition appears to be enrichedin N (by one to two orders of magnitude) relative tocellular requirements (Duce 1986). The challenge,then, is to devise a model for formation of N2-fixingplankton blooms that is consistent with both physi-ological and field data and that might serve as thebasis for one or more testable hypotheses. Specifi-cally, selection for N2-supported new productionduring anomalously calm periods needs to be ex-plained.
Today the NPSG ecosystem supports a high rate ofgross primary production (750–1000 mg C m22 d21)much of which is rapidly cycled through microbialfood webs (up to 50% of the daily gross primaryproduction appears as DOM), in part due to theobserved shift from a N-limited to a P-limitedecosystem (Karl and others 1998). This coupledintensification of both N (via N2 fixation) and Pcycles in the NPSG has caused major shifts inplankton community structure and in rates andmechanisms of organic matter production andremineralization (Figure 13; Karl and others 1999).For example, there appears to have been a selectionfor Bacteria and a dramatic shift from a eukaryote-dominated to a prokaryote-dominated photoautotro-phic species assemblage with numerous attendantbiogeochemical and ecological consequences.
EPILOGUE
It is always fashionable to criticize existing views,especially if the standing outlook can be termeddogma (Eppley 1981). Until recently the NPSG wasconsidered to be part of a vast global marine desertthat had very little influence on the oceanic cycles ofC and associated bioelements. This view has beenchallenged by recent field estimates of planktonicrate processes and, in particular, from the compre-hensive HOT program data sets.
Science is a world of ideas and progress in scienceis limited ultimately by the emergence of newhypotheses and by the ability to test them (Pomeroy1981). Therefore, it is difficult and, perhaps, danger-ous to predict future trends in science. However,one thing that seems almost certain is that repeatedhydrographic sections and biogeochemical time-series measurements at selected open ocean siteswill continue to be used in the study of the NPSG.No existing biogeochemical model captures thecomplexity and heterogeneity of the NPSG. Marinebiogeochemical modeling is inherently data drivenand significant progress will only be achieved withclose collaboration between observationalists andmodelers (Doney 1998). Long-term biological datasets are of demonstrable value in research and maybe the only hope for documenting and, eventually,predicting ecosystem change.
During the past two decades development ofnovel observational platforms, including ocean buoysand earth-orbiting satellites, has provided new op-portunities for continuous and synoptic observa-tions of the world ocean. Measurements frommoored and free-drifting buoys have yielded aninvaluable data base for investigations of air–seainteractions, ocean circulation, and biological pro-ductivity. Autonomous deep-sea moorings are ‘‘win-dows’’ into the water column that provide opportu-nities to view both high- and medium-frequency(minutes to years) habitat variability. Althoughfocus to date has been on surface meteorology andphysical oceanographic processes, such as heat andmass flux, ocean currents, wave phenomena, andwater-mass variability, the recent and continuingdevelopment of novel optical and chemical sensorsaffords opportunity to expand mooring missions toinclude relevant problems in ocean biogeochemis-try (Dickey 1991; Hayes and others 1991; Chavezand others 1994; Dickey and others 1997). Inparticular, ocean color satellites, such as Sea-viewing Wide Field-of-view Sensor (SeaWIFS), willbe invaluable for the detection of local and mesos-cale, short-lived ‘‘bloom’’ phenomena that couldnever be adequately sampled by surface ships,
The North Pacific Gyre 207
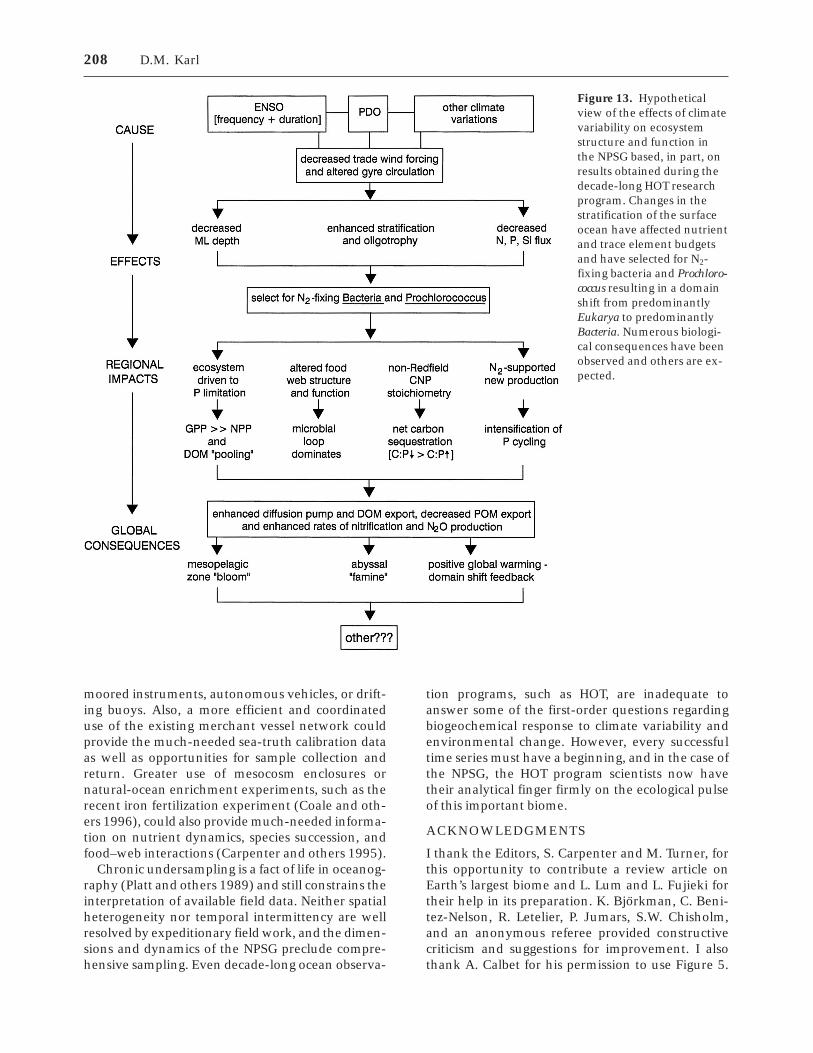
moored instruments, autonomous vehicles, or drift-ing buoys. Also, a more efficient and coordinateduse of the existing merchant vessel network couldprovide the much-needed sea-truth calibration dataas well as opportunities for sample collection andreturn. Greater use of mesocosm enclosures ornatural-ocean enrichment experiments, such as therecent iron fertilization experiment (Coale and oth-ers 1996), could also provide much-needed informa-tion on nutrient dynamics, species succession, andfood–web interactions (Carpenter and others 1995).
Chronic undersampling is a fact of life in oceanog-raphy (Platt and others 1989) and still constrains theinterpretation of available field data. Neither spatialheterogeneity nor temporal intermittency are wellresolved by expeditionary field work, and the dimen-sions and dynamics of the NPSG preclude compre-hensive sampling. Even decade-long ocean observa-
tion programs, such as HOT, are inadequate toanswer some of the first-order questions regardingbiogeochemical response to climate variability andenvironmental change. However, every successfultime series must have a beginning, and in the case ofthe NPSG, the HOT program scientists now havetheir analytical finger firmly on the ecological pulseof this important biome.
ACKNOWLEDGMENTS
I thank the Editors, S. Carpenter and M. Turner, forthis opportunity to contribute a review article onEarth’s largest biome and L. Lum and L. Fujieki fortheir help in its preparation. K. Bjorkman, C. Beni-tez-Nelson, R. Letelier, P. Jumars, S.W. Chisholm,and an anonymous referee provided constructivecriticism and suggestions for improvement. I alsothank A. Calbet for his permission to use Figure 5.
Figure 13. Hypotheticalview of the effects of climatevariability on ecosystemstructure and function inthe NPSG based, in part, onresults obtained during thedecade-long HOT researchprogram. Changes in thestratification of the surfaceocean have affected nutrientand trace element budgetsand have selected for N2-fixing bacteria and Prochloro-coccus resulting in a domainshift from predominantlyEukarya to predominantlyBacteria. Numerous biologi-cal consequences have beenobserved and others are ex-pected.
208 D.M. Karl
Numerous individuals published the original ideasthat are summarized herein, and I especially ac-knowledge L. Pomeroy, F. Azam, E. Venrick, T.Hayward, J. McGowan, M. Huntley, S. Chisholm, R.Eppley, R. Dugdale, T. Platt, J. Reid, E. Laws, R.Lukas, and the HOT program scientists and ancillaryinvestigators for their original, pathfinding contribu-tions on the NPSG. The HOT program is currentlysupported by National Science Foundation grants(OCE96–17409; D.M.K., P.I. and OCE98–11921;Roger Lukas, P.I.) and by the State of Hawaii. SOESTContribution #4808 and U.S. JGOFS Contribution#511.
REFERENCES
Allen CB, Kanda J, Laws EA. 1996. New production andphotosynthetic rates within and outside a cyclonic mesoscaleeddy in the North Pacific subtropical gyre. Deep-Sea Res43:917–36.
Andersen RA, Bidigare RR, Keller MD, Latasa M. 1996. Acomparison of HPLC pigment signatures and electron micro-scopic observations for oligotrophic waters of the North Atlan-tic and Pacific Oceans. Deep-Sea Res II 43:517–37.
Azam F. 1998. Microbial control of oceanic carbon flux: the plotthickens. Science 280:694–6.
Azam F, Fenchel T, Field JG, Gray JS, Meyer-Reil LA, Thingstad F.1983. The ecological role of water-column microbes in the sea.Mar Ecol Prog Ser 10:257–63.
Baines SB, Pace ML, Karl DM. 1994. Why does the relationshipbetween sinking flux and planktonic primary production differbetween lakes and oceans? Limnol Oceanogr 39:213–26.
Barber RT. 1992. Geologic and climatic time scales of nutrientvariability. In: Falkowski PG, Woodhead AD, editors. Primaryproductivity and biogeochemical cycles in the sea. New York:Plenum Press. p 89–106.
Beers JR, Reid FMH, Stewart GL. 1975. Microplankton of theNorth Pacific Central Gyre. Population structure and abun-dance, June 1973. Int Rev Ges Hydrobiol 60:607–38.
Beers JR, Reid FMH, Stewart GL. 1982. Seasonal abundance ofthe microplankton population in the North Pacific central gyre.Deep-Sea Res 29:227–45.
Berger WH. 1989. Global maps of ocean productivity. In: BergerWH, Smetacek VS, Wefer G, editors. Productivity of the ocean:present and past. New York: John Wiley and Sons. p 429–55.
Bernstein RL, White WB. 1974. Time and length scales ofbaroclinic eddies in the central North Pacific Ocean. J PhysOceanogr 4:613–24.
Billett DSM, Lampitt RS, Rice AL, Mantoura RFC. 1983. Seasonalsedimentation of phytoplankton to the deep-sea benthos.Nature 302:520–2.
Bjerknes J. 1969. Atmospheric teleconnections from the equato-rial Pacific. Monthly Weather Rev 97:163–72.
Blackburn M. 1981. Low latitude gyral regions. In: LonghurstAR, editor. Analysis of marine ecosystems. New York: Aca-demic Press. p 3–29.
Bonin DJ, Maestrini SY. 1981. Importance of organic nutrientsfor phytoplankton growth in natural environments: implica-tions for algal species succession. In: Platt T, editor. Physiologi-cal bases of phytoplankton cology. Ottawa: Department ofFisheries and Oceans. p 279–91.
Brewer PG, Bruland KW, Eppley RW, McCarthy JJ. 1986. Theglobal ocean flux study (GOFS): status of the U.S.GOFSprogram. EOS Trans Am Geophys Un 67:827–32.
Bult CJ, White O, Olsen GJ, and others 1996. Complete genomesequence of the methanogenic archaeon, Methanococcus jan-naschii. Science 273:1058–73.
Campbell L, Vaulot D. 1993. Photosynthetic picoplankton com-munity structure in the subtropical North Pacific Ocean nearHawaii (station ALOHA). Deep-Sea Res 40: 2043–2060.
Campbell L, Nolla HA, Vaulot D. 1994. The importance ofProchlorococcus to community structure in the central NorthPacific Ocean. Limnol Oceanogr 39:954–61.
Carlson CA, Ducklow HW. 1996. Growth of bacterioplanktonand consumption of dissolved organic carbon in the SargassoSea. Aquat Microb Ecol 10:69–85.
Carpenter EJ, Price CC (IV). 1976. Marine Oscillatoria (Trichodes-mium): Explanation for aerobic nitrogen fixation withoutheterocysts. Science 191:1278–80.
Carpenter SR, Chisholm SW, Krebs CJ, Schindler DW, Wright RF.1995. Ecosystem experiments. Science 269:324–7.
Chavez FP, Herlien R, Thurmond G. 1994. OASIS – Acquisitionsystem for moorings/drifters. Sea Tech 35:51–9.
Chelton DB, Schlax MG. 1996. Global observations of oceanicRossby waves. Science 272:234–8.
Chisholm SW, Olson RJ, Zettler ER, and others 1988. A novelfree-living prochlorophyte abundant in the oceanic euphoticzone. Nature 334:340–3.
Chisholm SW, Frankel SL, Goericke R, Olson RJ, Palenik B,Waterbury JB, West-Johnsrud L, Zettler ER. 1992. Prochlorococ-cus marinus nov. gen. Nov. sp.: an oxyphototrophic marineprokaryote containing divinyl chlorophyll a and b. ArchMicrobiol 157:297–300.
Christian JR, Lewis MR, Karl DM. 1997. Vertical fluxes of carbon,nitrogen, and phosphorus in the North Pacific Subtropical Gyrenear Hawaii. J Geophys Res 102:15667–77.
Clements FE. 1916. Plant succession. An analysis of the develop-ment of vegetation. Carnegie Inst., Washington D.C. 242:1–512.
Clements FE. 1936. Nature and structure of the climax. J Ecol24:253–84.
Coale KH, Johnson KS, Fitzwater SE, Gordon RM, Tanner S,Chavez FP, Ferioli L, Sakamoto C, Rogers P, Millero F, SteinbergP, Nightingale P, Cooper D, Cochlan WP, Landry MR, Constanti-nou J, Rollwagen G, Trasvina A, Kudela R. 1996. A massivephytoplankton bloom induced by an ecosystem-scale ironfertilization experiment in the equatorial Pacific Ocean. Nature383:495–501.
Daley RJ, Hobbie JE. 1975. Direct counts of aquatic bacteria by amodified epi-fluorescent technique. Limnol Oceanogr 20:875–82.
del Giorgio PA, Cole JJ, Cimbleris A. 1997. Respiration rates inbacteria exceed phytoplankton production in unproductiveaquatic systems. Nature 385:148–51.
DeLong EF, Wu KY, Prezelin BB, Jovine RVM. 1994. Highabundance of Archaea in antarctic marine picoplankton. Na-ture 371:695–7.
Deser C, Alexander MA, Timlin MS. 1996. Upper-ocean thermalvariations in the North Pacific during 1970–1991. J Climate9:1840–55.
Dickey TD. 1991. The emergence of concurrent high-resolutionphysical and bio-optical measurements in the upper ocean andtheir applications. Rev Geophys 29:383–413.
The North Pacific Gyre 209
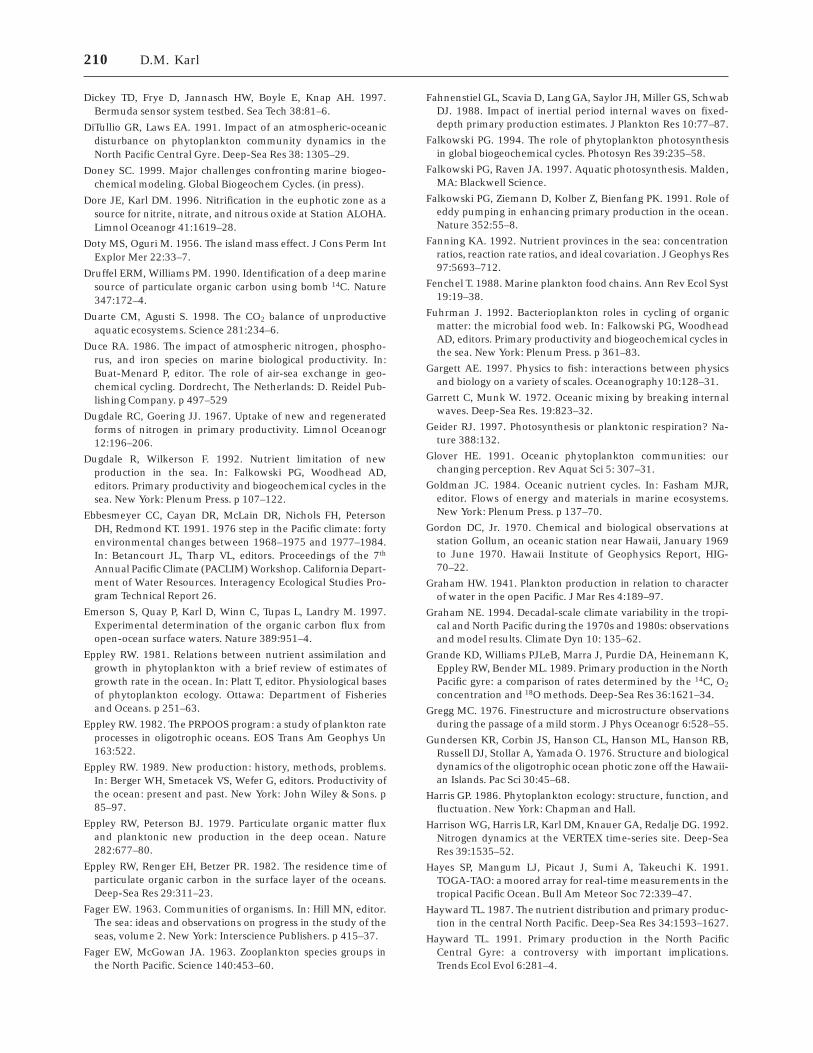
Dickey TD, Frye D, Jannasch HW, Boyle E, Knap AH. 1997.Bermuda sensor system testbed. Sea Tech 38:81–6.
DiTullio GR, Laws EA. 1991. Impact of an atmospheric-oceanicdisturbance on phytoplankton community dynamics in theNorth Pacific Central Gyre. Deep-Sea Res 38: 1305–29.
Doney SC. 1999. Major challenges confronting marine biogeo-chemical modeling. Global Biogeochem Cycles. (in press).
Dore JE, Karl DM. 1996. Nitrification in the euphotic zone as asource for nitrite, nitrate, and nitrous oxide at Station ALOHA.Limnol Oceanogr 41:1619–28.
Doty MS, Oguri M. 1956. The island mass effect. J Cons Perm IntExplor Mer 22:33–7.
Druffel ERM, Williams PM. 1990. Identification of a deep marinesource of particulate organic carbon using bomb 14C. Nature347:172–4.
Duarte CM, Agusti S. 1998. The CO2 balance of unproductiveaquatic ecosystems. Science 281:234–6.
Duce RA. 1986. The impact of atmospheric nitrogen, phospho-rus, and iron species on marine biological productivity. In:Buat-Menard P, editor. The role of air-sea exchange in geo-chemical cycling. Dordrecht, The Netherlands: D. Reidel Pub-lishing Company. p 497–529
Dugdale RC, Goering JJ. 1967. Uptake of new and regeneratedforms of nitrogen in primary productivity. Limnol Oceanogr12:196–206.
Dugdale R, Wilkerson F. 1992. Nutrient limitation of newproduction in the sea. In: Falkowski PG, Woodhead AD,editors. Primary productivity and biogeochemical cycles in thesea. New York: Plenum Press. p 107–122.
Ebbesmeyer CC, Cayan DR, McLain DR, Nichols FH, PetersonDH, Redmond KT. 1991. 1976 step in the Pacific climate: fortyenvironmental changes between 1968–1975 and 1977–1984.In: Betancourt JL, Tharp VL, editors. Proceedings of the 7th
Annual Pacific Climate (PACLIM) Workshop. California Depart-ment of Water Resources. Interagency Ecological Studies Pro-gram Technical Report 26.
Emerson S, Quay P, Karl D, Winn C, Tupas L, Landry M. 1997.Experimental determination of the organic carbon flux fromopen-ocean surface waters. Nature 389:951–4.
Eppley RW. 1981. Relations between nutrient assimilation andgrowth in phytoplankton with a brief review of estimates ofgrowth rate in the ocean. In: Platt T, editor. Physiological basesof phytoplankton ecology. Ottawa: Department of Fisheriesand Oceans. p 251–63.
Eppley RW. 1982. The PRPOOS program: a study of plankton rateprocesses in oligotrophic oceans. EOS Trans Am Geophys Un163:522.
Eppley RW. 1989. New production: history, methods, problems.In: Berger WH, Smetacek VS, Wefer G, editors. Productivity ofthe ocean: present and past. New York: John Wiley & Sons. p85–97.
Eppley RW, Peterson BJ. 1979. Particulate organic matter fluxand planktonic new production in the deep ocean. Nature282:677–80.
Eppley RW, Renger EH, Betzer PR. 1982. The residence time ofparticulate organic carbon in the surface layer of the oceans.Deep-Sea Res 29:311–23.
Fager EW. 1963. Communities of organisms. In: Hill MN, editor.The sea: ideas and observations on progress in the study of theseas, volume 2. New York: Interscience Publishers. p 415–37.
Fager EW, McGowan JA. 1963. Zooplankton species groups inthe North Pacific. Science 140:453–60.
Fahnenstiel GL, Scavia D, Lang GA, Saylor JH, Miller GS, SchwabDJ. 1988. Impact of inertial period internal waves on fixed-depth primary production estimates. J Plankton Res 10:77–87.
Falkowski PG. 1994. The role of phytoplankton photosynthesisin global biogeochemical cycles. Photosyn Res 39:235–58.
Falkowski PG, Raven JA. 1997. Aquatic photosynthesis. Malden,MA: Blackwell Science.
Falkowski PG, Ziemann D, Kolber Z, Bienfang PK. 1991. Role ofeddy pumping in enhancing primary production in the ocean.Nature 352:55–8.
Fanning KA. 1992. Nutrient provinces in the sea: concentrationratios, reaction rate ratios, and ideal covariation. J Geophys Res97:5693–712.
Fenchel T. 1988. Marine plankton food chains. Ann Rev Ecol Syst19:19–38.
Fuhrman J. 1992. Bacterioplankton roles in cycling of organicmatter: the microbial food web. In: Falkowski PG, WoodheadAD, editors. Primary productivity and biogeochemical cycles inthe sea. New York: Plenum Press. p 361–83.
Gargett AE. 1997. Physics to fish: interactions between physicsand biology on a variety of scales. Oceanography 10:128–31.
Garrett C, Munk W. 1972. Oceanic mixing by breaking internalwaves. Deep-Sea Res. 19:823–32.
Geider RJ. 1997. Photosynthesis or planktonic respiration? Na-ture 388:132.
Glover HE. 1991. Oceanic phytoplankton communities: ourchanging perception. Rev Aquat Sci 5: 307–31.
Goldman JC. 1984. Oceanic nutrient cycles. In: Fasham MJR,editor. Flows of energy and materials in marine ecosystems.New York: Plenum Press. p 137–70.
Gordon DC, Jr. 1970. Chemical and biological observations atstation Gollum, an oceanic station near Hawaii, January 1969to June 1970. Hawaii Institute of Geophysics Report, HIG-70–22.
Graham HW. 1941. Plankton production in relation to characterof water in the open Pacific. J Mar Res 4:189–97.
Graham NE. 1994. Decadal-scale climate variability in the tropi-cal and North Pacific during the 1970s and 1980s: observationsand model results. Climate Dyn 10: 135–62.
Grande KD, Williams PJLeB, Marra J, Purdie DA, Heinemann K,Eppley RW, Bender ML. 1989. Primary production in the NorthPacific gyre: a comparison of rates determined by the 14C, O2
concentration and 18O methods. Deep-Sea Res 36:1621–34.
Gregg MC. 1976. Finestructure and microstructure observationsduring the passage of a mild storm. J Phys Oceanogr 6:528–55.
Gundersen KR, Corbin JS, Hanson CL, Hanson ML, Hanson RB,Russell DJ, Stollar A, Yamada O. 1976. Structure and biologicaldynamics of the oligotrophic ocean photic zone off the Hawaii-an Islands. Pac Sci 30:45–68.
Harris GP. 1986. Phytoplankton ecology: structure, function, andfluctuation. New York: Chapman and Hall.
Harrison WG, Harris LR, Karl DM, Knauer GA, Redalje DG. 1992.Nitrogen dynamics at the VERTEX time-series site. Deep-SeaRes 39:1535–52.
Hayes SP, Mangum LJ, Picaut J, Sumi A, Takeuchi K. 1991.TOGA-TAO: a moored array for real-time measurements in thetropical Pacific Ocean. Bull Am Meteor Soc 72:339–47.
Hayward TL. 1987. The nutrient distribution and primary produc-tion in the central North Pacific. Deep-Sea Res 34:1593–1627.
Hayward TL. 1991. Primary production in the North PacificCentral Gyre: a controversy with important implications.Trends Ecol Evol 6:281–4.
210 D.M. Karl

Hayward TL, McGowan JA. 1985. Spatial patterns of chlorophyll,primary production, macrozooplankton biomass, and physicalstructure in the central North Pacific Ocean. J Plankton Res7:147–67.
Hayward TL, Venrick EL, McGowan JA. 1983. Environmentalheterogeneity and plankton community structure in the cen-tral North Pacific. J Mar Res 41:711–29.
Hedgpeth J.W. 1957. Introduction. In: Hedgpeth JW, editor.Treatise on marine ecology and paleoecology. Colorado: Geo-logical Society of America. p 1–16.
Hobbie JE. 1994. The state of the microbes: a summary of asymposium honoring Lawrence Pomeroy. Microb Ecol 28:113–6.
Hobbie JE, Daley RJ, Jaspar S. 1977. Use of Nuclepore filters forcounting bacteria by fluorescence microscopy. Appl EnvironMicrobiol 33:1225–8.
Horel JD, Wallace JM. 1981. Planetary-scale atmospheric phe-nomena associated with the Southern Oscillation. MonthlyWeather Rev 109:813–29.
Hutchinson GE. 1941. Ecological aspects of succession in naturalpopulations. Am Naturalist 75:406–18.
Hutchinson GE. 1961. The paradox of the plankton. Am Natural-ist 95:137–45.
Huxley L. 1900. Life and letters of Thomas Henry Huxley. NewYork: D. Appleton and Company.
Jacobs GA, Hurlburt HE, Kindle JC, Metzger EJ, Mitchell JL,Teague WJ, Wallcraft AJ. 1994. Decade-scale trans-Pacificpropagation and warming effects of an El Nino anomaly.Nature 370:360–3.
Johnson MW, Brinton E. 1963. Biological species, water-massesand currents. In: Hill MN, editor. The sea: ideas and observa-tions on progress in the study of the seas. Volume 2. New York:Interscience Publishers. p 381–414.
Johnson PW, Sieburth J McN. 1979. Chroococcoid cyanobacteriain the sea: a ubiquitous and diverse phototrophic biomass.Limnol Oceanogr 24:928–35.
Karl DM. 1994. Accurate estimation of microbial loop processesand rates. Microb Ecol 28:147–50.
Karl DM, Dobbs FC. 1998. Molecular approaches to microbialbiomass estimation in the sea. In: Cooksey KE, editor. Molecu-lar approaches to the study of the ocean. London: Chapman &Hall. p 29–89.
Karl DM, Lukas R. 1996. The Hawaii Ocean Time-series (HOT)program: background, rationale and field implementation.Deep-Sea Res II 43:129–56.
Karl DM, Tien G. 1997. Temporal variability in dissolved phospho-rus concentrations in the subtropical North Pacific Ocean. MarChem 56:77–96.
Karl DM, Winn CD. 1991. A sea of change: monitoring theoceans’ carbon cycle. Environ Sci Tech 25:1976–81.
Karl DM, Letelier R, Hebel DV, Bird DF, Winn CD. 1992.Trichodesmium blooms and new nitrogen in the North Pacificgyre. In: Carpenter EJ, Capone DG, Rueter JG, editors. Marinepelagic cyanobacteria: Trichodesmium and other diazotrophs.Netherlands: Kluwer Academic Publishers. p 219–37.
Karl DM, Letelier R, Hebel D, Tupas L, Dore J, Christian J, WinnC. 1995. Ecosystem changes in the North Pacific subtropicalgyre attributed to the 1991–92 El Nino. Nature 373:230–4.
Karl DM, Christian JR, Dore JE, Hebel DV, Letelier RM, TupasLM, Winn CD. 1996. Seasonal and interannual variability inprimary production and particle flux at Station ALOHA.Deep-Sea Res II 43:539–68.
Karl D, Letelier R, Tupas L, Dore J, Christian J, Hebel D. 1997. Therole of nitrogen fixation in biogeochemical cycling in thesubtropical North Pacific Ocean. Nature 388:533–8.
Karl DM, Hebel DV, Bjorkman K, Letelier RM. 1998. The role ofdissolved organic matter releases in the productivity of theoligotrophic North Pacific Ocean. Limnol Oceanogr, 43:12–15.
Karl DM, Bidigare RR, Letelier RM. 1999. Climate-related,long-term changes in plankton community structure andproductivity in the subtropical North Pacific Ocean. Nature, inrevision.
Kenyon KE. 1978. The shallow salinity minimum of the easternNorth Pacific in winter. J Phys Oceanogr 8:1061–9.
Kerr RA. 1992. Unmasking a shifty climate system. Science255:1508–10.
Knauer GA, Redalje DG, Harrison WG, Karl DM. 1990. Newproduction at the VERTEX time-series site. Deep-Sea Res37:1121–34.
Knauer GA, Martin JH, Karl DM. 1984. The flux of particulateorganic matter out of the euphotic zone. In: Global Ocean FluxStudy. Proceedings of a Workshop; 1982 Sept 10–14; Washing-ton, DC: National Academic Press. p 136–50.
Koblentz-Mishke OJ, Volkovinsky VV, Kabanova JG. 1970. Plank-ton primary production of the world ocean. In: Wooster, WS,editor. Scientific exploration of the South Pacific. Washington,DC: National Academy of Science. p 183–93.
Kriss AE. 1962. Marine microbiology. Great Britain: Oliver &Boyd.
Krom MD, Brenner S, Kress N, Neori A, Gordon LI. 1993.Nutrient distributions during an annual cycle across a warm-core eddy from the E. Mediterranean Sea. Deep-Sea Res40:805–25.
Laws EA, Haas LW, Bienfang PK, Eppley RW, Harrison WG, KarlDM, Marra J. 1984. High phytoplankton growth and produc-tion rates in oligotrophic Hawaiian coastal waters. LimnolOceanogr 29:1161–9.
Laws EA, Harrison WG, DiTullio GR. 1985. A comparison ofnitrogen assimilation rates based on 15N uptake and autotro-phic protein synthesis. Deep-Sea Res 32:85–95.
Ledwell JR, Watson AJ, Law CS. 1993. Evidence for slow mixingacross the pycnocline from an open-ocean tracer-release experi-ment. Nature 364:701–3.
Lee D-K, Niiler PP, Warn-Varnas A. 1994. Wind-driven secondarycirculation in ocean mesoscale. J Mar Res 52:1–25.
Legendre L, Le Fevre J. 1989. Hydrodynamical singularities ascontrols of recycled versus export production in oceans. InBerger WH, Smetacek VS, Wefer G, editors. Productivity of theocean: present and past. New York: John Wiley & Sons. p49–63.
Letelier RM. 1994. Studies on the ecology of Trichodesmium spp.(Cyanophyceae) in the central North Pacific gyre. Ph.D. disser-tation, University of Hawaii.
Letelier RM, Bidigare RR, Hebel DV, Ondrusek M, Winn CD, KarlDM. 1993. Temporal variability of phytoplankton communitystructure based on pigment analysis. Limnol Oceanogr 38:1420–37.
Letelier RM, Dore JE, Winn CD, Karl DM. 1996. Seasonal andinterannual variations in photosynthetic carbon assimilation atStation ALOHA. Deep-Sea Res 43:467–90.
Letelier RM, Karl DM, Abbott MR. 1999. Integration of researchvessel, autonomous mooring and satellite time-series data toresolve biogeochemical variability in the North Pacific subtropi-cal gyre. Submitted to J Geophys Res
The North Pacific Gyre 211
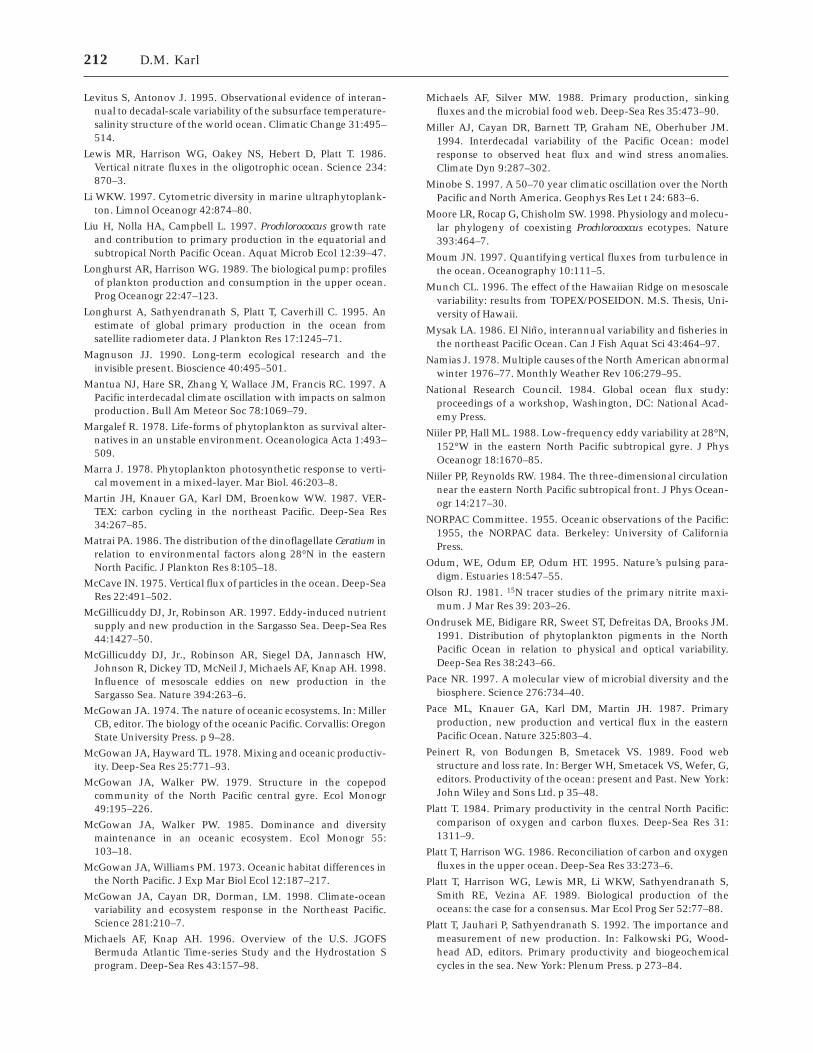
Levitus S, Antonov J. 1995. Observational evidence of interan-nual to decadal-scale variability of the subsurface temperature-salinity structure of the world ocean. Climatic Change 31:495–514.
Lewis MR, Harrison WG, Oakey NS, Hebert D, Platt T. 1986.Vertical nitrate fluxes in the oligotrophic ocean. Science 234:870–3.
Li WKW. 1997. Cytometric diversity in marine ultraphytoplank-ton. Limnol Oceanogr 42:874–80.
Liu H, Nolla HA, Campbell L. 1997. Prochlorococcus growth rateand contribution to primary production in the equatorial andsubtropical North Pacific Ocean. Aquat Microb Ecol 12:39–47.
Longhurst AR, Harrison WG. 1989. The biological pump: profilesof plankton production and consumption in the upper ocean.Prog Oceanogr 22:47–123.
Longhurst A, Sathyendranath S, Platt T, Caverhill C. 1995. Anestimate of global primary production in the ocean fromsatellite radiometer data. J Plankton Res 17:1245–71.
Magnuson JJ. 1990. Long-term ecological research and theinvisible present. Bioscience 40:495–501.
Mantua NJ, Hare SR, Zhang Y, Wallace JM, Francis RC. 1997. APacific interdecadal climate oscillation with impacts on salmonproduction. Bull Am Meteor Soc 78:1069–79.
Margalef R. 1978. Life-forms of phytoplankton as survival alter-natives in an unstable environment. Oceanologica Acta 1:493–509.
Marra J. 1978. Phytoplankton photosynthetic response to verti-cal movement in a mixed-layer. Mar Biol. 46:203–8.
Martin JH, Knauer GA, Karl DM, Broenkow WW. 1987. VER-TEX: carbon cycling in the northeast Pacific. Deep-Sea Res34:267–85.
Matrai PA. 1986. The distribution of the dinoflagellate Ceratium inrelation to environmental factors along 28°N in the easternNorth Pacific. J Plankton Res 8:105–18.
McCave IN. 1975. Vertical flux of particles in the ocean. Deep-SeaRes 22:491–502.
McGillicuddy DJ, Jr, Robinson AR. 1997. Eddy-induced nutrientsupply and new production in the Sargasso Sea. Deep-Sea Res44:1427–50.
McGillicuddy DJ, Jr., Robinson AR, Siegel DA, Jannasch HW,Johnson R, Dickey TD, McNeil J, Michaels AF, Knap AH. 1998.Influence of mesoscale eddies on new production in theSargasso Sea. Nature 394:263–6.
McGowan JA. 1974. The nature of oceanic ecosystems. In: MillerCB, editor. The biology of the oceanic Pacific. Corvallis: OregonState University Press. p 9–28.
McGowan JA, Hayward TL. 1978. Mixing and oceanic productiv-ity. Deep-Sea Res 25:771–93.
McGowan JA, Walker PW. 1979. Structure in the copepodcommunity of the North Pacific central gyre. Ecol Monogr49:195–226.
McGowan JA, Walker PW. 1985. Dominance and diversitymaintenance in an oceanic ecosystem. Ecol Monogr 55:103–18.
McGowan JA, Williams PM. 1973. Oceanic habitat differences inthe North Pacific. J Exp Mar Biol Ecol 12:187–217.
McGowan JA, Cayan DR, Dorman, LM. 1998. Climate-oceanvariability and ecosystem response in the Northeast Pacific.Science 281:210–7.
Michaels AF, Knap AH. 1996. Overview of the U.S. JGOFSBermuda Atlantic Time-series Study and the Hydrostation Sprogram. Deep-Sea Res 43:157–98.
Michaels AF, Silver MW. 1988. Primary production, sinkingfluxes and the microbial food web. Deep-Sea Res 35:473–90.
Miller AJ, Cayan DR, Barnett TP, Graham NE, Oberhuber JM.1994. Interdecadal variability of the Pacific Ocean: modelresponse to observed heat flux and wind stress anomalies.Climate Dyn 9:287–302.
Minobe S. 1997. A 50–70 year climatic oscillation over the NorthPacific and North America. Geophys Res Let t 24: 683–6.
Moore LR, Rocap G, Chisholm SW. 1998. Physiology and molecu-lar phylogeny of coexisting Prochlorococcus ecotypes. Nature393:464–7.
Moum JN. 1997. Quantifying vertical fluxes from turbulence inthe ocean. Oceanography 10:111–5.
Munch CL. 1996. The effect of the Hawaiian Ridge on mesoscalevariability: results from TOPEX/POSEIDON. M.S. Thesis, Uni-versity of Hawaii.
Mysak LA. 1986. El Nino, interannual variability and fisheries inthe northeast Pacific Ocean. Can J Fish Aquat Sci 43:464–97.
Namias J. 1978. Multiple causes of the North American abnormalwinter 1976–77. Monthly Weather Rev 106:279–95.
National Research Council. 1984. Global ocean flux study:proceedings of a workshop, Washington, DC: National Acad-emy Press.
Niiler PP, Hall ML. 1988. Low-frequency eddy variability at 28°N,152°W in the eastern North Pacific subtropical gyre. J PhysOceanogr 18:1670–85.
Niiler PP, Reynolds RW. 1984. The three-dimensional circulationnear the eastern North Pacific subtropical front. J Phys Ocean-ogr 14:217–30.
NORPAC Committee. 1955. Oceanic observations of the Pacific:1955, the NORPAC data. Berkeley: University of CaliforniaPress.
Odum, WE, Odum EP, Odum HT. 1995. Nature’s pulsing para-digm. Estuaries 18:547–55.
Olson RJ. 1981. 15N tracer studies of the primary nitrite maxi-mum. J Mar Res 39: 203–26.
Ondrusek ME, Bidigare RR, Sweet ST, Defreitas DA, Brooks JM.1991. Distribution of phytoplankton pigments in the NorthPacific Ocean in relation to physical and optical variability.Deep-Sea Res 38:243–66.
Pace NR. 1997. A molecular view of microbial diversity and thebiosphere. Science 276:734–40.
Pace ML, Knauer GA, Karl DM, Martin JH. 1987. Primaryproduction, new production and vertical flux in the easternPacific Ocean. Nature 325:803–4.
Peinert R, von Bodungen B, Smetacek VS. 1989. Food webstructure and loss rate. In: Berger WH, Smetacek VS, Wefer, G,editors. Productivity of the ocean: present and Past. New York:John Wiley and Sons Ltd. p 35–48.
Platt T. 1984. Primary productivity in the central North Pacific:comparison of oxygen and carbon fluxes. Deep-Sea Res 31:1311–9.
Platt T, Harrison WG. 1986. Reconciliation of carbon and oxygenfluxes in the upper ocean. Deep-Sea Res 33:273–6.
Platt T, Harrison WG, Lewis MR, Li WKW, Sathyendranath S,Smith RE, Vezina AF. 1989. Biological production of theoceans: the case for a consensus. Mar Ecol Prog Ser 52:77–88.
Platt T, Jauhari P, Sathyendranath S. 1992. The importance andmeasurement of new production. In: Falkowski PG, Wood-head AD, editors. Primary productivity and biogeochemicalcycles in the sea. New York: Plenum Press. p 273–84.
212 D.M. Karl

Polovina JJ, Mitchum GT, Graham NE, Craig MP, DeMartini EE,Flint EN. 1994. Physical and biological consequences of aclimate event in the central North Pacific. Fish Oceanogr3:15–21.
Pomeroy LR. 1974. The ocean’s food web, a changing paradigm.BioScience 24:499–504.
Pomeroy LR. 1981. Microbial processes in the sea: diversity innature and science. In: Hobbie JE, Williams PJ leB, editors.Heterotrophic activity in the sea. New York: Plenum Press. p1–23.
Potter D, Lajeunesse TC, Saunders GW, Andersen, RA. 1997.Convergent evolution masks extensive biodiversity amongmarine coccoid picoplankton. Biodiversity Conserv 6:99–107.
Quinones RA, Platt T. 1991. The relationship between the f-ratioand the P:R ratio in the pelagic ecosystem. Limnol Oceanogr36:211–3.
Raitt H, Moulton B. 1967. Scripps Institution of Oceanography:first fifty years. Pasadena, CA: The Ward Ritchie Press.
Raven JA. 1986. Physiological consequences of extremely smallsize for autotrophic organisms in the sea. In: Platt T, Li, WKW,editors, Photosynthetic picoplankton. Can Bull Fish Aquat Sci214:1–70.
Redfield AC. 1958. The biological control of chemical factors inthe environment. Am Sci 46:205–22.
Redfield AC, Ketchum BH, Richards FA. 1963. The influence oforganisms on the composition of seawater. In: Hill MN, editor.The sea: ideas and observations on progress in the study of theseas. New York: Interscience. p 26–77.
Reid JL, Shulenberger E. 1986. Oxygen saturation and carbonuptake near 28°N, 155°W. Deep-Sea Res 33:267–71.
Reid JL, Brinton E, Fleminger A, Venrick EL, McGowan JA. 1978.Ocean circulation and marine life. In: Charnock H, Deacon G,editors. Advances in oceanography. New York: Plenum Press. p65–130.
Ryther JH, Dunstan WM. 1971. Nitrogen, phosphorus andeutrophication in the coastal marine environment. Science171:1008–13.
Sahlsten E. 1987. Nitrogenous nutrition in the euphotic zone ofthe Central North Pacific Gyre. Mar Biol 96:433–9.
Scavia D. 1988. On the role of bacteria in secondary production.Limnol Oceanogr 33:1220–4.
Scharek R, Latasa M, Karl DM, Bidigare RR. 1999a. Temporalvariations in diatom abundance and downward vertical flux inthe oligotrophic North Pacific gyre. Deep-Sea Res 46:1051–75.
Scharek R, Tupas LM, Karl DM. 1999b. Diatom fluxes to the deepsea in the oligotrophic North Pacific gyre at Station ‘ALOHA’.Mar Ecol Prog Ser. (in press).
Scientific Committee on Oceanic Research. 1990. The JointGlobal Ocean Flux Study (JGOFS) science plan. JGOFS ReportNo. 5. Paris: International Council of Scientific Unions.
Sherr EB, Sherr BF. 1996. Temporal offset in oceanic productionand respiration processes implied by seasonal changes inatmospheric oxygen: the role of heterotrophic microbes. AquatMicrob Ecol 11:91–100.
Shor EN. 1978. Scripps Institution of Oceanography: probing theoceans 1936 to 1976. San Diego, CA: Tofua Press.
Shulenberger E. 1978. Vertical distributions, diurnal migrations,and sampling problems of hyperiid amphipods in the NorthPacific central gyre. Deep-Sea Res 25:605–23.
Shulenberger E, Reid JL. 1981. The Pacific shallow oxygenmaximum, deep chlorophyll maximum, and primary produc-tivity, reconsidered. Deep-Sea Res 28A:901–19.
Sieburth J McN, Smetacek V, Lenz J. 1978. Pelagic ecosystemstructure: heterotrophic compartments of the plankton andtheir relationship to plankton size fractions. Limnol Oceanogr23:1256–63.
Small LF, Knauer GA, Tuel MD. 1987. The role of sinking fecalpellets in stratified euphotic zones. Deep-Sea Res 34:1705–12.
Smith CR, Hoover DJ, Doan SE, Pope RH, DeMaster DJ, DobbsFC, Altabet MA. 1996. Phytodetritus at the abyssal seaflooracross 10° of latitude in the central equatorial Pacific. Deep-SeaRes 43:1309–38.
Steemann Nielsen E. 1956. Measuring the productivity of thesea. In: Bruun AF, and others, editors. The Galathea Deep SeaExpedition 1950–1952. London: George Allen and Unwin Ltd.p 53–64.
Strayer D. 1988. On the limits to secondary production. LimnolOceanogr 33:1217–20.
Strayer D, Glitzenstein JS, Jones CG, Kolasoi J, Likens GE,McDonnell MJ, Parker GG, Pickett STA. 1986. Long-termecological studies: an illustrated account of their design, opera-tion, and importance to ecology. Millbrook, NY: OccasionalPublication of the Institute of Ecosystem Studies, No. 2.
Strickland JDH. 1965. Production of organic matter in theprimary stages of the marine food chain. In: Riley JP, SkirrowG, editors. Chemical oceanography. New York: AcademicPress. p 477–610.
Suess E. 1980. Particulate organic carbon flux in the oceans—surface productivity and oxygen utilization. Nature 288:260–3.
Sverdrup HU, Johnson MW, Fleming RH. 1946. The oceans, theirphysics, chemistry and general biology. New York: Prentice-Hall.
Taylor GT. 1989. Variability in the vertical flux of microorganismsand biogenic material in the epipelagic zone of a North Pacificcentral gyre station. Deep-Sea Res 36: 1287–1308.
Thomas WH. 1969. Phytoplankton nutrient enrichment experi-ments off Baja California and in the eastern equatorial PacificOcean. J Fish Res Bd Can 26:1133–45.
Thomas WH. 1970. Effect of ammonium and nitrate concentra-tion on chlorophyll increases in natural tropical Pacific phyto-plankton populations. Limnol Oceanogr 15:386–94.
Toggweiler JR. 1989. Is the downward dissolved organic matter(DOM) flux important in carbon transport? In: Berger WH,Smetacek VS, Wefer G, editors. Productivity of the Ocean:Present and Past. New York: John Wiley & Sons Ltd. p 65–83.
Trenberth KE. 1990. Recent observed interdecadal climate changesin the northern hemisphere. Bull Am Meteor Soc 71:988–93.
Trenberth KE, Hoar, TJ. 1997. El Nino and climate change.Geophys Res Lett 24: 3057–3060.
Troup AJ. 1965. The southern oscillation. Q J Roy Meteor Soc91:490–506.
Urbach E, Scanlan DJ, Distel DL, Waterbury JB, Chisholm SW.1998. Rapid diversification of marine picophytoplankton withdissimilar light-harvesting structures inferred from sequencesof Prochlorococcus and Synechococcus (Cyanobacteria). J Mol Evol46:188–201.
Venrick EL. 1971. Recurrent groups of diatom species in theNorth Pacific. Ecology 52:614–25.
Venrick EL. 1979. The lateral extent and characteristics of theNorth Pacific central environment at 35°N. Deep Sea Res26:1153–78.
Venrick EL. 1982. Phytoplankton in an oligotrophic ocean:observations and questions. Ecol Monogr 52:129–54.
The North Pacific Gyre 213
Venrick EL. 1990. Phytoplankton in an oligotrophic ocean:species structure and interannual variability. Ecology 71:1547–63.
Venrick EL. 1992. Phytoplankton species structure in the centralNorth Pacific: is the edge like the center? J Plankton Res14:665–80.
Venrick EL. 1993. Phytoplankton seasonality in the central NorthPacific: the endless summer reconsidered. Limnol Oceanogr38:1135–49.
Venrick EL. 1995. Scales of variability in a stable environment:phytoplankton in the central North Pacific. In: Powell TM,Steele JH, editors. Ecological time-series. New York: Chapman& Hall. p 150–80.
Venrick EL, McGowan JA, Cayan DR, Hayward TL. 1987. Climateand chlorophyll a: long-term trends in the central North PacificOcean. Science 238:70–2.
Villareal TA, Altabet MA, Culver-Rymsza K. 1993. Nitrogentransport by migrating diatom mats in the North Pacific Ocean.Nature 363:709–12.
Vinogradov MYe, Shushkina EA. 1989. Macro-scale distributionof the quantitative characteristics of plankton in the PacificOcean. Oceanology 29:87–91.
Vinogradov MYe, Krapivin VF, Menshutkin VV, Fleyshman BS,Shushkina EA. 1973. Mathematical model of the functions ofthe pelagial ecosystem in tropical regions (from the 50th voyageof the R/V Vityaz’). Oceanology 13:704–17.
Vinogradov ME, Shushkina EA, Vedernikov VI, Nezlin NP,Gagarin VI. 1997. Primary production and plankton stocks inthe Pacific Ocean and their seasonal variation according toremote sensing and field observations. Deep-Sea Res 44:1979–2001.
Volk T, Hoffert MI. 1985. Ocean carbon pumps: analysis ofrelative strengths and efficiencies in ocean-driven atmosphericCO2 changes. In: Sundquist ET, Broecker WS, editors. Thecarbon cycle and atmospheric CO2: natural variations archeanto present. Washington, DC: American Geophysical Union. p99–110.
Ward BB, Olson RJ, Perry MJ. 1982. Microbial nitrification ratesin the primary nitrite maximum off southern California.Deep-Sea Res 29:247–55.
Ward BB, Kilpatrick KA, Renger EH, Eppley RW. 1989. Biologicalnitrogen cycling in the nitracline. Limnol Oceanogr 34:493–513.
Wassman P. 1990. Relationship between primary and exportproduction in the boreal coastal zone of the North Atlantic.Limnol Oceanogr 35:464–71.
Wiegert RG, Penas-Lado E. 1995. Nitrogen-pulsed systems on thecoast of northwest Spain. Estuaries 18:622–35.
Williams PJ leB. 1981. Incorporation of microheterotrophicprocesses into the classical paradigm of the planktonic foodweb. Kieler Meeresforsch Sonderh 5:1–28.
Williams PJ leB. 1993. On the definition of plankton productionterms. In: Li WKW, Maestrini SY, editors. Measurement ofprimary production from the molecular to the global scale.ICES marine science symposia. Volume 197. Denmark: Interna-tional Council for the Exploration of the Sea. p 9–19.
Williams PJ leB. 1998. The balance of plankton respiration andphotosynthesis in the open oceans. Nature 394:55–7.
Williams PJLeB, von Bodungen B. 1989. Group report: exportproductivity from the photic zone. In: Berger WH, SmetacekVS, Wefer G, editors. Productivity of the ocean: present andpast. New York: John Wiley & Sons Ltd. p 99–115.
Williams PM, Druffel ERM. 1987. Radiocarbon in dissolvedorganic matter in the central North Pacific Ocean. Nature330:246–8.
Winn CD, Karl DM. 1984. Microbial productivity and communitygrowth rate estimates in the tropical North Pacific Ocean. BiolOceanogr 3:123–45.
Winn CD, Campbell L, Christian JR, Letelier RM, Hebel DV, DoreJE, Fujieki L, Karl DM. 1995. Seasonal variability in thephytoplankton community of the North Pacific SubtropicalGyre. Global Biogeochem Cycles 9:605–20.
Woese CR. 1994. There must be a prokaryote somewhere:microbiology’s search for itself. Microbiol Rev 58:1–9.
Wyrtki K. 1975. Fluctuation of the dynamic topography in thePacific Ocean. J Phys Oceanogr 5:450–9.
Wyrtki K. 1985. Water displacements in the Pacific and thegenesis of El Nino cycles. J Geophys Res 90:7129–32.
Zehr JP, Mellon MT, Zani S. 1998. New nitrogen-fixing microor-ganisms detected in oligotrophic oceans by amplification ofnitrogenase (nifH) genes. Appl Environ Microbiol 64:3444–50.
Zhang R-H, Rothstein LM, Busalacchi AJ. 1998. Origin ofupper-ocean warming and El Nino change on decadal scales inthe tropical Pacific Ocean. Nature 391:879–83.
Zhang Y, Wallace JM, Battisti DS. 1997. ENSO-like interdecadalvariability: 1990–93. J Climate 10:1004–20.
214 D.M. Karl