a semi-automated system for the characterization …/67531/metadc624900/m2/1/high... · a...
TRANSCRIPT

SLAC-95-68 1 1 June 1995
A SEMI-AUTOMATED SYSTEM FOR THE CHARACTERIZATION OF NLC ACCELERATING STRUCTURES*
S.M. Hanna, G.B. Bowden, H.A. Hoag, R. Loewen, AB. Vlieks, J.W. Wmg Stanford Linear Accelerator Center, Stanford University, Stanford, CA 94309, USA
A system for characteriziig the phase shift per cell of a long X-band accelerator structure is described. The fields within the structure are perturbed by a small cylindrical metal bead pulled along the axis. A computer controls the bead position and processes the data from a network analy- zer connected to the accelerator section. Measurements made on prototype accelerator sections are described, and they are shown to be in good agreement with theory
1. INTRODUCTION
Linear accelerators require precise phase relationship to be maintained between the driving rf field and the bunched beam throughout the interaction length [l]. Structures for the Next Linear Collider (NLC) will probably be machined and assembled to such tight mechanical tolerances that no provision for cell tuning is needed. However, prototype structures being developed for the NLC Test Accelerator (NLCTA) will need to be tuned, and will have provision for tuning built into each cell. The X-baud structures are long, and employ a large number of cells (204). Tuning has traditionally been checked by the so-called nodal-shift method [2], in which a shorting plunger rests on the irises and is moved from cell to cell along the horizontal structure. Concerns over high-field breakdown and dark current generation in the operating accelerator prohibit the use of this method, which could damage the finely machined copper surfaces.
In Section I1 of this paper, we describe a semi- automated measurement system being built for testing and tuning NLCTA accelerator sections. The results of traveI- ing wave 0 perturbation measurements on two proto- type sections are reported in Section III. Finally, in Section Iv, the measured data are compared to predictions calcula- ted from our analytical model.
11. ACCELERATING STRUCTURE CHARACTEWZATION SYSTEM
The system being developed utilizes a bead field- perturbation technique to evaluate the tuning of X-band
* Work supported by Department of Energy contract DE- ACO3-76SFOO515.
accelerators. A small metallic cylindrical bead is attached to a thin nylon string running along the axis of the vertically-mounted accelerator section, as shown in Fig. 1. The position of the bead is determined by a stepper motor- driven lead screw and carriage attached to the external return loop of the nylon string. This method allows TW perturbation measurements to be made without contacting the clean inner surfaces of the section. The bead can be replaced by a light metal cylinder if it is necessary to make nodal-shift measurements.
4-95 m2A1
Figure 1. Schematic diagram for the semi-automated test setup.
A rotary encoder is shaft-coupled to the stepper motor. A computer interfaces with both, reading back position data from the encoder and stepping the motor as required by the measurement program. The computer also collects and processes the complex reflection coefficient data from a microwave network analyzer connected to the accelerator section.
Presented at the 16th IEEE Particle Accelerator Con$erence (PAC 95) and International Conference on High-Energy Accelerators, Dallas, Texas, May 1--5,199?
W$TRIBUTION OF THlS DOCUMENT IS UNLUMfTEn

0.03 1 I I I I I I
p 0.01
E o -0.01 o . o ~
([I C m .- -
/ Bead at Measured S1.l Center
of Cell
Bead at Cell Iris
-0.02 I I I I I 1 1 -0.03 -0.02 -0.01 0 0.01 0.02 0.03
792i1/\2 Real 4-95
Figure 2. Reflection from the perturbed 75 cm accelerator structure.
III. TW PERTURBATION MEASUREMENT
The system described above will be used to character- ize the NLCTA sections as they are built during the next two years. The measurements are based on bead perturba- tion under traveling wave conditions [3,41.
Preliminary tests to develop this system have been made on two X-band accelerator sections which were built during the early phases of the NLCTA program. Both are constant impedance sections, one 26 cm long (30 cells) and one 75 cm long (86 cells), and have been previously tested at high power [5]. The cylindrical bead used was 0.508 mm in diameter and 0.483 mm high. The monofilament nylon string was 0.145 mm in diameter. A network analyzer connected to one port of the accelerator measured the reflection coefficient. Figure 2 shows the variation in the reflection coefficient as the bead is pulled
0 400 800 1200 4-95 Position (mils) 39221\3
Figure 3. Phase advance as a function of bead position in the structure for the 75 crn structure.
0.02 XI
-0.03 -0.04 -0.02 0
79pA4 Real
4-95
Figure 4. Reflection from the perturbed 26 cm accelerator structure.
along the accelerator axis through three consecutive cells. The measured S 11 is plotted in the complex plane with axial position as parameter. The three-fold symmetry for the 2 d 3 mode is clearly manifested. Points on the curve where the bead crosses the center and the iris of one cell are marked. The phase advance from cell-to-cell, which can easily be deduced from the reflection data, is shown in Fig. 3. These results were confirmed by nodal-shift measurements on the same sections [6]. Our measurement technique is capable of detecting small deviations from $e required phase shift for any cell in the accelerator structure. This is demonstrated in Fig. 4 for the 26-cm section.
JY. COMPARISON WITH ANALYTICAL MODELS
The traces shown in Figs. 2 and 4 are geometrical figures known as hypotrochoids. This response can be predicted from a transmission line model [7], and also from a purely field approach [8]. In the transmission line model, the perturbation introduced by a lossless bead is treated as a reactive discontinuity. Starting with the space harmonics of the longitudinal electric field, E,, the magnitude and phase of the reflection coefficient at the input port of the accelerator can be obtained as the bead is pulled across the structure. The field model starts with the space harmonics of the longitudinal electric field and derives the magnitude and phase of the reflection coefficient at the input port of the accelerator. Figure 5 shows both the theoretical predictions and the measured values of S 11 for the 75 cm structure.
DISCLAIMER
Portions of this document may be illegible in electronic image products. Images are produced from the best available original document.
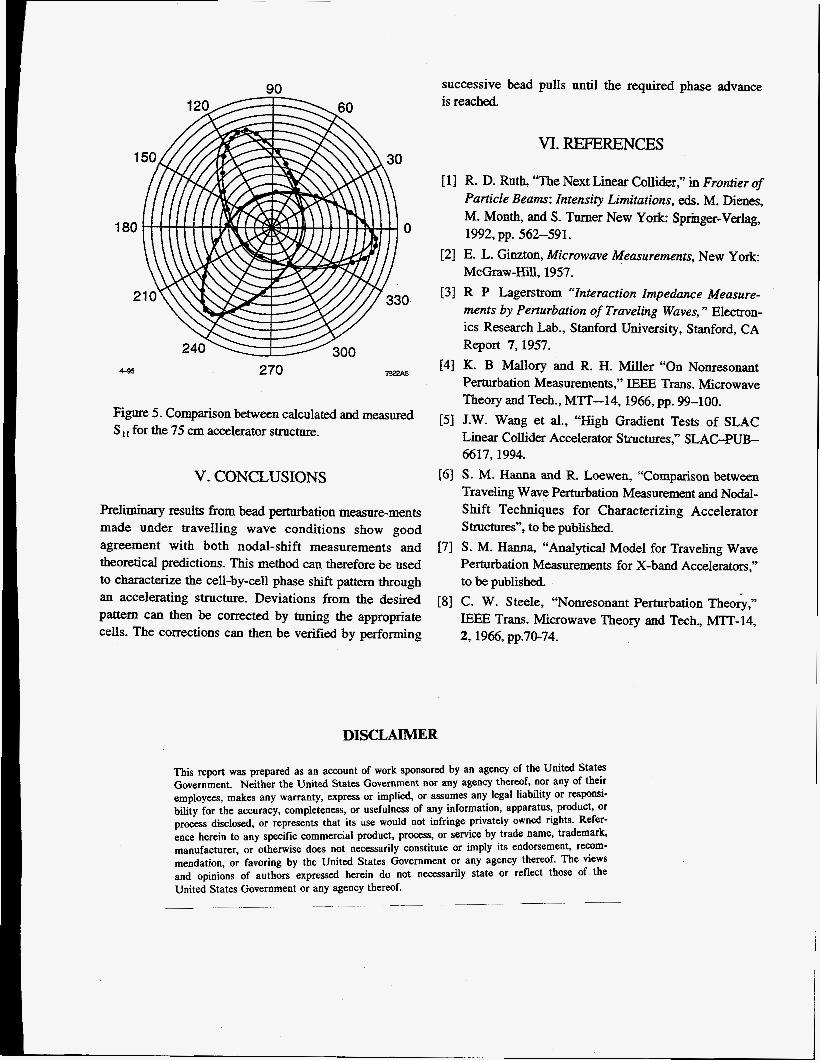
90 successive bead pulls until the required phase advance is reached.
4-95 270 79221\5
Figure 5. Comparison between calculated and measured SI* for the 75 cm accelerator structure.
V. CONCLUSIONS
Preliminary results from bead perturbation measure-ments made under travelling wave conditions show good agreement with both nodal-shift measurements and theoretical predictions. This method can therefore be used to characterize the cell-by-cell phase shift pattern through an accelerating structure. Deviations from the desired pattern can then be corrected by tuning the appropriate cells. The corrections can then be verified by performing
r11
[21
131
[41
[71
VI. REFERENCES
R. D. Ruth, ‘The Next Linear Collider,” in Frontier of Particle Beams: Intensity Limitations, eds. M. Dienes, M. Month, and S. Turner New York Springer-Verlag, 1992, pp. 562-591. E. L. Ginzton, Microwave Measurements, New York M~Graw-Hill, 1957. R P Lagerstrom “Interaction Impedance Measure- ments by Perturbation of Traveling Waves, ’’ Electron- ics Research Lab., Stanford University, Stanford, CA Report 7,1957. K. B Mallory and R. H. Miller “On Nonresonant Perturbation Measurements,” EEE Trans. Microwave Theory and Tech., M’IT-14,1966, pp. 99-100. J.W. Wang et al., “High Gradient Tests of SLAC Linear Collider Accelerator Structures,” SLAC-PUB- 6617,1994. S. M. Hanna and R. Loewen, “Comparison between Traveling Wave Perturbation Measurement and Nodal- Shift Techniques for Characterizing Accelerator Structures”, to be published. S. M. Hanna, “Analytical Model for Traveling Wave Perturbation Measurements for X-band Accelerators,” to be published. C. W. Steele, ccNonresonant Perturbation Theoj,” IEEE Trans. Microwave Theory and Tech., m - 1 4 , 2,1966, pp.70-74.
DISCLAIMER
This report was prepared as an account of work sponsored by an agency of the United States Government. Neither the United States Government nor any agency thereof, nor any of their employees, makes any warranty, express or implied, or assumes any legal liability or responsi- bility for the accuracy, completeness, or usefulness of any information, apparatus, produd, or process disclosed, or represents that its use would not infringe privately owned rights. Refer- ence herein to any specific commercial product, process, or service by trade name, trademark, manufacturer, or otherwise does not necessarily constitute or imply its endorsement, recom- mendation, or favoring by the United States Government or any agency thereof. The views and opinions of authors expressed herein do not necessarily state or reflect those of the United States Government or any agency thereof.
~ _ _ _ ~ - _____-