a serendipitous search for high-redshift lyα emission: two
TRANSCRIPT

arX
iv:a
stro
-ph/
0002
241v
2 9
Mar
200
0
In press,The Astrophysical Journal
A Serendipitous Search for High-Redshift Lyα Emission:
Two Primeval Galaxy Candidates at z ≃ 31
Curtis Manning, Daniel Stern2, Hyron Spinrad, & Andrew J. Bunker3
Department of Astronomy, University of California at Berkeley
Berkeley, CA 94720
email: (cmanning,dstern,spinrad,bunker)@bigz.berkeley.edu
ABSTRACT
In the course of our ongoing search for serendipitous high-redshift Lyα emission in
deep archival Keck spectra, we discovered two very high equivalent width (W obsλ ∼> 450
A, 2σ) Lyα emission line candidates at z ∼ 3 in a moderate dispersion (λ/∆λ ≃ 1200)
spectrogram. Both lines have low velocity dispersions (σv ∼ 60 km s−1) and decon-
volved radii r ≈ 1 h−150 kpc. We argue that the lines are Lyα, and are powered by stellar
ionization. The surface density of robust, high equivalent width Lyα candidates is esti-
mated to be ∼ 3±2 arcmin−2 per unit redshift at z ≃ 3, consistent with the estimate of
Cowie & Hu (1998). The Lyα emission line source characteristics are consistent with the
galaxies undergoing their first burst of star formation, i.e., with being primeval. Source
sizes and velocity dispersions are comparable to the theoretical primeval galaxy model
of Lin & Murray (1992) based on the inside-out, self-similar collapse of an isothermal
sphere. In this model, star formation among field galaxies is a protracted process.
Galaxies are thought to be able to display high equivalent widths for only the first ∼few ×107 yr. This time is short in relation to the difference in look back times between
z = 3 and z = 4, and implies that a substantial fraction of strong line-emitting galaxies
at z = 3 were formed at redshifts z ≤ 4. We discuss the significance of high-equivalent
width Lyα-emitting galaxies in terms of the emerging picture of the environment, and
the specific characteristics of primeval galaxy formation at high redshift.
Subject headings: Cosmology: observations — galaxies: compact — galaxies: evolution
— galaxies:formation — galaxies: starburst — line: profiles
1Based on observations at the W.M. Keck Observatory, which is operated as a scientific partnership among the Uni-
versity of California, the California Institute of Technology, and the National Aeronautics and Space Administration.
The Observatory was made possible by the generous financial support of the W.M. Keck Foundation.
2Current address: Jet Propulsion Laboratory, California Institute of Technology, Mail Stop 169-327, Pasadena,
CA 91109; [email protected]
3Current address: Institute of Astronomy, Madingley Road, Cambridge, CB3 0HA, England; email:

– 2 –
1. Introduction
Early theoretical models of primeval galaxies suggested that their Lyα lines would be highly
luminous and diffuse. But searches on 4m-class telescopes confirmed no such emission lines (Pritchet
1994; Thompson & Djorgovski 1995) and the search for galaxies at large look-back times turned to
other strategies. One highly successful technique is color-selection of the Lyman break in galaxies
of redshift z ≃ 3 (Steidel & Hamilton 1992; Steidel et al. 1996). Lyman-break galaxies (LBGs) are
strongly star-forming, and compact relative to local L∗ galaxies (Giavalisco et al. 1996b). However,
LBGs are not generally thought to be primeval, in part because they have lower Lyα equivalent
widths than expected of primeval galaxies, in part because interstellar metallic absorption lines
(e.g., Si II λ1260, Al II λ1670) are characteristic of most LBG spectra.
The theoretical upper limit equivalent width for Lyα emission produced by stellar photoion-
ization is thought to be W restλ ∼ 100 − 200 A (Charlot & Fall 1993), and can be expected to last
only a few×107 yr for a constant star formation rate (SFR). Several examples of high-redshift, high
equivalent width (non-AGN) Lyα emission have been reported (e.g., Dey et al. 1998; Weymann
et al. 1998; Hu et al. 1999). Few secure examples of isolated, high equivalent widths that are not
Lyα exist in the literature (e.g., Stockton & Ridgway 1998; Stern et al. 2000). About half of LBGs
have Lyα in emission (Steidel et al. 1996, 1998; Lowenthal et al. 1997), with rest equivalent widths
∼ 5− 35 A. Likewise, about half of local actively star-forming galaxies have Lyα in emission, with
rest equivalent widths in the range Wλ ≃ 10 − 35 A (Giavalisco et al. 1996a), though a few have
Wλ ∼> 50 A.
Local studies show that whether Lyα is seen in emission or absorption may depend heavily on
the kinematics of the surrounding neutral H I halo (Legrand et al. 1997; Kunth et al. 1998a) and
the chance geometry of neutral gas and dust (Giavalisco et al. 1996a). However, W restλ is shown to
be weakly-correlated with metallicity (Terlevich et al. 1993; Giavalisco et al. 1996a). The selective
absorption of resonantly scattered Lyα photons, whose path length in the cloud is much longer than
that of photons of modestly different wavelength, is thought to be the major factor in quenching the
Lyα line. The partially extincted Lyα line is characteristically asymmetric (e.g., Dey et al. 1998;
Kunth et al. 1998a; Legrand et al. 1997), presumably caused by the absorption of photons from
the blue side of the line by dust in an expanding shell, and compounded by the addition of red-
shifted backscattering off the neutral shell expanding away from the observer (e.g., Legrand et al.
1997). Though dust-free galaxies are the most likely to have high equivalent width Lyα emission,
it is clear that a more evolved galaxy can also have high equivalent width Lyα emission emerging
within specific zones of active star formation due to an incomplete covering factor. Such emission
may appear spatially offset from the region of star formation (e.g., Bunker et al. 2000). Averaged
over the whole galaxy, the continuum supplied by recent star formation with locally quenched Lyα
emission will reduce the integrated line equivalent width.
Deep spectra taken at the Keck telescopes regularly reveal serendipitous high-equivalent width,
isolated emission lines (e.g., Stern et al. 2000). Indeed, the first confirmed galaxy at z > 5 was

– 3 –
discovered in this manner (Dey et al. 1998). Steidel et al. (1998) obtained a serendipitous spectrum
of a strong Lyα line with extremely faint continuum near the 〈z〉 ≃ 3.09 structure in the SSA22
field. Strong emission lines can also be effectively targeted by using narrow band imaging, in
conjunction with broad band imaging. Recent observations, using narrow band imaging with a
“strong equivalent width” (W obsλ ≥ 77 A) criterion (Cowie & Hu 1998) and follow-up spectroscopy
(Hu et al. 1998) have disclosed a population of galaxies with what is thought to be Lyα in emission.
The galaxies tend to have very weak, sometimes undetectable, continua. They are also are quite
compact, as noted of the z ∼ 2.4 Lyα emitters found in HST searches (Pascarelle et al. 1996;
Pascarelle et al. 1998). Cowie & Hu (1998) estimate a surface density of 3.6 arcmin−2 per unit
redshift for flux densities j > 2 × 10⁻¹⁷ ergs cm−2 s−1, corresponding to line luminosities LLyα >
1.8 × 1042 ergs s−1 for an Einstein-de Sitter Universe with H0 = 50km s−1 Mpc−1 at z ≈ 3.4.
We are conducting a search for serendipitous emission lines in deep archival Keck spectra.
Such a serendipitous search is an emission-line flux-limited survey, and may find emission lines
over a wide range of redshifts. Narrow-band surveys are sensitive to candidates over only small
redshift ranges, and require follow-up spectroscopy to discriminate stellar Lyα lines from metal and
AGN emission lines. The identification of a population of primeval galaxies may provide important
information about the epoch(s) of galaxy formation, including data relevant to the integrated global
star formation rate, and the luminsity function of galaxies to photometric limits fainter than that
accessible to color-selection surveys.
One drawback faced by all Lyα emission line searches is possible confusion with other isolated,
high equivalent width lines such as [O II] λ3727 and Hα. Experience has shown that [O II] λ3727
is often mis-identified as Lyα. When continuum is detected, we may use the Balmer series or the
continuum depression to discriminate, and when absent we may search for another line, such as
N V λ1240 or [O III] λ5007. However, N V λ1240 is rarely detected in non-AGN, and the search for
[O III] λ5007 often fails because these lines would either fall out of the range of the spectrograph, or
in the high-noise infrared part of the spectrum which, combined with the large intrinsic dispersion
in [O II] λ3727/[O III] λ5007 (Kennicutt 1992), can make an unambiguous verification untenable.
Alternatively, one may use the known tendency of Lyα lines to display a P-Cygni profile to identify
this resonance line. However, asymmetry cannot be a completely necessary criterion for Lyα
emission lines since some local sources apparently have symmetric, or “pure” profiles (Kunth et al.
1998b). When emission lines are unresolved, and have undetected continua, the last recourse is the
knowledge that [O II] λ3727 rarely has an equivalent width greater than 100 A (but see Stern et al.
2000). For these reasons, unambiguous Lyα lines are rare, and worthy of extra scrutiny.
We serendipitously found two isolated emission lines on a single slitlet from a mask centered
on the SSA22 field, andq determined that they are in fact Lyα lines — examples of galaxies
which are more compact and have higher Lyα equivalent widths than known LBGs. We report
on their equivalent widths, intrinsic radii, velocity dispersions, and surface/volume density in or-
der to place them in the picture of the evolving Universe emerging from studies of high-redshift
galaxies. The source targeted by the slitlet in which we found our emission line galaxies is the

– 4 –
color-selected Lyman-break galaxy SSA22 C17; we analyze it in parallel for comparison. We adopt
H0 = 50h50 km s−1 Mpc−1,Ω0 = 1, and Λ = 0 unless otherwise stated. At z = 3, for Ω = 1(0.1),
1.′′0 corresponds to 7.3 (12.3)h−150 kpc.
2. Observations and Data Reduction
We have obtained deep, moderate-dispersion spectra of z ≃ 3 LBGs with the aim of making
detailed studies of the ages, kinematics, dust-content, and abundances of the LBG population
(Dey et. al., in preparation). The data were taken during the years 1997 to 1999 with the Low
Resolution Imaging Spectrometer (Oke et al. 1995) at the Cassegrain focus on the Keck II telescope.
The camera uses a Tek 20482 CCD detector with a pixel scale 0.′′212 pix−1. On UT 1997 September
10 we obtained moderate-dispersion multislit spectra of LBGs in the SSA22 field, using the 600
lines mm−1 grating blazed at 5000 A. Slitlet widths were 1.′′25, resulting in a spectral resolution
of ∼ 4.4 A (FWHM) for sources filling the slitlet, and a resolution λ/∆λFWHM ∼ 1200. Objects
not filling the slitlet will have higher spectral resolution. For a spatially unresolved source – one
blurred only by atmospheric seeing – we estimate a resolution of ∼ 2.8 A (FWHM) based on Lyα
absorption systems in the quasar SSA22 D14 also observed on the slitmask reported herein. Four
of the integrations totaling 7200s were of excellent quality, with seeing along the spatial axis of
0.′′78. Additional observations were made on UT 1997 September 12 and UT 1999 June 14. Here
we concentrate on the data of UT 1997 September 10 for which the signal-to-noise ratio (S/N) is
highest.
The data reductions were performed using the IRAF package, and followed standard slit spec-
troscopy procedures. Flat-fielding, sky subtraction, cosmic ray removal, and aperture extractions of
the slitmask data were facilitated by the home-grown software package BOGUS, created by D. Stern,
A. J. Bunker & S. A. Stanford. Wavelength calibration was performed using a HgNeAr lamp,
employing telluric sky lines to adjust the wavelength zero-point to the data frames, compensating
for any drift in the wavelength coverage. Flux calibration was performed using observations of Wolf
1346 (Massey & Gronwall 1990).
3. Spectroscopic Results
We find two serendipitous, isolated emission lines, ser-1 and ser-2, in a 100′′ long slitlet centered
on the LBG SSA22 C17 (z = 3.299; see Fig. 1). In lower dispersion spectra, it is often impossible
to distinguish between high equivalent width forms of [O II] λ3727 and Lyα, unless there is an
evident continuum depression, a line asymmetry, or other distinguishing features. Though only
one of these two serendipitously discovered sources (ser-2) displays evidence of the asymmetry
characteristic of high-redshift Lyα emission in LBGs, we argue that Lyα is indeed the most likely
interpretation for both. We simulate the [O II] λλ3726, 3729 doublet using our 2.8 A resolution
– 5 –
4600 4800 5000 5200 5400 5600 5800
λ (Angstroms)
SSA22 ser−1z=3.022
SSA22 C17z=3.299
SSA22 ser−2z=3.357
85"
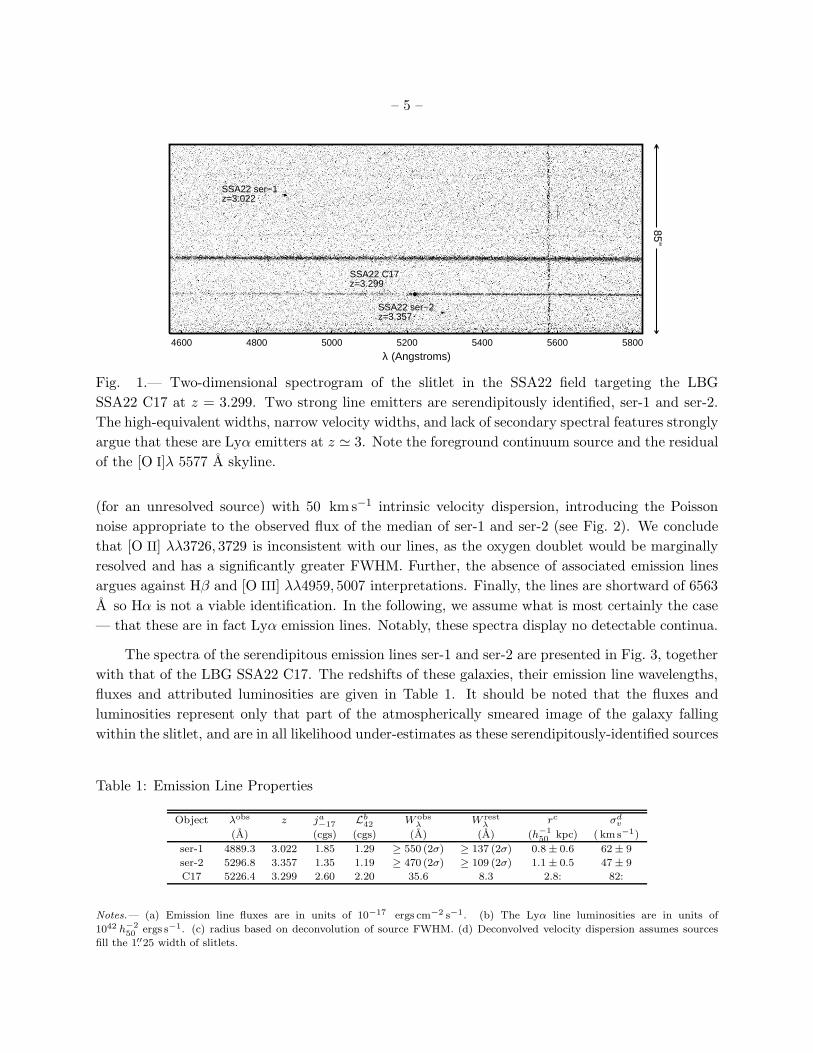
Fig. 1.— Two-dimensional spectrogram of the slitlet in the SSA22 field targeting the LBG
SSA22 C17 at z = 3.299. Two strong line emitters are serendipitously identified, ser-1 and ser-2.
The high-equivalent widths, narrow velocity widths, and lack of secondary spectral features strongly
argue that these are Lyα emitters at z ≃ 3. Note the foreground continuum source and the residual
of the [O I]λ 5577 A skyline.
(for an unresolved source) with 50 km s−1 intrinsic velocity dispersion, introducing the Poisson
noise appropriate to the observed flux of the median of ser-1 and ser-2 (see Fig. 2). We conclude
that [O II] λλ3726, 3729 is inconsistent with our lines, as the oxygen doublet would be marginally
resolved and has a significantly greater FWHM. Further, the absence of associated emission lines
argues against Hβ and [O III] λλ4959, 5007 interpretations. Finally, the lines are shortward of 6563
A so Hα is not a viable identification. In the following, we assume what is most certainly the case
— that these are in fact Lyα emission lines. Notably, these spectra display no detectable continua.
The spectra of the serendipitous emission lines ser-1 and ser-2 are presented in Fig. 3, together
with that of the LBG SSA22 C17. The redshifts of these galaxies, their emission line wavelengths,
fluxes and attributed luminosities are given in Table 1. It should be noted that the fluxes and
luminosities represent only that part of the atmospherically smeared image of the galaxy falling
within the slitlet, and are in all likelihood under-estimates as these serendipitously-identified sources
Table 1: Emission Line Properties
Object λobs z ja
−17Lb
42W obs
λW rest
λrc σd
v
(A) (cgs) (cgs) (A) (A) (h−1
50kpc) ( km s−1)
ser-1 4889.3 3.022 1.85 1.29 ≥ 550 (2σ) ≥ 137 (2σ) 0.8 ± 0.6 62 ± 9
ser-2 5296.8 3.357 1.35 1.19 ≥ 470 (2σ) ≥ 109 (2σ) 1.1 ± 0.5 47 ± 9
C17 5226.4 3.299 2.60 2.20 35.6 8.3 2.8: 82:
Notes.— (a) Emission line fluxes are in units of 10−17 ergs cm−2 s−1. (b) The Lyα line luminosities are in units of
1042 h−2
50ergs s−1. (c) radius based on deconvolution of source FWHM. (d) Deconvolved velocity dispersion assumes sources
fill the 1.′′25 width of slitlets.

– 6 –
Fig. 2.— The [O II] λλ3726, 3729 doublet line profile from a source with a 50 km s−1 velocity
dispersion, as it would appear in its rest frame, observed with an effective 2.8 A resolution of a
point-source emitter. Poisson noise has been added commensurate to that observed in the LRIS
spectra. The observed emission lines of ser-1 and ser-2 have been referred to the same wavelength,
with their amplitude adjusted to agree with that of the [O II] λλ3726, 3729 lines. The line profiles
of ser-1 and ser-2 are clearly incompatible with an [O II] λλ3726, 3729 interpretation.
are not necessarily centered in the slitlets. The sources ser-1 and ser-2 are at redshifts z = 3.022,
and z = 3.357, respectively. We note that ser-2 is at nearly the same redshift as the nearby quasar
SSA22 D14 (Steidel et al. 1998).
To date, our serendipitous search has reviewed five slitmasks (≃ 0.75 arcmin2) and five longslit
spectra (≃ 0.30 arcmin2). In addition to the two lines presented here, we have found one other
definite Lyα line at z = 2.946 with a line flux j = 3.32 × 10⁻¹⁷ ergs cm−2 s−1 and line luminosity
LLyα = 2.2× 1042h−250 ergs s−1. In a total search area slightly over 1 arcmin2, this suggests that the
surface density of robustly identified high equivalent width Lyα emission lines within the redshift
range, 2.5 ≤ z ≤ 3.5 is very roughly of the order 3±2 arcmin−2 per unit redshift. This is consistent
with the estimate of Cowie & Hu (1998) who find a surface density of ≈ 3.6 Lyα-emitters arcmin−2
per unit redshift to a higher limiting flux density of 2 × 10⁻¹⁷ ergs cm−2 s−1. The full survey
including candidates at higher redshift will be discussed in a subsequent paper.

– 7 –
Fig. 3.— Spectra of two serendipitously identified Lyα-emitters in the field of SSA22, with the
known LBG SSA22 C17. The abscissa on the left refers to the first two plots, while the abscissa on
the right refers to the right-hand plot. Inserts illustrate the characteristic asymmetric Lyα profile
of C17 and ser-2.
3.1. Intrinsic Angular Diameters and Velocity Dispersion
We derive the intrinsic spatial FWHM assuming that the intrinsic, atmospheric, and instru-
mental FWHM add in quadrature. Based on on the results of multiple measurements, we assume
the 1σ observational and intrinsic FWHM measurement errors to be ∼ 0.25 pix, and run 100 trials
based on the observed central values. We find deconvolved FWHM for ser-1 and ser-2 of 0.′′24
± 0.′′18 and 0.′′36 ± 0.′′15, respectively. At these redshifts, a compact galaxy with r = 1h−150 kpc
would have an intrinsic angular diameter of ∼ 0.′′27 / 0.′′16 (Ω = 1 / 0.1). We note, however, that
the deconvolved spatial FWHM of C17 at the Lyα line, and in the continuum redward of the line
are ∼ 0.′′90 and 0.′′40, respectively. The difference is likely due to scattering of Lyα photons in the
H I halo. Hence it is conceivable that the intrinsic sizes of the stellar components of ser-1 and ser-2
are ∼ 50% smaller than the values obtained above, or r ∼< 500h−150 pc.
We measure the instrumental resolution (for objects filling the slitlet) from the line profile of
lamp spectra. We find FWHMlampinstr ≃ 4.4 A. For spatially unresolved sources, we find FWHMQSO
instr ≃2.8 A, measured from the Lyα forest of the QSO SSA22 D14. The deconvolved velocity width is
given by the equation,
σv = c
√
(FWHMobs)2 − (FWHMinstr)2
2.354λobs, (1)
where c is the velocity of light. We find that σv is consistent with ∼ 55 ± 8.5 km s−1 for both
serendipitous objects assuming the sources fill the slitlet (see Table 1). For unresolved sources,
perhaps more appropriate for the small angular extent of these sources, σv ∼< 95 km s−1. Bear in
mind, however, that these values refer to the kinematics of the circum-galactic H I cloud, rather
than stellar velocity dispersion, which will be less (see related discussion in §5).

– 8 –
3.2. Lyα Equivalent Widths
The measured continua for the serendipitously-identified Lyα-emitters were consistent with
zero counts, confirming the visual impression of ser-1 and ser-2 seen in Figs. 1 and 3. Therefore,
direct spectroscopic measure of the line equivalent widths is not possible. We can, however, deter-
mine lower limits on the equivalent widths using the 1σ uncertainty of the continua. The Poisson
noise is the square root of the photon counts per pixel, and we denote its average per pixel by
σpix. The summed noise in a aperture of width w and length l is σpix
√wl. We have l different
approximations of the value of the continuum, so the noise in the continuum σcont is,
σcont = σpix
√
w
l. (2)
However, w is not a free parameter, but must be chosen so as to maximize the S/N . Since our
sources are small, we assume their undetected continua have a Gaussian shape along a spatial cut,
and that their FWHM is the same as the seeing (∼ 0.′′78). For the Lyα line, this would imply a
source of zero intrinsic extension. But since the FWHM of the continuum is probably significantly
less than that of the Lyα line, as we found with SSA22 C17 (§3.1), it may in fact be a slight
over-estimation of the continuum FWHM. We find the S/N ratio is maximized when w = 1.165×FWHM. For l we chose 100 pixels (∼ 126 A). Then,
W obsλ (2σ) ∼>
jα
2σcont. (3)
For the 1 σ continuum uncertainties, σcont ≃ 1.7(1.4) × 10−20 ergs cm−2 s−1 A−1
for ser-1 (ser-2).
We find the 2σ lower-limits on the observed equivalent widths are W obsλ ≥ 550 A (ser-1), and ≥ 470
A (ser-2). The rest-frame values are tabulated in Table 1. Considering the apparent absence of N V
λ1240 and C IV λ1549 and the low ISM velocity dispersion of these sources, the data is consistent
with stellar sources, and only marginally with a possible weak AGN. We discuss this further in §4.SSA22 C17 has measured W obs
λ ≃ 35.6 A.
3.3. Star Formation Rates
Assuming the Lyα line flux is powered by star formation, the strength of this line can be used
to infer a star formation rate for a young galaxy. We first estimate the Hα luminosity corresponding
to the measured Lyα luminsity: the low-density case B ratio Lyα/Hβ is approximately 25 in the
absence of dust (Ferland & Osterbrock 1985), while Hα/Hβ ∼ 2.8 for hot stars (T ≃ 1.2 × 10⁴ K;
Osterbrock 1989). Kennicutt (1983) provides the conversion from Hα luminosity to the SFR,
resulting in a SFR – LLyα relation of M (M⊙ yr−1) ≃ 10−42LLyα ( ergs s−1). This results in SFRs
of ∼ 1.3/1.2 M⊙ yr−1 for ser-1/ser-2, respectively. Because of the possibility of dust, or incomplete
absorption of ionizing radiation by the gaseous halo, these numbers are lower limits. We believe slit
losses are minimal as the lines are nearly unresolved and do not fill the slit. Line fluxes from two

– 9 –
other nights of observations support this conclusion. The continuum flux of the LBG SSA22 C17
at 1500 A was used to determine the SFR of M = 27.7 M⊙ yr−1 (Madau et al. 1998), based on
a Salpeter IMF with mass range 0.1 ≤ M/M⊙ ≤ 125. However, based on the synthetic spectra of
Leitherer et al. (1995), with a continuous SFR at ∼ 10 Myr of age, the SFR is ∼ 1.6 times larger, or
∼ 45 M⊙ yr−1. We expect that the true value is somewhere in between. The Lyα line luminosity
of C17 (Table 1) would imply a SFR of 2.2 M⊙ yr.
3.4. Projected Photometric Magnitudes
We use the spectral slope of a 107 year old starburst with a rest equivalent width of 150 A(Charlot
& Fall 1993) to calculate the expected continua of ser-1 and ser-2. We would thus expect continuum
magnitudes of V = 27.8/28.0 for ser-1/ser-2, or V = 27.4/27.7 when the Lyα line is in included.
The 2σ upper limits on the continua of ser-1 and ser-2 (§3.2) are only ∼ 30% greater than the
continua implied by Wrestλ = 150 A.
4. Discussion
What is the physical origin of these isolated, high equivalent width emission lines? N V λ1240
or C IV λ1549 are not found in the spectra of ser-1 or ser-2. The ratio of the high-ionization line
flux relative to Lyα is ∼< 1/15 and ∼< 1/20 for N V λ1240 and C IV λ1549, respectively, significantly
less than ratios measured from composite AGN spectra (e.g., Stern et al. 1999). The small velocity
dispersions of ser-1 and ser-2 (σv ≃ 60 km s−1) and the lack of associated N V λ1240 or C IV λ1549
emission argue against the presence of an AGN, while the high surface brightness is inconsistent
with photoionization by the metagalactic flux (e.g., Bunker et al. 1998). Thus we assume the lines
owe their existence to stellar sources. Below we argue that the galaxies are primeval, and attempt
to fit them into a cogent picture of the evolving Universe at z ≃ 3.
4.1. The Production of High Equivalent Width Lyα Emission
The production of a strong Lyα line requires two things: first there must be a large column
of neutral hydrogen which can intercept almost all photons with λ ≤ 912 A, and second, Lyα
radiation must escape the cloud. The large cross section of H I for Lyα photons makes Lyα
extremely vulnerable to dust quenching. We consider the scenario of Tenorio-Tagle et al. (1999)
in some detail as one model of the early phases of a starbursting protogalaxy. Tenorio-Tagle
et al. (1999) suggest that after an initial stellar ionization of dynamically quasi-relaxed gas and
attendant high equivalent width “pure” Lyα emission (i.e., a symmetric line profile), enriched stellar
winds sweep up gas. The compressed gas recombines, forming a shell of neutral gas which absorbs
emerging Lyman continuum radiation. Lyα radiation is then emitted and scattered within the shell.

– 10 –
The expansion of the compressed shell of gas results in the preferential scattering, and probable
absorption, of the blue-wing of the Lyα line. The LBG SSA22 C17 (Figs. 1, 3) is a good example
of this common feature of LBGs; in the insert we see a trough with center ∼ 350 km s−1 blueward
of the line center, while at ∼ 650 km s−1 we see a second maximum. Here, perhaps, is palpable
proof of a strong wind and a neutral shell, with the blueward emission line probably caused by the
recombination of shocked gas associated with the expanding shell (Tenorio-Tagle et al. 1999). In
this scenario, the time scale for high equivalent width Lyα line emission must be only modestly
greater than the lifetime of the most massive stars (at most ∼ 107 yr).
This model is based upon a single, central starburst driving the Lyα emission — an assumption
which may not generally hold in real galaxies. High-resolution VLA/optical observations of five local
star-forming blue compact dwarfs reveal a history of spatially distinct star forming regions in various
stages of evolution (van Zee et al. 1998). Perhaps new star-forming regions in the same galaxy could
display high equivalent width Lyα emission. This effect appears to be seen in a z = 4.04 lensed
galaxy whose star formation regions are subjected to a detailed lensing chromatography study by
Bunker et al. (2000). Their color analysis shows a sequence of non-coeval star formation sites with
ages ranging from zero to ∼ 100 Myr. “Nodes” of star formation, showing Lyα in absorption,
have spectral energy distributions consistent with a burst age of 20 − 30 Myr. There is, however,
an outlying region of very high equivalent width Lyα emission (W restλ > 100 A, 3σ) thought to
be resonantly-scattered Lyα photons escaping from the adjacent star-forming node. Yet summed
over the whole galaxy (as we would see it without the benefit of gravitational lensing), the Lyα
equivalent width is modest.
We therefore suggest that, for apertures containing entire young and compact galaxies, high
equivalent width stellar Lyα emission (W restλ ∼> 100 A) indicates a primeval or near-primeval galaxy.
We conclude that it is very likely that ser-1 and ser-2 are primeval galaxies — by which we mean
they are undergoing their first significant burst of star formation.
4.2. The Surface Density of High-Redshift Lyα-Emitters
How do ser-1 and ser-2 fit within the context of surveys of star forming galaxies at high
redshift? The luminosity function (LF) of galaxies at high redshift is a useful comparative tool for
our purposes. Steidel et al. (1999) find a steep faint-end slope (α ≃ −1.6) for the observed R-band
LF of star-forming galaxies at 〈z〉 ≃ 3.04, implying that a large fraction of the UV luminosity density
is produced by galaxies fainter than the spectroscopic limits of current Earth-based photometric
surveys. By virtue of the association of UV luminosity with SFR, this implies that a large fraction
of the star formation history is unobserved. When integrated to the apparent magnitudes expected
of the continua our serendipitous emission-line galaxies (R ≃ 28 mag), their UV luminosity function
implies number densities ∼ 20 times, and integrated star formation density ∼ 4 times, higher than
the classical LBGs integrated to the completeness limits of their ground-based survey, R = 25 mag.

– 11 –
As we have noted, because the Lyα emission lines of such sources as our serendipitous objects
are likely to be observable only for a very small fraction of 1 Gyr, the modest numbers of high
equivalent width Lyα sources are tangible evidence for this many-fold larger population of slightly
older, faint continuum, star forming galaxies with self-absorbed Lyα inaccessible to even the deepest
spectroscopic or color selection surveys. If we are to believe that high equivalent width Lyα can
only be exhibited for the first ∼ 5 × 10⁷ yr of a galaxy’s life, and that their surface density is
∼ 3 arcmin−2 per unit redshift, then if their distribution is uniform between 3 ≤ z ≤ 4, there must
be ∼ 30 (50) galaxies (Ω = 1 (0.1)) per square arcminute formed in that interval. This follows
because there are 10 (17) intervals of 5 × 10⁷ yr between z = 3 and z = 4. The surface density of
newly formed galaxies would thus be ∼ 30 times larger than the LBG surface density. One must
integrate the UVLF to R = 28.5 to achieve that surface density. Thus, available surface density
estimates of primeval (high equivalent width Lyα emission) galaxies are consistent with the claim
that most galaxies at z ≃ 3 were formed at redshifts less than z = 4. However, the integration
of the z ∼ 4 LF (Steidel et al. 1999) over luminosity limits identical to that at z = 3 shows that
the implied co-moving number densities increase only slightly for Ω in the range of 0.1 ≤ Ω ≤ 1.0,
apparently consistent with very low net galaxy formation. These two lines of research could be
consistent if the merger rate was nearly equal to the galaxy formation rate. There is evidence that
the epoch-dependent merger rate was higher in the past by (1+z)m with m ∼ 1.5−3.0 (Windhorst
et al. 1999), and that mergers were more frequent for the sub-L∗ galaxies. However, determining
the size-dependent merger rate that would be needed to leave the shape of the luminosity function
unchanged while producing only a very modest increase in comoving galaxy density, is beyond the
scope of this paper.
4.3. Environment
The environment of high equivalent width Lyα-emitters is of considerable interest. In their
study of Lyman-break candidates in the SSA22 field, Steidel et al. (1998) display convincing ev-
idence for redshift “spikes” at 〈z〉 = 3.09, and 〈z〉 = 3.35. Ser-1 lies ∼ 5000 km s−1 from the
former enhancement, a structure which they suggest is a proto-Abell cluster. The latter redshift
spike, which is substantially less massive than the former, contains a quasar (SSA22 D14). Ser-2
is only ∼ 190(320)h−150 kpc (projected), for Ω = 1 (0.1), and ∼< 200 km s−1 distant from the quasar,
while both are on order 400 km s−1 beyond the apparent center of the redshift spike4. We note
that the serendipitously-identified high equivalent width Lyα line, SSA22-S1 (Steidel et al. 1998)
at z = 3.100, is ∼ 750 km s−1 from the 〈z〉 = 3.09 enhancement. Thus, this limited amount of
data suggests that high equivalent width Lyα emitters tend to be loosely associated with density
enhancements some of which may be protoclusters. Similar clustering of Lyα emitters is seen in
4We modeled the effect of the quasar on ser-2 by extending the observed continuum blueward of the Lyα line.
The extrapolated photon flux is such that its excitation of gas around ser-2 could account for at most ∼ 3% of the
Lyα emission of ser-2.

– 12 –
studies at z ≃ 2.4 (Keel et al. 1999).
5. A Primeval Galaxy Model
In a speculative vein, we now consider what we have learned of primeval galaxies in the light
of observations, and the modeling of associated phenomena. Our purpose is to emphasize the
significance of the above results to the wider field of cosmology. Our study suggests the existence
of a high volume density of tiny galaxies with high specific SFRs, which may cumulatively have
rivaled that of the LBGs. We seek here to provide a galaxy formation scenario in which this is
plausible, and to place this scenario in the larger context of the evolution of the universe.
In response to the very small effective radii of faint galaxies imaged by HST (e.g., Giavalisco
et al. 1996b; Pascarelle et al. 1998), it has been shown that an “inside-out” galaxy formation
scenario may produce galaxies with small scale-lengths (Bouwens et al. 1997; Cayon et al. 1996).
A theoretical framework for this hypothesis is presented in a paper by Lin & Murray (1992), which
seeks to model primeval galaxies using two alternative hypotheses of protogalactic clouds. In these
models, robust self–regulating star formation occurs at a rate inversely proportional to the cooling
time for hydrogen number densities greater than nc ∼ 4 cm−3. Their model A is a homogeneous
cloud which collapses uniformly; the critical density is first reached at a size Rc ≃ 6M1/311 kpc, where
M11 is the galaxy mass in units of 1011 M⊙, creating a star-forming region whose size is inconsistent
with observations of either ser-1 or ser-2. Model B is an isothermal cloud with a core of 500 pc,
which collapses in an inside–out manner according to the Shu (1977) self-similar collapse model, and
reaches the density nc at Rc ≃ 1M1/211 R
−1/2100 kpc , where R100 is the outer radius of the cloud in units
of 100 kpc. Model B predicts sizes that are very close to the constrained sizes of our serendipitous
emission line regions, and makes their comparison with the model appear quite promising. It
also predicts that protogalaxies will have a relatively constant bolometric luminosity for a period
of ∼ 1.7 Gyr. In their published simulation, the bolometric luminosity logL ∼ 43.5 (erg s−1),
though the scale-free nature of isothermal spheres could be expected to allow the somewhat more
modest luminosities observed here. We shall see that this luminosity is consistent with a SFR of
∼ 5.7 M⊙ yr−1.
An isothermal cloud which is bounded by an external medium of pressure Pext may achieve a hy-
drostatic equilibrium if the ratio of the external to the internal pressure is less than 14.3 (Shu 1977).
This cloud, known as a Bonnor-Ebert sphere, has a just-critical mass Mcrit ≃ 0.8a4G−3/2P−1/2ext ,
where a is the sound speed. This mass may be consistent with galactic masses when the intergalac-
tic pressure is modest (i.e., Pext ∼< 1×10⁻¹⁹dyne cm−2). Such a sphere would become super-critical,
and collapse from the inside out if it were part of a general over-density which had pulled away
from the Hubble flow and begun to collapse. Linear theory shows that the turn-around radius
moves outward at a rate of ∼half the Hubble flow (Davis et al. 1980), so that we could expect
the location of high equivalent width Lyα emission to be somewhat within the turn-around radius,
and to move outward with time. A more extensive discussion of this subject will be reserved for a

– 13 –
future publication.
In order to link the model with observations, we made a rough simulation of a galaxy under-
going a constant SFR over a period of up to 1 Gyr. We used a Salpeter IMF (α = −2.35) with
lower mass limit of 0.1 M⊙, and main sequence lifetimes and luminosities (Tables 3-6 and 3-9)
from Mihalas & Binney (1981), modeling them as black bodies, which is sufficiently accurate for
metal-free, non-evolved stars. Unless otherwise stated, our upper mass limit is 125 M⊙, and we
assume that the SFR is 1.2 M⊙ yr−1. The Lyα photon emission rate of a primeval galaxy is taken
to be 2/3 of the stellar emission of photons more energetic than 13.6 eV, according to the case B
recombination (Spitzer 1978). We assume that 80% of all newly introduced gas (i.e., over and above
the ∼ 107 M⊙ of gas of density nc within the central 500 pc) is transformed into stars immediately.
The continuum measured in the 75 A region around the Lyα emission line, together with
the Lyα luminosity, is used to calculate the equivalent width. We tested the derived equivalent
widths against the dust-free calculations of Charlot & Fall (1993) for continuous star formation
and upper mass limits of 80 and 120 M⊙, and found values that were quite consistent with values
attained by interpolating between the bracketing Salpeter slopes which they employed. We find
that for a 10 Myr old galaxy, W restλ = 160/200/250A respectively for 80/100/120 M⊙ upper limits.
These derived values drop to ∼ 125/155/200A by 100 Myr. The relation of the resulting Lyα
line luminosity to the SFR is in agreement with the case B predictions. The model predicts a
continuum in the observed visual band of ∼ 1.3× 10⁻²⁰ ergs cm−2 s−1 A−1
for a z = 3 galaxy with
M = 1.2 M⊙ yr−1. This is within the 1σ non-detection limits of the continua of ser-1 and ser-2
(1.7/1.4 × 10−20 ergs cm−2 s−1 A−1
).
For an upper mass limit of 100 M⊙, and M = 1.0 M⊙ yr−1, the bolometric luminosity at
10 Myr is ∼ 5.5 × 1042 ergs s−1. Thus, the luminosity of the Lin & Murray (1992) model B
corresponds to M ≃ 5.7 M⊙ yr−1. We calculate the mass to bolometric luminosity ratio of our
model by adding the mass in stars and dissipated gas, dividing it by the luminosity. The dark
matter does not participate in the cloud’s collapse since it is not pressure supported. It will be
compressed somewhat by the gradually increasing concentration of baryons in the center, however,
on the whole, the DM halo should have little effect on the velocity dispersion of stars formed out
of dissipated gas in the first few tens of Myr since they are formed well within the core of the
isothermal sphere. We find that the calculated M/L ≃ 0.01, 0.05, and 0.37 for log t = 7, 8, and 9
(Gyr) respectively. We note that compact narrow emission line galaxies, which appear to be likely
lower-redshift counterparts, have mass-to-luminosity ratios, M/L ≈ 0.1 (Phillips et al. 1997).
The expected stellar velocity dispersion, σs =√
GMstars+gas/r, implies dispersions of model
galaxies of from ∼ 14 / 37 / , and 110 km s−1 for log t = 7, 8, and 9 (yr), assuming a radius of 500
pc. The low σs for the 10 Myr old galaxy is actually reasonable, in view of the finding that the very
large cluster in the blue compact dwarf NGC 1705 (Ho & Filippenko 1996) has σs ∼ 11 km s−1. A
low σs is also not in conflict with our deconvolved velocity dispersions of σv ∼ 60 km s−1 (§3.1)since the latter is a measure of both the turbulence of gas (from infall and stellar winds) which give

– 14 –
rise to the Lyα resonance line, as well as the possibly spatially resolved structure within the slitlet.
On the basis of the observed σv and deconvolved radius r of the LBG C17 (Table 1), we find that
the galaxy mass is MLBG = 4.3 × 10⁹ M⊙. This galaxy would take ∼1.2 Gyr to form at the SFR
derived for ser-1 or ser-2. However, between z = 3.5 and z = 3.0, there are only 0.265/0.473 Gyr
for Ω = 1.0/0.1. Thus, LBGs would not be formed in a reasonable amount of time from low-SFR
objects if SFRs remain constant. Below, we consider the possibility that the SFR may increase
with time
Our simple galaxy model has assumed that M is constant. However, a realistic isothermal
sphere will have a baryonic core, assumed here to be ∼ 500 pc. In this case case the infall rate
will not be constant in time, but given a sound speed of 10 km s−1, may increase during the first
∼ 5 × 10⁷ yr. In addition, the negligible metallicity expected of primordial gas will make cooling
times, and the Jeans mass, larger5 during the first few tens of Myr of a galaxy’s life. Thus the effect
of metals ejected from evolved stars in aiding cooling, and of dust in catalyzing the production of
molecules, is to compound the effect of increasing infall; the SFR and its efficiency can be expected
to rise substantially by a few tens of Myr.
On the other hand, recall that the high equivalent width of the Lyα emission line of primeval
galaxies is expected to be quenched over essentially the same time scale. This means that the
nature, and fate of these pre-LBG/post-primeval galaxies will be very difficult to learn. With an
ernhanced SFR, the post-primeval galaxies could plausibly grow by a factor of 10-40 into LBGs
in a few tenths of a Gyr or, by virtue of competition from neighbors, have their growth truncated
while still in the dwarf stage, or even be cannibalized; environment may have a dominant role to
play.
While the mass and SFRs of our purportedly primeval galaxies are much smaller than that
of LBGs, the specific SFR of the former is on average 10 or 20 times greater than the latter.
The large numbers of small, young galaxies which are thought to have been formed (§4.2) in the
interval 3 ∼< z ∼< 4 might thus be expected to provide a substantial fraction of the star formation
rate density. In fact, the steep faint end slope of the z ∼ 3 UV luminosity function of Steidel et al.
(1999) implies that up to 40% of the SFR density may be supplied by galaxies fainter than R = 27
(L ∼ 0.1) but brighter than the projected continuum magnitudes of our serendipitous sources.
In addition to the formation of a galactic bulge according to the Lin-Murray process, it is
expected to be accompanied by the formation of the halo, as infalling clumps of gas dissipatively
interact with the already accreted gas (Binney 1976; Manning 1999).
5It has been suggested (Lin & Murray 1992) that the IMF of primeval galaxies may be heavily weighted in
high-mass stars, which could result in rest Lyα equivalent widths significantly larger than 150 A. The truth of this
contention could be tested if spectroscopic observations deep enough to detect the continua were made.

– 15 –
6. Conclusions
We draw the following conclusions from this study:
• We suggest that the combination of high equivalent widths, low velocity dispersions, and
small intrinsic sizes seen in the Lyα lines of these two galaxies can be well-explained as
their being extremely low-metallicity galaxies undergoing an initial burst of star formation—
hence, primeval galaxies. These characteristics, markedly different from earlier expectations,
suggests an inside-out, rather than a monolithic collapse formation mechanism.
• Our data, which imply that most galaxies at z = 3 may have been formed at z ≤ 4, stand
in apparent conflict with the z = 3 and 4 UVLFs (Steidel et al. 1999), which suggest that
the comoving galactic density remained relatively constant during this interval. These may
be reconciled, however, with a large merger rate that preserves the faint-end slope of the
luminosity function.
• The agreement of the angular size, and the projected total luminosity of these emission line
galaxies, with the predictions of the inside-out collapse of a nearly-isothermal H I halo (Lin
& Murray 1992) suggests that the latter is a promising basis for modeling galaxy formation.
Our discussion has suggested that a rising star formation rate with a time-scale of ∼ 5× 10⁷
yr is plausible for many post-primeval galaxies.
• The isothermal collapse model requires that protogalactic clouds form in relatively isolated
regions. However, their collapse may be stimulated by the gradually increasing pressures of
a protocluster environment, thus accounting for the apparent weak clustering on large scales
noted of high-, as well as low-redshift Lyα emission line galaxies.
We thank C. Leitherer, and C. C. Steidel, for useful discussions. We are grateful to our
referee, Dr. R. A. Windhorst, for valuable suggestions. We also thank A. Dey for assistance with
the observations. We are grateful for the support of NSF grant AST 95-28536.
References
Binney, J. 1976, MNRAS, 177, 19
Bouwens, R. J., Cayon, L., & Silk, J. 1997, ApJ, 489, L21
Bunker, A. J., Marleau, F. R., & Graham, J. R. 1998, AJ, 116, 2086
Bunker, A. J., Moustakas, L. A., & Davis, M. 2000, ApJ, in press
Cayon, L., Silk, J., & Charlot, S. 1996, ApJ, 467, L53

– 16 –
Charlot, S. & Fall, S. M. 1993, ApJ, 451, 580
Cowie, L. & Hu, E. M. 1998, AJ, 115, 1319
Davis, M., Tonry, J., Huchra, J., & Latham, D. W. 1980, ApJ, 238, L113
Dey, A., Spinrad, H., Stern, D., Graham, J. R., & Chaffee, F. 1998, ApJ, 498, L93
Ferland, G. J. & Osterbrock, D. E. 1985, ApJ, 289, 105
Giavalisco, M., Koratkar, A., & Calzetti, D. 1996a, ApJ, 466, 831
Giavalisco, M., Steidel, C. C., & Macchetto, D. 1996b, ApJ, 470, 189
Ho, L. C. & Filippenko, A. V. 1996, ApJ, 472, 600
Hu, E. M., Cowie, L. L., & McMahon, R. G. 1998, ApJ, 502, 99
Hu, E. M., McMahon, R. G., & Cowie, L. L. 1999, ApJ, 522, 9
Keel, W. C., Cohen, S. H., Windhorst, R. A., & Waddington, I. 1999, AJ, 118, 2547
Kennicutt, R. 1983, ApJ, 282, 54
—. 1992, ApJ, 388, 310
Kunth, D., Mas-Hesse, J. M., Terlevich, E., Terlevich, R., & Fall, S. M. 1998a, A&A, 334, 11
Kunth, D., Terlevich, E., Terlevich, R., & Tenorio-Tagle, G. 1998b, in Dwarf Galaxies and Cos-
mology, ed. T. X. Thuan (Gif-sur-Yvette: Editions Frontieres), in press
Legrand, F., Kunth, D. F., Mas-Hesse, J. M., & Lequeus, J. 1997, A&A, 326, 929
Leitherer, C., Carmelle, R., & Heckman, T. M. 1995, ApJS, 99, 173
Lin, D. N. C. & Murray, S. D. 1992, ApJ, 394, 523
Lowenthal, J. D. et al. 1997, ApJ, 481, 673
Madau, P., Pozzetti, L., & Dickinson, M. E. 1998, ApJ, 498, 106
Manning, C. 1999, ApJ, 518, 226
Massey, P. & Gronwall, C. 1990, ApJ, 358, 344
Mihalas, D. & Binney, J. 1981, Galactic Astronomy (San Francisco: W. H. Freeman and Company)
Oke, J. B. et al. 1995, PASP, 107, 375
Osterbrock, D. 1989, The Astrophysics of Gaseous Nebulae and Active Galactic Nuclei (Mill Valley:
Univ. Science Books)

– 17 –
Pascarelle, S. M., Windhorst, R. A., & Keel, W. C. 1998, AJ, 116, 2659
Pascarelle, S. M., Windhorst, R. A., Keel, W. C., & Odewahn, S. C. 1996, Nature, 383, 45
Phillips, A. C., Guzman, R., Gallego, J., Koo, D. C., Lowenthal, J. D., Vogt, N. P., Faber, S. M.,
& Illingworth, G. D. 1997, ApJ, 489, 543
Pritchet, C. J. 1994, PASP, 106, 1052
Shu, F. H. 1977, ApJ, 214, 488
Spitzer, L. 1978, Physical Processes in the Interstellar Medium (New Work: Wiley)
Steidel, C. S., Adelberger, K. L., Dickinson, M., Giavalisco, M., Pettini, M., & Kellogg, M. 1998,
ApJ, 492, 428
Steidel, C. S., Adelberger, K. L., Giavalisco, M., Dickinson, M., & Pettini, M. 1999, ApJ, 519, 1
Steidel, C. S., Giavalisco, M., Dickinson, M., & Adelberger, K. L. 1996, AJ, 112, 352
Steidel, C. S. & Hamilton, D. 1992, AJ, 104, 941
Stern, D., Bunker, A. J., Spinrad, H., & Dey, A. 2000, ApJ, in press
Stern, D., Dey, A., Spinrad, H., Maxfield, L. M., Dickinson, M. E., Schlegel, D., & Gonzalez, R. A.
1999, AJ, 117, 1122
Stockton, A. & Ridgway, S. E. 1998, AJ, 115, 1340
Tenorio-Tagle, G., Silich, S. A., Kunth, D., Terlevich, E., & Terlevich, R. 1999, MNRAS, 309, 332
Terlevich, E., Diaz, A. I., Terlevich, R., & Garcia, M. L. 1993, MNRAS, 260, 3
Thompson, D. & Djorgovski, S. G. 1995, AJ, 110, 982
van Zee, L., Skillman, E. D., & Salzer, J. J. 1998, AJ, 110, 963
Weymann, R., Stern, D., Bunker, A. J., Spinrad, H., Chaffee, F., Thompson, R., & Storrie-
Lombardi, L. 1998, ApJ, 505, L95
Windhorst, R. A., Cohen, S. H., & Waddington, I. 1999, in After the Dark Ages: When Galaxies
were Young, ed. S. S. Holt & E. P. Smith, Vol. 470 (New York: AIP), 202