a share monthly portfolio€¦ · stocks, one non-ferrous metal stock, one food and beverage stock,...
TRANSCRIPT

1
A-Share Monthly Portfolio
May 16, 2016
Rally pattern continuing; focus on small cap with
growth potential
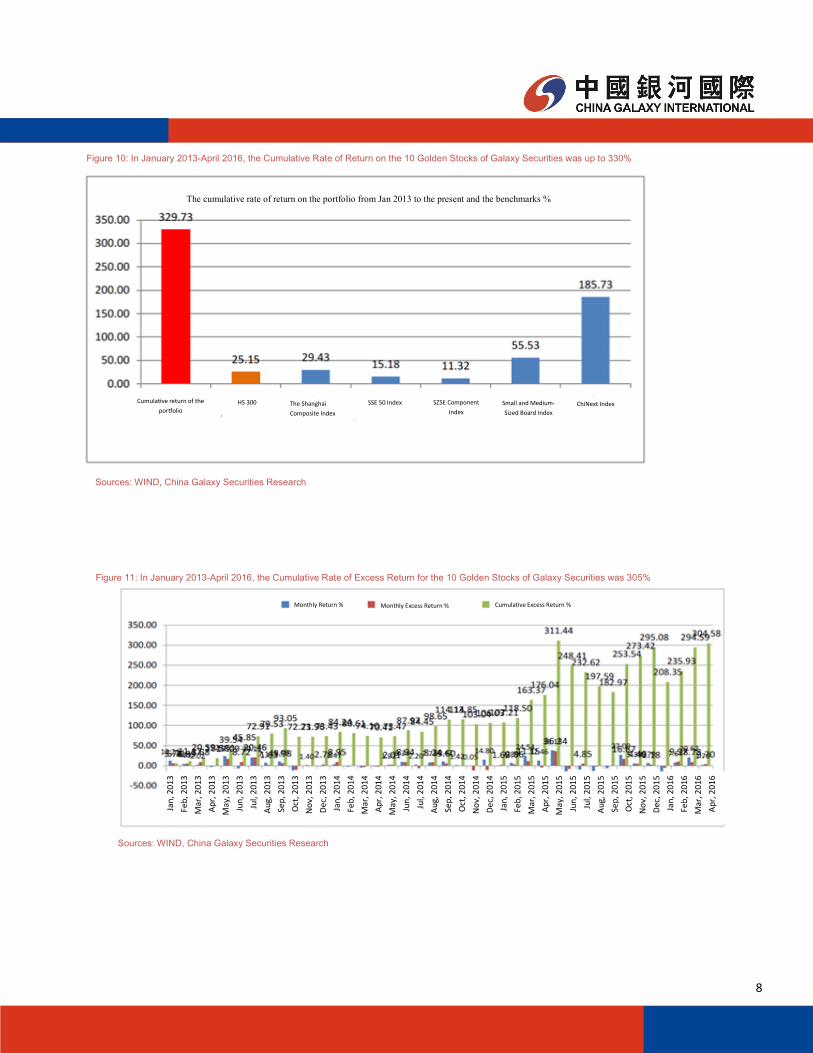
The rate of return in April 2016 for the portfolio of the 10 golden stocks of Galaxy
Securities was 1.79%, 3.7ppt higher than CSI 300 Index. In January-April 2016, the
cumulative return on the monthly portfolio of Galaxy Securities was -3%, 12.4ppt higher
than CSI 300 Index. From January 2013 to now, the cumulative monthly return has
been 330%, significantly higher than the 305% return of the CSI 300 Index and
significantly higher than the 186% return of the ChiNext Index.
Outlook for May: Expectations of a FED increase in the interest rate are very low, and
the RMB exchange rate is expected to remain relatively stable. The fundamentals of
domestic economic policies will be the dominant factors affecting market trend, and it is
expected that the economy in Q2 will continue to stabilize, and that financial and
monetary policies will remain unchanged in general or see only minor fine-tuning. It is
possible for liquidity to be affected, and special care should be paid to changes in credit
risk. Capital markets place particular importance on the building of major institutions,
and the central government pays close attention to the healthy development of the stock
market. Generally, it is possible for the rally pattern to continue in May.
The prices of consumer goods continue to rise, as do high-quality growth stocks.
Cyclical products with sound fundamentals deserve attention, focusing mainly on
medium and small caps.
Our May portfolio includes one petrochemical stock, two machinery and military industry
stocks, one non-ferrous metal stock, one food and beverage stock, one construction
stock, one electrical equipment and new energy stock, one electronics stock, and one
computer stock.
Our stock portfolio for May (in no particular order) is as follows: Geo-Jade Petroleum
(600759.CH), Longhua Energy-saving (300263.CH), Anhui Zhongding (000887.CH),
Chenming Paper (000488.CH), Hengshun Zhongsheng (300208.CH), Shuanghui
Development (000895.CH), Arts Group (603017.CH), Pinggao Electric (600312.CH),
DMEGC (002056.CH), Conant (300061.CH).
Yang Huachao — Chief Analyst of Small-
and Mid-cap Stocks
(8621) 20252681
yanghuachao @chinastock.com.cn
Practicing Certificate No.: S0130512050003
Sun Jianbo — Doctor, Chief Strategy Ana-
(8610) 83571306
sunjianbo @chinastock.com.cn
Practicing Certificate No.: S0130511040002
Qin Xiaobin — Strategy Analyst Director
(8610)6656 8746
Practicing Certificate No.: S0130511030001
Wong Chi Man—Head of Research
(852) 3698-6317
Sources: China Galaxy Securities Research
Figure 1: Portfolio of May for Galaxy Securities (Note: share prices are the closing prices on May 16, 2016)
Stock
Code
Stock Discription EPS (RMB) PE (X)
2014A 2015A 2016E 2017E 2014A 2015A 2016E 2017E
600759.SH Geo-Jade Petroleum 0.02 0.03 0.06 0.34 393.0 262.0 131.0 23.1
300263.SZ Longhua Energy-saving 0.33 0.40 0.50 0.62 47.6 39.3 31.4 25.3
000887.SZ Anhui Zhongding 0.47 0.76 1.05 1.33 44.1 27.3 19.7 15.6
000488.SZ Chenming Paper 0.26 0.53 1.02 1.37 32.0 15.7 8.2 6.1
000895.SZ Shuanghui Development 1.84 1.29 1.35 1.48 11.6 16.6 15.9 14.5
603017.SH Arts Group 0.75 0.55 1.04 1.31 44.6 60.8 32.2 25.5
600312.SH Pinggao Electric 0.61 0.73 0.86 1.02 23.3 19.5 16.5 13.9
002056.SZ DMEGC 0.93 0.79 1.02 1.29 14.8 17.4 13.5 10.7
300208.SZ Hengshun Zhongsheng 0.15 0.42 0.70 1.26 92.1 32.9 19.7 11.0
300061.SZ Conant 0.24 0.21 0.48 0.66 120.3 137.4 60.1 43.7
2
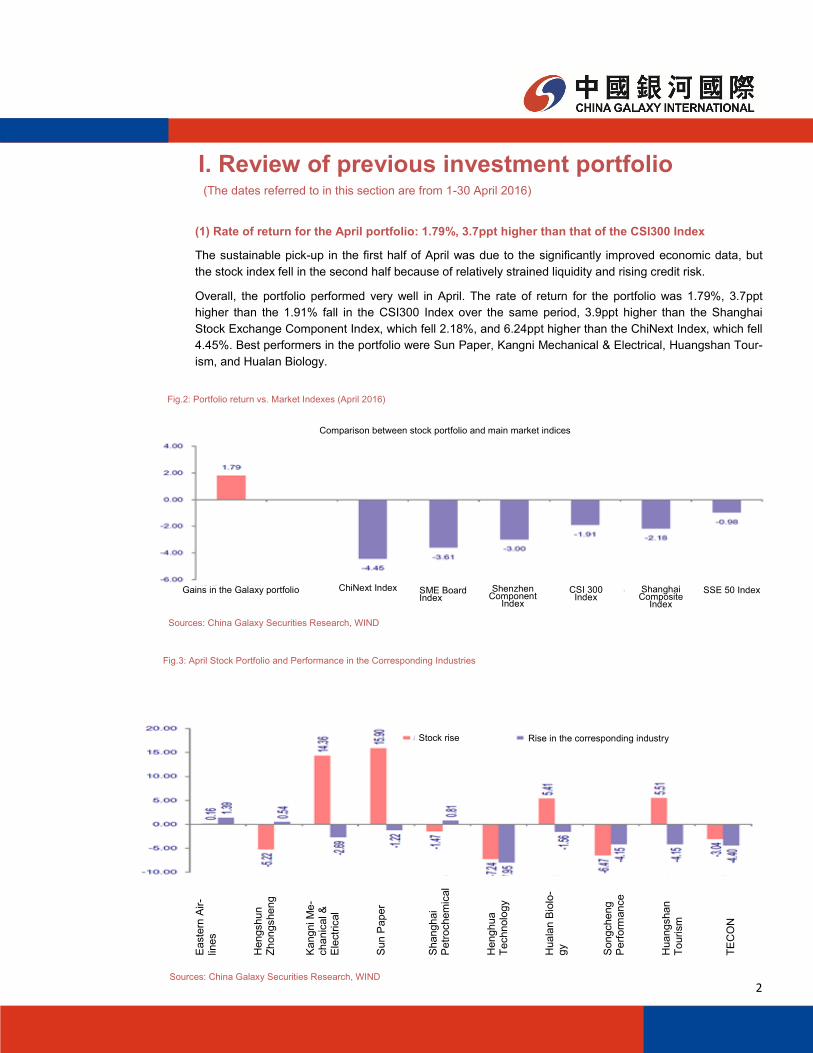
(1) Rate of return for the April portfolio: 1.79%, 3.7ppt higher than that of the CSI300 Index
The sustainable pick-up in the first half of April was due to the significantly improved economic data, but
the stock index fell in the second half because of relatively strained liquidity and rising credit risk.
Overall, the portfolio performed very well in April. The rate of return for the portfolio was 1.79%, 3.7ppt
higher than the 1.91% fall in the CSI300 Index over the same period, 3.9ppt higher than the Shanghai
Stock Exchange Component Index, which fell 2.18%, and 6.24ppt higher than the ChiNext Index, which fell
4.45%. Best performers in the portfolio were Sun Paper, Kangni Mechanical & Electrical, Huangshan Tour-
ism, and Hualan Biology.
I. Review of previous investment portfolio
Fig.2: Portfolio return vs. Market Indexes (April 2016)
Sources: China Galaxy Securities Research, WIND
Gains in the Galaxy portfolio
Stock rise Rise in the corresponding industry
Fig.3: April Stock Portfolio and Performance in the Corresponding Industries
Sources: China Galaxy Securities Research, WIND
Comparison between stock portfolio and main market indices
(The dates referred to in this section are from 1-30 April 2016)
Shenzhen Component
Index
ChiNext Index SME Board Index
CSI 300 Index
SSE 50 Index Shanghai Composite
Index
Easte
rn A
ir-
lines
Hengshun
Zh
ongsheng
Kangni M
e-
chanic
al &
E
lectr
ical
Sun P
aper
Shanghai
Petr
ochem
ical
Henghua
Te
chnolo
gy
Huala
n B
iolo
-gy
Songcheng
Perf
orm
ance
Huangshan
To
urism
TE
CO
N
3
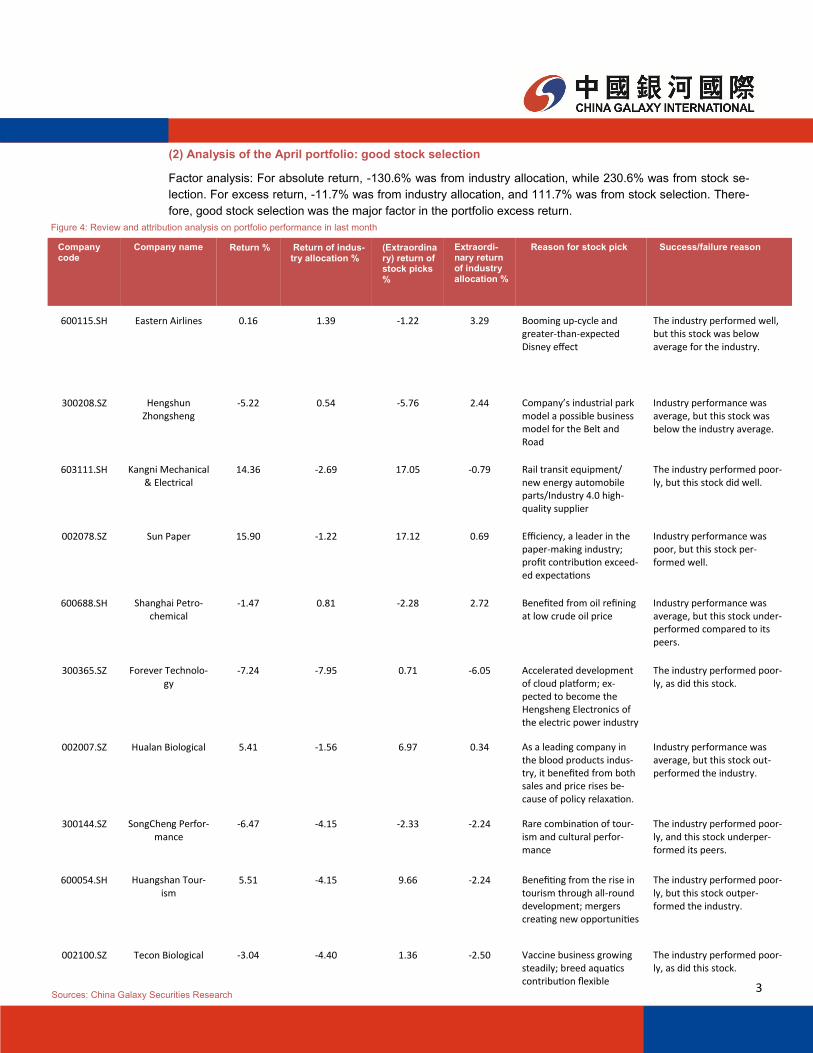
(2) Analysis of the April portfolio: good stock selection
Factor analysis: For absolute return, -130.6% was from industry allocation, while 230.6% was from stock se-
lection. For excess return, -11.7% was from industry allocation, and 111.7% was from stock selection. There-
fore, good stock selection was the major factor in the portfolio excess return.
Company code
Company name Return % Return of indus-try allocation %
(Extraordinary) return of stock picks %
Extraordi-nary return of industry allocation %
Reason for stock pick Success/failure reason
600115.SH Eastern Airlines 0.16 1.39 -1.22 3.29 Booming up-cycle and greater-than-expected Disney effect
The industry performed well, but this stock was below average for the industry.
300208.SZ Hengshun Zhongsheng
-5.22 0.54 -5.76 2.44 Company’s industrial park model a possible business model for the Belt and Road
Industry performance was average, but this stock was below the industry average.
603111.SH Kangni Mechanical & Electrical
14.36 -2.69 17.05 -0.79 Rail transit equipment/new energy automobile parts/Industry 4.0 high-quality supplier
The industry performed poor-ly, but this stock did well.
002078.SZ Sun Paper 15.90 -1.22 17.12 0.69 Efficiency, a leader in the paper-making industry; profit contribution exceed-ed expectations
Industry performance was poor, but this stock per-formed well.
600688.SH Shanghai Petro-chemical
-1.47 0.81 -2.28 2.72 Benefited from oil refining at low crude oil price
Industry performance was average, but this stock under-performed compared to its peers.
300365.SZ Forever Technolo-gy
-7.24 -7.95 0.71 -6.05 Accelerated development of cloud platform; ex-pected to become the Hengsheng Electronics of the electric power industry
The industry performed poor-ly, as did this stock.
002007.SZ Hualan Biological 5.41 -1.56 6.97 0.34 As a leading company in the blood products indus-try, it benefited from both sales and price rises be-cause of policy relaxation.
Industry performance was average, but this stock out-performed the industry.
300144.SZ SongCheng Perfor-mance
-6.47 -4.15 -2.33 -2.24 Rare combination of tour-ism and cultural perfor-mance
The industry performed poor-ly, and this stock underper-formed its peers.
600054.SH Huangshan Tour-ism
5.51 -4.15 9.66 -2.24 Benefiting from the rise in tourism through all-round development; mergers creating new opportunities
The industry performed poor-ly, but this stock outper-formed the industry.
002100.SZ Tecon Biological -3.04 -4.40 1.36 -2.50 Vaccine business growing steadily; breed aquatics contribution flexible
The industry performed poor-ly, as did this stock.
Sources: China Galaxy Securities Research
Figure 4: Review and attribution analysis on portfolio performance in last month

4
Composition of total return
1.79 -2.34 4.13
Contribution to total return
100% -130.6% 230.6%
Composition of excess earnings
3.70 4.13 -0.43
Contribution to
excess earnings 100% 111.7% -11.7%
Consumption, growth and cycle relatively balanced
Industry selection was poor; good stock selection produced excess earnings.
Company code
Company name Return % Return of indus-try allocation %
(Extraordinary) return of stock picks %
Extraordi-nary return of industry allocation %
Reason for stock pick Success/failure reason
Sources: China Galaxy Securities Research
Industries topping the list in terms of return were coal, food and beverage, banking, steel, petrochemicals
and nonferrous metals. Falling behind were media, computer, military, shipping and agriculture. Cyclical
stocks performed well; growth industries performed relatively poorly.
As for hot themes, the best performers were sub-new stocks. Relatively good performers included hydro-
power construction, military-civilian integration, rare earth permanent magnets and new energy vehicles.
Relatively poorly performing industries were mobile payment, network security, smart TV, Internet celebri-
ties and aircraft.
With respect to individual stocks, only 42 stocks achieved over 30% growth in April, most of which were sub
-new stocks. This significantly reduced the potential for investors to profit, and individual stocks were not
very active.

5
Name Change Name Change
Sub-new stock 60.17 Mobile payments -7.59
Water conservan-cy and hydro-power construc-tion
10.05 Network security -7.32
Military-civilian integration
9.10 Smart TV -7.00
New energy auto-mobiles
7.99 Internet celebrities -6.88
Rare-earth perma-nent magnets
7.33 Aircraft carriers -6.74
Lithium batteries 6.62 Credit investigation -6.67
Beautiful China 5.89 Satellite navigation -6.41
Placards 5.03 Cold chain logistics -6.28
Beijing-Tianjin-Hebei integration
4.59 Smart city -5.92
Beibu Bay Free Trade Zone
4.04 Third-party payment -5.91
Sources: WIND, China Galaxy Securities Research
Figure 6: The Best and the Worst 10 Concept Stocks in March
Figure 5: April 2016 Performance of All Industry Indexes (%)
Sources: WIND, China Galaxy Securities Research
Co
al
Foo
d a
nd
bev
erag
e
Ban
kin
g
Stee
l
Pet
role
um
an
d p
etro
chem
ical
s
No
nfe
rro
us
met
als
Ap
plia
nce
s
Au
tom
ob
iles
Co
ngl
om
erat
es
Co
mm
un
icati
on
Bas
ic c
hem
ical
s
Bu
ildin
g m
ater
ials
Ligh
t m
anu
fact
uri
ng
Rea
l est
ate
Elec
tric
al e
qu
ipm
ent
Med
icin
e
CSI
300
Ind
ex
Texti
les
and
gar
men
ts
Elec
tro
nic
co
mp
on
ents
Elec
tric
an
d u
tiliti
es
Co
mm
erci
al r
etai
ling
Mac
hin
ery
Arc
hit
ectu
re
No
n-b
ank
fin
anci
als
Cat
erin
g an
d t
ou
rism
Agr
icu
ltu
re a
nd
far
min
g
Tran
spo
rtati
on
Def
ence
Med
ia
Co
mp
ute
r
6
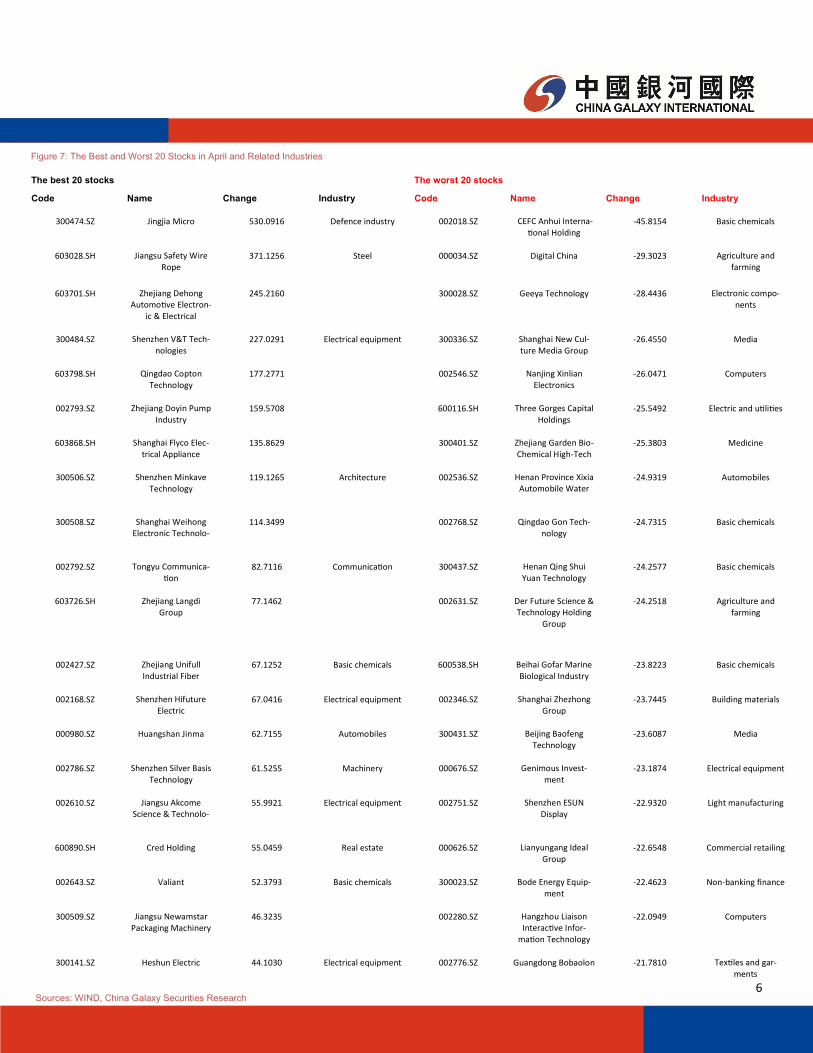
Code Name Change Industry Code Name Change Industry
300474.SZ Jingjia Micro 530.0916 Defence industry 002018.SZ CEFC Anhui Interna-tional Holding
-45.8154 Basic chemicals
603028.SH Jiangsu Safety Wire Rope
371.1256 Steel 000034.SZ Digital China -29.3023 Agriculture and farming
603701.SH Zhejiang Dehong Automotive Electron-
ic & Electrical
245.2160 300028.SZ Geeya Technology -28.4436 Electronic compo-nents
300484.SZ Shenzhen V&T Tech-nologies
227.0291 Electrical equipment 300336.SZ Shanghai New Cul-ture Media Group
-26.4550 Media
603798.SH Qingdao Copton Technology
177.2771 002546.SZ Nanjing Xinlian Electronics
-26.0471 Computers
002793.SZ Zhejiang Doyin Pump Industry
159.5708 600116.SH Three Gorges Capital Holdings
-25.5492 Electric and utilities
603868.SH Shanghai Flyco Elec-trical Appliance
135.8629 300401.SZ Zhejiang Garden Bio-Chemical High-Tech
-25.3803 Medicine
300506.SZ Shenzhen Minkave Technology
119.1265 Architecture 002536.SZ Henan Province Xixia Automobile Water
-24.9319 Automobiles
300508.SZ Shanghai Weihong Electronic Technolo-
114.3499 002768.SZ Qingdao Gon Tech-nology
-24.7315 Basic chemicals
002792.SZ Tongyu Communica-tion
82.7116 Communication 300437.SZ Henan Qing Shui Yuan Technology
-24.2577 Basic chemicals
603726.SH Zhejiang Langdi Group
77.1462 002631.SZ Der Future Science & Technology Holding
Group
-24.2518 Agriculture and farming
002427.SZ Zhejiang Unifull Industrial Fiber
67.1252 Basic chemicals 600538.SH Beihai Gofar Marine Biological Industry
-23.8223 Basic chemicals
002168.SZ Shenzhen Hifuture Electric
67.0416 Electrical equipment 002346.SZ Shanghai Zhezhong Group
-23.7445 Building materials
000980.SZ Huangshan Jinma 62.7155 Automobiles 300431.SZ Beijing Baofeng Technology
-23.6087 Media
002786.SZ Shenzhen Silver Basis Technology
61.5255 Machinery 000676.SZ Genimous Invest-ment
-23.1874 Electrical equipment
002610.SZ Jiangsu Akcome Science & Technolo-
55.9921 Electrical equipment 002751.SZ Shenzhen ESUN Display
-22.9320 Light manufacturing
600890.SH Cred Holding 55.0459 Real estate 000626.SZ Lianyungang Ideal Group
-22.6548 Commercial retailing
002643.SZ Valiant 52.3793 Basic chemicals 300023.SZ Bode Energy Equip-ment
-22.4623 Non-banking finance
300509.SZ Jiangsu Newamstar Packaging Machinery
46.3235 002280.SZ Hangzhou Liaison Interactive Infor-
mation Technology
-22.0949 Computers
300141.SZ Heshun Electric 44.1030 Electrical equipment 002776.SZ Guangdong Bobaolon -21.7810 Textiles and gar-ments
Sources: WIND, China Galaxy Securities Research
Figure 7: The Best and Worst 20 Stocks in April and Related Industries
The best 20 stocks The worst 20 stocks
7
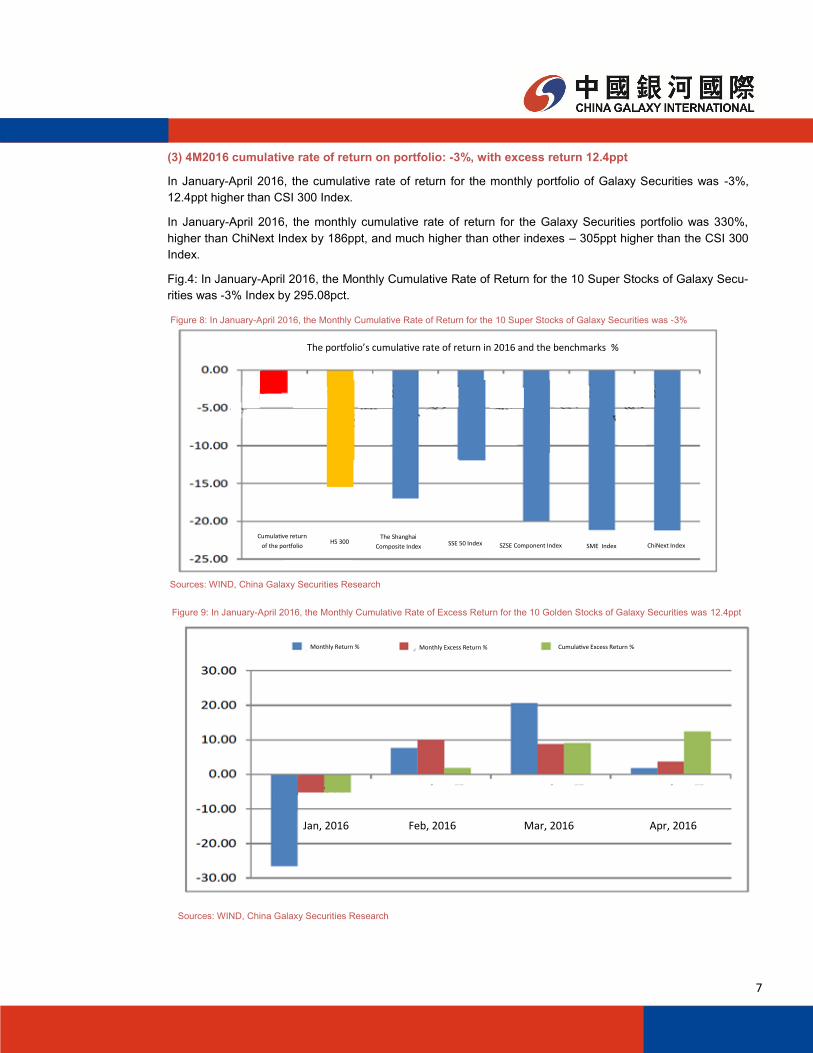
(3) 4M2016 cumulative rate of return on portfolio: -3%, with excess return 12.4ppt
In January-April 2016, the cumulative rate of return for the monthly portfolio of Galaxy Securities was -3%,
12.4ppt higher than CSI 300 Index.
In January-April 2016, the monthly cumulative rate of return for the Galaxy Securities portfolio was 330%,
higher than ChiNext Index by 186ppt, and much higher than other indexes – 305ppt higher than the CSI 300
Index.
Fig.4: In January-April 2016, the Monthly Cumulative Rate of Return for the 10 Super Stocks of Galaxy Secu-
rities was -3% Index by 295.08pct.
Cumulative return
of the portfolio
Sources: WIND, China Galaxy Securities Research
Figure 8: In January-April 2016, the Monthly Cumulative Rate of Return for the 10 Super Stocks of Galaxy Securities was -3%
Sources: WIND, China Galaxy Securities Research
Figure 9: In January-April 2016, the Monthly Cumulative Rate of Excess Return for the 10 Golden Stocks of Galaxy Securities was 12.4ppt
HS 300 The Shanghai
Composite Index SSE 50 Index SZSE Component Index ChiNext Index
The portfolio’s cumulative rate of return in 2016 and the benchmarks %
SME Index
Monthly Return % Monthly Excess Return % Cumulative Excess Return %
Jan, 2016 Feb, 2016 Mar, 2016 Apr, 2016
8
Sources: WIND, China Galaxy Securities Research
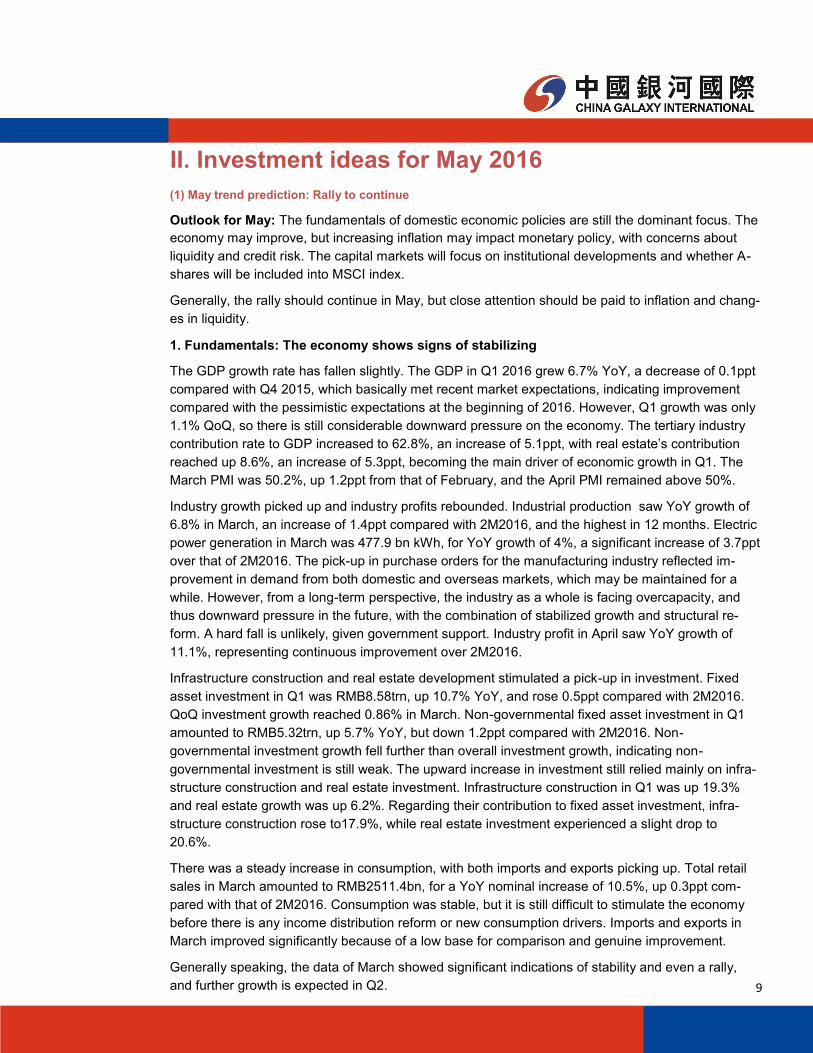
Figure 11: In January 2013-April 2016, the Cumulative Rate of Excess Return for the 10 Golden Stocks of Galaxy Securities was 305%
Jan
, 20
13
Feb
, 20
13
Mar
, 20
13
Ap
r, 2
013
May
, 20
13
Jun
, 201
3
Jul,
20
13
Au
g, 2
01
3
Sep
, 20
13
Oct
, 201
3
No
v, 2
01
3
Dec
, 20
13
Jan
, 20
14
Feb
, 20
14
Mar
, 20
14
Ap
r, 2
014
May
, 20
14
Jun
, 201
4
Jul,
20
14
Au
g, 2
01
4
Sep
, 20
14
Oct
, 201
4
No
v, 2
01
4
Dec
, 20
14
Jan
, 20
15
Feb
, 20
15
Mar
, 20
15
Ap
r, 2
015
May
, 20
15
Jun
, 201
5
Jul,
20
15
Au
g, 2
01
5
Sep
, 20
15
Oct
, 201
5
No
v, 2
01
5
Dec
, 20
15
Jan
, 20
16
Feb
, 20
16
Mar
, 20
16
Ap
r, 2
016
Monthly Return % Monthly Excess Return % Cumulative Excess Return %
Sources: WIND, China Galaxy Securities Research
Figure 10: In January 2013-April 2016, the Cumulative Rate of Return on the 10 Golden Stocks of Galaxy Securities was up to 330%
Cumulative return of the
portfolio HS 300 The Shanghai
Composite Index
SSE 50 Index SZSE Component
Index ChiNext Index
The cumulative rate of return on the portfolio from Jan 2013 to the present and the benchmarks %
Small and Medium-
Sized Board Index
9
(1) May trend prediction: Rally to continue
Outlook for May: The fundamentals of domestic economic policies are still the dominant focus. The
economy may improve, but increasing inflation may impact monetary policy, with concerns about
liquidity and credit risk. The capital markets will focus on institutional developments and whether A-
shares will be included into MSCI index.
Generally, the rally should continue in May, but close attention should be paid to inflation and chang-
es in liquidity.
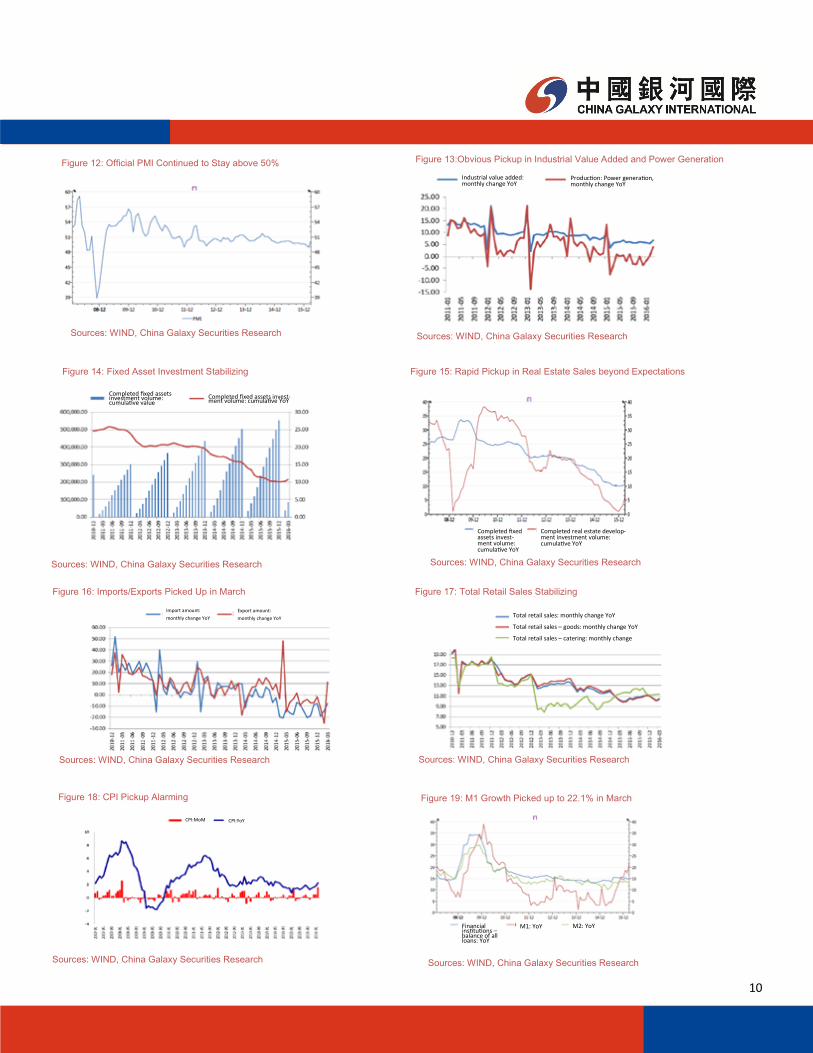
1. Fundamentals: The economy shows signs of stabilizing
The GDP growth rate has fallen slightly. The GDP in Q1 2016 grew 6.7% YoY, a decrease of 0.1ppt
compared with Q4 2015, which basically met recent market expectations, indicating improvement
compared with the pessimistic expectations at the beginning of 2016. However, Q1 growth was only
1.1% QoQ, so there is still considerable downward pressure on the economy. The tertiary industry
contribution rate to GDP increased to 62.8%, an increase of 5.1ppt, with real estate’s contribution
reached up 8.6%, an increase of 5.3ppt, becoming the main driver of economic growth in Q1. The
March PMI was 50.2%, up 1.2ppt from that of February, and the April PMI remained above 50%.
Industry growth picked up and industry profits rebounded. Industrial production saw YoY growth of
6.8% in March, an increase of 1.4ppt compared with 2M2016, and the highest in 12 months. Electric
power generation in March was 477.9 bn kWh, for YoY growth of 4%, a significant increase of 3.7ppt
over that of 2M2016. The pick-up in purchase orders for the manufacturing industry reflected im-
provement in demand from both domestic and overseas markets, which may be maintained for a
while. However, from a long-term perspective, the industry as a whole is facing overcapacity, and
thus downward pressure in the future, with the combination of stabilized growth and structural re-
form. A hard fall is unlikely, given government support. Industry profit in April saw YoY growth of
11.1%, representing continuous improvement over 2M2016.
Infrastructure construction and real estate development stimulated a pick-up in investment. Fixed
asset investment in Q1 was RMB8.58trn, up 10.7% YoY, and rose 0.5ppt compared with 2M2016.
QoQ investment growth reached 0.86% in March. Non-governmental fixed asset investment in Q1
amounted to RMB5.32trn, up 5.7% YoY, but down 1.2ppt compared with 2M2016. Non-
governmental investment growth fell further than overall investment growth, indicating non-
governmental investment is still weak. The upward increase in investment still relied mainly on infra-
structure construction and real estate investment. Infrastructure construction in Q1 was up 19.3%
and real estate growth was up 6.2%. Regarding their contribution to fixed asset investment, infra-
structure construction rose to17.9%, while real estate investment experienced a slight drop to
20.6%.
There was a steady increase in consumption, with both imports and exports picking up. Total retail
sales in March amounted to RMB2511.4bn, for a YoY nominal increase of 10.5%, up 0.3ppt com-
pared with that of 2M2016. Consumption was stable, but it is still difficult to stimulate the economy
before there is any income distribution reform or new consumption drivers. Imports and exports in
March improved significantly because of a low base for comparison and genuine improvement.
Generally speaking, the data of March showed significant indications of stability and even a rally,
and further growth is expected in Q2.
II. Investment ideas for May 2016
10
Figure 12: Official PMI Continued to Stay above 50% Figure 13:Obvious Pickup in Industrial Value Added and Power Generation
Figure 14: Fixed Asset Investment Stabilizing
Sources: WIND, China Galaxy Securities Research
Figure 15: Rapid Pickup in Real Estate Sales beyond Expectations
Figure 16: Imports/Exports Picked Up in March
Sources: WIND, China Galaxy Securities Research
Figure 17: Total Retail Sales Stabilizing
Sources: WIND, China Galaxy Securities Research
Completed fixed assets investment volume: cumulative value
Sources: WIND, China Galaxy Securities Research
Comparison with the previous month
Completed fixed assets invest-ment volume: cumulative YoY
Sources: WIND, China Galaxy Securities Research Sources: WIND, China Galaxy Securities Research
Completed fixed assets invest-ment volume: cumulative YoY
Completed real estate develop-ment investment volume: cumulative YoY
Import amount:
monthly change YoY Total retail sales: monthly change YoY
Total retail sales – goods: monthly change YoY
Total retail sales – catering: monthly change
CPI:MoM
Export amount:
monthly change YoY
CPI:YoY
Financial institutions – balance of all loans: YoY
M1: YoY M2: YoY
Figure 18: CPI Pickup Alarming Figure 19: M1 Growth Picked up to 22.1% in March
Sources: WIND, China Galaxy Securities Research
Industrial value added: monthly change YoY
Production: Power generation, monthly change YoY
Sources: WIND, China Galaxy Securities Research
11
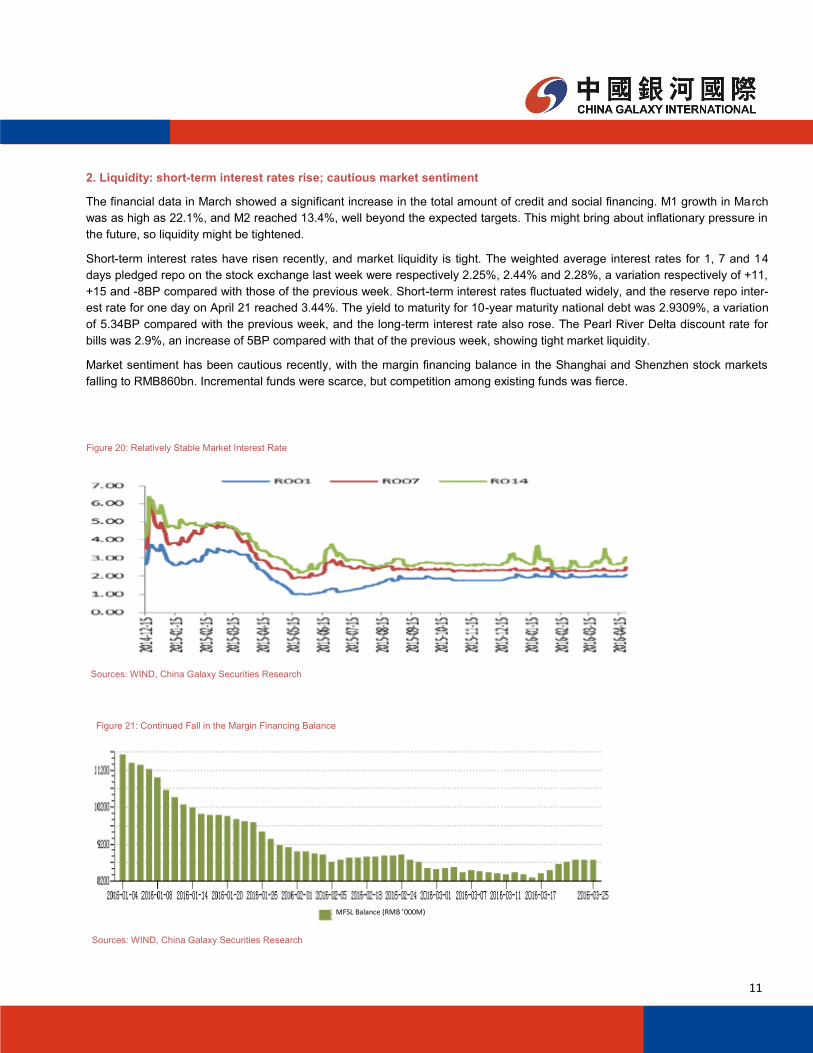
2. Liquidity: short-term interest rates rise; cautious market sentiment
The financial data in March showed a significant increase in the total amount of credit and social financing. M1 growth in March
was as high as 22.1%, and M2 reached 13.4%, well beyond the expected targets. This might bring about inflationary pressure in
the future, so liquidity might be tightened.
Short-term interest rates have risen recently, and market liquidity is tight. The weighted average interest rates for 1, 7 and 14
days pledged repo on the stock exchange last week were respectively 2.25%, 2.44% and 2.28%, a variation respectively of +11,
+15 and -8BP compared with those of the previous week. Short-term interest rates fluctuated widely, and the reserve repo inter-
est rate for one day on April 21 reached 3.44%. The yield to maturity for 10-year maturity national debt was 2.9309%, a variation
of 5.34BP compared with the previous week, and the long-term interest rate also rose. The Pearl River Delta discount rate for
bills was 2.9%, an increase of 5BP compared with that of the previous week, showing tight market liquidity.
Market sentiment has been cautious recently, with the margin financing balance in the Shanghai and Shenzhen stock markets
falling to RMB860bn. Incremental funds were scarce, but competition among existing funds was fierce.
Figure 20: Relatively Stable Market Interest Rate
Sources: WIND, China Galaxy Securities Research
Figure 21: Continued Fall in the Margin Financing Balance
Sources: WIND, China Galaxy Securities Research
MFSL Balance (RMB ’000M)

12
3. Policy: Stable, with fine adjustments to ensure healthy stock market development
Overseas markets. Close attention is paid to expectations of an interest rate increase by the Fed, along with a series of recent data
releases in the US. The market is not convinced the Fed will raise the interest rate, so there should not be a significant shrinkage of
global liquidity. This is quite different from the situation last year.
National policy. The Political Bureau of the CCP Central Committee convened a meeting at the end of April to analyze the current eco-
nomic situation and plan future economic measures, which set the main policy tone for next period. The following main issues were
covered in the meeting:
(a) Firstly, there was a summary of the economic work completed in Q1, and the conclusion was positive. GDP growth, new urban
jobs, urban and rural income growth, and other major economic indicators were in line with expectations. The economy was operating
within an appropriate range. Agricultural production maintained good momentum, industrial enterprises improved efficiency, the ser-
vice sector continued to account for a high portion of the economy, restructuring was advancing, and social undertakings were devel-
oping well. Some industries with high degree of market orientation and emphasis on innovation had seen increases in growth in terms
of quality and benefits. Supply-side structural reform was better understood by the various regions and departments. As a result, they
were carrying out their work actively and there was already gradual evidence of initial success.
(b) Secondly, there was an analysis of the future economic situation. Economic downturn pressure was still high, and some enterpris-
es still had difficulty in production and operations, increasing market risks. It was agreed that close attention must be paid to existing
conflicts and problems, that they must be analyzed calmly, that specific corresponding measures must be taken, and that we must get
ready for a protracted uphill battle.
(c) The third point had to do with the general tone of future policy: (i) adhering to the moderate expansion of aggregate demand, (ii)
implementing a proactive fiscal policy and prudent monetary policy, (iii) taking the promotion of supply-side structural reforms firmly as
the main line, (iv) accelerating new development momentum, (v) transforming and upgrading traditional comparative advantages, (vi)
fully implementing the five key tasks of "cutting overcapacity and excess inventory, de-leveraging, reducing costs, and strengthening
points of weakness", and (vii) ensuring that there is no deviation from, or deformation of, the policies determined by the Central Com-
mittee of the Communist Party of China (CPC) and ensuring the full and rigid implementation of these policies. At the end of last year,
the Central Economic Work Conference defined the macro policy goals for 2016 as "stronger proactive fiscal policy" and "monetary
policy that is neither too tight nor too loose". The overall tone regarding monetary and fiscal policies during this conference remained
unchanged. The goals are still defined as proactive fiscal policy and stable monetary policy, but the emphasis on "stronger" and
"neither too tight nor too loose" was not mentioned again. This may have been due to the stable economic growth in Q1, high mone-
tary growth, and positive results in other indexes, so only fine adjustment measures were needed.
(d) The fourth issue involved strengthening macroeconomic policy in relation to the stock market, exchange rates, real estate, employ-
ment, prices, state-owned enterprise (SOE) reform, etc.
(i) It is necessary to maintain healthy stock market development, giving full play to the role of market mechanisms, strengthening basic
system construction and market supervision, and protecting the interests of investors. It is rare to see the Central Government address
the healthy development of the stock market, so this shows the great importance of the Central Government gives to the stock market.
Capital markets pay a lot of attention to building a solid foundation for the sytem. Other focus include the introduction of long-term
funds such as regional social security funds and whether or not A-shares will be included in the MSCI index.
(ii) The RMB exchange rate should be kept basically stable, and a market-based, two-way floating exchange rate and flexible opera-
tion mechanism should gradually be formed. In the context of a weakened expectation on US rate hike, the RMB exchange rate has a
stable foundation.
(iii) Efforts will be stepped up to increase the number of Chinese people registered as permanent urban residents and to deepen the
reform of housing system requirements to help stimulate an orderly cut in real estate inventory. There will also be a greater focus on
regional and structural problems, and on implementing appropriate regulatory policies for specific circumstances.
(iv) The objective is to maintain stable employment, properly handle the issue of employment in the process of economic restructuring,
help employees adapt to new economic circumstances, and improve their re-employability.
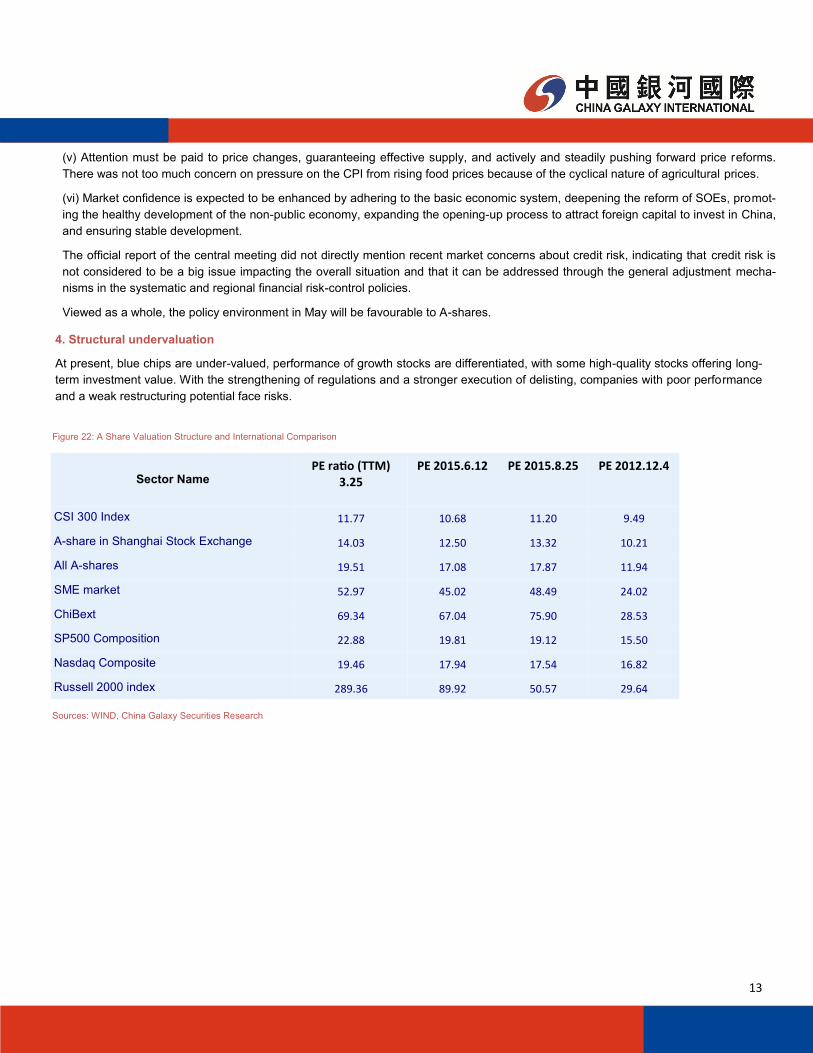
13
Sector Name PE ratio (TTM)
3.25 PE 2015.6.12 PE 2015.8.25 PE 2012.12.4
CSI 300 Index 11.77 10.68 11.20 9.49
A-share in Shanghai Stock Exchange 14.03 12.50 13.32 10.21
All A-shares 19.51 17.08 17.87 11.94
SME market 52.97 45.02 48.49 24.02
ChiBext 69.34 67.04 75.90 28.53
SP500 Composition 22.88 19.81 19.12 15.50
Nasdaq Composite 19.46 17.94 17.54 16.82
Russell 2000 index 289.36 89.92 50.57 29.64
Figure 22: A Share Valuation Structure and International Comparison
Sources: WIND, China Galaxy Securities Research
4. Structural undervaluation
At present, blue chips are under-valued, performance of growth stocks are differentiated, with some high-quality stocks offering long-
term investment value. With the strengthening of regulations and a stronger execution of delisting, companies with poor performance
and a weak restructuring potential face risks.
(v) Attention must be paid to price changes, guaranteeing effective supply, and actively and steadily pushing forward price reforms.
There was not too much concern on pressure on the CPI from rising food prices because of the cyclical nature of agricultural prices.
(vi) Market confidence is expected to be enhanced by adhering to the basic economic system, deepening the reform of SOEs, promot-
ing the healthy development of the non-public economy, expanding the opening-up process to attract foreign capital to invest in China,
and ensuring stable development.
The official report of the central meeting did not directly mention recent market concerns about credit risk, indicating that credit risk is
not considered to be a big issue impacting the overall situation and that it can be addressed through the general adjustment mecha-
nisms in the systematic and regional financial risk-control policies.
Viewed as a whole, the policy environment in May will be favourable to A-shares.

14
5. Market trend and investment views
(a) Investment views: upward but turbulent market trend will continue
Outlook for May: The fundamentals of domestic economic policies will be the dominant factors affecting market
trends. Though economic improvement will continue in Q2, consumer prices may influence monetary policy. As
for liquidity, the emphasis will be on “stability” and concern about credit risk. Capital markets will focus on build-
ing a solid foundation for the system and whether A-shares will be included in the MSCI index.
Generally, the markets in May should see a continuation of the rally with attention to inflation and liquidity
changes.
(b) Investment strategy and sector allocation: neutral to optimistic; choose stocks carefully with atten-
tion to small cap growth stocks
For May, the market is neutral to optimistic, and stocks should be carefully chosen, paying attention to small cap
growth stocks.
(i) Prices should rise in general, with emphasis on the cyclical and consumer sectors: chemical engineering,
agriculture, food, medicine, textile and garment, light industry, etc.
(ii) Examine opportunities related to the consumption peak season: e.g. tourism.
(iii) Carefully choose high-quality growth stocks with reasonable valuation: technology, media and telecommuni-
cations (TMT), machinery and military equipment.
(iv) Consider thematic opportunities: e.g. SOE reform, Disney.
(c) Risk factors
Risk factors include (a) credit risk and liquidity pressure exceeding expectations, and (b) downward pressure on
the economy exceeding expectations.
II. May portfolio
Portfolio of May: 1 petrochemical stock, 2 machinery and military industry stocks, 1 non-ferrous metal stock, 1
light manufacturing stock, 1 food & beverage stock, 1 construction stock, 1 electrical equipment & new energy
stock, 1 electronics stock, and 1 computer stock.
Stock portfolio in current month (pari passu):
Geo-Jade Petroleum (600759.CH)
Longhua Energy-saving (300263.CH)
Anhui Zhongding (000887.CH)
Chenming Paper (000488.CH)
Hengshun Zhongsheng (300208.CH)
Shuanghui Development (000895.CH)
Arts Group (603017.CH)
Pinggao Electric (600312.CH)
DMEGC (002056.CH)
Conant (300061.CH)

15
Sources: China Galaxy Securities Research
Figure 23: Portfolio of May for Galaxy Securities (Note: share prices are the closing prices on May 16, 2016)
Stock
Code
Stock Discription EPS (RMB) PE (X)
2014A 2015A 2016E 2017E 2014A 2015A 2016E 2017E
600759.SH Geo-Jade Petroleum 0.02 0.03 0.06 0.34 393.0 262.0 131.0 23.1
300263.SZ Longhua Energy-saving 0.33 0.40 0.50 0.62 47.6 39.3 31.4 25.3
000887.SZ Anhui Zhongding 0.47 0.76 1.05 1.33 44.1 27.3 19.7 15.6
000488.SZ Chenming Paper 0.26 0.53 1.02 1.37 32.0 15.7 8.2 6.1
000895.SZ Shuanghui Development 1.84 1.29 1.35 1.48 11.6 16.6 15.9 14.5
603017.SH Arts Group 0.75 0.55 1.04 1.31 44.6 60.8 32.2 25.5
600312.SH Pinggao Electric 0.61 0.73 0.86 1.02 23.3 19.5 16.5 13.9
002056.SZ DMEGC 0.93 0.79 1.02 1.29 14.8 17.4 13.5 10.7
300208.SZ Hengshun Zhongsheng 0.15 0.42 0.70 1.26 92.1 32.9 19.7 11.0
300061.SZ Conant 0.24 0.21 0.48 0.66 120.3 137.4 60.1 43.7

16
Content
Geo-Jade Petroleum (600759.CH): Belt and road play, overseas oil and gas acquisitions ........................................................ 17
Conant (300061.CH): Traditional business upgraded, M&A advancing soundly to build a leading consumer finance stock ....... 19
Longhua Heat Transfer & Energy Conservation (300263.CH): Management expected to introduce major changes .............. 21
Lnhui Zhongding (000887.CH): Good potential development from environmental protection engines for UAVs, charging piles,
and after-market components for vehicles.................................................................................................................................... 23
Henan Shuanghui Investment & Development Co., Ltd. (000895.CH): Positive development trend for new products, slaughter
capacity expected to rise .............................................................................................................................................................. 25
Shandong Chenming Paper Holdings Limited (000488.CH): Excellent leading enterprise expected to benefit from supply-side
reform, two main businesses with satisfactory performance ........................................................................................................ 27
Qingdao Hengshun Zhongsheng Group Co., Ltd. (300208.CH): China replicating its model to the world at top speed.......... 29
Henan Pinggao Electric Co., Ltd. (600312.CH): Expedited delivery of ultra-high voltage products, good potential for charging
pile sales ...................................................................................................................................................................................... 31
Arts Group Co., Ltd. (603017.CH): Industrial park development service provider, domestic and international growth potential
..................................................................................................................................................................................................... 33
DMEGC (002056.CH): Driven by growth and cyclical factors, concurrent development of magnetic materials and new energy
..................................................................................................................................................................................................... 35

17
Geo-Jade Petroleum (600759.CH): Belt and Road potential, overseas oil and gas ac-
quisitions
Driving factors, key assumptions and main predictions:
The Company intends to increase its capital through an RMB8.2bn equity offering and another RMB7bn supporting loan, for a total of
RMB15.2bn, to purchase three overseas high-quality oil and gas assets through Shanghai Longzhou Xinke, which is a major project
involving bargain-hunting for overseas oil and gas assets arising as a result of low oil prices.
With the completion of this acquisition, the residual recoverable reserves of the Company will more than double, from 218m barrels to
553m barrels, and annual output will increase over five-fold, from 0.65m tons to 3.64m tons. Residual recoverable reserves for each
10,000 shares will rise from 963 tons to 1,349 tons; crude output for each 10,000 shares will increase from 2.9 tons to 8.9 tons. Earn-
ingsare based on oil prices, with each US$10/barrel rise resulting in another approximately RMB1bn in net profit.
The supply-over-demand pattern is expected to improve in 2016, but it may be seen only in 2H, which means the oil price may be low
in 1H, but higher in 2H. The previous oil price below US$30 was below the full cost of production for most global oil companies, with
the exception of those in the Middle East, which has increased the risk of political unrest in many of the main oil-producing countries.
In our opinion, before the expectation that OPEC would reduce output fell through, it was unlikely that oil prices would face major
risks. We should note that the failure of the output-reduction plan, combined with inventory accumulation, may cause the oil price to
fall, but it is unlikely to give rise to another new low. The price is expected to rebound to US$40–50 by the end of this year.
Main financial indicators 2014 2015 2016E 2017E 2018E
Operating income (RMB m) 1,387 1,261 6,978 9,230 13,845
Operating income growth rate -9.13% 468% 32% 50%
Net profit (RMB m) 85 65 249 1,385 3,231
Net profit growth rate / -24% 8208% 317% 133%
EPS (RMB) (DILUTED) 0.02 0.03 0.06 0.34 0.79
P/E 393.0 262.0 131.0 23.1 10 Sources: Company data,China Galaxy Securities Research
Investment Rating:
Recommend
Wang Qiang: (8621)20252621 [email protected] No. of certificate to practice: S0130511080002
Qiu Xiaofeng: (8621) 20252676 [email protected] No. of certificate to practice: S0130511050001
How our views differ from the market’s
Originally, oversupply and weak demand were considered to
have been the two key reasons for the falling oil price. The
agreement among major oil-producing countries to freeze
production caused a rise in the oil price in this round. For a
considerable period in the future, the key factors affecting
the oil price will be transferred to the supply end: i.e. wheth-
er OPEC is able to continue the “freeze production” policy.
In the long run, the current international oil price of US$30-
40 per barrel is in the bottom range. Future downslide poten-
tial is considered unlikely, which means this is the best time
to purchase high-quality overseas oil and gas resources.
The One-Belt, One Road strategy introduced by China and
development strategies related to oil and gas will proceed
simultaneously, “driven by two wheels”. Therefore, the Com-
pany is expected to become a middle-to-large international
oil company.
Company valuation and investment recommendation
Provided that the average oil price of Brent Crude in
2016–2018 is US$42, 50 or 60 a barrel, and provided
that the purchase is settled in October this year, crude
output in 2016, 2017 and 2018 is expected to reach
1.15m, 4m, and 5m tons, respectively. We estimate
that the net profit of the Company in 2016, 2017 and
2018 will be RMB80m, 1.38bn, and 3.231bn, respec-
tively, provided all RMB4.1bn of additional equity is
fully diluted, and that the EPS will be RMB0.02, 0.34,
and 0.79, respectively. We give it a “Recommend”
rating.

18
Catalyst for share price performance
International crude oil price stabilizing or rebounding.
Continued success in overseas assets acquisition.
Main risk factors
Another oil price decline and continued lack of stability.
Slower than expected progress in share placement and acquisition.
19
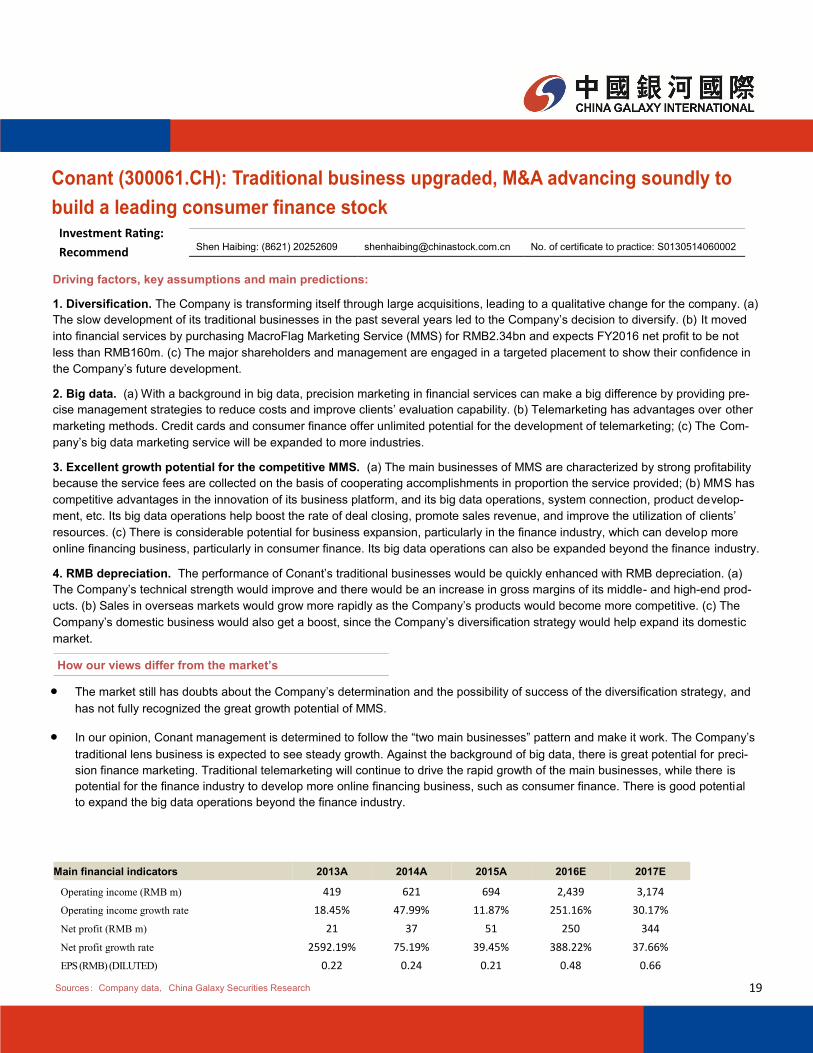
Conant (300061.CH): Traditional business upgraded, M&A advancing soundly to
build a leading consumer finance stock
Driving factors, key assumptions and main predictions:
1. Diversification. The Company is transforming itself through large acquisitions, leading to a qualitative change for the company. (a)
The slow development of its traditional businesses in the past several years led to the Company’s decision to diversify. (b) It moved
into financial services by purchasing MacroFlag Marketing Service (MMS) for RMB2.34bn and expects FY2016 net profit to be not
less than RMB160m. (c) The major shareholders and management are engaged in a targeted placement to show their confidence in
the Company’s future development.
2. Big data. (a) With a background in big data, precision marketing in financial services can make a big difference by providing pre-
cise management strategies to reduce costs and improve clients’ evaluation capability. (b) Telemarketing has advantages over other
marketing methods. Credit cards and consumer finance offer unlimited potential for the development of telemarketing; (c) The Com-
pany’s big data marketing service will be expanded to more industries.
3. Excellent growth potential for the competitive MMS. (a) The main businesses of MMS are characterized by strong profitability
because the service fees are collected on the basis of cooperating accomplishments in proportion the service provided; (b) MMS has
competitive advantages in the innovation of its business platform, and its big data operations, system connection, product develop-
ment, etc. Its big data operations help boost the rate of deal closing, promote sales revenue, and improve the utilization of clients’
resources. (c) There is considerable potential for business expansion, particularly in the finance industry, which can develop more
online financing business, particularly in consumer finance. Its big data operations can also be expanded beyond the finance industry.
4. RMB depreciation. The performance of Conant’s traditional businesses would be quickly enhanced with RMB depreciation. (a)
The Company’s technical strength would improve and there would be an increase in gross margins of its middle- and high-end prod-
ucts. (b) Sales in overseas markets would grow more rapidly as the Company’s products would become more competitive. (c) The
Company’s domestic business would also get a boost, since the Company’s diversification strategy would help expand its domestic
market.
Shen Haibing: (8621) 20252609 [email protected] No. of certificate to practice: S0130514060002
Sources: Company data, China Galaxy Securities Research
Investment Rating:
Recommend
Main financial indicators 2013A 2014A 2015A 2016E 2017E
Operating income (RMB m) 419 621 694 2,439 3,174
Operating income growth rate 18.45% 47.99% 11.87% 251.16% 30.17%
Net profit (RMB m) 21 37 51 250 344
Net profit growth rate 2592.19% 75.19% 39.45% 388.22% 37.66%
EPS (RMB) (DILUTED) 0.22 0.24 0.21 0.48 0.66
How our views differ from the market’s
The market still has doubts about the Company’s determination and the possibility of success of the diversification strategy, and
has not fully recognized the great growth potential of MMS.
In our opinion, Conant management is determined to follow the “two main businesses” pattern and make it work. The Company’s
traditional lens business is expected to see steady growth. Against the background of big data, there is great potential for preci-
sion finance marketing. Traditional telemarketing will continue to drive the rapid growth of the main businesses, while there is
potential for the finance industry to develop more online financing business, such as consumer finance. There is good potential
to expand the big data operations beyond the finance industry.

20
Catalyst for share price performance
Consumer finance has support from national policy.
Completion of extended M&A.
Main risk factors
The Company’s performance does not meet expectations
after diversification.
Fierce market competition.
Company valuation and investment recommendations
With its purchase of MMS, the Company now has diversified its business, with two main businesses advancing simultane-
ously. The traditional lens business is on a steady upward trend. With the strong development of MMS, bank precision mar-
keting has the potential to expand to more industries against the big data background. The telemarketing industry also has
good prospects.
We expect the net profit of the Company in 2016–2017 to be RMB250m and 344m, and the EPS to be RMB0.48 and 0.66,
respectively. Therefore, we maintain our "Recommend" rating.
21
Longhua Heat Transfer & Energy Conservation (300263): Management ex-
pected to introduce major changes
Driving factors, key assumptions and main predictions:
1) The Company’s energy-saving business remains stable, and the environmental- protection business continues its rapid growth.
Its high-efficiency compound cooling technology has reached the advanced international level and has been successfully applied
and promoted in the power, petrochemical, coal, chemical, metallurgy and refrigeration industries, among others. The technology
is projected to maintain stable development in the future as the macro economy stabilizes. The Planning Institute of Ministry of
Environmental Protection projects that total social investment in environmental protection is expected to exceed RMB17trn during
the 13th Five-year Plan period in the goal to beautify China. The company has entered the water treatment field through a mer-
ger. It will continue to accelerate its investment in the industry. Orders for environmental protection equipment are projected to be
strong, and the industry is expected to maintain rapid growth.
2) We believe the current global market volume for the target materials is nearly RMB60bn, compared to nearly RMB40bn in 2011
according to the company, but annual sales of the target materials were around US$8.57bn worldwide in 2014 according to fig-
ures from the industrial information network.
3) The company has a strong core team dedicated to common goals. The company expects strong growth in the fields of new mate-
rials and defence products. Senior executives of the company hold many shares and are confident in and dedicated to the com-
pany’s success.
Wang Huajun: (8610) 66568477 [email protected] No. of certificate to practice: S0130513050002
Main financial indicators 2014A 2015A 2016E 2017E 2018E
Operating income (RMB m) 1,245.02 1,370.80 1,625 1,974 2,459
Operating income growth rate 70.76% 10.10% 19% 22% 25%
Net profit (RMB m) 145.72 178.65 220 277 337
Net profit growth rate 28.49% 22.60% 23% 26% 22%
EPS (RMB) (DILUTED) 0.33 0.40 0.50 0.62 0.76
P/E 47.6 39.3 31.4 25.3 24
Sources: Company data, China Galaxy Securities Research
How our views differ from the market’s
Investment Rating:
Recommend
The market is concerned that the company’s conventional energy-saving business will drag Longhua’s performance down,
but we believe that the conventional energy-saving business will maintain stable development. The environmental-protection
business will still be the main force in new business growth in 2016–2017. The new materials business is expected to in-
crease its contribution to the Company’s performance in 2017–2018.
The Company’s new materials have not been fully recognized by the market. We think that there is a significant opportunity
to substitute imported materials with Longhua’s new materials, which have other applications as well. We expect the devel-
opment of the new materials business to exceed market expectations.
The market is focusing on the development of the new materials. General Manager Sun Jianke is expected to make major
changes. The Company’s dual-use approach is not limited to new materials; military equipment will be another growth point
for the company in the future.
22
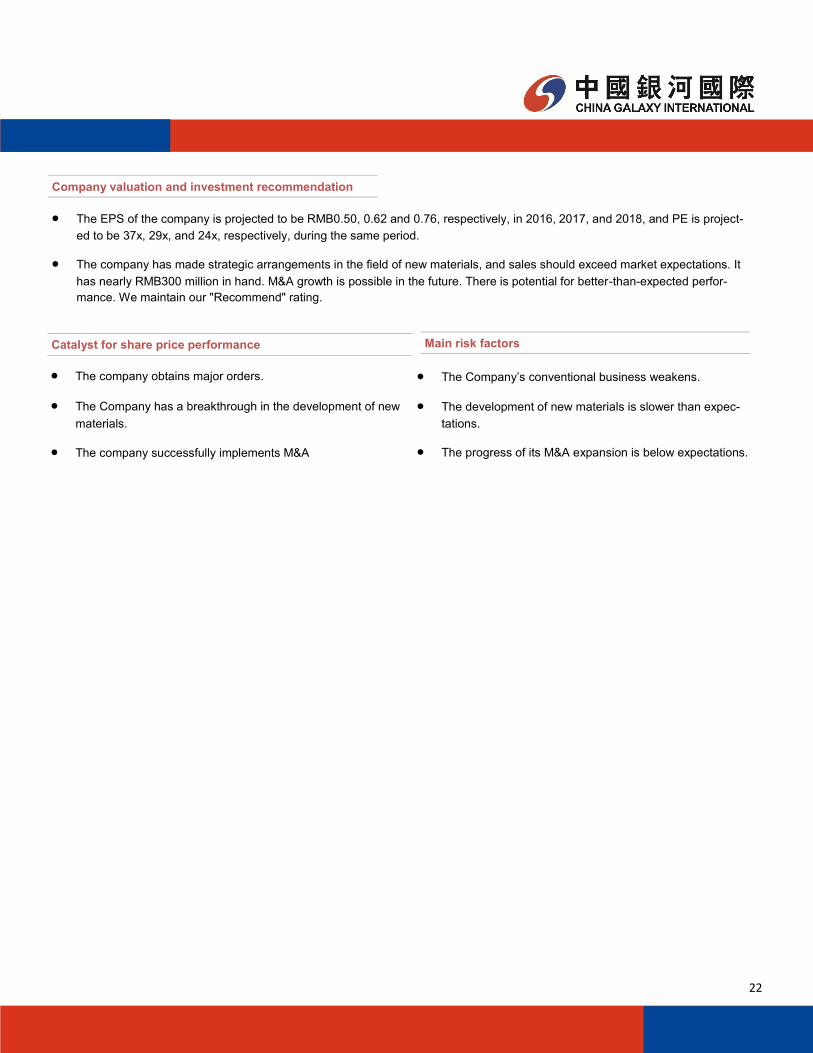
Catalyst for share price performance
The company obtains major orders.
The Company has a breakthrough in the development of new
materials.
The company successfully implements M&A
Main risk factors
The Company’s conventional business weakens.
The development of new materials is slower than expec-
tations.
The progress of its M&A expansion is below expectations.
Company valuation and investment recommendation
The EPS of the company is projected to be RMB0.50, 0.62 and 0.76, respectively, in 2016, 2017, and 2018, and PE is project-
ed to be 37x, 29x, and 24x, respectively, during the same period.
The company has made strategic arrangements in the field of new materials, and sales should exceed market expectations. It
has nearly RMB300 million in hand. M&A growth is possible in the future. There is potential for better-than-expected perfor-
mance. We maintain our "Recommend" rating.

23
Anhui Zhongding (000887.CH): Good potential development from environmental pro-
tection engines for UAVs, charging piles, and after-market components for vehicles
Driving factors, key assumptions and main predictions:
1) Four driving forces promote the rapid growth of the company’s main business: (a) restructuring the main business, (b) cost sav-
ings, (c) export development, and (d) industry integration. The size of non-tire rubber market in China is around RMB50bn. The
company accounts for around 10% of this, but the Company’s market share is expected to increase.
2) The company has moved into the energy-saving, environmental protection and new energy vehicles field instead of the conven-
tional vehicle field. A new generation of intelligent charging products is now in mass production. The market demand for charging
piles may exceed RMB10bn in the future, so the market potential is huge. An e-commerce service platform for after-market vehi-
cle components has been created through “Internet Plus”, transforming the Company by opening up new space for growth.
3) The company conducts R&D for UAV heavy oil engines in cooperation with NORINCO GROUP. This is expected to result in an in
-depth integration of military and civilian technology in the future.
Main financial indicators 2013A 2014E 2015E 2016E 2017E
Operating income (RMB m) 4,161.69 5,040.19 6,840 9,045 11,071
Operating income growth rate 23.53% 21.11% 36% 32% 22%
Net profit (RMB m) 388.41 566.59 920 1,270 1,609
Net profit growth rate -24.83% 45.87% 62% 38% 27%
EPS(RMB)(DILUTED) 0.32 0.47 0.76 1.05 1.33
P/E 64.8 44.1 27.3 19.7 17
Sources: Company data, China Galaxy Securities Research
Investment Rating:
Recommend Wang Huajun: (8610) 66568477 wanshuajun@chinastock_com.cn No. of certificate to practice: S0130513050002
How our views differ from the market’s
The market thinks that the company’s main strengths are its large market capitalization and stable growth. We believe that the
company also benefits from its environmental protection engines, UAV engines, charging piles for new energy vehicles, etc. We
expect the Company to maintain high growth and exceed expectations in the future.
The market is concerned that the company’s businesses have a low ceiling, but we believe that it has opened up new growth
space. The Company will benefit from energy saving and environmental protection trends, new energy vehicles, and themed
investment, like the Internet of Vehicles, in the future. We expect its new business development to exceed market expectations.
The market questions the possibility of success of its OPOC engine, but we believe that there is a high probability of success.
The Company’s overseas business accounts for over 60% of its total business. The company has purchased five US companies
and three European companies. It has international vision, and we expect its overseas acquisitions to exceed market expecta-
tions in the future.
24
Catalyst for share price performance
Significant progress in the industrialization of its OPOC
environmental protection engines.
Significant progress in the Company’s M&A .
New energy vehicles and high-end seals business obtain
a major breakthrough.
Main risk factors
Industrialization risks of its OPOC environmental protec-
tion engines.
M&A is slower than expected.
The price of natural rubber and the exchange rate fluc-
tuate.
Company valuation and investment recommendations
If we don’t consider the additional share issue, EPS is projected to be RMB0.80, 1.03, and 1.24 in 2015, 2016, and 2017, re-
spectively, and PER is projected to be 28x, 22x,and 18x, respectively, during the same period.
If we take the additional share issue into account, EPS is projected to be RMB0.76, 1.05, and 1.33 in 2015, 2016, and 2017, and
PER is projected to be 29x, 21x, and 17x, respectively, during the same period. We expect the Company’s performance to im-
prove in the future and maintain our “Recommend” rating.
25
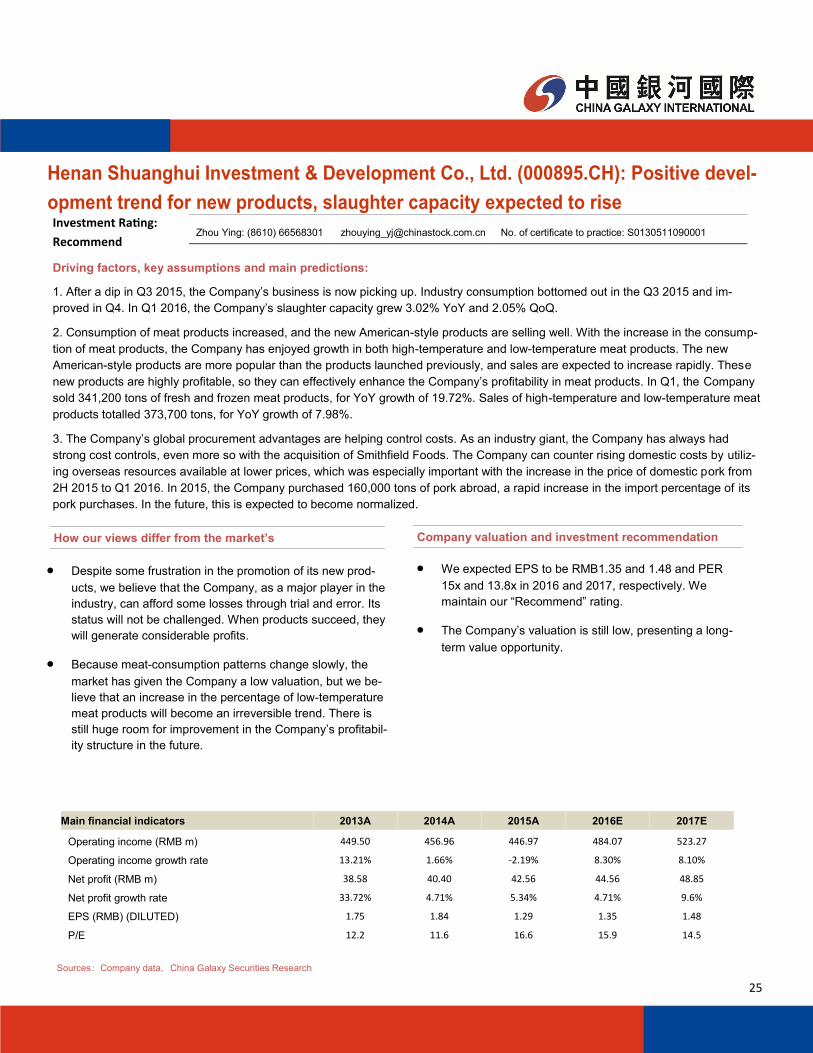
Henan Shuanghui Investment & Development Co., Ltd. (000895.CH): Positive devel-
opment trend for new products, slaughter capacity expected to rise
Driving factors, key assumptions and main predictions:
1. After a dip in Q3 2015, the Company’s business is now picking up. Industry consumption bottomed out in the Q3 2015 and im-
proved in Q4. In Q1 2016, the Company’s slaughter capacity grew 3.02% YoY and 2.05% QoQ.
2. Consumption of meat products increased, and the new American-style products are selling well. With the increase in the consump-
tion of meat products, the Company has enjoyed growth in both high-temperature and low-temperature meat products. The new
American-style products are more popular than the products launched previously, and sales are expected to increase rapidly. These
new products are highly profitable, so they can effectively enhance the Company’s profitability in meat products. In Q1, the Company
sold 341,200 tons of fresh and frozen meat products, for YoY growth of 19.72%. Sales of high-temperature and low-temperature meat
products totalled 373,700 tons, for YoY growth of 7.98%.
3. The Company’s global procurement advantages are helping control costs. As an industry giant, the Company has always had
strong cost controls, even more so with the acquisition of Smithfield Foods. The Company can counter rising domestic costs by utiliz-
ing overseas resources available at lower prices, which was especially important with the increase in the price of domestic pork from
2H 2015 to Q1 2016. In 2015, the Company purchased 160,000 tons of pork abroad, a rapid increase in the import percentage of its
pork purchases. In the future, this is expected to become normalized.
Investment Rating:
Recommend Zhou Ying: (8610) 66568301 [email protected] No. of certificate to practice: S0130511090001
How our views differ from the market’s
Despite some frustration in the promotion of its new prod-
ucts, we believe that the Company, as a major player in the
industry, can afford some losses through trial and error. Its
status will not be challenged. When products succeed, they
will generate considerable profits.
Because meat-consumption patterns change slowly, the
market has given the Company a low valuation, but we be-
lieve that an increase in the percentage of low-temperature
meat products will become an irreversible trend. There is
still huge room for improvement in the Company’s profitabil-
ity structure in the future.
Main financial indicators 2013A 2014A 2015A 2016E 2017E
Operating income (RMB m) 449.50 456.96 446.97 484.07 523.27
Operating income growth rate 13.21% 1.66% -2.19% 8.30% 8.10%
Net profit (RMB m) 38.58 40.40 42.56 44.56 48.85
Net profit growth rate 33.72% 4.71% 5.34% 4.71% 9.6%
EPS (RMB) (DILUTED) 1.75 1.84 1.29 1.35 1.48
P/E 12.2 11.6 16.6 15.9 14.5
Sources: Company data, China Galaxy Securities Research
Company valuation and investment recommendation
We expected EPS to be RMB1.35 and 1.48 and PER
15x and 13.8x in 2016 and 2017, respectively. We
maintain our “Recommend” rating.
The Company’s valuation is still low, presenting a long-
term value opportunity.

26
Catalyst for share price performance (monthly)
According to a grass roots survey, the acceptance of the
Company’s new American-style product is beyond expec-
tations.
Overall market demand is beyond expectations.
Main risk factors
Slow progress in new product acceptance in the con-
sumer market.
A sharp rise in pork prices.
27
Shandong Chenming Paper Holdings Limited (000488): Excellent leading enterprise
expected to benefit from supply-side reform; two main businesses with satisfactory
performance
Driving factors, key assumptions and main predictions:
1. Financing lease business. This business should see rapid growth. At present, the financing lease balance stands at RMB24bn,
and the balance on average throughout the year will reach RMB30bn. The registered capital of Chenming Holdings Hong Kong Lim-
ited increased to RMB11bn benefiting from a private placement and laying a foundation for continued heavy volume in 2017.
2. Paper-making business. Because of a decrease in raw material costs and an increase in product prices, forestry pulp and paper
integration will be followed by a focus on upstream cost control.
3. Supply-side reform. Enterprises failing to meet standards for production capacity and environmental protection will be closed
down, and this will benefit excellent leading enterprises like Shandong. The concentration ratio of the industry is expected to improve.
Main financial indicators 2014A 2015A 2016E 2017E
Operating income (RMB m) 19,101.68 20,241.91 20,241.91 21,678.00
Operating income growth rate -6.31% 5.97% 7.09% 5.48%
Net profit (RMB m) 505.20 1,021.22 1,977.79 2,648.32
Net profit growth rate -28.91% 115.73% 93.67% 33.90%
EPS (RMB) (DILUTED) 0.26 0.53 1.02 1.37
P/E 32.0 15.7 8.2 6.1
Sources: Company data, China Galaxy Securities Research
How our views differ from the market’s
Investment Rating:
Recommend
Profit. The Company’s profit may be better than mar-
ket expectations in 2016. The profit growth rate is
close to 100%.
Financing lease business. This part of the Compa-
ny’s business remains positive, with a rapidly enlarged
scale, enhanced risk management, and adequate sub-
sequent financing projects. By the end of 2016, the
financing lease balance will exceed RMB30bn, and the
balance on average throughout the year should reach
RMB30bn with profit of RMB1.2bn. The private place-
ment program will lay a foundation for an earnings
increase in 2017.
Industry reform. This will result in the paper-making
business of leading enterprises rising steadily, with
lower costs and higher sales prices. This trend is ex-
pected to continue.
Ma Li :(8610)66568489 [email protected] No. of certificate to practice: S0130511020012
Company valuation and investment recommendations
Investment advice. We expect EPS to be RMB1.02 and
1.37 in 2016 and 2017, respectively. The present price is
RMB8.25. The total equity of RMB1.336bn corresponds to a
market value of nearly RMB16bn. The PER is 8x and 6x. We
maintain our “Recommend” rating.
Valuation. The paper-making business has a valuation
ranging from 10x to 15x PER. As the scale of the financing
lease business gets bigger, it should result in a valuation of
12x PER.

28
Catalyst for share price performance
A number of policies for environmental protection have
been introduced, resulting in more small and medium-
sized paper-making enterprises being closed down.
The performance of the Company’s diversified financial
services is better than expectations.
Raw material prices continue to drop.
Main risk factors
Default risk of financing lease business; slower-than-
expected business expansion.
Risk of a rebound in the price of raw materials and a
drop in product prices.
29
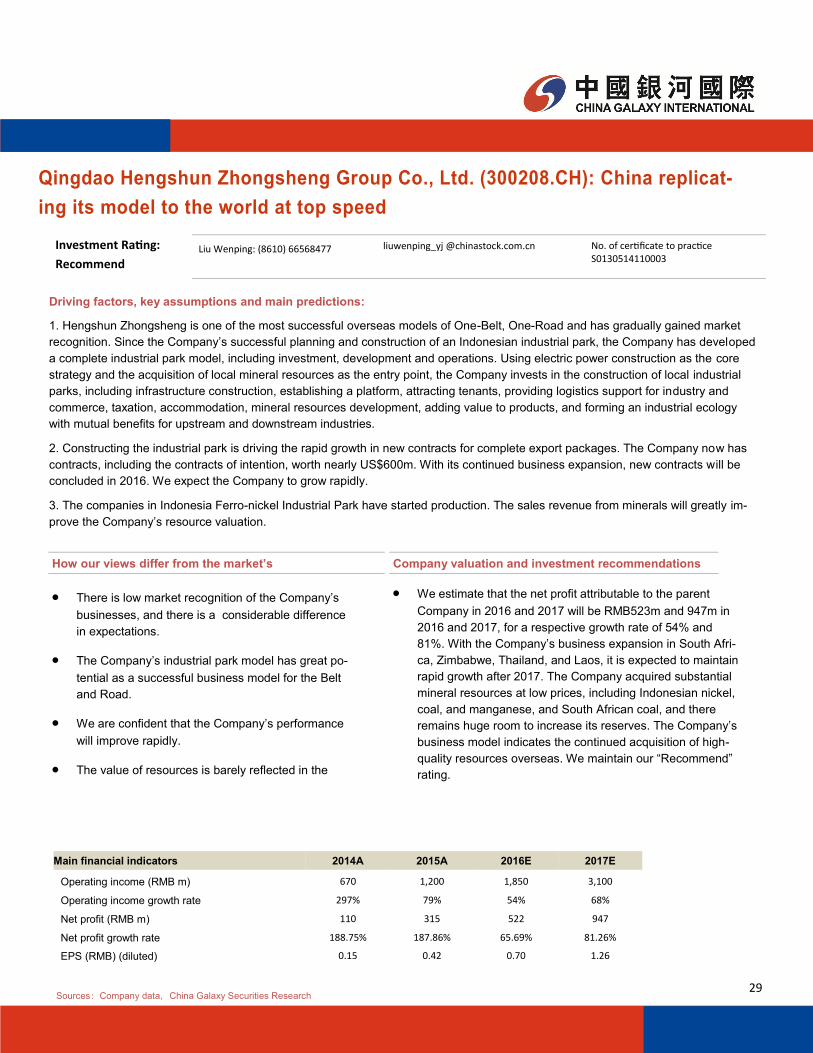
Qingdao Hengshun Zhongsheng Group Co., Ltd. (300208.CH): China replicat-
ing its model to the world at top speed
Driving factors, key assumptions and main predictions:
1. Hengshun Zhongsheng is one of the most successful overseas models of One-Belt, One-Road and has gradually gained market
recognition. Since the Company’s successful planning and construction of an Indonesian industrial park, the Company has developed
a complete industrial park model, including investment, development and operations. Using electric power construction as the core
strategy and the acquisition of local mineral resources as the entry point, the Company invests in the construction of local industrial
parks, including infrastructure construction, establishing a platform, attracting tenants, providing logistics support for industry and
commerce, taxation, accommodation, mineral resources development, adding value to products, and forming an industrial ecology
with mutual benefits for upstream and downstream industries.
2. Constructing the industrial park is driving the rapid growth in new contracts for complete export packages. The Company now has
contracts, including the contracts of intention, worth nearly US$600m. With its continued business expansion, new contracts will be
concluded in 2016. We expect the Company to grow rapidly.
3. The companies in Indonesia Ferro-nickel Industrial Park have started production. The sales revenue from minerals will greatly im-
prove the Company’s resource valuation.
Main financial indicators 2014A 2015A 2016E 2017E
Operating income (RMB m) 670 1,200 1,850 3,100
Operating income growth rate 297% 79% 54% 68%
Net profit (RMB m) 110 315 522 947
Net profit growth rate 188.75% 187.86% 65.69% 81.26%
EPS (RMB) (diluted) 0.15 0.42 0.70 1.26
Sources: Company data, China Galaxy Securities Research
Investment Rating:
Recommend Liu Wenping: (8610) 66568477 liuwenping_yj @chinastock.com.cn No. of certificate to practice
S0130514110003
Company valuation and investment recommendations
We estimate that the net profit attributable to the parent
Company in 2016 and 2017 will be RMB523m and 947m in
2016 and 2017, for a respective growth rate of 54% and
81%. With the Company’s business expansion in South Afri-
ca, Zimbabwe, Thailand, and Laos, it is expected to maintain
rapid growth after 2017. The Company acquired substantial
mineral resources at low prices, including Indonesian nickel,
coal, and manganese, and South African coal, and there
remains huge room to increase its reserves. The Company’s
business model indicates the continued acquisition of high-
quality resources overseas. We maintain our “Recommend”
rating.
How our views differ from the market’s
There is low market recognition of the Company’s
businesses, and there is a considerable difference
in expectations.
The Company’s industrial park model has great po-
tential as a successful business model for the Belt
and Road.
We are confident that the Company’s performance
will improve rapidly.
The value of resources is barely reflected in the
30
Catalyst for share price performance
New purchase orders.
Realization of potential.
Increasing cooperation with Qingdao Urban Construction
Investment Holding (Group) Co., Ltd.
Unlikelihood of the CSRC’s penalizing listed companies.
Main risk factors
What sort of penalty CSRC determines for listed compa-
nies.
Overseas political risks.
31
Henan Pinggao Electric Co., Ltd. (600312.CH): Expedited delivery of ultra -high
voltage products, good potential for charging-pile sales
Driving factors, key assumptions and main predictions:
1. The Company’s UHVAC composite apparatus has maintained a steady leading role, with new orders and deliveries rising sharply.
The Company announced the successful bid for 7 ultra-high voltage GIS intervals for the Ximeng-Shengli Project. At present, the
Company has 45 orders for ultra-high voltage GIS intervals, compared to only 20 confirmed orders in FY2015. Therefore, the 45 or-
ders on hand are already sufficient to guarantee the Company’s rapid profit growth this year. We expect the Company to receive a
large number of orders for the East Junggar-East China DC Line and the Ji’nan-Zaozhuang-Linyi-Weifang AC Line, ensuring growth
for both this year and next.
2. The Company’s base in Tianjin had one production line put into service last year after numerous tests, and the Company has start-
ed its distribution network business and asset integration plan. It is expected that the Tianjin plant will generate revenue of about
RMB1bn this year.
3. The private placement has injected assets in the listed companies. We expect the Company’s profitability to improve in 2016.
4. With the overseas business expansion of Pinggao Group, the Company has received quick, successful international certification of
a large number of products.
5. The Company’s subsidiary Tianjin Pinggao has reported tests on six 30~360kW DC chargers and two 220V and 380V AC charging
piles. It also had successful bids for 89 DC chargers and 106 AC charging piles in Beijing, Xinjiang, etc. Production capacity is in-
creasing. Upon the completion of its automated production line, Tianjin Pinggao will have the capacity to produce 6,000 DC chargers
and 20,000 AC charging piles annually, for potential annual output value of about RMB600m. The Company is listed in the State Grid
system. At present, the five companies (Xuji Group Corporation, Nari Technology Co., Ltd., Beijing Huashang Sanyou New Energy
Technology Co., Ltd., etc.) in the State Grid system enjoy a market share of about 10% each in the State Grid’s annual tenders for
charging piles. We expect the State Grid’s tenders for charging equipment this year to total nearly RMB4bn. If Tianjin Pinggao can get
a 5% market share, it could generate additional revenue of about RMB200m.
Main financial indicators 2014A 2015A 2016E 2017E 2018E
Operating income (RMB m) 4,606 5,831 6,522 7,251 8,342
Operating income growth rate 21 27 12 11 15
Net profit (RMB m) 693 827 978 1,160 1,376
Net profit growth rate 74 19 18 19 19
EPS (RMB) (diluted) 0.61 0.73 0.86 1.02 1.21
P/E 23.3 19.5 16.5 13.9 11.8
Sources: Company data, China Galaxy Securities Research
How our views differ from the market’s
Investment Rating:
Recommend
According to market, the Company benefits mainly from ultra-high voltage AC construction. However, the Company has also
invested and achieved success in DC ultra-high voltage technology, and the Company and its subsidiary Henan Pinggao Toshi-
ba High-Voltage Switchgear Co., Ltd. have successfully bid on tenders for DC field and combined electrical apparatus worth
nearly RMB700m, apart from converter valves and transformers.
Zhang Ling : (8621) 66568643 [email protected] No. of certificate to practice : S013051402000

32
Catalyst for share price performance
The ultra-high voltage project is approved for operation by
the National Energy Administration.
Orders are received for charging piles.
Main risk factors
The number of ultra-high voltage projects approved for
operation is lower than expected.
The Company’s ultra-high voltage products have low
market share and prices drop sharply.
Revenue and profits from the factory in Tianjin are lower
than expected.
Company valuation and investment recommendations
As a leader in the ultra-high voltage GIS industry, the Company benefits from the ultra-high voltage AC and DC construction,
has plenty of orders on hand, and has the capacity to take on more orders. The DC/AC charging piles and low-voltage equip-
ment in its distribution network have created a new growth pole for the Company. We expect the EPS to be RMB0.86, 1.02,
and 1.21 in 2016, 2017 and 2018, respectively, and maintain our “Recommend” rating.

33
ARTS Group Co., Ltd. (603017.CH): Industrial park development service pro-
vider, domestic and international growth potential
Driving factors, key assumptions and main predictions:
1. The Company purchased 100% of ECD’s stock for RMB598m in October 2015. ECD’s original shareholders promised that the after
-tax net profits for 2016 and 2017 would be no less than RMB51m and RMB57m, respectively. The purchase of ECD opens the door
to the market in the southwest. China has finalized the China-Singapore (Chongqing) Strategic Interconnectivity Demonstration Pro-
ject with Singapore. Based on this purchase and the Company’s excellent performance in industrial park design and construction, it is
expected to realize a great leap forward in development.
2. With the Company’s experience in the construction of Suzhou Industrial Park, it has established a unique competitive niche in park
planning and design. It signed a contract valued at RMB358m for the construction of China-Malaysia Qinzhou Industrial Park and a
Strategic Cooperation Agreement on the Jining Economic and Technological Development Zone. The Company’s capability in park
design is fully recognized. In the future, its design is expected to be copied on a national scale, indicating huge potential to receive
more orders for design and planning.
3. The Company has proposed a capital increase of RMB12m in Chongqing Lufugong Image Digital Technology for equity of no more
than 20%. The target company was one of the earliest enterprises in the VR architectural design field. The Company will apply the VR
technology to create innovative designs on the traditional pattern. This will greatly promote the Company’s design business.
4. In July 2015, the Company issued 2.34m restricted shares to 91 directors, middle and senior administrative personnel, and key
staff at RMB18.96/share, totalling RMB44.3664m. The stock ownership incentive will help retain talent and guarantee the Company’s
future development.
Main financial indicators 2014A 2015A 2016E 2017E 2018E
Operating income (RMB m) 540 636 859 1,074 1,288
Operating income growth rate 13.9 17.9 35.0 25.0 20.0
Net profit (RMB m) 91.4 67.7 127.2 160.6 192.2
Net profit growth rate 7.5 -26.0 88.0 26.3 19.6
EPS (RMB) (diluted) 0.75 0.55 1.04 1.31 1.57
P/E 44.6 60.8 32.2 25.5 21.3
Sources: Company data, China Galaxy Securities Research
How our views differ from the market’s
Investment Rating:
Recommend
In 2015, without considering the cost of the stock ownership
incentive plan, the Company had revenue growth of 17.88%
and net profit growth of 5.12%. In view of the effect of acquisi-
tions on consolidated statement, the Company’s performance is
expected to rise sharply.
The purchase of ECD opens the door to the market in the
southwest. China has finalized the China-Singapore
(Chongqing) Strategic Interconnectivity Demonstration Project
with Singapore. The Company is expected to realize a great
leap forward in its development.
The Company is extremely skilful in park design. Its designs are
expected to be copied on a national scale, indicating huge po-
tential to receive more orders for park design.
Zhou Song:(8621) 68956786 zhousong [email protected] No. of certificate to practice : S0130515050001
Company valuation and investment recommendations
We expect EPS of RMB1.04 and 1.31 and PE of 32x
and 25x in 2016 and 2017, respectively, and maintain
our “Recommend” rating.
Valuation: The Company’s valuation is low compared
to that of its peers. Given the Company’s potential
profit upside, we believe that a valuation premium is
reasonable. In 2017, a reasonable valuation range will
be 35x PER, corresponding to a price of RMB45.

34
Catalyst for share price performance
The private placement is completed as expected and the
external-oriented acquisition is implemented step by step.
The framework agreement is signed with Lufugong Image
Digital Technology to develop new VR business.
Main risk factors
Macroeconomic risks.
Asset-restructuring risks.

35
DMEGC (002056.CH): Driven by growth and cyclical factors, concurrent develop-
ment of magnetic materials and new energy
Driving factors, key assumptions and main predictions:
1) In the short run, no other technologies can replace the application of ferrite in shielding materials.
2) In 2014-2015, the solar cell industry underwent a fierce reshuffle, but it began to rebound in 2015. It is expected that the boom
will continue for the coming 1-2 years.
3) DMEGC’s position in the photovoltaic and power battery business has favourable prospects. Meanwhile, its magnetic material
business is increasing steadily. We expect EPS to be RMB1.02, 1.29, and 1.61 in 2016, 2017 and 2018, respectively, corre-
sponding to 25 times the valuation in 2016. We rate it “Recommend”.
Main financial indicators 2015A 2016E 2017E 2018E
Operating income (RMB million) 3,958 5,015 6,246 7,531
Growth rate of operating revenue 7.9% 26.7% 24.5% 20.6%
Net profit (RMB million) 323 418 530 661
Net profit growth rate -15.2% 29.2% 26.8% 24.9%
EPS (RMB) (DILUTED) 0.79 1.02 1.29 1.61
P/E 14.8 17.4 13.5 10.7
Sources: Company data, China Galaxy Securities Research
Investment Rating:
Recommend Wang Li :(8610) 83574039
[email protected] No. of certificate to practice : S0130515070001
How our views differ from the market’s
According to market, the Company has sound operations but
insufficient profit upside. We believe that the Company is expe-
riencing both growth and cyclical factors. Based on its perfor-
mance safety margin, both profitability and valuation still have
upside.
Company valuation and investment recommendations
We expect EPS to be RMB1.02, 1.29, and 1.61 in
2016, 2017 and 2018, respectively, corresponding to
27x the valuation in 2016. Our rating is “Recommend”.
Catalyst for share price performance
Improved market for power batteries or magnetic materi-
als.
Rise in price of magnetic materials.
Ternary power battery certified by clients or technological
breakthrough.
Main risk factors
Downturn in solar energy industry.
Reshuffle in the power battery industry.
36
Disclaimer
This research report is not directed at, or intended for distribution to or used by, any person or entity who is a citizen or resident of or located in any jurisdiction where such distribution, publication, availability or use would be contrary to applicable law or regulation or which would subject China Galaxy International Securities (Hong Kong) Co., Limited (“Galaxy International Securities”) and/or its group companies to any registration or licensing requirement within such jurisdiction.
This report (including any information attached) is issued by Galaxy International Securities, one of the subsidiaries of the China Galaxy International Financial Holdings Limited, to the institutional clients from the information sources believed to be reliable, but no representation or warranty (expressly or implied) is made as to their accuracy, correctness and/or completeness.
This report shall not be construed as an offer, invitation or solicitation to buy or sell any securities of the company(ies) referred to herein. Past perfor-mance should not be taken as an indication or guarantee of future performance, and no representation or warranty, express or implied, is made regard-ing future performance. The recipient of this report should understand and comprehend the investment objectives and its related risks, and where necessary consult their own independent financial advisers prior to any investment decision.
Where any part of the information, opinions or estimates contained herein reflects the personal views and opinions of the analyst who prepared this report, such views and opinions may not correspond to the published views or investment decisions of China Galaxy International Financial Holdings Limited and any of its subsidiaries (“China Galaxy International”), directors, officers, agents and employees (“the Relevant Parties”).
All opinions and estimates reflect the judgment of the analyst on the date of this report and are subject to change without notice. China Galaxy Interna-tional and/or the Relevant Parties hereby disclaim any of their liabilities arising from the inaccuracy, incorrectness and incompleteness of this report and its attachment/s and/or any action or omission made in reliance thereof. Accordingly, this report must be read in conjunction with this disclaimer.
Disclosure of Interests
China Galaxy Securities (6881.hk) is the direct and/or indirect holding company of the group of companies under China Galaxy International.
China Galaxy International may have financial interests in relation to the subjected company(ies) the securities in respect of which are reviewed in this report, and such interests aggregate to an amount may equal to or more than 1 % of the subjected company(ies)’ market capitalization.
One or more directors, officers and/or employees of China Galaxy International may be a director or officer of the securities of the company(ies) men-tioned in this report.
China Galaxy International and the Relevant Parties may, to the extent permitted by law, from time to time participate or invest in financing transac-tions with the securities of the company(ies) mentioned in this report, perform services for or solicit business from such company(ies), and/or have a position or holding, or other material interest, or effect transactions, in such securities or options thereon, or other investments related thereto.
China Galaxy International may have served as manager or co-manager of a public offering of securities for, or currently may make a primary market in issues of, any or all of the entities mentioned in this report or may be providing, or have provided within the last 12 months, significant advice or invest-ment services in relation to the investment concerned or a related investment or investment banking services to the company(ies) mentioned in this report.
Furthermore, China Galaxy International may have received compensation for investment banking services from the company(ies) mentioned in this report within the preceding 12 months and may currently seeking investment banking mandate from the subject company(ies).
Analyst Certification
The analyst who is primarily responsible for the content of this report, in whole or in part, certifies that with respect to the securities or issuer covered in this report: (1) all of the views expressed accurately reflect his or her personal views about the subject, securities or issuer; and (2) no part of his or her compensation was, is, or will be, directly or indirectly, related to the specific views expressed by the analyst in this report.
Besides, the analyst confirms that neither the analyst nor his/her associates (as defined in the code of conduct issued by The Hong Kong Securities and Futures Commission) (1) have dealt in or traded in the securities covered in this research report within 30 calendar days prior to the date of issue of this report; (2) will deal in or trade in the securities covered in this research report three business days after the date of issue of this report; (3) serve as an officer of any of the Hong Kong-listed companies covered in this report; and (4) have any financial interests in the Hong Kong-listed companies cov-ered in this report.
Explanation on Equity Ratings
Copyright Reserved
No part of this material may be reproduced or redistributed without the prior written consent of China Galaxy International Securities (Hong Kong) Co., Limited.
China Galaxy International Securities (Hong Kong) Co. Limited, CE No.AXM459
Room 3501-3507, 35/F, Cosco Tower, Grand Millennium Plaza, 183 Queen’s Road Central, Sheung Wan, Hong Kong. General line: 3698-6888.
BUY share price will increase by >20% within 12 months in absolute terms :
SELL share price will decrease by >20% within 12 months in absolute terms :
HOLD no clear catalyst, and downgraded from BUY pending clearer signal to reinstate BUY or further downgrade to outright SELL :