a significant financial services...
TRANSCRIPT

Aditya Birla Financial Services
Copyright © 2017 Aditya Birla Financial Services
A significant financial services conglomerate
June 2017
1

Aditya Birla Financial Services
Copyright © 2017 Aditya Birla Financial Services
1. Aditya Birla Group Overview
2. Aditya Birla Financial Services Overview
3. Key Business Segments Snapshot
4. Way Forward
3
5
16
36
Table of Contents
2

Aditya Birla Financial Services
Copyright © 2017 Aditya Birla Financial Services
Aditya Birla Group Overview 1
3

Aditya Birla Financial Services
Copyright © 2017 Aditya Birla Financial Services
69%
31%
65%
23%
12%
Maufacturing Services Trading
FY17 Revenue & EBITDA Contribution by Business
Metals & Mining
Cement
Textiles
Chemicals
Telecom
Fashion & Retail
Financial Services
Revenue
(Outer Circle)
EBITDA
(Inner Circle)
Total group
revenues of
~ 2USD 40 Bn
120,000+
employees
belonging to
42 nationalities
Derives ~50% of
revenues from
overseas
operations
Serves 200
million+
customers
~1.4 million
shareholders with
Market cap of 1USD 42 Bn+
(as on 31st May ‘17)
Runs 48 schools &
20 hospitals –
Reaches out to
7.5 Mn people
annually through
CSR work
India’s 1st truly
global
multinational Operating in 36
countries across
6 continents
4
2Revenue: ~USD 40 Bn
2EBITDA: ~USD 6 Bn
Aditya Birla Group A leading business conglomerate and one of India’s most respected business groups
FY17 Revenue & EBITDA Contribution by Sector
1US$ = INR 65 2US$ = INR 67.1.(Annual Average)

Aditya Birla Financial Services
Copyright © 2017 Aditya Birla Financial Services
Aditya Birla Financial Services Overview 2
5

Aditya Birla Financial Services
Copyright © 2017 Aditya Birla Financial Services
Aditya Birla Financial Services Resulting structure post listing
Birla Sun Life
Asset Management
Company Limited 1
Aditya Birla
Finance
Limited
Aditya Birla
Capital Advisors
Private Limited
Aditya Birla
Housing
Finance Limited
Aditya Birla
Health Insurance
Co. Limited 1
51% 100% 100%
Aditya Birla
Money Limited
75% 51%
6
Listed
Aditya Birla
Insurance
Brokers
Limited 2
50.002% 100%
Aditya Birla
Financial Shared
Services Limited
100%
Aditya Birla
Customer Services
Limited 3
93.7%
Aditya Birla Financial Services Limited
1 Indicates JV. 2 49.998% of ABIBL is held by Infocyber India Pvt Ltd. 3 6.3% of ABCSL is held by employee welfare trust (under ESOP)
Note: ABFS structure contains major subsidiaries and excludes step down subsidiaries, if any
Birla Sun Life
Insurance
Company Limited 1
Aditya Birla ARC
Limited
Aditya Birla
Wellness Private
Limited 1
100% 51%
51%
57.3%
Public
Investors
25.6%
Promoter
Group
17.1%

Aditya Birla Financial Services
Copyright © 2017 Aditya Birla Financial Services
Renowned for risk management, investor education, product
innovation and fund management capabilities
Acknowledged for leadership development practices and
talent management
Among the best 3 financial services players to work for [As
per study by Great Place to Work Institute, 2016]
Present across the spectrum of financial services with 12 lines of business
catering to varied needs of our customer across their lifetime
An integrated play with a competitive edge through sharing of best practices,
deriving cross – business synergies & providing talent pool with world of
opportunity to grow
Aditya Birla Financial Services Progressing in line with its vision
7
Among
Top 5 Fund Managers in India
(excl. LIC)
# 5 Private Life Insurance
Company in India
# 4 Asset Management
Company in India
Among
Top 5 Private Diversified
NBFCs in India
Among
Top 5 General Insurance
Brokers in India
Source: AMFI, IRDAI & Company Reports

Aditya Birla Financial Services
Copyright © 2017 Aditya Birla Financial Services
80
117
177
277
388
FY13 FY14 FY15 FY16 FY17
Lending Book** (₹ Bn)
1,074
1,223
1,648
1,843
2,463
FY13 FY14 FY15 FY16 FY17
AUM* (₹ Bn)
8
*Includes AUM of Life & Health Insurance, Private Equity and quarterly average AUM of Asset Management businesses. **Includes Lending Book of NBFC & Housing Finance businesses
Aditya Birla Financial Services Key Metrics
8

Aditya Birla Financial Services
Copyright © 2017 Aditya Birla Financial Services
64
66
79
93
106
FY13 FY14 FY15 FY16 FY17
Revenue (₹ Bn)
9
Note: The financial information above is extracted from the IGAAP financial statements of the individual subsidiaries and joint ventures of ABFS and represents a summation of 100% of the financial information contained in such financial statements, before any
adjustments, inter-company eliminations or minority interest. This financial information is unaudited.
Aditya Birla Financial Services Financial Information
7.6 7.3
8.5
9.9
11.5
FY13 FY14 FY15 FY16 FY17
PBT (₹ Bn)

Aditya Birla Financial Services
Copyright © 2017 Aditya Birla Financial Services
Note: The financial information above is extracted from the IGAAP financial statements of the individual subsidiaries and joint ventures of ABFS and represents a summation of 100% of the financial information contained in such financial statements, before any
adjustments, inter-company eliminations or minority interest. This financial information is unaudited
11%
72%
29%
-14%
2%
52%
32%
9%
4%
3%
Aditya Birla Financial Services Leading financial services conglomerate
Revenue
(Outer Circle)
PBT
(Inner Circle)
New Businesses2
Asset Management
NBFC
Life Insurance
AUM
INR 2,463 Bn
(US$1 37.9 Bn)
Lending Book
INR 388.4 Bn
(US$1 6.0 Bn)
Agents &
Channel
Partners
142,000+
Pan-India
Presence
1300+ Points of
presence across
400+ cities
Employees
12000+
Revenue
INR 105.7 Bn
(US$1 1.6 Bn)
PBT
INR 11.5 Bn
(US$1 177 Mn)
10
Revenue: INR 105.7 Bn PBT: INR 11.5 Bn
2New Businesses include Health Insurance, Housing Finance & Online Money Management. 1US$ = INR 65
.
Others
FY17 Revenue & PBT Contribution by Business

Aditya Birla Financial Services
Copyright © 2017 Aditya Birla Financial Services
Our Distribution Multichannel Presence
11
260+ National Distributors
MULTICHANNEL
APPROACH
54K+ Independent
Financial Advisors
1800+ Health
Insurance Agents
84 Banks
1300+
Points of Presence
73K+ Life Insurance
Agents
Online/Direct
3300+ DSAs in
Lending

Aditya Birla Financial Services
Copyright © 2017 Aditya Birla Financial Services
Our Product Suite Delivery through 12 lines of businesses
12
Protecting Investing Financing Advising
- Life Insurance
- Health Insurance
- Motor Insurance
- Mutual Funds
- Wealth Management
- Private Equity
- Stocks, Commodity
and Currency Trading
- Home Loans
- Personal Loans
- SME Loans
- Corporate Loans
- Aggregating
- Financial planning
- Tools & calculators Our Solutions
Our Innovation
& Performance
- Among the first few
to launch ULIP in
India
- Chronic care,
Incentivised wellness
& Health returns
- 98.3% of Mutual Fund
AUM in Quartile 1 & 2
(based on 3 year returns)
- Returns since
inception of Birla Sun
Life Frontline Equity
Fund is 22.5% p.a.
- Among the first few
to launch IPO
Financing
- Forayed into Digital
& Unsecured
Lending
- Online Money
Management
- ZipSip
Note: Quartile Analysis is based on customized peer set provided by Birla Sun Life Asset Management Source: Value Research,

Aditya Birla Financial Services
Copyright © 2017 Aditya Birla Financial Services
3 Tier Framework
Level
1
Audit & governance
committees
Level
2
Risk oversight
Level
3
Oversight by function
Risk Management at ABFS
Transaction Risk
Portfolio Risk
Credit Policy &
Processes
Credit Risk Management
Investment Risk Management & ALM
Key Controls
Oversight by
Committees
Operations Risk Management
Risk Assessment
Operational Loss
monitoring
Key Controls
Policies
Robust internal risk rating
Central risk aggregation system
Strong underwriting, Structuring and Legal capabilities
Credit delegation, Approval structure & Portfolio monitoring
Portfolio risk analysis
Attribution risk analysis
Risk and control self assessment
Information security framework
Robust business continuity framework & Disaster recovery
13

Aditya Birla Financial Services
Copyright © 2017 Aditya Birla Financial Services
Experienced Leadership Management Structure
CEO, ABFS
Ajay Srinivasan
14
CEO, General
Insurance Brokers
Sandeep Dadia
CEO, Health
Insurance
Mayank Bathwal
Average experience
of 23+ years in
Financial Services
domain
Average experience
of 10 years in ABG
A. Balasubramanian
CEO, Private Equity
D. Muthukumaran
CEO, Infra & Broking
Tushar Shah
CEO, Asset
Management
MD Life Insurance &
Dy. CEO ABFS
Pankaj Razdan
CMO
Ajay Kakar
CPO
Subhro Bhaduri
CEO Online Money
Management & CDO
Gaurav Zutshi
COO
Mukesh Malik
CRO
A Dhananjaya
CEO, Non-Infra,
Housing & Wealth
Rakesh Singh
President Business
Development
Pramo Selvaratnam
CFO
Anjali Makhija
Business CEOs
ABFS Management

Aditya Birla Financial Services
Copyright © 2017 Aditya Birla Financial Services
Awards & Recognitions
15
B.M Munjal Award for Learning & Development 2017 (Private sector services)
‘IMC Ramakrishna Bajaj National Quality Award’ in the Service Category, 2016
“Best companies to work for” by Business Today and PeopleStrong, 2016
Top 50 companies to work by ‘Great Places to Work For’ Institute among 700 companies, 2016
Society for Human Resource Management (SHRM) award for ‘Excellence in Developing leaders of Tomorrow’, 2016
Gold & Silver in Midas Awards New York, 2016
Best Digital Integrated Campaign’ & ‘Best Digital Marketing Campaign’ by ‘BBC Knowledge National Digital Marketing Awards’
‘Abby 2017 Bronze’ for ‘The Movekars’ campaign, 2017
HR & BUSINESS
EXCELLENCE
MARKETING
Overall Fund House of the Year at Thomson Reuter Lipper Awards, 2017
6th Annual Indian Legal awards for ‘Best Insurance In-house Legal team
Best of the Best Awards, “Best Fund House - Investor Education”, at the Asia Asset Management Awards, 2016
‘CIO of the Year - Equity’& ‘CIO of the Year- Fixed Income’ at the Asia Asset Management Awards, 2017
Runner Up – Equity AMC of the Year, at the Outlook Money Awards, 2016
Birla Sun Life Insurance - Ranked 4th in customer loyalty in a study conducted by Kantar IMRB in 2017
PERFORMANCE

Aditya Birla Financial Services
Copyright © 2017 Aditya Birla Financial Services
Key Business Segments Snapshot 3
16

Aditya Birla Financial Services
Copyright © 2017 Aditya Birla Financial Services
17
Indian NBFC sector
(₹ Bn)
Highly underpenetrated market Rising share of non-banks in credit growth
NBFCs outperforming banks in asset quality and returns by a wide margin
9.1%
4.9%
Banks NBFCs
GNPA
10 year CAGR
NBFCs 20%
Banks 16%
84% 82%
79% 16%
18%
21%
Mar'06 Mar'11 Mar'16
16,345 42,315
76,944 353%
237% 193%
163% 163% 107%
76%
175%
Japan US China S. Africa UK Brazil India World
Credit as % of GDP (2015)
0.4%
2.2%
Banks NBFCs
ROA
5.0%
10.5%
Banks NBFCs
ROE
Note: GNPA, ROA and ROE are for half year ended 30th Sep’16. ROA and ROE are annualised Source: World Bank, RBI & Kotak Institutional Equities

Aditya Birla Financial Services
Copyright © 2017 Aditya Birla Financial Services
80 117
176
258
347
FY13 FY14 FY15 FY16 FY17
Lending Book (₹ Bn)
Aditya Birla Finance Consistently delivering quality growth
Source: Company reports
A1+ rating for short term debt &
AA+ rating for long term debt
Capital Infusion of ₹ 28.2 Bn in
past 5 years to support growth “Among Top 5” – Private
Diversified NBFCs in India1 Gross NPA of 0.47% at 120 DPD
Note: Wealth management business merged with ABFL wef 1st April, 2016. Wealth AUA stood at INR 135 Bn as on 31st March 2017
18

Aditya Birla Financial Services
Copyright © 2017 Aditya Birla Financial Services
Diversification (1/2) Portfolio mix by products & customers
Mid Corporate
15%
Others
3%
Promoter & Ultra - HNI
10%
19
LAS 10%
Project Loan 13%
Structured Finance 10%
TL / WCDL 16%
Cons Fin 4% Project Loan 1%
Structured Finance 5%
TL / WCDL 5%
Digital & Unsecured 1%
LAP 4%
LAS 1%
Broker 2%
LAP 7%
LRD 7%
Supply Chain 3%
TL / WCDL 8%
Others 3%
Loan Book Mix
₹ 347 Bn (Mar’17) Large Corporate
39%
SME
27%
Retail
6%

Aditya Birla Financial Services
Copyright © 2017 Aditya Birla Financial Services
58% 20%
18%
4%
West North South East
Margin
Trade
Funding
IPO
Funding
Promoter
Funding
Loan
against
Shares
In the Past
Supply
Chain
Finance
Loan
against
Property
SME
Lending
Project &
Structured
Finance
Lease
Rental
Discount
Com.
Property
purchase
DCM Builder
Finance
FY12 - 13
Personal
Loans Wealth
Management
Digital
Lending
Unsecured
Business
Loans
FY14 - 17
Healthcare Financing
Planned Foray
Consumer Durables
Financing
Education Loans
Portfolio Mix by Geography (%)
Diversification (2/2) Accessing wider market with risk mitigation
79%
21%
Sourcing Mix (%)
Direct Channel Partners
20
(Excl Wealth) (Excl Wealth)

Aditya Birla Financial Services
Copyright © 2017 Aditya Birla Financial Services
(₹ Mn)
14.3% 13.1%
14.6% 15.4% 15.8%
1.9% 1.9% 2.0% 2.1% 2.1%
FY13 FY14 FY15 FY16 FY17
ROE ROA
7151
12012
17762
24633
34247
1471 2513 4109
6264 8319
FY13 FY14 FY15 FY16 FY17
Revenue PBT
Aditya Birla Finance Key Financials, Value Drivers & Metrics
21
36%
31% 29%
24% 27%
FY13 FY14 FY15 FY16 FY17
Opex to Net interest (%) (Excl Wealth)
10.8
17.7
25.8
37.0
49.9
FY13 FY14 FY15 FY16 FY17
Net Worth (₹ Bn)
Sub-debt 5%
Term Loans 27%
Cash Credit / WCDL 9%
CPs 26%
NCDs 33%
Borrowing Mix (31 Mar’ 17)
1.23% 1.29%
0.90%
0.63% 0.47%
0.83%
0.58%
0.32% 0.22% 0.21%
FY13 FY14 FY15 FY16 FY17
Gross NPA Net NPA(Excl Wealth)
Note: Financials are as per IGAAP; Aditya Birla Finance Limited uses simple equivalent method to calculate ROE. Gross & Net NPA figures are for 180 DPD till FY15, 150 DPD in FY16 & 120 DPD in FY17

Aditya Birla Financial Services
Copyright © 2017 Aditya Birla Financial Services
1.18
0.56
FY14
1.11
0.45
FY13
1.7%
7.3%
8.5%
FY 96-97 FY 05-06 FY 14-15
Aditya Birla Housing Finance A growth business with low credit losses
22
Gross & Net NPA of all Housing Finance Companies
Highly underpenetrated market
37% 34% 35%
32%
18%
5% 3%
US UK Spain France Japan China India
Housing Loan as % of Total Loan Portfolio (2015)
Share of non-banks in outstanding housing loans
CAGR
NBFCs 21%
Banks 17%
(₹ Bn)
Source: NHB
Sector with low credit losses
Rising share of housing loans as % of GDP at market prices
1.08
0.47
FY15
Gross NPA (%)
Net NPA (%)
62% 60% 60%
38% 40%
40%
FY13 FY14 FY15
7,551 8,785
10,632

Aditya Birla Financial Services
Copyright © 2017 Aditya Birla Financial Services
56% 32%
12%
Product composition (%)
HL
LAP
CF
Aditya Birla Housing Finance Key Financials, Value Drivers & Metrics
23
1420
19,729
41,363
FY15 FY16 FY17
Lending Book (₹ Mn)
Commenced operations in
October ‘14 Footprint expanded to 34 markets
by March ‘17
Net Worth at ₹ 3675 Mn as on
March ‘17
Turned profitable within 7 quarters
of full operations
10.9% 10.7%
3.8% 3.2%
FY16 FY17
Yields & NIM (%)
Yields NIM
43%
57%
Sourcing Mix (%)
Direct
Channel Partners
Note: Financials are as per IGAAP

Aditya Birla Financial Services
Copyright © 2017 Aditya Birla Financial Services
Strong growth in net equity inflows
56% 56% 57%
23% 24% 24%
21% 20% 19%
Q4 FY15 Q4 FY16 Q4 FY17
Top 5 Next 5 Others
24
Indian Mutual Fund Industry
104%
56% 54% 46%
36%
11% 10%
55%
US Brazil UK S. Africa Japan China India World
AUM to GDP Ratio (%) (Sep-2016)
.
Note : GDP at current prices - 2015
11,875 13,522
18,282
Q4FY15 Q4FY16 Q4FY17
(₹ Bn)
-144 -113
809 938
1,070
FY13 FY14 FY15 FY16 FY17
(₹ Bn)
Highly underpenetrated market Industry AUM has grown at 24% CAGR in 2 years
Highly concentrated industry
Source: World Bank, IIFA, SEBI, & AMFI
(AUM)

Aditya Birla Financial Services
Copyright © 2017 Aditya Birla Financial Services
13% 12% 19% 21%
24%
79% 80%
70%
69%
69%
8%
8%
10%
10%
7%
Q4 FY13 Q4 FY14 Q4 FY15 Q4 FY16 Q4 FY17
AUM (₹ Bn)
Domestic Equity Domestic Fixed Income Offshore & Alternate assets
4th Largest in India with AUM
of ₹ 2,107 Bn (Q4 FY 17)
25
Birla Sun Life Asset Management Consistent growth on the back of superior investment performance
Multi channel distribution including
Banks, NDs, IFAs & Direct #4 in Equity AAUM
Alternate Assets AuM at ₹ 157 Bn
(Q4 FY 17)
2,107.4
1,334.7
1,524.3
963.4
833.5
Note: Financials are as per IGAAP
5.5% 6.0%
7.1% 7.6%
8.5%
9.4% 9.8%
10.1% 10.1%
10.7%
Q4 FY13 Q4 FY14 Q4 FY15 Q4 FY16 Q4 FY17
Rising Market Share (%)
Equity Market Share Domestic Market ShareSource: AMFI

Aditya Birla Financial Services
Copyright © 2017 Aditya Birla Financial Services 26
Birla Sun Life Asset Management Solid Investment Performance
92%
81%
100% 96% 97%
92% 93% 93% 93%
50%
75%
100%
Mar-15 Mar-16 Mar-17
1Equity AUM (Based on 1 year return in Quartile 1 & Quartile 2)
1st & 2nd Quartile
98% 96% 100%
82%
95% 96% 98% 98%
84%
50%
75%
100%
Mar-15 Mar-16 Mar-17
1Total AUM (Based on 1 year return in Quartile 1 & Quartile 2)
1st & 2nd Quartile
Source: Value Research 1 Quartile analysis is based on customized peer set provided by Birla Sun Life Asset Management

Aditya Birla Financial Services
Copyright © 2017 Aditya Birla Financial Services
15%
41% 24%
20%
%
Bank Direct IFA National Distributor
94,117 1,35,921
1,73,183
2,69,766
6.8% 7.2%
7.9%
8.7%
Mar 2014 Mar 2015 Mar 2016 Mar 2017
B15 Cities Monthly AAuM
27
Birla Sun Life Asset Management Key Financials, Value Drivers & Metrics
Channel Mix
869 997
1,769
2,818
5,035
Mar-13 Mar-14 Mar-15 Mar-16 Mar-17
SIP book size grew 5.5x
(₹ Mn)
Note: Financials are as per IGAAP
(₹ Mn)
Source: AMFI
4,052
5,018
5,960
7,652
9,685
1,074 1,403 1,816
3,136 3,371
FY13 FY14 FY15 FY16 FY17
Revenue & PBT (₹ Mn)
Revenue PBT

Aditya Birla Financial Services
Copyright © 2017 Aditya Birla Financial Services
Others
Top 4 bank backed players
28
Indian Life Insurance Industry
65% 63% 46%
35% 37% 54%
FY07 FY12 FY17
Individual APE (₹ Bn)
Highly underpenetrated market Private players driving growth & gaining share
Channel mix has favoured bank backed players
Share in private player’s individual APE
Private players increasing individual APE growth
3,431 3,363
2,569 2,362
690 302 168 43
UK Singapore US Japan S. Africa Malaysia Brazil India
Life Insurance premium density per capita (USD) [2015]
403
479 532
10 year CAGR
Private +7%
LIC -1%
Note: Annual Premium Equivalent (APE) = 100% of regular premium + 10% of single premium
52% 65%
48% 35%
FY12 FY17
Source: OECD & IRDA Report
2% -3%
16% 14%
26%
FY13 FY14 FY15 FY16 FY17
Growth in private player’s individual APE

Aditya Birla Financial Services
Copyright © 2017 Aditya Birla Financial Services
74%
16%
10%
Agency Third Party Direct Marketing
# 5 private life insurer with new
business market share at 7.1% 13th Month persistency : 71.5%
Multi channel distribution including
Agency, Bancassurance, Brokers &
Direct Marketing
#1 in group business
(~25% APE share FY17)
29
Birla Sun Life Insurance Key Highlights
Individual New Business Mix
Note: Financials are as per IGAAP Source: IRDA 1:Annual Premium Equivalent (APE) = 100% of regular premium + 10% of single premium
18 17 19 22 25
34 31
33 34
32
FY13 FY14 FY15 FY16 FY17
Total Premium (₹ Bn)
Renewal New Business
52 48
52 56 57

Aditya Birla Financial Services
Copyright © 2017 Aditya Birla Financial Services 30
Birla Sun Life Insurance Key Financials, Metrics & Value Drivers
Note: Financials are as per IGAAP
36.9
32.2 32.6 32.8
134.3
FY13 FY14 FY15 FY16 FY17
Embedded Value (₹ Bn)
81.3%
60.0% 62.2%
64.7%
71.5%
FY13 FY14 FY15 FY16 FY17
13th Month Persistency (%)
16.6 16.2
14.1
15.2
17.0
FY13 FY14 FY15 FY16 FY17
VNB Margin (%)
1:Provisional
5.4
3.7
2.9
1.4 1.2
FY13 FY14 FY15 FY16 FY17
PBT (₹ Bn)

Aditya Birla Financial Services
Copyright © 2017 Aditya Birla Financial Services
31
Indian Health Insurance Industry
Lowest expenditure on health among peers 85% of Health expenses funded Out-of-Pocket
17%
9% 9%
7% 6%
5% 5%
UK USA South Africa Thailand China Singapore India
Source: WHO
13% 21%
57% 58%
72% 85%
83% 64%
31% 20%
10%
5%
5% 14% 12% 22% 17% 10%
South Africa USA Thailand UK China India
Out-of-Pocket Health Insurance Other Pvt Expenditure

Aditya Birla Financial Services
Copyright © 2017 Aditya Birla Financial Services
Diversified financial services leader from South Africa
Experience in Incentivized Wellness which has been integrated successfully
Sound technical and product capabilities incl. Chronic care & Wellness
Tied-up with 4 banking partners -
HDFC Bank
Deutsche Bank
DCB Bank
RBL Bank
Agency - Initial roll out in 7 cities and 9 branches with around 1,800 Agents
Tie-up with 50+ Brokers and Digital and Online Tele-assisted channel launched
Unique offerings include Chronic Care and Incentivized Wellness
Move from “Buy & Forget” to “Buy & Engage” with philosophy of ‘Health First’
.
Digitized delivery and use of technology to integrate entire ecosystem
Key digital assets launched – Seller portal and Customer APP – ‘Activ
Health’
Wellness app ’Ab Multiply’ live on App Stores
Aditya Birla Health Insurance - An exciting Partnership
51:49 JV of Aditya Birla Financial Services
and MMI Holdings.
Business launched in Nov’16 Unique product opening doors of distributors
32
MMI Holdings - our J. V. Partner
Distribution Digital Ecosystem
Product Proposition
Aditya Birla Financial Services
Copyright © 2017 Aditya Birla Financial Services
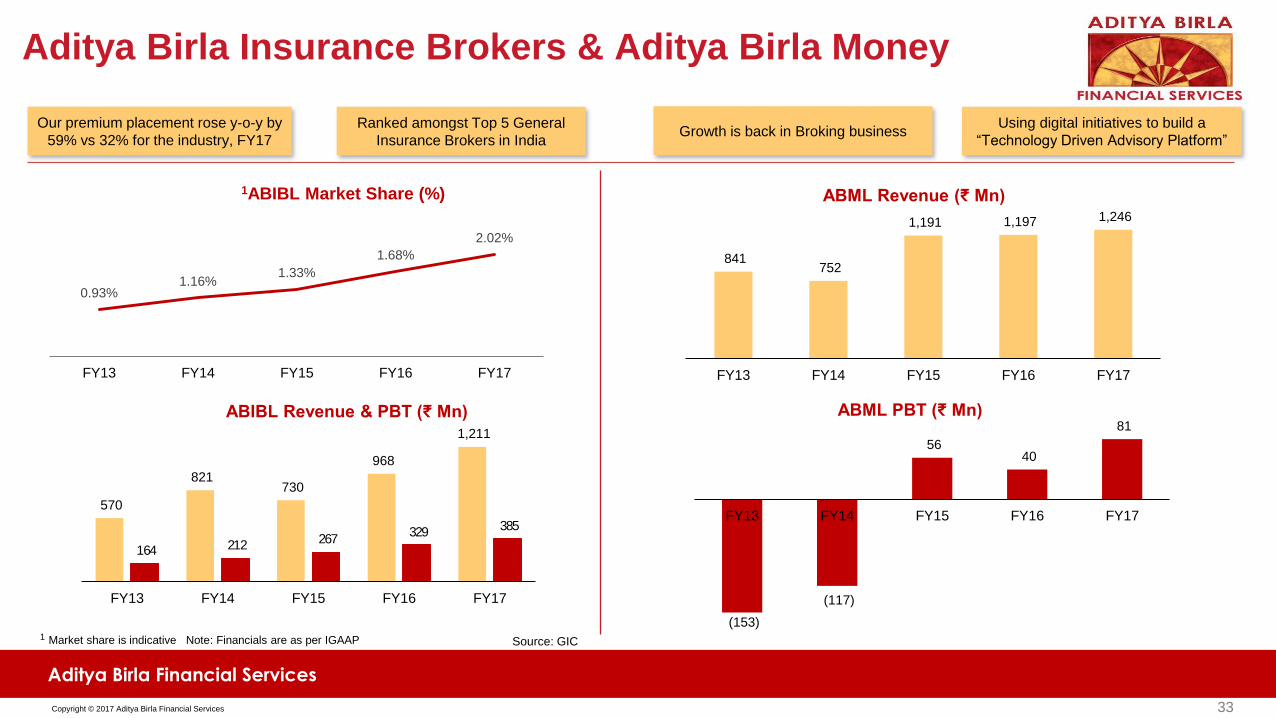
(153)
(117)
56 40
81
FY13 FY14 FY15 FY16 FY17
ABML PBT (₹ Mn)
0.93% 1.16%
1.33%
1.68%
2.02%
FY13 FY14 FY15 FY16 FY17
33
Aditya Birla Insurance Brokers & Aditya Birla Money
570
821 730
968
1,211
164 212 267 329
385
FY13 FY14 FY15 FY16 FY17
ABIBL Revenue & PBT (₹ Mn)
Our premium placement rose y-o-y by
59% vs 32% for the industry, FY17
Ranked amongst Top 5 General
Insurance Brokers in India Growth is back in Broking business
Using digital initiatives to build a
“Technology Driven Advisory Platform”
1ABIBL Market Share (%)
841 752
1,191 1,197 1,246
FY13 FY14 FY15 FY16 FY17
ABML Revenue (₹ Mn)
1 Market share is indicative Note: Financials are as per IGAAP Source: GIC

Aditya Birla Financial Services
Copyright © 2017 Aditya Birla Financial Services
Registered users
3.76 Mn
User aggregated accounts
Money under aggregation
1.3 Mn
₹ 205 Bn
Aditya Birla My Universe
Automated PFM mobile app with
online aggregation in India
One of the largest SIP distributors by
Numbers
International Finance Corporation
is a strategic investor in My
Universe
34
Transaction Execution
Analytics-based
Advisory
Aggregation
Product Offerings
Mutual
Funds Equities
Loans &
Credit
Cards
Life &
General
Insurance
Others –
Bonds, Tax-
filing, etc.
Full service financial multi-product platform
34
Leading Online Money
Management Platform

Aditya Birla Financial Services
Copyright © 2017 Aditya Birla Financial Services 35
Growth Opportunities
Average Ticket
Size INR 8 – 15 Lakhs
Customer
Segment Low/ Middle Income Group
Pilot In progress at 21 locations
Direct SME
Financing
Online Direct Business
E commerce Anchor Business
Program Based Lending
Digital process end to end
Rise in NPAs provides supply with 80%
of market untapped
Expected commercial launch in Q3 / Q4
2018 post RBI approval
Business moving to cash basis will
need to create operational turnaround

Aditya Birla Financial Services
Copyright © 2017 Aditya Birla Financial Services
Way Forward
36
Birla Sun Life Asset Management Company Limited
4

Aditya Birla Financial Services
Copyright © 2017 Aditya Birla Financial Services
ABFS Roadmap
37
Customer Cross Sell
Distributor Employee
• Unified brand
• Unified experience
• Common distributor program
• Leverage digital assets to
drive customer acquisition
and improve experience
• Analytics capability
• Cross sell & upsell
• Building leadership pipeline
• Great place to work
Branding Digital
• Strategic tie-ups
• Acquisitions
Inorganic Growth

Aditya Birla Financial Services
Copyright © 2017 Aditya Birla Financial Services 38
Birla Sun Life Asset Management Company Limited Contact Us
CIN: U67120GJ2007PLC058890
Regd. Office: Indian Rayon Compound, Veraval – 362 266, Gujrat
Corporate Office: One Indiabulls Centre, Tower 1, Jupiter Mills Compound, 841, Senapati Bapat Marg, Elphinstone Road, Mumbai – 400 013
Aditya Birla Financial Services Limited

Aditya Birla Financial Services
Copyright © 2017 Aditya Birla Financial Services 39
Birla Sun Life Asset Management Company Limited Disclaimer
The information contained in this presentation is provided by Aditya Birla Financial Services Limited (“ABFSL or the Company”) to you solely for your reference. This document is being given solely for your
information and for your use and may not be retained by you and neither this presentation nor any part thereof may be (i) used or relied upon by any other party or for any other purpose; (ii) copied,
photocopied, duplicated or otherwise reproduced in any form or by any means; or (iii) re-circulated, redistributed, passed on, published in any media, website or otherwise disseminated, to any other person,
in any form or manner, in part or as a whole, without the prior written consent of the Company. This presentation does not purport to be a complete description of the markets conditions or developments
referred to in the material. Any reference herein to "the Company" shall mean Aditya Birla Financial Services Limited, together with its subsidiaries / joint ventures.
Although care has been taken to ensure that the information in this presentation is accurate, and that the opinions expressed are fair and reasonable, the information is subject to change without notice, its
accuracy, fairness or completeness is not guaranteed and has not been independently verified and no express or implied warranty is made thereto. You must make your own assessment of the relevance,
accuracy and adequacy of the information contained in this presentation and must make such independent investigation as you may consider necessary or appropriate for such purpose. Neither the
Company nor any of its directors, officers, employees or affiliates nor any other person assume any responsibility or liability for, the accuracy or completeness of, or any errors or omissions in, any
information or opinions contained herein, and none of them accept any liability (in negligence, or otherwise) whatsoever for any loss howsoever arising from any use of this presentation or its contents or
otherwise arising in connection therewith. Any unauthorised use, disclosure or public dissemination of information contained herein is prohibited. The distribution of this presentation in certain jurisdictions
may be restricted by law. Accordingly, any persons in possession of the aforesaid should inform themselves about and observe such restrictions.
The statements contained in this document speak only as at the date as of which they are made, and the Company expressly disclaims any obligation or undertaking to supplement, amend or disseminate
any updates or revisions to any statements contained herein to reflect any change in events, conditions or circumstances on which any such statements are based. By preparing this presentation, neither the
Company nor its management undertakes any obligation to provide the recipient with access to any additional information or to update this presentation or any additional information or to correct any
inaccuracies in any such information which may become apparent. This document is for informational purposes and private circulation only and does not constitute or form part of a prospectus, a statement in
lieu of a prospectus, an offering circular, offering memorandum, an advertisement, and should not be construed as an offer to sell or issue or the solicitation of an offer or an offer document to buy or acquire
or sell securities of the Company or any of its subsidiaries or affiliates under the Companies Act, 2013, the Securities and Exchange Board of India (Issue of Capital and Disclosure Requirements)
Regulations, 2009, both as amended, or any applicable law in India or as an inducement to enter into investment activity. No part of this document should be considered as a recommendation that any
investor should subscribe to or purchase securities of the Company or any of its subsidiaries or affiliates and should not form the basis of, or be relied on in connection with, any contract or commitment or
investment decision whatsoever. This document is not financial, legal, tax, investment or other product advice.
The Company, its shareholders, representatives and advisors and their respective affiliates also reserves the right, without advance notice, to change the procedure or to terminate negotiations at any time
prior to the entry into of any binding contract for any potential transaction. This presentation contains statements of future expectations and other forward-looking statements which involve risks and
uncertainties. These statements include descriptions regarding the intent, belief or current expectations of the Company or its officers with respect to the consolidated results of operations and financial
condition, and future events and plans of the Company. These statements can be recognised by the use of words such as “expects,” “plans,” “will,” “estimates,” or words of similar meaning. Such forward-
looking statements are not guarantees of future performance and actual results, performances or events may differ from those in the forward-looking statements as a result of various factors and
assumptions. You are cautioned not to place undue reliance on these forward looking statements, which are based on the current view of the management of the Company on future events. No assurance
can be given that future events will occur, or that assumptions are correct. The Company does not assume any responsibility to amend, modify or revise any forward-looking statements, on the basis of any
subsequent developments, information or events, or otherwise.
This presentation is not an offer of securities for sale in the United States or in any other jurisdiction. Securities may not be offered or sold in the United States absent registration or an exemption from
registration under the U.S Securities Act of 1933, as amended.