a silicon-29 nuclear magnetic resonance study of silicon ... · a silicon-29 nuclear magnetic...
TRANSCRIPT

Phys Chem Minerals (1988) 15:370-382 PHYSICS CHEMIS]]IY @ MINERW © Springer-Verlag 1988
A Silicon-29 Nuclear Magnetic Resonance Study of Silicon-Aluminum Ordering in Leucite and Analcite J.B. Murdoch 1, J.F. Stebbins 2, I.S.E. Carmichael a, and A. Pines 4 1 Picker International, Inc., NMR Clinical Science Center, 5500 Avion Park Drive, Highland Heights, OH 44143, USA 2 Department of Geology, Stanford University, Stanford, CA 94305, USA 3 Department of Geology, University of California, Berkeley, CA 94720; and Earth Sciences Division, Lawrence Berkeley Laboratory, Berkeley, CA 94720, USA 4 Department of Chemistry, University of California, Berkeley, CA 94720; and Materials and Molecular Research Division, Lawrence Berkeley Laboratory, Berkeley, CA 94720, USA
Abstract. Silicon-29 magic-angle-spinning NMR spectro- scopy has been used to investigate the silicon-aluminum distribution in natural samples of analcite and leucite (be- fore and after heat treatment) as well as a leucite synthesized from a gel. Three different simulation programs have been developed to fit the experimental spectra. For two we as- sume a different aluminum occupancy fraction g~ for each of the three crystallographically distinct tetrahedral sites T~ in leucite and some degree of aluminum avoidance, but an otherwise random arrangement of tetrahedral cations. A third program interchanges A1 and Si cations on a lattice of 3 x 3 x 3 unit cells to generate an optimized fit. All models predict that the T2 sites in natural leucite are deficient in aluminum: g ~ 0 . 3 9 , g2~0.16, and g3~0.42 for the frac- tional A1 occupancy at each site, with apparently strict alu- minum avoidance. Heat treatment of the sample at 1673 K for a week has little effect on the gz values but may create some A 1 - O - A 1 linkages. In the gel-synthesized leucite, A1 occupancies are slightly more uniform than in natural leucite: gl ~ 0.36, g2 ~ 0.20, and g3 ~ 0.42.
For analcite, two distinctly different Si, A1 distributions are obtained: (A) g l=g3~0.09, g2~0.78 and (B) g l=g3 ~0.46, g2~0.04. Additional NMR measurements on an ion-exchanged sample or an accurate determination of unit- cell dimensions could resolve this ambiguity.
Introduction
In a previous paper (Stebbins et al. 1986), we described the use of silicon-29 nuclear magnetic resonance (NMR) spectro- scopy to study defects and short-range order in nepheline group minerals. Here we apply the same technique to inves- tigate the distribution of silicon and aluminum atoms in a second class of feldspathoid minerals, developing in the process several computational methods to find distributions that best match experimental spectra. Phase transitions in most of the samples we will discuss have also been examined recently using differential scanning calorimetry (Lange et al. 1986).
Leucite (KA1Si206) and analcite (NaA1SizO6-HzO) are silica-poor alkali aluminosilicates with the same topological arrangement of tetrahedral cations. As in feldspars, zeolites, and the silica polymorphs, the tetrahedra - SiO4 or A104
form a three-dimensional network structure, with every tetrahedron connected to four others. X-ray and neutron diffraction measurements on single crystals of these minerals (e.g. Taylor 1930; Peacor 1968; Ferraris et al. 1972; Mazzi et al. 1976; Mazzi and Galli 1978) can be used to determine the average coordinates of the tetrahedral sites in the unit cell. However, because diffraction techniques inherently measure long-range averages, determining the true local dis- tribution of silicon and aluminum atoms among these sites is often not possible. In particular, short-range disorder of- ten cannot be distinguished from long-range disorder that results from domain structure.
In contrast, NMR provides a direct, complementary look at short-range structure: a nucleus with non-zero spin is used as a probe of its local electronic environment. As pioneered by Lippmaa et al. (1980, 1981), 298i magic-angle- spinning (MAS) NMR has been of particular use in the study of silicate minerals. The isotropic chemical shift 6 sensitively reflects the bonding environment of a silicon nu- cleus, varying systematically with several local structural variables. In tectosilicates, the most important of these are the average inter-tetrahedral bond angle S i - O - T (Smith and Blackwell 1983; Thomas et al. 1983; Ramdas and Klin- owski 1984) and the number of aluminum next-nearest neighbors. Because of the latter effect, 29Si MAS NMR has been of crucial importance in determining the short-range (and hence energetically most important) distribution of A1 and Si in tectosilicates, particularly zeolites (e.g. Lippmaa et al. 1981; Fyfe et al. 1983).
Aluminum-27 MAS NMR at high magnetic fields can also be used to study the distribution of A1 among tetrahed- ral sites in leucite (Phillips and Kirkpatrick 1986). Future combination of the two types of data may eventually lead to improved models for feldspathoid structure.
Sample Characterization
We have examined three samples of natural leucite (one before and after heat treatment), one natural analcite speci- men, and a synthetic leucite. Compositional data for the leucite samples, mostly based on electron microprobe mea- surements, have been presented by Lange et al. (1986). The associated silicon-to-aluminum ratios are listed in Table 1. Powder diffraction data on all samples confirmed that they

Table 1. Silicon-to-aluminum ratios from chemical analysis of leucite and analcite samples"' b
Mt. Cimini leucite Heat-treated Roccamonfina Wyomingite Gel-synthesized Analcite Mt. Cimini leucite leucite leucite leucite c
Si/A1 ratio 2.05 2.02 2.06 2.35 2.09 2.13
371
" Leucite analyses from Lange et al. (1986) b Electron microprobe data, except where noted ° Wet chemical data
were pure, and for the synthetic phase, that the desired product was obtained.
Two samples were obtained from leucite-rich volcanic rocks in the Roman District, Italy: the first (labeled "89-21" in Lange et al. 1986) from Mt. Cimini, the second (Universi- ty of California, Berkeley, Department of Geology and Geo- physics, collection number 16682; labeled "90-05" by Lange et al.) from Roccamonfina. Each is close in composition to the ideal stoichiometry KA1Si206, and the two samples yielded very nearly identical 29Si MAS N M R spectra. These were analyzed separately, but also were averaged together to improve the overall signal-to-noise ratio and thus mini- mize the effect of artifacts in deconvolution and simulation. The combination will be referred to as "natural leucite." In addition, to study thermal effects on Si, A1 ordering, a portion of the Mt. Cimini sample was heat treated at 1673 K for one week.
The third leucite sample (labeled "1774" in Lange et al. 1986), which exhibits no optically observable twinning, is from the groundmass of a wyomingite lava obtained, appro- priately enough, in the Leucite Hills of Wyoming (Carmi- chael 1967). It contains 2.3 weight percent Fe and has a higher Si/A1 ratio (2.35) than the other feldspathoid samples we have examined.
To investigate the effect of excess SiO2 in solid solution, a synthetic leucite was prepared as a gel using the technique of Hamilton and Henderson (1968), then dehydrated and heated in a Pt crucible for 3 days at 1373 K, followed by 5 days at 1773 K (Lange et al. 1986, sample SL. 2). Electron microprobe and wet chemical data indicate that the product is approximately 86 weight percent KA1Si206 and 14 weight percent KA1Si30 s .
The analcite sample is in the form of colorless needles from Golden, Colorado (composition by weight from elec- tron microprobe data: 56.8 percent SiO2, 22.7 percent A1203, and 14.1 percent Na20, with 8.0 percent H20 speci- fied). A portion of this sample was dehydrated for 23 h at 1033 K. In turn, part of the dehydrated sample was used to create a potassium-exchanged analcite by heating it in molten KBr at 1033 K for 44 h. This procedure is not ex- pected to affect the distribution of A1 and Si cations (Wald- baum and Robie 1971). Intriguingly, however, the resulting leucite gave no zgsi N M R signal. The likely reasons for this lack of response will be discussed later.
Experimental Details
As in previous work (Stebbins et al. 1986), spectra were obtained on a "home-built" Fourier transform N M R spec- trometer operating at 8.5 tesla with a magic-angle-spinning probe from Doty Scientific. Powdered samples were spun in alumina rotors at 2.5-3.5 kHz, and spinning sideband
peaks were small for all samples except the wyomingite leu- cite.
From 660 to 8300 free induction decays were acquired and averaged together for each spectrum. The rf pulse tip angle was approximately 45 ° , and successive pulses were spaced at 4-120 seconds to avoid spectral distortion result- ing from incomplete spin-lattice (T1) relaxation. Silicon chemical shifts were measured relative to an external sample of tetramethylsilane or relative to a secondary standard: a spinning sample of crystalline jadeite (NaA1Si206, 6 = -92 .0 ppm). Except for the case of analcite, dehydrated analcite, and wyomingite leucite, no modification (other than truncation) of free induction decay signal was per- formed prior to Fourier transformation. Triangular apodi- zation of these data gave rise to an increase in linewidth of at most a few percent.
Isotropic lineshapes have been deconvoluted and simu- lated using a number of programs described in a later sec- tion. For all analyzed spectra, however, the small spinning sideband lineshapes have not been included in the deconvo- lution process: their lower signal-to-noise ratio plus some roll in the baseline preclude a quantitative multi-component fit. Omission of the sidebands introduces some error in the relative peak areas for each silicon type, which in turn affects the structural interpretation. However, we believe that this source of error can be neglected relative to the uncertainties in deeonvolution of the center peaks. Except in the case of the wyomingite leucite (which was only examined qualita- tively), no sideband is more than roughly 15 percent as high as the corresponding center peak. Moreover, the side- band lineshapes, when distinguishable, are miniature ver- sions of the center peaks, suggesting that, as one might expect, chemical shift anisotropies associated with the differ- ent silicon sites do not vary widely. Hence center peak areas are probably scaled down uniformly relative to total peak areas.
Structural Considerations
Before discussing the N M R spectra we have obtained, a closer look at the connectivity of tetrahedral cations in leu- cite minerals is necessary. There are 48 tetrahedral sites in the unit cell, which is cubic (or nearly so) for analcite and tetragonal for leucite itself. Galli et al. (1978) have pre- sented an elegant model for visualizing the intricate tetra- hedral framework. As noted also by Merlino (1984), the building block for this idealized structure can be considered to be a square prism with two of the long edges missing. The structure of a unit cell is shown in Figure 1, a view looking approximately along the c-axis. The circles repre- sent tetrahedral cations (A1 or Si), and intervening oxygens are omitted. Three sets of the aforementioned prisms can

372
OT, OT~
Fi :. 1. An idealized unit cell for leucite group minerals that illus- trates the connectivity of the 48 tetrahedral sites. Circles represent tetrahedral cations (Si or A1) and oxygens are omitted. The view is approximately along the c-axis, and the three types of crystallo- graphically distinct T~ sites in low-temperature leucite (space group 14t/a) are displayed
be seen, each set oriented parallel to one of the unit cell axes. The three sets of crystallographically distinct tetrahed- ral sites T~ for low temperature leucite (I41/a symmetry) are also apparent. Each tetrahedral node is part of two four-membered rings (end pieces of the prisms) and two six-membered rings (which appear chair-shaped in this rep- resentation). Not shown are the two types of interstitial sites occupied by charge-balancing alkali cations or water molecules: the so-called S sites, located at the center of each prism, and the W sites, located midway along the miss- ing edges of each prism. There are 24 S sites and 16 W sites per unit cell (Galli et al. 1978).
The topologic symmetry (Smith 1982) of the unit cell in Figure 1 is cubic: Ia3d, with all tetrahedral sites equiva- lent. Assuming a random arrangement of tetrahedral ca- tions A1 and Si, the topochemical symmetry (a long-range average over a multitude of unit cells) is also Ia3d. How- ever, a mismatch in the size of the extra-framework species present can induce structural distortion and lower the real symmetry. In pollucite [a naturally occurring cesium analog (Beger 1969)], large Cs + ions (and water molecules in some samples) occupy the W sites, and the overall cubic symmetry is maintained. In analcite, NaA1Si206-H20, water mole- cules occupy the W sites and sodium ions occupy two-thirds of the S sites (Galli et al. 1978). Its structure has also been characterized as cubic (Taylor 1930; Ferraris et al. 1972), but more recent work (Mazzi and Galli 1978) indicates that small deviations can exist and that the real symmetry is lower. Some samples were found by these authors to be tetragonal: I4~/acd, with sites T1 and Ta in Figure 1 equiva- lent and either e > a or a > e. Others were found to be ortho- rhombic ( l ab c).
In leucite, potassium ions occupy the W sites and the S sites are vacant. Above roughly 900 K, the symmetry is Ia3d as in pollucite (Peacor 1968). At lower temperatures, however, because K + is smaller than either Cs + o r H 2 0 , the framework structure collapses around the potassium ions to maintain a favorable K - O distance. The tetragonal
symmetry that results is I41/a, with a = 13.09 ~ , c = 13.75/k (Mazzi et al. 1976). The characteristic four-fold screw axes parallel to the c-axis are apparent in Figure 1.
Inversion from the high-temperature cubic phase to the low-temperature tetragonal phase also gives rise to exten- sive merohedric and pseudomerohedric twinning (Mazzi et al. 1976). However, because MAS N M R is a probe of short-range structure, the presence of twinning will have an effect on the leucite 298i spectrum only if silicons on the twin boundaries are a measurable fraction (at least one percent) of the total number of silicons present and if these silicons have a different chemical shift as a result of site distortion.
One may note that there are three varieties of four-mem- bered rings in the leucite structure: one with four T1 sites, one with four T 3 sites, and one composed of two T 2 sites, a T1 site, and a T3 site. The sites themselves can be further distinguished as follows:
Each T1 site has two Tt neighbors and two T2 neighbors. Each T2 site has two T~ neighbors and two T3 neighbors. Each T 3 site has two T2 neighbors and two T3 neighbors.
Because the chemical shift of a silicon-29 nucleus depends on the identity - Si or A1 - of adjacent tetrahedral cations, such connectivity information is crucial for interpreting the N M R lineshape and determining the nature of Si, A1 order- ing.
With this background, we can now examine how silicon and aluminum are distributed on the lattice of tetrahedral sites. Single-crystal x-ray diffraction results suggest that the arrangement is completely random in leucite; in analcite, random but with enrichment of A1 in one type of site and Si in the other, depending on the ratio of unit-cell dimen- sions (Galli et al. 1978).
N M R data provide information directly on local cation distributions. In particular, previous work on a wide variety of alkali aluminosilicates, including other feldspathoids (Stebbins et al. 1986), has demonstrated that in these materi- als, one constraint on tetrahedral cation disorder is of gener- al validity: the aluminum-avoidance principle or "Loewen- stein's rule" (Loewenstein 1954). This principle states that energetically unfavorable A 1 - O - A 1 linkages do not occur in aluminosilicates for which the Si/A1 ratio is greater than or equal to one. It appears to be true even for NaA1SiO4 (carnegieite) synthesized at 1673 K and for volcanic nephe- line ([Na, K] A1SiO4) (Stebbins et al. 1986). We will there- fore assume that some degree of aluminum avoidance is present in our analysis of leucite and analcite. (As will be shown, our data are indeed consistent with this assumption.)
Tectosilicates with network-modifying cations smaller or more highly charged than Na + or K + may show greater disorder, including A 1 - O - A 1 bonds, when prepared at high temperature or under disequilibrium conditions. The reasons for this difference are discussed below.
Results
Analcite
Figure 2 displays the 298i MAS N M R spectrum of analcite; peak positions, widths, and areas are listed in Table 2. Be- cause the tetrahedral sites T1 = T3 and T2 are very nearly equivalent (as evidenced in part by the S i - - O - - T angles listed below), 29Sj chemical shifts are a function only of the number of aluminum neighbors - there is no "intrinsic"

2 AI
Dehydrated Analcite
Analcite
1 AI 3A'r -60 -80 -100 -120
(~$i (ppm) Fig. 2. The z9Si MAS NMR spectrum of analcite (1259 acquisitions with a recycle time - the interval between successive rf pulses of 40 s). The chemical shift 6 is given in ppm relative to a tetrameth- ylsilane standard. In this and subsequent spectra, the thick solid line is the experimental lineshape, the thin solid lines delineate individual Gaussian components, and the dotted line is the sum of these deconvoluted peaks. The small spinning sidebands are not shown; they lie beyond the range of this plot
Table 2. Deconvolution of the analcite spectrum into Gaussian components
Peak Chemical FWHM" Relative Number of shift (ppm) (ppm) area (%) Al neighbors
1 - 91.6 3.5 14.8±0.3 3 2 - 96.8 3.1 59.7±0.3 2 3 -102.0 3.3 23.4±0.3 1 4 -106.9 3.4 2.0±0.3 0
" Full width at half-maximum of the Gaussian component
shift difference between sites. Hence each peak in Figure 2 corresponds to silicons with a fixed number of S i - O - A 1 linkages.
Peak assignments can be made using one of several em- pirical formulas that relate 6si to par t icular structural pa- rameters. F o r example, Ramdas and Klinowski (1984) have found that 6si in tectosilicates can be expressed as the sum of a constant term, a term propor t iona l to the average dis- tance to adjacent te t rahedral cations (expressed in terms of 0, the average S i - O - T bond angle), and an electrostatic deshielding term propor t iona l to k, the number of A1 neigh- bors. Combining their Equat ions 1 and 2 yields the follow- ing relat ionship:
6 = 143.03 - (263.61 + 2.64 k) sin 0/2 + 7.95 k. (1)
As such, 6 can be writ ten as a zero-aluminum-neighbor shift 6(0A1) plus k times a shift increment A6. Using bond angles obta ined by Mazzi and Galli (1978) for seven differ- ent analcite samples, one finds 0(T0=144.3°_+0.2 ° and 0(T2) = 144.5 ° _+0.4 °, where s tandard deviations are indicat- ed. F rom Equat ion 1, the average deviat ion between 0(7"1) and 0(T2) of 0.3 ° corresponds to an est imated chemical shift
-6o
373
-80 -100 -120 asi (ppm)
Fig. 3. The 29Si MAS NMR spectrum of dehydrated analcite (662 acquisitions, 120 s recycle time)
difference of at most 0.2 ppm. Hence for both sites, 6(0A1)= - 1 0 8 . 0 p p m , 6 ( 1 A 1 ) = - 1 0 2 . 5 p p m , 6 ( 2 A 1 ) = - 9 7 . 1 ppm, 6 ( 3 A 1 ) = - 9 1 . T p p m , 6 ( 4 A 1 ) = - 8 6 . 2 p p m , and A 6 = 5.44 ppm. These est imated chemical shifts are in good agree- ment with experimental values and substantiate the peak assignments in Figure 2 and Table 2. Note that there are apparent ly no silicons present with four A1 neighbors. The si l icon-to-aluminum rat io R can be obtained from the rela- tive peak areas Ik. The average number of a luminum neigh- bors per silicon is given by
(k> =X, klk/XIk; (2)
if Loewenstein's rule is obeyed,
R=4/<k) (3)
(Klinowski et al. 1982). Using the peak areas for analcite, one finds @ ) = 1 . 8 7 and R=2.14 , in excellent agreement with the electron microprobe measurement listed in Table 1. Were a substantial number of A 1 - O - A1 linkages present, the value of R obtained using Equat ion 3 would be consid- erably larger than the microprobe result. We will return to the analysis of analcite peak areas in a later section.
The 29Si M A S N M R spectrum of an analcite sample dehydrated at 1033 K for 23 hours is displayed in Figure 3. The absence of water molecules in the W sites has apparent- ly distorted the te t rahedral framework, broadening the peaks associated with each type of silicon present and in- creasing the overall range of chemical shifts. Because the spectrum lacks distinct " b u m p s " and shoulders, however, we have not a t tempted to deconvolute it into a sum of Gaussian components.
As stated earlier, we also prepared a potassium-ex- changed dehydra ted analcite that unfortunately gave rise to no measurable 29Si N M R signal. We believe that this lack of response is a consequence of an extremely long 298i spin-lattice re laxat ion time TI:[T1 is the characterist ic time for nuclear spin state popula t ions to return to their equilib- r ium values (following rf pulse per turbat ion) via energy ex- change with their surroundings.] Indeed, there is a likely reason why T1 (not to be confused with the te t rahedral

374
i I
-120
/ -80
6si (ppm)
I i I
-60 -100 L ~ i I i I I
-60 -80 -120
Fig. 4. (top) A weighted sum of 29Si MAS NMR spectra for the Mt. Cimini and Roccamonfina leucite samples (Mt. Cimini leucite: 1077 acquisitions, 40 s recycle time +2000 acquisitions, 5 s recycle time; Roccamonfina leucite: 2647 acquisitions, 15 s recycle time). (bottom) Model 3 lineshape simulation. T3, T2, and T1 subspectra appear from left to right
site designation) should be longer in our potassium-ex- changed analcite than in the untreated original sample. In non-porous silicates, the predominant coupling pathway be- tween nuclear spin states and the lattice is via the unpaired electrons in paramagnetic impurities, e.g. Fe z + or Fe 3 + ions (Barron et al. 1983). [Nuclei near the paramagnetic species relax rapidly; adjacent nuclei in an expanding shell are then relaxed by a process known as spin diffusion: an energy- conserving "flip-flop" of nuclear states (Abragam 1961).] The concentration of paramagnetic ions, low to begin with in our microprobe standard analcite specimen, was no doubt further reduced in the high-temperature ion exchange process. The resulting impurity concentration was appar- ently less than in our gel-synthesized leucite sample, for which a spectrum was readily obtained.
• A second mechanism that could account for the appar- ent increase in silicon T1 after ion exchange is a relaxation pathway involving dipole-dipole coupling between 298i and quadrupolar 23Na nuclei (100% isotopic abundance). Po- tassium-39 (93.1% abundant) is also a quadrupolar nucleus, but interacts less strongly with 29Si than does 23Na because its gyromagnetic ratio is smaller by a factor of 5.67. The same substitional effect on T1 has been seen in nepheline minerals (Stebbins et al. 1986) and in alkali silicate glasses (Schneider et al. 1987).
,-,eat:','rea,ed Leuc
I
8s~ (ppm)
J r I
-100
Fig. 5. The 29Si MAS NMR spectrum of the heat-treated Mt. Ci- mini leucite sample (1501 acquisitions, 20 s recycle time +4292 acquisitions, 15 s recycle time + 2500 acquisitions, 4 s recycle time), plus a model 3 simulation
Leucite
The averaged 298i MAS NMR spectrum obtained for the Mt. Cimini and Roccamonfina leucite samples is displayed in Figure 4. The lineshape was not appreciably altered by varying the delay between successive rf pulses from 5 to 40 s, suggesting that all the silicons present have roughly the same spin-lattice relaxation time. The spectrum of the heat-treated Mt. Cimini leucite sample appears in Figure 5 and that of the gel-synthesized leucite in Figure 6.
Peak assignments and the analysis of intensities will be discussed in the next section. We note here, however, that heat treatment of leucite at 1673 K for a week has at most a small effect on its 298i NMR spectrum and hence on the nature of its short-range Si, A1 order. As observed by differential scanning calorimetry, heat treatment did lower the tetragonal-cubic phase transition temperature by 24 ° and better resolved two peaks on the heat capacity curve (Lange et al. 1986). We should also note that prior to quan- titatively deconvoluting the leucite spectrum on the com- puter, we incorrectly described it in a preliminary report as a series of sharp peaks centered on a broad background absorption (Murdoch et al. 1984).
The wyomingite leucite spectrum is shown in Figure 7. Because of the low signal-to-noise ratio, no peak fitting

Gel-Synthesized 1 Leucite
8s~ (ppm)
Fig. 6. The 298i MAS NMR spectrum of gel-synthesized leucite (1716 acquisitions, 40 s recycle time), plus a model 3 simulation
I = I = I I = I = I I I -60 -80 -100 -120
Wyomingite / ~
-60 -80 -100 -120 6si (ppm)
Fig. 7. The 298i MAS NMR spectrum of wyomingite groundmass leucite (316 acquisitions, 30 s recycle time +758 acquisitions, 60 s recycle time)
was attempted, but it is apparent that a distinctly different Si, A1 distribution must exist in this sample than in the other leucites. In addition, as mentioned earlier, spinning sidebands for this sample are noticeably larger. This side- band enhancement is the result of an anisotropic coupling
375
Table 3. Deconvolution of the leucite spectra into Gaussian compo- nents
Sample Peak Chemical FWHM Relative shift (ppm) (ppm) area (%)
Natural leucite 1 - 78.7 5.2 3.6_+0.2 2 - 81.4 2.3 5.1_+0.2 3 - 85.3 3.4 17.2_+0.3 4 - 88.4 2.8 8.7_+0.4 5 - 92.2 4.6 28.2_+0.5 6 - 97.6 4.1 21.9_+0.3 7 -102.3 4.2 10.0+0.5 8 - 106.7 6.7 5.2 _+ 0.4
Heat-treated 1 - 78.4 4.4 2.7_+0.1 leucite 2 - 81.3 2.3 5.4_+0.1
3 - 85.2 3.3 16.0-+0.3 4 - 88.4 3.0 10.8___0.5 5 - 92.1 4.3 25.1_+0.5 6 - 97.5 4.4 23.2_+0.3 7 - 102.5 4.0 10.7 _+ 0.3 8 -107.2 6.7 6.0_+0.3
Gel-synthesized 1 - 77.3 3.3 2.6-+0.1 leucite 2 - 81.3 2.9 8.0-+0.1
3 - 85.0 2.7 10.3_+0.5 4 - 88.1 4.1 17.1_+ 1.0 5 - 92.4 3.9 22.2_+0.6 6 - 97.5 4.7 25.3+0.4 7 -102.7 3.8 10.0+0.3 8 - 107.2 5.0 4.5 _+ 0.3
to the unpaired electrons associated with the 2.3 weight percent iron present. The same effect has been seen in glasses prepared from silicic lavas (Murdoch et al. 1985).
Interpretation of the Leucite Spectra
Overview
Our goal is to use relative peak areas from deconvolution and lineshape simulation programs to determine the distri- but ion of silicon and a luminum cations among the different T/ sites. Similar analyses have been published recently for cordierite (Putnis et al. 1985; Putnis and Angel 1985) and synthetic mazzite 0 a r m a n et al. 1984; Klinowski and An- derson 1986).
The first step is peak assignment. There are three inequi- valent tetrahedral sites in low-temperature leucite, and for each a silicon can have 0 to 4 a luminum neighbors. Hence there can exist 15 different silicon species. Were 15 distinct peaks present in the leucite spectrum, our task would be relatively straightforward. However, each of the three exper- imental lineshapes in Figures ~ 6 appears to be made up of only eight peaks or shoulders.
To quantify this observation, we have deconvoluted each spectrum using a modification of a peak-fitting pro- gram originally developed for Raman spectra (Mysen et al. 1982). Individual peaks are assumed to be Gaussian, mirror- ing the statistically normal distribution of bond length and bond angle values expected in a disordered crystal. We limit the number of components in the lineshape-fitting process to eight, then let the program freely vary the position, height, and width of each component to obtain an optimal fit. The output, as listed in Table 3, includes an estimated

376
Table 4. Estimated chemical shifts for T/(kA1) silicon species in leueite a
T1 T2 % sites sites sites
Average S i - O - T angle b 145.9 ° 138.9 ° 130.4 °
6si (ppm) for 0AI -- 109.0 - 103.8 -96.3 1A1 - 103.5 - 98.3 -90.7 2A1 - 98.1 - 92.9 -85.2 3A1 - 92.7 - 87.4 --79.6 4A1 - 87.3 - 81.9 -74.1
A3 (ppm) 5.43 5.48 5.55
Calculated using Equation 1, a relationship derived by Ramdas and Klinowski (1984) b From bond angles obtained by Mazzi et al. (1976)
standard deviation for each peak area; these values are in- corporated in subsequent structural analysis.
To interpret the results, we again turn to the linear rela- tionship between 6sl and the average S i - O - T bond angle expressed in Equation 1. Using bond angles calculated from single-crystal x-ray diffraction data by Mazzi et al. (1976), we can estimate the chemical shift for each of the 25 silicon species, as listed in Table 4. Note that the estimated intrinsic shift between T1 (0A1) and T3 (0A1) silicons is 12.7 ppm, a larger intrinsic shift than has been seen in zeolites. Note also that the average S i - O - T bond angle for site TI is nearly the same as that for all tetrahedra in analcite. We expect, therefore, that Tt silicons contribute to the four leu- cite peaks (5-8) that coincide with peaks in the analcite spectrum.
The estimated leucite chemical shifts provide a starting point for detailed structural analysis, for which we have used three different computer modeling techniques. With models 1 and 2, each of the 15 possible Si species is matched to one of the eight deconvoluted experimental peaks (or
is assumed to be nonexistent). This approach entails some sort of peak assignment scheme; four examples are listed in Table 5. The relative merits of these will be discussed below. Model 1 assumes a different aluminum occupancy value for each of the three T~ sites and the existence of some degree of aluminum avoidance, but an otherwise ran- dom distribution of A1 and Si. Model 2 begins with an initial distribution of A1 and Si on a 3 × 3 × 3-unit-cell lattice of sites, then generates random A1 jumps (subject to alumi- num avoidance) to obtain a progressively better fit to the eight experimental peak areas.
The third model we have developed does not make use of the eight deconvoluted Gaussians. Instead, the entire leu- cite lineshape is simulated as the sum of 15 peaks, subject to a number of constraints on intensity, linewidth, and posi- tion. Because it avoids the all-or-nothing nature of peak assignments, we feel that this model is the most reliable. However, we present results for all three to demonstrate that our basic f indings are not tied to a single simulation scheme. Each model is described in more detail below.
Model 1
Assume we have N T 1 sites, N Tz sites, and N T3 sites with the connectivity of the leucite lattice, where N is the proverbial large number. These give rise to N T1 - 7"1 bonds (omitting the intervening oxygens), N T3-T3 bonds, 2 N T1--T2 bonds, and 2 N T2--T3 bonds, but no T1-T3 or T2--T2 bonds. Let gl , g2, and g3 be the fraction of each type of site occupied by aluminum. If we define
( g ) = (g~ + g2 + g3)/3, (4)
then the Si/A1 ratio is given by
R = 1 - ( g ) (5) ( g )
In order to quantify the degree of aluminum avoidance, let ~ represent the average propensity for A1--A1 linkages to form: c¢ = 0 corresponds to strict A1 avoidance; c~ = 1 sig- nifies that A 1 - O - - A 1 bonds are no different from S i - O
Table 5. Leucite peak assignment schemes
Peak Scheme I Scheme II
1 T3 (4A1) 2 T3(3A1) 3 T/(4A1) + T3 (2A1) 4 T~ (4A1) + T2 (3 A1)+ T3 (1A1) 5 T 1 (3 A1) + T2 (2 A1) + T 3 (0A1) 6 T, (2 A1) + T2 (1 A1) 7 T~ (1 A1) + T2 (0A1) 8 T~ (o A1)
T3 (4A1) T3(3 A1) T3 (2A1)
T~ (4 A1) + T2 (4 A1) + T3 ( 1 A1) T 1 (3 A1) + T2 (3 A1) + T3 (0A1) T, (2 A1) + T2 (2 A1) Tl(1A1) + T2(1A1) T, (0A1) + T2 (0A1)
Peak Scheme III Scheme IV
1 T2 (4A1) 2 Td3 A1) 3 T~ (4A1) + T2 (3 A1) 4 T3 (2A1) 5 T~ (3 A1) + 7"2 (2 A1) + T3 (1 A1) 6 /'1 (2 A1) + Tz ( 1 A1) + T3 (0 A1) 7 T 1 ( 1 A1) + T 2 (0 A1) 8 T~ (0 A1)
T3(3A1) T3(2A0 T3(1A1)
T~ (4 A1) + T 2 (4 A1) + T3 (0 A1) T1 (3 A1) + T2 (3 A1) T 1 (2 A1) + T 2 (2 A1) 7"1 (1 A1) + T 2 (i A1) T~ (0A1) + T2 (0A1)

Table 6. Model 1 simulation values for aluminum T~ site occupancies in leucite a
Sample Assignment gl g2 g3 R c~ Relative scheme rms error (%)
Natural leucite I 0.41 0.09 0.50 2.00 [0.0] 18.9 II 0.50 0.17 0.42 1.75 [0.0] 20.6 III 0.45 0.17 0.41 1.91 [0.0] 15.7 IV 0.50 0.18 0.25 2.23 [0.0] 23.9 I 0.40 0.09 0.49 [2.06] 0.0 19.1
Heat-treated leucite I 0.39 0.11 0.46 2.13 [0.0] 13.8 I 0.39 0.11 0.48 [2.06] 0.12 13.7
Gel-synthesized leucite I 0.34 0.26 0.38 2.06 [0.0] 8.7 I 0.33 0.28 0.36 [2.09] 0.0 8.9
377
a Fixed values for R or e are indicated by square brackets
--Si or S i - O - A1 bonds. The number of A1--A1 linkages present is consequently as follows:
N~g~ A1 [T~] to A1 [T1] bonds,
2Nc~gl g2 A1 [T1] to A1 [T2] bonds,
2 Nce g2 g3 A1 [T2] to A1 [T3] bonds,
Nc~g32 A1 [T3] to A1 IT3] bonds.
In turn, recognizing that each A 1 - A 1 linkage eliminates two S i - A 1 linkages, we can list the total number of S i - A 1 bonds:
( 2 N g ~ - - 2 N ~ g 2) Si[T~] to AI[T1] bonds,
(2 N g~ - 2 N a g a g2) Si [T2] to A1 [T1] bonds,
(2Ng2 - 2 N e g ~ g z ) SilT1] to A1 IT2] bonds,
(2Ng2-2Nc~g2g3) Si IT3] to A1 IT2] bonds,
(2Ng3 -2Nc~g2g3) Si IT2] to A1 [T3] bonds,
( 2 N g a - 2 N e g 2) SilT3] to AI[T3] bonds.
The probabili ty of each is found by dividing the number of bonds from Si [ Ti] to A1 [Tj] by the total number of bonds from Si[TJ to a Tj site:
2Ngj ( l - ~ g t ) _ g j(1 --~gt) P ( i , j ) = 2 N ( l _ g t ) l _ g t (6)
In turn, the probability of a Si[T~] to Si[Tj] bond is given by
Q (i,j) --. 1 - P (i,j). (7)
Note that to keep probabilities greater than or equal to zero and less than or equal to one, we must have
1 gl, g3 < (8a) = 1 +(1 --c@/2'
i - g , (8b) g 2 ~ l__~g I ,
1 - g 3 g2 < • (8 c)
1 - -~g3
The limits vary according to the level of aluminum avoid- ance.
To further compress notation, we now relabel the follow- ing single-bond aluminum-neighbor probabilities: a =P(1 , 1), b~ =P(1,2) , a 2 = P ( 2 , 1), b 2 = P ( 2 , 3), a3=P(3 , 2), and ba =P(3 , 3). In addition, we define analogous Si-neigh- bor probabilities: c i= 1 - a t and dr= 1 - b t . To obtain an
expression for ni(k), the number of silicons in site Ti with k adjacent A1 cations, we must multiply the population of silicons in site T~, N(1 --gt), by the probability of their hav- ing k A1 neighbors. This probability is given by the sum of the probabilities for different A1 arrangements :
nt (4) = N (1 - gi)( a2 b2), (9 a)
nt (3) = N (1 - gl) (2 at ci b { + 2 a 2 bt dr), (9 b)
nt(2 ) = N(1 -g t ) (a 2 d { + c{ b 2 + 4arc t bidt) , (9c)
nt(1) = g (1 - g t ) ( 2 a i c t d 2 +2cZbid~), (9d)
nt (0) = N (1 - gt)( c2 dE) • (9 e)
At this point, a computer is used to determine which set of aluminum site occupancy values { g l , g 2 , g 3 ) best matches the experimental peak areas for a particular assign- ment scheme. An outline of the program is as follows:
(1) Loop over the allowed g l ,g2 , and g3 values (plus if it is varied) in increments of 0.01.
(2) For every combination of g / and a values, calculate the number of silicons in each T~ site with k A1 neighbors.
(3) Combine these numbers according to the peak as- signment scheme of choice.
(4) Scale the simulated intensities to provide the best weighted-least-squares fit to the experimental peak areas.
(5) Calculate the rms error for each {gl, g2, g3, c~} com- bination, and keep track of the "winners."
Before discussing results, we note the following limita- tion. Because our window into the nature of Si, A1 ordering is the 29 Si N M R spectrum, what we know of A 1 - A 1 bonds is indirectly measured. For example, both an increase in the number of A 1 - A 1 linkages and an increase in the Si/A1 ratio have the effect of lowering the total number of S i - A1 bonds, which in turn changes the distribution of T i (k A1) silicon species. Indeed, ~ and R are somewhat interdepen- dent variables, and for model 1, we therefore choose to not let them vary independently.
Results are listed in Table 6 for the Mt. Cimini + Rocca- monfina leucite spectrum, analyzed using assignment schemes I-IV, with ~ set equal to zero and R free to vary from 1.0 to 99.0. Assignment scheme III generates the best rms fit to the experimental peak areas, but scheme I is the most consistent with the electron microprobe Si/A1 values found in Table 1. Hence we will focus on scheme I here. Also in Table 6 are data for the heat-treated and gel-synthe- sized leucites. In all three samples, an inequality exists in the aluminum occupancy of the three T~ sites, with T3 the

378
most hospitable to A1 cations and T2 the least so. For natu- ral leucite, the difference in g~ values before and after heat treatment may possibly be a real effect, but is much more likely an indication of the uncertainties in the analysis.
With R fixed at electron microprobe values and e free to vary, we obtain g~ values almost identical to those in Table 6 and find e=0.0 , 0.12, and 0.0 for the natural, heat- treated, and gel-synthesized leucites, respectively. Similar numbers are generated using model 3 and are discussed be- low.
Model 2
As noted earlier, the previous model incorporates a variable A1 occupancy for each T~ site and variable aluminum avoid- ance, but otherwise assumes a random distribution of A1 and Si. As a consequence, the relative abundance of various silicon species can be expressed in terms of simple probabili- ty relationships. There may exist, however, additional con- straints or tendencies that affect the actual Si, A1 distribu- tion. An example is Dempsey's rule (Dempsey et al. 1969; Vega 1983), which in generalized form states that for elec- trostatic reasons, the number of A 1 - S i - A 1 linkages should be minimized.
To investigate possible non-random cation distributions (within the bounds of strict A1 avoidance, however) and to better fit the experimental peak areas, we have devised a "directed j ump" simulational technique, inspired by the method Vega (1983) has used to study adherence to Demp- sey's rule in zeolites. Our starting point is a 3 x 3 x 3 array of unit cells with periodic boundary conditions. The 1296 tetrahedral sites (48 in each of the 27 unit cells) constitute a feldspathoid microcosm, one that is meant to be large enough to allow for a wide variety of Si, A1 configurations but small enough to be analyzed in a reasonable amount of computer time. In accord with the R value of choice, a semi-random pattern of A1 cations is scattered among the tetrahedral sites, which otherwise are assumed to con- tain silicon. Next an initial set of simulated peak areas is generated, based on the relative number of each type of silicon present and the assignment scheme one has selected. The rms error in fitting the experimental peaks is computed and stored as the current "record." A silicon and an alumi- num cation are then selected randomly for a possible swap in position on the lattice. For the swap to be allowed, no violations of the aluminum-avoidance rule can occur, and the resulting set of simulated peak areas must be a better fit to the experimental spectrum. If the move is allowed, the rms error record is also updated. The process continues until selected Si, A1 swaps fail to break the error record 1000 times in a row. The entire procedure is then repeated several times in an attempt to obtain the best possible fit for a particular value of R. Finally, in the outermost loop of the program, the input Si/A1 ratio itself is varied over a narrow range about its experimentally determined value, again in the quest for an optimum fit. (We chose the incre- ment in Si/A1 values to be 0.05.)
Listed in Table 7 are results for "winning" distributions found for each of the three leucite samples. When two differ- ent Si/A1 ratios produced comparably small rms error values, both data sets are listed. Two observations can be made. First, the aluminum distributions generated by this directed jump simulation are in good agreement with those of model 1 for natural leucite, with and without heat treat-
Table 7. Model 2 simulation values for aluminum T/site occupan- cies in leucite
Sample Si/A1 gl g2 g3 Relative ratio rms error (%)
Naturalleucite 2.05 0.37 0.14 0.48 0.32
Heat-treated 2.10 0.36 0 .13 0.48 1.11 leucite 2.15 0.35 0.14 0.46 0.23
Gel-synthesized 2.10 0.36 0 .17 0.44 0.46 leucite 2.15 0.36 0 .19 0.41 0.28
ment. For the gel-synthesized sample, a more differentiated A1 distribution is generated than with model 1, a distribu- tion more like (but not identical to) that found for natural leucite. Second, for all three samples, the quality of the fit, as evidenced by the optimized rms error values, is noticeably improved relative to model 1. Much of this improvement may simply be an adjustment of the calculated Si, A1 distri- bution to mask errors inherent in the peak assigmnent pro- cess. However, a similar, though smaller, improvement in fit for model 2 compared to model 1 is also seen with anal- cite, for which the peak assignments are unambiguous. Hence there may well be more to the Si, A1 distribution in leucites than T~ site preferences and aluminum avoidance.
Model 3
Rather than varying gl values to match a set of peak areas for each spectrum, we can instead simulate spectral line- shapes directly. In the absence of constraints, this would entail a 45-parameter fit: a Gaussian characterized by height, width, and chemical shift for each of the 15 possible silicon species. However, we have seen that each spectrum is modeled well as the sum of only eight Gaussians - i.e., 24 parameters. We therefore limit the number of variables in this lineshape-fitting process by assuming the following:
(1) As for model 1, a statistical distribution of A1 and Si cations, subject only to site occupancies gl and a degree of aluminum avoidance described by c~.
(2) For each site T/, evenly spaced Si(k A1) peaks sepa- rated by a chemical shift increment (A6)i.
(3) For each site T/, a single full-width at half-maximum wz for all five Si(k A1) peaks.
These assumptions reduce the number of variables to 13: a value of gl, [6(0Al)]i, (A6)z, and wi for i=1 -3 , plus cc Even so, we have proceeded carefully in the simulation pro- cess to avoid wandering aimlessly through parameter space. Two different programs are used to iteratively minimize the least-squares difference between simulated and experi- mental lineshapes: one is based on subroutine P O W E L L (Press et al. 1986), the other on subroutine E 0 4 D B F from the Numerical Algorithms Group library.
Starting with trial lineshapes based on model 1 gl values and chemical shift estimates from Table 4, we carry out the minimization in several stages. In the first stage, natural, heat-treated, and gel-synthesized leucite spectra have been fit simultaneously, with the same set of chemical shift and peak width parameters for each, and with R values con- strained to be 2.06, 2.06, and 2.09 respectively. The common set of chemical shifts is to ensure that the three simulations remain mutually consistent. In later stages, to fine-tune the

Table 8. Model 3 simulation values for A1 site occupancies and Si chemical shifts in leucite
Sample Site gl [3 (0 A1)t (A 6)i w i R ~ Relative (ppm) (ppm) (ppm) error (%)
Natural leucite T1 0.39 - 108.6 5.17 4.3 2.09 0.0 6.9 T2 0.16 --101.5 4.58 3,5 T 3 0.42 - 93.8 4.26 3.1
Heat-treated leucite T1 0.37 - 108.4 5.02 3.9 2.11 0.11 6.3 T 2 0.20 - 101.2 4.56 3.5 T3 0.41 -- 93.5 4.17 2.9
Gel-synthesized leucite T~ 0.36 -- 108.0 4.79 3.8 2.07 0.0 6.0 T2 0.20 - 100.8 4.27 3.3 T3 0.42 -- 94.0 4.31 3.0
Roccamonfina leucite T~ 0.40 - 108.0 4.94 3.8 2.05 0.0 7.7 T z 0.15 -- 100.8 4.32 3.4 T3 0.43 -- 93.6 4.15 2.9
Mt. Cimini leucite Tx 0.38 - 108.9 5.30 4.6 2.12 0.0 7.2 T2 0.16 -- 101.8 4.68 3.6 T 3 0.42 -- 93.9 4.34 3.2
379
fit, each spectrum is allowed to evolve separately and R is al lowed to vary.
Results for the three aforementioned spectra are dis- played in Figures 4~6 and listed in Table 8. Also in Table 8 are separate analyses for (unheated) Mt. Cimini and Rocca- monfina leucite. Aluminum-occupancy values agree reason- ably well with model 1 and model 2 da ta - the basic findings that gz <g~ <g3 and c ~ 0 appear to be model independent. (The errors repor ted in Table 8, however, cannot be directly compared with those in Tables 6 and 7.) We note also that the Mt. Cimini and Roccamonfina distr ibutions are indeed nearly identical (and hence nearly identical to the distribu- t ion calculated for their combined spectrum).
The chemical shifts calculated for the center peak of each site subspectrum, the T/(2A1) silicons, match the esti- mates in Table 4 that are based on the Ramdas and Klin- owski formula. However, the peak- to-peak chemical shift increments generated by model 3 are smaller than predicted values; for natura l leucite, as an example, the differences are 0.26, 0.90, and 1.29 ppm for sites T~, T2, and T 3 respec- tively.
F o r every spectral s imulat ion except that of heat- treated Mt. Cimini leucite, we find that when R and e are allowed to vary freely, R winds up close to the value expected from chemical analysis and e is zero: an apparent affirmation of Loewenstein 's rule. The simulation for heat- treated leu- cite, when taken to completion, also yields c~=0, but R=2.20 . When R is constrained to be more in line with chemical analysis (R=2.11), then e=0.11. As noted earlier, a similar number is obta ined using model 1. This result suggests that to some extent, s i l icon-aluminum reordering occurred in the sample during its week at 1673 K and a non-equil ibr ium distr ibut ion of cations was frozen out. We again caution, however, that the rms fit of a leucite simula- t ion is rather insensitive to s imultaneous variat ion of R and e.
Wha t of the small differences between experimental lin- eshapes and model 3 s imulat ions? To explore if these can be reduced, we have modified a model 3 program to mini- mize the number of electrostatically unfavorable A 1 - S i - A 1 linkages in accord with Dempsey's rule. Fol lowing Vega (1983), we count the number of such linkages by considering,
for a given silicon, the number of ways no of selecting k A1 neighbors two at a t ime: no=O, 0, 1, 3, 6 for k = 0 , 1, 2, 3, 4. The probabi l i ty associated with each Ti(k A1) Si species is modified by subtract ing the quant i ty ( 1 - g i ) f l n D and then renormalizing, where fl is a Dempsey's rule param- eter. In running simulations, however, we find that fl is very small and changes sign from one leucite spectrum to another, suggesting that Dempsey's rule is not a driving force for the distr ibution of Si and A1 in leucite.
Finally, we note that a "model 4" incorporat ing di- rected-jump intensities with full l ineshape simulat ion would allow us to further investigate dis t r ibut ional constraints in leucite, but it is too computa t ional ly intensive for current u s e .
Comparison with 27A1 results
Phillips and Kirkpa t r ick (1986) have recently analyzed the 27A1 M A S N M R spectrum of leucite at 11.7 T, using spin- ning sideband analysis to resolve three peaks centered at 60.7, 63.9, and 68 .7ppm relative to aqueous AI(H20)~ +. Based on the bond angles of Mazzi et al. (1976), they assign these to T1, T2, and T 3 silicons respectively. The relative intensities appear to be equal, suggesting that gl "~g2 '~g3. Clearly, this finding is at odds with our data, but we have no ready explanat ion for the discrepancy.
Analysis of the Analcite Spectrum
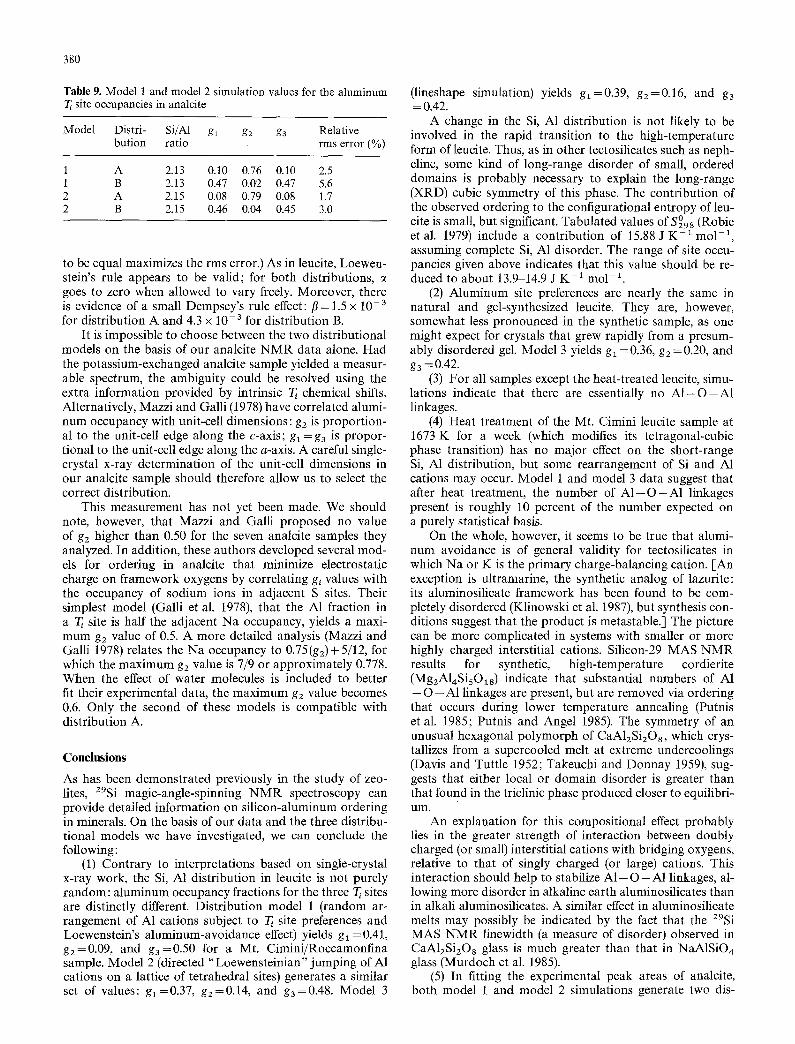
Model 1 and model 2 simulations were also run to fit the peak areas listed in Table 2 for analcite. As noted earlier, because of the lack of an intrinsic site shift, each peak in the spectrum corresponds to a par t icular value of k, the number of A1 neighbors. The symmetry is assumed to be tetragonal I 4 1 / a c d or very nearly so; as a consequence, sites T1 and T 3 are equivalent and gl should equal ga. Our results appear in Table 9. Both models find that two dis- tinctly different Si, A1 distr ibutions give rise to minimal rms error values. In what we will call distr ibution A, alumi- num cations are concentrated in the T2 sites: g2 -- 0.76-0.78. In distr ibution B, almost all A1 cations occupy T1 = T3 sites: g2 = 0.02-0.04. (In contrast , constraining the three gl values
380
Table 9. Model 1 and model 2 simulation values for the aluminum T~ site occupancies in analcite
Model Distr i - Si/A1 gl g2 g3 Relative bution ratio rms error (%)
1 A 2.13 0.10 0.76 0.10 2.5 1 B 2.13 0.47 0.02 0.47 5.6 2 A 2.15 0.08 0.79 0.08 1.7 2 B 2.15 0.46 0.04 0.45 3.0
to be equal maximizes the rms error.) As in leucite, Loewen- stein's rule appears to be valid; for both distributions, goes to zero when allowed to vary freely. Moreover, there is evidence of a small Dempsey's rule effect:/~= 1.5 x 10 -3 for distribution A and 4.3 x 10- 3 for distribution B.
It is impossible to choose between the two distributional models on the basis of our analcite NMR data alone. Had the potassium-exchanged analcite sample yielded a measur- able spectrum, the ambiguity could be resolved using the extra information provided by intrinsic T~ chemical shifts. Alternatively, Mazzi and Galli (1978) have correlated alumi- num occupancy with unit-cell dimensions: g2 is proportion- al to the unit-cell edge along the c-axis; gl = g3 is propor- tional to the unit-cell edge along the a-axis. A careful single- crystal x-ray determination of the unit-cell dimensions in our analcite sample should therefore allow us to select the correct distribution.
This measurement has not yet been made. We should note, however, that Mazzi and Galli proposed no value of g2 higher than 0.50 for the seven analcite samples they analyzed. In addition, these authors developed several mod- els for ordering in analcite that minimize electrostatic charge on framework oxygens by correlating gl values with the occupancy of sodium ions in adjacent S sites. Their simplest model (Galli et al. 1978), that the A1 fraction in a T~ site is half the adjacent Na occupancy, yields a maxi- mum g2 value of 0.5. A more detailed analysis (Mazzi and Galli 1978) relates the Na occupancy to 0.75(g2)+ 5/12, for which the maximum g2 value is 7/9 or approximately 0.778. When the effect of water molecules is included to better fit their experimental data, the maximum g2 value becomes 0.6. Only the second of these models is compatible with distribution A.
Conclusions
As has been demonstrated previously in the study of zeo- lites, 298i magic-angle-spinning NMR spectroscopy can provide detailed information on silicon-aluminum ordering in minerals. On the basis of our data and the three distribu- tional models we have investigated, we can conclude the following:
(1) Contrary to interpretations based on single-crystal x-ray work, the Si, A1 distribution in leucite is not purely random: aluminum occupancy fractions for the three T~ sites are distinctly different. Distribution model 1 (random ar- rangement of A1 cations subject to T~ site preferences and Loewenstein's aluminum-avoidance effect) yields gl =0.41, g2=0.09, and g3=0-50 for a Mt. Cimini/Roccamonfina sample. Model 2 (directed "Loewensteinian" jumping of AI cations on a lattice of tetrahedral sites) generates a similar set of values: g1=0.37, g2=0.14, and g3=0.48. Model 3
(lineshape simulation) yields gl--0.39, g2=0.16, and g3 = 0.42.
A change in the Si, A1 distribution is not likely to be involved in the rapid transition to the high-temperature form of leucite. Thus, as in other tectosilicates such as neph- eline, some kind of long-range disorder of small, ordered domains is probably necessary to explain the long-range (XRD) cubic symmetry of this phase. The contribution of the observed ordering to the configurational entropy of leu- cite is small, but significant. Tabulated values of S°9s (Robie et al. 1979) include a contribution of 15.88 J K -1 mo1-1, assuming complete Si, A1 disorder. The range of site occu- pancies given above indicates that this value should be re- duced to about 13.9 14.9 J K -1 tool -1.
(2) Aluminum site preferences are nearly the same in natural and gel-synthesized leucite. They are, however, somewhat less pronounced in the synthetic sample, as one might expect for crystals that grew rapidly from a presum- ably disordered gel. Model 3 yields gl =0.36, g2 =0.20, and g3 = 0.42.
(3) For all samples except the heat-treated leucite, simu- lations indicate that there are essentially no A 1 - O - A 1 linkages.
(4) Heat treatment of the Mt. Cimini leucite sample at 1673 K for a week (which modifies its tetragonal-cubic phase transition) has no major effect on the short-range Si, A1 distribution, but some rearrangement of Si and A1 cations may occur. Model 1 and model 3 data suggest that after heat treatment, the number of A 1 - O - A 1 linkages present is roughly 10 percent of the number expected on a purely statistical basis.
On the whole, however, it seems to be true that alumi- num avoidance is of general validity for tectosilicates in which Na or K is the primary charge-balancing cation. [-An exception is ultramarine, the synthetic analog of lazurite: its aluminosilicate framework has been found to be com- pletely disordered (Klinowski et al. 1987), but synthesis con- ditions suggest that the product is metastable.] The picture can be more complicated in systems with smaller or more highly charged interstitial cations. Silicon-29 MAS NMR results for synthetic, high-temperature cordierite (Mg2A14SisOls) indicate that substantial numbers of A1 - O - A 1 linkages are present, but are removed via ordering that occurs during lower temperature annealing (Putnis et al. 1985; Putnis and Angel 1985). The symmetry of an unusual hexagonal polymorph of CaAlzSi20 8, which crys- tallizes from a supercooled melt at extreme undercoolings (Davis and Tuttle 1952; Takeuchi and Donnay 1959), sug- gests that either local or domain disorder is greater than that found in the triclinic phase produced closer to equilibri- um.
An explanation for this compositional effect probably lies in the greater strength of interaction between doubly charged (or small) interstitial cations with bridging oxygens, relative to that of singly charged (or large) cations. This interaction should help to stabilize A 1 - O - A 1 linkages, al- lowing more disorder in alkaline earth aluminosilicates than in alkali aluminosilicates. A similar effect in aluminosilicate melts may possibly be indicated by the fact that the 29Si MAS NMR linewidth (a measure of disorder) observed in CaAlzSizOs glass is much greater than that in NaA1SiO4 glass (Murdoch et al. 1985).
(5) In fitting the experimental peak areas of analcite, both model 1 and model 2 simulations generate two dis-

381
tinctly different distr ibutions A and B, the former with alu- minum predominant ly in Tz sites (gl = g3 ~0.09, g2 ~0-78), the lat ter with only a scattering of T 2 A1 cations (gl =g3 ~0.46, g2 ~0.04). A choice between distr ibutions A and B could likely be made based on the spectrum of a K- exchanged sample or the unit-cell dimensions.
The detailed information on si l icon-aluminum ordering in tectosilicates that can be obtained with 29Si (and 27A1) MAS N M R has been of great use in the design of zeolite catalysts for the chemical industry. Petrologic appl icat ions remain largely for future work but are potential ly wide: cation distr ibutions often reflect the geologically impor tan t variables of time, temperature, and composit ion. The order- ing state of feldspar, as determined by x-ray diffraction and optical means, is an often-used clue to the temperature of ordering and to growth kinetics. Similar constraints on geo- chemical processes may be obtainable from studies of natu- ral zeolites and feldspathoids. As a small start, we have shown here that leucite phenocrysts from very similar lavas of the Roman province are structurally nearly identical, but that mater ial from the groundmass of a wyomingite lava is quali tat ively different.
In short, now that the analytical tools have been devel- oped, opportuni t ies for future work include a more thor- ough investigation of Si, A1 ordering in a variety of leucite minerals of different origin and thermal history. Ion ex- change (with the inclusion of paramagnet ic impurit ies to facilitate relaxation) will allow the direct compar ison of dis- t r ibut ional results from leucite-like and analcite-like spec- t ra: one with and the other without intrinsic T~ site chemical shifts. Finally, the cal ibrat ion of ordering with experimental- ly determined temperature and time of synthesis may pro- vide new quanti tat ive da ta on the origin of these types of minerals in nature.
Acknowledgments. Special thanks are due R. Lange for supplying the gel-synthesized leucite sample. We also thank B. Mysen for sending us a copy of the Raman lineshape-fitting program that we modified for NMR analysis, and the reviewers for their thought- ful (and thought-inducing) comments. This work was supported by the Director, Office of Basic Energy Sciences, Division of Engi- neering, Mathematics, and Geosciences of the U.S. Department of Energy under contract DEACO3-76SF00098; and by the Na- tional Science Foundation, grant number EAR-8507925.
References
Abragam A (1961) The Principles of Nuclear Magnetism. Oxford University Press, London
Barron PF, Frost RL, Skjemstad JO (1983) 29Si spin-lattice relaxa- tion in aluminosilicates. J Chem Soc Chem Commun: 581-583
Beger RM (1969) The crystal structure and chemical composition of pollucite. Z Kristallogr 129:280~302
Carmichael ISE (1967) The mineralogy and petrology of the volca- nic rocks from the Leucite Hills, Wyoming. Contrib Mineral Petrol 15 : 24-66
Davis GL, Tuttle OF (1952) Two new crystalline phases of the anorthite composition, CaO-A1203-2S iO 2. Am J Science Bowen Volume: 107-114
Dempsey E, Kuhl GH, Olsen DH (1969) Variation of the lattice parameter with aluminum content in synthetic sodium fauja- sites. Evidence for ordering of the framework cations. J Chem Phys. 73 : 387-390
Ferraris G, Jones DW, Yerkess J (1972) A neutron-diffraction study of the crystal structure of analcime, NaA1SizO6. H20. Z Kristal- logr 135:241~252
Fyfe CA, Thomas JM, Klinowski J, Gobbi GC (1983) Magic-angle-
spinning NMR (MAS-NMR) spectroscopy and the structure of zeolites. Angew Chem Int Ed Engl 22:259-275
Galli E, Gottardi G, Mazzi F (1978) The natural and synthetic phases with the leucite framework. Miner Petrogr Acta 22:185 193
Hamilton DL, Henderson CMB (1968) The preparation of silicate compositions by a gelling method. Mineral Mag 36:832 838
Jarman RH, Jacobson AJ, Melchior MT (1984) Interpretation of the silicon-29 nuclear magnetic resonance spectra of zeolites: synthetic mazzite. J Phys Chem 88 : 5748 5752
Klinowski J, Anderson MW (1986) A high-resolution solid-state nuclear magnetic resonance study of the ordering of silicon and aluminium in synthetic mazzite (zeolite omega). J Chem Soc Faraday Trans 1 82:569 584
Klinowski J, Carr SW, Tarling SE, Barnes P (1987) The aluminosili- care framework of ultramarine is completely disordered: a mag- ic-angle-spinning NMR study. Nature, in press
Klinowski J, Ramdas S, Thomas JM (1982) A re-examination of Si, A1 ordering in zeolites NaX and NaY. J Chem Soc Faraday Trans 2 78:1025 1050
Lange R, Carmichael ISE, Stebbins JF (1986) Phase transitions in leucite (KA1Si206) , orthorhombic KAISiO4, and their iron analogs (KFeSi206, KFeSiO4). Am Mineral 71:937-945
Lippmaa E, Magi M, Samoson A, Engelhardt G, Grimmer AR (1980) Structural studies of silicates by solid-state high-resolu- tion 29Si NMR. J Am Chem Soc 102:48894893
Lippmaa E, Magi M, Samoson A, Tarmak M, Engelhardt G (1981) Investigation of the structure of zeolites by solid-state high- resolution z9Si NMR spectroscopy. J Am Chem Soc 103:4992 4996
Loewenstein W (1954) The distribution of aluminum in the tetrahe- dra of silicates and aluminates. Am Mineral 39:92-96
Mazzi F, Galli E (1978) Is each analcime different? Am Mineral 63:448 460
Mazzi F, Galli E, Gottardi G (1976) The crystal structure of tetra- gonal leucite. Am Mineral 61:108 115
Merlino S (1984) Feldspathoids: their average and real structure. In: Brown WL (ed) Feldspars and Feldspathoids (NATO Ad- vanced Study Institute). Reidel Publishing Co, New York, pp 435470
Murdoch JB, Stebbins JF, Carmichael ISE (1984) Silicon-29 MAS nuclear magnetic resonance study of the structure of feldspath- oid minerals. Geol Soc Am Abst w Prog 16, 6:604
Murdoch JB, Stebbins JF, Carmichael ISE (1985) High-resolution 29Si NMR study of silicate and aluminosilicate glasses: the ef- fect of network-modifying cations. Am Mineral 70:332-343
Peacor DR (1968) A high temperature single crystal diffractometer study of leucite, (K, Na)A1SiaO ~. Z Kristallogr 127:213 224
Phillips BL, Kirkpatrick RJ (1986) Increased resolution for solid- state 27A1 NMR. Abstracts, Fourteenth General Meeting of the International Mineralogical Association 198-199
Press WH, Flannery BP, Teukolsky SA, Vetterling WT (1986) Nu- merical Recipes: The Art of Scientific Computing. Cambridge University Press, Cambridge
Putnis A, Fyfe CA, Gobbi GC (1985) A1, Si ordering in cordierite using "magic angle spinning" NMR. I. Si 29 spectra of synthetic cordierites. Phys Chem Minerals 12:211-216
Putnis A, Angel RJ (1985) A1, Si ordering in cordierite using "magic angle spinning" NMR. II. Models of A1, Si order from NMR data. Phys Chem Minerals 12:217-222
Ramdas S, Klinowski J (1984) A simple correlation between isotro- pic z9Si-NMR chemical shifts and T - - O - - T angles in zeolite frameworks. Nature 308: 521-523
Robie RA, Hemingway BS, Fisher JR (1979) Thermodynamic properties of minerals and related substances at 298.15 K and 1 bar (105 pascals) pressure and at higher temperatures. US Geol Survey Bull 1452
Schneider E, Stebbins JF, Pines A (1987) Speciation and local struc- ture in alkali and alkaline earth silicate glasses: constraints from Si-29 NMR spectroscopy. J Non-Cryst Solids 89:371 383

382
Smith JV (1982) Geometrical and structural crystallography. Wiley, New York
Smith JV, Blackwell CS (1983) Nuclear magnetic resonance of silica polymorphs. Nature 303:223-225
Stebbins JF, Murdoch JB, Carmichael ISE, Pines A (1986) Defects and short-range order in nepheline group minerals: a silicon-29 nuclear magnetic resonance study. Phys Chem Minerals 13:371-381
Takeuchi Y, Donnay G (1959) The crystal structure of hexagonal CaA12Si208. Acta Crystallogr 12:465470
Taylor WH (1930) The structure of analcite (NaA1Si206. H20 ). Z Kristallogr 74:1-19
Thomas JM, Klinowski J, Ramdas S, Hunter BK, Tennakoon DTB
(1983) The evaluation of non-equivalent tetrahedral sites from 29Si NMR chemical shifts in zeolites and related aluminosili- cates. Chem Phys Lett 102:158-162
Vega AJ (1983) A statistical approach to the interpretation of sili- con-29 NMR of zeolites. In: Stucky GD, Dwyer FG (eds) Intra- zeolite Chemistry. American Chemical Society, Washington, D.C., pp 217530
Waldbaum DR, Robie RA (1971) Calorimetric investigation of N a - K mixing and polymorphism in the alkali feldspars. Z Kristallogr 184:381~420
Received October 9, 1986
Note added in proof. Brown et al. (1987) have recently presented 298i MAS NMR spectra of natural and synthetic leucite that are very similar to those displayed here. They have also simulated these lineshapes using chemical shifts derived from the empirical secant rule of Smith and Blackwell (1983) with a reasonable choice for individual peak widths. By varying only the A1 distribution among T~ sites (but assuming an otherwise random arrangement of A1 and Si), they find g1=0.56, g2=0.36, and g3=0.08. These values differ from ours primarily in that the effect of aluminum avoidance was not considered.
Brown IWM, Cardile CM, MacKenzie KJD, Ryan M J, Meinhold RH (1987) Natural and synthetic leucites studied by solid state z9Si and 27A1 NMR and SVFe Mossbauer spectroscopy. Phys Chem Minerals 15:78 83